Submitted:
27 August 2025
Posted:
29 August 2025
You are already at the latest version
Abstract
Probabilistic Risk Assessment (PRA), also known as Probabilistic Safety Assessment (PSA), is a methodology endorsed by the United States (US) Nuclear Regulatory Commission (NRC) to support risk-informed, performance-based decision-making for nuclear facilities across all lifecycle phases, from design to decommissioning. PRA tools, essential to this process, enable analysts to assess and quantify risk efficiently. However, despite their critical role, many PRA tools, particularly their quantification engines, have not kept pace with advances in computational capabilities since their inception in the 1990s. The quantification engine is central to the PRA tool’s function, responsible for interpreting models, generating cut sets, and calculating risk metrics. Limited quantification capacity can compromise model reliability and, ultimately, decision-making accuracy. This paper introduces the Enhancement Assessment Framework (EAF), a structured approach to evaluate PRA tool performance systematically, pinpoint areas requiring improvement, and facilitate a comparative assessment across tools. Comprising five elements—model generation, model exchange, benchmarking, standard profiling, and deeper profiling—the EAF assesses and tracks the performance and enhancement needs of PRA tools. Model generation enables flexible model testing configurations, while model exchange expands testing to actual models for comprehensive validation. Benchmarking and profiling elements offer metrics to diagnose and address performance bottlenecks. The EAF is not intended as a single application but as a cyclic process for continuous tool enhancement. Applying the EAF to PRA tools such as SCRAM-CPP and SAPHSOLVE has underscored the potential for significant improvements.
Keywords:
model generation
; model exchange
; benchmarking
; profiling
; probabilistic risk assessment
; verification
1. Introduction
Probabilistic Risk Assessment (PRA) [1], also referred to as Probabilistic Safety Assessment (PSA), is a methodology endorsed by the United States (US) Nuclear Regulatory Commission (NRC) to support risk-informed [2], performance-based decision-making throughout the entire lifecycle of nuclear facilities. This includes phases such as design, construction, operation, and decommissioning.
PRA analysts rely on PRA tools to assess and quantify risks both qualitatively and quantitatively. These tools are designed to operate efficiently on-premises, delivering real-time results when feasible within specified timeframes. They are invaluable resources for analysts, enabling the precise and timely identification and assessment of risks.
Despite the critical role PRA tools play, many of these tools were developed in the 1990s and are still in use today. While computational capabilities have advanced significantly since then, equivalent improvements in PRA tools, particularly in the PRA quantification engine—the core component of these tools—have not been uniformly observed.
The PRA quantification engine serves as the linchpin, responsible for reading the given model, generating cut sets, and calculating risk metrics directly from the model or the generated cut sets. The potency of the quantification engine is paramount, as its effectiveness directly influences the ability to quantify the model. If the quantification engine lacks sufficient power, the model cannot be adequately quantified, resulting in insufficient results to inform risk-informed decisions.
As will be discussed in the next section, many challenges surrounding PRA tools have already been identified. What remains is the development of an efficient, repeatable, and broadly applicable methodology to measure tool performance and diagnose areas in need of improvement. This paper proposes the Enhancement Assessment Framework (EAF), a systematic approach to evaluating PRA tools. Rather than presuming a tool needs improvement, the EAF provides a process for testing the tool, measuring its performance, and identifying areas that require enhancement. Additionally, the framework facilitates the verification of results across different PRA tools.
The remainder of the paper is structured as follows: Section 2 introduces various PRA tools developed throughout history and highlights some common issues. Section 3 discusses the fundamentals of verification and validation. Section 4 reviews various approaches to determining the maturity of modeling and simulation. Section 5 presents a novel approach that begins with testing the tool and progresses to identifying areas for improvement. Section 6 demonstrates an application of the EAF. Section 7 concludes the paper and discusses potential future work.
2. Probabilistic Risk Assessment Tools and Issues
In the evolution of PRA during the 1970s various tools, as shown in Figure 1, were concurrently developed to facilitate the analysis process. PREP and KITT [3] was developed as computer code for the automatic evaluation of a fault tree by Idaho Nuclear Corporation. PREP obtained minimal cut sets (MCS) of the fault tree using either Monte Carlo or deterministic methods, while KITT obtained numerical probabilities associated with the tree. MOCUS [4] was developed by Aerojet Nuclear Company as a computer program to obtain MCS from fault trees. MODULE [5] is a computer code capable of handling MCS generation, importance analysis, and uncertainty analysis. SIGPI [6] was developed by Lawrence Livermore National Laboratory for the NRC computes complex systems’ probability. CAFTA [7] develops, maintains, and updates single-top failure models through fault and event tree modeling. It is currently maintained under the Phoenix Architect Module [8] and is mainly used by US NPP owners. SAPHIRE [9] is a follow-up work of IRRAS [10], an application developed by the Idaho National Laboratory (INL) for the NRC, released in 1987. RISKMAN [11] is a general-purpose, integrated tool for quantitative risk analysis developed by ABS Consulting, Inc [12]. KIRAP [13] is a fault tree construction and analysis code package. RiskSpectrum [14] is an advanced software developed by Relcon Scandpower AB, increasingly used for developing fault trees and event trees to assess system reliability in various parts of NPP. RiskA [15] is an integrated reliability and PRA tool developed by the FDS Team. XFTA [16] is a calculation engine initially developed in 2012 as part of the Open-PSA initiative. SCRAM-CPP is an OpenPRA open-source quantification engine [17,18]. DeRisk [19] is a dynamic, uncertain causality graph-embedded risk analysis program package.
In addition to introduced software packages, various contributors have made significant improvements to the approximate and practical quantification methods. These include algorithms for simplifying large fault trees [20], leveraging binary decision diagrams to obtain MCS [21,22,23,24], applying Monte Carlo direct simulation technique to obtain MCS and estimate probabilities [25], and methods for estimating truncation errors in fault tree analysis [26].
To summarize, numerous PRA tools have been developed and continuously improved. CAFTA is the preferred choice for most NPP operators in the US. SAPHIRE is the NRC’s primary software tool for modeling, evaluating, and validating NPP results. On the other hand, SCRAM-CPP is one of the open-source PRA tools capable of handling almost all PRA calculations.
Although significant improvements have been made, there is still much room for enhancement in PRA tools to efficiently utilize resources and obtain accurate results in a shorter time. Below are some of the current areas that need improvement [27] in PRA tools:
- Quantification speed and accuracy.
- Dependency analysis for human reliability analysis.
- Model development, maintenance, and updates.
- Risk aggregation includes multi-hazard models, multi-unit sites, analyzing combinations of PRA model elements for criticality, uncertainty analysis, communication of risk insight, and incorporating new PRA technologies into existing models.
Although bullet points above give insights about issues of PRA tools in general, a method is needed to determine what the specific PRA tool’s current status. As discussed in previous section, EAF enables to systematically analyze the PRA tool to determine the areas needs improvement.
3. Fundamentals of Verification and Validation in Scientific Computing – Brief Overview
In this section, we introduce the fundamentals of verification and validation (V&V) in scientific computing, as the EAF aims not only to provide an efficient and repeatable methodology for improving PRA tools, but also to establish a comprehensive framework for code verification (CV), solution verification (SV), and model validation (MV).
The operations research community spearheaded initial efforts to establish a terminology for V&V [28]. These endeavors resulted in a significant milestone document published by the Society of Computer Simulation in 1979 [29]. After a few years, with the increasing significance and prevalence of computer-aided systems in commercial and public sectors, the Institute of Electrical and Electronics Engineers (IEEE) formulated definitions for V&V in 1984 [30] and expanded the definition in 1991 [31].
In the early 1990s, the US Department of Defense (DOD) began recognizing the necessity of establishing terminology and procedures for V&V to cater to their extensive range of needs in modeling and simulation (M&S) [32]. While most science and engineering communities focused on specific applications, the DOD’s requirements spanned diverse systems. Notably, the American Institute of Aeronautics and Astronautics (AIAA) was the first engineering community to develop concepts and procedures for V&V methodology. In 1998, the Guide for the Verification and Validation of Computational Fluid Dynamics Simulations was issued [33]. Around the same time, in the late 1990s, members of the solid mechanics community within the American Society of Mechanical Engineers (ASME) became increasingly engaged in V&V concepts and methodologies. After extensive efforts, ASME released the ASME Guide for Verification and Validation in Computational Solid Mechanics in late 2006 [34].
The foundational terms CV, SV, and MV are discussed below using the definitions provided by ASME, AIAA, IEEE, and DOD, Ch. 2 [35].
CV entails the process of affirming that numerical algorithms are accurately implemented within computer code and identifying errors in the software. This process can be categorized into numerical algorithm verification and software quality assurance (SQA). Numerical algorithm verification concerns the mathematical correctness of the software’s implementation of all numerical algorithms that impact the numerical accuracy of computational results. Its primary objective is to amass evidence demonstrating that the numerical algorithms within the code are implemented correctly and are functioning as intended. Conversely, SQA determines whether the code, as part of a software system, is implemented accurately and yields repeatable results on specified computer hardware and within designated software environments. These environments encompass computer operating systems, compilers, and function libraries. Numerical algorithm verification is fundamentally empirical, relying on testing, observations, comparisons, and analyses of code results for individual code executions. Numerical algorithm verification typically involves comparing computational solutions with highly accurate solutions, known as verification benchmarks. SQA activities encompass practices, procedures, and processes primarily developed by researchers and practitioners within the computer science and software engineering communities.
SV involves determining the correctness of input data, the numerical accuracy of obtained solutions, and the accuracy of output data for a specific simulation. It aims to identify and quantify three sources of errors: errors in the preparation of input for the simulation code by the computational analyst, numerical errors resulting from computing the discretized solution of the mathematical model on a computer, and errors in any processing of the output data by the computational analyst.
MV encompasses three fundamental aspects [36]. Firstly, it involves assessing the accuracy of a model by comparing it with experimental data. Model accuracy is quantitatively evaluated using validation metric operators. Secondly, model validation entails using the model to make predictions and forecasting the response of a system under conditions for which the model has not been previously validated. Thirdly, it involves comparing the estimated accuracy of the model with the accuracy requirements for its intended use domain, ultimately determining whether the model is adequate or inadequate for its intended purpose.
Scientific computing employs various types of models, with the primary ones being conceptual, mathematical, and computational. The conceptual model delineates the physical system, its surroundings, relevant phenomena, operating environment, and domain of intended use, along with any simplifying physical assumptions. Derived from the conceptual model, the mathematical model comprises a set of mathematical and logical relations representing the system and its responses to the environment. The computational model, in turn, arises from the numerical implementation of the mathematical model, involving the formulation of discretized equations and solution algorithms programmed into a computer. While model validation primarily addresses the mathematical model, comparisons with experimental data also involve assessing the results of the computational model.
4. Various Approaches for Determining Level of Maturity in Modeling and Simulation
The level of maturity is critical for any tool used in M&S, as both analysts and reviewers depend on the accuracy of the results it provides. This principle holds true for PRA model development and quantification as well. To fully understand the EAF, it is useful to explore some general approaches, which are discussed in this section.
M&S significantly influences the design and evaluation of engineered systems, particularly in high-consequence contexts such as NPP, nuclear waste storage facilities, and nuclear weapons safety assessments. These simulations must exhibit exceptionally high levels of quality in terms of both credibility and interpretability. M&S offers numerous benefits, including reducing time-to-market for new products, optimizing system performance prior to production, lowering the cost of traditional engineering design cycles, and enabling the assessment of system reliability and safety in conditions that cannot be feasibly tested.
In PRA, the reliance on specialized software underscores the importance of measuring the maturity and credibility of such tools. Several approaches exist to assess software maturity, which is a foundational element for our enhancement methodology.
The most widely recognized method for assessing the maturity of software product development and business processes is the Capability Maturity Model Integration (CMMI), which was developed by the Software Engineering Institute hosted by Carnegie Mellon University [37]. The latest iteration of CMMI is explicitly tailored for service-oriented organizations and is known as CMMI for Services [38].
The Technology Readiness Levels (TRLs) system, which originated from risk management practices, was introduced by NASA [39]. TRLs were developed to reduce acquisition risks associated with high-technology systems by providing a more precise and standardized assessment of technology maturity. The TRL system categorizes technological maturity into nine levels, each representing a different stage in the evolution of a technology.
NASA’s Technical Standard for Models and Simulations [40], recently revised, primarily mitigates risks associated with decisions influenced by models and simulations. The Standard achieves this by establishing a foundational set of best practices applicable to all models and simulations and a flexible life-cycle process that includes formal assessments to ensure the credibility of results derived from models and simulations. This approach minimizes risks through requirements and recommendations covering various aspects such as development, maintenance, operation, results analysis, training, assessments, and reporting. Notably, the Standard outlines what needs to be accomplished and communicated, leaving the specific methodologies and practices to discipline-specific recommended guides tailored to individual applications.
The Predictive Capability Maturity Model (PCMM) [41] is constructed based on several previously established methodologies, employing a 4-level approach.
- Level 0: Little to no assessment of accuracy or completeness; limited evidence of maturity; reliance on individual judgment and experience; convenience and expediency are primary motivators. This level is suitable for low-consequence systems, those with minimal reliance on models and simulations, scoping studies, or conceptual design support.
- Level 1: Informal assessment of accuracy and completeness; generalized characterization; evidence of maturity; internal peer review group conducts some assessments. Typically appropriate for moderate consequence systems, those with some reliance on models and simulations, or preliminary design support.
- Level 2: Formal assessment of accuracy and completeness; detailed characterization; significant evidence of maturity; assessments conducted by an internal peer review group. Commonly suitable for high-consequence systems, those with substantial reliance on models and simulations, qualification support, or final design support.
- Level 3: Formal assessment of accuracy and completeness; precise and accurate characterization; comprehensive evidence of maturity; assessments conducted by independent peer-review groups. Typically, it is appropriate for high-consequence systems where decision-making relies heavily on models and simulations, such as certification or qualification of a system’s performance, safety, and reliability primarily based on models and simulations rather than complete system testing information.
The elements utilized in the PCMM include:
- Representation and geometric fidelity.
- Physics and material model fidelity.
- Code verification.
- Solution verification.
- Model validation.
- Uncertainty quantification and sensitivity analysis.
Each of these elements and their respective maturity levels can be considered relatively independent measures or attributes of predictive capability.
The methodology has gained widespread adoption and has become foundational within the nuclear industry. For instance, it has been employed in initiatives such as the Consortium for Advanced Simulation of Light Water Reactors codes [42], as well as in trustworthiness studies for nearly autonomous management and control systems [43], and the development of nuclear thermal hydraulic codes [44].
5. Enhancement Assessment Framework – Unique Approach for Probabilistic Risk Assessment Tools
EAF is constructed based on the PCMM approach, specifically tailored to target PRA tools. It employs a 4-level index approach ranging from 4 to 1, encompassing five essential elements as illustrated in Figure 2. Each index level has predefined criteria to assess the Enhancement Need Index (ENI). The elements serve as necessary milestones in the process of improving a PRA tool.
These five elements collectively form the diagnostic methodology for PRA tools. This methodology informs the improvement strategy, which may include optimization, leveraging parallel computing, or developing novel features from scratch.
Each element in the EAF can also contribute to CV, SV, and MV, as outlined in the corresponding table in Appendix A, Appendix B, Appendix C, Appendix D and Appendix E. Although it is not mandatory, it is recommended to apply each element sequentially, starting with model generation and progressing to deeper profiling. Each subsequent element builds upon the previous one. However, after the initial application of the EAF, the order may be adjusted, as the first application provides insights into how each element functions. Further improvements may then focus on specific EAF elements, depending on the expectations and goals set by the improvement team.
5.1. Model Generation
Model generation is critical for testing PRA tools across various configurations and serves as the foundation for subsequent enhancement steps, such as benchmarking and profiling. Model generation can involve both synthetic and real-world models, depending on the availability of models and the objectives of the improvement efforts. Researchers working on enhancing a PRA tool may initially focus on specific solutions and test the tool using synthetic models, which is why synthetic model generation is included as an element of the EAF. Ultimately, all PRA tools should be tested with real-world models, if available, by the end of the enhancement process.
As shown in Figure 3, model generation combines model logic with failure data for basic events. Each element within model generation is crucial for enhancing the PRA tool. Model logic is important because the cut sets generated by the quantification engine are derived from this logic. Similarly, failure data plays a key role in calculating risk metrics, such as top event probability, importance measures, and uncertainty calculations. The significance of failure data becomes even greater when using approximation methods, like Min-Cut Upper Bound (MCUB) or Rare-Event Approximation (REA). Researchers should be mindful that probability results may deviate from expectations, especially when basic event failure probabilities exceed 0.5, a common scenario in external PRA or multi-hazard PRA.
The general description of the EAF for model generation is detailed in Table A1. If a model generator is absent, the ENI is at 4, indicating a need for significant improvement. As the ENI approaches 1, it signifies that the model generation element has become more reliable, robust, and mature. Model generation not only serves as a test generator for PRA tools but also establishes an environment for CV and SV, which is essential for comparing results against expected outcomes.
Additionally, it is recommended to place all generated models under a configuration management system to track changes and improvements throughout the enhancement process.
5.2. Model Exchange
The model exchange framework is essential for enabling the seamless transfer of models between different PRA tools. Without such a framework, updating a tool may require rebuilding all models—a process that is costly, time-consuming, and prone to errors and information loss. An efficient, reliable, and well-tested model exchange framework ensures smooth transitions between tools and supports code-to-code verification, thereby contributing to solution verification.
The model exchange element within the EAF, as outlined in Table A2, becomes especially critical when a researcher has extensively tested synthetic models and needs to verify improvements on PRA tools using actual models. Actual models are often limited to specific formats, necessitating a robust model exchange framework, as shown in Figure 4. The framework should first parse the model based on available documentation and schema, and then convert it into the required format. After conversion, the format must be exported into a file structure that the PRA tool under development can process.
For instance, if a generic Pressurized Water Reactor (PWR) model [45] is available in SAPHIRE format, but the quantification engine requires input in OpenPSA XML [46], the model must be converted accordingly. Without this capability, any claims of improvement would be restricted to synthetic models alone.
5.3. Benchmarking
Benchmarking is a well-established computer science method primarily used to compare various methods, techniques, and tools [47]. In the benchmarking phase of the EAF methodology, three key components come into play: the PRA model, the PRA tool itself, and the benchmarking configuration, as illustrated in Figure 5.
The generation of the PRA model is closely linked to the specific PRA tool being analyzed. For benchmarking purposes, only the executable version of the PRA tool is required. The benchmarking configuration is crucial for replicating the work and predefining the limits of each run. By setting these limits in advance, the configuration ensures that the tool’s performance is evaluated under standardized conditions, tailored to the computational environment.
Once these three elements are prepared, the benchmarking process begins, measuring key metrics such as CPU time and memory usage for each model run. These measurements offer valuable insights into the performance and resource utilization of the PRA tool under various conditions, laying the foundation for further analysis and improvement.
As detailed in in Table A3, benchmarking serves as an EAF for CV, SV, and MV. A robust benchmarking suite allows developers to validate quantification results and compare the tool’s performance with other industry counterparts. Given that quantification results guide critical decision-making processes, it is vital to ensure solution accuracy and optimize the tool’s performance to deliver expected outcomes within defined timeframes using available computing resources.
5.4. Standard Profiling
The standard profiling methodology, illustrated in Figure 6, utilizes a challenging PRA model to enhance the understanding of the source code by allowing sufficient runtime. This model, selected based on benchmarking results, serves as a comprehensive test for the PRA tool.
To prepare the PRA tool, it must be compiled in release mode with the highest compiler optimization level while generating debug information for accurate profiling.
Standard profiling as an EAF element is detailed in Table A4, becomes an essential element when targeting improvements. The benchmarking process initiates the profiling step, which is informed by the model generator and the model exchange framework. During profiling, predefined models are analyzed, allowing for the identification of areas for improvement within the functions.
5.5. Deeper Profiling
The goal of the deeper profiling methodology remains consistent with that of standard profiling introduced in the previous section. However, the methodologies, models used, and outcomes may differ slightly.
In the deeper profiling step, as illustrated in Figure 7, we divide the entire process into six distinct sub-processes. This division facilitates the independent investigation and improvement of each component. Each sub-process is structured to feed into the next in a serial manner, enabling the parallelization of sub-processes whenever possible through shared memory parallelization techniques. While the naming conventions may vary across different PRA tools, these six distinct sub-processes are expected to be present in a complete PRA tool.
The set up involves collecting the top events of fault trees and applying common cause failure models when available. The pre-processing step simplifies and modularizes the process to efficiently generate cut sets. Cut set generation applies the solution method, while storing cut sets involves deciding the format for the stored cut sets to facilitate follow-up calculations. The calculations encompass probability, uncertainty, and importance measurement assessments, relying on the generated and stored cut sets to derive results. Reporting results entails saving the outcomes of the solution in a text file for user review.
A general description of deeper profiling as an EAF is provided in Table A5. Deeper profiling also aims to measure the performance of the tool.
6. Application of Enhancement Assessment Framework to Available Probabilistic Risk Assessment Tools
EAF is applicable to all PRA tools. However, for a comprehensive application of EAF to a specific PRA tool, access to the source code is essential, particularly when identifying improvement needs within the source code itself.
Direct access to the source code may not be necessary when the objective is SV and MV. In such cases, model generation, the model exchange framework, and benchmarking elements are sufficient to achieve these objectives. These elements enable developers to verify quantification results, compare performance with other PRA tools, and ensure that the tool functions as intended without delving into the intricacies of the source code.
Since we have access to SCRAM-CPP and SAPHIRE Solve Engine (SAPHSOLVE) [48], EAF is applied to assess the ENI for the current versions of both quantification engines. The ENI for each element is established and given in Table 1.
The latest version of the Open-PSA MEF and SAPHSOLVE model generator [18] boasts the following capabilities:
- Synthetical model generation is possible.
- Generated models include AND, OR, K/N gates.
- Models include only fault trees.
- Models are rigorously tested and validated using at least two different quantification engines.
- Models are in a configuration management system.
- Model generation is well documented.
- Some peer review is conducted.
This model generator is currently indexed as 2, indicating moderate maturity. Some early works have emphasized the significance of a model exchange framework [49], particularly regarding model exchange between SAPHIRE and CAFTA. However, this area remains in its nascent phase. Therefore, it can be concluded that a model exchange framework between various tools is currently not feasible, resulting in an ENI of 4.
Establishing a model generator and model exchange framework is foundational for the remaining elements. Notably, the model generator and model exchange framework are essential components for code and solution verification.
Currently, a benchmarking suite for a PRA tool has not been defined or is not publicly available, with the target being an ENI of 2. Since the goal is to enhance the PRA tool, establishing a standard and deeper profiling methodology is crucial. At present, both elements have an ENI of 4.
As a result, we determined the ENI for each element in both quantification engines. Our evaluation indicates that additional effort is required to reduce the ENI for each EAF element, consistent with the need for updates in the quantification engines. This outcome does not imply an absence of diagnostic and improvement strategies in these tools; instead, applying the EAF provides a systematic, repeatable, and trackable approach to diagnostics and improvement.
7. Conclusion
PRA tools have been in use for more than three decades, and the EAF plays a vital role in enhancing these tools in an objective, systematic, efficient, and traceable manner. The five EAF elements not only assess the current level of each element but also facilitate CV, SV, and MV. Model generation enables the creation of models with diverse configurations to rigorously test the quantification engine, while model exchange extends this testing from synthetic models to actual models when available. Without a model exchange platform, developers may be limited to synthetic models, which may not fully test the quantification engine. Benchmarking measures performance metrics with given models and configurations without requiring source code access. When the source code is accessible, profiling elements can pinpoint specific areas in need of improvement. Together, these five elements enable the assessment of the quantification engine’s ENI and guide researchers in defining an improvement strategy. Rather than a one-time application, the EAF functions as a cyclic process throughout the quantification engine’s lifecycle.
In our demonstration case, we observed that SCRAM-CPP and SAPHSOLVE would benefit from further efforts to implement the EAF. In future work, we will explore each element in detail for both SCRAM-CPP and SAPHSOLVE and develop an improvement strategy based on our findings.
Author Contributions
Egemen M. Aras: Conceptualization, Formal Analysis, Investigation, Methodology, Visualization, Writing – Original Draft. Mihai A. Diaconeasa: Conceptualization, Formal Analysis, Funding Acquisition, Investigation, Methodology, Supervision, Writing – Review and Editing. The authors have read and agreed to the published version of the manuscript.
Funding
This research is funded by the Department of Energy (DOE) Office of Nuclear Energy’s Nuclear Energy University Program (NEUP) project No. 21-24004. Any opinions or conclusions expressed in this study are those of the author(s) and do not necessarily reflect the views of the US DOE.
Declaration of generative AI and AI-assisted technologies in the writing process
During the preparation of this work the authors uses Grammarly and ChatGPT 4 to improve readability and language of the manuscript. After using these tools, the authors reviewed and edited the content as needed and take full responsibility for the content of the published article.
Acknowledgments
SAPHSOLVE analysis and results would not have been possible without collaboration with the SAPHIRE development team at Idaho National Laboratory. Also, invaluable support and feedback from our research group, the Probabilistic Risk Assessment Group (PRAG), have been instrumental in achieving this outcome.
Conflicts of Interest
The authors have nothing to declare.
Appendix A. Description of Enhancement Assessment Framework for Model Generation

Table A1.
General description of EAF for model generation.
|
Enhancement Need Index [ENI] |
4 | 3 | 2 | 1 |
|
Model Generation [CV, SV] |
Synthetical model generation is not possible. |
Synthetical model generation is possible. Generated models include AND, OR gates. Models include only fault trees. Models are rigorously tested and validated using just interested quantification engine. Model generation is well documented. |
Synthetical model generation is possible. Generated models include AND, OR, K/N gates. Models include only fault trees. Models are rigorously tested and validated using at least two different quantification engines. Models are in a configuration management system. Model generation is well documented. Some peer review is conducted. |
Synthetical model generation is possible. Generated models include AND, OR, K/N gates. Models include common cause failures. Models include both event trees and linked various fault trees. Models are rigorously tested and validated using at least two different quantification engines. Data necessary for the model is captured automatically from the database available. Models are in a configuration management system. Model generation is well documented. An independent peer review is conducted. |
Appendix B. Description of Enhancement Assessment Framework for Model Exchange
Table A2.
General description of EAF for model exchange.
|
Enhancement Need Index [ENI] |
4 | 3 | 2 | 1 |
|
Model Exchange [CV, SV] |
Model exchange between various tools is not possible. |
Model exchange between various tools is possible. Models include AND, OR gates. Models are either synthetical or real-life models. Models include only fault trees. Models are rigorously tested and validated using just interested quantification engine. Model generation is well documented. |
Model exchange between various tools is possible. Models include AND, OR, K/N gates. Models are real-life models. Models include both event trees and linked various fault trees. Models are rigorously tested and validated using at least two different quantification engines. Models are in a configuration management system. Model generation is well documented. Some peer review is conducted. |
Model exchange between various tools is possible. Models include AND, OR, K/N gates. Models are real-life models. Models include common cause failures. Models include both event trees and linked various fault trees. Models are rigorously tested and validated using at least two different quantification engines. Data necessary for the model is captured automatically from the database available. Models are in a configuration management system. Model generation is well documented. An independent peer review is conducted. |
Appendix C. Description of Enhancement Assessment Framework for Benchmarking
Table A3.
General description of EAF for benchmarking.
|
Enhancement Need Index [ENI] |
4 | 3 | 2 | 1 |
|
Benchmarking [CV, SV, MV] |
The benchmarking framework is not ready. |
The benchmarking framework is ready. Performance metrics are well-defined and measured. Run configuration is defined and tested. Only selected approaches and approximations are tested. Test models satisfy Model Generation element ENI of 3. Benchmarking is well documented. |
The benchmarking framework is ready. Performance metrics are well-defined and measured. Run configuration is defined and tested. Various approaches and approximations are tested. Test models satisfy Model Generation element ENI of 2. Results are in a configuration management system. Benchmarking is well documented. Some peer review is conducted. |
The benchmarking framework is ready. Performance metrics are well-defined and measured. Run configuration is defined and tested. Various approaches and approximations are tested. Test models satisfy Model Generation element ENI of 1. Results are in a configuration management system. Benchmarking is well documented. An independent peer review is conducted. |
Appendix D. Description of Enhancement Assessment Framework for Standard Profiling
Table A4.
General description of EAF for standard profiling.
|
Enhancement Need Index [ENI] |
4 | 3 | 2 | 1 |
|
Standard Profiling [MV] |
The standard profiling framework is not ready. |
The standard profiling framework is ready. Overall performance is obtained. Hot spots in the source are identified. Run configuration is defined and tested. Only selected approaches and approximations are tested. Test models satisfy Model Generation element ENI of 3. Standard profiling is well documented. |
The standard profiling framework is ready. Overall performance is obtained. Hot spots in the source are identified. Run configuration is defined and tested. Various approaches and approximations are tested. Test models satisfy Model Generation element ENI of 2. Results are in a configuration management system. Standard profiling is well documented. Some peer review is conducted. |
The standard profiling framework is ready. Overall performance is obtained. Hot spots in the source are identified. Run configuration is defined and tested. Various approaches and approximations are tested. Test models satisfy Model Generation element ENI of 1. Results are in a configuration management system. Standard profiling is well documented. An independent peer review is conducted. |
Appendix E: Description of Enhancement Assessment Framework for Deep Profiling
Table A5.
General description of EAF for deeper profiling.
|
Enhancement Need Index [ENI] |
4 | 3 | 2 | 1 |
|
Deeper Profiling [MV] |
The deeper profiling framework is not ready. |
The deeper profiling framework is ready. The whole run is broken down into sub-runs. The performance of each sub-run is obtained. Run configuration is defined and tested. Only selected approaches and approximations are tested. Test models satisfy Model Generation element ENI of 3. Deeper profiling is well documented. |
The deeper profiling framework is ready. The whole run is broken down into sub-runs. The performance of each sub-run is obtained. Run configuration is defined and tested. Various approaches and approximations are tested. Test models satisfy Model Generation element ENI of 2. Results are in a configuration management system. Deeper profiling is well documented. Some peer review is conducted. |
The deeper profiling framework is ready. The whole run is broken down into sub-runs. The performance of each sub-run is obtained. Run configuration is defined and tested. Various approaches and approximations are tested. Test models satisfy Model Generation element ENI of 1. Results are in a configuration management system. Deeper profiling is well documented. An independent peer review is conducted. |
References
- W. Keller and M. Modarres, “A historical overview of probabilistic risk assessment development and its use in the nuclear power industry: a tribute to the late Professor Norman Carl Rasmussen,” Reliability Engineering & System Safety, vol. 89, no. 3, pp. 271–285, Sep. 2005. [CrossRef]
- I. S. Kim, S. K. Ahn, and K. M. Oh, “Deterministic and risk-informed approaches for safety analysis of advanced reactors: Part II, Risk-informed approaches,” Reliability Engineering & System Safety, vol. 95, no. 5, pp. 459–468, May 2010. [CrossRef]
- W. E. Vesely and R. E. Narum, “PREP and KITT Computer Codes for the Automatic Evaluation of a Fault Tree,” Idaho Nuclear Corporation, Idaho, IN-1349, 1970.
- J. B. Fussell, E. B. Henry, and N. H. Marshall, “MOCUS: a computer program to obtain minimal sets from fault trees,” ANCR--1156, 4267950, Aug. 1974. [CrossRef]
- S. Hoon Han, T. Woon Kim, and K. Joong Yoo, “Development of an integrated fault tree analysis computer code MODULE by modularization technique,” Reliability Engineering & System Safety, vol. 21, no. 2, pp. 145–154, Jan. 1988. [CrossRef]
- L. L. N. Laboratory, “SIGPI:A USER’S MANUAL FOR FAST COMPUTATION OF THE PROBABILISTIC PERFORMANCE OF COMPLEX SYSTEMS.,” p. 73.
- J. M. Koren and J. Gaertner, CAFTA: A fault tree analysis tool designed for PSA. Germany: Verl TUEV Rheinland, 1987. [Online]. Available: http://inis.iaea.org/search/search.aspx?orig_q=RN:20061750.
- EPRI, “Phoenix Architect 2.0,” Palo Alto, CA, 2021.
- ”Systems Analysis Programs for Hands-on Integrated Reliability Evaluations (SAPHIRE) Version 8, Volume 1: Overview and Summary.,” Idaho National Lab. (INL), Idaho Falls, ID, NUREG/CR-7039, 2011. [CrossRef]
- K. D. Russell and D. M. Rasmuson, “Fault tree reduction and quantification—an overview of IRRAS algorithms,” Reliability Engineering & System Safety, vol. 40, no. 2, pp. 149–164, Jan. 1993. [CrossRef]
- M. D. Wakefield, M. S. Epstein, D. Y. Xiong, and M. K. Nouri, “RISKMAN®®, Celebrating 20+ Years of Excellence!,” p. 10.
- D. Wakefield, “Example Application of RISKMAN®®,” ABS Consulting, Inc., Operational Risk and Performance Consulting Division, 300 Commerce Drive 200, Irvine, CA, 92602, Sep. 2004. [Online]. Available: https://flightsafety.org/wp-content/uploads/2016/09/RISKMAN_application.pdf.
- S. H. Han, T. W. Kim, and K. S. Jeong, “PC Workstation-Based Level 1 PRA Code Package KIRAP,” Reliability Engineering and System Safety, vol. 30, p. 313,322, 1990.
- Manorma, “RiskSpectrum: Emerging software for Nuclear Power Industry,” in 2010 1st International Nuclear & Renewable Energy Conference (INREC), Amman, Jordan: IEEE, Mar. 2010, pp. 1–6. [CrossRef]
- Y. Wu, “Development of reliability and probabilistic safety assessment program RiskA,” Annals of Nuclear Energy, vol. 83, pp. 316–321, Sep. 2015. [CrossRef]
- A.B. Rauzy, Probabilistic Safety Analysis with XFTA. ALTARICA ASSOCIATION, 2020.
- O. Rakhimov, rakhimov/scram: Transition to C++17. (Jan. 2018). Zenodo. [CrossRef]
- Arjun Earthperson et al., openpra-org/openpra-monorepo: v0.1.1. (Mar. 28, 2024). [CrossRef]
- Z. Zhou, H. Nie, and Q. Zhang, “Design and Development of DeRisk: A Fault Tree Analysis Program Package,” in Volume 2: Plant Systems, Structures, Components, and Materials; Risk Assessments and Management, London, England: American Society of Mechanical Engineers, Jul. 2018, p. V002T14A008. [CrossRef]
- I. Niemela, “On Simplification of Large Fault Trees,” Reliability Engineering and System Safety, vol. 44, pp. 135–138, 1994.
- R. M. Sinnamon and J. D. Andrews, “New approaches to evaluating fault trees,” Reliability Engineering & System Safety, vol. 58, no. 2, pp. 89–96, Nov. 1997. [CrossRef]
- E. Châtelet, Y. Dutuit, A. Rauzy, and T. Bouhoufani, “An optimized procedure to generate sums of disjoint products,” Reliability Engineering & System Safety, vol. 65, no. 3, pp. 289–294, Sep. 1999. [CrossRef]
- K. A. Reay and J. D. Andrews, “A fault tree analysis strategy using binary decision diagrams,” Reliability Engineering & System Safety, vol. 78, no. 1, pp. 45–56, Oct. 2002. [CrossRef]
- W. S. Jung, S. H. Han, and J. Ha, “A fast BDD algorithm for large coherent fault trees analysis,” Reliability Engineering & System Safety, vol. 83, no. 3, pp. 369–374, Mar. 2004. [CrossRef]
- J. S. Choi and N. Z. Cho, “A practical method for accurate quantification of large fault trees,” Reliability Engineering & System Safety, vol. 92, no. 7, pp. 971–982, Jul. 2007. [CrossRef]
- W. S. Jung, J.-E. Yang, and J. Ha, “Development of measures to estimate truncation error in fault tree analysis,” Reliability Engineering & System Safety, vol. 90, no. 1, pp. 30–36, Oct. 2005. [CrossRef]
- A. Miller, S. Hess, and C. Smith, “R&D Roadmap to Enhance Industry Legacy Probabilistic Risk Assessment Methods and Tools,” INL/EXT-20-59202, 2020.
- G. Sheng, M. S. Elzas, T. I. Ören, and B. T. Cronhjort, “Model validation: a systemic and systematic approach,” Reliability Engineering & System Safety, vol. 42, no. 2–3, pp. 247–259, Jan. 1993. [CrossRef]
- ”Terminology for model credibility,” Simulation, vol. 32, no. 3, p. 103,104.
- Institute of Electrical and Electronics Engineers, F. Jay, and American National Standards Institute, Eds., IEEE standard dictionary of electrical and electronics terms, 3rd ed. New York, NY: Institute of Electrical and Electronics Engineers: Distributed in cooperation with Wiley-Interscience, 1984.
- IEEE standard glossary of software engineering terminology. New York, N.Y: Institute of Electrical and Electronics Engineers, 1990.
- P. K. Davis, Generalizing concepts and methods of verification, validation, and accreditation (VV&A) for military simulations. Santa Monica, Calif: Rand, 1992.
- Computational Fluid Dynamics Committee, Ed., “Guide: Guide for the Verification and Validation of Computational Fluid Dynamics Simulations (AIAA G-077-1998(2002)),” in Guide: Guide for the Verification and Validation of Computational Fluid Dynamics Simulations (AIAA G-077-1998(2002)), Washington, DC: American Institute of Aeronautics and Astronautics, Inc., 1998. [CrossRef]
- American Society of Mechanical Engineers, Ed., Guide for verification and validation in computational solid mechanics: an American national standard. in ASM V&V 2006, no. 10. New York: ASME Press, 2006.
- W. L. Oberkampf and C. J. Roy, Verification and Validation in Scientific Computing. New York: Cambridge University Press, 2010.
- W. L. Oberkampf and T. G. Trucano, “Verification and Validation Benchmarks,” Sandia National Laborato ries, Albuquerque, NM, USA, SAND2007-0853, 2007.
- ”CMMI for Development, Version 1.3.” Accessed: Apr. 12, 2024. [Online]. Available: https://insights.sei.cmu.edu/library/cmmi-for-development-version-13/.
- ”CMMI for Services, Version 1.3”.
- J. C. Mankins, “TECHNOLOGY READINESS LEVELS”.
- Office of the NASA Chief Engineer, Standard for Models and Simulations, Technical Standard NASA-STD-7009B, Feb. 05, 2024.
- W. Oberkampf, T. Trucano, and M. Pilch, “Predictive Capability Maturity Model for computational modeling and simulation.,” SAND2007-5948, 976951, Oct. 2007. [CrossRef]
- V. Mousseau and N. Dinh, “CASL Verification and Validation Plan,” SAND2016--6338R, 1431322, 643439, Jun. 2016. [CrossRef]
- L. Wang, L. Lin, and N. Dinh, “Trustworthiness modeling and evaluation for a nearly autonomous management and control system,” Reliability Engineering & System Safety, p. 110008, Feb. 2024. [CrossRef]
- P. Athe and N. Dinh, “A framework for assessment of predictive capability maturity and its application in nuclear thermal hydraulics,” Nuclear Engineering and Design, vol. 354, p. 110201, Dec. 2019. [CrossRef]
- C. Smith, “Generic Pressurized Water Reactor Model for SAPHIRE,” INL/EXT-21-62553-Rev000, 1804754, Apr. 2021. [CrossRef]
- E. Steven and R. Antoine, Eds., “Open-PSA Model Exchange Format.” 2017.
- W. Hasselbring, “Benchmarking as Empirical Standard in Software Engineering Research,” in Evaluation and Assessment in Software Engineering, Trondheim Norway: ACM, Jun. 2021, pp. 365–372. [CrossRef]
- E. M. Aras, A. S. Amin Aly Farag, S. T. Wood, and J. T. Boyce, “Refining Processing Engines from SAPHIRE: Initialization of Fault Tree/Event Tree Solver,” Idaho National Laboratory (INL), Idaho Falls, ID (United States), INL/RPT-23-75066-Rev000, Oct. 2023. [CrossRef]
- M. Hamza, A. Tezbasaran, E. Aras, A. S. Farag, and M. A. Diaconeasa, “Model Exchange Methodology Between Probabilistic Risk Assessment Tools: SAPHIRE and CAFTA Case Study,” presented at the 18th International Probabilistic Safety Assessment and Analysis (PSA 2023), Knoxville, TN, Jul. 2023.
Figure 1.
PRA tools developed along the history.
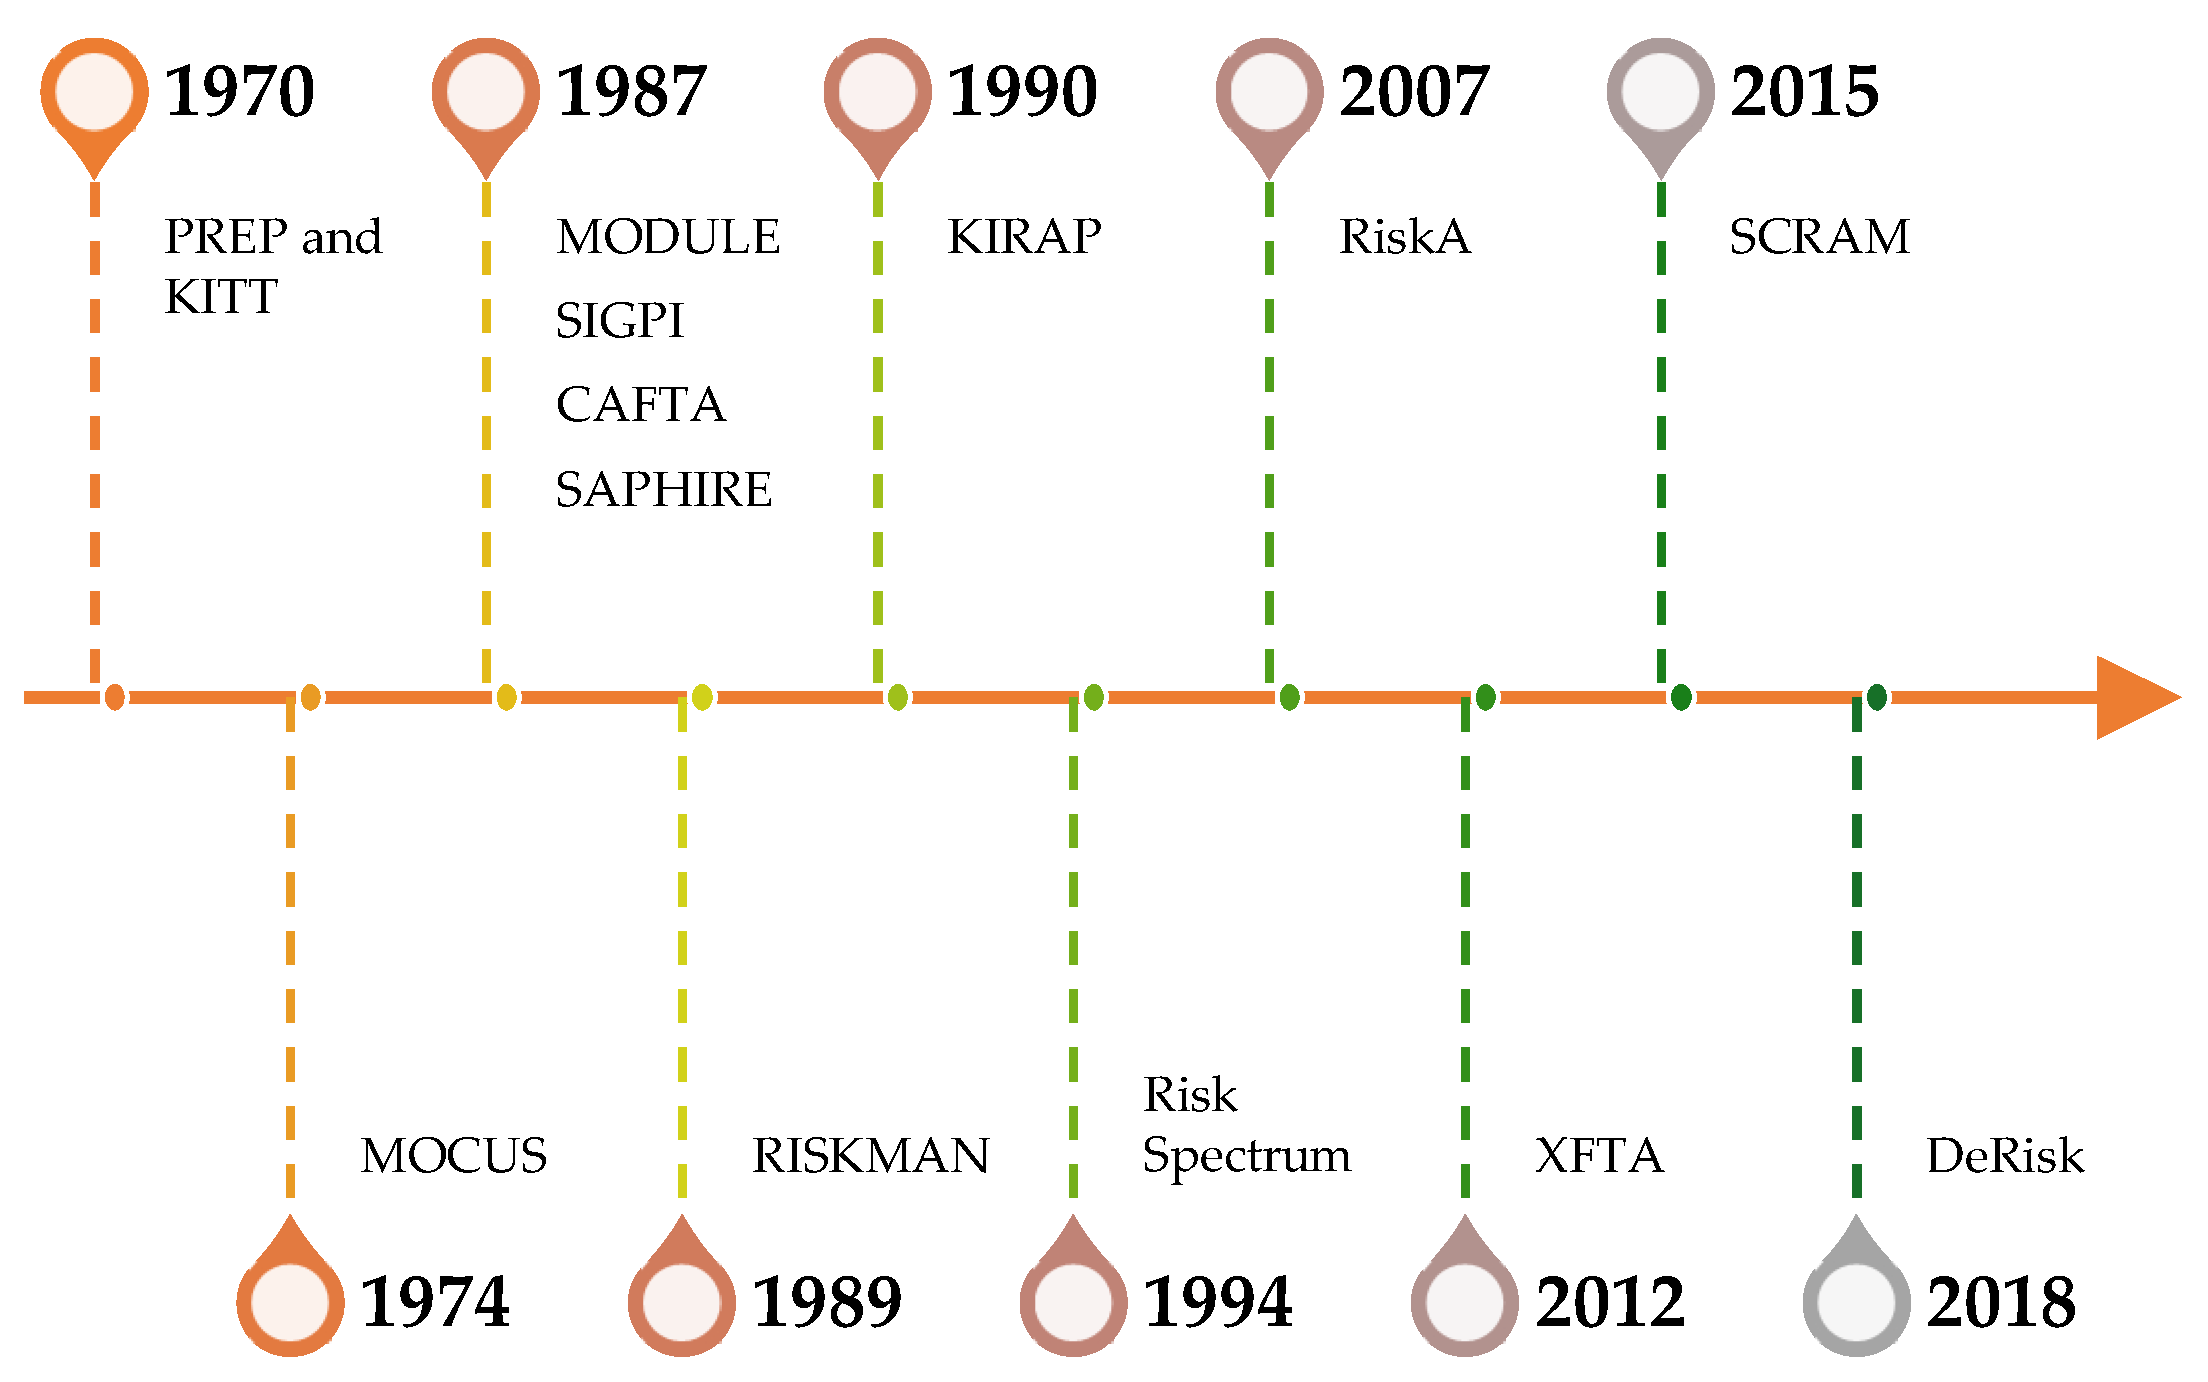
Figure 2.
Enhancement assessment framework elements.
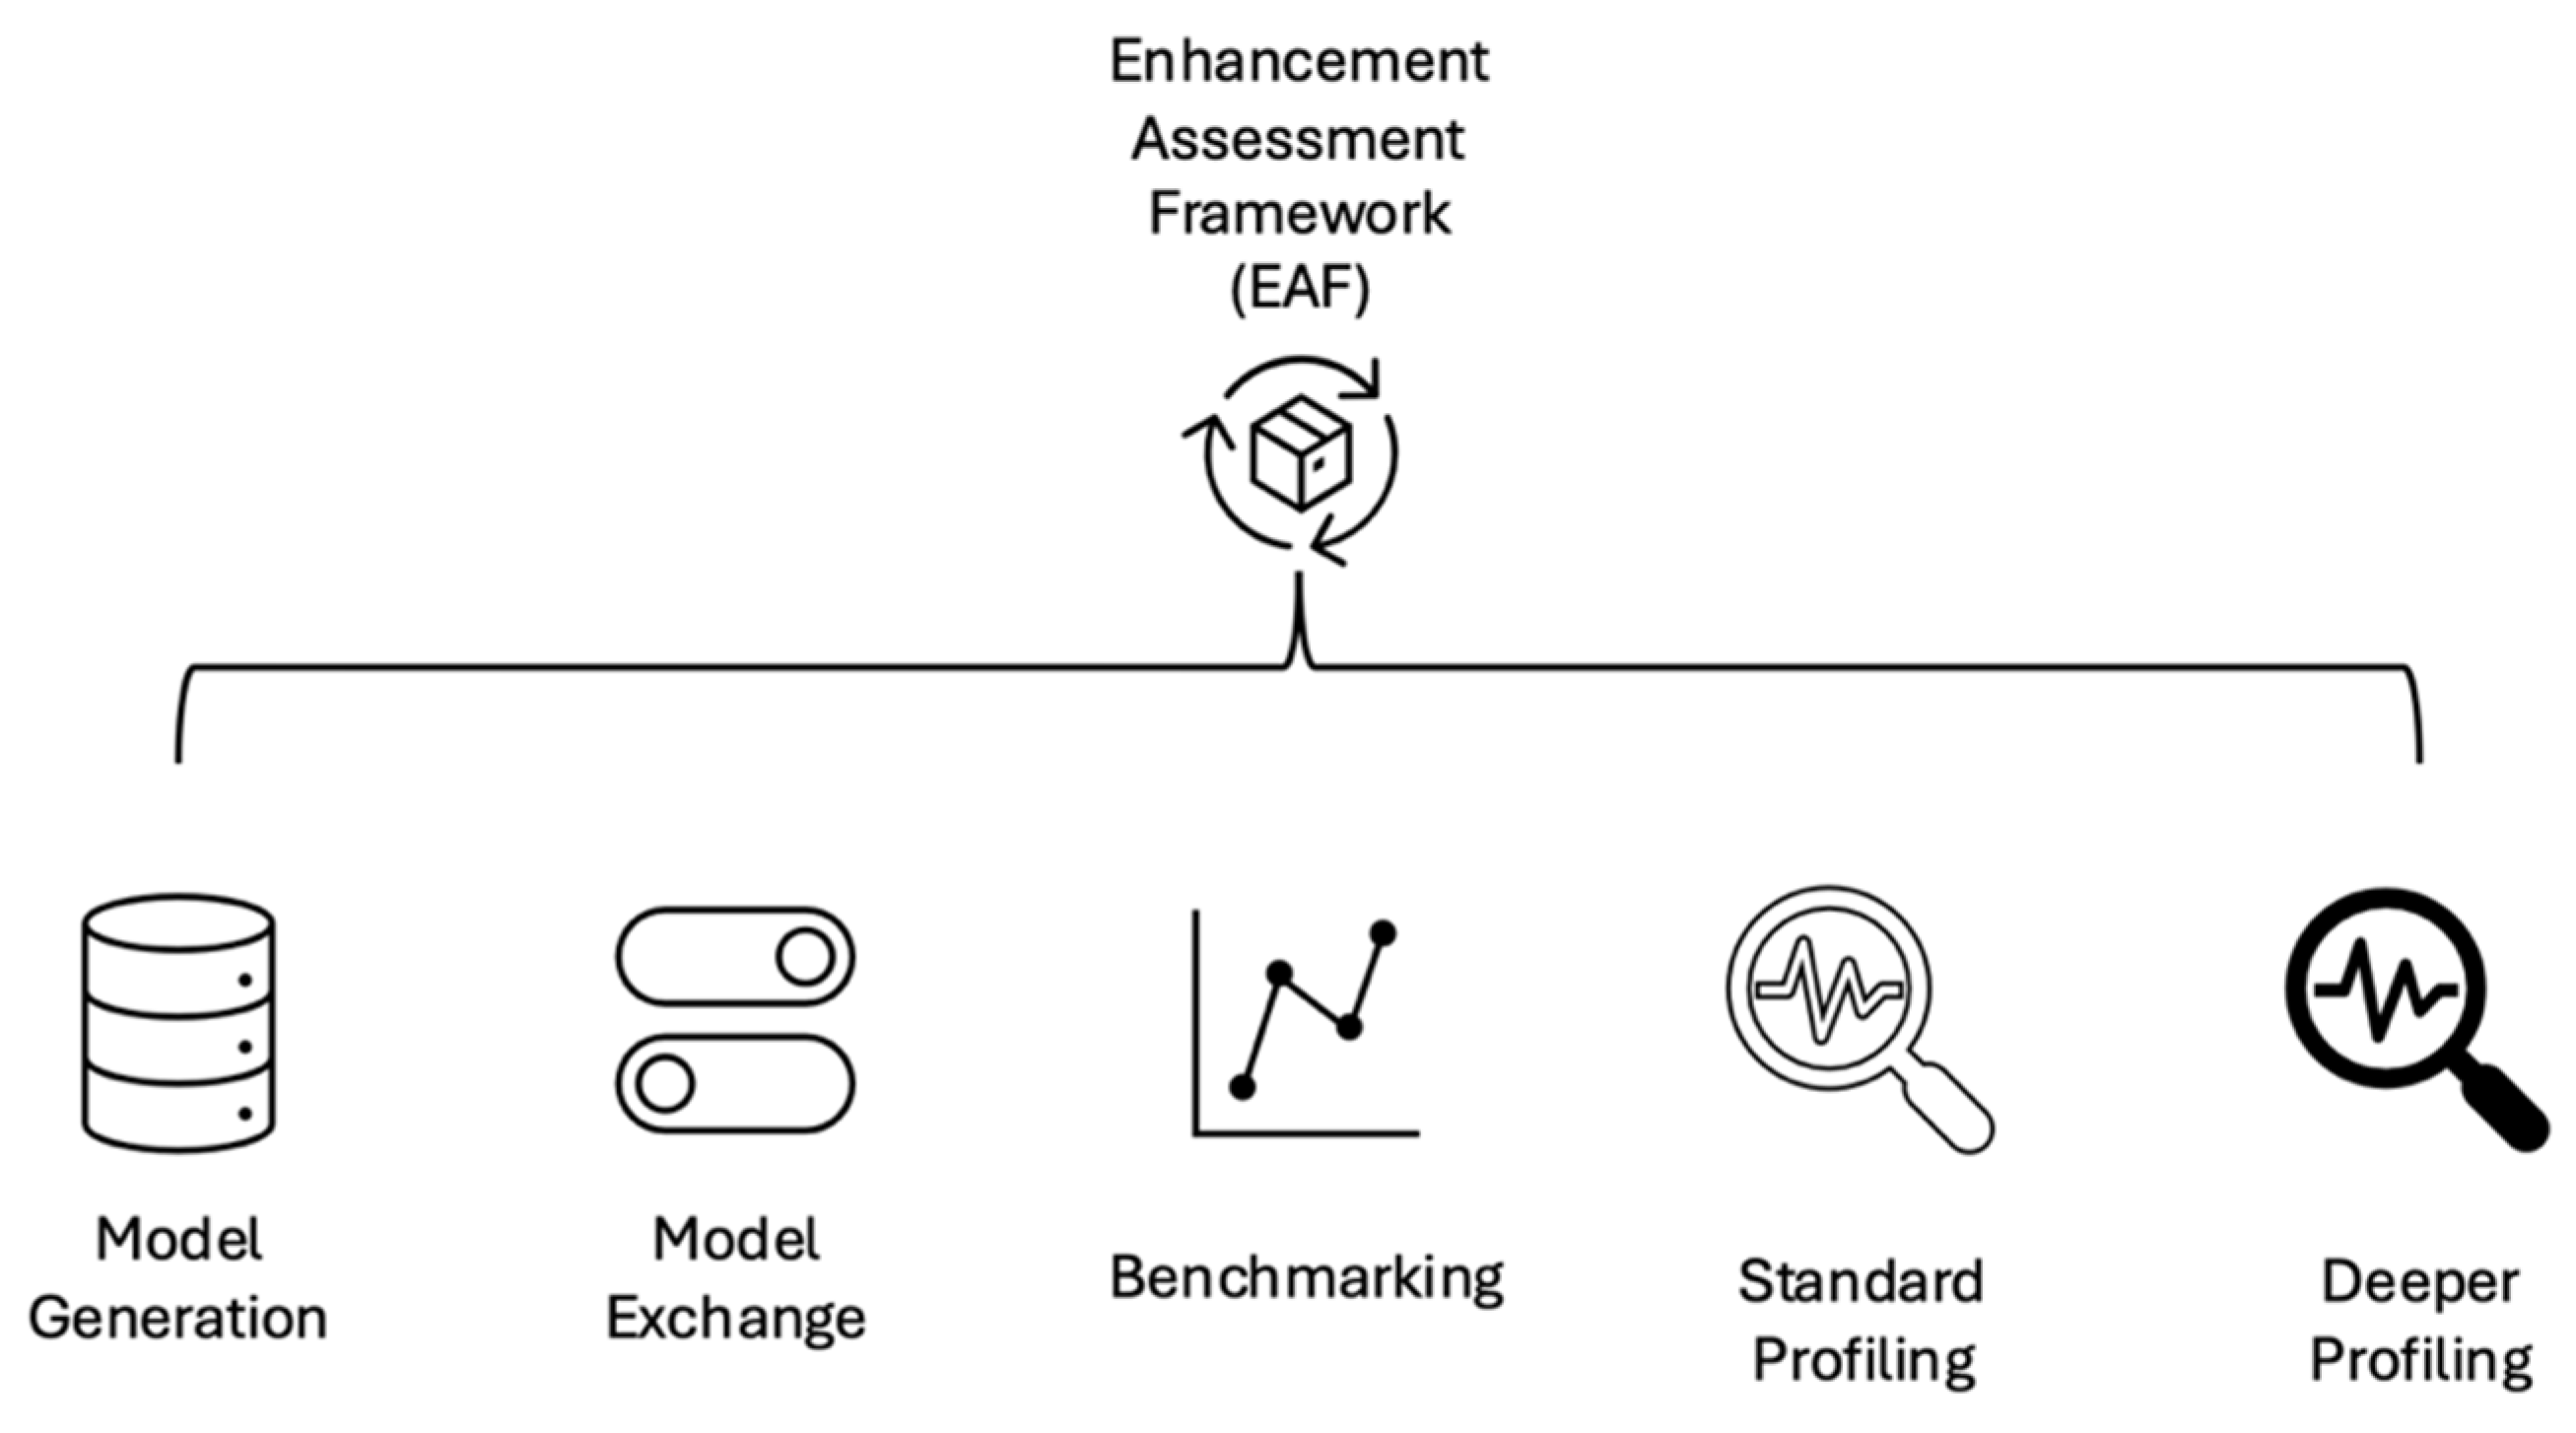
Figure 3.
Model generator framework.
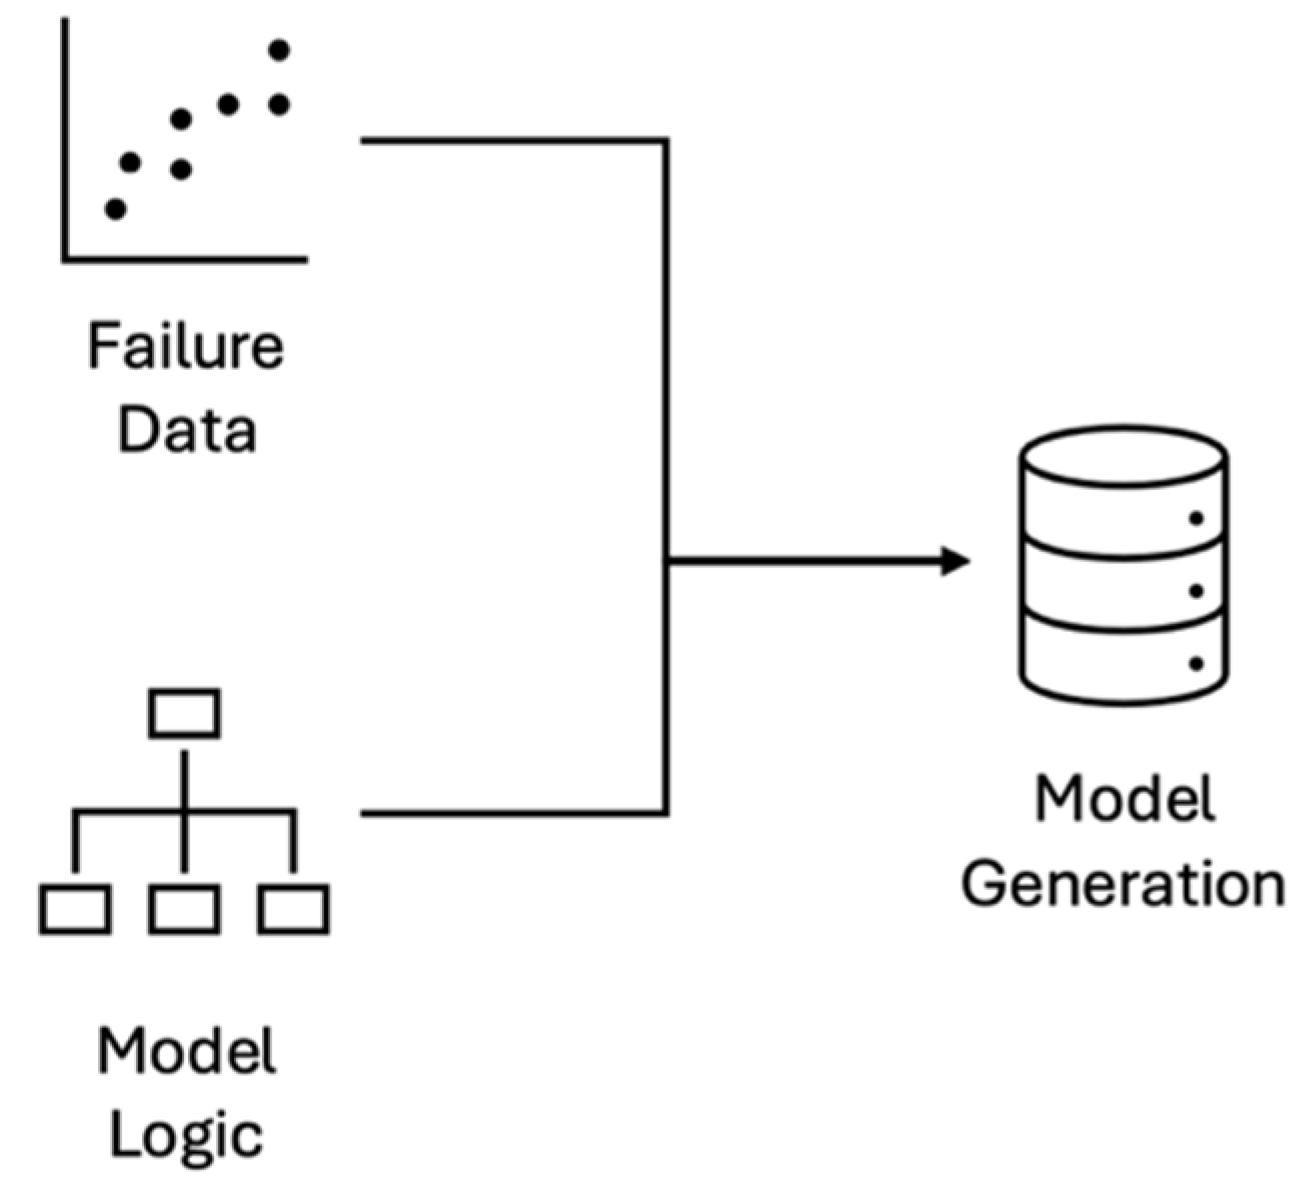
Figure 4.
Model exchange framework.
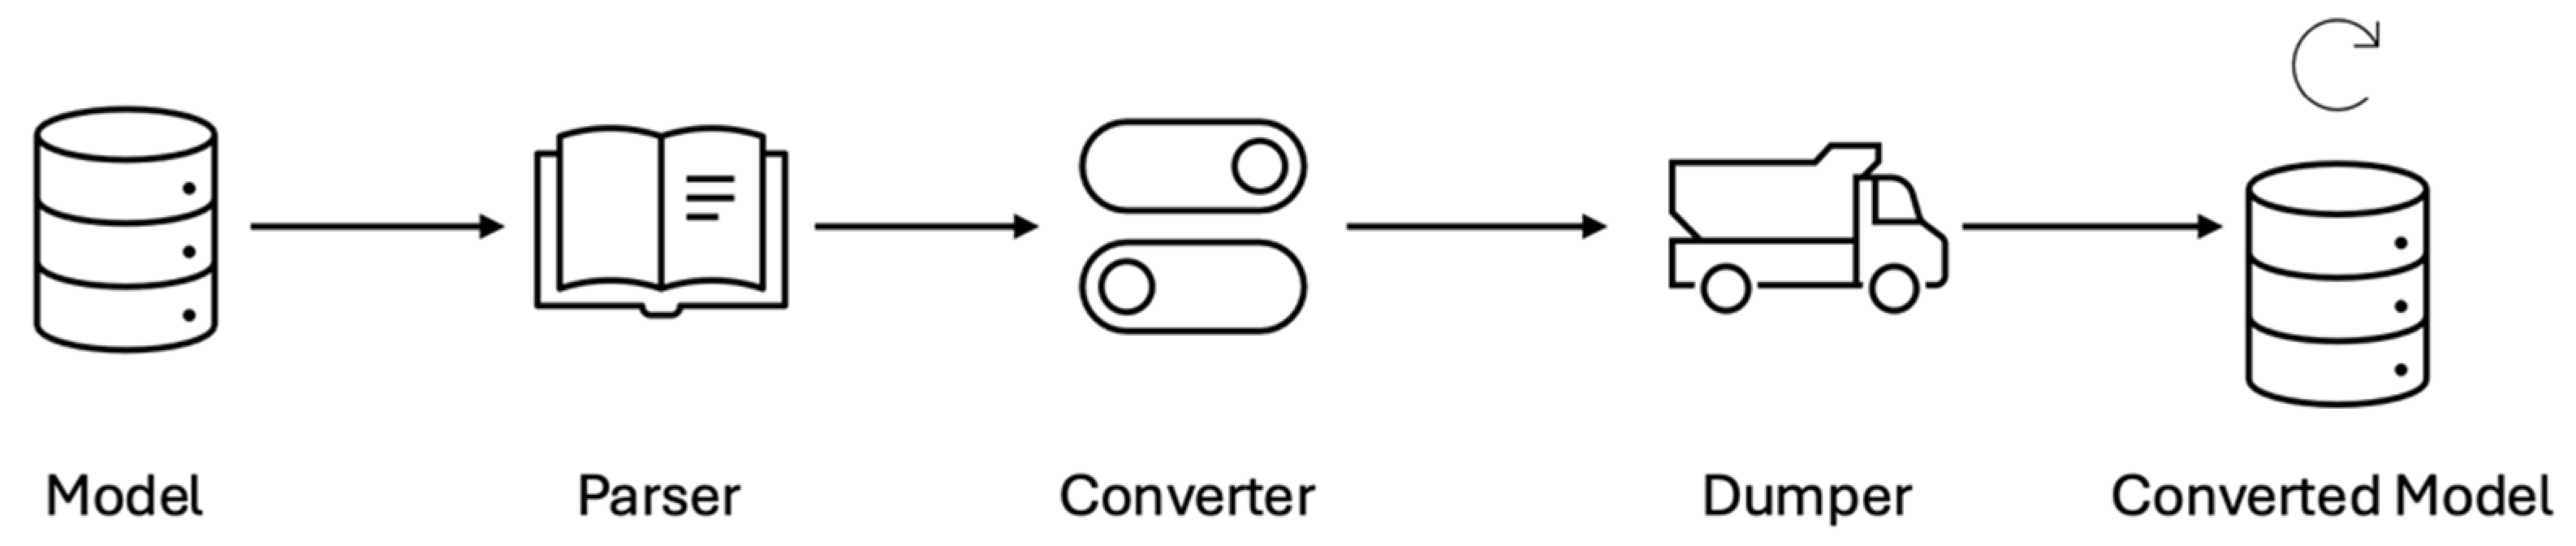
Figure 5.
Benchmarking methodology.
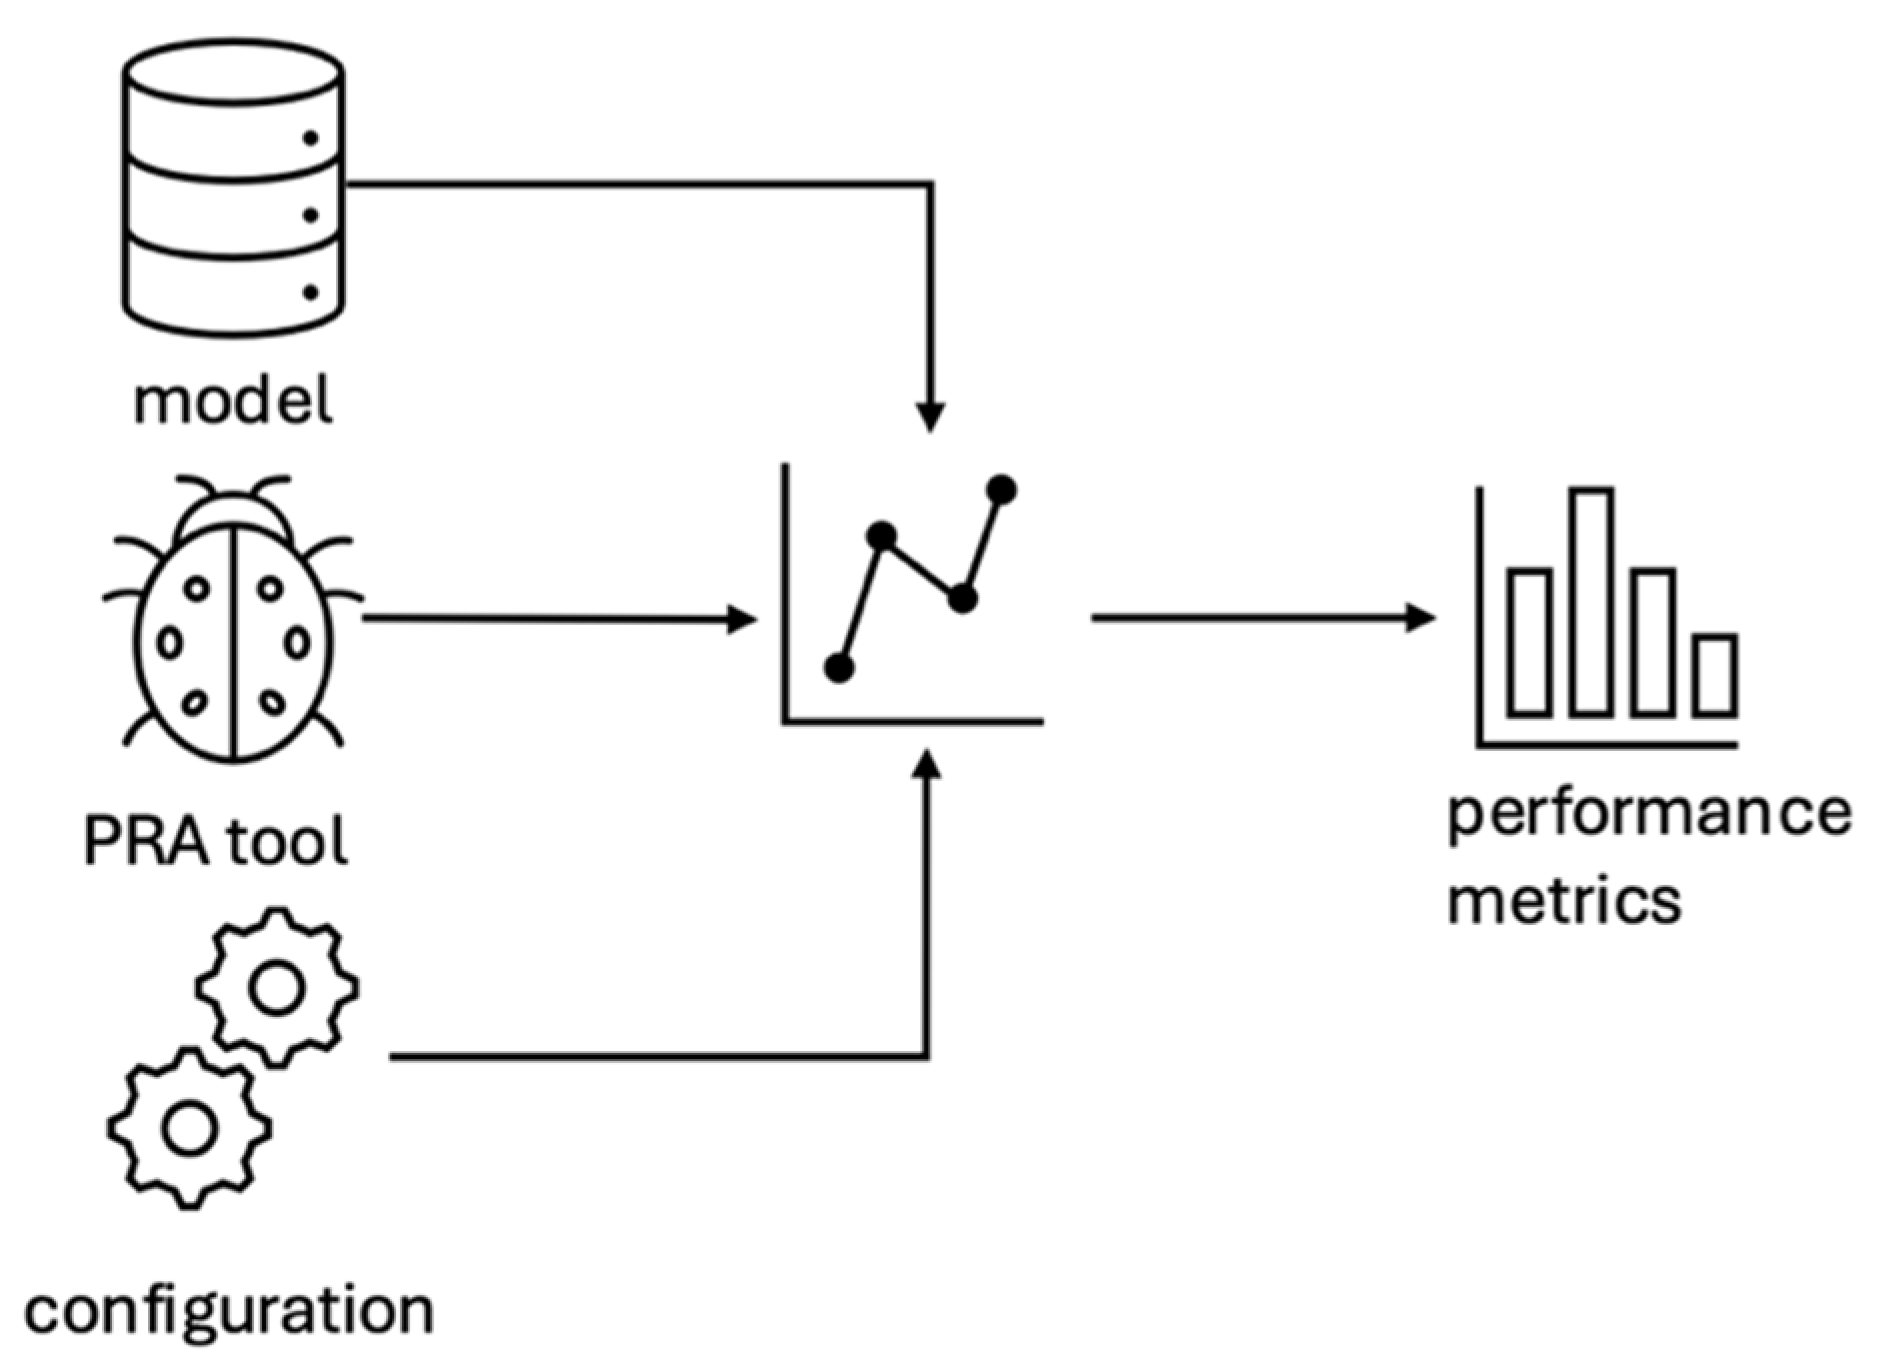
Figure 6.
Standard profiling framework.
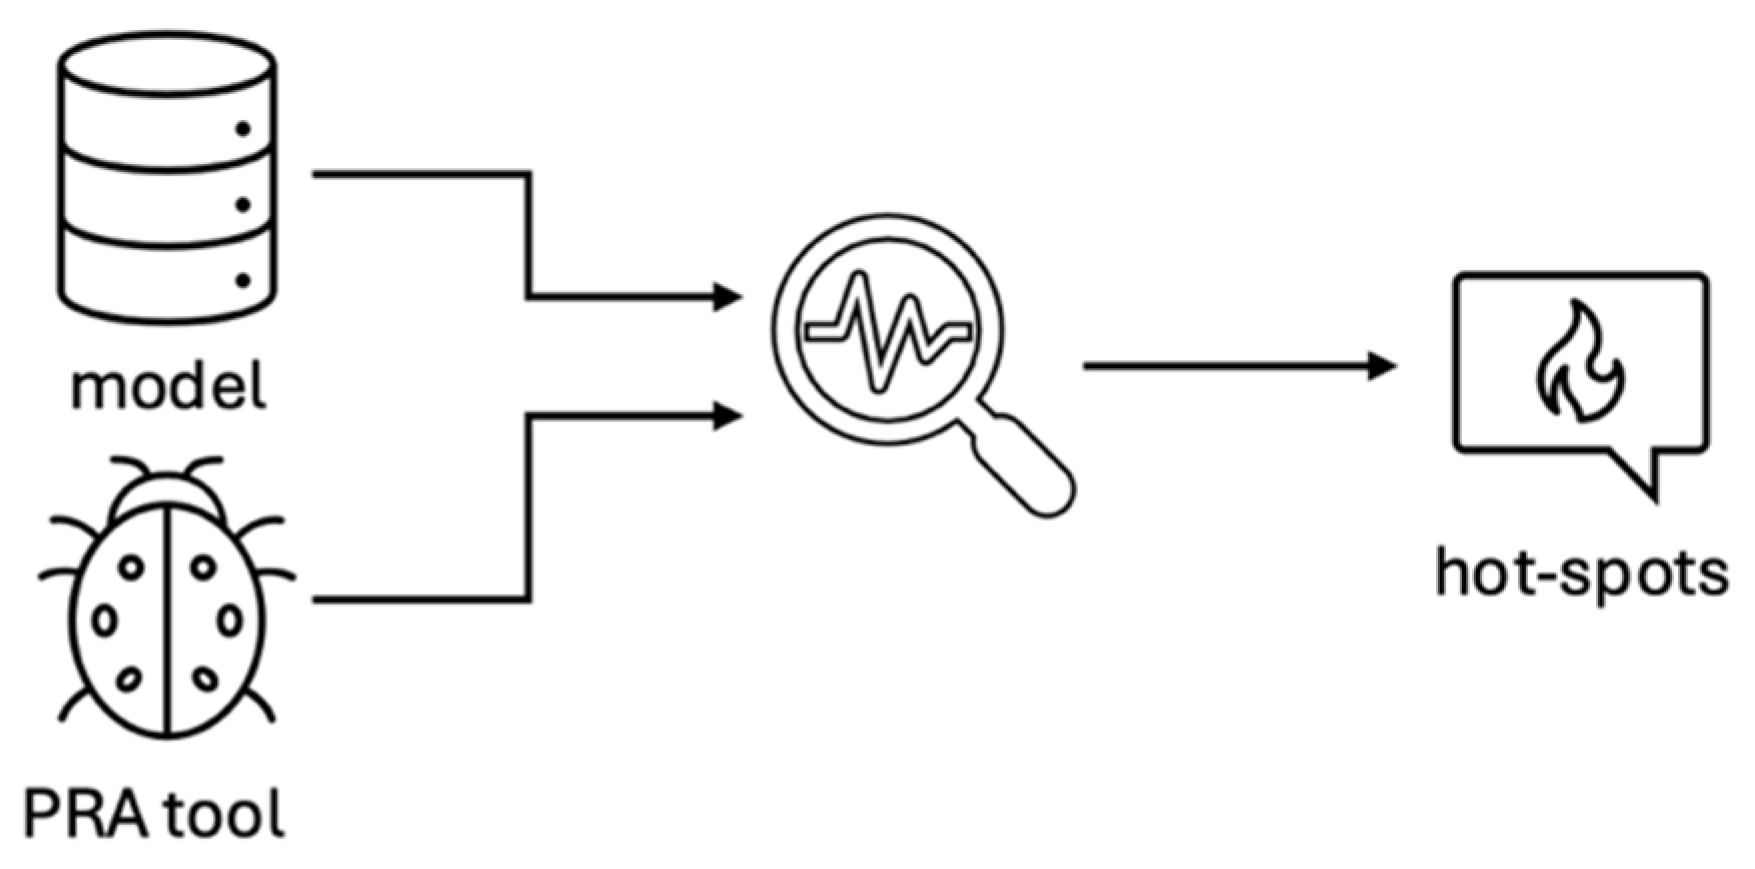
Figure 7.
Deeper profiling methodology.
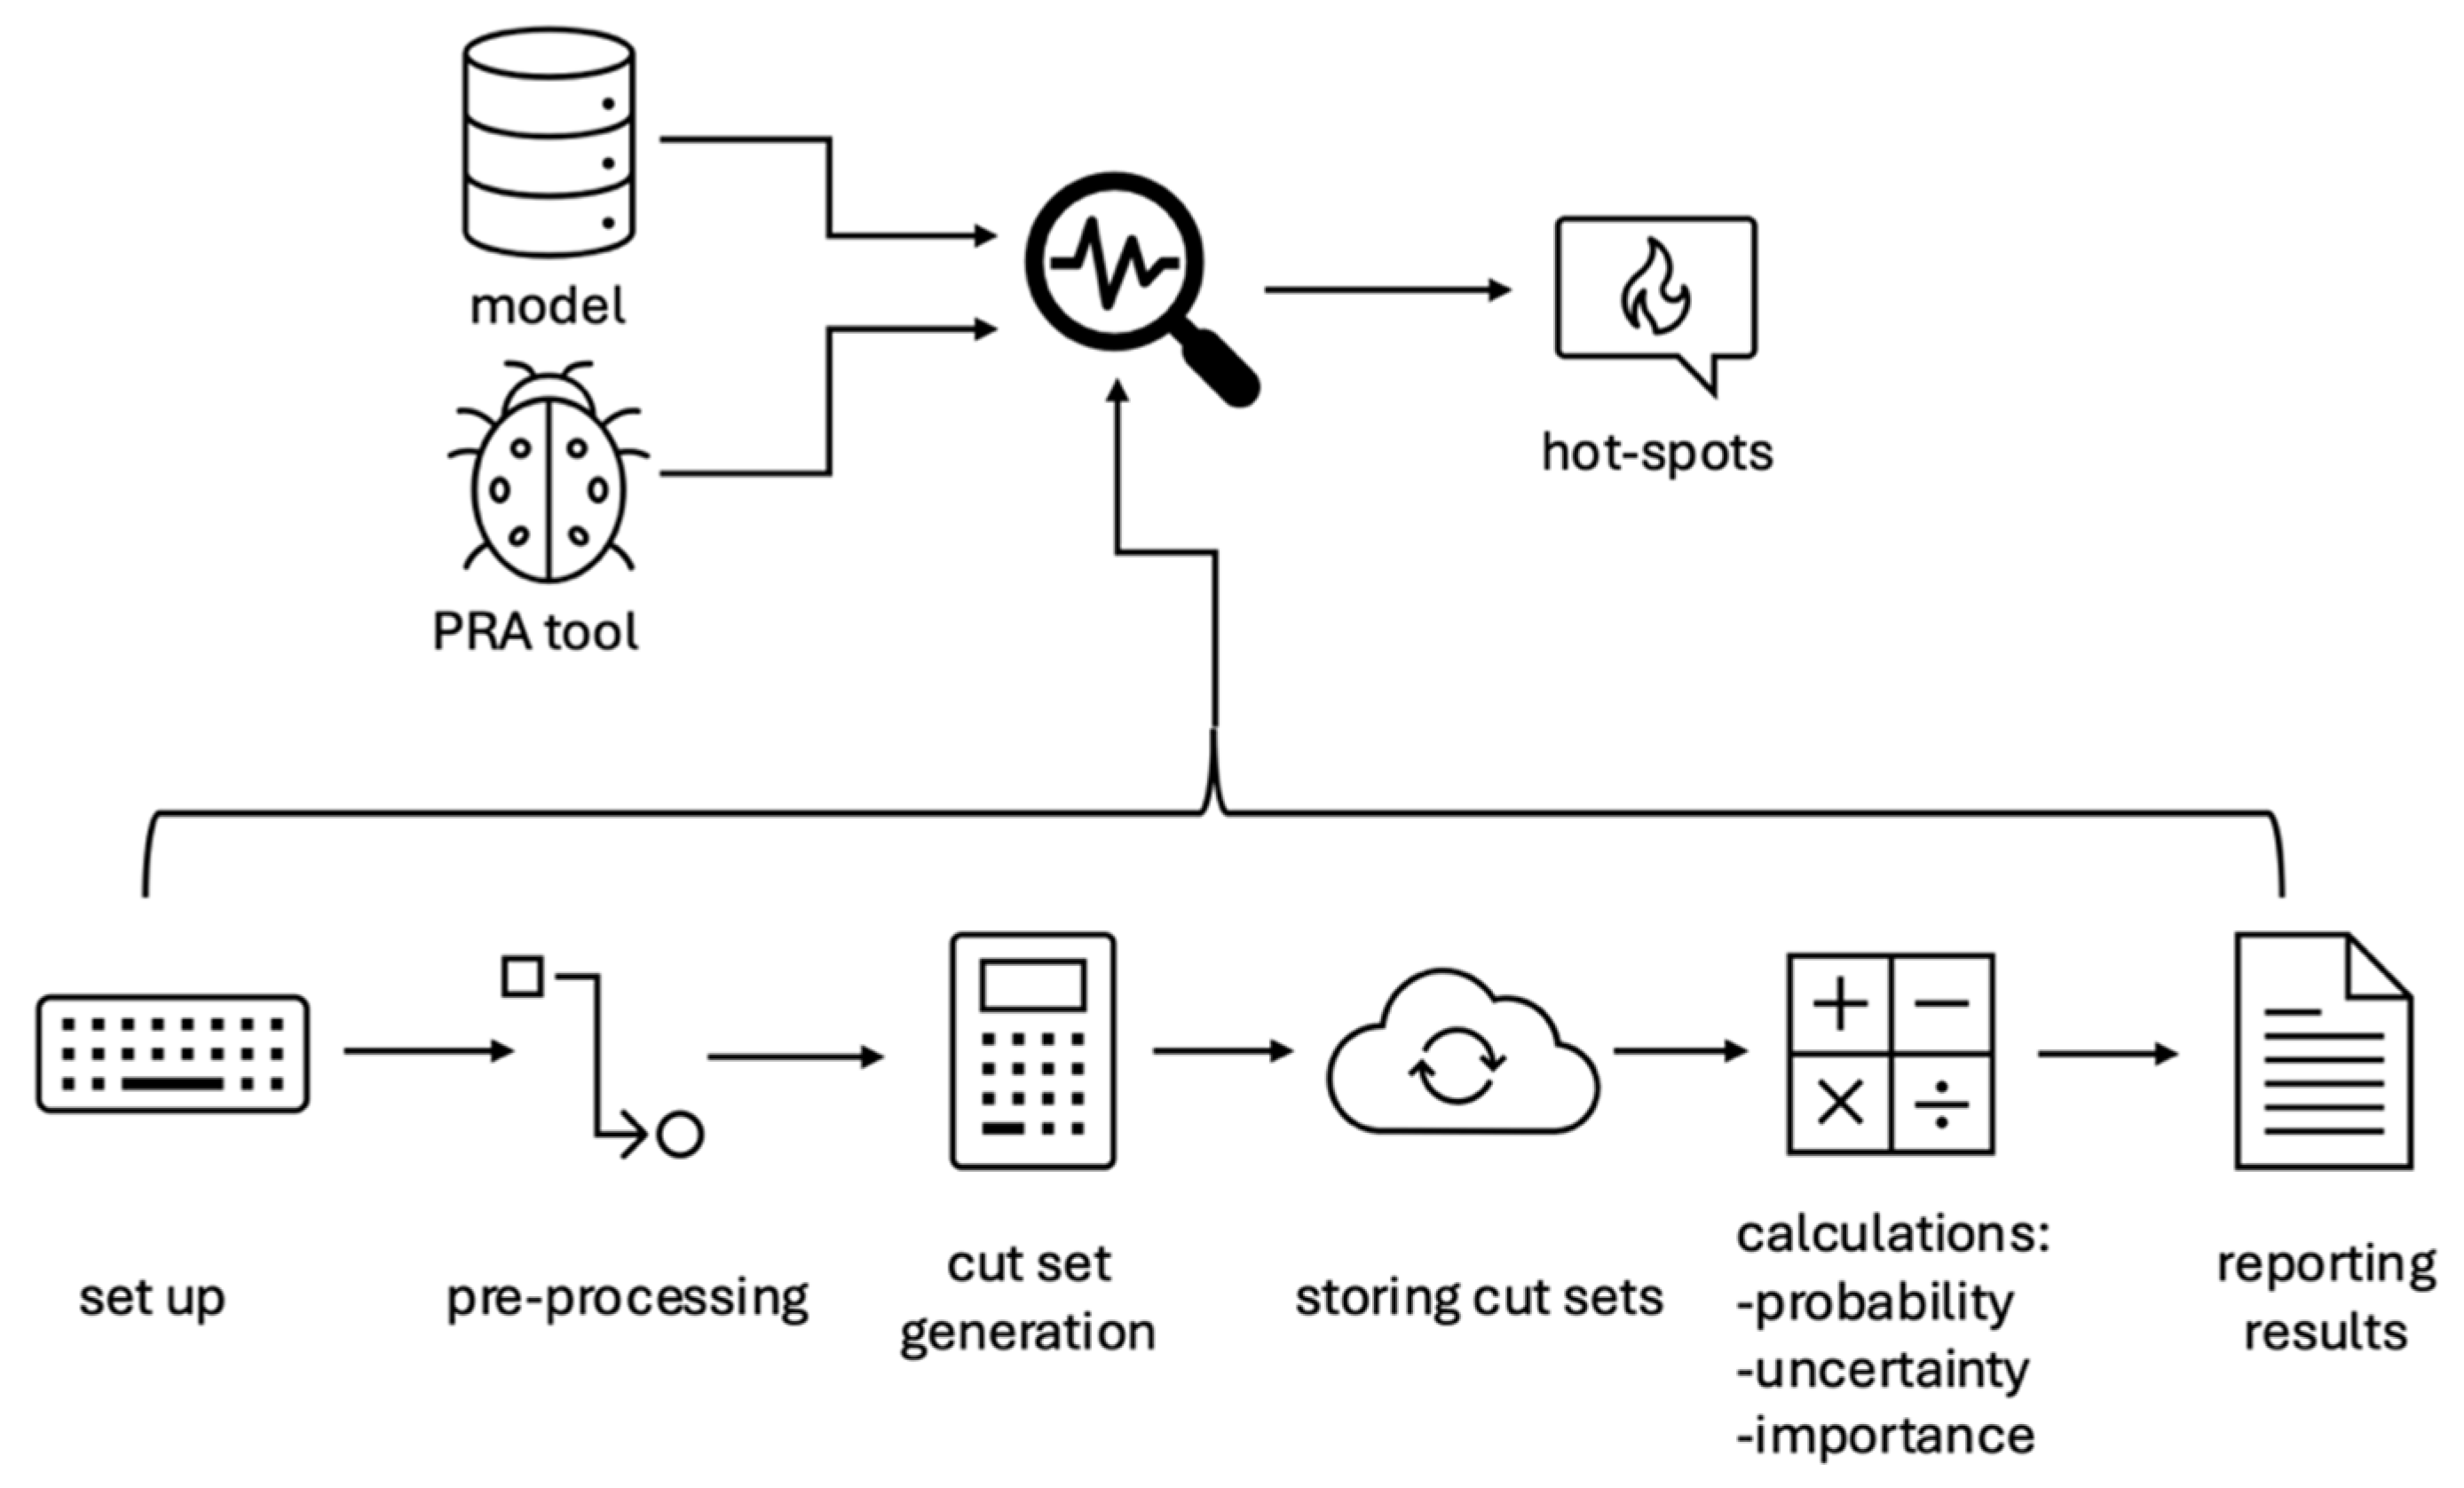
Table 1.
Current ENI for EAF elements for SCRAM-CPP and SAPHSOLVE.
| EAF Element | Current ENI |
| Model generation | 2 |
| Model exchange | 4 |
| Benchmarking | 4 |
| Standard profiling | 4 |
| Deep profiling | 4 |
Disclaimer/Publisher’s Note: The statements, opinions and data contained in all publications are solely those of the individual author(s) and contributor(s) and not of MDPI and/or the editor(s). MDPI and/or the editor(s) disclaim responsibility for any injury to people or property resulting from any ideas, methods, instructions or products referred to in the content. |
© 2025 by the authors. Licensee MDPI, Basel, Switzerland. This article is an open access article distributed under the terms and conditions of the Creative Commons Attribution (CC BY) license (http://creativecommons.org/licenses/by/4.0/).
Copyright: This open access article is published under a Creative Commons CC BY 4.0 license, which permit the free download, distribution, and reuse, provided that the author and preprint are cited in any reuse.


