1. Introduction
The greenhouse effect refers to the increase in temperature that occurs when a microenvironment is enclosed by a transparent material that allows solar radiation to enter (Tiwari, 2001). This effect results from two combined mechanisms, which may act simultaneously and to different degrees.
The first mechanism is the spectral selectivity of transparent enclosures: materials such as glass or polycarbonate are highly transparent to solar radiation but opaque or partially opaque to longwave radiation. Once solar radiation enters the enclosure, it is absorbed by interior opaque surfaces (e.g., walls or ground) and re-emitted as longwave radiation, which is then trapped inside due to the longwave opacity of the transparent material.
The second mechanism is the retention of air caused by the enclosure itself. Even if the structure were fully transparent to longwave radiation, a greenhouse effect would still occur, since the absorbed solar radiation heats the interior surfaces, which in turn warm the confined air [
1]. The temperature rise is maintained simply because air exchange with the exterior is restricted. In high-performance passive solar systems, these two conditions—longwave opacity and airtightness—combine to produce substantial temperature increases. In other cases, such as greenhouses covered with thin films, the longwave opacity is only partial, reducing the effect. Similarly, in semi-outdoor spaces that are transparent to longwave radiation but poorly enclosed against air exchange, the greenhouse effect is strongly diminished.
In conventional greenhouses, the heat generated by the greenhouse effect is intended to condition the interior environment for plant growth. When greenhouses are attached to a building, part of this heat can be transferred to the adjacent interior space, either by conduction through the internal wall, by convective thermosyphoning, or by a combination of both [
2,
3,
4].
A more specialised version of the attached greenhouse is the solar wall [
5,
6]. A solar wall can be considered a greenhouse in which the depth of the space is minimised, so that height and length dominate over width. This configuration increases net winter solar gains compared to attached greenhouses, because solar exposure depends primarily on height and length, while thermal losses are proportional to width. Reducing the width therefore decreases heat losses while only minimally reducing solar gains, improving the thermal efficiency of the system [
7].
Like greenhouses, solar walls can deliver heat to a room interior by conduction, convection, or both [
8,
9]. Early solar walls were massive and relied primarily on conduction. In these systems, the wall mass acts both as thermal storage and as a regulator of heat transfer, depending on its thickness, thermal conductivity, and density. A drawback of massive solar walls, however, is that on cloudy winter days they can become a source of heat loss due to conduction through the mass in the absence of solar gains [
10,
11]. This made the earliest versions of passive solar walls most successful in climates with regular sequences of cold nights and sunny days, such as New Mexico.
To reduce heat losses and accelerate heat transfer to the interior, ventilated solar walls were developed—commonly known as Trombe walls [
12]—where heat is transferred by conduction and convection, with convection interrupted when solar input is insufficient [
13].
In configurations with low thermal mass and opaque insulation in the cavity, conductive heat transfer is also limited. In such cases, heat transfer occurs mainly through convection, either by passive thermosyphoning or by fan-assisted ventilation [
14]. Systems of this type are usually classified in the literature as solar air collectors rather than solar walls.
An advantage of both Trombe walls and insulated wall air collectors is that, in hot seasons, their circulation loop can be cut off from the interior space so that they discharge heat directly outward. In this way, Trombe walls can limit, and insulated wall air collectors can nearly nullify, their solar gains [
15,
16,
17]. Enhancements of this strategy through coupling with solar chimneys have also been studied [
18]. Such approaches can be defined as overheating avoidance rather than passive cooling, because the wall must first become hot before heat can be discharged. Another common strategy to control Trombe wall or air-collector performance is solar control, typically achieved with shading fins [
19,
20], combined with outside-to-outside or inside-to-outside ventilation [
21].
To further improve Trombe wall performance, transparent insulation can be installed beneath the glazing to reduce heat losses [
22,
23]. In addition, selective coatings with high solar absorptance and low thermal emittance can be applied to the wall surface. These measures significantly enhance performance, to the point that cavity ventilation becomes non-essential. As a result, the most common type of solar wall today is non-ventilated and insulated with transparent insulation [
24].
This article assumes that, if a solar wall is installed on the interior side of a room, facing outdoors, it can transfer the heat generated by the greenhouse effect from the room to the exterior, rather than from the exterior to the room. In this way, the room could be maintained at a lower temperature than it would be without the interior solar wall, under the same indoor solar radiation conditions. Such a configuration is meaningful in situations where high daylight levels are required indoors, as is often necessary to support modern living and working activities.
The deeper implication of this strategy lies in expanding the architectural palette of passive cooling solutions in hot-climate countries. In many such regions—often including developing countries—traditional buildings are typically dark inside in order to avoid overheating, leaving daylight levels insufficient for common modern tasks such as reading or precision work. This issue affects not only dwellings but also schools, offices, libraries, and even greenhouses cultivating light-demanding plant species.
The solution presented here can be seen as an indoor analogue of the ventilated façade, in which heat gained in the cavity drives thermal buoyancy and facilitates heat flushing [
25,
26,
27]. The difference is that a ventilated façade is usually ventilated in its outer layer due to heat gained from the outside [
28,
29], while in the present case the ventilated cavity is on the inner side, and the heat is gained passively from solar radiation inside the room.
The feasibility of this strategy has been demonstrated, as a proof of concept, through monitoring and calibrated simulation of small-scale prototypes, as well as simulation of a real-world retrofit scenario.
2. Methodology
This study combines physical experimentation and simulation to test the effectiveness of reverse solar walls in reducing indoor temperatures caused by passive solar gains. The following trials were carried out: (1) small-scale twin prototype testing; (2) calibrated simulation of the small-scale prototype and of real-scale models derived from it; (3) simulation of retrofit scenarios in a real building, exemplifying a possible architecturally integrated use of the system.
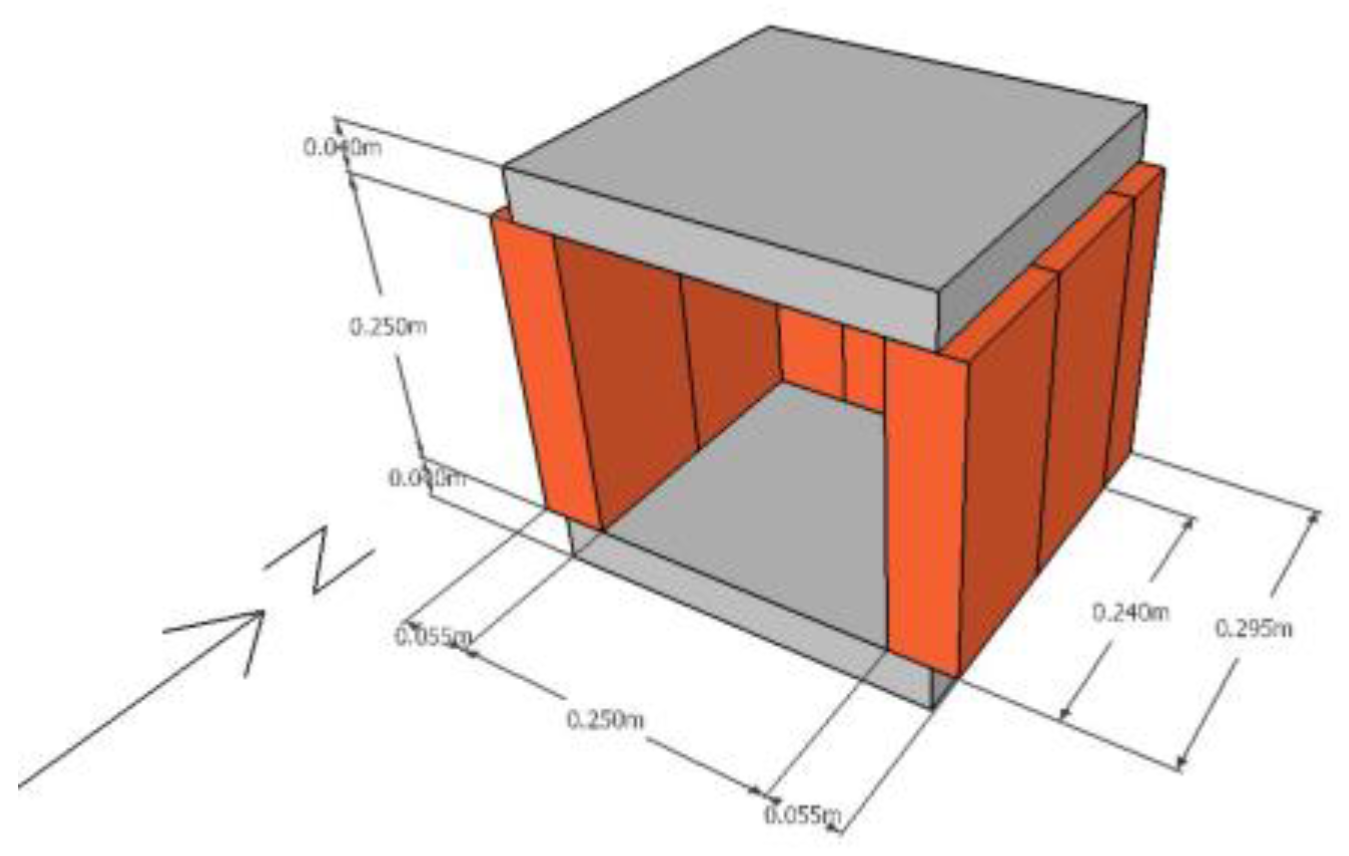
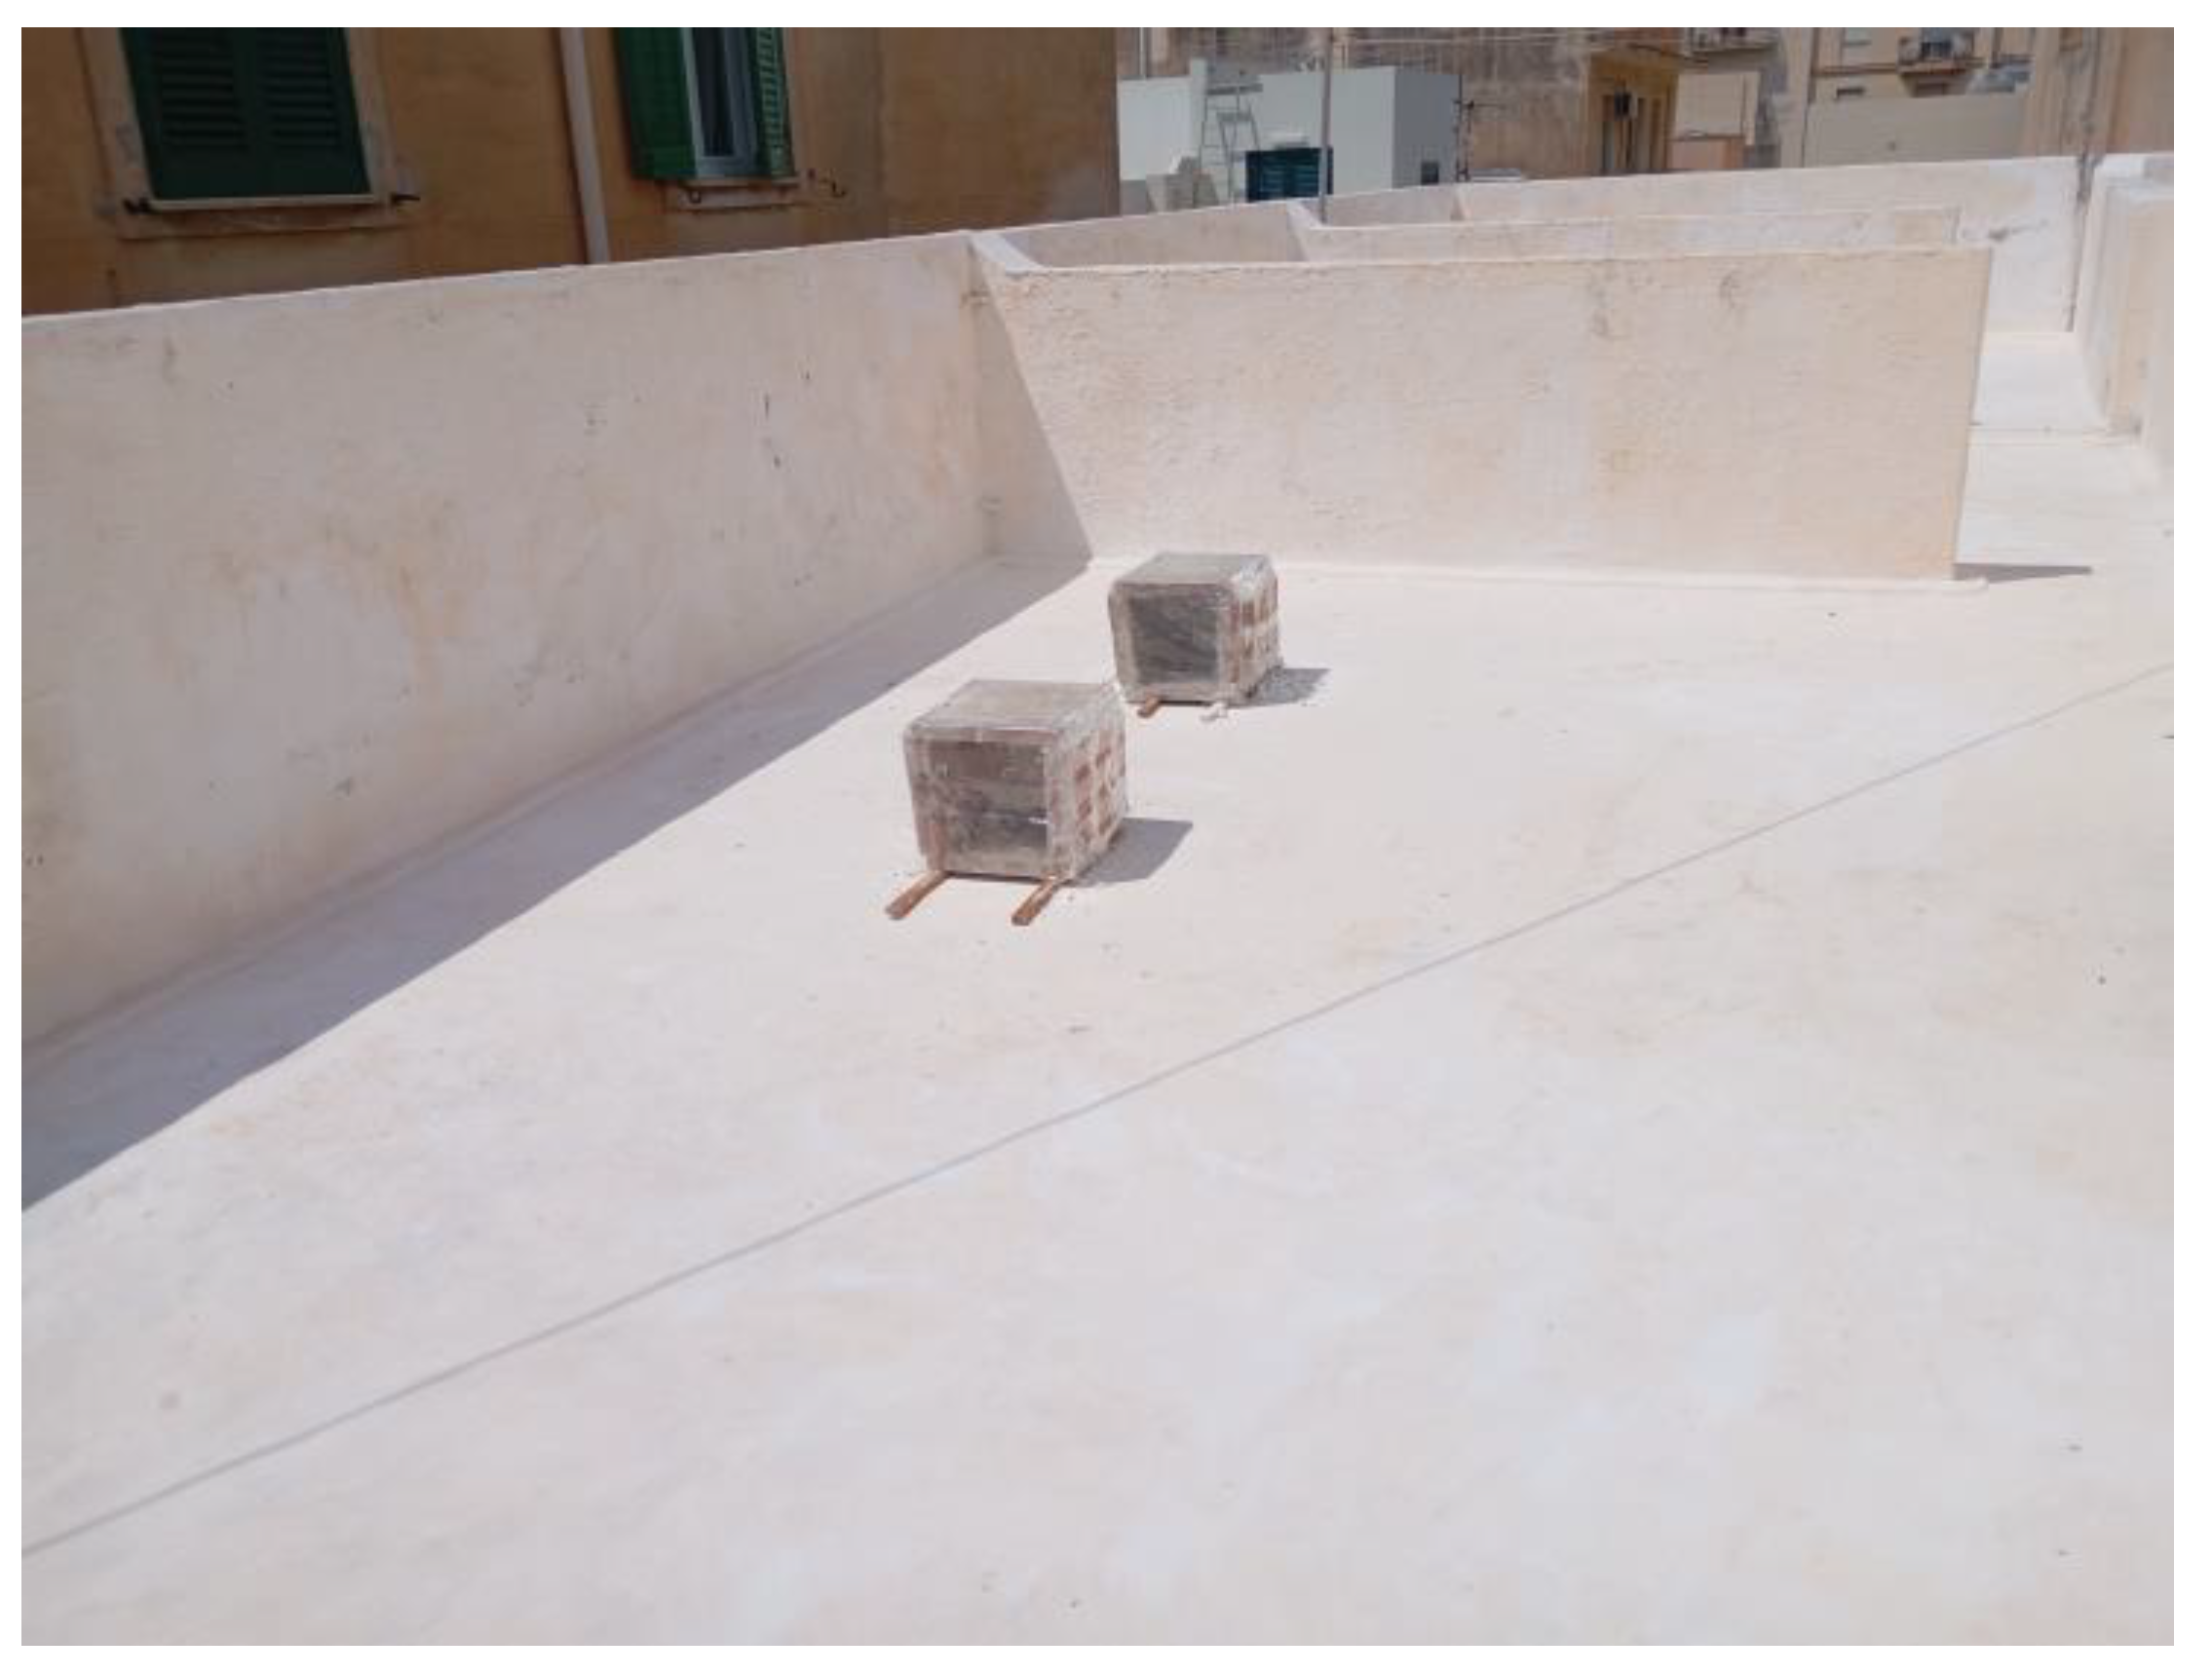
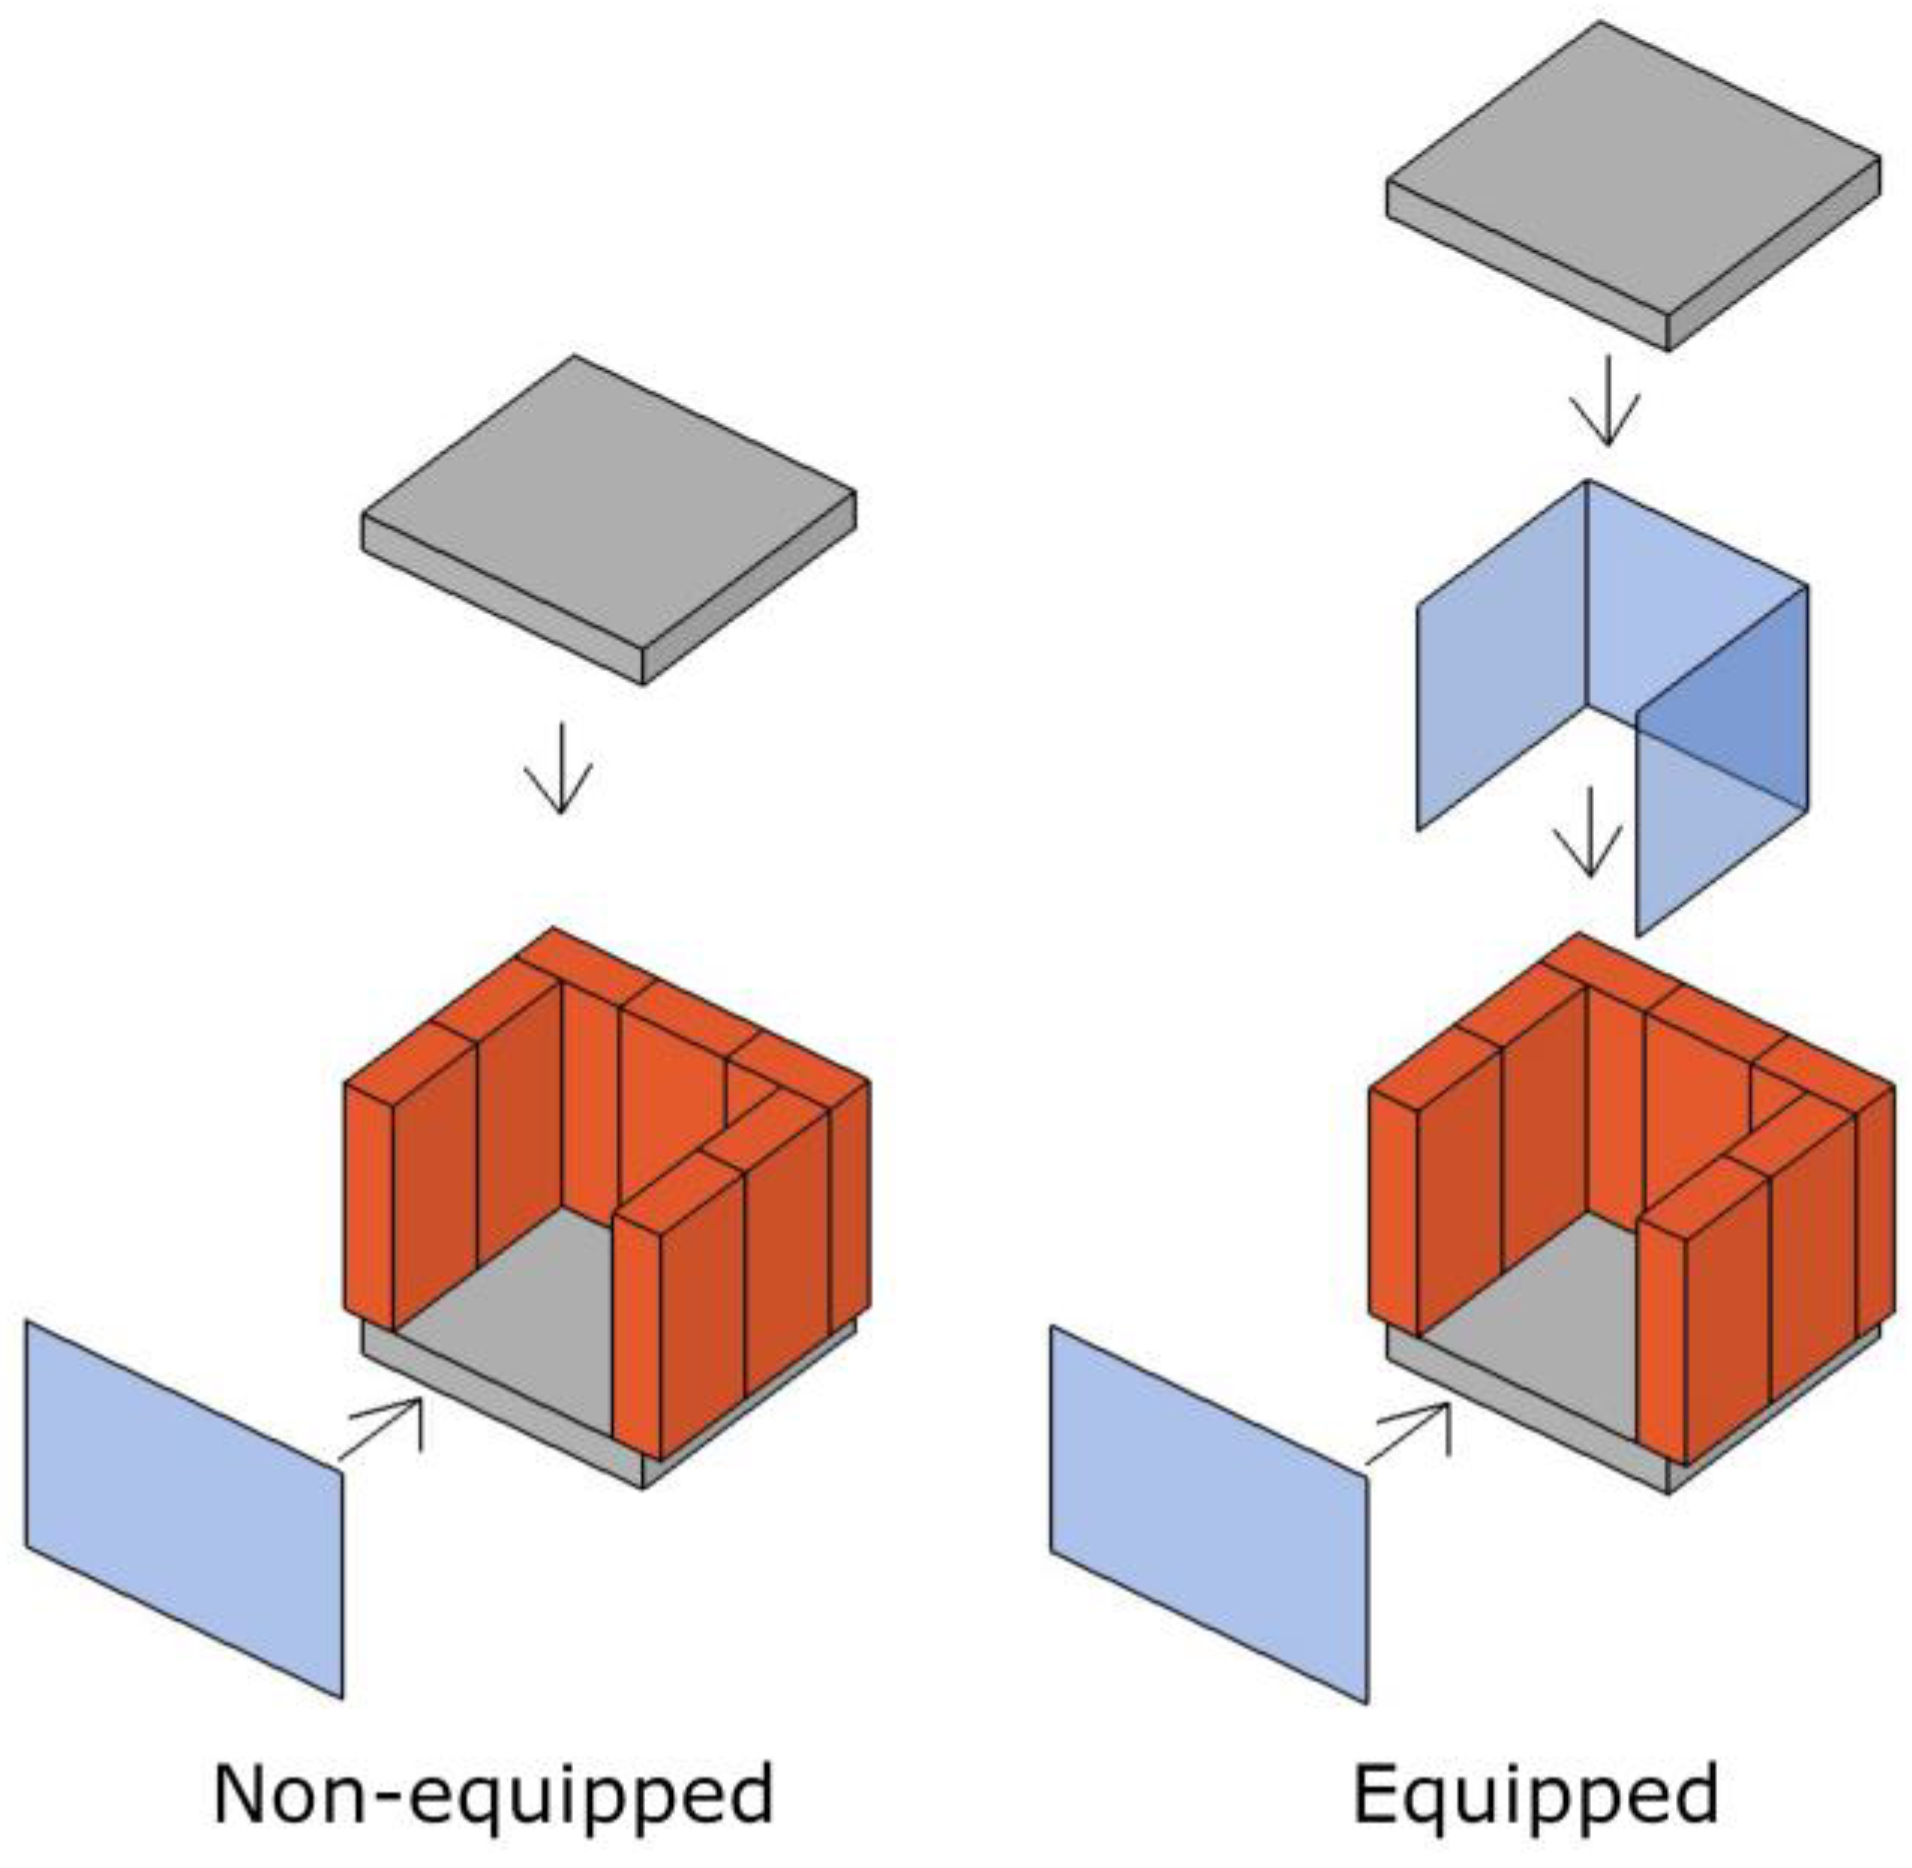
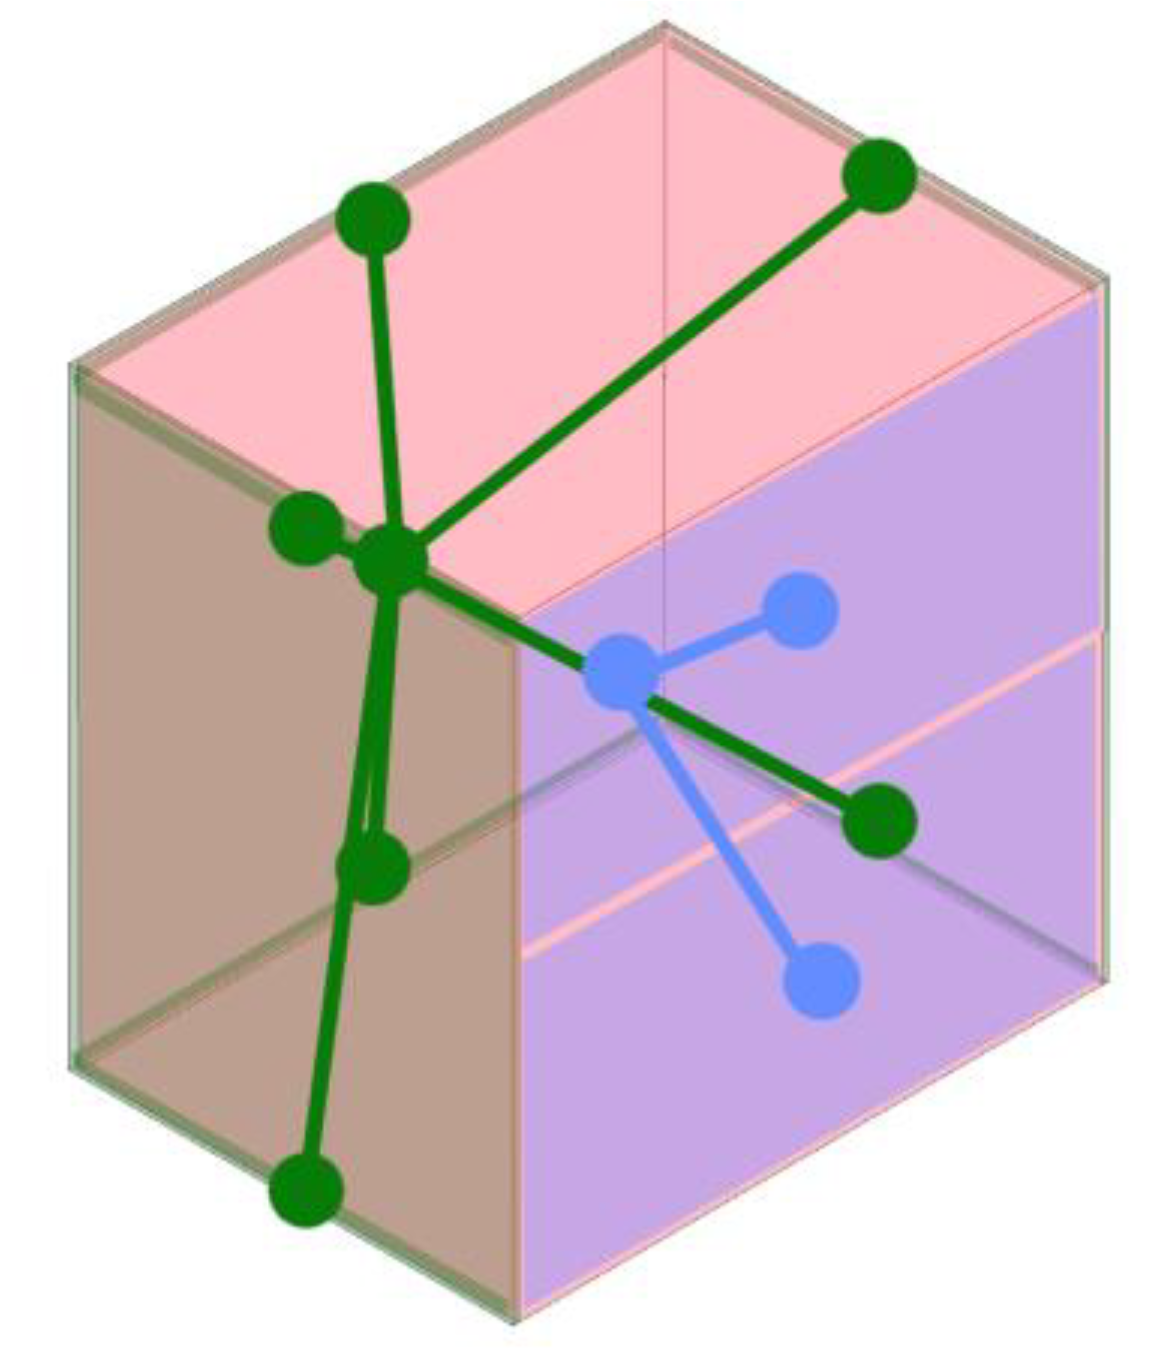
2.1. Prototype Experiments
Two twin small-scale prototypes were constructed and monitored during August 2025 in Trapani, Sicily, Italy (latitude 38.01° N), in order to compare thermal behaviour with and without the proposed reverse solar wall system. Each prototype consisted of a chamber measuring 25 × 18 cm in plan and 25 cm in height. The roof and floor were made of 4 cm thick concrete slabs, while the walls were constructed with vertically placed fired clay bricks (standard size: 25 × 18 × 5.5 cm, net dimensions), using their short side to determine wall thickness (
Figure 1).
The front (solar-facing) side of each chamber was enclosed with a transparent polyethylene mesh with a 4 × 4 mm module, giving a ventilation efficiency of about 75%. In the concrete models used to calibrate the simulations, the front surface was oriented 18° counter-clockwise from due south (i.e. facing south-south-east), so that the walls of the chambers were parallel with the rooftop edges. The rooftop itself was flat, high-albedo (≈ 0.8), and lime-coated. In mid-August it was shaded by surrounding buildings except during solar hours between 10:00 and 14:00 (corresponding to 11:00 and 15:00 daylight saving time) (
Figure 2 and
Figure 3).
One chamber was configured with a passive solar arrangement while the other—the reference—was not (
Figure 4). The inner and rear walls of the test model were clad with three transparent polyethylene film layers, each separated by an air gap of approximately 1 mm. The estimated far-infrared opacity of each film was around 60% (Tong et al., 2022), so the combined longwave opacity of the three layers was close to 100%, i.e. nearly opaque. The films were sealed at the edges with transparent tape to prevent air infiltration between them and between the cavity and the chamber. The concrete slabs were left bare, and the floors were lime-washed to reach a reflectance of about 0.8.
In the solar-ventilated-wall version, the cavity created by the transparent enclosure was opened to the outside through the bricks, with openings amounting to about 10 cm², distributed at the top and bottom of the brick enclosure.
Thermal simulations were conducted in parallel with the monitoring, using the ESP-r energy simulation software (Clarke, 2001). The material properties were set as follows: brick conductivity = 0.7 W/m·K; concrete = 1.7 W/m·K; transparent insulation cavities = 0.1 m²·K/W each, considering their narrowness. Ground (roof floor) reflections were modelled as diffuse, and indoor surface reflections were likewise treated as diffuse.
The prototype without the reverse solar wall (“bare” model) was represented as a single thermal zone, while the version with the reverse solar wall (“equipped” model) was modelled as two thermal zones: one for the main chamber and one for the solar gain cavity. Solar obstructions were included in both models used for calibration (
Figure 5).
For each simulation model, a ventilation network was created. The main zone had two boundary nodes on the façade, one in the top half and the other in the bottom half. The ventilated cavity had six boundary nodes modelled as openings: one at the bottom and one at the top of each wall, each 1 × 10 cm in size (
Figure 6). The two indoor zones did not communicate with each other (no infiltration was allowed), and the “bare” model did not include the cavity nodes.
The simulation models of the two prototypes were validated by comparing air temperatures with those measured on 17–18 August, including the effects of urban obstructions. The agreement was considered acceptable (
Figure 7), with a mean absolute error of about 1.5 °C and a root mean squared error of about 0.5 °C (
Figure 8).
After confirming acceptable agreement between simulations and physical prototypes, further simulations were run on more generalised models, with solar obstructions and the 18° rotation removed. Weather data from Palermo (IWEC 2001) were used, as these are more complete than the data available for Trapani.
And after this step, to investigate scalability, the models were geometrically upscaled by a factor of 12 (excluding cavity widths, which were unchanged; wall thicknesses were increased fivefold to represent typical building walls). The resulting chambers measured 3 × 3 m in plan, with walls thickened to 27.5 cm and slabs to 20 cm. These real-scale models were simulated using the same criteria as the small-scale versions.
For these real-scale models, a parametric inquiry was then performed, considering: (a) a bare model without the solar gain cavity; (b) a model equipped with the reverse Trombe system, with wall openings amounting to about 1% of the cavity’s area; (c) the same as (b), but with cavity openings increased fourfold; (d) versions of both bare and equipped models with thinner 5.5 cm walls instead of 27.5 cm; (e) versions with an enclosure of grey-painted aluminium sheet (1 mm thick) instead of brick; (f) versions of (a), (b), and (d) enclosed with low-E double glazing rather than the permeable mesh (implemented by modelling front nodes as 0.3 mm × 12 m cracks), and coupled with a zone controller featuring an all-convective ideal cooling plant (capacity 3000 kWh, setpoint 24 °C), to assess cooling loads.
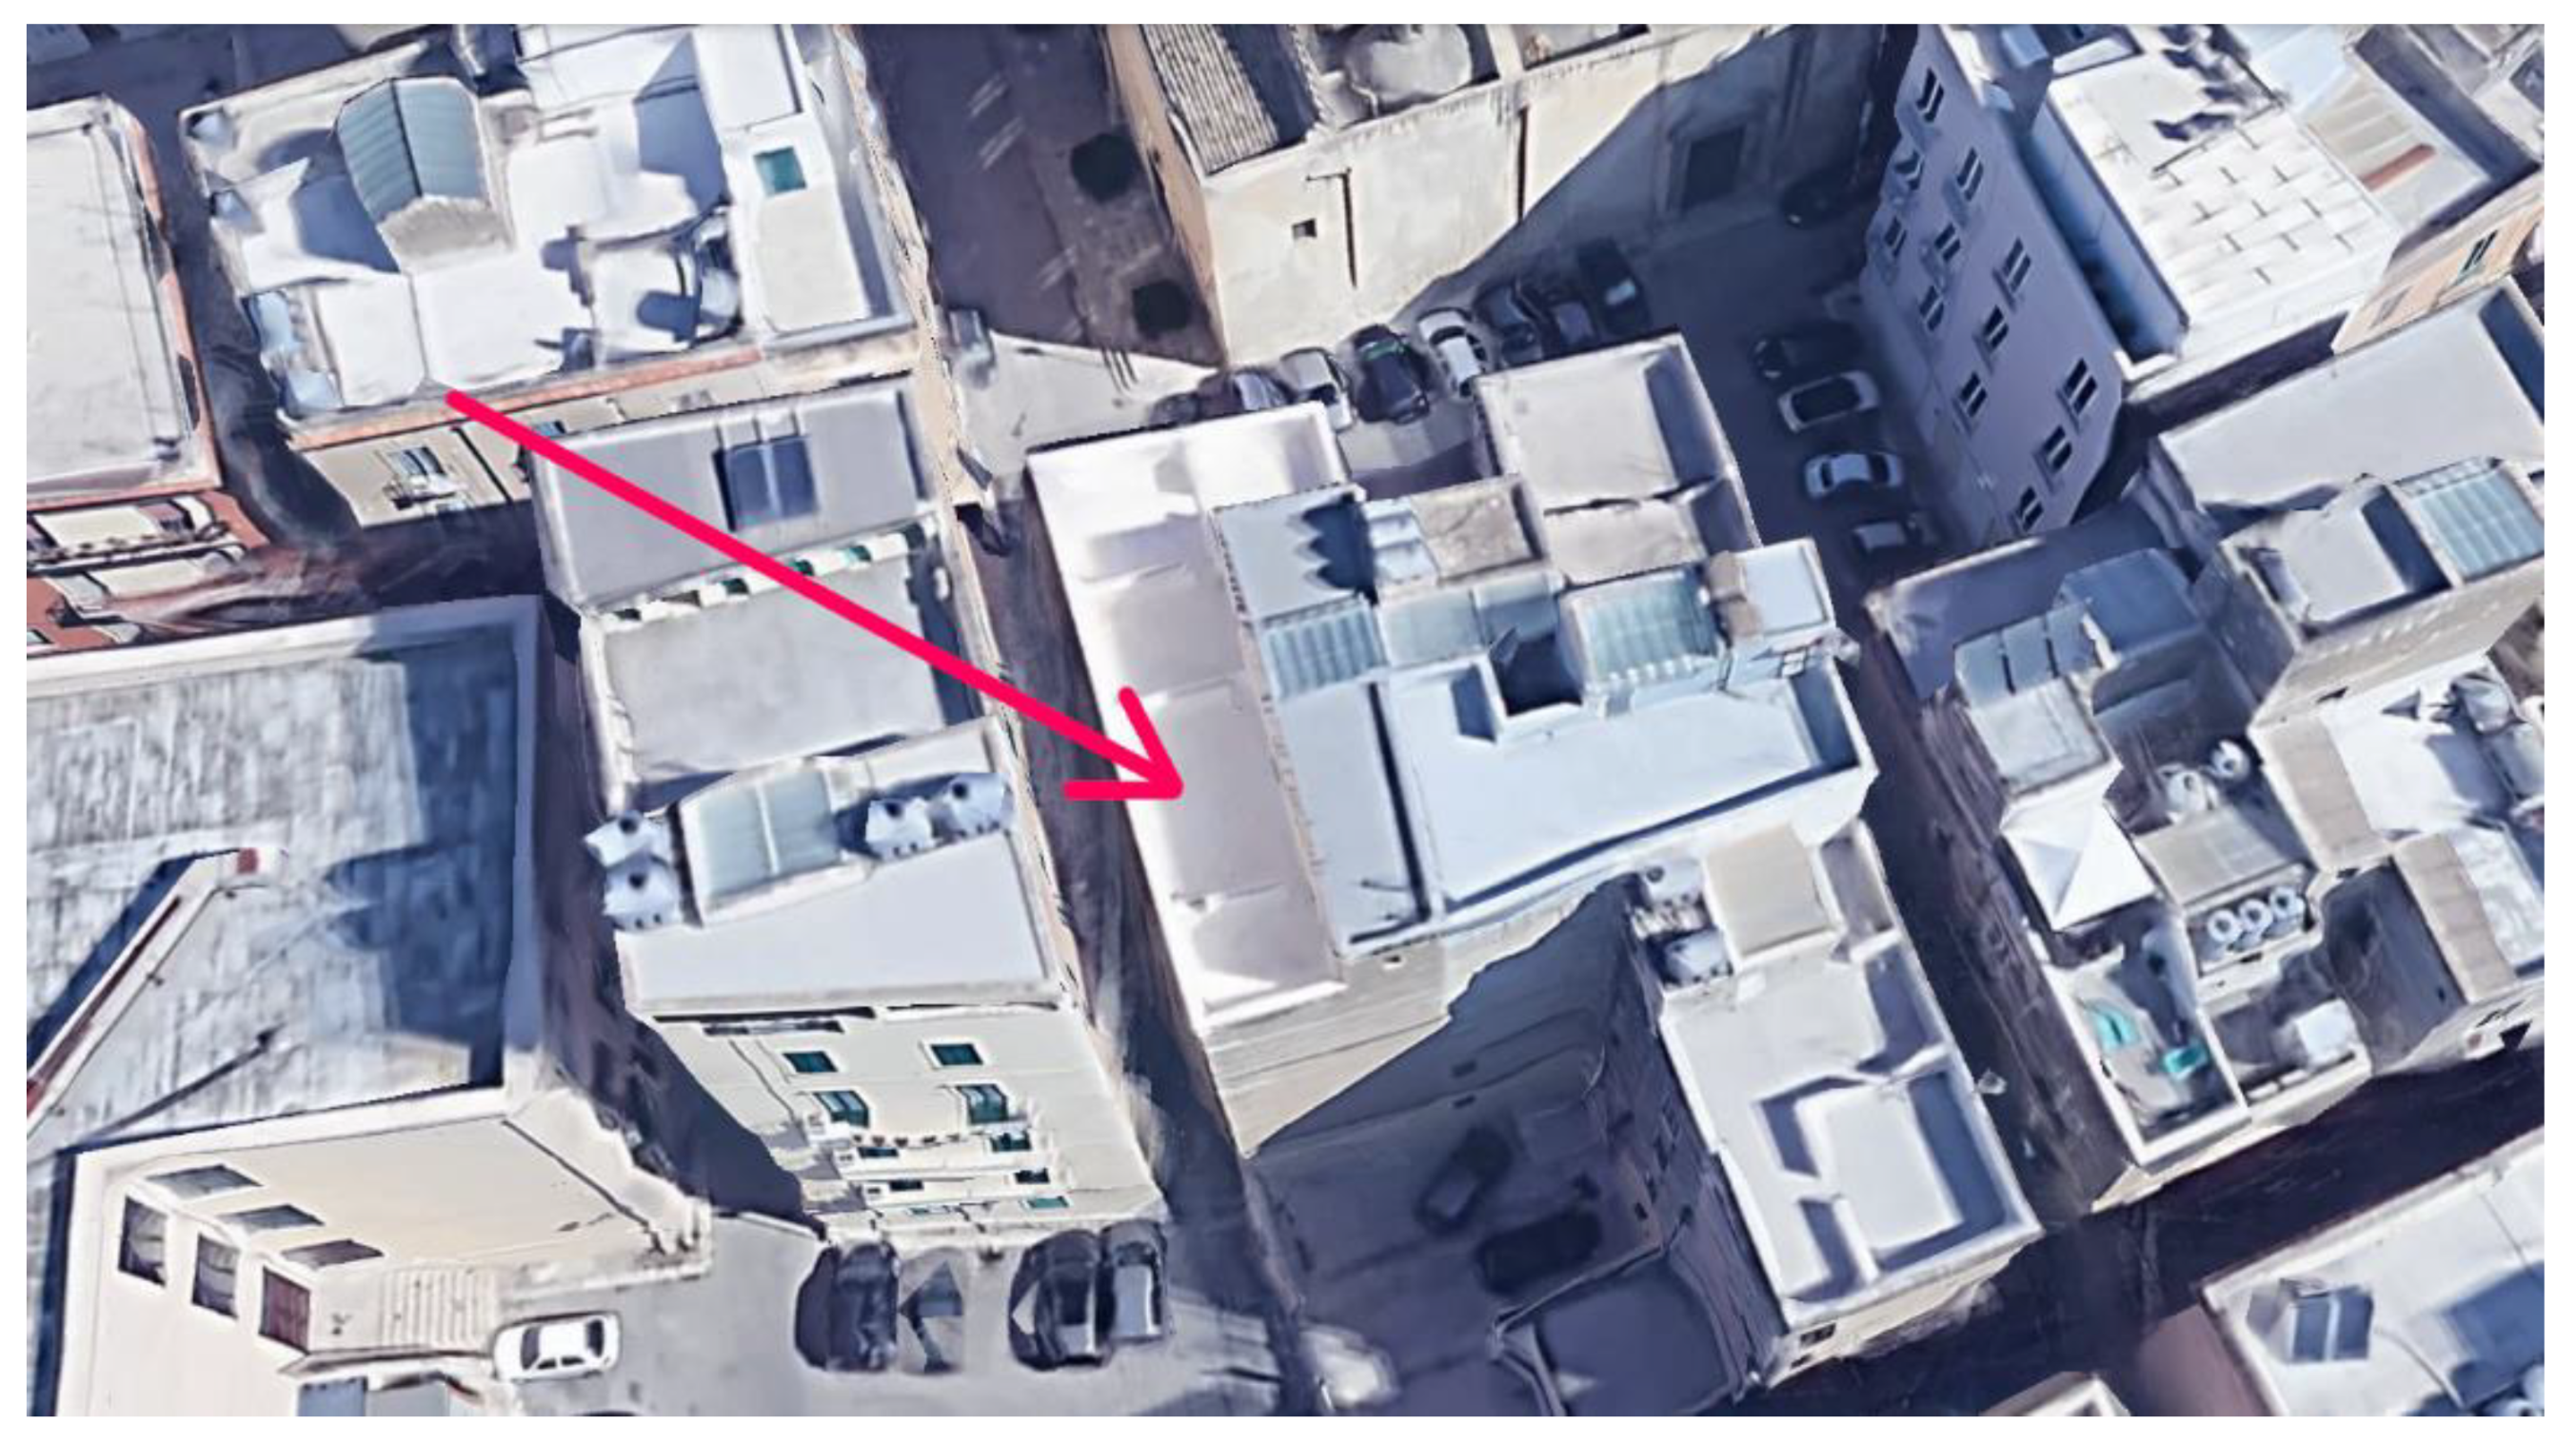
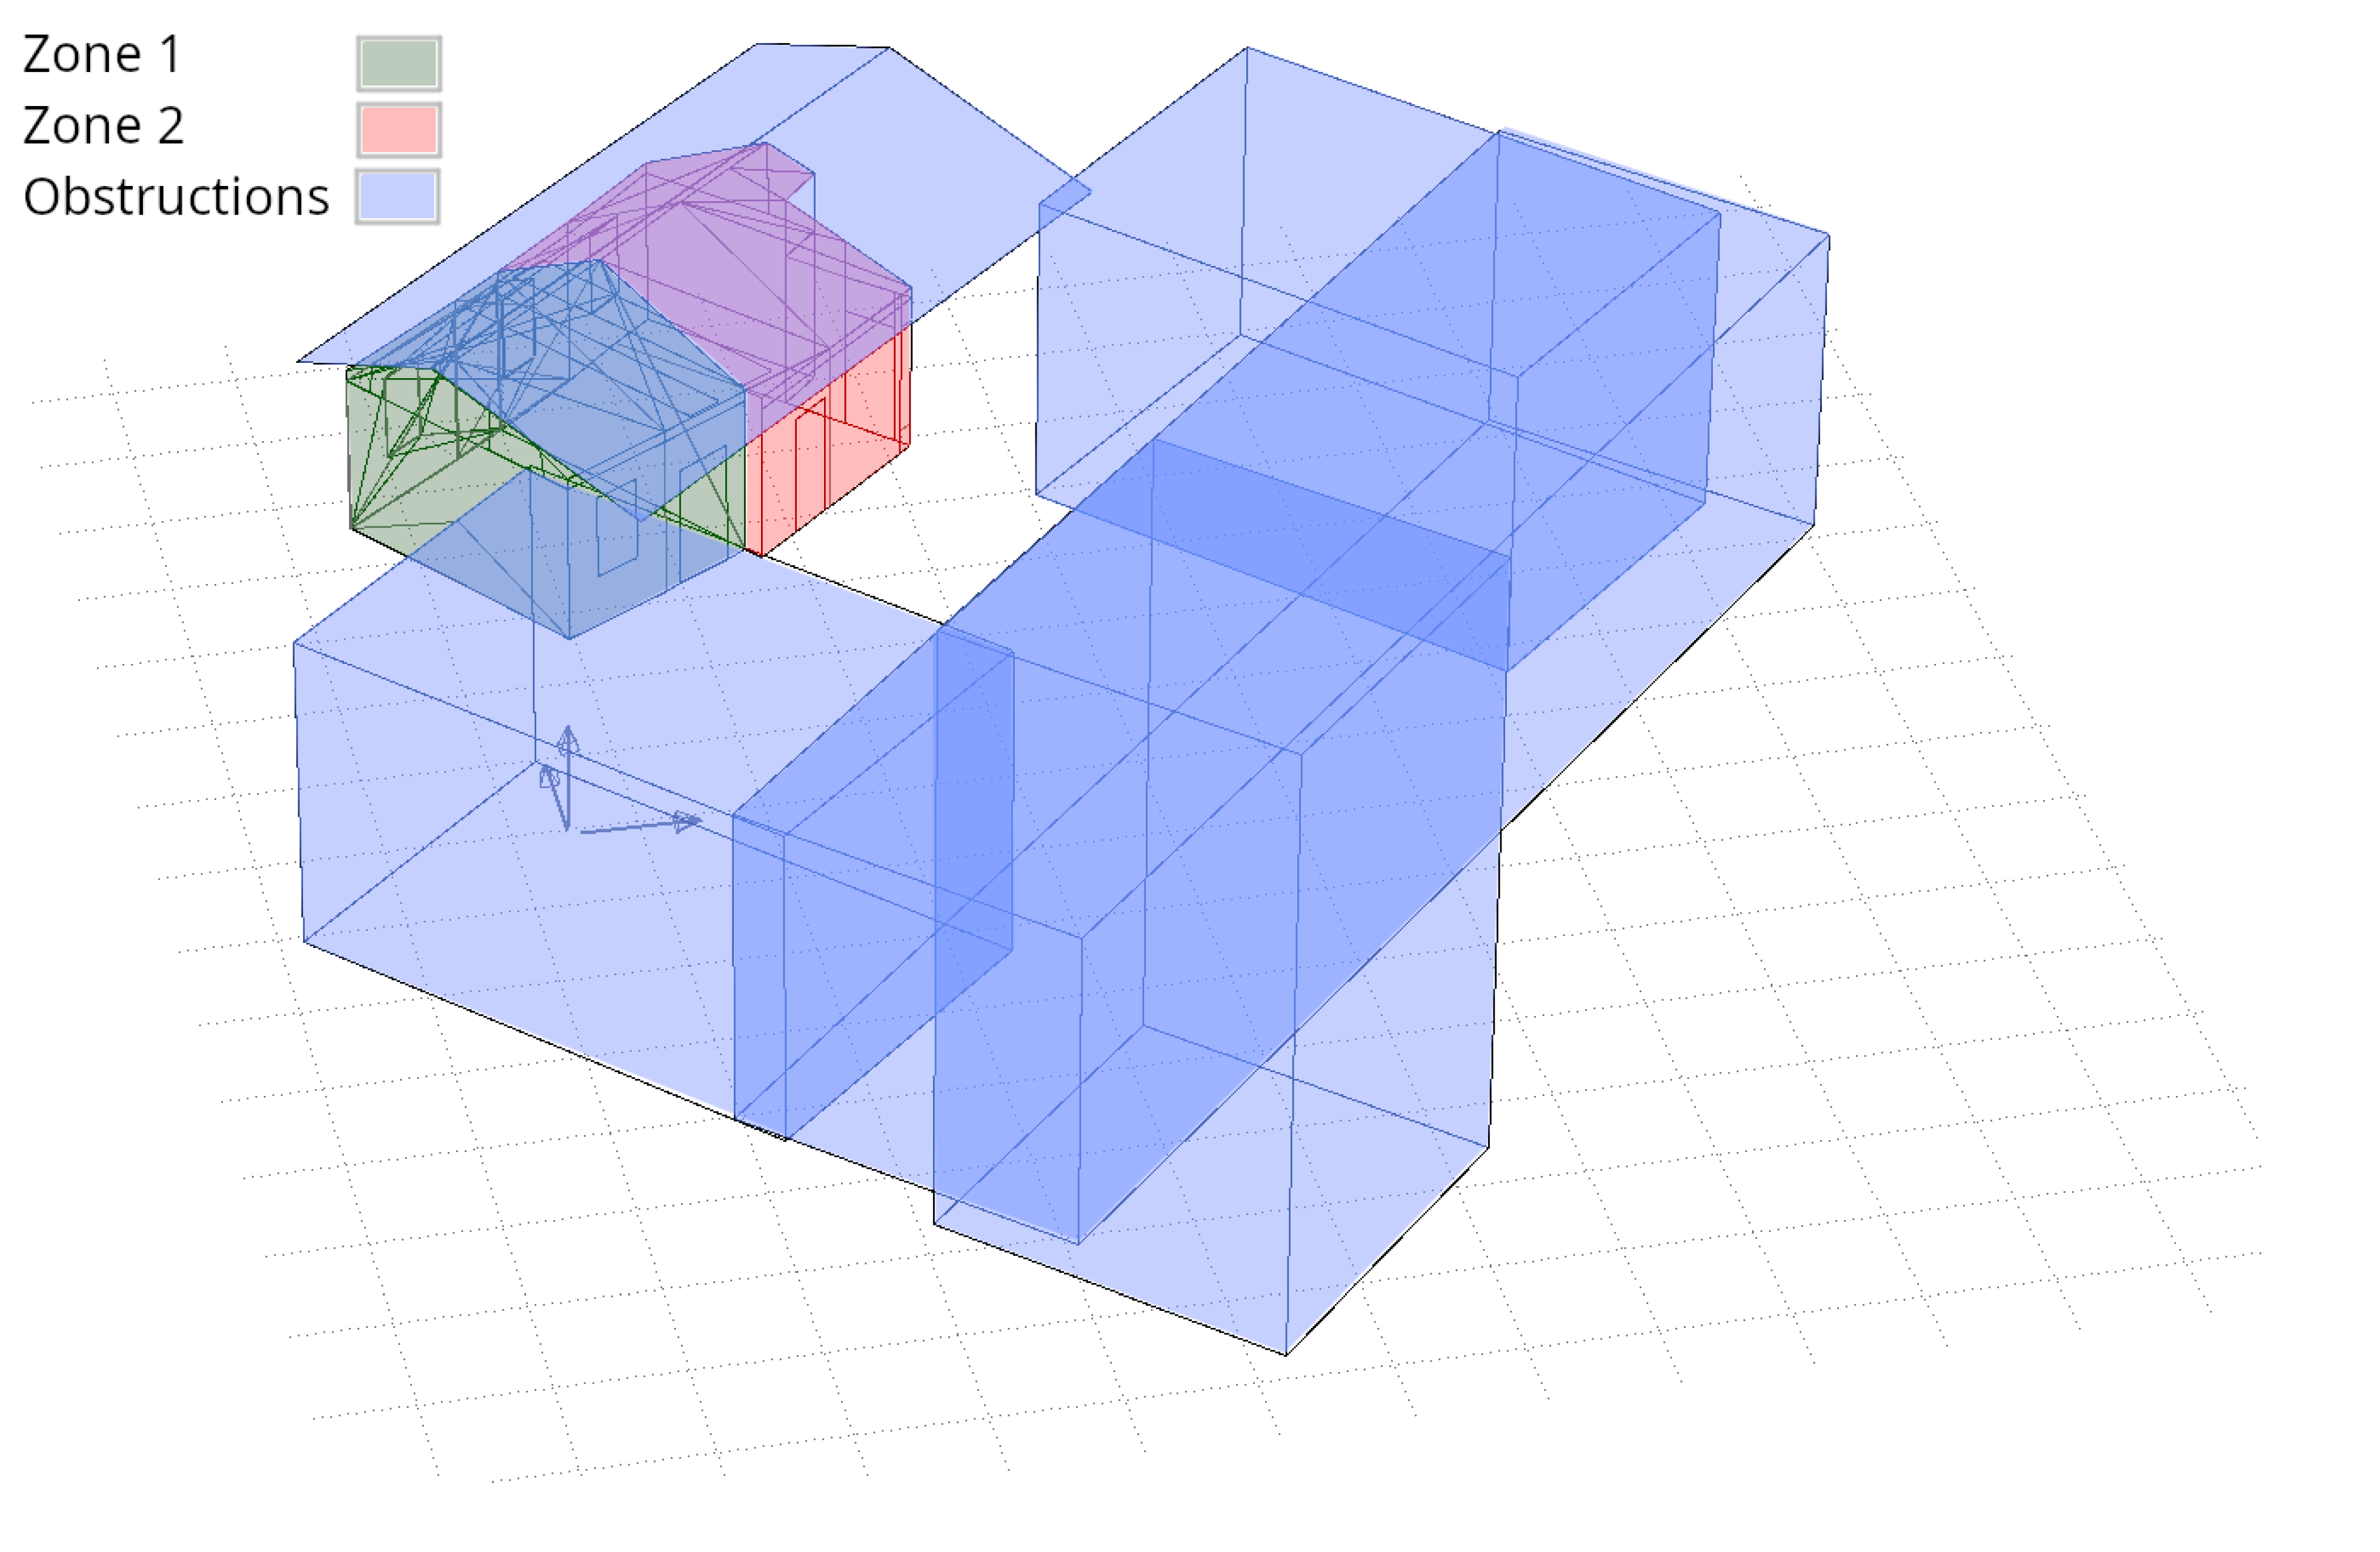
2.2. Case Study Simulations
A real-world retrofit case was also modelled to assess the usefulness of the proposed system. The case involved an autonomous room in a building in Malnate, near Varese, Lombardy, Italy (latitude 45.79° N). This building has hosted, over the past five years, several retrofit-oriented graduate design–build workshops by the author (Brunetti, 2023), and has been the subject of retrofit proposals by the owning environmentalist association (Legambiente Varese).
The room is located above ground level, on top of an open-air space, with very limited adjacencies. It faces a courtyard that partially obstructs solar radiation, especially in winter, and it has a balcony towards the courtyard. The complex is rotated about 40° counter-clockwise from due south, meaning the main walls of the target room face south-east and north-west (
Figure 9).
The room’s enclosures comprise load-bearing mixed masonry (stone and brick) on three sides, and a thinner, non-load-bearing single-brick wall on the south-east side. The uninsulated roof consists of timber decking on rafters, covered with tiles. Existing overhangs and relatively narrow windows produce low daylight levels, conflicting with the intended use of the space as a multi-purpose room for meetings and leisure, particularly in summer.
The highly irregular building geometry was modelled with high fidelity based on a physical survey. The model was divided into two thermal zones (north-west and south-east halves of the room), separated by a fictitious air partition (
Figure 10). A constant ventilation rate of 10 air changes per hour was imposed in the room. In the version featuring a reverse Trombe wall, a mass-flow network was added for the solar wall cavity, based on criteria similar to those used for the prototypes. This included openings at the top and bottom of the wall with a total area equal to 1/100 of the wall surface. Windows were assumed to be open to 30% from May to October. The surrounding courtyard buildings were modelled as solar obstructions.
The aim was to verify whether a reverse solar wall strategy could allow higher daylight levels without overheating in this context. Three overlapping daylight-enhancement strategies were applied to the model, modifying the as-is condition: (a) increasing floor reflectivity from ~0.5 (bare wood) to ~0.8 (white finish); (b) replacing the south-east masonry wall with a translucent multiwall polycarbonate panel (U-value: 1.18 W/m²·K; solar transmittance: 0.70); (c) installing translucent skylights of the same material on 50% of the south-east-facing roof slopes (
Figure 11,
Figure 12 and
Figure 13).
Figure 11.
View from the east (Google Earth), showing the balcony, the proposed transparent insulation wall (replacing the thin masonry layer on the south-east side), and the skylight to be created on the roof.
Figure 11.
View from the east (Google Earth), showing the balcony, the proposed transparent insulation wall (replacing the thin masonry layer on the south-east side), and the skylight to be created on the roof.
Figure 12.
Plan of the upper floor showing the position of the room (yellow) and the reverse solar wall (red).
Figure 12.
Plan of the upper floor showing the position of the room (yellow) and the reverse solar wall (red).
Figure 13.
Transversal section of the room, showing the retrofit operations included in the models.
Figure 13.
Transversal section of the room, showing the retrofit operations included in the models.
Figure 14.
Retrofit operations and modelling decisions highlighted in the ESP-r model.
Figure 14.
Retrofit operations and modelling decisions highlighted in the ESP-r model.
This retrofit scenario was combined with three alternative wall configurations on the north-west side: 1. uninsulated masonry; 2. masonry clad internally with 12 cm hempcrete insulation on a 1 cm cavity (the combined wall was modelled as a separate thermal zone); 3. interior multiwall polycarbonate cladding (U-value: 1.959 W/m²·K) on a 1 cm cavity, also modelled as a separate thermal zone.No airflow was modelled in the cavity for case (3), since architectural preservation regulations for historic buildings prevented the creation of perforations in the north-west façade.
The models and datasets from both parts of this study have been made freely available online [
30].
Figure 15.
Architectural proposal for retrofitting the back wall with an inner curtain wall enclosing transparent insulation (grey). Authors: Baixue Fan and Ju Yan. Draft for a graduate thesis, Politecnico di Milano, 2025.
Figure 15.
Architectural proposal for retrofitting the back wall with an inner curtain wall enclosing transparent insulation (grey). Authors: Baixue Fan and Ju Yan. Draft for a graduate thesis, Politecnico di Milano, 2025.
3. Results
In the following subsections, the results pertaining to the prototypes and those pertaining to the real-word models will be presented separately.
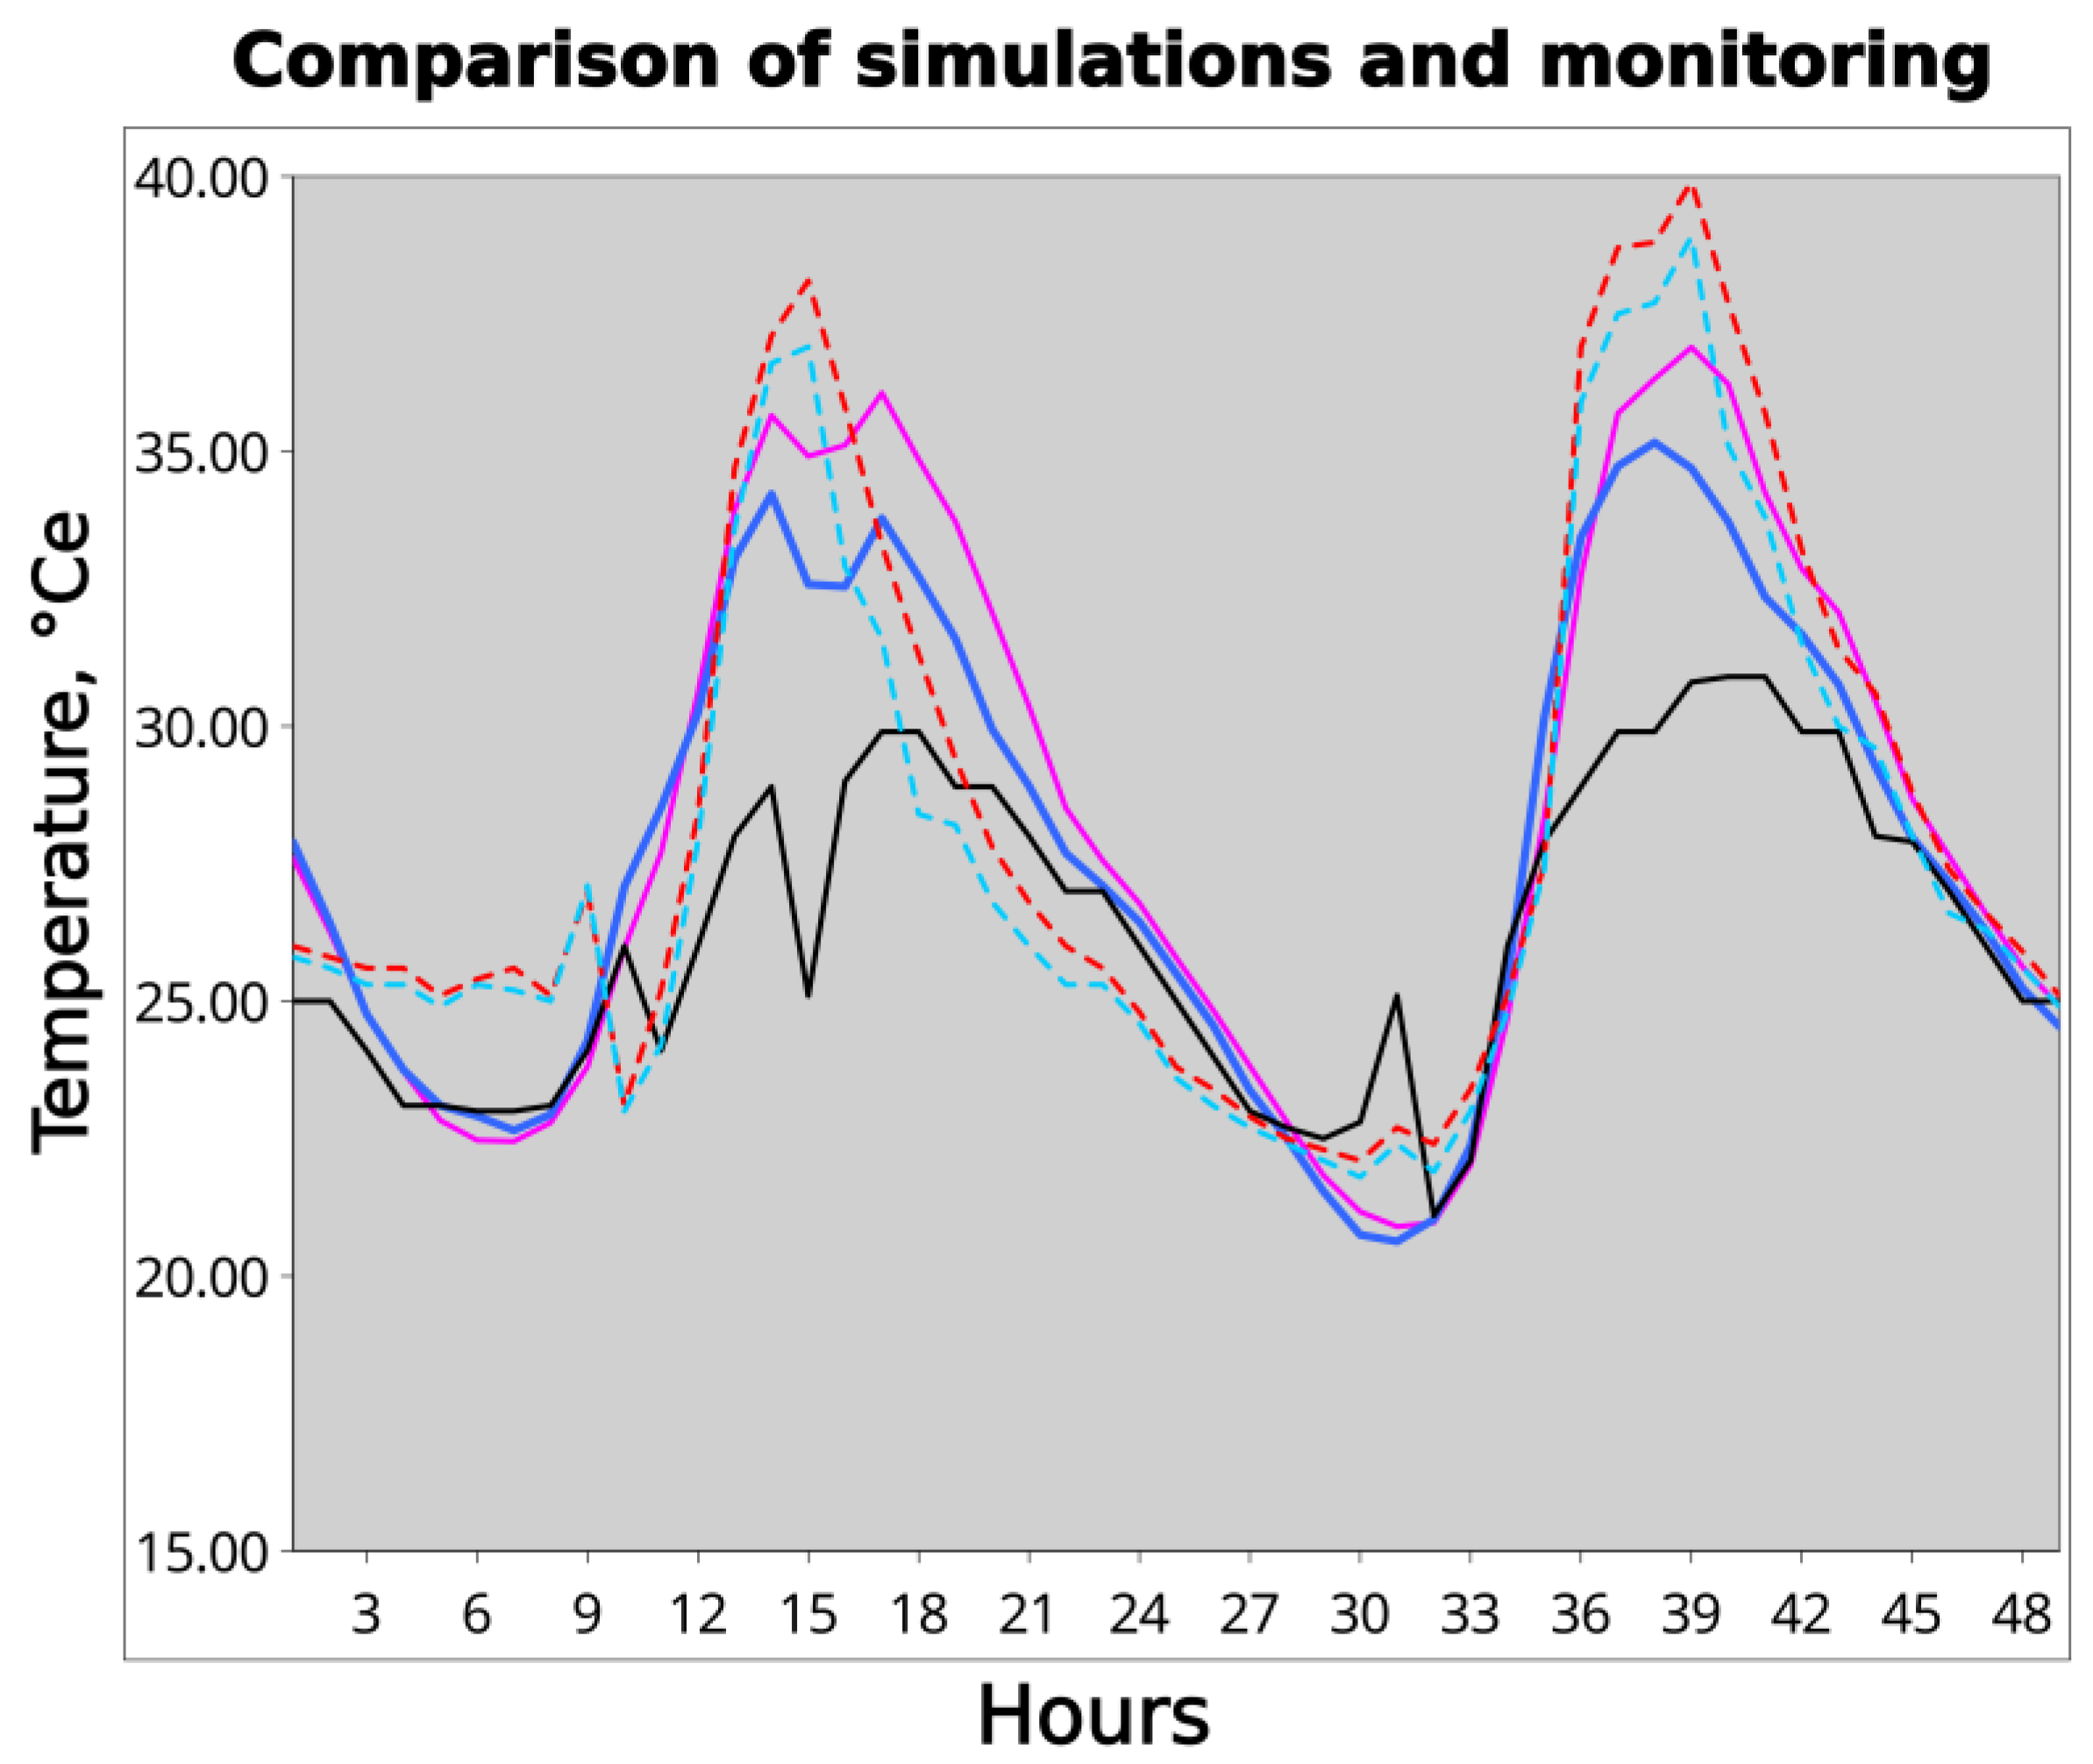
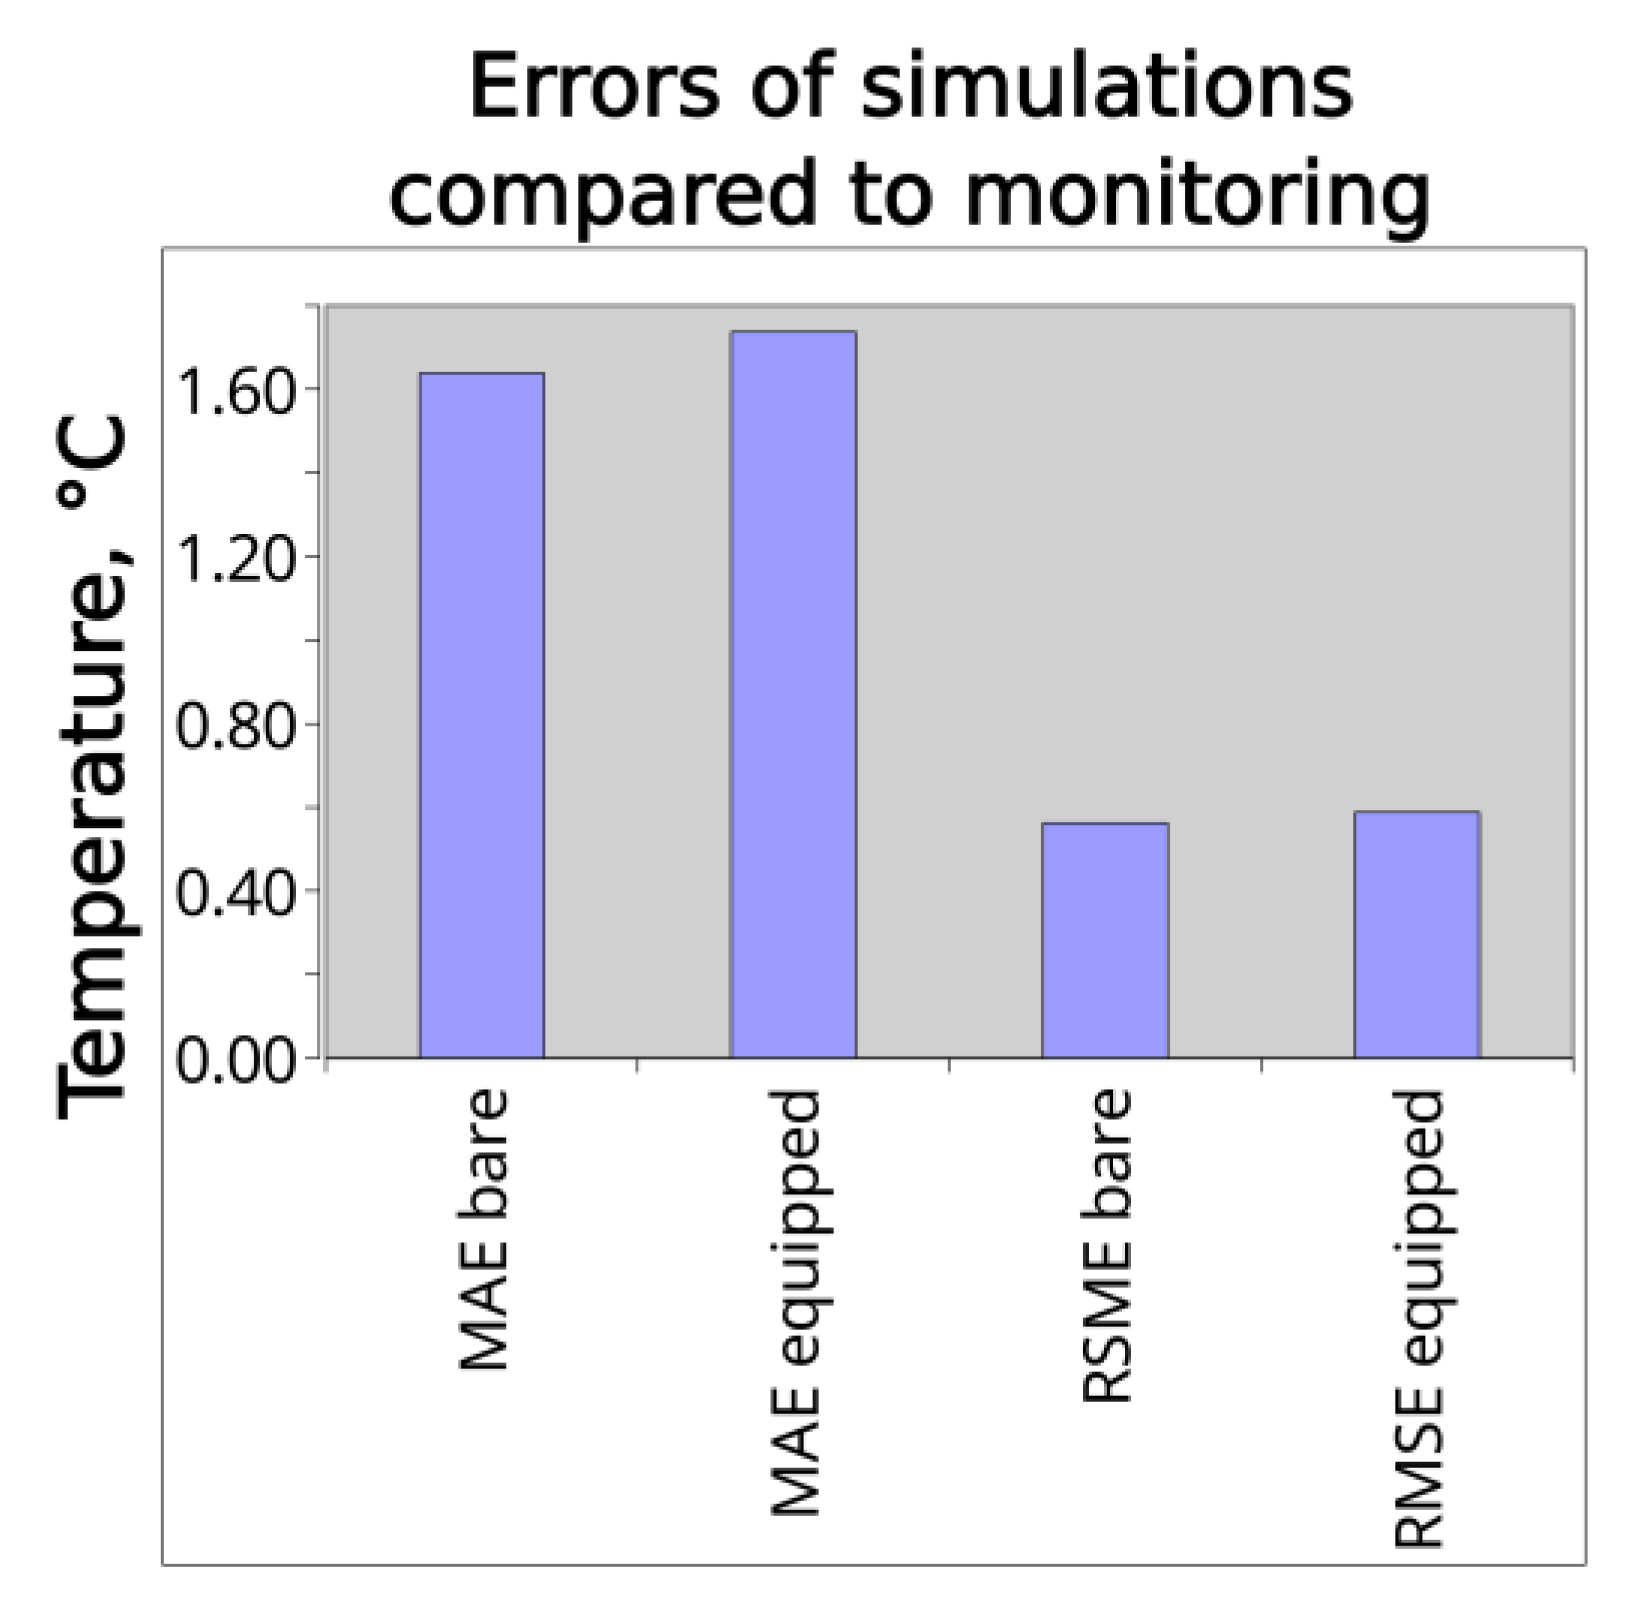
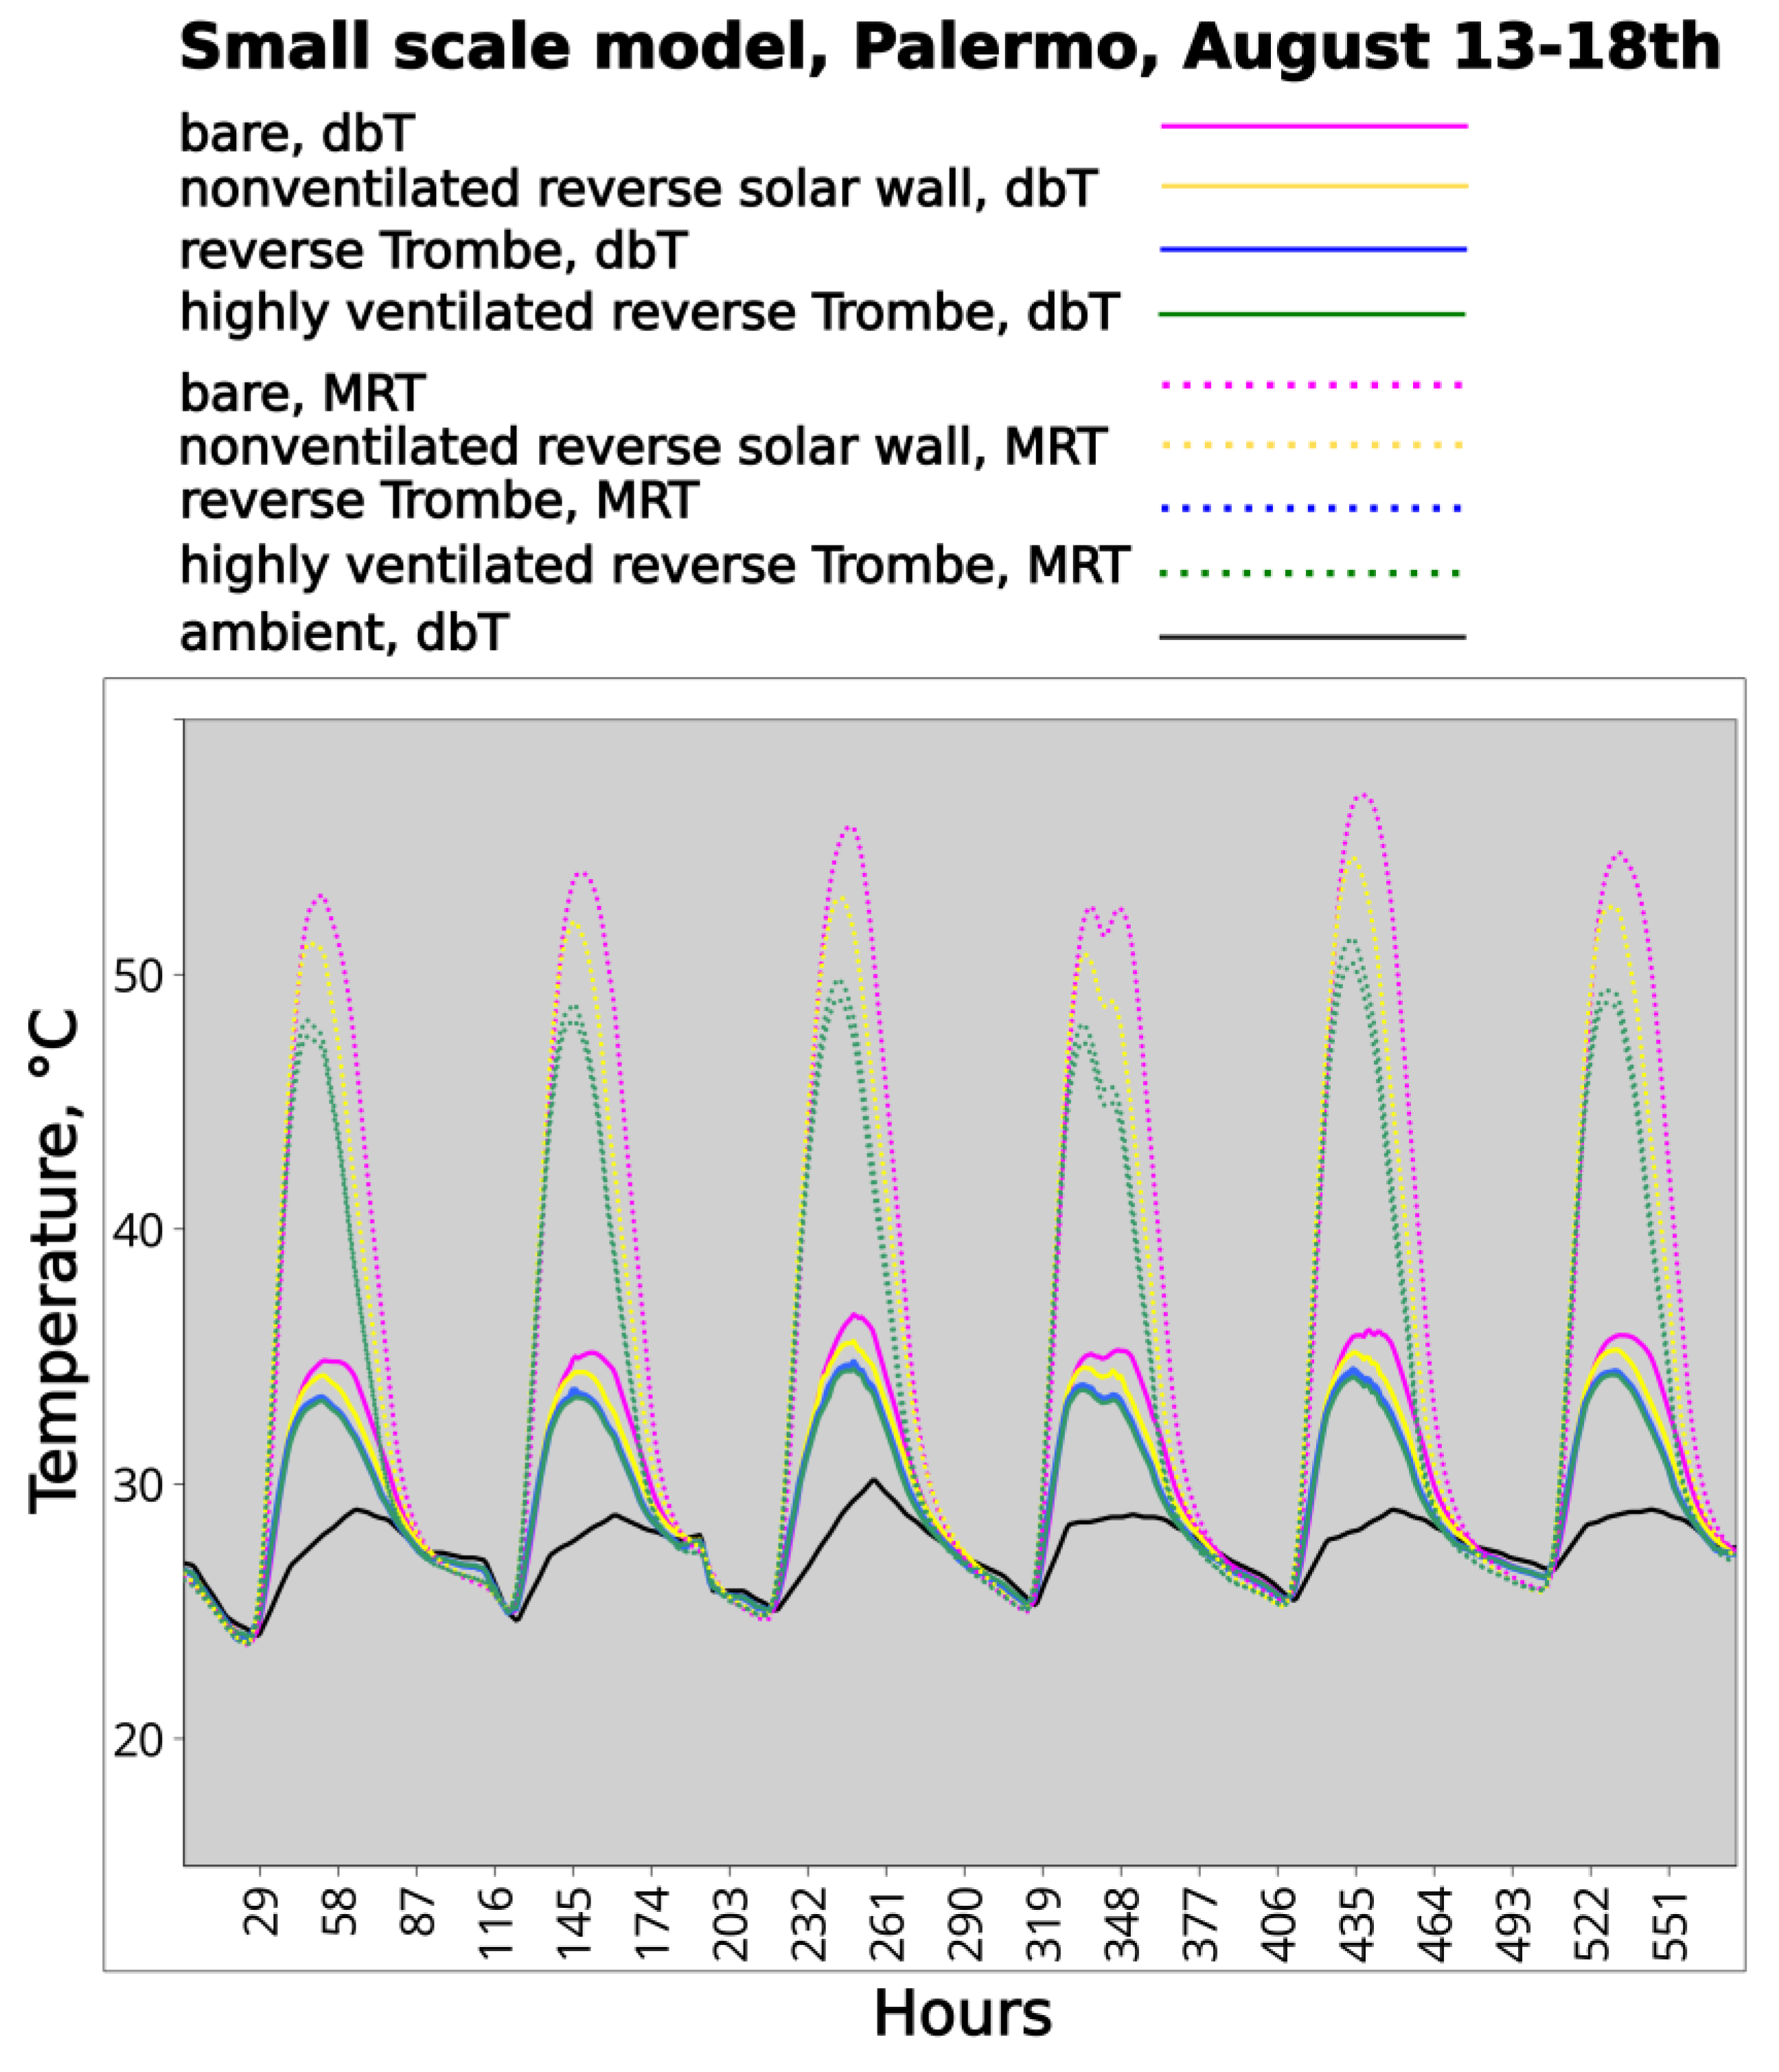
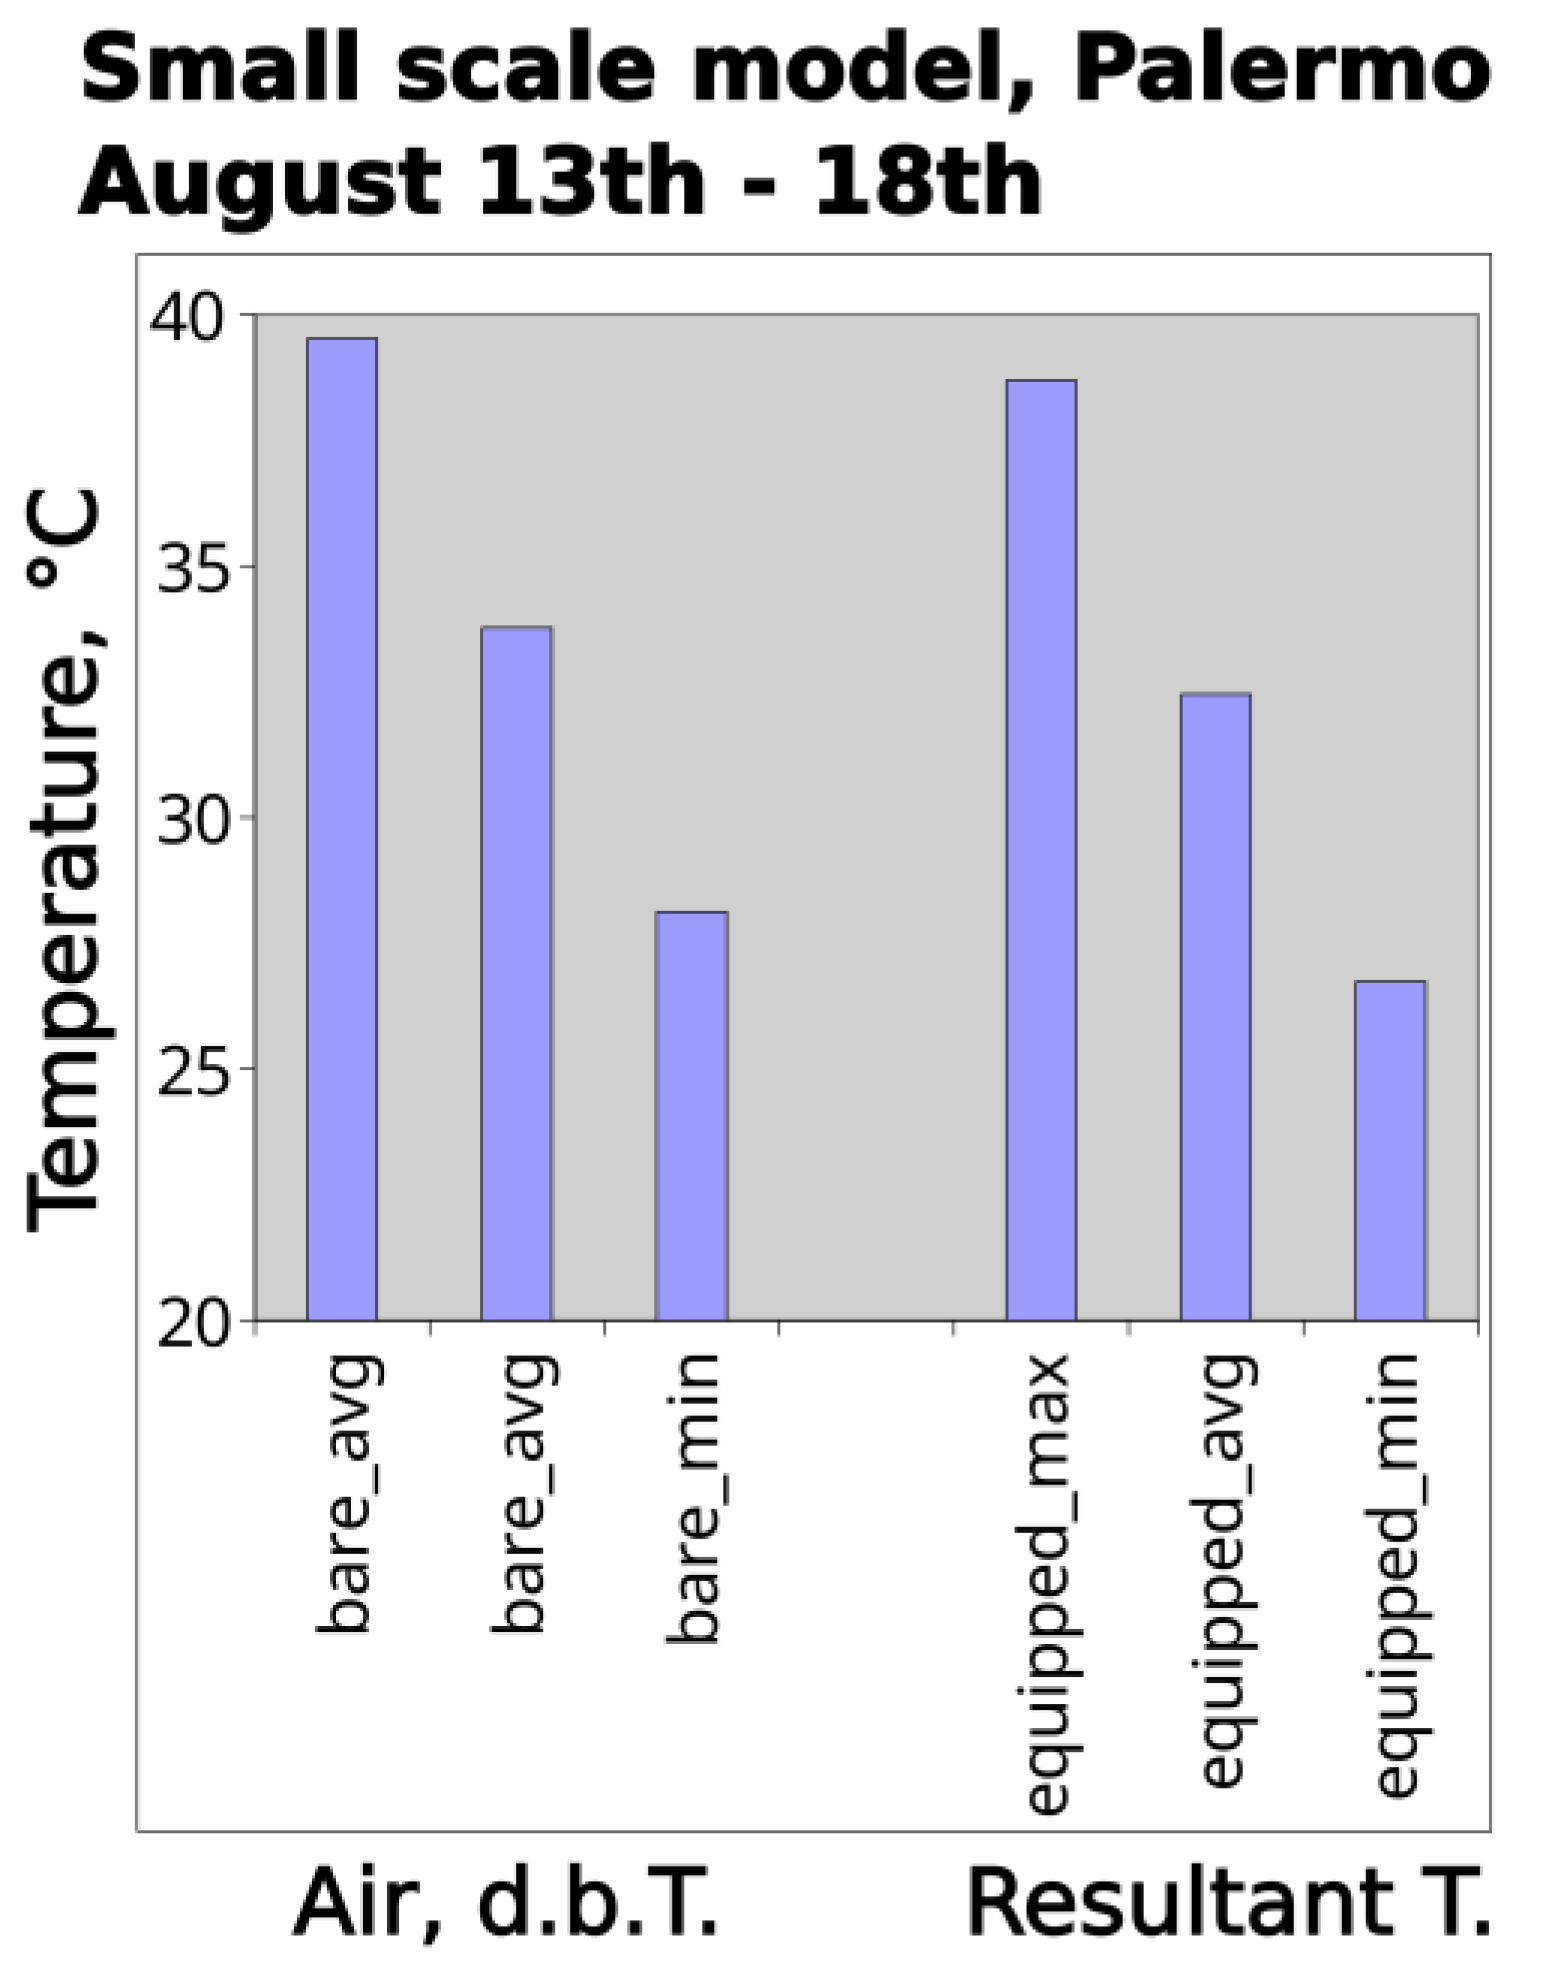
3.2. Results Linked to the Prototypes
Monitoring and simulations of the chambers showed that, in all tested configurations, the solutions featuring the reverse solar wall reduced indoor air temperatures relative to the reference chambers. These findings confirmed the results from the physical prototypes used to validate the simulation models: whenever the cavity was ventilated to the exterior, in the configuration analogous to a reverse Trombe wall, the indoor air was consistently cooler than in the reference case. This held true for both the small-scale models (
Figure 16 and
Figure 17) and the real-scale ones (
Figure 18).
The simulations further indicated that the relative benefit of the reverse Trombe wall was even greater in terms of mean radiant temperatures (MRTs). They also showed that enlarging the cavity ventilation openings increased the advantage of the reverse Trombe wall configuration.
Once it was determined that the small-scale and real-scale models exhibited broadly similar behaviour—despite the fact that many thermal phenomena linked to buoyancy-driven convection and radiation do not scale linearly—further investigations focused specifically on the real-scale models. In this case, variants with thinner walls and without cavity ventilation were also tested.
Across the monitored August period, chambers equipped with the reverse solar wall consistently showed peak temperatures more than 1 °C lower than those in the reference chamber. This benefit was also reflected in cumulative indicators such as cooling degree-hours (CDHs) above 26 °C (
Figure 19). The only exception occurred when the ventilated chamber was sealed airtight, in which case the results of both configurations were virtually identical.
The results also showed that the absence of ventilation in the cavity did not prevent the reverse solar configuration from reducing summer indoor temperatures.
Reducing the brick wall thickness from 27.5 cm to 5.5 cm preserved the advantage of the reverse Trombe wall, though to a lesser extent. A similar outcome was observed when the 27.5 cm brick wall was substituted with a 1 mm thick painted aluminium sheet (
Figure 20). Overall, the effect of the reverse solar wall was greatest when combined with the original massive and conductive wall.
The presence of the reverse solar wall also produced advantages when the front enclosure of the chamber was sealed with a double low-emissivity glazing unit and cooled using an idealised all-air plant. In this case, the cooling loads over the considered summer period were reduced by more than 30% with the reverse solar wall (
Figure 21).
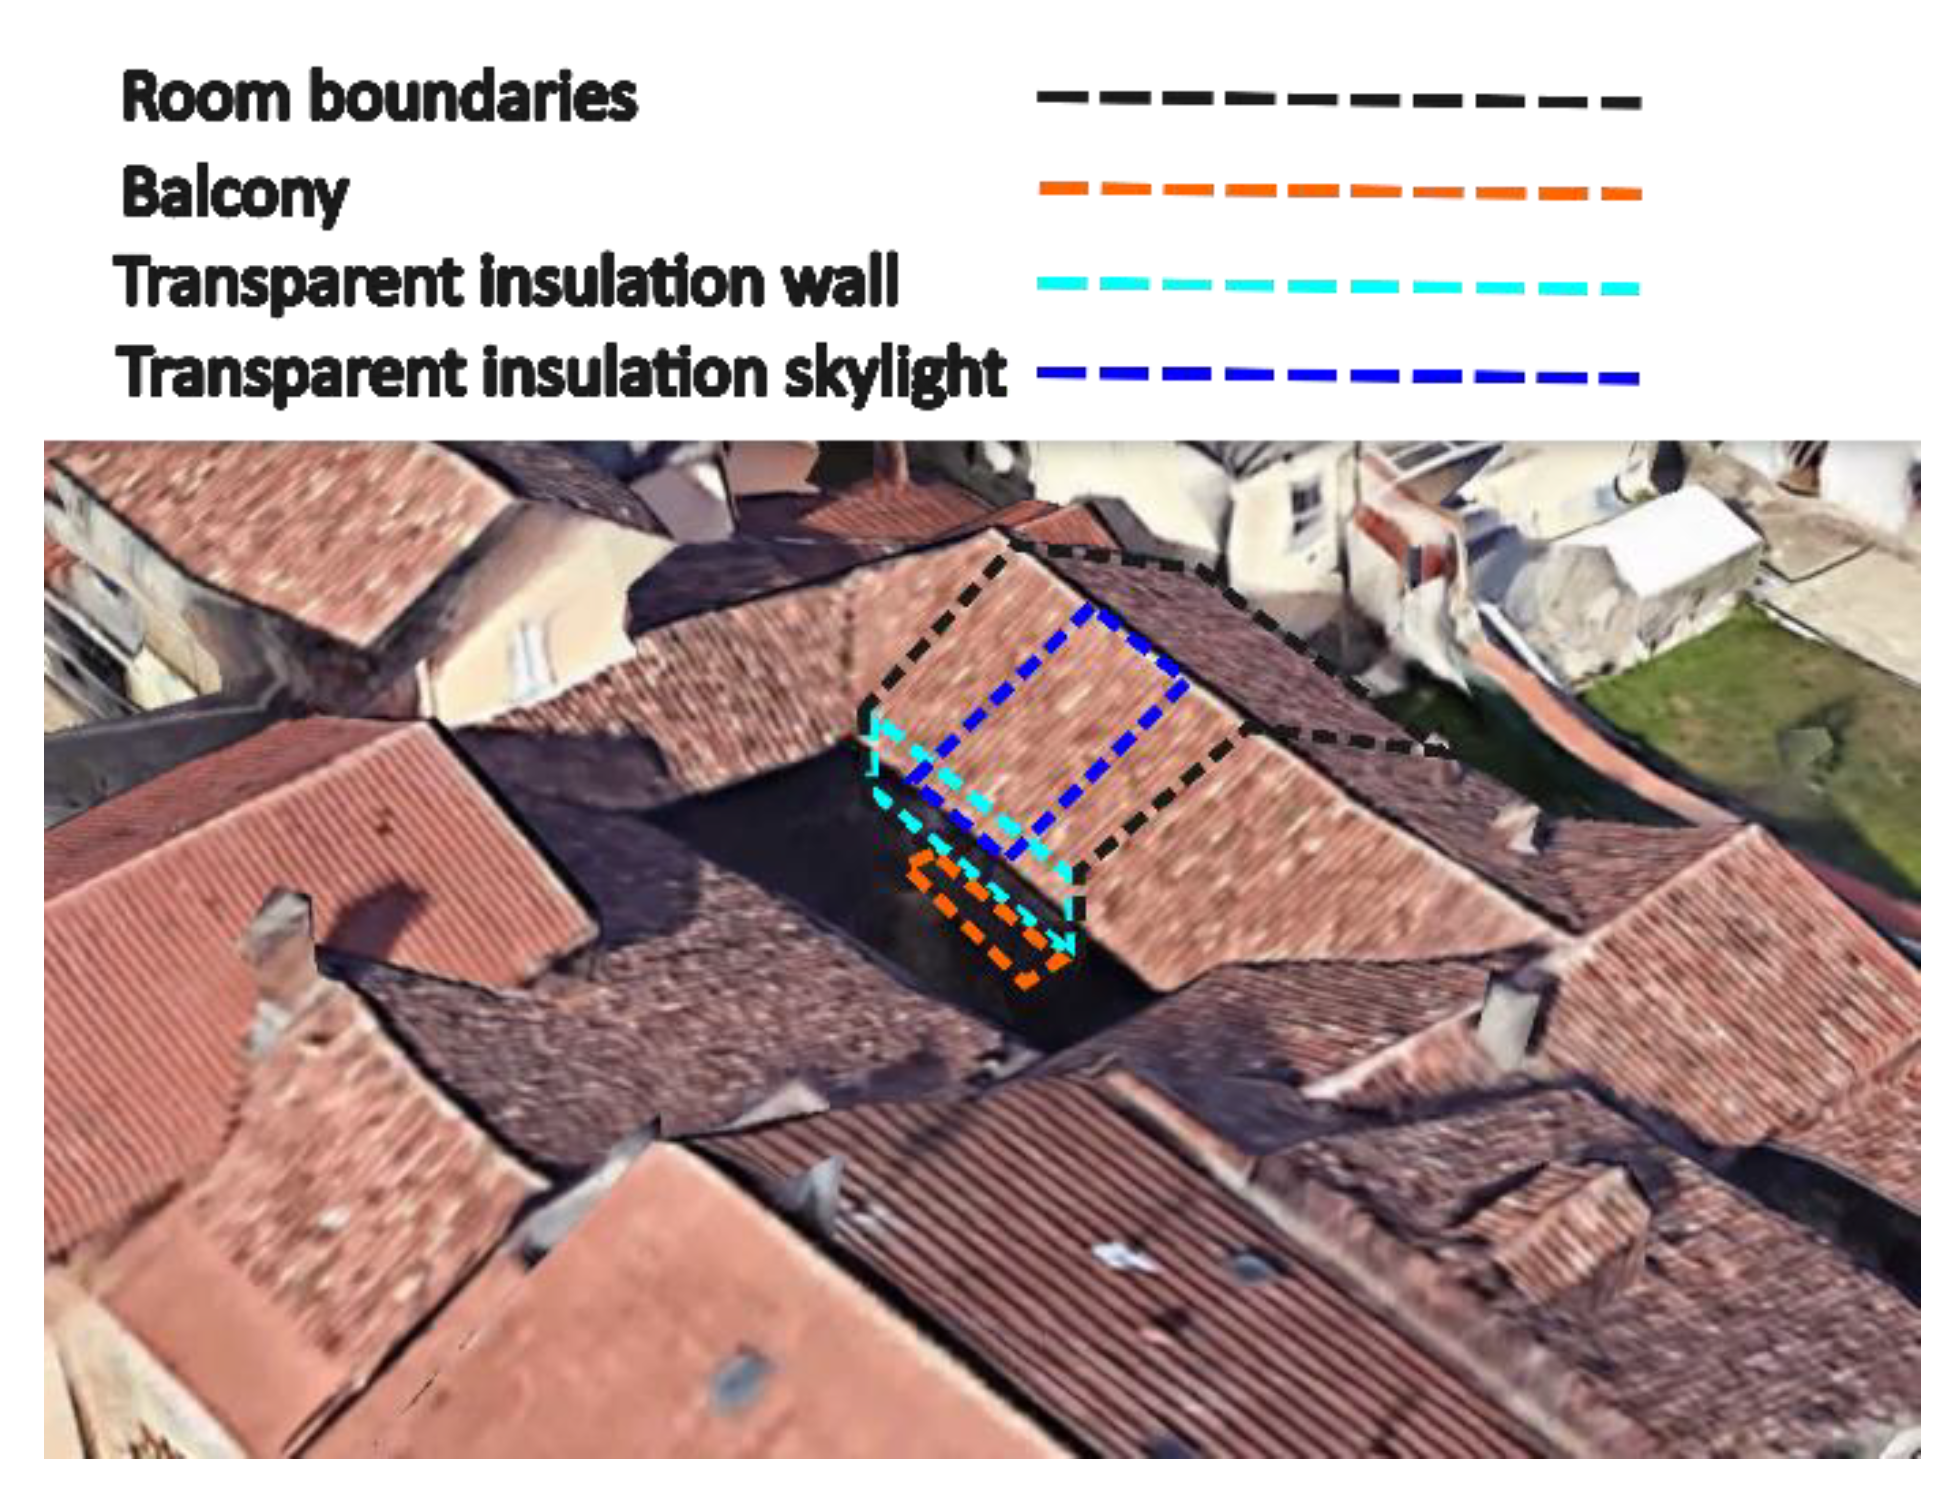
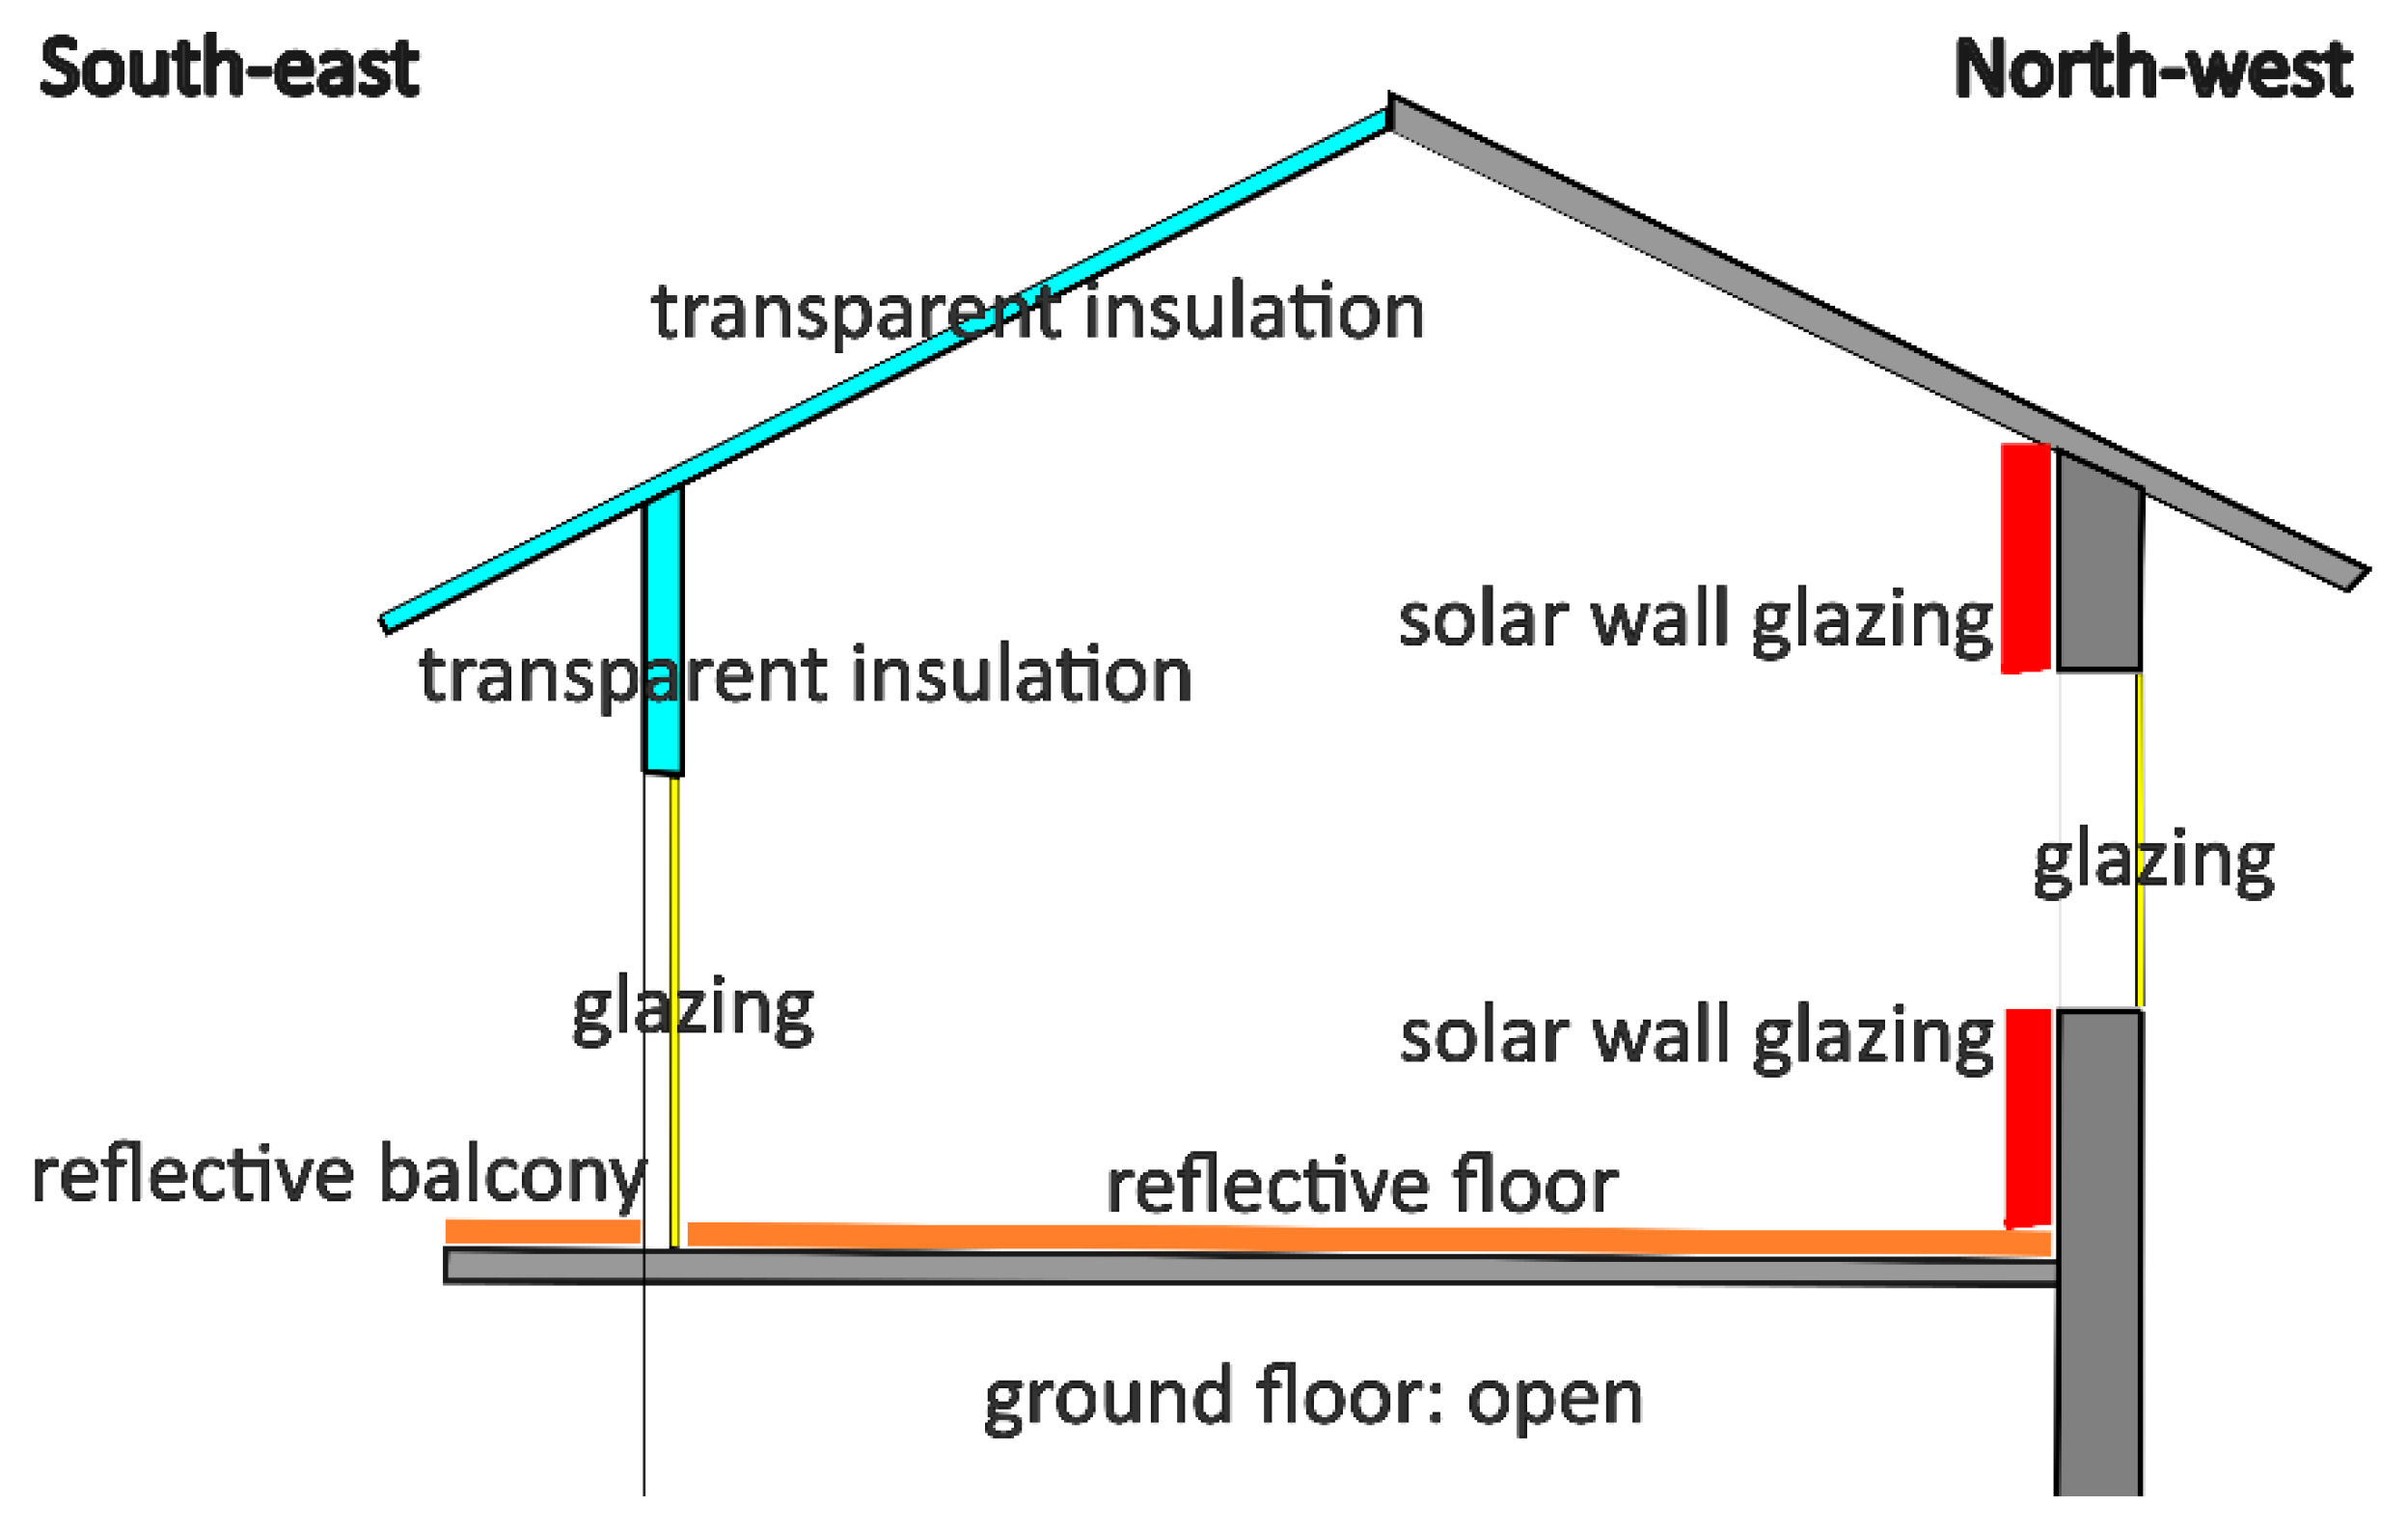
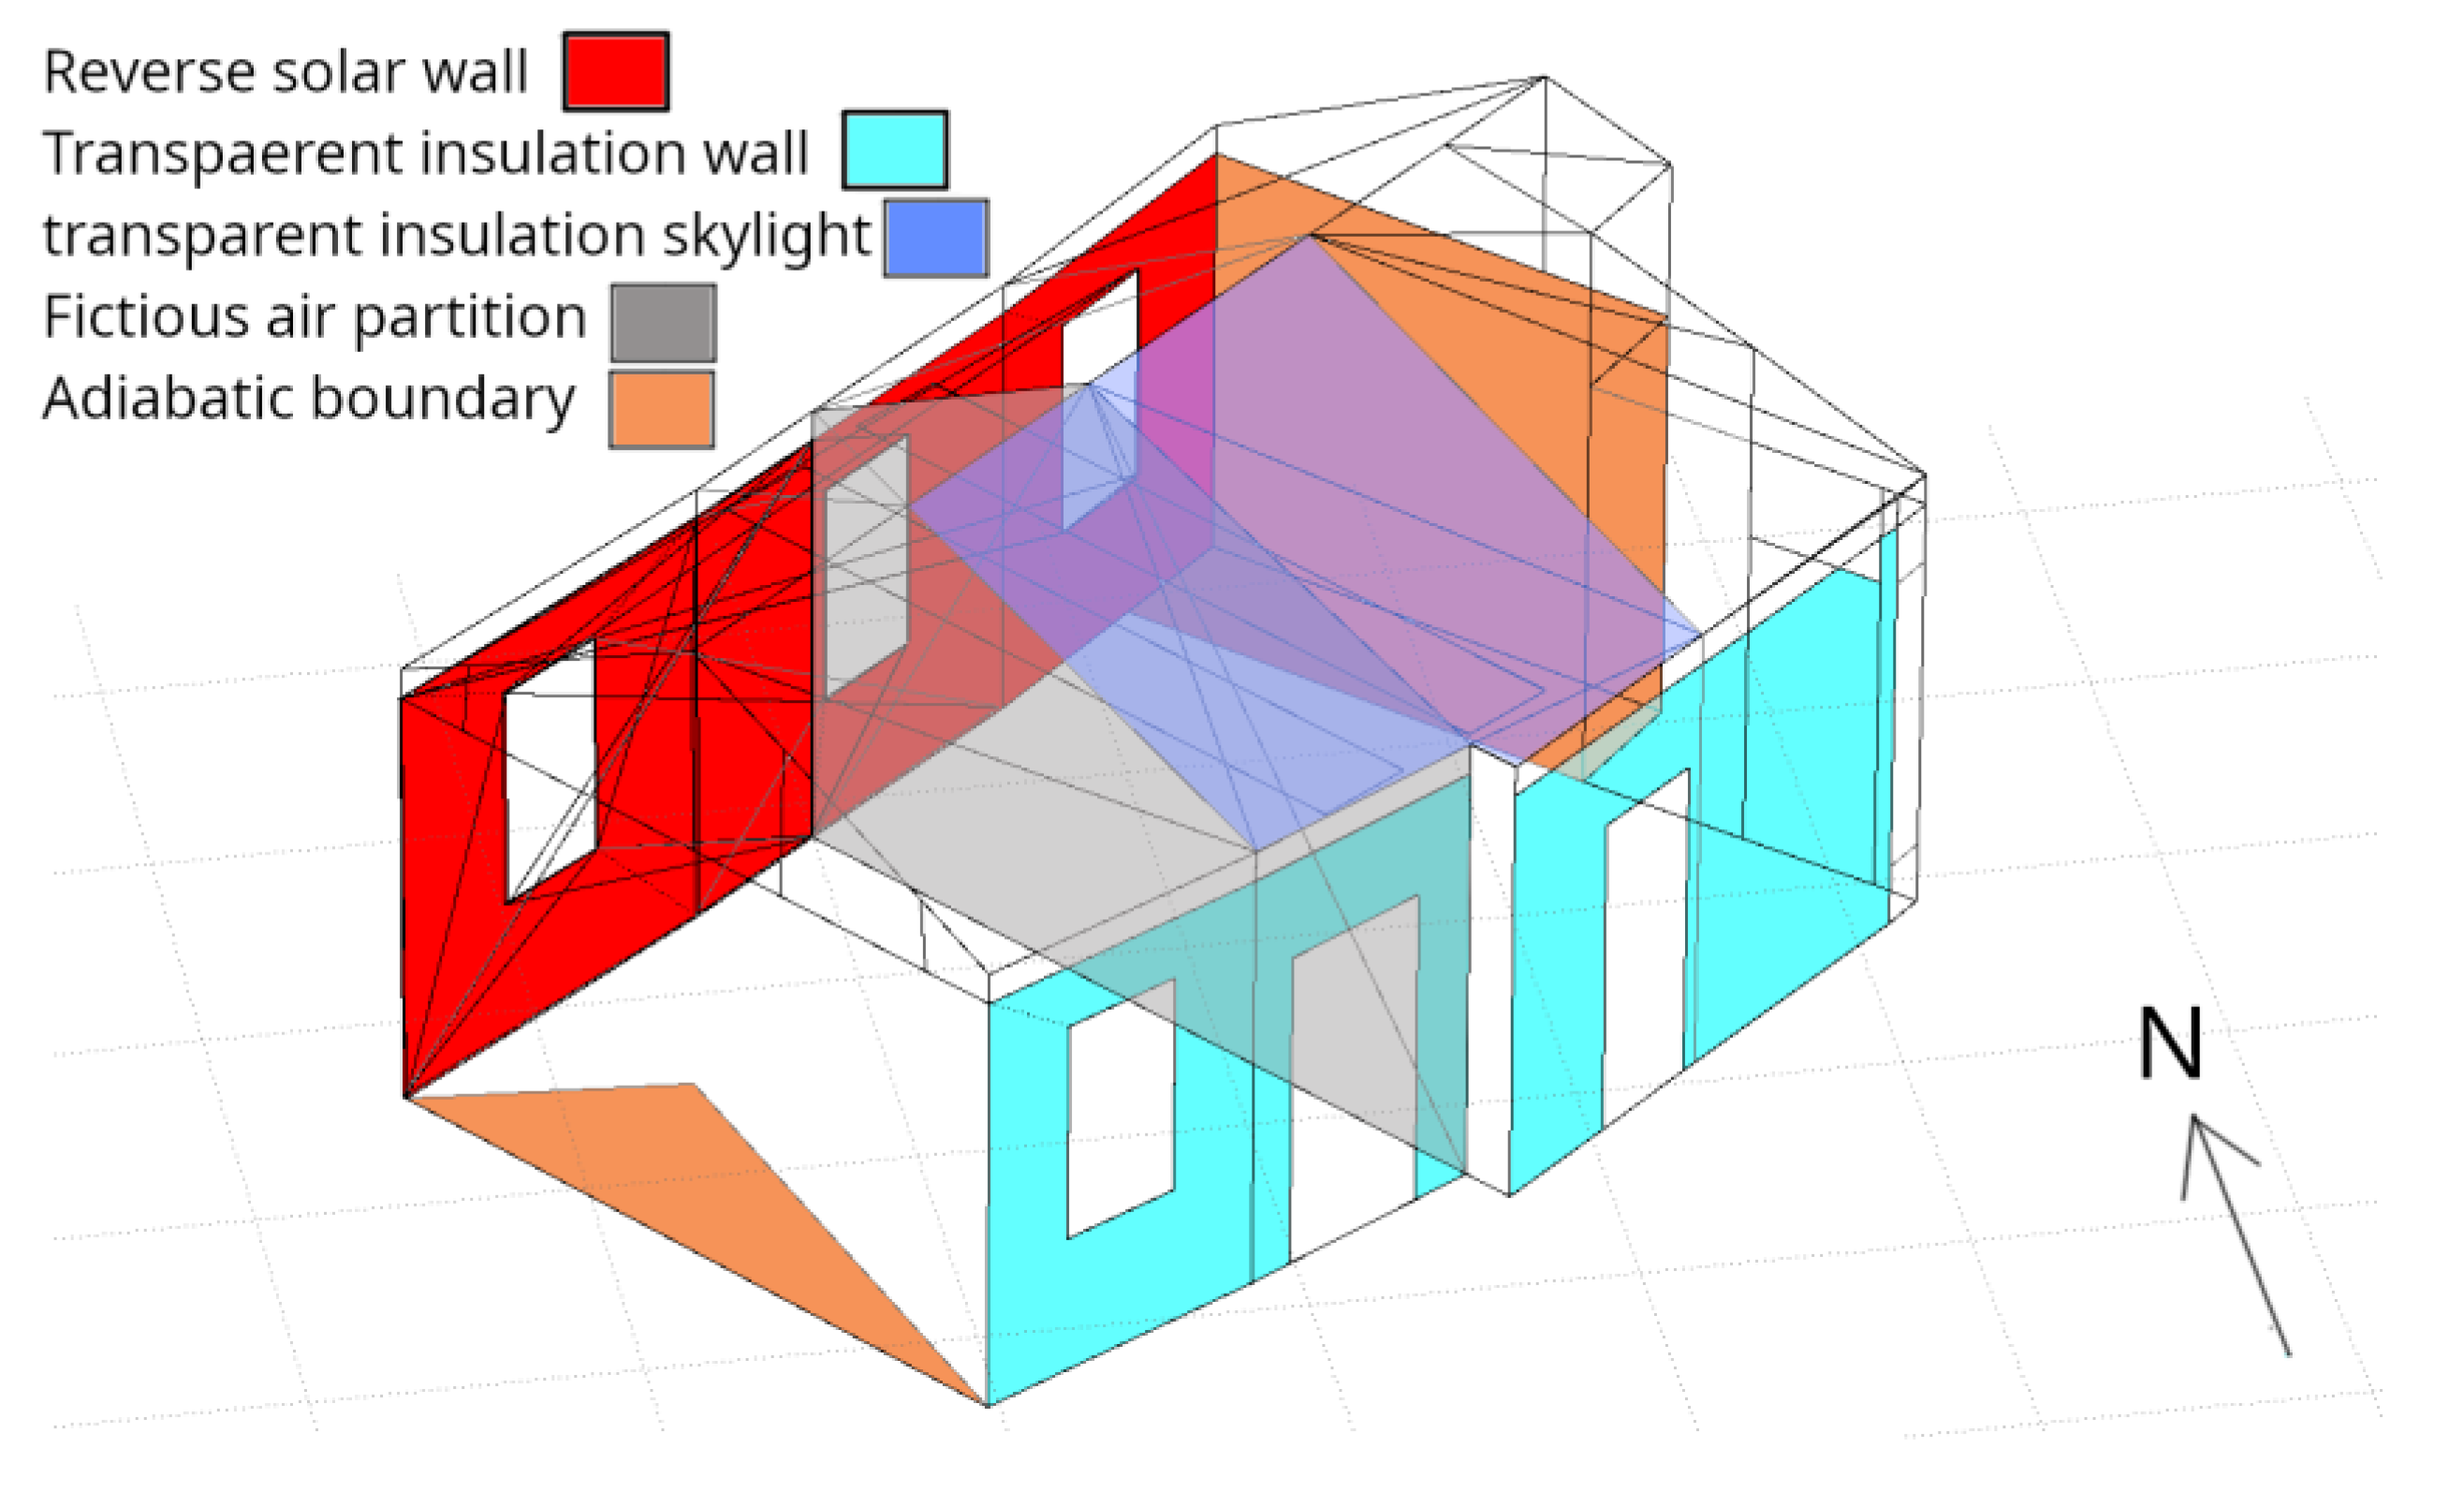
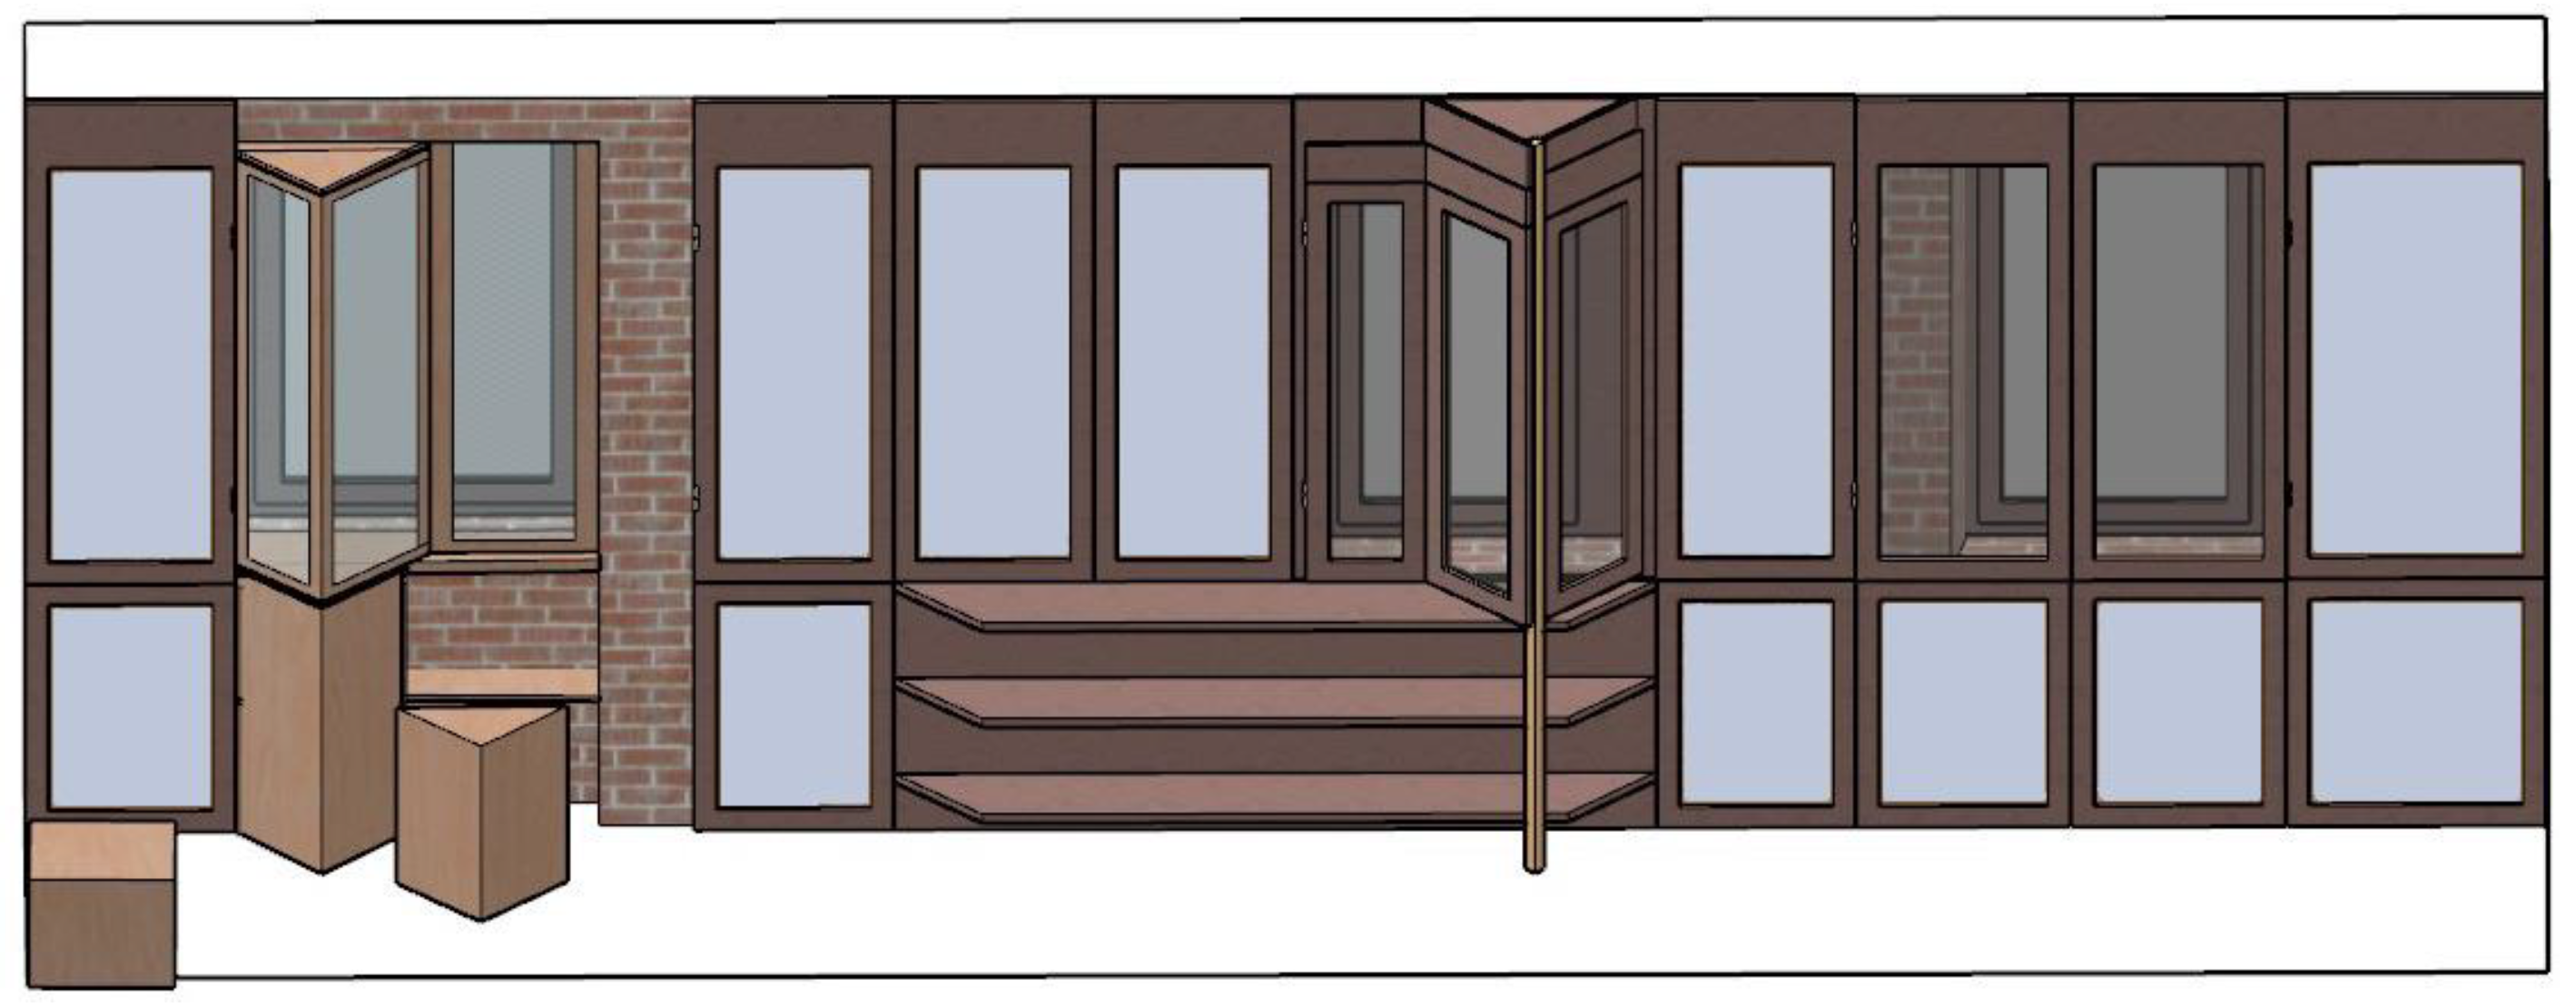
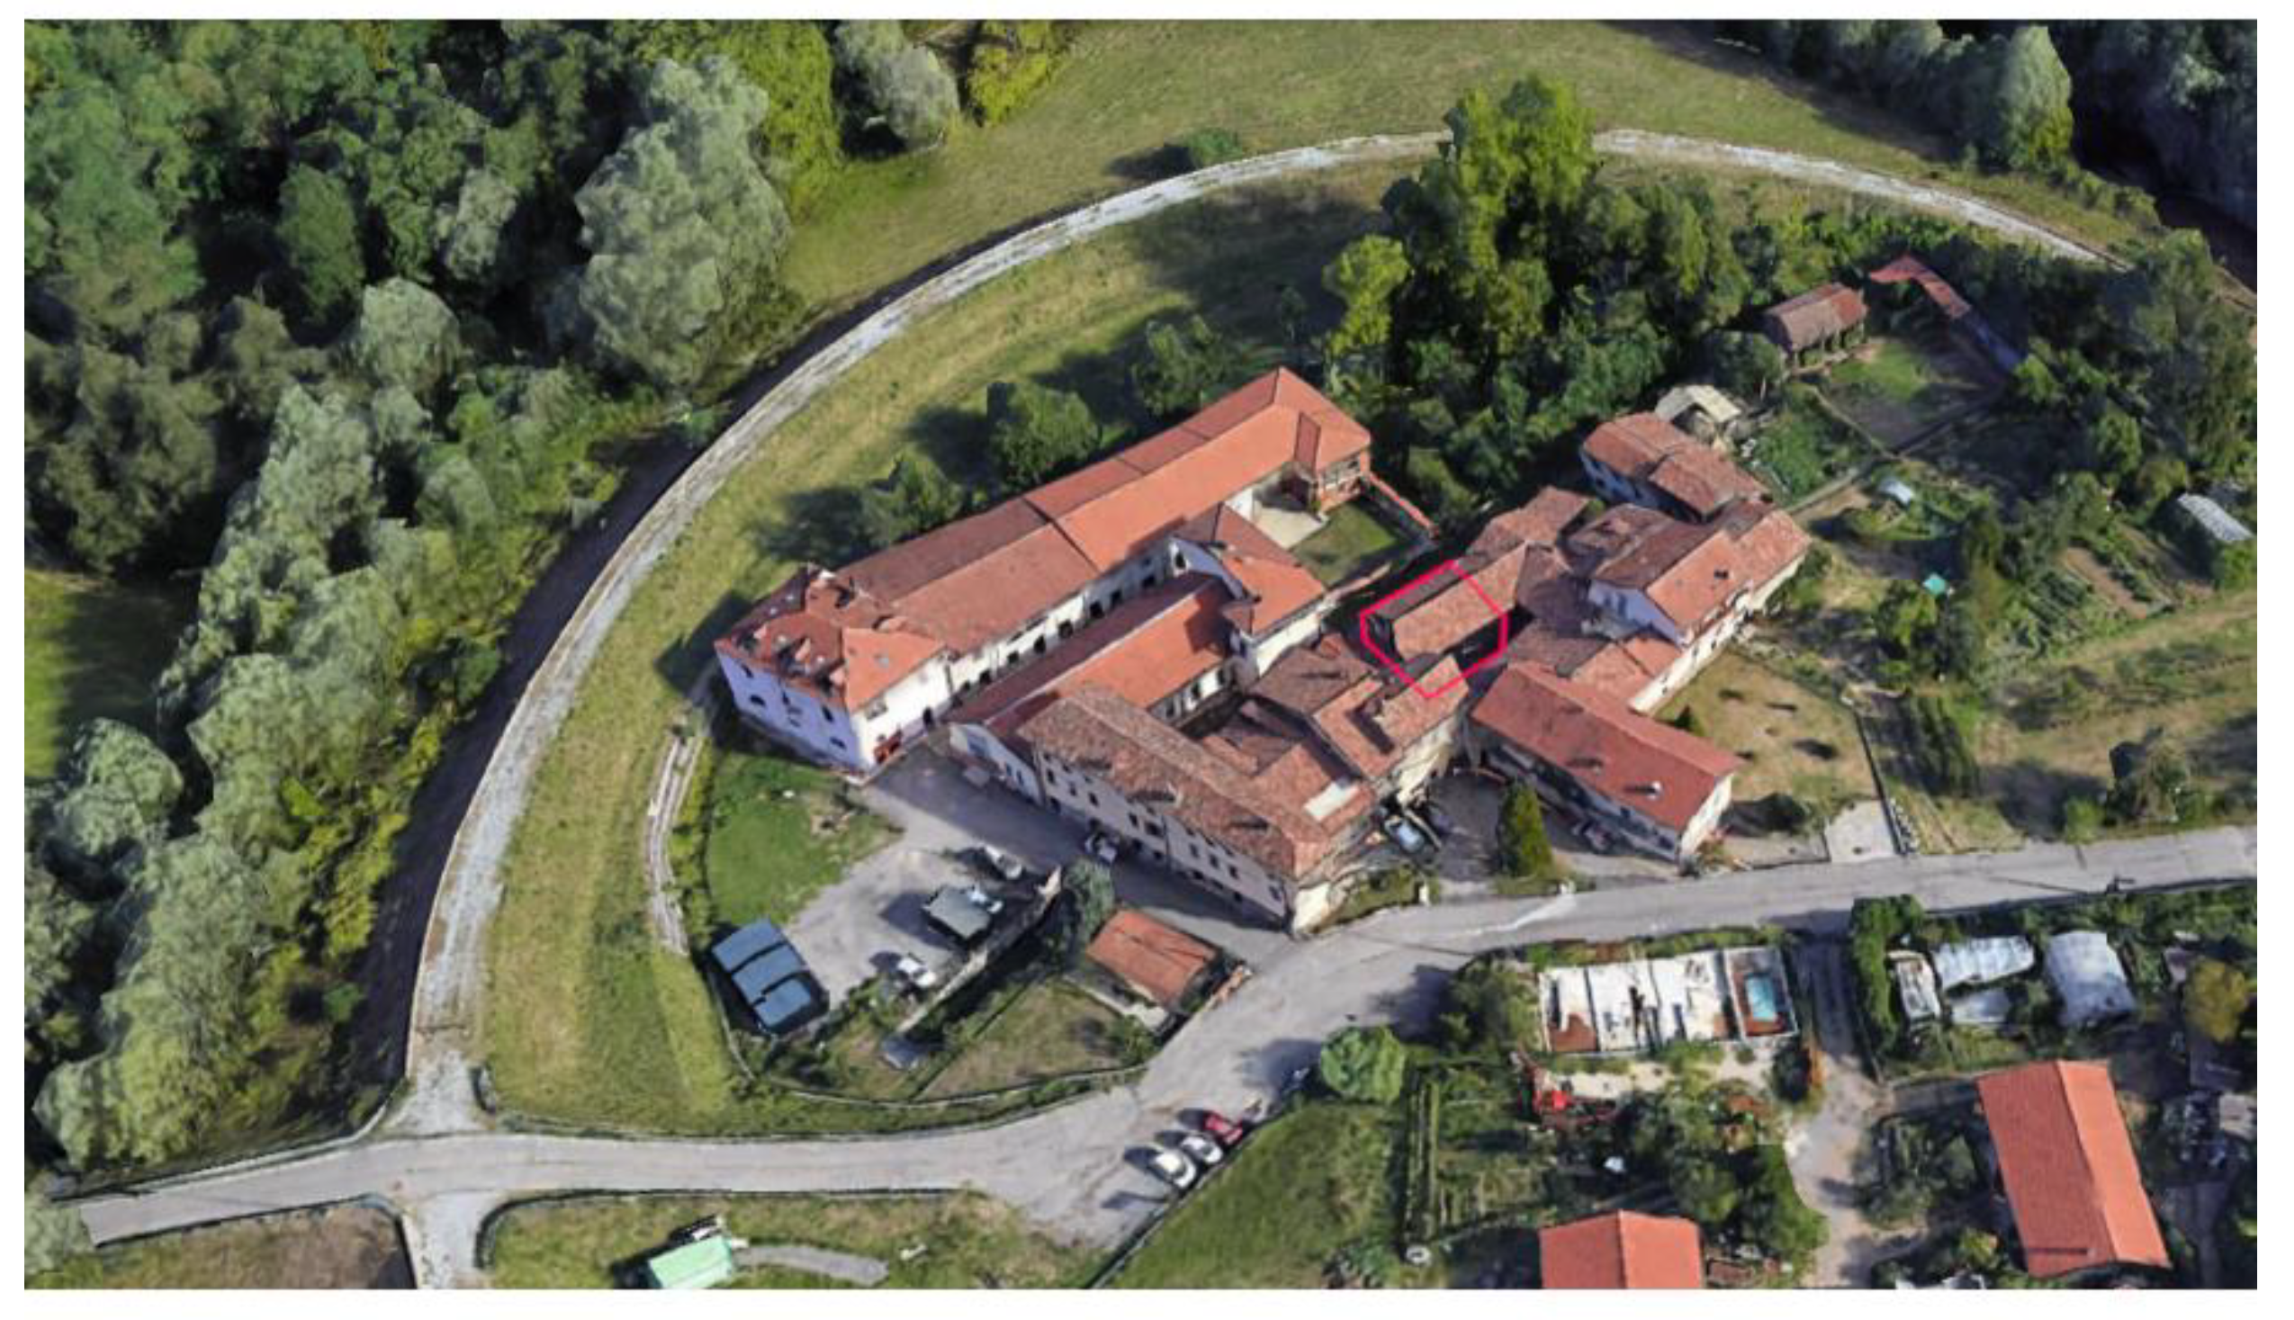
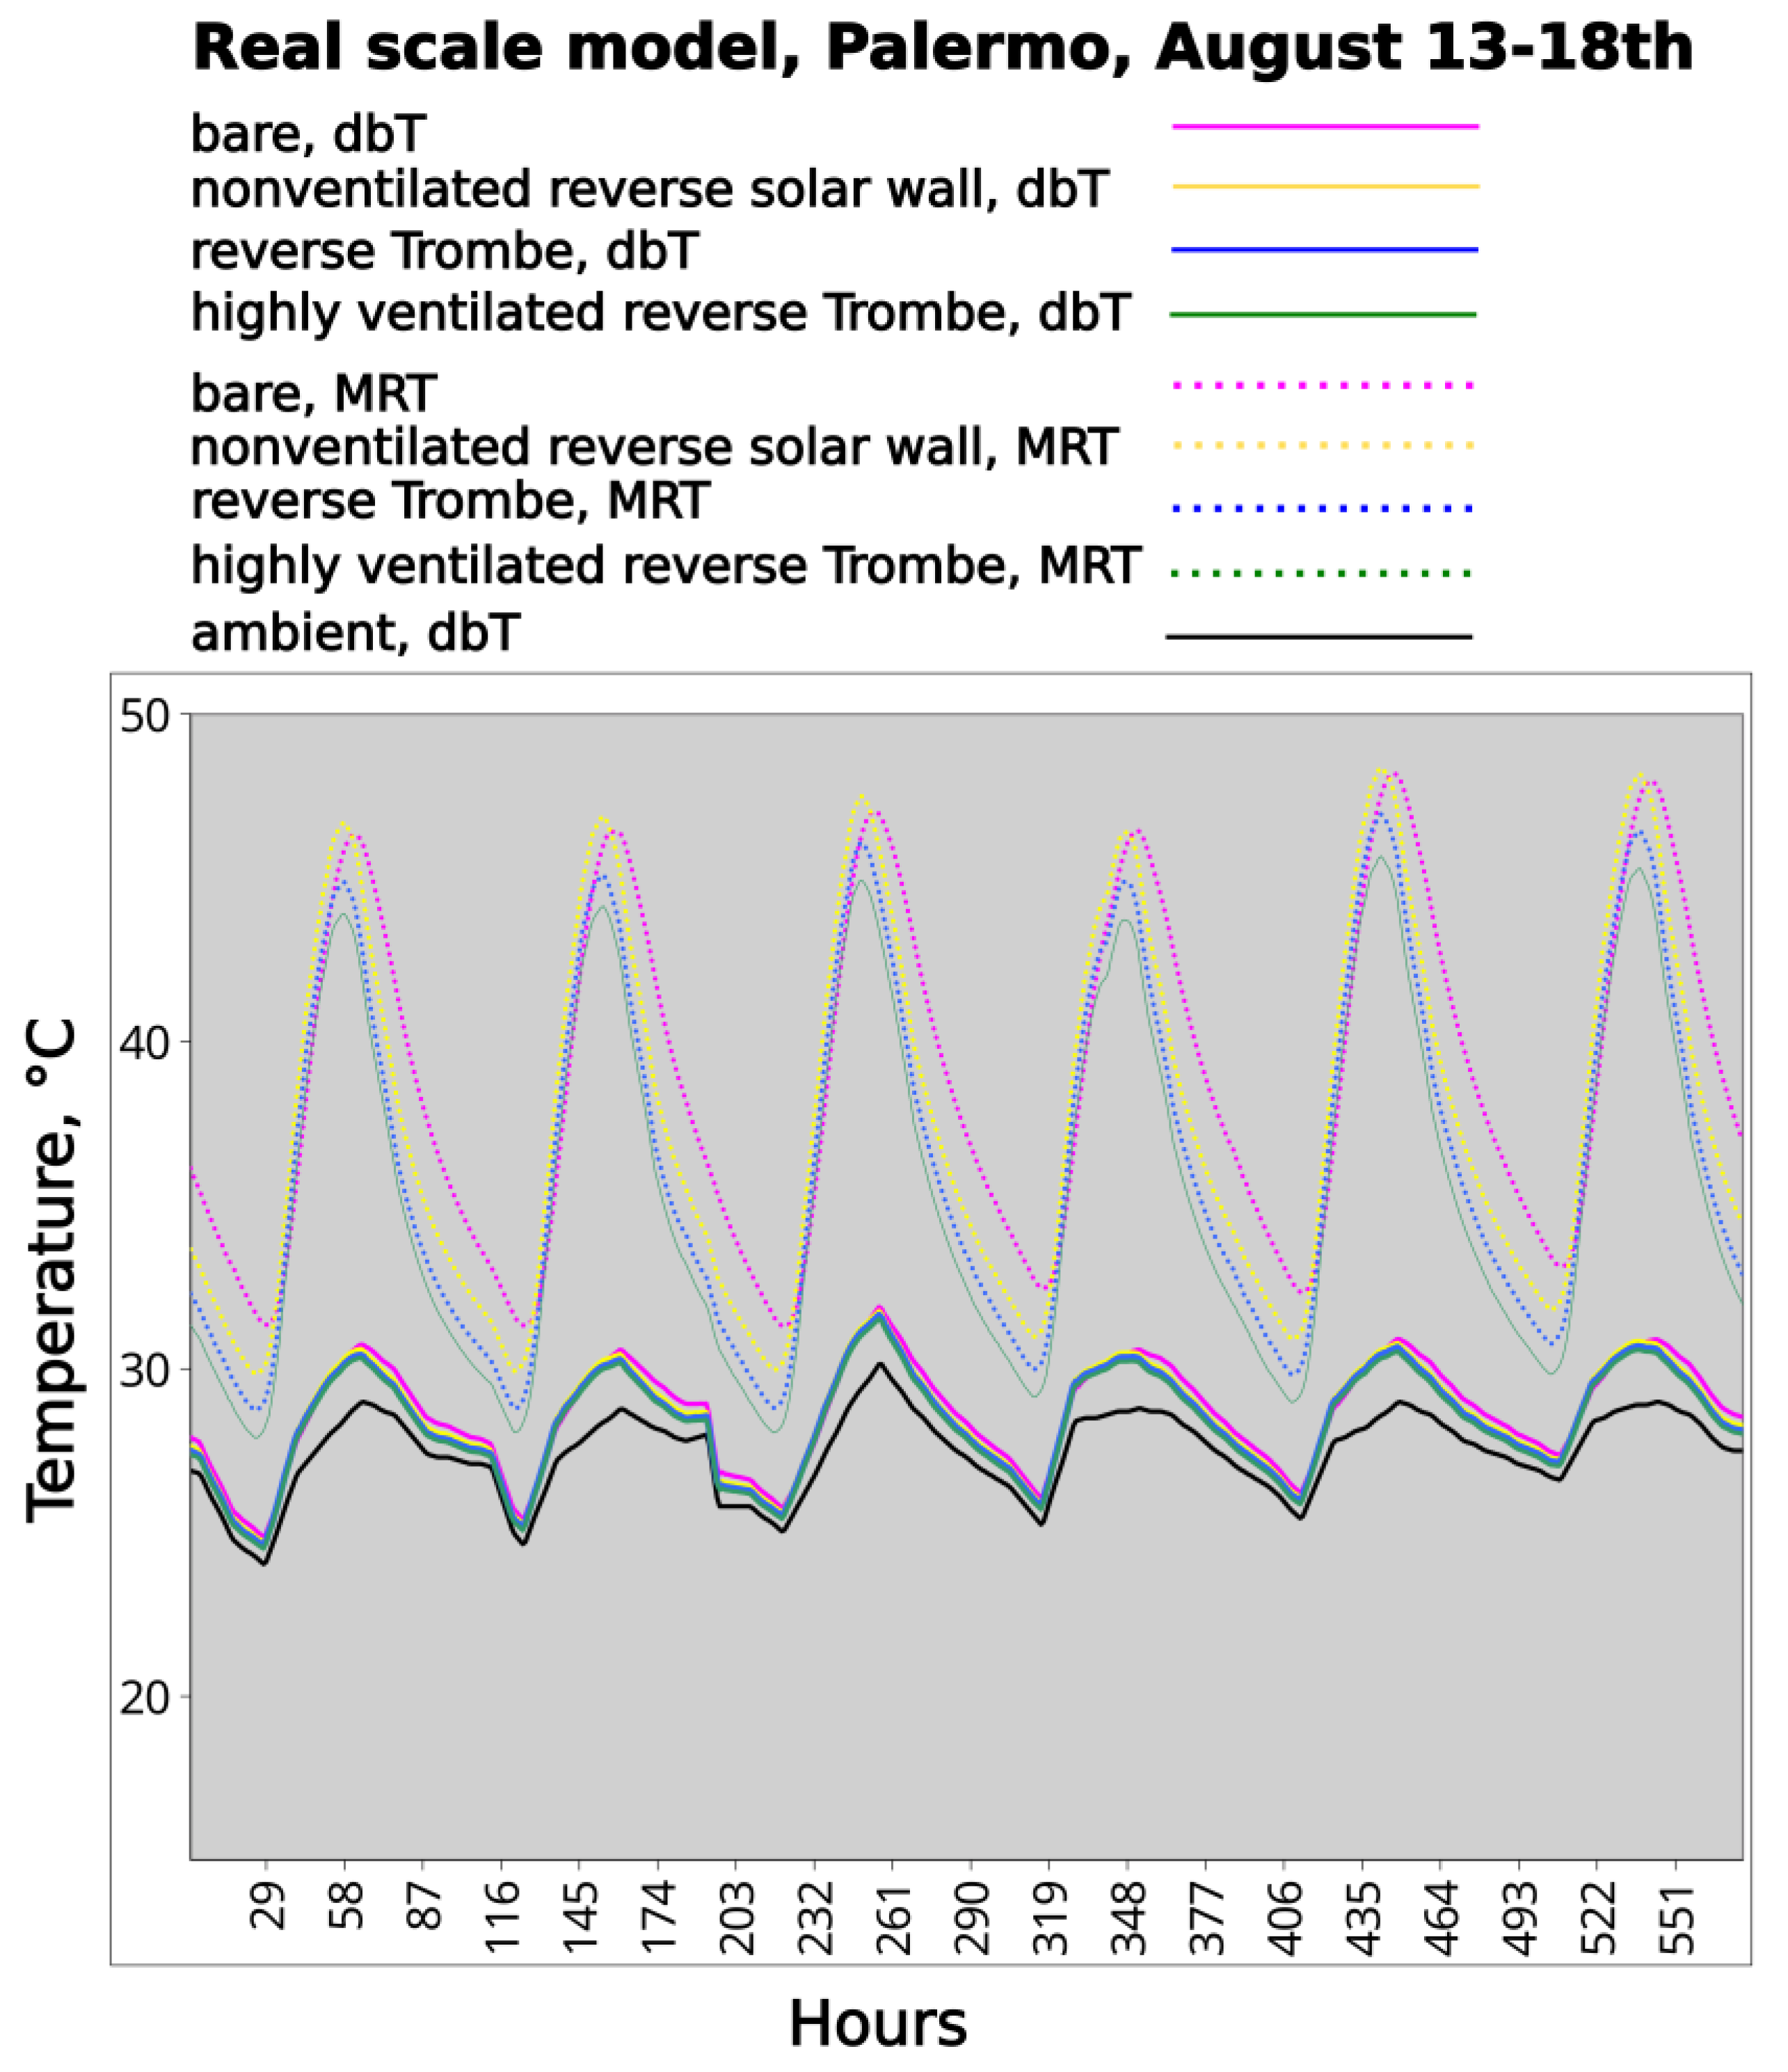
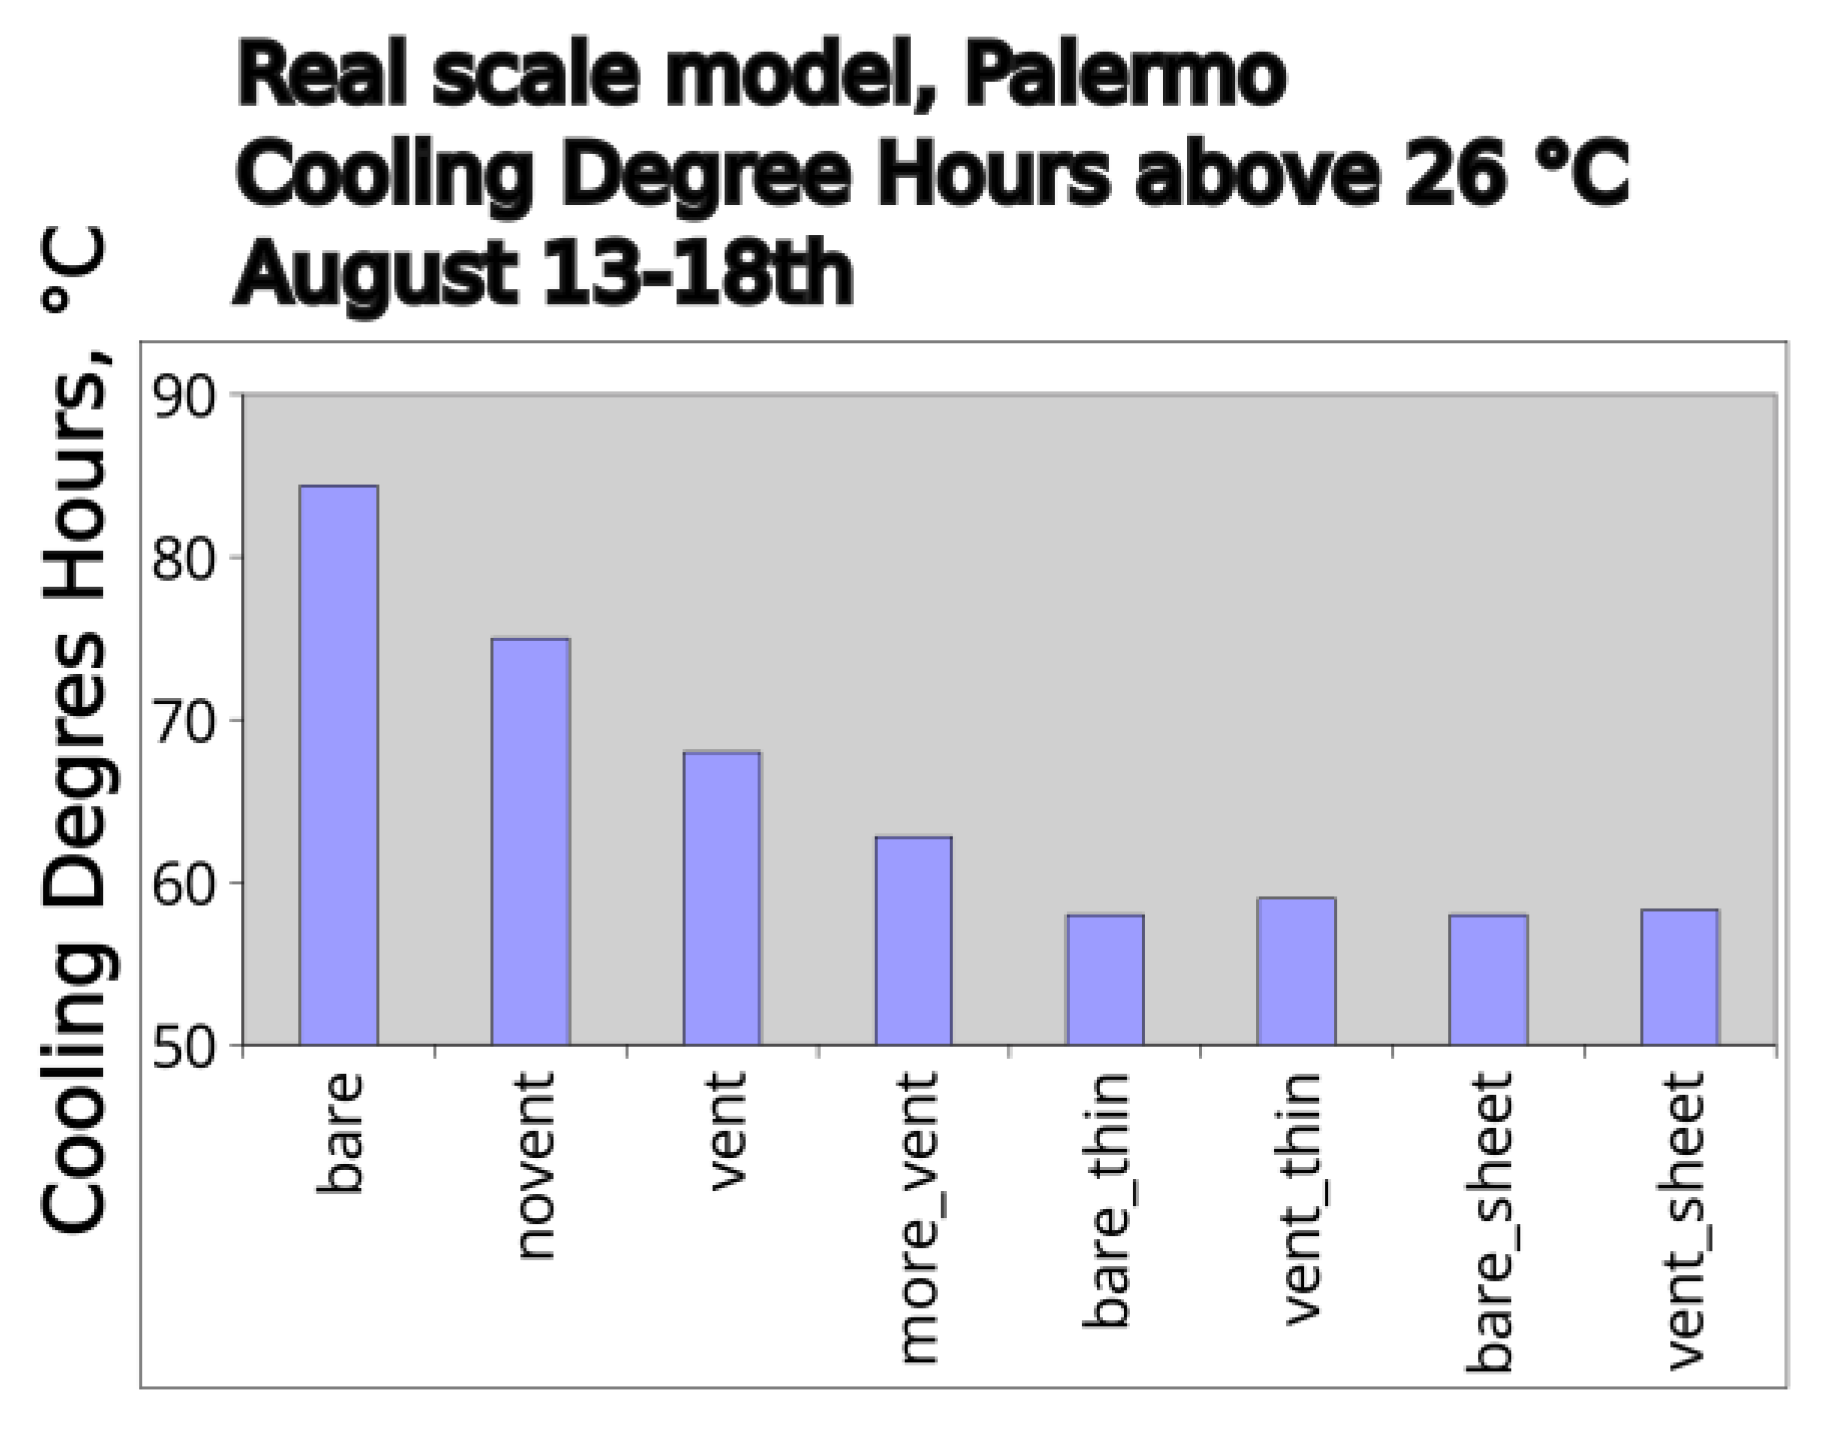
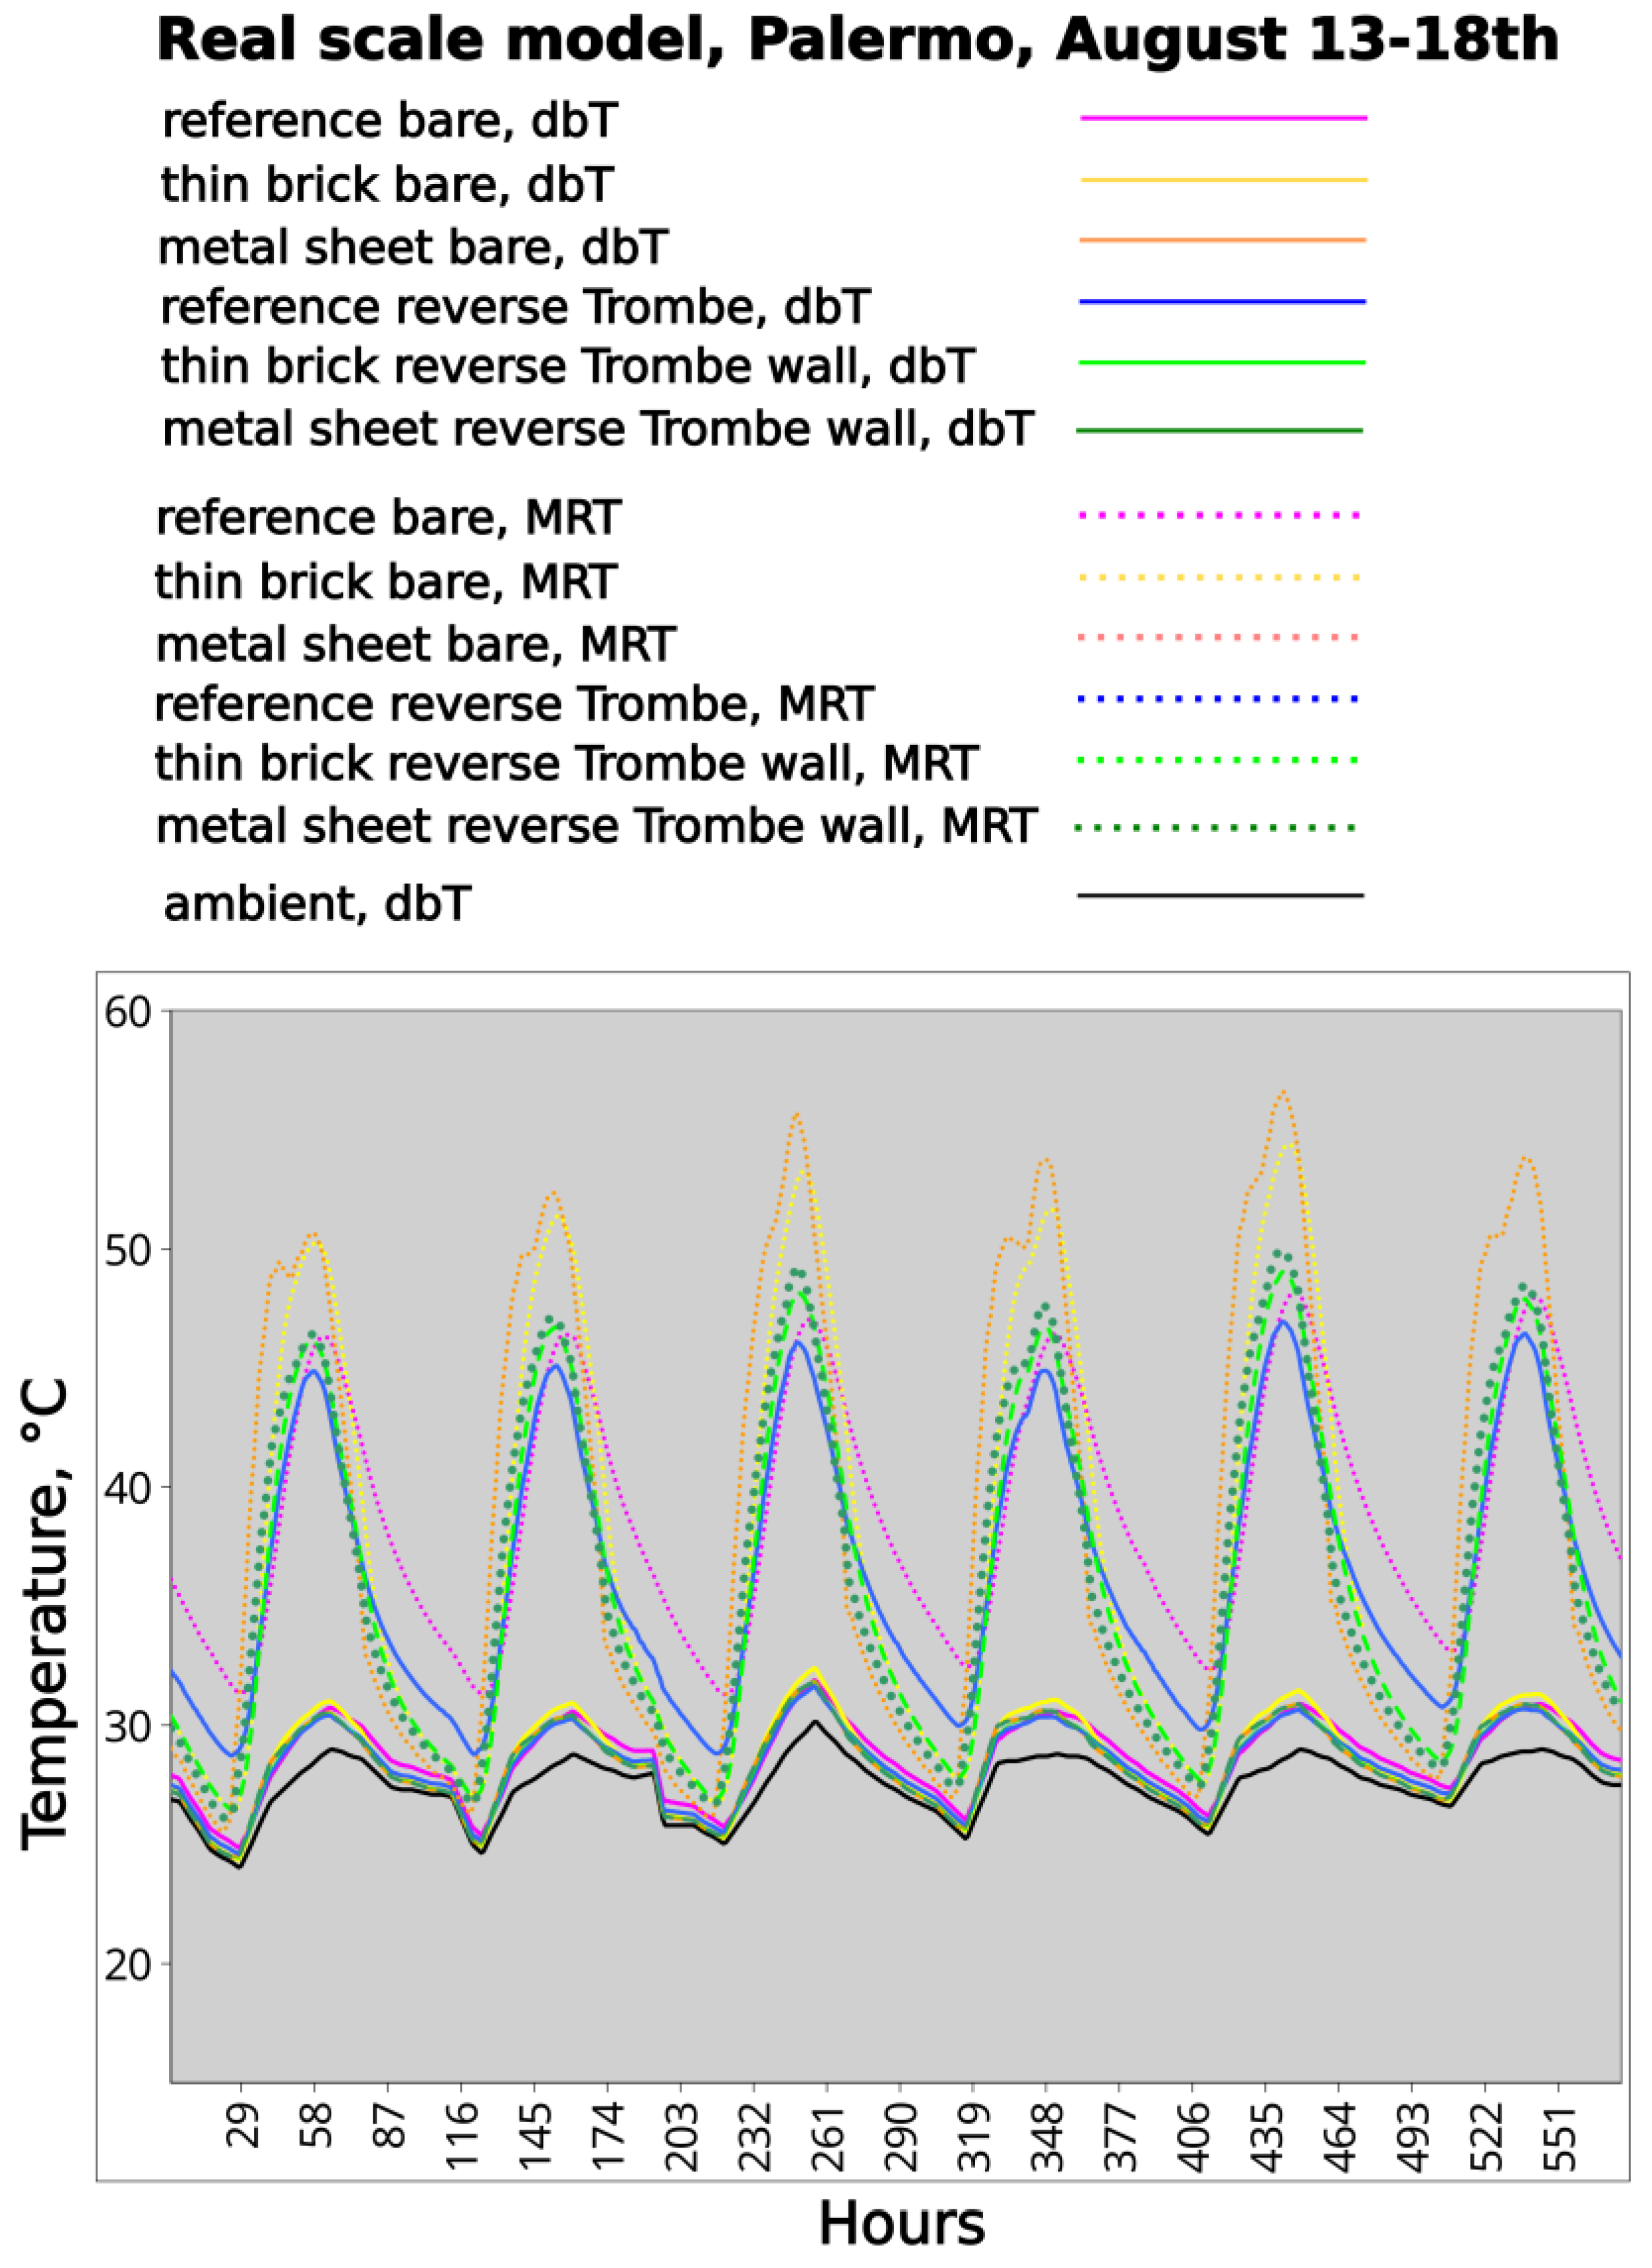
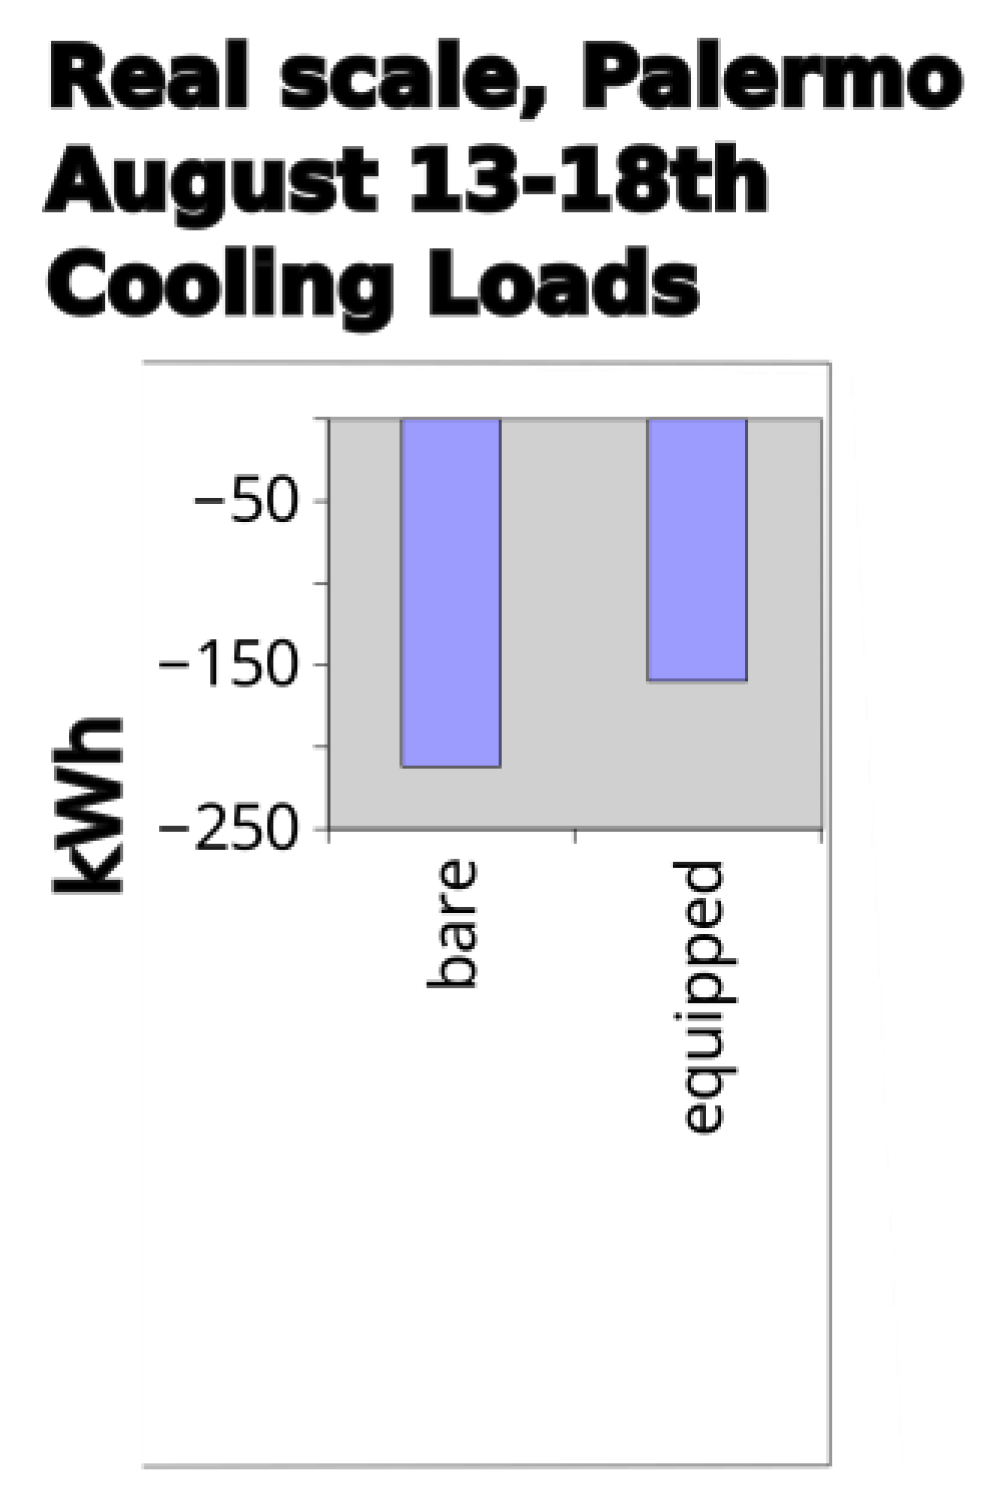
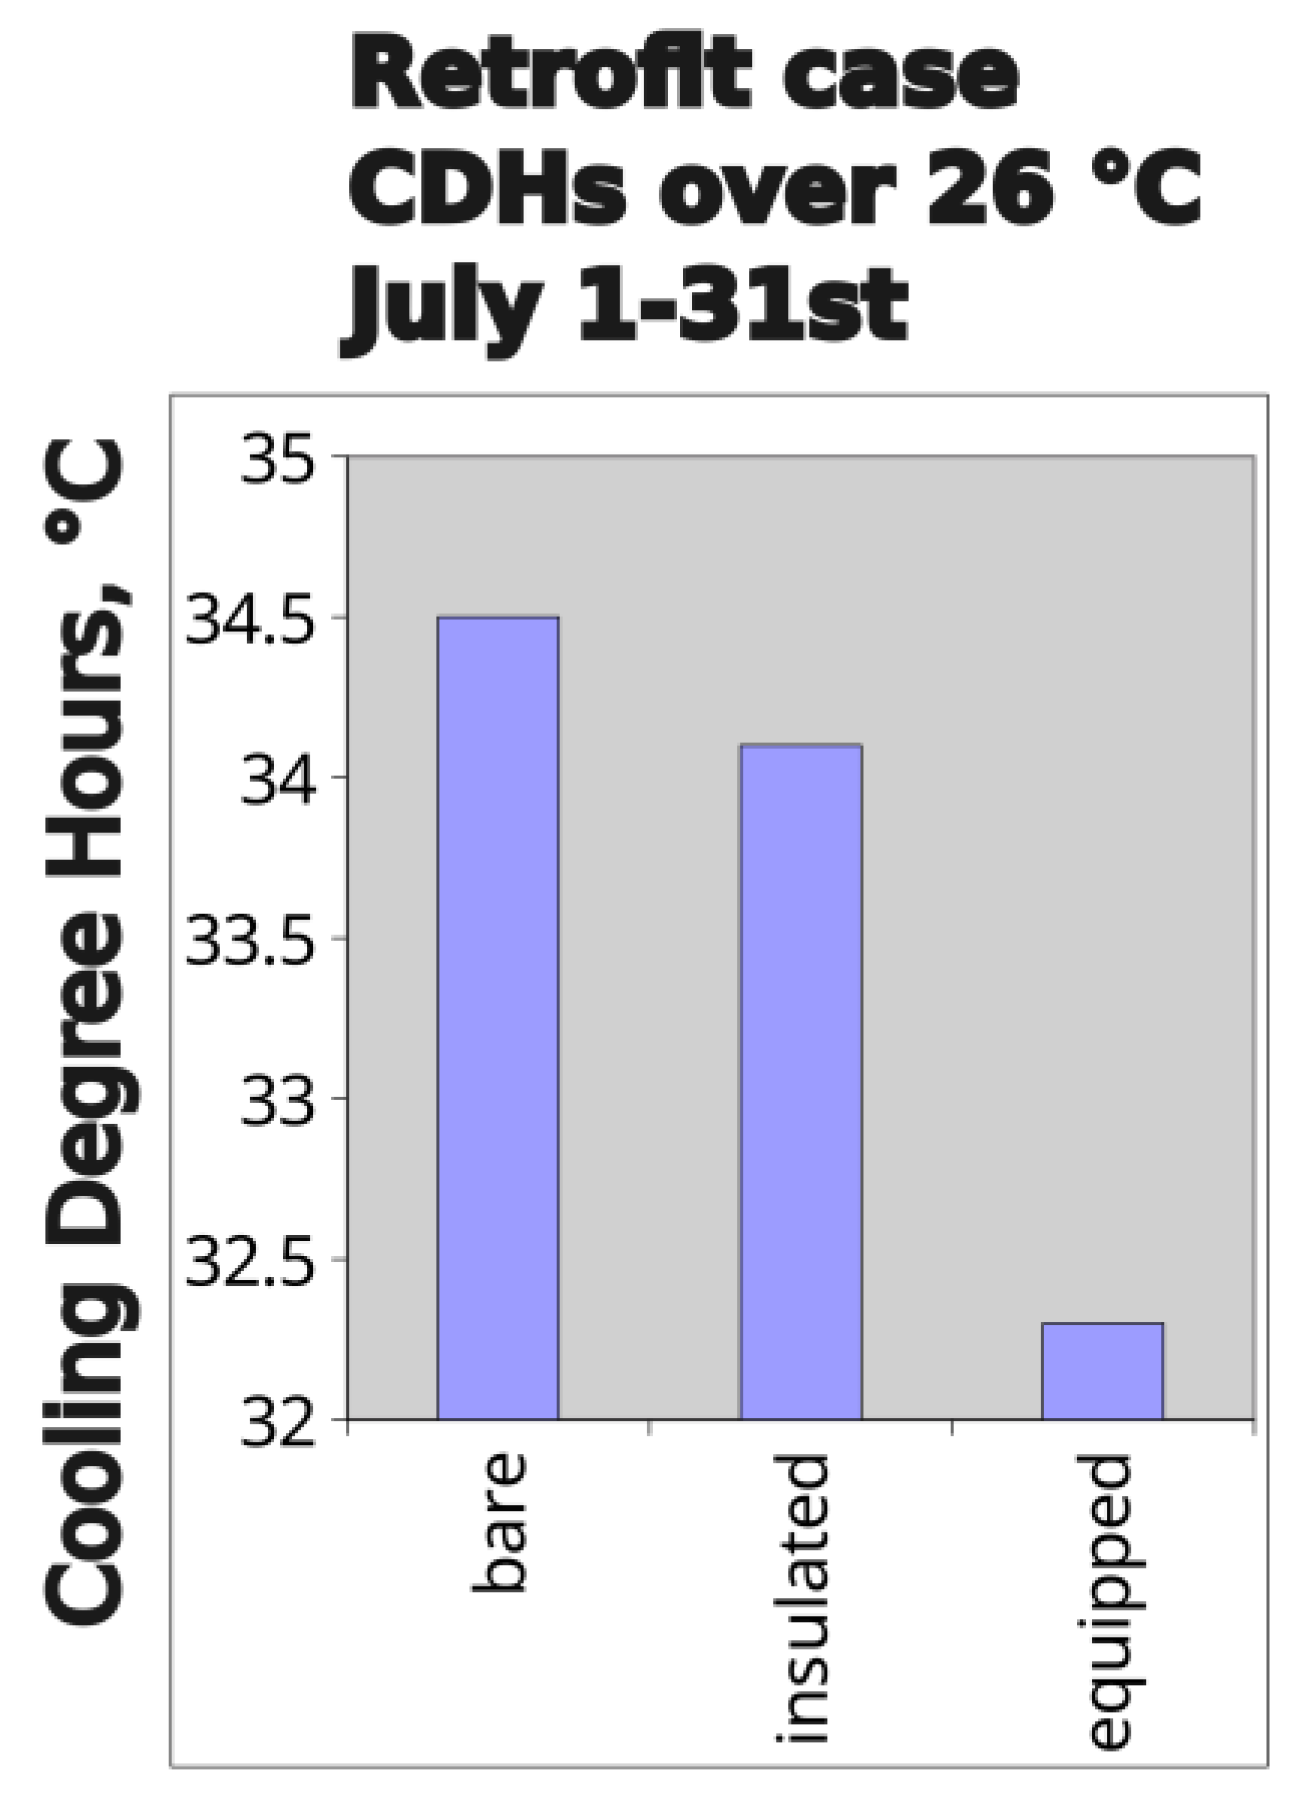
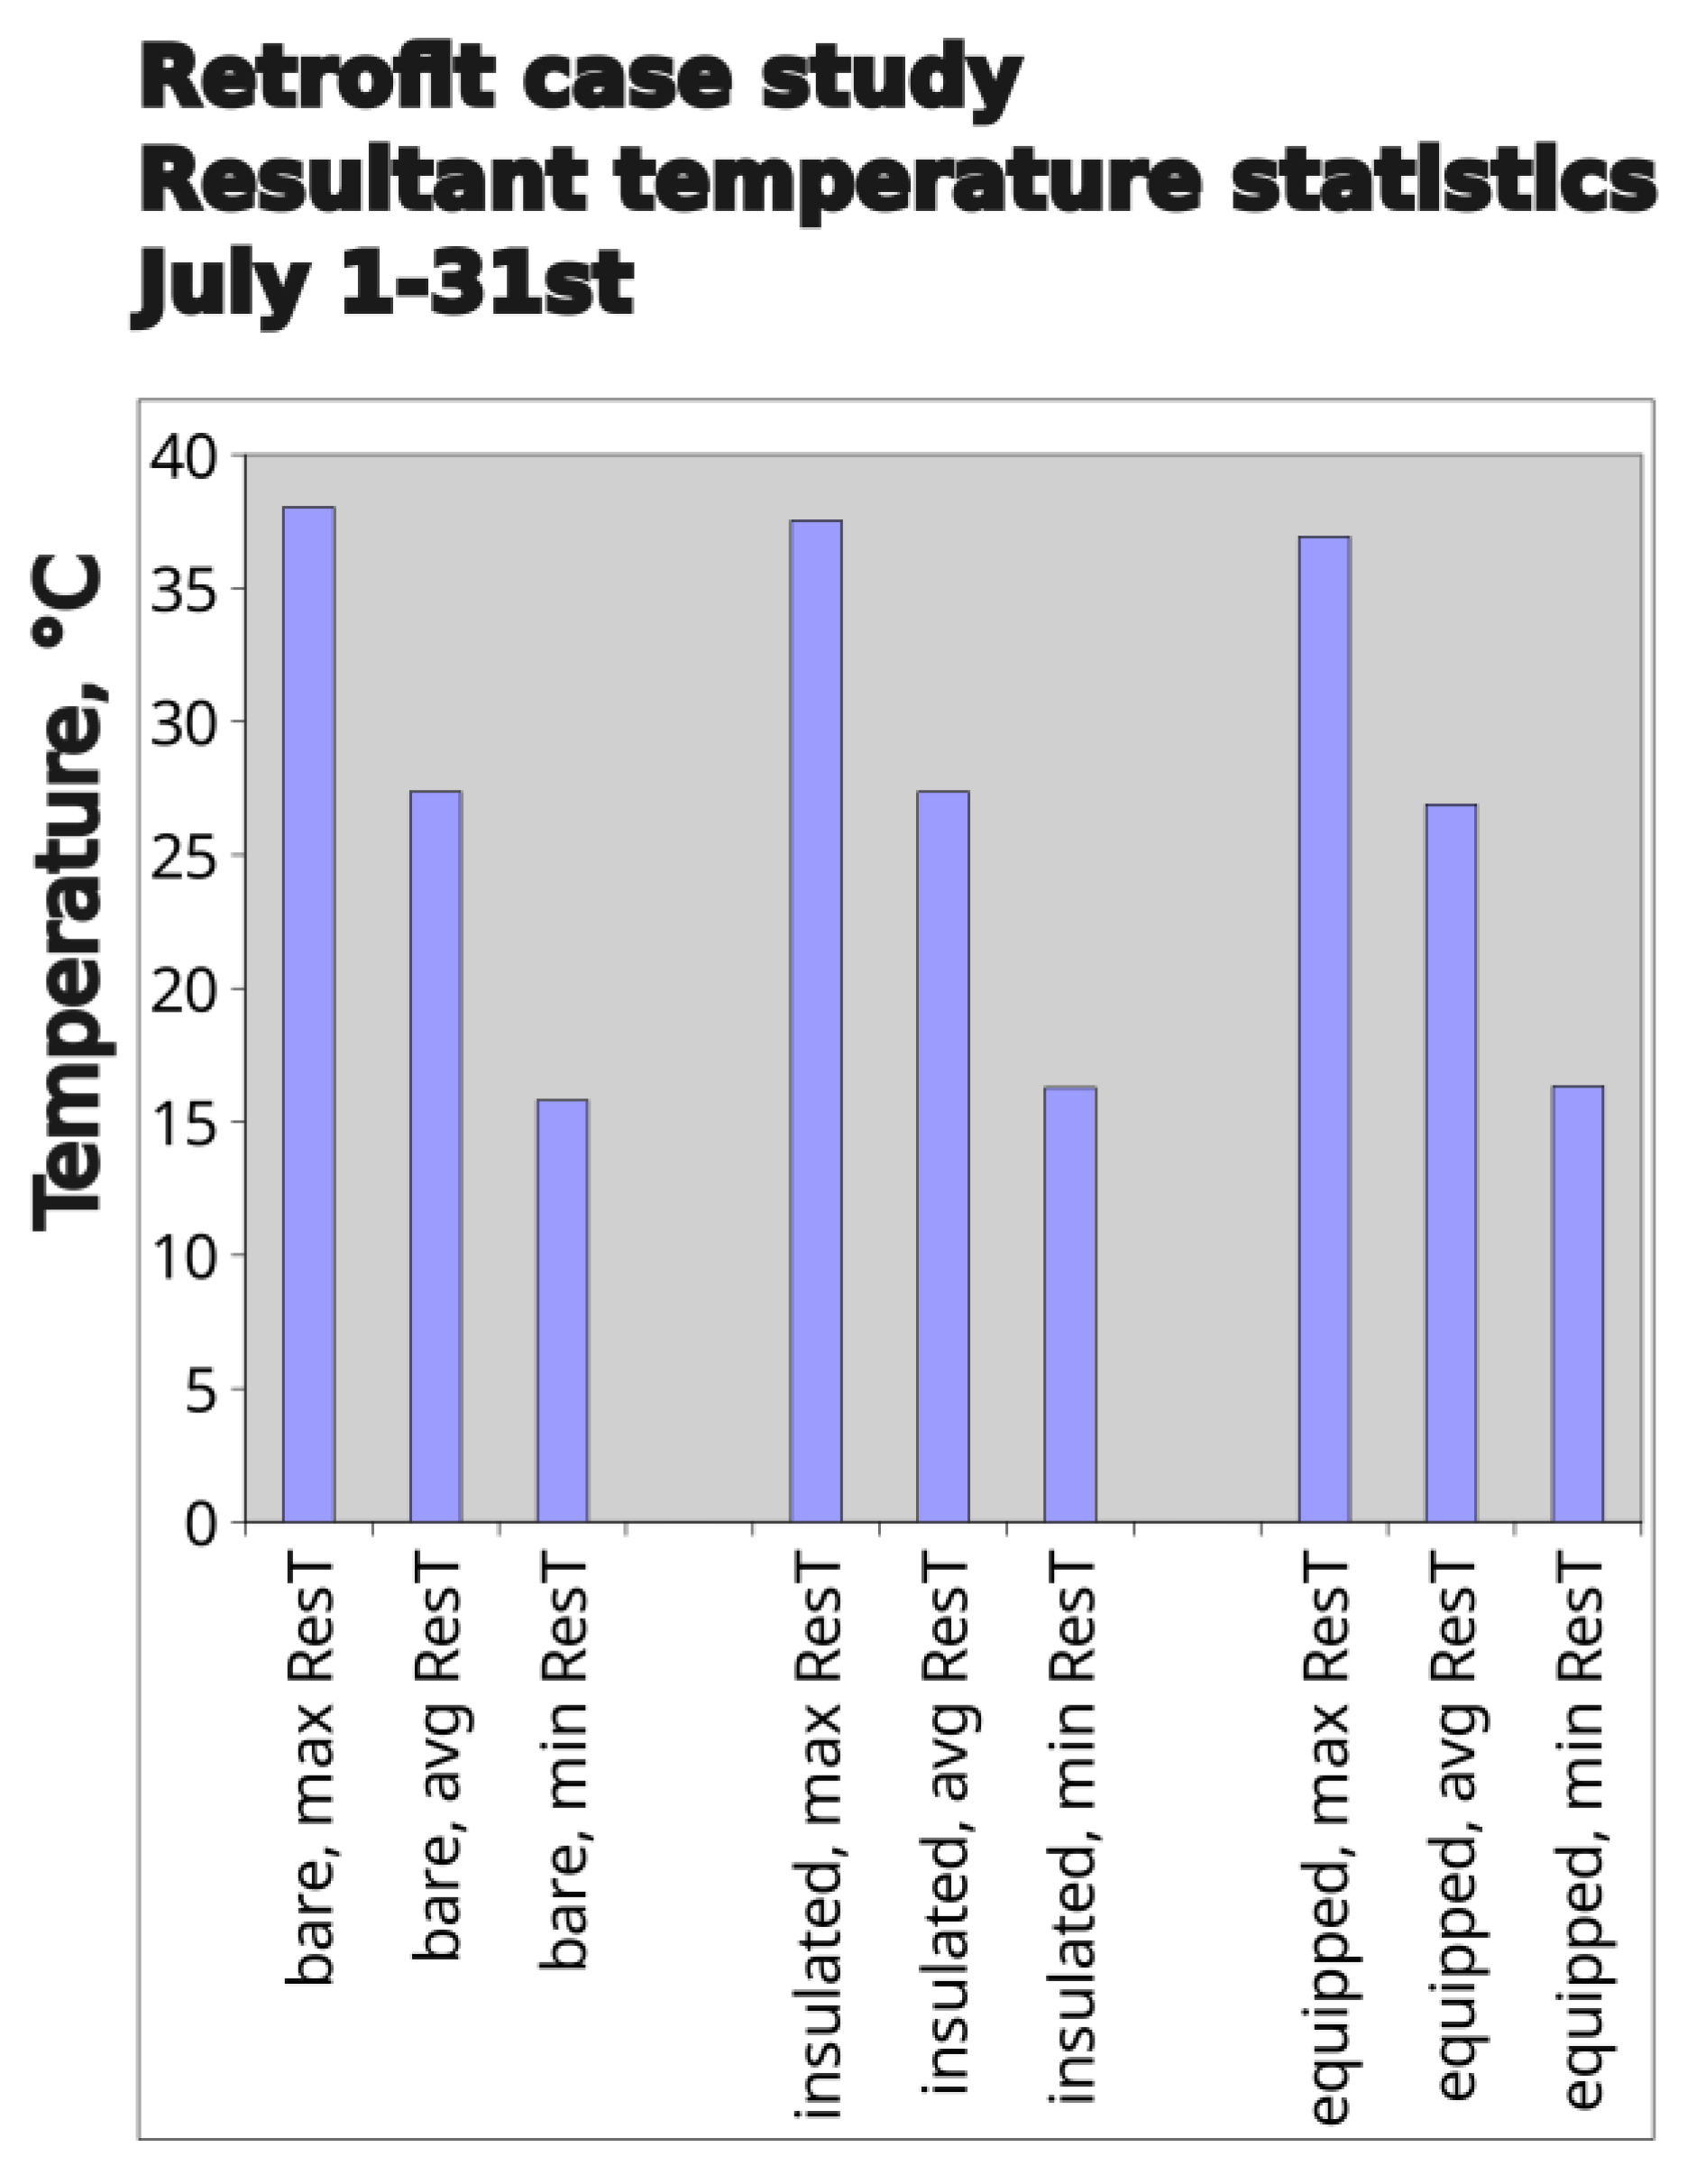
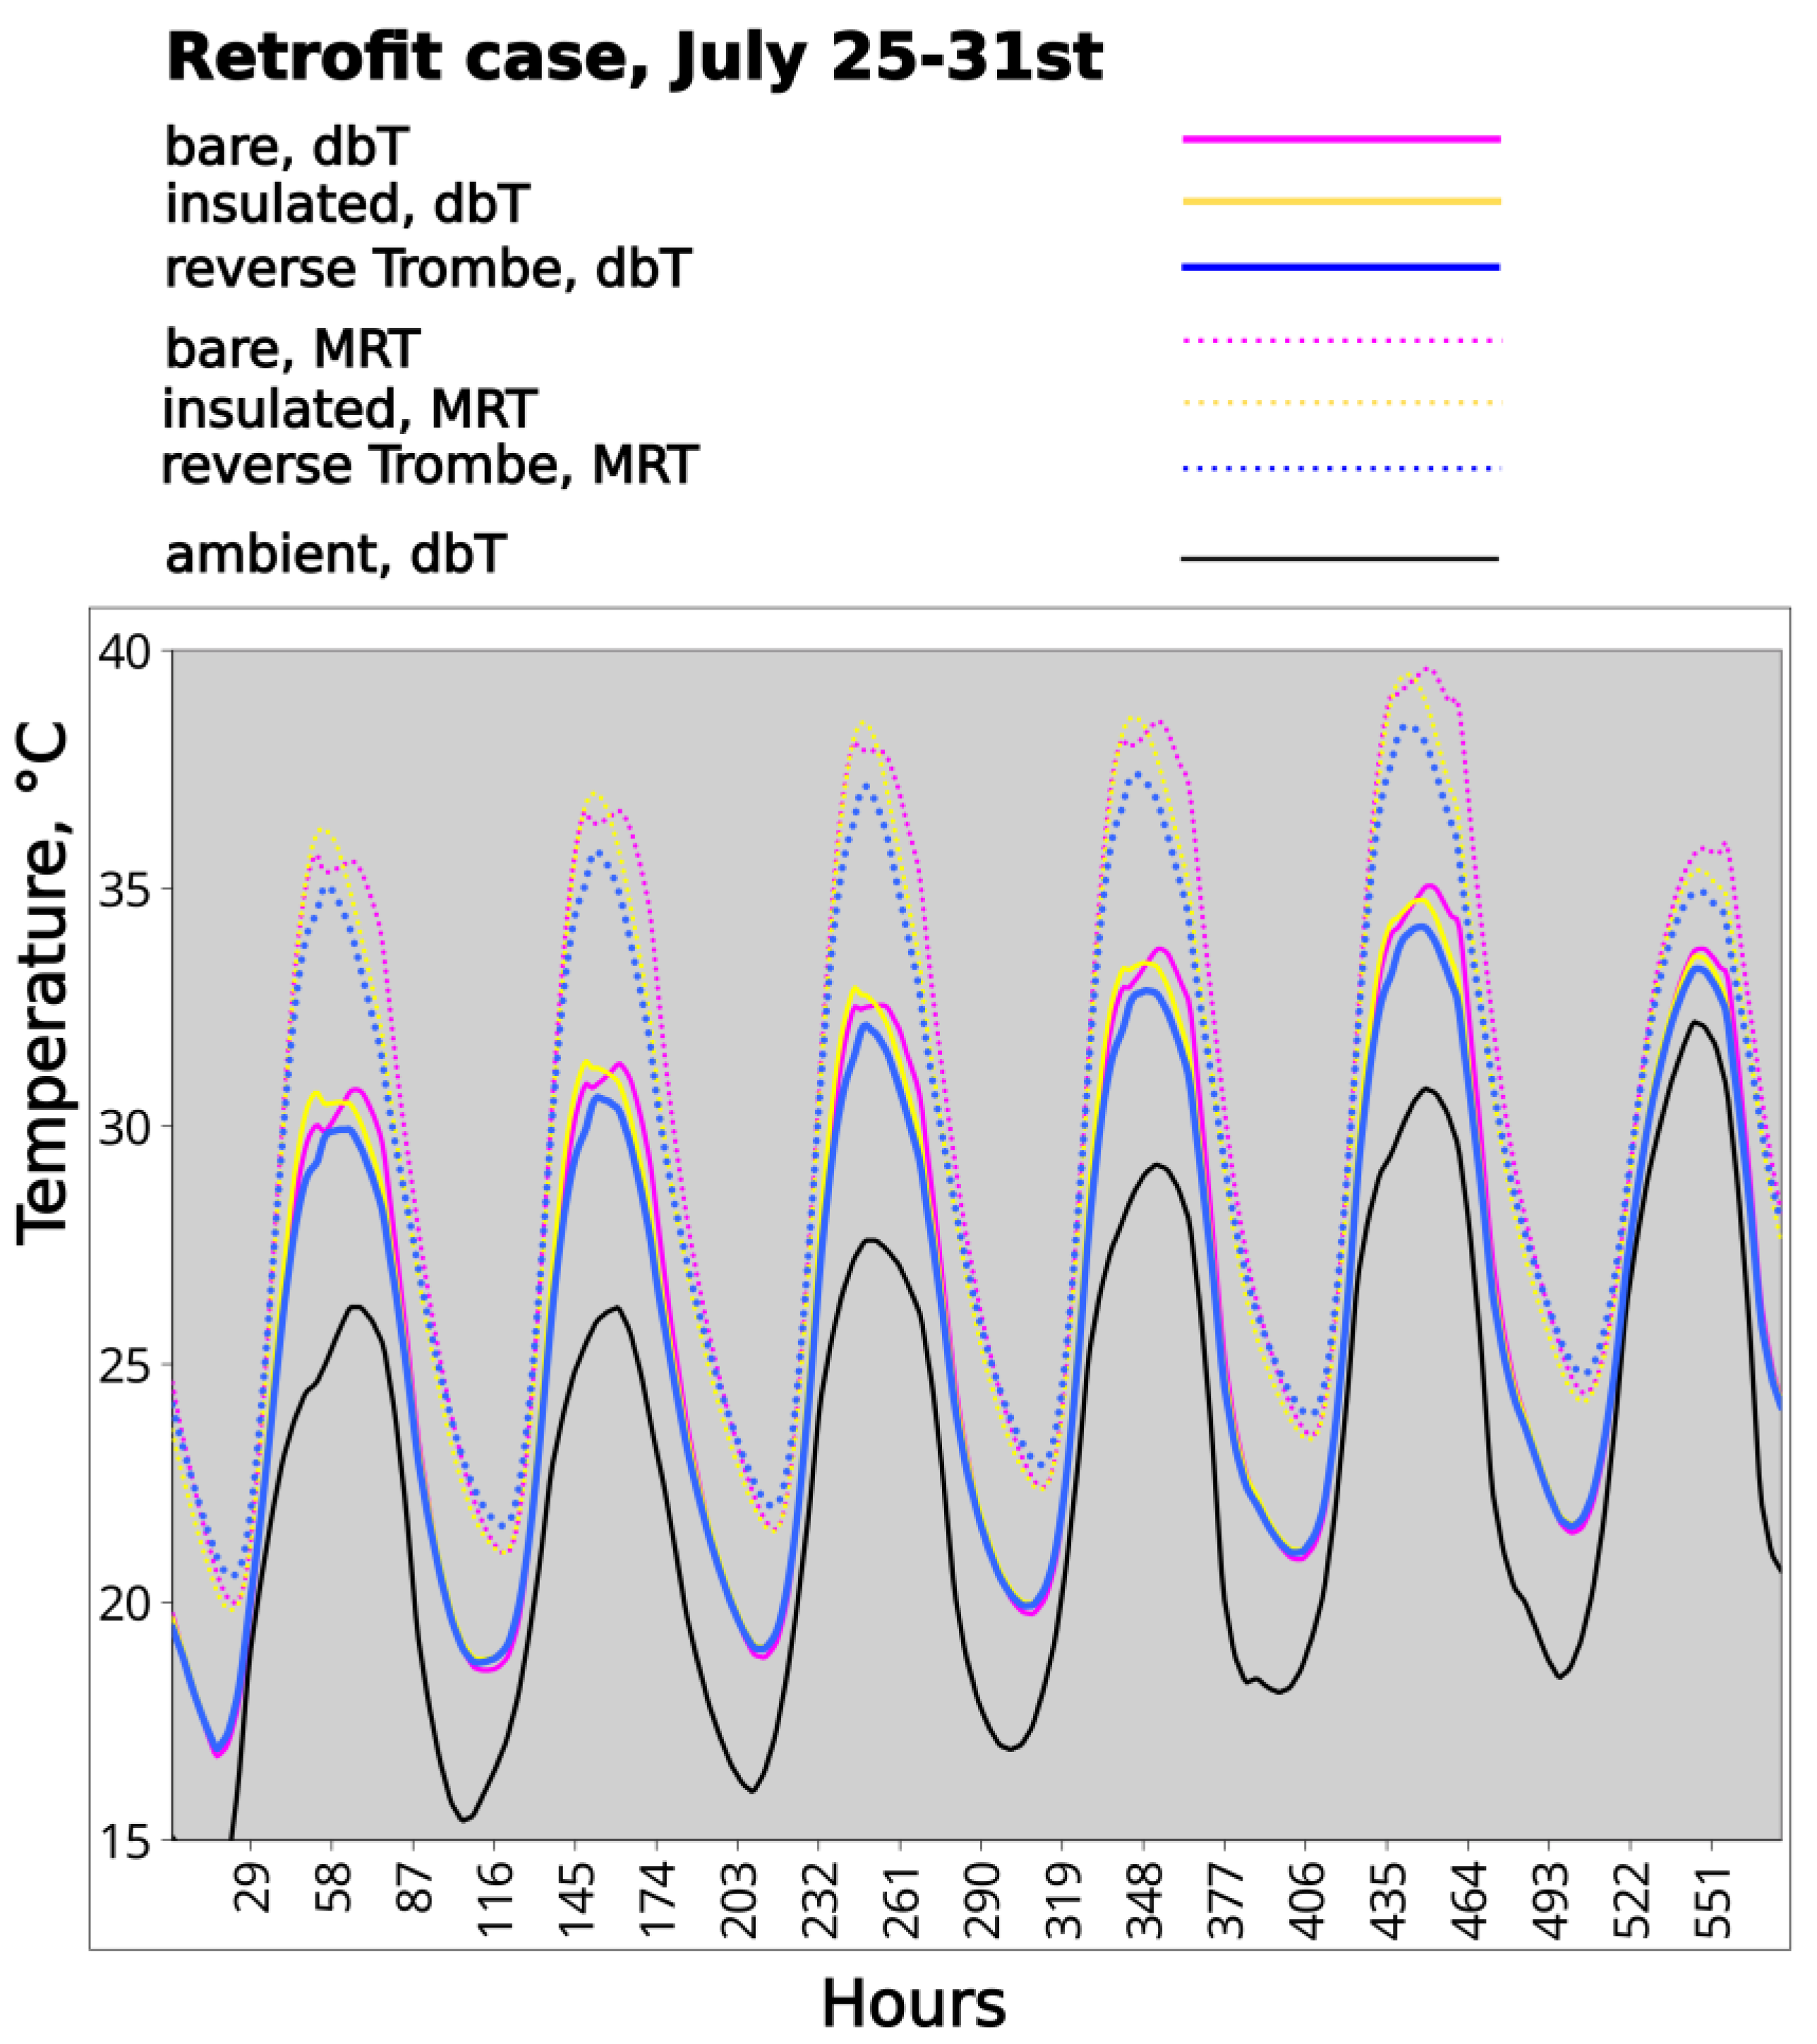
3.2. Results Regarding the Real-Life Case Study
In the real-case retrofit simulations, the reverse solar wall also produced a clear reduction in indoor temperatures. This was evident both in cumulative indicators, such as cooling degree-hours (CDHs) above 26 °C (
Figure 22), and in average dry-bulb air temperature and resultant temperature statistics (
Figure 23). These benefits were achieved despite the fact that the reverse solar wall cavity was not ventilated.
As with the prototypes, the advantage of the system was particularly pronounced in terms of mean radiant temperatures (MRTs) (
Figure 24). Moreover, the reverse solar wall configuration delivered more favourable results than the configuration where the wall was insulated on its interior face. The insulated wall exhibited higher thermal responsiveness and therefore larger temperature swings compared to the bare configuration, in which the thermal mass was exposed indoors.
4. Discussion
The monitoring results, together with the simulations on both the scale models, the enlarged prototype, and the real-case retrofit scenario, consistently demonstrated that the reverse solar wall configuration can lower indoor temperatures under summer conditions when solar access is desirable. This applies both to dry-bulb air temperatures and, even more markedly, to mean radiant and resultant temperatures. This effect is particularly relevant because the reverse solar wall strategy is most likely to be applied in situations where a room has abundant air exchange with the outside. The results also showed that the benefit increases when ventilation is enhanced (
Figure 18). In the present trials, ventilation was increased by enlarging the inlet and outlet areas, but it is reasonable to assume that airflow—and the related heat-purging effect—could also be increased by raising the stack height, and thus the height of the ventilation cavity.
For this heat-purging effect to occur, adequate solar access to the reverse solar wall is required. Such access may be provided either by direct beam radiation or by reflected radiation, as in both the prototypes and the case-study models, where beam radiation was reflected from light-coloured pavements. In other words, the solution can only be effective in spaces that receive at least moderate solar radiation.
The addition of the reverse solar wall produced beneficial effects in avoiding overheating even when the enclosing wall was thin and conductive—substantially reducing mean radiant temperatures to levels typical of more high-performing arrangements such as thick brick walls. This was also true when the wall masonry was very thin and lacked thermal inertia (
Figure 20). This suggests the usability of the solution in extremely low-cost scenarios, such as informal settlements, where dwellings are often enclosed by thin sheets. The fact that the solution works with inexpensive transparent enclosures, such as the thin polyethylene films used in the trials, reinforces its suitability for such contexts.
The confirmation of the advantage when thermal loads were measured under active air cooling also suggests that the technique can be applied not only in passive solutions but also in hybrid systems.
The real-case scenario demonstrated the practical feasibility of the technique. While the trials focused on summer performance, the strategy could also be adapted to winter by coupling the reverse solar wall with a removable thermal curtain. Such a curtain would help reduce the overall thermal transmittance of the enclosure and prevent winter heat losses through the reverse greenhouse effect in the wall.
The necessity of ventilation in the solar wall was shown to provide varying levels of advantage depending on the context. The benefits of the cavity in the unventilated case—particularly in terms of mean radiant temperatures—were evident in the small-scale model but less so in the real-case model. This suggests that, as expected, the wall thickness requires careful sizing, accounting for thermal delay, and should be assessed through dedicated dynamic thermal analysis, much as in the design of conventional massive solar walls.
The absence of this technique in the literature can be explained by a combination of contextual constraints. First, although the solution improves overheating avoidance, it depends on substantial solar access—a condition generally avoided where overheating risk is high. Its relevance is therefore limited to scenarios where high daylight levels generated by direct or reflected beam radiation are required in warm or hot climates. Such situations may include libraries, conference rooms, living rooms, or precision-work spaces such as drawing offices, but are relatively unfamiliar to many traditional cultures in hot climates, which historically prioritised solar exclusion [
31] (Oliver, 1987). Second, for the technique to be effective, the reverse solar wall must face roughly towards the equator, ideally within ±30–45° [
32], and it must directly face the exterior.
Third, while the thermal advantage derived from the solution is significant, it is not dramatic. The approach is therefore only reasonable where investment costs are low. Fourth, the building must either have an existing massive wall without external insulation, or one where the transparent cladding itself provides sufficient insulation and where solar gain in the cavity can be seasonally prevented (for example, by covering the glazing with thermal curtains). Otherwise, winter performance may be negatively affected. Fifth, the technique makes sense only in rooms that are well ventilated, so as to avoid indoor heat build-up.
On this basis, the most promising application of the technique appears to be a low-cost, seasonal reverse solar wall constructed from multiple layers of thin polyethylene films stretched across the massive part of an uninsulated, conductive wall (whether massive or lightweight). The inside face of this wall must receive sufficient solar radiation—either directly or by reflection of beam radiation—in buildings located in climates with hot or warm summers. This possibility is further conditioned by the requirement that the interior space should be shallow enough (ideally less than about 5 m deep) to permit solar access to the reverse solar wall. In such cases—where high levels of solar admission are necessary—the technique can reduce both air and radiant temperatures. This is a condition generally unaddressed by traditional bioclimatic strategies, which have relied almost exclusively on solar exclusion to prevent overheating.
Several limitations of this study must be acknowledged. First, the small-scale prototypes necessarily employed thin walls, and thus did not fully capture the transient thermal dynamics of full-scale walls. Conduction and convection processes do not scale linearly, limiting the representativeness of the prototypes. Second, the real-scale and retrofit cases were investigated only through simulations, calibrated against small-scale results. Third, as a proof-of-concept study, this work did not include a systematic parametric exploration, which is reserved for future research. Its aim was not to quantify all possible design parameter variations, but to identify a general technical direction. It is no coincidence that the idea of the reverse solar wall emerged from a real-world retrofit case and was subsequently tested through prototypes, rather than the other way round.
Nevertheless, the results point towards further promising developments beyond those explored here. One possibility is that greater benefits could be achieved by concentrating incoming solar radiation onto a reverse solar wall—for example, by using reflectors that collect radiation from a wider area. Such devices could be integrated architecturally as part of “super-lit” elements (such as light wells or reverberant surfaces) in indoor situations where it is desirable to maximise daylight without excessive thermal cost.
Further performance improvements may also be obtained by incorporating technological refinements already common in modern passive solar walls. These include: finishing the massive side of the reverse solar wall with low-emissivity linings; adding transparent insulation to the cavity enclosure (potentially beneficial both with and without ventilation); and replacing the solid massive wall with a water wall to increase both thermal inertia and conductive responsiveness [
34].
5. Conclusions
This study explored a simple, yet previously unexamined [
33], idea: using a fundamental and well-known passive solar device—the passive solar wall—not to supply heat to a room, but to remove it. In this way, the wall becomes what may be termed a reverse passive solar wall. The proposed solution is distinct from existing overheating-avoidance strategies for solar walls. It is not merely a way to limit a wall’s tendency to transmit heat indoors in summer, but a genuine—albeit moderate—cooling strategy, aimed at reducing indoor heat gains on walls that, for functional reasons, must admit full beam radiation (direct or reflected).
By inverting the conventional direction of heat transfer, the proposed configuration contrasts both with the dominant focus of contemporary passive-solar experimentation and with traditional bioclimatic strategies, which typically aim to reduce overheating by limiting solar admission.
Because the solar wall is here used in reverse, the applicability of the solution is necessarily narrower than that of standard solar walls. Its relevance is limited to indoor spaces that combine: (a) significant potential exposure to solar radiation; (b) limited depth, ensuring solar access to the wall; and (c) a requirement to maintain high daylight levels in warm or hot climates—i.e. situations where reducing solar admission to prevent overheating would create greater disadvantages (e.g. insufficient daylight) than benefits.
The results from monitoring the small-scale prototypes, as well as from simulations of both theoretical and real-case models, confirm that the technique provides a measurable thermal benefit in the hot season. While the reductions in indoor temperature are not dramatic, they are consistent and robust. This suggests that additional performance gains may be achievable through targeted optimisations—such as concentrating incident solar radiation onto the reverse solar wall using reflectors or other optical devices, and/or incorporating transparent superinsulation into the solar wall enclosure.
Acknowledgments
With regards to the prototype-based case, I wish to thank my dear wife Marcella who, without complaining, accepted that I spent my August’s mornings of the beautiful summer of Trapani trafficking on a rooftop with my prototype samples, rather than on a beach. With regards to the real-world case study, I would like to dedicate the work, with moved commotion, to the memory of Alberto Minazzi, friend Architect, who has been for many years the heart of the group of volunteers who made the magic situation of self-directed, self-built, experimental, environmental-friendly reuse of the “Casamatta” building in Malnate possible. Dear Alberto, thank you for everything. You are sorely missed by many and your example will serve generations.t.
References
- McCullagh, The Solar Greenhouse Book, Rodale Press, Emmaus, Pennsylvania, 1978.
- Shapiro, A.M. The Homeowner's Complete Handbook for Add-On Solar Greenhouses and Sunspaces: Planning, Design, Construction, Rodale Press, Emmaus, Pennsylvania, 1984.
- Gustavsen, A.; Griffith, B.T.; Arasteh, D. Natural Convection Effects in Three-Dimensional Window Frames with Internal Cavities, ASHRAE Transactions, 107 (2), 2001.
- Z. Hu, W. He, J. Ji, S. Zhang, A review on the application of Trombe wall system in buildings, Renewable and Sustainable Energy Reviews, 70, 2017, 976–987. [CrossRef]
- Balcomb, J.D., Editor, Passive Solar Buildings, The MIT Press, Cambridge, Massachusetts, 1992.
- Saadatian, O.; Sopian, K.; Lim, C.H.; Asim, N.; Sulaiman, M.Y. Trombe walls: A review of opportunities and challenges in research and development, Renewable and Sustainable Energy Reviews, 16, 8, 2012, 6340-6351. [CrossRef]
- Mazria, E. The Passive Solar Energy Book, Rodale Press, Emmaus, Pennsylvania, 1980.
- Mokni, A.; Lashin, A.; Ammar, M. Mhiri, H. Thermal analysis of a Trombe wall in various climatic conditions: An experimental study, Solar Energy, 243, 2022, 247–263. [CrossRef]
- Prozuments, A. Borodinecs, G. Bebre, D. Bajare, A Review on Trombe Wall Technology Feasibility and Applications, Sustainability, 2023, 15, 3914. [Google Scholar] [CrossRef]
- Duffie, J.A.; Beckman, W.A. Solar engineering of thermal processes, Wiley, New York, 2013.
- Szyszka, J. From Direct Solar Gain to Trombe Wall: An Overview on Past, Present and Future Developments, Energies, 2022, 15, 8956. [CrossRef]
- Michel, J. (1973). Utilisation de l’énergie solaire, L’Architecture d’Aujourd’hui, 167, 88–96.
- Burek, S.A.M.; Habeb, A. Air flow and thermal efficiency characteristics in solar chimneys and Trombe Walls, Energy and Buildings, 39, 2007, 128–135. [CrossRef]
- Ong, K.S.; Chow, C.C. (2003). Performance of a solar chimney, Solar Energy, 74 (1), 1–17. [CrossRef]
- G. Gan, A parametric study of Trombe walls for passive cooling of buildings Energy and Buildings, 27, 1, 1998, 37-43. [CrossRef]
- Chan, H.Y.; Riffat, S.B.; Zhu, J. Review of passive solar heating and cooling technologies, Renewable and Sustainable Energy Reviews, 14, 2010, 781–789. [CrossRef]
- F. Stazi, A. F. Stazi, A. Mastrucci, C. di Perna, Trombe wall management in summer conditions: An experimental study, Solar Energy, 86 (2012) 2839–2851. [CrossRef]
- Rabani, M.; Kalantar, V.; Dehghan, A.A.; Faghih, A.K. Experimental study of the heating performance of a Trombe wall with a new design, Solar Energy, 118, 2015, 359–374. [CrossRef]
- Dabeh, M.; Elbably, A. Ventilated Trombe wall as a passive solar heating and cooling retrofitting approach; a low-tech design for off-grid settlements in semi-arid climates, Solar Energy, 122, 2015, 820-833. [CrossRef]
- Hong, X.; Leung, M.K.H.; He, W. Effective use of venetian blind in Trombe wall for solar space conditioning control, Applied Energy, 250, 2019, 452–460. [CrossRef]
- Simões, N.; Manaia, M.; Simões, I. Energy performance of solar and Trombe walls in Mediterranean climates, Energy, 234, 2021, 121197. [CrossRef]
- Kaushika, N.D. , Sumathy, S K. olar transparent insulation materials: a review, Renewable and Sustainable Energy Reviews, 7, 2003) 317–35. [CrossRef]
- Wong, I.L.; Eames, P.C. Perera, R.S. A review of transparent insulation systems and the evaluation of payback period for building applications, Solar Energy, 81 (2007) 1058–1071. [CrossRef]
- Świrska-Perkowska, J.; Kucharczyk, A., Wyrwał, J. Energy Efficiency of a Solar Wall with Transparent Insulation in Polish Climatic Conditions, Energies, 13, 2020, 859. [CrossRef]
- Ciampi, M.; Leccese, F.; Tuoni, G. Ventilated facades energy performance in summer cooling of buildings, Solar Energy, 75, 6, 2003, 491-502. [CrossRef]
- Prieto, A.; Auer, A.; Klein, T. Passive cooling & climate responsive façade design: Exploring the limits of passive cooling strategies to improve the performance of commercial buildings in warm climates, Energy and Buildings, 175, 2018, 30-47. [CrossRef]
- Lin, Z.; Song, Y.; Chu, Y. An experimental study of the summer and winter thermal performance of an opaque ventilated facade in cold zone of China, Building and Environment, 218, 2022, 109108. [CrossRef]
- Ibañez-Puy, M.; Vidaurre-Arbizu, M.; Sacristán-Fernández, J.A.; Martín-Gómez, C. Opaque Ventilated Façades: Thermal and energy performance review, Renewable and Sustainable Energy Reviews, 79, 2017, 180-191. [CrossRef]
- Cuce, P.M.; Cuce, E. Ventilated Facades for Low-Carbon Buildings: A Review. Processes, 13, 7, 2025, 2275. [CrossRef]
- Gian Luca Brunetti, 2025 dataset with the models and data for this study, https://figshare.com/articles/dataset/reverse_greenhouse_effect_by_means_of_a_reverse_solar_wall_in_prototypes_in_a_retrofit_case_study_Casamatta_building_in_Malnate_Varese_Italy_featuring_a_reverse_solar_wall_/29975272.
- Oliver, P. Dwellings: The House Across the World, Phaidon Press, London, 1987.
- Dekay, M.; Brown, G.Z. Sun Wind and Light. Architectural Design Strategies, Wiley, New York, 2014.
- Santamouris, M.; Kolokotsa, D. Passive cooling dissipation techniques for buildings and other structures: The state of the art, Energy and Buildings, 57, 2013, 74-94. [CrossRef]
- Hassanain, A.A. Hokam, E.M. Mallick, T.K. Effect of solar storage wall on the passive solar heating constructions, Energy and Buildings, 43, 2011, 737–747. [CrossRef]
Figure 1.
Dimensions the small-scale prototypes.
Figure 1.
Dimensions the small-scale prototypes.
Figure 2.
Position of the samples on the roof, as seen from the viewpoint of the sun at noon in mid-August. Image created with Google Earth (note that the cast shadows are unrelated to the viewpoint).
Figure 2.
Position of the samples on the roof, as seen from the viewpoint of the sun at noon in mid-August. Image created with Google Earth (note that the cast shadows are unrelated to the viewpoint).
Figure 3.
The prototypes placed on the roof.
Figure 3.
The prototypes placed on the roof.
Figure 4.
Difference between the “bare” model (on the left) and the model adopting the reverse Trombe enclosure (on the right).
Figure 4.
Difference between the “bare” model (on the left) and the model adopting the reverse Trombe enclosure (on the right).
Figure 5.
Small-scale model in ESP-r, including the solar obstructions present on site.
Figure 5.
Small-scale model in ESP-r, including the solar obstructions present on site.
Figure 6.
Nodes and connections of the ventilation network in the model featuring the inverse Trombe configuration. Blue nodes = chamber; green nodes = inverse solar gain cavity.
Figure 6.
Nodes and connections of the ventilation network in the model featuring the inverse Trombe configuration. Blue nodes = chamber; green nodes = inverse solar gain cavity.
Figure 7.
Air temperatures in the monitored prototypes and simulation models on 17–18 August.
Figure 7.
Air temperatures in the monitored prototypes and simulation models on 17–18 August.
Figure 8.
Mean absolute error and root mean squared error in the validation simulations compared with measured air temperature data.
Figure 8.
Mean absolute error and root mean squared error in the validation simulations compared with measured air temperature data.
Figure 9.
The room (outlined in red) within its built context, seen from the sun’s position at noon on the summer solstice.
Figure 9.
The room (outlined in red) within its built context, seen from the sun’s position at noon on the summer solstice.
Figure 10.
Thermal zones (in red and green) and solar obstructions (in blue) in the retrofit case model.
Figure 10.
Thermal zones (in red and green) and solar obstructions (in blue) in the retrofit case model.
Figure 16.
Temperatures simulated in the small-scale models between 13–18 August.
Figure 16.
Temperatures simulated in the small-scale models between 13–18 August.
Figure 17.
Temperature statistics in the small-scale models between 1 June and 31 August.
Figure 17.
Temperature statistics in the small-scale models between 1 June and 31 August.
Figure 18.
Temperatures simulated in the real-scale models between 13–18 August.
Figure 18.
Temperatures simulated in the real-scale models between 13–18 August.
Figure 19.
Cooling Degree Hours (CDHs) above 26 °C predicted in the various cases in the real-scale models. Legend: bare: reference case; novent; with unventilated reverse solar wall; vent: with reverse Trombe wall; more_vent: with reverse Trombe wall featuring greater inlets and outlets 4 times greater; bare_thin: like the reference case, but with thinner (5.5 cm) walls; like vent_thin: like the reverse Trombe wall case, but with thinner walls; bare_sheet: like the reference case, but with walls constituted by painted aluminium sheets (2 mm thick); vent_sheet: like the reverse Trombe wall case, but with walls constituted by painted aluminium sheets.
Figure 20.
Temperatures in the real-scale “bare” models and models with the reverse Trombe wall, comparing cases with thinner (5.5 cm) brick walls and with 1 mm aluminium sheet walls.
Figure 20.
Temperatures in the real-scale “bare” models and models with the reverse Trombe wall, comparing cases with thinner (5.5 cm) brick walls and with 1 mm aluminium sheet walls.
Figure 21.
Cooling loads between 13–18 August in different retrofit scenarios. The option “morevent_equipped” includes reverse solar cavity openings increased fourfold.
Figure 21.
Cooling loads between 13–18 August in different retrofit scenarios. The option “morevent_equipped” includes reverse solar cavity openings increased fourfold.
Figure 22.
Cooling Degree Hours (CDHs) above 26 °C for the three retrofit configurations tested in July.
Figure 22.
Cooling Degree Hours (CDHs) above 26 °C for the three retrofit configurations tested in July.
Figure 23.
Resultant temperature statistics for the retrofit options in July.
Figure 23.
Resultant temperature statistics for the retrofit options in July.
Figure 24.
Free-floating temperatures of the retrofit options between 25–31 July.
Figure 24.
Free-floating temperatures of the retrofit options between 25–31 July.
|
Disclaimer/Publisher’s Note: The statements, opinions and data contained in all publications are solely those of the individual author(s) and contributor(s) and not of MDPI and/or the editor(s). MDPI and/or the editor(s) disclaim responsibility for any injury to people or property resulting from any ideas, methods, instructions or products referred to in the content. |
© 2025 by the authors. Licensee MDPI, Basel, Switzerland. This article is an open access article distributed under the terms and conditions of the Creative Commons Attribution (CC BY) license (http://creativecommons.org/licenses/by/4.0/).