
Submitted:
26 August 2025
Posted:
27 August 2025
You are already at the latest version
Abstract
p-Phenylenediamine antioxidants (ppDs) and their quinone derivatives (ppDs-Q) are key additives in rubber products with strong toxicity, persistence, and increasing aquatic concentrations, though global data scarcity hinders risk assessment. Thisstudy addressed limitations of manual data extraction by using a python-based toolkit integrating ocR and Spacy neural networks to eficiently extract key information (concentrations,locations, media) from unstructured literature, compiling globaldata via Web of science, scopus, and pubMed. ppDs/ppDs-Q show significant concentration differences across global aquaticmedia: in artificial water, 6ppD in road runoff reaches 80019,000 ng/L (Seattle, UsA) and 907 ng/L (china's Greater Bay Area)with lower levels in wastewater effluents; in natural water, 6ppD-Q varies regionally (2003,500 ng/L in Us rivers, 290890 ng/lin Canadian rivers, 0.2611.3 ng/L in chinese rivers); snowmelt water shows high 6ppD.Q (19.0 g/L in seattle, 367 ng/L aver.age in Canadian cold cities,. species sensitivity follows patterns: salmoniformes are most sensitive to 6PPD/6PPD-Q (LC/EC5O <0.001 mg/L), followed by echinoderms/mollusks, with lower sensitivity in lower trophic organisms. Coupled analysis showsUS river 6PpD-Q exceeds ultra-sensitive organisms' thresholds, chinese rivers pose subchronic risks to benthic organisms,and widespread detection in human fluids indicates continuous exposure. This "ocR-neural network" framework resolvesmanual extraction bottienecks, provlding an extensible paradigm for other bolutants, wnle conclusons support regulationsecological protection,and risk management for PPDs.
Keywords:
Data Extraction
; Concentration Compilation
; Environmental Management
; Pollutant Regulation
1. Introduction
p-Phenylenediamine antioxidants (PPDs) and their quinone derivatives (PPDs-Q) function as critical anti-aging and anti-ozonant additives in rubber products (notably tires), with their usage proliferating in tandem with the rubber industry’s expansion. PPDs and PPDs-Q exhibit remarkable persistence in aquatic environments and possess long-range transport potential via runoff and atmospheric deposition. During tire abrasion, these antioxidants are released as debris, transported by hydrological and atmospheric processes, and ultimately accumulate in global water bodies [1]. Structurally, PPDs contain benzene rings that undergo ozonolysis during photochemical reactions, yielding benzoquinone moieties. These transformation products typically exhibit far greater toxicity than their precursors. For instance, 6PPD (N- (1,3-dimethylbutyl)-N’- (p-tolyl)benzene-p-diamine) disrupts the growth and reproduction of freshwater cladocerans at environmental concentrations, while its quinone derivative (6PPD-Q) displays even higher toxicity, significantly reducing sediment microbial community diversity at low exposure levels (e.g., ≤10 ug/L) . PPDs and their quinone products have been confirmed to induce immunotoxicity, embryotoxicity, and neurotoxicity , highlighting the need for systematic compilation of their environmental concentrations to support potential biotic risk analysis. Conventional environmental concentration data curation relies on manual extraction from literature, which suffers from prolonged cycles, extraction errors, and inconsistent recording standards, potentially undermining the comprehensiveness and accuracy of global concentration compilations. To address these limitations, we integrated OCR with pre-trained neural networks: OCR facilitates efficient extraction of text from unstructured literature (e.g., scanned articles or PDFs), while pre-trained neural networks enhance accuracy in literature screening, string recognition of key metrics (e.g., concentration values), and entity extraction (e.g., geographic locations and environmental media), thereby mitigating manual errors and accelerating data curation. We curated studies reporting field water and sediment concentrations of target pollutants, then developed a Python-based pipeline for machine learning-augmented concentration data compilation. Our study employs machine learning to screen literature and compiles global aqueous concentrations of PPDs and their quinone oxidation products (PPDs-Q). Our work aims to inform the formulation of clean emission regulations for p-phenylenediamines, support environmental management decisions, and demonstrate a novel machine learning-enabled framework for pollutant concentration data extraction and compilation.
2. Materials and Methods
2.1. Data Sources
The core data of our study were derived from academic literature containing acute toxicity data and environmental concentration data of p-phenylenediamine compounds (PPDs) and their quinone derivatives (PPDs-Q). Literature retrieval was conducted across three major academic databases: Web of Science, Scopus, and PubMed. The retrieval time range covered from the establishment of each database to July 2025 to ensure comprehensive coverage of existing research findings.
Initially, retrieval was performed in the databases using the keywords topics = ’p-Phenylenediamine’ and topics = ’p-Phenylenediamine Quinone’, followed by more comprehensive screening through machine reading. All codes are accessible via the GitHub repository: https://github.com/renarddsfsdfdsfefadfsdfd/Brianzhang-ARTI.
The entire code framework in the study, including the OCR module and pre-trained neural networks, was implemented using Python (Version == 3.10). The corresponding versions of other relevant packages are as follows: PyMuPDF == 3.14.7, requests == 2.28.1, spacy == 3.4.4, PyQt5 == 5.15.11, and pip == 25.0.1. Local code repositories can be updated to the preset versions using "upgrade-pip". The neural network training materials involved in the study have been uploaded to the Python Package Index (PyPI) as datasets ( It can be installed and invoked using the command pip install pollutants-annotations.).
2.2. Explanation of Logical Implementation
A web DOI recognition tool named DOIE was constructed using Python. Formal description was conducted through set theory, string pattern matching, and quantitative screening rules, with its core being a logical chain of "pattern definition - set screening - verification output" based on the standardized DOI format.
The mathematical definitions of inputs and targets are based on set theory: Let the input HTML text content be a string set , where represents the k-th character in the HTML, and L is the total length of the HTML text (i.e., the total number of characters). Define the DOI target set D, whose elements are strings conforming to the international standard format of DOI, i.e., satisfies specific format rules — structured as "prefix/suffix". The prefix starts with "10." followed by 4–9 digits (e.g., 10.1038); the suffix consists of letters, digits, and special symbols (such as -._;()/:@) and contains no spaces or line breaks.
The patterned definition of the DOI format constitutes the core matching rule, which can be strictly defined through mathematical patterns: Let the structure of be , where the prefix , and N is a string composed of 4–9 digits (i.e., ); the suffix , representing a non-empty string composed of letters, digits, and allowed special symbols; "/" is a fixed separator.
This pattern can be simplified using regular expression mathematical symbols as
where ≡ denotes "matching pattern", represents 4–9 digits, and denotes the allowed sequence of suffix characters.
The process of extracting DOIs from HTML is essentially set screening: First, preliminary screening is implemented through substring traversal and pattern matching. Define a matching function . For any continuous substring in the HTML, if (i.e., the substring conforms to the DOI format), then ; otherwise, . The tool traverses all possible substrings in the HTML text, calculates , and marks substrings with as candidate DOIs.
Subsequently, deduplication and verification are performed: Since duplicate DOIs may exist in HTML (e.g., the same literature appearing in different positions), define a deduplication mapping , where is a set with no duplicate elements, i.e., , where ∼ is the "string equality" equivalence relation used to remove duplicate elements. Meanwhile, each element d in is re-verified to check if it satisfies the structural rules of P and S (e.g., the number of digits in the prefix, no illegal characters in the suffix), and finally, the verified element set is retained.
The finally extracted DOI set is output in the form of a text file. Let (i.e., the total number of extracted DOIs), then the output file dois.txt contains the set representation:
A summary reading tool named NERRE was constructed using Python. This tool realizes the identification and quantitative statistics of literature keywords based on regular pattern matching, and completes the transformation from raw literature data to structured analysis results through mathematical set definitions, indicator functions, and statistical measure construction.
The input literature set is defined as , where N is the total number of literatures. Each literature contains abstract text and auxiliary information such as title, authors, and year. Meanwhile, 4 core keyword pattern sets are defined : the PPD-related pattern set , where each is a regular expression ; the sediment-related pattern set ; the water-related pattern set ; and the organism-related pattern set . In addition, the concentration-related pattern set , providing a basis for subsequent combined identification.
Statistical measures and result quantification convert identification results into analyzable indicators. Based on the indicator function , the number of literatures containing various keywords is defined: the number of literatures containing PPDs , the number of literatures containing sediments , the number of literatures containing water bodies , and the number of literatures containing organisms . Similarly, based on , the number of literatures with "keyword-concentration" combinations is defined, such as the number of literatures with sediment-concentration combinations , the number with water body-concentration combinations , and the number with organism-concentration combinations . The signal plot generated by "generate signal plot" in the code is a visualization of the indicator function results: the horizontal axis is the literature index , the vertical axis is the value of (0 or 1), and the height of the bar chart directly reflects the presence of keywords, forming "signal peaks" to intuitively present distribution characteristics.
Consistent with the logical implementation framework outlined in the methodology, refined entity extraction following keyword signal peak detection is formalized using set theory and function mapping, aligning with the mathematical rigor established for DOI extraction and keyword detection.
The target entity type set is defined as , where each element corresponds to domain-specific entities: (pollutant names), (geopolitical entities), (concentration values), (environmental media), (toxicity metrics), (biological species), and (exposure pathways). Each type is associated with a semantic function (where is the set of descriptive strings), e.g., ="Measured concentration of PPDs/PPDs-Q in water, sediment, or biota".
The annotated training dataset is structured as , where each sample comprises a text string (length ) and an annotation set . Each annotation in is a triple , with as the start position, as the end position, and as the entity type, satisfying constraints and .
For unstructured text processing, a chunking function is defined to decompose the input PDF text T (total length ) into manageable sub-texts, where the chunk set satisfies:
Here, denotes the fixed chunk length, ensuring semantic integrity of each sub-text , analogous to the segmentation strategy used in structured DOI extraction.
The entity recognition model is denoted as , where represents model parameters and is the set of chunk-level predictions. Each contains entities with , , and , corresponding to the start position, end position, and type of the k-th entity in .
Model training optimizes by minimizing batch-based loss over . For I training iterations, each iteration involves: shuffling samples to form batches with size (capped at 32); computing loss for each batch; summing losses to get with average loss ; updating via gradient descent to minimize . Post-training, optimized parameters are saved, and a loss curve (where is the i-th iteration average loss) visualizes convergence.
Final entity extraction results form a type-entity mapping set , where (entity texts of type e) is defined as:
Each undergoes deduplication and sorting to generate structured outputs (text/CSV/JSON), enabling conversion from unstructured literature to analysis-ready data, supporting subsequent ecological risk assessment as defined in the methodology.
2.3. Quality Assurance and Quality Control
2.3.1. DOI Extraction and Literature Title Recognition Module
For the study, a QAQC framework centered on manual verification was constructed for six datasets containing 6,360 literatures.
Consistent with the indicator function defined in the reference document (where denotes the detection of a keyword in literature and 0 denotes non-detection), core variables for detection results are defined as follows: Let represent machine detection results, where is the literature index () and corresponds to the four keyword categories of PPD, Sediment, Water, and Biology, respectively; indicates that the machine detected keyword j in literature i, and indicates non-detection . Let represent manual verification results, following the same 1/0 assignment rule as , with discrepancies between independent annotations by two researchers resolved through third-party arbitration to determine final values.
To quantify discrepancies between machine and manual detection, a difference variable is defined as
where indicates inconsistent detection results between the two methods, and indicates consistent results, adhering to the binary detection logic of keyword screening in the reference document .
A stratified random sampling method was used to select 5% of literatures from each dataset, resulting in a verification sample of literatures. The overall difference level in the sample was characterized by the sample mean difference, calculated as
which reflects the average inconsistency rate across all four keyword categories in the verification sample, extending the keyword counting logic (e.g., ) in the reference document . The variability of these discrepancies was quantified by the sample standard deviation:
To statistically verify the consistency between machine and manual detection, a one-sample t-test was conducted with the null hypothesis (the population mean difference is 0, indicating no significant difference) and the alternative hypothesis . The t-statistic for this test was calculated as
where the denominator represents the standard error of the mean, is the degrees of freedom, and is the significance level; if , is accepted, indicating non-significant differences between the two detection methods.
For the detection of "keyword-concentration" co-occurrences (e.g., for water-concentration co-occurrences in the reference document ), the same verification logic applies, with a co-occurrence difference variable defined as
where and denote machine and manual annotations of co-occurrence results, respectively. A t-test confirming ensures the accuracy of core co-occurrence statistics such as . All test results, including sample size, t-values, and P-values, are archived alongside the datasets to maintain traceability, consistent with the transparency framework of the reference document.
2.3.2. Neural Networks Entity Recognition Module
To ensure the stability of the entity recognition model during training, loss dynamics were monitored as a core quality assurance and quality control (QAQC) metric. For each training iteration, loss was computed based on the conditional probability of predicted entity sequences relative to manually annotated ground truth, following a conditional random field (CRF) framework consistent with the model structure.
Let denote the training dataset, where represents a text sequence of length , and denotes its corresponding true label sequence with labels drawn from the predefined entity set . For each text sequence , the model outputs two types of scores: emission scores (indicating the confidence of assigning label l to the t-th token) and transition scores (quantifying the likelihood of transitioning from label to ).
The total score of a predicted label sequence for text is calculated as:
where "start" and "end" are dummy states representing the beginning and termination of the label sequence, respectively.
The conditional probability of the true label sequence given text is defined as:
where denotes the set of all valid label sequences for .
The per-sample loss is formulated as the negative log-likelihood of the true sequence:
For a batch containing B samples, the batch loss is computed as the average of per-sample losses:
During training, losses were aggregated across M batches per iteration to derive the iteration-averaged loss:
QAQC criteria mandated that exhibit a monotonically decreasing trend with fluctuations less than 5% over 10 consecutive iterations, ensuring the model converged to a stable minimum.
3. Results and Discussions
3.1. Discussion on Species-Specific Sensitivity to 6PPD, 6PPD-Q, and DNPD
In the literature mining of species toxicity data, we obtained toxicity data of various organisms, and all these data used mortality or inhibition as the core observation endpoints to determine acute toxicity effects, ensuring consistency in the criteria for toxicity determination across all datasets. Among them, the acute toxicity data for 6PPD involve organisms including Selenastrum capricornutum, Brachionus koreana, Hyalella azteca, Daphnia magna, Paracentrotus lividus, Arbacia lixula, Planorbella pilsbryi, Megalonaias nervosa, Oncorhynchus kisutch, Salvelinus leucomaenis, Salvelinus fontinalis, Salvelinus namaycush, Oncorhynchus mykiss, Oncorhynchus tshawytscha, and Lepomis macrochirus; the acute toxicity data for 6PPD-Q cover organisms such as Daphnia magna, Hexagenia spp., Megalonaias nervosa, Arbacia lixula, Oncorhynchus kisutch, Salvelinus namaycush, Salvelinus fontinalis, Salvelinus leucomaenis, Oncorhynchus mykiss, and Oncorhynchus tshawytscha; the acute toxicity data for DNPD include organisms including Hyalella azteca, Hexagenia spp., Megalonaias nervosa, Lampsilis siliquoidea, Oryzias latipes, Gobiocypris rarus, Pimephales promelas, Danio rerio, Salvelinus namaycush, Salvelinus leucomaenis, and Oncorhynchus tshawytscha. The relevant results correspond to the figure that includes the statistical distribution of species toxicity data for 6PPD (Table 1), 6PPD-Q (Table 2), and DNPD (Table 3).
The sensitivity of organisms to 6PPD, 6PPD-Q, and DNPD is directly reflected by their LC/EC50 values-lower LC/EC50 indicates higher susceptibility to the corresponding pollutant, and a detailed analysis of species-specific sensitivity based on the compiled toxicity data (Table 1, Table 2, and Table 3) reveals distinct taxonomic patterns and interspecific differences. Among all species tested for 6PPD toxicity (Table 1), Oncorhynchus kisutch (Chordata, Actinopterygii, Salmoniformes), a Pacific salmon species, exhibits the highest sensitivity with an extremely low LC/EC50 of 0.000041, which is two orders of magnitude lower than those of most other organisms, while echinoderms like Arbacia lixula (Echinodermata, Echinoidea) and gastropod mollusks such as Paracentrotus lividus (Mollusca, Gastropoda) follow closely with LC/EC50 values of 0.0008 and 0.0007 respectively, and mollusks including Megalonaias nervosa (Bivalvia, Unionida), the amphipod Hyalella azteca (Arthropoda, Malacostraca), and cladoceran Daphnia magna (Arthropoda, Branchiopoda) show moderate sensitivity with LC/EC50 values ranging from 0.017 to 0.042, in contrast, lower trophic levels like the rotifer Brachionus koreana (Rotifera, Monogononta) (LC/EC50 = 1) and green alga Selenastrum capricornutum (Chlorophyta, Chlorophyceae) (LC/EC50 = 8.78) as well as non-salmonid fishes such as Lepomis macrochirus (Chordata, Actinopterygii, Perciformes) (LC/EC50 = 0.45) display relatively low sensitivity.
For 6PPD-Q (Table 2), the more toxic quinone derivative of 6PPD, a similar taxonomic sensitivity pattern emerges: Oncorhynchus kisutch again has the lowest LC/EC50 of 0.0000485, other salmonids like Salvelinus namaycush (0.00051), Salvelinus fontinalis (0.00059), Salvelinus leucomaenis (0.0012), and Oncorhynchus mykiss (0.00103) also show very low LC/EC50 values, echinoderms such as Arbacia lixula (LC/EC50 = 0.012) and bivalves like Megalonaias nervosa (LC/EC50 = 0.0180) exhibit moderate sensitivity, arthropods including Hexagenia spp. (Insecta, Ephemeroptera) (LC/EC50 = 0.042) and Daphnia magna (LC/EC50 = 0.0534) have relatively higher values, and notably, Oncorhynchus tshawytscha (another salmonid) has a higher LC/EC50 of 0.0821, indicating intraspecific variability.
Regarding DNPD (Table 3), salmonid fishes remain among the most sensitive: Salvelinus namaycush (LC/EC50 = 0.00051) and Salvelinus leucomaenis (LC/EC50 = 0.0008) have low values, Oncorhynchus tshawytscha shows a slightly higher LC/EC50 of 0.067307, mollusks like Megalonaias nervosa (0.0114) and Lampsilis siliquoidea (0.047) maintain moderate sensitivity consistent with their responses to 6PPD and 6PPD-Q, arthropods such as Hyalella azteca (0.048) and Hexagenia spp. (0.0534) display similar sensitivity to DNPD as to 6PPD-Q, while non-salmonid fishes including Oryzias latipes (Beloniformes) (LC/EC50 = 0.029) and cypriniforms like Gobiocypris rarus (0.162), Pimephales promelas (0.48), and Danio rerio (1) exhibit lower sensitivity. Across all three pollutants (6PPD, 6PPD-Q, and DNPD), a consistent taxonomic sensitivity pattern is observed: Salmoniformes fishes (especially Oncorhynchus kisutch and Salvelinus species) are the most sensitive with LC/EC50 values often mg/L; for 6PPD, Oncorhynchus kisutch has an LC/EC50 of 0.000041 mg/L, Salvelinus leucomaenis 0.00051 mg/L, Salvelinus fontinalis 0.00038 mg/L, and Salvelinus namaycush 0.00039 mg/L; for 6PPD-Q, Oncorhynchus kisutch is 0.0000485 mg/L, Salvelinus namaycush 0.00051 mg/L, Salvelinus fontinalis 0.00059 mg/L, and Salvelinus leucomaenis 0.0012 mg/L; for DNPD, Salvelinus namaycush is 0.00051 mg/L and Salvelinus leucomaenis 0.0008 mg/L—likely due to physiological traits like high metabolic rates and sensitivity to oxidative stress.
Echinoderms and mollusks (e.g., Arbacia lixula, Megalonaias nervosa) form the second-most sensitive group with LC/EC50 values ranging from 0.0007 to 0.047 mg/L; for 6PPD, Arbacia lixula is 0.0008 mg/L, Paracentrotus lividus 0.0007 mg/L, and Megalonaias nervosa 0.0179 mg/L; for 6PPD-Q, Arbacia lixula is 0.012 mg/L and Megalonaias nervosa 0.0180 mg/L; for DNPD, Megalonaias nervosa is 0.0114 mg/L and Lampsilis siliquoidea 0.047 mg/L—possibly due to limited detoxification mechanisms or direct habitat exposure.
Arthropods (e.g., Daphnia magna, Hyalella azteca) show moderate sensitivity with LC/EC50 values between 0.017 and 0.0534 mg/L; for 6PPD, Hyalella azteca is 0.017 mg/L and Daphnia magna 0.042 mg/L; for 6PPD-Q, Hexagenia spp. is 0.042 mg/L and Daphnia magna 0.0534 mg/L; for DNPD, Hyalella azteca is 0.048 mg/L and Hexagenia spp. 0.0534 mg/L—and as key food web intermediates, their sensitivity implies potential cascading effects.
Lower trophic organisms (e.g., green algae, rotifers) and non-salmonid fishes (e.g., cypriniforms) are the least sensitive with LC/EC50 values mg/L; for 6PPD, Selenastrum capricornutum is 8.78 mg/L, Brachionus koreana 1 mg/L, and Lepomis macrochirus 0.45 mg/L; for DNPD, Oryzias latipes is 0.029 mg/L, Gobiocypris rarus 0.162 mg/L, Pimephales promelas 0.48 mg/L, and Danio rerio 1 mg/L—possibly due to efficient detoxification or reduced bioaccumulation.
This pattern highlights the need to prioritize salmonid habitats and benthic communities in biotic risk assessments for PPDs and PPDs-Q, as these groups are most likely to be affected by environmental concentrations of these pollutants.
3.2. Discussion on Toxicity Data of PPDs and PPDs-Q in Global Aquatic Media and Organismal Media
The global occurrence and concentration profiles of p-phenylenediamine antioxidants (PPDs) and their quinone derivatives (PPDs-Q) in aquatic media, biological matrices, and sediments-summarized in Table 4, Table 5, Table 6, and Table 7-reveal distinct spatial patterns, medium-specific accumulation characteristics, and implications for biotic exposure risk. These data, compiled via machine learning-augmented text mining, address the critical gap in global concentration compilation and provide a foundational dataset for ecological and human health risk assessment.
Figure 1.
Spatial Distribution of PPDs and PPD-Qs in Environmental and Biological Matrices. Note: (a) Distribution of PPD Contaminants in Natural and Artificial Aqueous Matrices. (b) Distribution of PPD-Q Transformation Products in Aqueous and Snow Matrices. (c) Occurrence of PPDs and PPD-Qs in Biological Samples (d)Distribution of PPDs and PPD-Qs in Natural and Artificial Sediments.
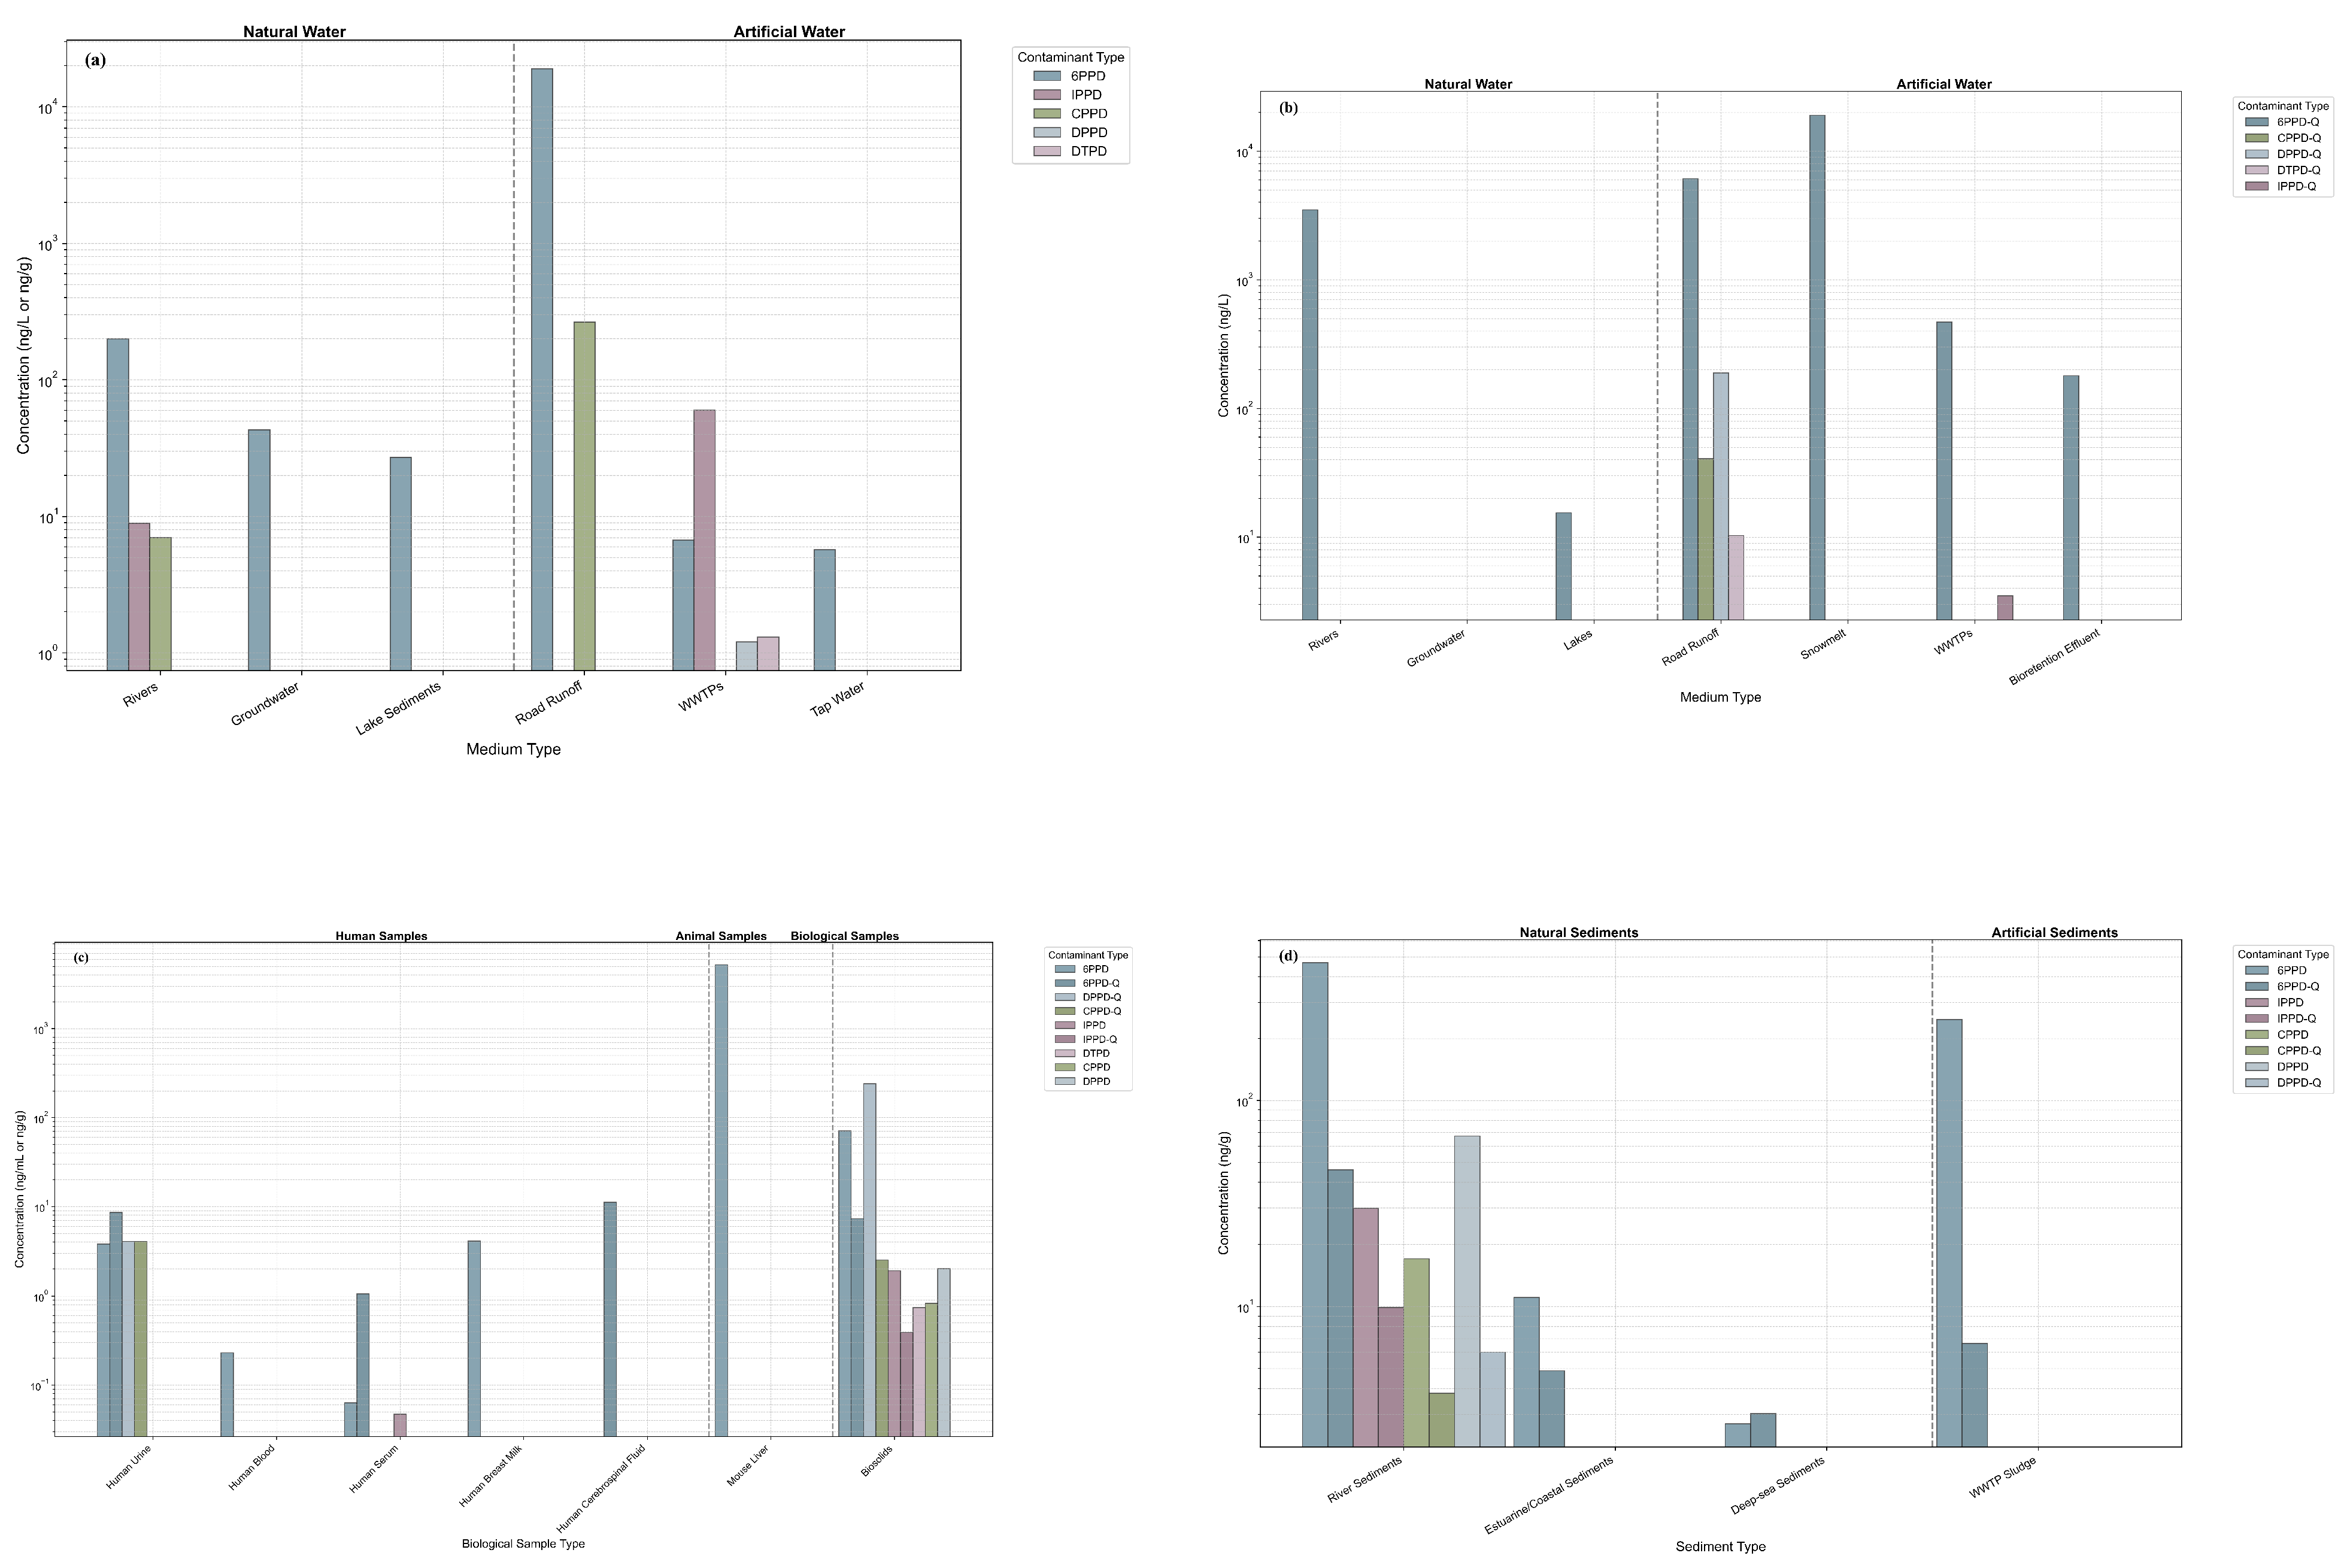
Aquatic environments, encompassing both natural and artificial water matrices, serve as primary reservoirs for PPDs and PPDs-Q, with concentrations exhibiting significant regional and medium-dependent variability (Table 4 and Table 5). For PPDs (Table 4), natural water systems display heterogeneous contamination levels. In riverine environments, 6PPD concentrations range from non-detected (ND) to 200 ng/L: Washington (USA) rivers show 35-200 ng/L, while Chinese rivers (e.g., Jiaojiang River) exhibit 4.0-72 ng/L, and the Dongjiang River Basin (China) has a median of 4.90 ng/L. Groundwater contamination is relatively mild, with the Kaifeng area (China) recording 6PPD concentrations of ND-43.0 ng/L (mean: 4.05 ng/L), indicating limited leaching potential of PPDs into subsurface water. Lake sediments, however, reflect cumulative contamination: sediments from five major lake regions in China contain 6PPD at <0.045-27 ng/g dw, suggesting long-term deposition in lentic systems. Artificial water matrices, particularly road runoff and wastewater treatment plant (WWTP) effluents, are key sources of PPD input. Road runoff exhibits the highest 6PPD concentrations: Seattle (USA) has 800-19,000 ng/L, and the Guangdong-Hong Kong-Macau Greater Bay Area (GBA, China) reaches a maximum of 907 ng/L-consistent with tire abrasion as a primary emission pathway. WWTPs act as both sinks and sources: Guangzhou (China) WWTPs (Plant A and B) have 6PPD influent concentrations of 0.29-6.69 ng/L, with effluents reduced to <method detection limit (MDL)-0.16 ng/L, demonstrating effective removal. In contrast, Hong Kong WWTPs show higher influent variability (1.1-59 ng/L) and effluent concentrations of <limit of quantitation (LOQ)-15 ng/L, potentially due to differences in treatment processes. Tap water contamination is low but ubiquitous: Hangzhou and Taizhou (China) have 6PPD concentrations of <LOD-5.7 ng/L (mean: 0.79-0.93 ng/L), indicating minor post-treatment exposure risks.
PPDs-Q (Table 5), the more toxic quinone derivatives, exhibit even greater spatial differentiation in aquatic media. Natural riverine 6PPD-Q concentrations span three orders of magnitude: American rivers (200-3500 ng/L) and Canadian rivers (290-890 ng/L) are substantially more contaminated than Chinese rivers (0.26-11.3 ng/L) and Australian rivers (0.38-88 ng/L). This disparity likely reflects differences in tire usage intensity, urbanization rates, and hydrological transport efficiency. Lake systems show lower contamination: nearshore waters of Lake Ontario (Canada) have 6PPD-Q concentrations of 2.4-15.5 ng/L, while snowmelt-an understudied seasonal matrix-emerges as a critical transport pathway. Seattle (USA) snowmelt contains 19.0 ug/L of 6PPD-Q, and cold-climate cities in Canada have an average of 367 ng/L (range: 0.08-0.37 ug/L), highlighting the role of atmospheric deposition and snowmelt runoff in contaminant delivery to aquatic systems. Artificial matrices further confirm PPDs-Q’s persistence. Road runoff in high-traffic areas (e.g., Los Angeles, USA: 4100-6100 ng/L; Hong Kong, China: 1.9-470 ng/L) exceeds natural water concentrations by 10-100-fold. WWTPs show variable removal efficacy for 6PPD-Q: Guangzhou Plant A reduces influent concentrations (1.33-10.5 ng/L) to 0.06-1.77 ng/L in effluents, while Toronto (Canada) WWTP suspended solids accumulate 6PPD-Q at 1.64-4.33 ng/g dw, indicating sorption to particulate matter. Bioretention cells, a green infrastructure for stormwater treatment, reduce 6PPD-Q loadings (Vancouver, Canada: peak 150 ng/L in effluents), but simulated maximum exposure concentrations (23-180 ng/L) still pose risks to sensitive biota.
Biological samples (Table 6) confirm widespread human and biotic exposure to PPDs and PPDs-Q, with tissue-specific accumulation and interpopulation differences. Human exposure is evident across multiple matrices, with PPDs-Q exhibiting higher bioaccumulation potential than parent PPDs. In urine-a key non-invasive biomarker-6PPD-Q concentrations are substantially higher than 6PPD: pregnant women in southern China have a median 6PPD-Q concentration of 2.91 ng/mL (vs. 0.068 ng/mL for 6PPD), while adults and children show 0.40-0.076 ng/mL (vs. 0.018-0.015 ng/mL for 6PPD). Regional variations are notable: Quzhou (China) has elevated 6PPD in urine (0.41-3.8 ng/mL), while Shanghai adults exhibit 6PPD-Q concentrations of 0.14-6.3 ng/mL. Serum and cerebrospinal fluid (CSF) data further highlight systemic exposure: South China adults have a median 6PPD serum concentration of 0.063 ng/mL, and Parkinson’s patients in Shenzhen (China) show higher 6PPD-Q in CSF (median: 11.18 ng/mL) than controls (5.07 ng/mL)-suggesting potential associations with neurological outcomes, though causal links require further investigation. Breast milk, a critical exposure pathway for infants, contains a median 6PPD concentration of 4.10 ng/mL in South China, indicating maternal transfer of contaminants. Animal and biotic samples reveal species-specific accumulation. In mice, oral exposure to 6PPD leads to dose-dependent liver accumulation: 1000 mg/kg doses result in 5236 pg/uL (3 h exposure) and 4044 pg/uL (9 h exposure), while intratracheal instillation (25 mg/kg) leads to 339 pg/uL-demonstrating respiratory and oral absorption pathways. Biosolids, a byproduct of WWTPs, contain detectable levels of PPDs and PPDs-Q: 6PPD ranges from 2.1-71 ng/g, and DPPD-Q (a less studied derivative) reaches 19-240 ng/g-posing risks if biosolids are applied as agricultural amendments.
Sediments act as long-term sinks for PPDs and PPDs-Q, with concentrations reflecting historical contamination and local emission sources (Table 7). Riverine sediments, particularly in urbanized regions, show the highest contamination. The Pearl River Delta (China) urban rivers exhibit 6PPD concentrations of 1.87-18.2 ng/g and 6PPD-Q of 0.585-468 ng/g, while the Jiaojiang River (China) has 6PPD up to 46 ng/g and 6PPD-Q up to 172 ng/g-attributed to high tire usage and urban runoff. Estuarine and coastal sediments display gradient contamination: the Pearl River Estuary has 6PPD concentrations of 1.49-5.71 ng/g and 6PPD-Q of <MDL-4.88 ng/g (median: 2.00 ng/g), while coastal areas of the South China Sea show 6PPD (1.07-11.1 ng/g) and 6PPD-Q (0.431-2.98 ng/g)-indicating transport of riverine contaminants to marine systems. Deep-sea sediments, though less contaminated, still contain detectable 6PPD (Okinawa Trough: median 0.77 ng/g dw) and 6PPD-Q (South China Sea: median 2.71 ng/g), suggesting long-range atmospheric or oceanic transport. WWTP sludge is a concentrated source of sediment-bound PPDs: Guangzhou (China) sludge contains 6PPD at 9.06-248 ng/g dw (median: 35.6 ng/g dw, accounting for >60% of total PPDs) and 6PPD-Q at a median of 6.62 ng/g dw-emphasizing the role of WWTPs in concentrating these contaminants and the need for safe sludge disposal practices.
The concentration data presented in Table 4, Table 5, Table 6 and Table 7, when contextualized with species-specific toxicity thresholds (e.g., LC/EC50 values for salmonids <0.001 ng/mL for 6PPD-Q), highlight significant biotic risk. For instance, 6PPD-Q concentrations in American rivers (200-3500 ng/L) far exceed the LC50 of Oncorhynchus kisutch (0.000041 ng/mL), indicating acute toxicity risks to salmonid populations. In contrast, lower concentrations in Chinese rivers (0.26-11.3 ng/L) may pose sub-chronic risks to sensitive benthic organisms (e.g., Hyalella azteca, LC50: 0.017 ng/mL). For human health, ubiquitous presence in tap water, urine, and breast milk confirms ongoing exposure, with PPDs-Q exhibiting higher bioaccumulation potential. The elevated 6PPD-Q in Parkinson’s patients’ CSF warrants further investigation into neurotoxicity mechanisms. Collectively, these data underscore the need for region-specific emission controls (e.g., targeted regulation of tire abrasion in high-contamination regions like the U.S. and Canada) and improved WWTP treatment efficiency for PPDs-Q. Additionally, the dataset validates the utility of machine learning-enabled text mining for compiling global environmental concentration data-providing a scalable framework for future pollutant monitoring.
4. Conclusion
Ours study aimed to address the gap in comprehensive global aqueous concentration compilation of p-Phenylenediamine (PPD) antioxidants and their quinone derivatives (PPDs-Q)—pollutants with potent neurotoxicity, immunotoxicity, and reproductive toxicity—and support biotic risk analysis and environmental management decisions. To overcome the limitations of manual literature data extraction (prolonged cycles, errors, inconsistent standards), the research developed a Python-based text mining pipeline integrating Optical Character Recognition (OCR) and pre-trained neural networks (via SpaCy) for efficient, accurate data curation. Literature retrieval was conducted across Web of Science, Scopus, and PubMed, ultimately identifying 49 articles on field water concentrations, 14 on sediment concentrations, and 4 review articles related to PPDs and PPDs-Q.
Core findings include distinct global concentration patterns of PPDs and PPDs-Q across media: In artificial water matrices, 6PPD concentrations in road runoff reached 800-19,000 ng/L (Seattle, USA) and 907 ng/L (Guangdong-Hong Kong-Macau Greater Bay Area, China), while wastewater treatment plant effluents had lower 6PPD (< MDL-15 ng/L) and 6PPD-Q (0.06-3.08 ng/L) concentrations. Natural water matrices showed regional differences, with 6PPD-Q concentrations of 200-3500 ng/L (USA rivers), 290-890 ng/L (Canada rivers), and 0.26-11.3 ng/L (China rivers). Snowmelt (e.g., 19.0 ug/L 6PPD-Q in Seattle) also emerged as a critical transport medium.
Toxicity data revealed taxonomic sensitivity patterns: Salmoniformes (e.g., Oncorhynchus kisutch, LC/EC50 = 0.000041) were most sensitive to 6PPD and 6PPD-Q, followed by echinoderms and mollusks, while lower trophic organisms and non-salmonid fishes showed lower sensitivity. Concentration-toxicity context highlighted biotic risks—e.g., 6PPD-Q in American rivers far exceeds salmonid LC50—and human exposure (via urine, serum, breast milk).
Ours work not only compiles global PPDs/PPDs-Q concentration data to inform clean emission regulations but also demonstrates a scalable machine learning-enabled framework for pollutant concentration data extraction, laying the groundwork for future environmental monitoring and risk assessment.
Author Contributions
Conceptualization: Yaolin Zhang, Menghui Li. Methodology: Yaolin Zhang, Menghui Li. Investigation: Yaolin Zhang, Menghui Li. Visualization: Yaolin Zhang, Menghui Li. Writing: Yaolin Zhang, Menghui Li. Editing: Yaolin Zhang, Menghui Li. Funding Acquisition: Yaolin Zhang, Menghui Li. Supervision: Yaolin Zhang, Menghui Li.
Acknowledgments
The data mining and analysis component of our research was supported by the Guangdong Provincial University Student Innovation and Entrepreneurship Training Program (Grant No. S202510559074). Data storage and computational resources for model training were provided by the Guangdong Provincial Key Laboratory of Environmental Pollution and Health at Jinan University.
Conflicts of Interest
All authors declare that they have no competing interests. No financial, professional, or personal relationships existed between the authors and any organizations or entities that could inappropriately influence the design, conduct, analysis, or interpretation of our study. This includes, but is not limited to, no conflicts arising from grants, employment, consultancies, stock ownership, honoraria, patent applications, or other financial or non-financial interests relevant to the work presented herein.
References
- Maringer, L.; Roiser, L.; Wallner, G.; Nitsche, D.; Buchberger, W. The role of quinoid derivatives in the UV-initiated synergistic interaction mechanism of HALS and phenolic antioxidants. Polymer Degradation and Stability 2016, 131, 91–97. [Google Scholar] [CrossRef]
- Yan, X.; Kiki, C.; Xu, Z.; Manzi, H.P.; Rashid, A.; Chen, T.; Sun, Q. Comparative growth inhibition of 6PPD and 6PPD-Q on microalgae Selenastrum capricornutum, with insights into 6PPD-induced phototoxicity and oxidative stress. Science of the Total Environment 2024, 957, 177627. [Google Scholar] [CrossRef] [PubMed]
- Maji, U.; Kim, K.; Yeo, I.; Shim, K.; Jeong, C. Toxicological Effects of Tire Rubber-Derived 6PPD-Quinone, a Species-Specific Toxicant, and Dithiobisbenzanilide (DTBBA) in the Marine Rotifer Brachionus koreanus. Marine Pollution Bulletin 2023, 192. [Google Scholar] [CrossRef]
- Prosser, R.; Salole, J.; Hang, S. Toxicity of 6PPD-quinone to Four Freshwater Invertebrate Species. Environmental Pollution 2023, 337, 6. [Google Scholar] [CrossRef]
- Prosser, R.; Bartlett, A.; Milani, D.; Holman, E.; Ikert, H.; Schissler, D.; Toito, J.; Parrott, J.; Gillis, P.; Balakrishnan, V. Variation in the Toxicity of Sediment-Associated Substituted Phenylamine Antioxidants to an Epibenthic (Hyalella azteca) and Endobenthic (Tubifex tubifex) Invertebrate. Chemosphere 2017, 181, 250–258. [Google Scholar] [CrossRef]
- Calle, L.; Le Du-Carree, J.; Martinez, I.; Sarih, S.; Montero, D.; Gomez, M.; Almeda, R. Toxicity of Tire Rubber-Derived Pollutants 6PPD-Quinone and 4-Tert-Octylphenol on Marine Plankton. Journal of Hazardous Materials 2025, 484. [Google Scholar] [CrossRef]
- Prosser, R.; Salole, J.; Hang, S. Toxicity of 6PPD-quinone to Four Freshwater Invertebrate Species. Environmental Pollution 2023, 337, 6. [Google Scholar] [CrossRef]
- Lo, B.; Marlatt, V.; Liao, X.; Reger, S.; Gallilee, C.; Brown, T. Acute Toxicity of 6PPD-Quinone to Early Life Stage Juvenile Chinook (Oncorhynchus tshawytscha) and Coho (Oncorhynchus kisutch) Salmon. Environmental Toxicology and Chemistry 2023, 42, 815–822. [Google Scholar] [CrossRef]
- Hiki, K.; Yamamoto, H. The Tire-Derived Chemical 6PPD-quinone Is Lethally Toxic to the White-Spotted Char Salvelinus leucomaenis pluvius but not to Two Other Salmonid Species. Environmental Science & Technology Letters, 2022. [Google Scholar]
- Philibert, D.; Stanton, R.; Tang, C.; Stock, N.; Benfey, T.; Pirrung, M.; De Jourdan, B. The Lethal and Sublethal Impacts of Two Tire Rubber-Derived Chemicals on Brook Trout (Salvelinus fontinalis) Fry and Fingerlings. Chemosphere 2024, 360. [Google Scholar] [CrossRef]
- Roberts, C.; Lin, J.; Kohlman, E.; Jain, N.; Amekor, M.; Alcaraz, A.; Hogan, N.; Hecker, M.; Brinkmann, M. Acute and Subchronic Toxicity of 6PPD-Quinone to Early Life Stage Lake Trout (Salvelinus namaycush). Environmental Science & Technology 2025, 59, 791–797. [Google Scholar] [CrossRef] [PubMed]
- Di, S.; Liu, Z.; Zhao, H.; Li, Y.; Qi, P.; Wang, Z.; Xu, H.; Jin, Y.; Wang, X. Chiral Perspective Evaluations: Enantioselective Hydrolysis of 6PPD and 6PPD-Quinone in Water and Enantioselective Toxicity to Gobiocypris rarus and Oncorhynchus mykiss. Environment International 2022, 166. [Google Scholar] [CrossRef] [PubMed]
- Greer, J.; Dalsky, E.; Lane, R.; Hansen, J. Establishing an In Vitro Model to Assess the Toxicity of 6PPD-Quinone and Other Tire Wear Transformation Products. Environmental Science & Technology Letters 2023, 10, 533–537. [Google Scholar] [CrossRef]
- Co., M. Co., M. Initial Submission: Acute Toxicity of Santoflex 13 to Rainbow Trout and Bluegill with Cover Letter Dated 081492. Technical Report EPA/OTS 88-920007606, Monsanto Co., 1977.
- Prosser, R.; Salole, J.; Hang, S. Toxicity of 6PPD-quinone to Four Freshwater Invertebrate Species. Environmental Pollution 2023, 337. [Google Scholar] [CrossRef]
- Brinkmann, M.; Montgomery, D.; Selinger, S.; Miller, J.; Stock, E.; Alcaraz, A.; Challis, J.; Weber, L.; Janz, D.; He, M. Acute Toxicity of the Tire Rubber-Derived Chemical 6PPD-Quinone to Four Fishes of Commercial, Cultural, and Ecological Importance. Environmental Science & Technology Letters 2022, 9, 333–338. [Google Scholar] [CrossRef]
- Liao, X.; Chen, Z.; Ou, S.; Liu, Q.; Lin, S.; Zhou, J.; Wang, Y.; Cai, Z. Neurological Impairment is Crucial for Tire Rubber-Derived Contaminant 6PPDQ-induced Acute Toxicity to Rainbow Trout. Science Bulletin 2024, 69, 621–635. [Google Scholar] [CrossRef]
- Prosser, R.; Gillis, P.; Holman, E.; Schissler, D.; Ikert, H.; Toito, J.; Gilroy, E.; Campbell, S.; Bartlett, A.; M, D. Effect of Substituted Phenylamine Antioxidants on Three Life Stages of the Freshwater Mussel Lampsilis siliquoidea. Environmental Pollution 2017, 229, 281–289. [Google Scholar] [CrossRef] [PubMed]
- Roberts, C.; Lin, J.; Kohlman, E.; Jain, N.; Amekor, M.; Alcaraz, A.; Hogan, N.; Hecker, M.; Brinkmann, M. Acute and Subchronic Toxicity of 6PPD-Quinone to Early Life Stage Lake Trout (Salvelinus namaycush). Environmental Science & Technology 2025, 59, 791–797. [Google Scholar] [CrossRef]
- Hiki, K.; Yamamoto, H. The Tire-Derived Chemical 6PPD-quinone Is Lethally Toxic to the White-Spotted Char Salvelinus leucomaenis pluvius but not to Two Other Salmonid Species. Environmental Science & Technology Letters, 2022; 6. [Google Scholar]
- Ministry of the Environment, J. Results of Aquatic Toxicity Tests of Chemicals Conducted by Ministry of the Environment in Japan (March 2019). Technical report, Ministry of the Environment, Japan, 2019.
- Co., M. Dynamic Toxicity of Santoflex 13 to Fatheads Minnows (Pimephales promelas). Technical report, Monsanto, St. Louis, MO, USA, 1979.
- Rao, C.; Chu, F.; Fang, F.; Xiang, D.; Xian, B.; Liu, X.; Bao, S.; Fang, T. Toxic Effects and Comparison of Common Amino Antioxidants (AAOs) in the Environment on Zebrafish: A Comprehensive Analysis Based on Cells, Embryos, and Adult Fish. Science of The Total Environment 2024, 924. [Google Scholar] [CrossRef]
- Geng, N.; Hou, S.; Sun, S.; Cao, R.; Zhang, H.; Lu, X.; Zhang, S.; Chen, J.; Zhang, Y. A Nationwide Investigation of Substituted p-Phenylenediamines (PPDs) and PPD-Quinones in the Riverine Waters of China. Environmental Science & Technology 2025, 59. [Google Scholar] [CrossRef]
- Shi, C.; Wu, F.; Zhao, Z.; Ye, T.; Luo, X.; Wu, Y.; Liu, Z.; Zhang, H. Effects of environmental concentrations of 6PPD and its quinone metabolite on the growth and reproduction of freshwater cladoceran. Science of The Total Environment 2024, 948, 175018. [Google Scholar] [CrossRef]
- Shi, R.; Zhang, Z.; Zeb, A.; Fu, X.; Shi, X.; Liu, J.; Wang, J.; Wang, Q.; Chen, C.; Sun, W.; et al. Environmental occurrence, fate, human exposure, and human health risks of p-phenylenediamines and their quinones. Science of The Total Environment 2024, 957, 177742. [Google Scholar] [CrossRef] [PubMed]
- Wang, J.; Li, Y.; Nie, C.; Liu, J.; Zeng, J.; Tian, M.; Chen, Z.; Huang, M.; Lu, Z.; Sun, Y. Occurrence, fate and chiral signatures of p-phenylenediamines and their quinones in wastewater treatment plants, China. Water Research 2025, 276, 123272. [Google Scholar] [CrossRef] [PubMed]
- Somepalli, K.; Andaluri, G. Spatiotemporal distribution and environmental risk assessment of 6PPDQ in the Schuylkill River. Emerging Contaminants 2025, 11, 100501. [Google Scholar] [CrossRef]
- Chen, X.; Sun, S.; Xu, P.; Du, L.; Sun, C.; Feng, F.; Feng, T.; Yao, X.; Cui, Z.; Liang, D.; et al. Rubber additives and relevant oxidation products in groundwater in a central China region: Levels, influencing factors and exposure. Environmental Pollution 2024, 363, 125155. [Google Scholar] [CrossRef]
- Zhou, L.J.; Liu, S.; Wang, M.; Wu, N.N.; Xu, R.; Wei, L.N.; Xu, X.R.; Zhao, J.L.; Xing, P.; Li, H.; et al. Nationwide occurrence and prioritization of tire additives and their transformation products in lake sediments of China. Environment International 2024, 193, 109139. [Google Scholar] [CrossRef]
- Jin, R.; Venier, M.; Chen, Q.; Yang, J.; Liu, M.; Wu, Y. Amino antioxidants: A review of their environmental behavior, human exposure, and aquatic toxicity. Chemosphere 2023, 317, 137913. [Google Scholar] [CrossRef]
- Liu, Y.H.; Mei, Y.X.; Liang, X.N.; Ge, Z.Y.; Huang, Z.; Zhang, H.Y.; Zhao, J.L.; Liu, A.; Shi, C.; Ying, G.G. Small-Intensity Rainfall Triggers Greater Contamination of Rubber-Derived Chemicals in Road Stormwater Runoff from Various Functional Areas in Megalopolis Cities. Environmental Science & Technology 2024, 58. [Google Scholar] [CrossRef]
- Xie, L.; Yuan, L.; Sun, J.; Yang, M.I.; Khan, I.; Lopez, J.J.; Gong, Y.; Nair, P.; Hao, C.; Helm, P.; et al. Compound Class-Specific Temporal Trends (2021–2023) of Tire Wear Compounds in Suspended Solids from Toronto Wastewater Treatment Plants. ACS ES&T Water 2024, 4. [Google Scholar] [CrossRef]
- Cao, G.; Wang, W.; Zhang, J.; Wu, P.; Qiao, H.; Li, H.; Huang, G.; Yang, Z.; Cai, Z. Occurrence and Removal of Substituted p-Phenylenediamine-Derived Quinones in Hong Kong Sewage Treatment Plants. Environmental Science & Technology 2023, 57. [Google Scholar] [CrossRef]
- Zhu, J.; Guo, R.; Ren, F.; Jiang, S.; Jin, H. p-Phenylenediamine Derivatives in Tap Water: Implications for Human Exposure. Water 2024, 16, 1128. [Google Scholar] [CrossRef]
- Ren, S.; Xia, Y.; Wang, X.; Zou, Y.; Li, Z.; Man, M.; Yang, Q.; Lv, M.; Ding, J.; Chen, L. Development and application of diffusive gradients in thin-films for in-situ monitoring of 6PPD-Quinone in urban waters. Water Research 2024, 266, 122408. [Google Scholar] [CrossRef]
- Black, G.P.; Parsia, M.D.; Uychutin, M.; Lane, R.; Orlando, J.L.; Hladik, M.L. 6PPD-quinone in water from the San Francisco–San Joaquin Delta, California, 2018–2024. Environmental Monitoring and Assessment 2025, 197. [Google Scholar] [CrossRef]
- Seiwert, B.; Nihemaiti, M.; Troussier, M.; Weyrauch, S.; Reemtsma, T. Abiotic oxidative transformation of 6 - PPD and 6 - PPD quinone from tires and occurrence of their products in snow from urban roads and in municipal wastewater. Water Research 2022, 212, 118122. [Google Scholar] [CrossRef]
- Rodgers, T.F.M.; Wang, Y.; Humes, C.; Jeronimo, M.; Johannessen, C.; Spraakman, S.; Giang, A.; Scholes, R.C. Bioretention Cells Provide a 10-Fold Reduction in 6PPD-Quinone Mass Loadings to Receiving Waters: Evidence from a Field Experiment and Modeling. Environmental Science & Technology Letters 2023, 10. [Google Scholar] [CrossRef] [PubMed]
- Choi, M.S.; Kim, S.H.; Hyun, M.; Han, S.M.; Kim, Y.H. Development of a quantitative analytical method for 6PPD, a harmful tire antioxidant, in biological samples for toxicity assessment. Ecotoxicology and Environmental Safety 2025, 296, 118171. [Google Scholar] [CrossRef]
- Zhang, H.Y.; Huang, Z.; Liu, Y.H.; Hu, L.X.; He, L.Y.; Liu, Y.S.; Zhao, J.L.; Ying, G.G. Occurrence and risks of 23 tire additives and their transformation products in an urban water system. Environment International 2023, 171, 107715. [Google Scholar] [CrossRef]
- Wan, X.; Liang, G.; Wang, D. Potential human health risk of the emerging environmental contaminant 6-PPD quinone. Science of The Total Environment 2024, 949, 175057. [Google Scholar] [CrossRef] [PubMed]
- Prosser, R.; Salole, J.; Hang, S. Toxicity of 6PPD-quinone to four freshwater invertebrate species. Environmental Pollution 2023, 337, 122512. [Google Scholar] [CrossRef] [PubMed]
- Zhang, R.; Zhao, S.; Liu, X.; Tian, L.; Mo, Y.; Yi, X.; Liu, S.; Liu, J.; Li, J.; Zhang, G. Aquatic environmental fates and risks of benzotriazoles, benzothiazoles, and p-phenylenediamines in a catchment providing water to a megacity of China. Environmental Research 2023, 216, 114721. [Google Scholar] [CrossRef]
- Yu, W.; Tang, S.; Wong, J.W.; Luo, Z.; Li, Z.; Thai, P.K.; Zhu, M.; Yin, H.; Niu, J. Degradation and detoxification of 6PPD-quinone in water by ultraviolet-activated peroxymonosulfate: Mechanisms, byproducts, and impact on sediment microbial community. Water Research 2024, 263, 122210. [Google Scholar] [CrossRef]
- Johannessen, C.; Metcalfe, C.D. The occurrence of tire wear compounds and their transformation products in municipal wastewater and drinking water treatment plants. Environmental Monitoring and Assessment 2022, 194. [Google Scholar] [CrossRef] [PubMed]
- Klauschies, T.; Isanta-Navarro, J. The joint effects of salt and 6PPD contamination on a freshwater herbivore. Science of The Total Environment 2022, 829, 154675. [Google Scholar] [CrossRef] [PubMed]
- Zeng, L.; Li, Y.; Sun, Y.; Liu, L.Y.; Shen, M.; Du, B. Widespread Occurrence and Transport of p-Phenylenediamines and Their Quinones in Sediments across Urban Rivers, Estuaries, Coasts, and Deep-Sea Regions. Environmental Science & Technology 2023, 57. [Google Scholar] [CrossRef]

Table 1.
Species Toxicity Data of 6PPD
| Phylum | Class | Order | Species | LC/EC50 (mg/L) | Reference |
|---|---|---|---|---|---|
| Chlorophyta | Chlorophyceae | Sphaeropleales | Selenastrum capricornutum (Printz, 1964) | 8.78 | [2] |
| Rotifera | Monogononta | Brachionida | Brachionus koreana (Hwang et al., 2013) | 1 | [3] |
| Arthropoda | Malacostraca | Amphipoda | Hyalella azteca (Saussure, 1858) | 0.017 | [4] |
| Arthropoda | Branchiopoda | Anomopoda | Daphnia magna (Straus, 1820) | 0.042 | [5] |
| Mollusca | Gastropoda | Basommatophora | Paracentrotus lividus (Lamarck, 1816) | 0.0007 | [6] |
| Mollusca | Gastropoda | Basommatophora | Planorbella pilsbryi (F.C. Baker, 1926) | 0.0117 | [7] |
| Mollusca | Bivalvia | Unionida | Megalonaias nervosa (Rafinesque, 1820) | 0.0179 | [7] |
| Echinodermata | Echinoidea | Arbacioida | Arbacia lixula (Linnaeus, 1758) | 0.0008 | [6] |
| Chordata | Actinopterygii | Salmoniformes | Oncorhynchus kisutch (Walbaum, 1792) | 0.000041 | [8] |
| Chordata | Actinopterygii | Salmoniformes | Salvelinus leucomaenis (Pallas, 1814) | 0.00051 | [9] |
| Chordata | Actinopterygii | Salmoniformes | Salvelinus fontinalis (Mitchill, 1814) | 0.00038 | [10] |
| Chordata | Actinopterygii | Salmoniformes | Salvelinus namaycush (Walbaum, 1792) | 0.00039 | [11] |
| Chordata | Actinopterygii | Salmoniformes | Oncorhynchus mykiss (Walbaum, 1792) | 0.00226 | [12] |
| Chordata | Actinopterygii | Salmoniformes | Oncorhynchus tshawytscha (Walbaum, 1792) | 0.0082 | [13] |
| Chordata | Actinopterygii | Perciformes | Lepomis macrochirus (Rafinesque, 1819) | 0.45 | [14] |
Table 2.
Species Toxicity Data of 6PPD-Q
| Phylum | Class | Order | Species | LC/EC50 (mg/L) | Reference |
|---|---|---|---|---|---|
| Arthropoda | Branchiopoda | Anomopoda | Daphnia magna (Straus, 1820) | 0.0534 | [15] |
| Arthropoda | Insecta | Ephemeroptera | Hexagenia spp. (Charbonneau and Hare, 1998) | 0.042 | [15] |
| Mollusca | Bivalvia | Unionida | Megalonaias nervosa (Rafinesque, 1820) | 0.0180 | [15] |
| Echinodermata | Echinoidea | Arbacioida | Arbacia lixula (Linnaeus, 1758) | 0.012 | [6] |
| Chordata | Actinopterygii | Salmoniformes | Oncorhynchus kisutch (Walbaum, 1792) | 0.0000485 | [8] |
| Chordata | Actinopterygii | Salmoniformes | Salvelinus namaycush (Walbaum, 1792) | 0.00051 | [8] |
| Chordata | Actinopterygii | Salmoniformes | Salvelinus fontinalis (Mitchill, 1814) | 0.00059 | [16] |
| Chordata | Actinopterygii | Salmoniformes | Salvelinus leucomaenis (Pallas, 1814) | 0.0012 | [9] |
| Chordata | Actinopterygii | Salmoniformes | Oncorhynchus mykiss (Walbaum, 1792) | 0.00103 | [17] |
| Chordata | Actinopterygii | Salmoniformes | Oncorhynchus tshawytscha (Walbaum, 1792) | 0.0821 | [13] |
Table 3.
Species Toxicity Data of DNPD
| Phylum | Class | Order | Species | LC/EC50 (mg/L) | Reference |
|---|---|---|---|---|---|
| Arthropoda | Malacostraca | Amphipoda | Hyalella azteca (Saussure, 1858) | 0.048 | [5] |
| Arthropoda | Insecta | Ephemeroptera | Hexagenia spp. (Charbonneau and Hare, 1998) | 0.0534 | [4] |
| Mollusca | Bivalvia | Unionida | Megalonaias nervosa (Rafinesque, 1820) | 0.0114 | [4] |
| Mollusca | Bivalvia | Unionida | Lampsilis siliquoidea (Barnes, 1823) | 0.047 | [18] |
| Chordata | Actinopterygii | Salmoniformes | Salvelinus namaycush (Walbaum, 1792) | 0.00051 | [19] |
| Chordata | Actinopterygii | Salmoniformes | Salvelinus leucomaenis (Pallas, 1814) | 0.0008 | [20] |
| Chordata | Actinopterygii | Salmoniformes | Oncorhynchus tshawytscha (Walbaum, 1792) | 0.067307 | [8] |
| Chordata | Actinopterygii | Beloniformes | Oryzias latipes (Temminck & Schlegel, 1846) | 0.029 | [21] |
| Chordata | Actinopterygii | Cypriniformes | Gobiocypris rarus (Ye et al., 1983) | 0.162 | [12] |
| Chordata | Actinopterygii | Cypriniformes | Pimephales promelas (Rafinesque, 1820) | 0.48 | [22] |
| Chordata | Actinopterygii | Cypriniformes | Danio rerio (Hamilton, 1822) | 1 | [23] |
Table 4.
Summary of PPDs contaminants in different media.
| Contaminant Name | Medium Type | Details | References |
|---|---|---|---|
| 6PPD | Natural water - Rivers | Chinese rivers: concentrations not specified (Liuxi River, Pearl River, Dongjiang River); Washington rivers (USA): 35-200 ng/L; Miller Creek (USA): ug/L; Schuylkill River (USA): not detected to 17.95 ng/L; Don River (Canada): concentrations not specified; Jiaojiang River: 4.0-72 ng/L | [24,25,26,27,28] |
| 6PPD | Natural water - Groundwater | Kaifeng area (China): ND-43.0 ng/L, mean value 4.05 ng/L | [29] |
| 6PPD | Natural water - Lakes | Sediments in China’s five major lake regions: <0.045-27 ng/g | [30] |
| 6PPD | Artificial water - Road runoff | Seattle (USA): 800-19,000 ng/L; Guangdong-Hong Kong-Macau Greater Bay Area (China): maximum 907 ng/L | [31,32] |
| 6PPD | Artificial water - WWTPs | Guangzhou Plant A influent: 0.29-3.11 ng/L; effluent: <MDL-0.16 ng/L; Guangzhou Plant B influent: 1.46-6.69 ng/L; effluent: 0.07-0.16 ng/L; Hong Kong influent: 1.1 - 59 ng/L; effluent: <LOQ - 15 ng/L; Suspended solids in Toronto WWTPs: WWTP A ng/g dw; WWTP B ng/g dw | [27,33,34] |
| 6PPD | Artificial water - Tap water | Hangzhou (China): <LOD - 5.7 ng/L (mean: 0.79 ng/L); Taizhou (China): <LOD - 2.6 ng/L (mean: 0.93 ng/L) | [35] |
| IPPD | Natural water - Rivers | Jiaojiang River: <LOD-8.9 ng/L; Liuxi River (China): 0.658-3.85 ng/L | [35,36] |
| IPPD | Artificial water - WWTPs | Hong Kong influent: 0.63 - 33 ng/L; effluent: 0.13 - 28 ng/L; Malaysia influent: not detected–60 ng/L; effluent: not detected–47 ng/L; Sri Lanka influent: 0.63–2.4 ng/L; effluent: 1.2–3.6 ng/L | [34,37] |
| CPPD | Natural water - Rivers | Jiaojiang River: <LOD-7.0 ng/L | [36] |
| CPPD | Artificial water - Road runoff | Guangdong-Hong Kong-Macau Greater Bay Area (China): maximum 265 ng/L | [32] |
| DPPD | Artificial water - WWTPs | Hong Kong influent: 0.39 - 1.2 ng/L; effluent: <LOQ - 0.28 ng/L | [34] |
| DTPD | Artificial water - WWTPs | Hong Kong influent: <LOQ - 1.3 ng/L; effluent: <LOQ - 0.3 ng/L | [34] |
Table 5.
Summary of PPDsQ contaminants in different media.
| Contaminant Name | Medium Type | Details | References |
|---|---|---|---|
| 6PPD-Q | Natural water - Rivers | Chinese rivers: 0.26-11.3 ng/L; Canadian rivers: 290-890 ng/L; American rivers: 200-3500 ng/L; Australian rivers: 0.38-88 ng/L; Guangdang River (Yantai): ng/L; Xin’an River: ng/L; Yu’niao River: ng/L; Urban rivers in the Pearl River Delta: 7.20-34.5 ng/L; Upper reaches of Shenchong River (Guangzhou): ng/L; Discharge point: ng/L; Downstream: ng/L; Upper reaches of Tianma River (Guangzhou): ng/L; Discharge point: ng/L; Downstream: ng/L; Schuylkill River (USA): not detected to 17.95 ng/L; Don River (Canada, during rainstorms): ug/L; GTA streams (wet season): 5.6-82.3 ng/L; (dry season): <2.0-8.4 ng/L; Sacramento-San Joaquin Delta (USA): 0.43-21 ng/L | [26,27,28,32,37,38,39] |
| 6PPD-Q | Natural water - Groundwater | Guanghua Basin (China): detection frequency > 70% | [35] |
| 6PPD-Q | Natural water - Lakes | Nearshore waters of Lake Ontario (Canada): Toronto Harbour 2.4-2.55 ng/L; Near Humber Bay Park 2.8-15.5 ng/L | [32] |
| 6PPD-Q | Artificial water - Road runoff | Seattle (USA): 6.1 ug/L; 0.8-19 ug/L; High-traffic areas in Hong Kong (China): 2.43 ug/L; 1.9-470 ng/L; Los Angeles (USA): 4100-6100 ng/L; 4.1-6.1 ug/L; San Francisco creeks (USA): 1.0-3.5 ug/L; Huizhou (China): 38.5-1562 ng/L; Dongguan (China): 38.5-1562 ng/L; Guangdong-Hong Kong-Macau Greater Bay Area (China): 1.6–940 ng/L; Roads around Guelph (Canada): 0.05-0.20 ug/L | [25,32,38,40,41,42,43] |
| 6PPD-Q | Artificial water - Snowmelt | Seattle (USA): 19.0 ug/L; Snowmelt in Yantai (grab sampling): 67.4-129 ng/L; (DGT detection): 210 ng/L; Cold-climate cities in Canada: 367 ng/L (average); 0.08-0.37 ug/L; Leipzig (Germany): 110-428 ng/L | [28,39,44,45] |
| 6PPD-Q | Artificial water - WWTPs | A WWTP in Germany (influent): snowmelt period ug/L; rainfall period ug/L; Guangzhou Plant A influent: 1.33-10.5 ng/L; effluent: 0.06-1.77 ng/L; Guangzhou Plant B influent: 2.49-10.0 ng/L; effluent: 0.90-3.08 ng/L; Hong Kong influent: 1.9-470 ng/L; effluent: 1.1-37 ng/L; Southern Ontario (Canada) influent: ng/POCIS - ng/POCIS; effluent: ng/POCIS - ng/POCIS; Suspended solids in Toronto WWTPs: WWTP A ng/g dw; WWTP B ng/g dw | [27,33,34,38,46] |
| 6PPD-Q | Artificial water - Bioretention cell effluent | Vancouver (Canada): peak value 150 ng/L; simulated MEC range 23-180 ng/L | [47] |
| IPPD-Q | Artificial water - WWTPs | Hong Kong influent: 0.36-3.5 ng/L; effluent: 0.06-1.7 ng/L | [34] |
| CPPD-Q | Artificial water - Road runoff | Guangdong-Hong Kong-Macau Greater Bay Area (China): ND–40.7 ng/L | [32] |
| DPPD-Q | Artificial water - Road runoff | Guangdong-Hong Kong-Macau Greater Bay Area (China): ND–189 ng/L | [32] |
| DTPD-Q | Artificial water - Road runoff | Guangdong-Hong Kong-Macau Greater Bay Area (China): ND–10.3 ng/L | [32] |
Table 6.
Summary of PPDs and PPDsQ in biological samples.
| Contaminant Name | Biological Type | Details | References |
|---|---|---|---|
| 6PPD | Human - Urine | Pregnant women in southern China: median 0.068 ng/mL; adults: 0.018 ng/mL; children: 0.015 ng/mL; Quzhou (China): 0.41-3.8 ng/mL; Guangzhou (China): <LOD-0.54 ng/mL | [26,38] |
| 6PPD | Human - Blood | Tianjin (China): <LOD-0.230 ng/mL | [26] |
| 6PPD | Human - Serum | South China: median 0.063 ng/mL | [26] |
| 6PPD | Human - Breast milk | South China: median 4.10 ng/mL | [26] |
| 6PPD | Animal - Mouse liver | Oral exposure for 3h: 1043 pg/uL (100 mg/kg dose), 5236 pg/uL (1000 mg/kg dose); Oral exposure for 9h: 1868 pg/uL (100 mg/kg dose), 4044 pg/uL (1000 mg/kg dose); Intratracheal instillation for 9h: 150 pg/uL (10 mg/kg dose), 339 pg/uL (25 mg/kg dose) | [24] |
| 6PPD-Q | Human - Urine | Pregnant women in southern China: median 2.91 ng/mL; adults: 0.40 ng/mL; children: 0.076 ng/mL; Children in Guangzhou (China): <MQL-0.78 ng/mL; Pregnant women: 0.26-8.58 ng/mL; Adults: 0.055-2.11 ng/mL; Adults in Shanghai (China): 0.14-6.3 ng/mL; General population in Tianjin (China): ND-0.073 ng/mL | [25,38] |
| 6PPD-Q | Human - Serum | Control group in South China: <LOQ-1.06 ng/mL; Adults with S-NAFLD: <LOQ-0.78 ng/mL; General population: 0.11-0.43 ng/mL; median 0.15 ng/mL | [25,26] |
| 6PPD-Q | Human - Cerebrospinal fluid | Parkinson’s patients in Shenzhen (China): median 11.18 ng/mL; Control group: median 5.07 ng/mL | [25] |
| IPPD | Human - Serum | South China: median 0.047 ng/mL | [26] |
| DPPD-Q, CPPD-Q, DNPD-Q | Human - Urine | Tianjin (China): 0.193-4.064 ng/mL | [26] |
| IPPD | Biological sample - Biosolids | 0.25-1.9 ng/g | [34] |
| CPPD | Biological sample - Biosolids | 0.48-0.83 ng/g | [34] |
| 6PPD | Biological sample - Biosolids | 2.1-71 ng/g | [34] |
| DPPD | Biological sample - Biosolids | 0.49-2.0 ng/g | [34] |
| DTPD | Biological sample - Biosolids | 0.53-0.74 ng/g | [34] |
| IPPD-Q | Biological sample - Biosolids | <LOQ-0.39 ng/g | [34] |
| CPPD-Q | Biological sample - Biosolids | 0.35-2.5 ng/g | [34] |
| 6PPD-Q | Biological sample - Biosolids | 2.6-7.3 ng/g | [34] |
| DPPD-Q | Biological sample - Biosolids | 19-240 ng/g | [34] |
Table 7.
Summary of PPDs and PPDsQ in sediments.
| Contaminant Name | Sediment Type | Details | References |
|---|---|---|---|
| 6PPD | River sediments | Urban rivers in the Pearl River Delta (China): 0.585-468 ng/g; Jiaojiang River (China): 1.6-172 ng/g; Rivers in the Dongjiang River basin (China): median 4.90 ng/g dw | [26,35,36,48] |
| 6PPD | Estuarine/coastal sediments | Pearl River Estuary: 1.49-5.71 ng/g; Coastal areas of the South China Sea: 1.07-11.1 ng/g; Estuaries in the Dongjiang River basin (China): range not specified (PPD median 5.26 ng/g dw) | [35,48] |
| 6PPD | Deep-sea sediments | Deep-sea areas of the South China Sea: <MDL-2.69 ng/g; Okinawa Trough: median 0.77 ng/g dw | [35,48] |
| 6PPD | WWTP sludge | Guangzhou (China): range 9.06-248 ng/g dw (accounting for over 60%); median 35.6 ng/g dw | [35] |
| 6PPD-Q | River sediments | Urban rivers in the Pearl River Delta (China): 1.87-18.2 ng/g; Jiaojiang River (China): <LOD-46 ng/g; Rivers in the Dongjiang River basin (China): nd-5.24 ng/g dw | [25,36,38,48] |
| 6PPD-Q | Estuarine/coastal sediments | Pearl River Estuary: <MDL-4.88 ng/g; median 2.00 ng/g; Coastal areas of the South China Sea: 0.431-2.98 ng/g; Estuaries in the Dongjiang River basin (China): nd-0.62 ng/g dw | [25,48] |
| 6PPD-Q | Deep-sea sediments | Deep-sea areas of the South China Sea: <MDL-3.02 ng/g; median 2.71 ng/g | [25,48] |
| 6PPD-Q | WWTP sludge | Guangzhou (China): median 6.62 ng/g dw | [35] |
| IPPD | River sediments | Urban rivers in the Pearl River Delta (China): <MDL-29.9 ng/g; Jiaojiang River (China): <LOD-22 ng/g | [48] |
| IPPD-Q | River sediments | Urban rivers in the Pearl River Delta (China): 0.434-9.91 ng/g | [48] |
| CPPD | River sediments | Urban rivers in the Pearl River Delta (China): <MDL-5.30 ng/g; Jiaojiang River (China): <LOD-17 ng/g | [48] |
| CPPD-Q | River sediments | Urban rivers in the Pearl River Delta (China): <MDL-3.79 ng/g | [48] |
| DPPD | River sediments | Urban rivers in the Pearl River Delta (China): <MDL-67.1 ng/g; Jiaojiang River (China): <LOD-17 ng/g | [48] |
| DPPD-Q | River sediments | Pearl River Delta (China): <1.2-6.0 ng/g | [26] |
Disclaimer/Publisher’s Note: The statements, opinions and data contained in all publications are solely those of the individual author(s) and contributor(s) and not of MDPI and/or the editor(s). MDPI and/or the editor(s) disclaim responsibility for any injury to people or property resulting from any ideas, methods, instructions or products referred to in the content. |
© 2025 by the authors. Licensee MDPI, Basel, Switzerland. This article is an open access article distributed under the terms and conditions of the Creative Commons Attribution (CC BY) license (http://creativecommons.org/licenses/by/4.0/).
Copyright: This open access article is published under a Creative Commons CC BY 4.0 license, which permit the free download, distribution, and reuse, provided that the author and preprint are cited in any reuse.


