
Submitted:
25 August 2025
Posted:
27 August 2025
You are already at the latest version
Abstract
Background: Although tryptophanyl-tRNA synthetase (WRS) is a novel biomarker released during bacterial and viral infections, its prognostic value in sepsis has rarely been reported. We aimed to investigate the prognostic value of WRS in patients with sepsis in the emergency department (ED). Methods: This prospective, observational study included 243 patients with sepsis. Blood samples were collected to measure full-length WRS levels. The prognostic value of WRS was evaluated using the area under the receiver operating characteristic curve, Kaplan–Meier survival curve analysis, and the Cox proportional hazards model. Results: The WRS levels were higher in patients with septic shock than in those without shock (p = 0.018). WRS could predict 30-day mortality (area under the curve, 0.648; 95% confidence interval [CI], 0.569–0.726; sensitivity, 56.7%; specificity, 73.3%; cutoff value, 84.15 µg/L; p < 0.001). Patients with WRS levels of ≥ 84.15 µg/L showed higher 30-day mortality than those with WRS levels of <84.15 µg/L. Among patients with WRS levels of ≥ 84.15 µg/L, those with positive urine culture results had higher 30-day mortality than those with negative urine culture. Patients with renal Sequential Organ Failure Assessment (SOFA) score of ≥ 1 had higher 30-day mortality than those with renal SOFA score of 0. WRS was an independent predictor of 30-day mortality (hazard ratio = 1.003; 95% CI, 1.001–1.005; p = 0.014). Conclusions: WRS showed significant prognostic value in patients with sepsis and could be more useful in those with kidney dysfunction or urinary tract infection.
Keywords:
kidney dysfunction
; mortality
; sepsis
; tryptophanyl-tRNA synthetase
; urinary tract infection
1. Introduction
Sepsis is defined as a fatal organ dysfunction due to dysregulated response to current infection [1]. Globally, it is an important health problem that remains a clinical challenge for critically ill patients [2,3,4]. Early identification and intensive management are required for better clinical outcomes of patients with sepsis [5,6,7]. Although the Sepsis-3 criteria incorporated the degree of organ dysfunction, as measured by the Sequential Organ Failure Assessment (SOFA) score, into the definition of sepsis [1,8,9], the presence of infection should still be determined based on clinician’s opinion [10]. Despite important advances in the understanding and management of sepsis, there is no reference standard for diagnosing sepsis [11]. Organ failure is generally defined as severe organ dysfunction that normal equilibrium cannot be maintained without active clinical procedure or intervention [12]. Organ failure can be induced by infection as well as various non-infectious causes such as brain hemorrhage, myocardial infarction, hepatic failure, pulmonary thromboembolism, and hypovolemic shock. Many critically ill patients have simultaneous dysfunction of many organs and are at risk of developing various organ failure, complicating high mortality rates [13,14].
C-reactive protein (CRP) and procalcitonin (PCT) are widely used to support the early identification and diagnosis of sepsis; however, their diagnostic and prognostic performances have limitations [6,8,9,10,11]. CRP and PCT levels cannot effectively indicate fungal and viral infections [15], and have limited prognostic value in patients with sepsis [16]. Presepsin (P-SEP) is a relatively novel biomarker with a high sensitivity and specificity for discriminating sepsis. However, the accuracy of P-SEP concentrations in elderly patients with kidney dysfunction and without signs of infection is poor [17,18]. Thus, more reliable biomarkers are needed to facilitate the prompt diagnosis of sepsis and to predict clinical outcomes.
Tryptophanyl-tRNA synthetase (WRS) is a key enzyme responsible for catalyzing the aminoacylation process, in which tryptophan is attached to its specific tRNA during protein translation. [19]. WRS is critically involved in innate immune responses and contributes to the pathophysiology of diverse disorders, including sepsis, cancer, autoimmune diseases, and neurological conditions [20]. Although earlier research demonstrated that WRS is released from human fibroblasts, macrophages, and endothelial cells upon stimulation with the proinflammatory cytokine interferon-γ, the precise mechanism and function of WRS are still unclear [21]. According to previous studies, WRS is released in patients with bacterial or viral infections [22,23,24]. A recent study showed that full-length WRS (FL-WRS) could help discriminate sepsis from noninfectious inflammation and predict mortality in patients with sepsis admitted to the intensive care unit (ICU) [25]. However, to the best of our knowledge, no study has reported the prognostic value of WRS among patients with sepsis in the emergency department (ED). Thus, this study aimed to investigate the prognostic value of WRS in sepsis patients who visited our ED.
2. Materials and Methods
2.1. Study Design and Population
This single-center ED-based, prospective, observational study was performed at a tertiary care teaching hospital. This study was conducted in accordance with the Declaration of Helsinki (2013; Seventh revision, 64th Meeting, Fortaleza) and was permitted by the Institutional Review Board of Korea University Ansan Hospital (IRB no. 2020AS0216). Prior to enrollment in the study, written informed consent was obtained from all participants or their legal guardians.
This study included adult patients (≥19 years) who fulfilled the Sepsis-3 diagnostic criteria for sepsis and provided written informed consent to provide blood samples. From July 2019 to August 2020, blood samples were drawn from participants and archived in the institutional biobank. Patients demonstrating evidence of infection and an increase of ≥2 points in the SOFA score from baseline were enrolled. For patients without an existing baseline SOFA score, an independent emergency physician reviewed the clinical data in their electronic health records to determine an estimated baseline score. Two infectious disease specialists, along with an emergency physician, evaluated the patients’ laboratory findings and medical records to assign them to either the sepsis or septic shock group. The inter-rater agreement among the three reviewers, measured by the light kappa statistic, was 0.957. Following discussion of minor discrepancies, consensus on group assignment was achieved.
2.2. Data Collection
Clinical data on patient demographics, comorbid conditions, vital signs, and laboratory parameters were gathered. Prognostic indices, such as the SOFA score, National Early Warning Score (NEWS), Modified Early Warning Score (MEWS), and Acute Physiology and Chronic Health Evaluation II (APACHE II) score, were computed. Subjects were monitored for 30 days after their ED visit, and for patients discharged or transferred during this timeframe, follow-up information was collected through telephone communication with the patients or their legal guardians.
2.3. Definitions
Sepsis is defined as fatal organ failure due to a dysregulated host response to current infection [1]. The diagnostic criteria of sepsis requires a rise in the SOFA score of two or more points due to an ongoing infection. Septic shock, considered a subset of sepsis, involves severe circulatory, cellular, and metabolic disturbances that significantly increase mortality risk. Diagnosis of septic shock necessitates vasopressor support to sustain a mean arterial pressure of 65 mmHg and a serum lactate concentration greater than 2 mmol/L, even after sufficient fluid resuscitation. Positive culture results were defined as the isolation of any microorganism from the clinical specimens, regardless of clinical symptoms or disease severity.
2.4. Multiplex Immunoassay
WRS can exist in various forms. FL-WRS can be truncated or spliced into shorter forms such as mini-WRS, T1-WRS, or T2-WRS, and each form has a different biological function [20]. In this study, the measured WRS levels refer only to the FL-WRS levels because the commercial kit used in our study can detect only FL-WRS. Serum WRS levels were measured using a human WRS enzyme-linked immunosorbent assay (ELISA) kit (Catalog No. JWBS-R001; JW Bioscience, Chungcheongbuk-do, Republic of Korea) following the manufacturer’s protocol. Polystyrene 96-well plates (Nunc Immunoplate, Nunc, Denmark) were coated with 100 µl of affinity-purified coating antibody, sealed, and incubated for 15 h at 4 °C. After washing to remove unbound antibodies, the wells were blocked for 1 h with blocking buffer. Standards and diluted samples were subsequently added for 1 h at room temperature, followed by washing and addition of horseradish peroxidase-conjugated detection antibody. The colorimetric reaction was developed using 3,3’,5,5’-tetramethylbenzidine (TMB) for 10 min at room temperature in the dark and terminated with stop solution. Absorbance was read at 450 nm using a spectrophotometric microplate reader (Sunrise, Tecan, Grodig, Austria), and WRS levels were determined from a standard curve via linear regression. To prevent bias, emergency physicians were blinded to WRS measurements, which did not influence clinical management or patient disposition. PCT levels were measured using an automated electrochemiluminescence assay (BRAHMS, Hennigsdorf, Germany) on a Roche Cobas e-system (Roche Diagnostics, Basel, Switzerland), with a manufacturer-reported range of 0.02–100 µg/L.
2.5. Statistical Analysis
Statistical analyses were performed using SPSS Statistics (version 29.0.2.0; IBM, Armonk, NY, USA), MedCalc (version 19.1.6; MedCalc Software, Mariakerke, Belgium) for Windows, and Python version 3.13. A p-value <0.05 was considered statistically significant. Continuous variables and mortality outcomes were compared using the Mann–Whitney U-test, while categorical variables were analyzed with the chi-squared or Fisher’s exact test. The prognostic performance of WRS in differentiating survivors from non-survivors was evaluated using the area under the receiver operating characteristic (ROC) curve. Optimal cutoff values for distinguishing septic shock from sepsis and predicting 30-day mortality were determined via Youden’s index. Patients were stratified into two groups based on the optimal WRS cutoff to predict 30-day mortality, and Kaplan–Meier survival curves were compared using the log-rank test. Correlations between WRS and clinical variables were assessed by Spearman’s correlation analysis. Variables with p < 0.10 were included in the multivariable Cox proportional hazards model.
A logistic regression analysis was conducted to estimate the probability of 30-day mortality, with the logit transformation (logit(p)) calculated using the coefficients of the final model. The predicted logit(p) values were converted into probabilities of 30-day mortality, and model fit was evaluated using the Hosmer-Lemeshow test.
3. Results
3.1. Baseline Characteristics of the Study Population
Figure 1 shows a flowchart of the study population. Initially, 246 patients with sepsis were screened. Among them, three patients were excluded because of missing PCT data (n = 3). Finally, 243 patients with sepsis were enrolled in this study. The patients were classified into two groups: 1) sepsis (without shock) (n = 124), and 2) septic shock (n = 119). Each group was further divided into 30-day survival and mortality groups.
The baseline characteristics of the study population are presented in Table 1. There were no differences in age, sex, comorbidities, or infection sites between the two groups. Except for MEWS, clinical severity scores were higher in patients with septic shock than in those with sepsis. Systolic blood pressure, diastolic blood pressure, mean arterial pressure, and peripheral capillary oxygen saturation were lower in the septic shock group than in the non-septic shock group. Platelet and creatinine levels differed between the two groups. The WRS, P-SEP, PCT, and lactate levels were higher in patients with septic shock than in those with sepsis. CRP levels did not differ between the two groups. Mechanical ventilation was more frequently used in the septic shock group. Overall, the 7-, 14-, and 30-day mortality rates were higher in the septic shock group.
3.2. Diagnostic and Prognostic Value of Biomarkers
We assessed the clinical value of WRS in patients with sepsis using ROC curve analysis (Figure 2A, 2 B, Table 2). The area under the curve (AUC) to discriminate septic shock from sepsis was 0.588 for WRS (95% confidence interval [CI], 0.516–0.660; sensitivity, 67.2%; specificity, 50.8%; p = 0.018), 0.624 for P-SEP (95% CI, 0.554–0.695; sensitivity, 45.4%; specificity, 82.3%; p = 0.001), 0.685 for PCT (95% CI, 0.618–0.751; sensitivity, 59.7%; specificity, 71.0%; p < 0.001), and 0.669 for lactate (95% CI, 0.602–0.737; sensitivity, 93.3%; specificity, 13.7%; p < 0.001). The optimal cut-off values to discriminate septic shock from sepsis were 61.20 µg/L for WRS, 1286 ng/L for P-SEP, 3.08 µg/L for PCT, and 2.08 mmol/L for lactate. CRP could not discriminate between septic shock and sepsis (AUC, 0.549; 95% CI, 0.477–0.621; sensitivity, 74.8%; specificity, 23.4%; p = 0.187).
The AUC to predict 30-day mortality was 0.648 for WRS (95% CI, 0.569–0.726; sensitivity, 56.7%; specificity, 73.3%; p < 0.001), 0.610 for P-SEP (95% CI, 0.531–0.689; sensitivity, 64.2%; specificity, 57.4%; p = 0.008), 0.683 for lactate (95% CI, 0.606–0.759; sensitivity, 88.1%; specificity, 28.4%; p < 0.001). The optimal cut-off values for predicting 30-day mortality were 84.15 µg/L for WRS, 823 ng/L for P-SEP, and 4.42 mmol/L for lactate. However, CRP and PCT levels did not predict the 30-day mortality.
3.3. Combination of Clinical Severity Scores with Biomarkers
We investigated the prognostic value of clinical severity scores (Figure 2C, Table 2). Among the four clinical severity scores, SOFA score had the highest AUC (AUC, 0.732; 95% CI, 0.662–0.802; p < 0.001), followed by APACHE Ⅱ (AUC, 0.650; 95% CI, 0.572–0.727; p < 0.001), NEWS (AUC, 0.607; 95% CI, 0.523–0.691; p = 0.010), and MEWS (AUC, 0.553; 95% CI, 0.469–0.636; p = 0.206).
Figure 2D and Table 2 show the multivariable logistic regression model for predicting 30-day mortality using the SOFA score and the three biomarkers (WRS, P-SEP, and lactate). The log of probability was converted into the 30-day mortality probability using a regression equation. In the ROC curve analysis, the AUC of the SOFA score alone was 0.732 (95% CI, 0.662–0.802; p < 0.001), and the model was well calibrated (Hosmer–Lemeshow test; chi-squared = 4.633; df = 8; p = 0.796). When combining the SOFA score with WRS, the AUC was 0.748 (95% CI, 0.680–0.816; p < 0.001), and the model was well calibrated (Hosmer-Lemeshow test; chi-square = 4.633; df = 8; p = 0.796). When the SOFA score was combined with three biomarkers (WRS, P-SEP, and lactate), the AUC for predicting 30-day mortality increased to 0.761 (95% CI, 0.692–0.830; p < 0.001), and the model showed good calibration (Hosmer–Lemeshow test; chi-squared = 10.617; df = 8; p = 0.224).
3.4. Prognostic Value of WRS According to Microbial Culture Test Results
Figure 3 shows the prognostic values of WRS, P-SEP, and lactate according to the microbial culture test results, including blood, sputum, and urine cultures. Each Kaplan–Meier survival curve was stratified by the optimal cut-off value of WRS (84.15 µg/L, Figure 3A), P-SEP (823 ng/L, Figure 3E), or lactate (4.42 mmol/L; Figure 3I) to predict 30-day mortality. Overall, patients whose biomarker levels were above the cutoff value had higher 30-day mortality than those whose biomarker levels were below the cutoff value. In addition, patients whose biomarker levels were above the cutoff value were stratified based on the results of blood, sputum, or urine culture tests.
Among patients whose WRS levels were above the cutoff value, 30-day mortality did not differ between those with positive and negative blood culture results (p = 0.061; Figure 3B). Thirty-day mortality did not differ between the patients with positive and negative sputum culture results (p = 0.745; Figure 3C). Thirty-day mortality was higher in patients with positive urine cultures than in those with negative cultures (p = 0.040; Figure 3D). Among patients whose P-SEP levels were above the cutoff value, 30-day mortality was higher in those with positive blood cultures than in those with negative results (p = 0.042; Figure 3F). Thirty-day mortality did not differ between the patients with positive and negative sputum culture results (p = 0.130; Figure 3G). Thirty-day mortality also did not differ between patients with positive and negative urine culture results (p = 0.354; Figure 3H). Among patients whose lactate levels were above the cutoff value, 30-day mortality did not differ between positive and negative results for blood culture (p = 0.116; Figure 3J), sputum culture (p = 0.737; Figure 3K), and urine culture (p = 0.444; Figure 3L).
3.5. Prognostic Value of WRS According to Each Component of SOFA Score
We classified patients whose WRS, P-SEP, or lactate levels were above the cutoff value using the central nervous system SOFA (GCS SOFA) score, cardiovascular SOFA (BP SOFA) score, coagulation SOFA (PLT SOFA) score, renal SOFA (Cr SOFA) score, liver SOFA (Bili SOFA) score, and respiration SOFA (Resp SOFA) score (Figure 4A–R).
Among patients whose WRS levels were over the cut-off value, 30-day mortality was higher in those with PLT SOFA score ≥ 1 than in those with PLT SOFA score of 0 (p = 0.036; Figure 4C). Thirty-day mortality was higher in those with a Cr SOFA score ≥ 1 than in those with Cr SOFA score of 0 (p = 0.027; Figure 4D). However, 30-day mortality did not differ in between patients with the other components of SOFA score ≥ 1 and those with the other components of SOFA score of 0: GCS SOFA score (p = 0.655; Figure 4A), BP SOFA score (p = 0.109; Figure 4B), Bili SOFA score (p = 0.125; Figure 4E), and Resp SOFA score (p = 0.797; Figure 4F).
Among patients whose P-SEP levels were over the cut-off value, 30-day mortality was higher in those with BP SOFA score ≥ 1 than in those with a BP SOFA score of 0 (p = 0.014; Figure 4H). Thirty-day mortality was higher in patients with a PLT SOFA score ≥ 1 than in those with a PLT SOFA score of 0 (p = 0.002; Figure 4I). However, classification using GCS SOFA score (p = 0.506; Figure 4G), Cr SOFA score (p = 0.472; Figure 4J), Bili SOFA score (p = 0.070; Figure 4K), or Resp SOFA score (p = 0.349; Figure 4L) did not show differences in 30-day mortality between the two groups (each component of SOFA score of ≥ 1 vs that of SOFA score of 0).
Among patients whose lactate levels were over the cut-off value, the 30-day mortality was higher in patients with a SOFA score ≥ 1 than in those with a SOFA score of 0 when patients were classified by BP SOFA score (p < 0.001; Figure 4N), PLT SOFA score (p = 0.001; Figure 4O), and Bili SOFA score (p = 0.001; Figure 4Q). When patients were classified by GCS SOFA score (p = 0.968; Figure 4M), Cr SOFA score (p = 0.111; Figure 4P), and Resp SOFA score (p = 0.090; Figure 4R), 30-day mortality did not differ between patients with each component SOFA score of ≥ 1 and those with each component SOFA score of 0.
3.6. Correlation between WRS and Clinical Variables
Spearman’s correlation analysis showed that creatinine levels positively correlated with WRS (rho = 0.183, p = 0.004), P-SEP (rho = 0.541, p < 0.001), CRP (rho = 0.218, p = 0.001), PCT (rho = 0.302, p < 0.001), and lactate (rho = 0.191, p = 0.003). Among the tested biomarkers, the correlation coefficient was highest for P-SEP and lowest for WRS. The WRS levels positively correlated with the SOFA scores (rho = 0.223, p < 0.001). However, WRS did not correlate with NEWS (rho = 0.006, p = 0.926), MEWS (rho = 0.032, p = 0.619), or APACHE II (rho = 0.112, p = 0.082).
3.7. Comparison of Biomarker Levels According to Cr SOFA score
Figure 5 shows serum biomarker levels according to Cr SOFA score. Among the enrolled patients, those who had pre-existing kidney disease were excluded from this analysis (n = 20). Using Cr SOFA score of 0 as a reference value (n = 98), the patients with sepsis, including septic shock were sequentially stratified according to Cr SOFA score. Then we compared biomarker levels using Mann–Whitney U-test.
Patients with a Cr SOFA score of ≥ 1 (n = 125) did not have higher WRS levels than those in the reference group (93.35 vs 82.79 µg/L, p > 0.05). However, all the other biomarkers were higher in patients with Cr SOFA score of ≥ 1 than in the reference group (P-SEP, 1660 vs 778 ng/L, p < 0.001; CRP, 15.10 vs 10.94 mg/L, p < 0.01; PCT, 18.39 vs 7.56 µg/L, p < 0.01; lactate, 5.41 vs 3.97 mmol/L, p < 0.05).
Patients with a Cr SOFA score ≥ 2 (n = 55) did not have higher CRP levels than those in the reference group (17.40 vs 10.94 mg/L, p > 0.05). However, the other biomarkers were higher in patients with Cr SOFA ≥ 2 than in the reference group (WRS, 120.61 vs 82.79 µg/L, p < 0.05; P-SEP, 2371 vs 778 ng/L, p < 0.001; PCT, 25.47 vs 7.56 µg/L, p < 0.001; lactate, 6.68 vs 3.97 mmol/L, p < 0.001).
Patients with a Cr SOFA score ≥ 3 (n = 17) did not have higher WRS levels than the reference group (104.43 vs 82.79 µg/L, p > 0.05). However, the other biomarkers were higher in patients with Cr SOFA ≥ 2 than in the reference group (P-SEP, 2623 vs 778 ng/L, p < 0.001; CRP, 17.82 vs 10.94 mg/L, p < 0.05; PCT, 24.61 vs 7.56 µg/L, p < 0.01; lactate, 7.11 vs 3.97 mmol/L, p < 0.05).
Patients with Cr SOFA score of 4 (n = 6) did not have higher WRS or CRP levels than the reference group (WRS, 93.89 vs 82.79 µg/L, p > 0.05; CRP, 15.98 vs 10.94 mg/L, p > 0.05). However, P-SEP, PCT, and lactate levels were higher in patients with Cr SOFA score of 4 than in the reference group (P-SEP, 3088 vs 778 ng/L, p < 0.001; PCT, 43.17 vs 7.56 µg/L, p < 0.05; lactate, 6.62 vs 3.97 mmol/L, p < 0.05).
3.8. Risk Factors for 30-day Mortality in Sepsis
Cox proportional hazards model analysis was conducted to determine the risk factors associated with 30-day mortality among patients with sepsis. (Table 3). In the univariable analysis, the risk factors for 30-day mortality were WRS (hazard ratio [HR], 1.003; 95% CI, 1.001–1.005; p = 0.002) and lactate (HR, 1.116; 95% CI, 1.075–1.160; p < 0.001) levels. In the multivariable analysis, the risk factors for 30-day mortality were WRS (HR, 1.003; 95% CI, 1.001–1.005; p = 0.014) and lactate (HR, 1.110; 95% CI, 1.068–1.154; p < 0.001) levels. P-SEP, CRP, and PCT levels did not predict the 30-day mortality.
4. Discussion
We investigated the clinical value of WRS in sepsis patients who visited the ED. Those experiencing septic shock demonstrated greater WRS levels relative to patients with sepsis. WRS can also effectively predict 30-day mortality. Notably, WRS demonstrated strong predictive performance for 30-day mortality among sepsis patients presenting with bacteriuria or increased serum creatinine. A comparison of biomarker levels according to the Cr SOFA score suggests that WRS levels might be less influenced by kidney dysfunction than the established biomarkers.
According to the Sepsis-3 definition, sepsis is a severe medical condition characterized by organ failure triggered by a dysregulated host response to infection [1]. The performance of the SOFA score in predicting in-hospital mortality was similar to that of the Logistic Organ Dysfunction System and better than that of the SIRS or quick SOFA (qSOFA) [8]. SOFA score is now widely used to evaluate clinical severity of organ dysfunction [12,13,14]. A recent study showed that WRS levels positively correlated with SOFA score and mortality [19]. In the present study, WRS levels positively correlated with the SOFA score and creatinine, P-SEP, CRP, PCT, and lactate levels in patients with sepsis. These findings suggest that WRS levels could be associated with both organ dysfunction and prognosis in critically ill patients.
A recent ICU-based study reported that WRS could be useful not only for discriminating sepsis from non-infectious inflammation but also for predicting 28-day mortality in sepsis [25]. In that study, the AUC of WRS to predict 28-day mortality was 0.687 (cut-off value, 97.23 µg/L) in patients with sepsis. Similarly, our study showed that the AUC of WRS to predict 30-day mortality was 0.648 (optimal cut-off value, 84.15 µg/L) in patients with sepsis. Our results suggest that WRS levels can help predict short-term mortality among patients with sepsis in the ED.
Acute kidney injury (AKI) is a critical and common sepsis complication. Up to 60% of patients with sepsis experience AKI during their hospital stay [26,27]. Among patients with sepsis, those without pre-existing kidney disease should be considered a high-risk group for developing AKI [28]. Older adults are more vulnerable to urosepsis because one of the most common infection sources in this age group is the urinary tract [29]. PCT performs well in diagnosing sepsis, but its prognostic value for sepsis or septic shock is limited [16,30,31]. P-SEP may be a useful biomarker in the ED because plasma P-SEP levels are more rapidly elevated than those of PCT or CRP in patients with sepsis [32]. However, P-SEP has limited diagnostic performance in patients with kidney dysfunction because P-SEP levels positively correlate with Cr levels [33,34].
Our study showed that WRS has excellent prognostic value in sepsis patients with positive urine culture results or high serum creatinine levels. This result suggests that patients with elevated WRS levels and positive urine culture or high serum creatinine levels should be considered as a high-risk group for mortality and treated more carefully. For these patients, we recommend the earlier initiation of active interventions, including renal replacement therapy and administration of antibiotics.
Our study showed that WRS had the lowest correlation coefficient with serum creatinine levels among the tested biomarkers. If the biomarker levels are strongly influenced by kidney dysfunction and serum creatinine levels, it may be difficult to discriminate sepsis without AKI from AKI without sepsis. For example, P-SEP levels in patients receiving hemodialysis without infection may be as high as those in patients with sepsis or septic shock [34]. WRS levels appear to be less influenced by serum creatinine levels than by other biomarkers in patients with sepsis. This suggests that WRS levels can predict sepsis more effectively than other established biomarkers in creatinine-elevated conditions.
A previous study suggested that WRS could be a therapeutic target for various clinical conditions such as malignancy [20]. Another study that examined the expression of WRS in cancer tissues indicated that the role of WRS in tumor biology is complex and appears to be context-dependent [35]. Studies have shown that elevated WRS levels in gastric adenocarcinoma, ovarian, and colorectal cancers correlate with favorable prognosis and can serve as predictive markers to guide the avoidance of adjuvant chemotherapy post-surgery in resectable gastric adenocarcinoma [36,37,38]. In contrast, elevated WRS levels positively correlated with tumor stage, invasion, and depth in oral squamous cell carcinoma [39]. Our data showed that median WRS levels were higher in patients with malignancy than in those without malignancy (100.60 vs 64.50 µg/L, p < 0.001) among patients with sepsis. Although this suggests that high levels of WRS might be associated with malignancy, the commercial kit used in our study could detect only FL-WRS, not mini-WRS. The alternative splice form Mini-WRS, which lacks the N-terminal 47 amino acids, has been shown to exert antiangiogenic effects. [40,41]. However, FL-WRS, which retains the entire N-terminal extension, does not display angiostatic activity. [42,43]. Since the commercial assay exclusively detects FL-WRS, the reason for the markedly elevated FL-WRS levels observed in patients with malignancy in our study remains unclear. Additional experimental investigations are warranted to elucidate the role of WRS in tumor biology.
Our work had several limitations. First, this was a single-center ED-based study, making the generalization of our results to other populations difficult. A prospective multicenter study with a bigger sample size should be performed to confirm our results. Second, we did not analyze the serial measurements of WRS levels because our study only measured the initial WRS levels in the ED. Further prospective studies with serial measurements of WRS levels are needed to reflect the dynamic changes in patients with sepsis and septic shock. Third, there was a time gap between blood sampling and WRS measurements. Venous blood was drawn into ethylenediaminetetraacetic acid tubes within 6 hours following admission to the emergency department. To minimize protein degradation, blood samples were centrifuged at 800 × g for 15 minutes at 4 ℃. The plasma supernatants were then aliquoted without delay and stored at −80 ℃ in the biobank. All analyses were performed within 3 months of blood sampling in the ED. We defrosted the blood sample only once for the WRS measurement. Fourth, this study did not include a control group, such as patients with noninfectious inflammation or noninfectious organ failure. Further prospective studies including appropriate control groups are required to evaluate the diagnostic performance of the WRS among critically ill patients.
5. Conclusions
WRS is a novel biomarker that can help predict clinical outcomes in patients having sepsis. In particular, the prognostic performance of WRS levels was remarkable in sepsis patients with kidney dysfunction or urinary tract infection. The combination of SOFA score, WRS, P-SEP, and lactate level showed excellent value in predicting 30-day mortality among patients with sepsis. Future large-scale, prospective multicenter investigations are required to confirm these results.
Author Contributions
Conceptualization, J.S. and D.W.P.; methodology, J.S. and D.W.P.; validation, J.S., D.W.P. and U.K.; formal analysis, S.L. (Sijin Lee), K.S.H., S.J.K. and S.L. (Sungwoo Lee); data curation, J.S. and U.K.; writing—original draft preparation, J.S., D.W.P. and U.K.; writing—review and editing, J.S., D.W.P. and U.K.; visualization, U.K.; supervision, J.S. and D.W.P.; funding acquisition, J.S and D.W.P. All authors have read and agreed to the published version of the manuscript.
Funding
This work was funded in part by a National Research Foundation (NRF) grant from the Korean Government (MSIT) (No. 2020R1C1C1010362, No. RS-2023-00208807), and Korea University Anam Hospital Grant (No. K2514031, No. K2401001) (all were received by J.S.). This work was funded in part by a National Research Foundation (NRF) grant from the Korean Government (MSIT) (No. 2020R1F1A1071620, No. RS-2023-00220894, No. RS-2025-00563782) (all received from D.W.P.).
Institutional Review Board Statement
This study adhered to the ethical standards of the Declaration of Helsinki and received approval from the Institutional Review Board of Korea University Medical Center (IRB no. 2020AS0216, approval date: 28 July 2020). All patients included in this study (or their legal guardians) provided written informed consent.
Informed Consent Statement
Informed consent was obtained from all patients enrolled in the study.
Data Availability Statement
Raw data can be obtained upon request from the corresponding author.
Conflicts of Interest
The authors declare no conflicts of interest.
Abbreviations
The following abbreviations are used in this manuscript:
| AKI | Acute kidney injury |
| APACHE Ⅱ | Acute Physiology and Chronic Health Evaluation Ⅱ |
| AUC | Area under the curve |
| Bili SOFA | Liver SOFA |
| BP SOFA | Cardiovascular SOFA |
| CI | Confidence interval |
| Cr SOFA | Renal SOFA |
| CRP | C-reactive protein |
| DBP | Diastolic blood pressure |
| ED | Emergency department |
| FL-WRS | Full-length WRS |
| GCS SOFA | Central nervous system SOFA |
| ICU | Intensive care units |
| IQR | Interquartile ragne |
| MAP | Mean arterial pressure |
| MEWS | Modified Early Warning Score |
| NEWS | National Early Warning Score |
| PCT | Procalcitonin |
| PLT | Coagulation SOFA |
| P-SEP | Presepsin |
| qSOFA | Quick SOFA |
| Resp SOFA | Respiration SOFA |
| ROC | Receiver operating characteristic |
| SBP | Systolic blood pressure |
| Sepsis-3 | Third International Consensus Definitions for Sepsis and Septic shock |
| SOFA | Sequential Organ Failure Assessment |
| SpO2 | Saturation of percutaneous oxygen |
| WRS | Tryptophanyl-tRNA synthetase |
References
- Singer, M.; Deutschman, C.S.; Seymour, C.W.; Shankar-Hari, M.; Annane, D.; Bauer, M.; Bellomo, R.; Bernard, G.R.; Chiche, J.D.; Coopersmith, C.M.; et al. The Third International Consensus Definitions for Sepsis and Septic Shock (Sepsis-3). Jama 2016, 315, 801–810. [Google Scholar] [CrossRef]
- Angus, D.C.; van der Poll, T. Severe sepsis and septic shock. N Engl J Med 2013, 369, 840–851. [Google Scholar] [CrossRef]
- Bauer, M.; Gerlach, H.; Vogelmann, T.; Preissing, F.; Stiefel, J.; Adam, D. Mortality in sepsis and septic shock in Europe, North America and Australia between 2009 and 2019- results from a systematic review and meta-analysis. Crit Care 2020, 24, 239. [Google Scholar] [CrossRef]
- Gaieski, D.F.; Edwards, J.M.; Kallan, M.J.; Carr, B.G. Benchmarking the incidence and mortality of severe sepsis in the United States. Crit Care Med 2013, 41, 1167–1174. [Google Scholar] [CrossRef]
- De Backer, D.; Dorman, T. Surviving Sepsis Guidelines: A Continuous Move Toward Better Care of Patients With Sepsis. Jama 2017, 317, 807–808. [Google Scholar] [CrossRef]
- Evans, L.; Rhodes, A.; Alhazzani, W.; Antonelli, M.; Coopersmith, C.M.; French, C.; Machado, F.R.; McIntyre, L.; Ostermann, M.; Prescott, H.C.; et al. Surviving Sepsis Campaign: International Guidelines for Management of Sepsis and Septic Shock 2021. Crit Care Med 2021, 49, e1063–e1143. [Google Scholar] [CrossRef]
- Gotts, J.E.; Matthay, M.A. Sepsis: pathophysiology and clinical management. Bmj 2016, 353, i1585. [Google Scholar] [CrossRef]
- Seymour, C.W.; Liu, V.X.; Iwashyna, T.J.; Brunkhorst, F.M.; Rea, T.D.; Scherag, A.; Rubenfeld, G.; Kahn, J.M.; Shankar-Hari, M.; Singer, M.; et al. Assessment of Clinical Criteria for Sepsis: For the Third International Consensus Definitions for Sepsis and Septic Shock (Sepsis-3). Jama 2016, 315, 762–774. [Google Scholar] [CrossRef]
- Shankar-Hari, M.; Phillips, G.S.; Levy, M.L.; Seymour, C.W.; Liu, V.X.; Deutschman, C.S.; Angus, D.C.; Rubenfeld, G.D.; Singer, M. Developing a New Definition and Assessing New Clinical Criteria for Septic Shock: For the Third International Consensus Definitions for Sepsis and Septic Shock (Sepsis-3). Jama 2016, 315, 775–787. [Google Scholar] [CrossRef]
- Klimpel, J.; Weidhase, L.; Bernhard, M.; Gries, A.; Petros, S. The impact of the Sepsis-3 definition on ICU admission of patients with infection. Scand J Trauma Resusc Emerg Med 2019, 27, 98. [Google Scholar] [CrossRef]
- Shashikumar, S.P.; Stanley, M.D.; Sadiq, I.; Li, Q.; Holder, A.; Clifford, G.D.; Nemati, S. Early sepsis detection in critical care patients using multiscale blood pressure and heart rate dynamics. J Electrocardiol 2017, 50, 739–743. [Google Scholar] [CrossRef]
- Vincent, J.L.; de Mendonça, A.; Cantraine, F.; Moreno, R.; Takala, J.; Suter, P.M.; Sprung, C.L.; Colardyn, F.; Blecher, S. Use of the SOFA score to assess the incidence of organ dysfunction/failure in intensive care units: results of a multicenter, prospective study. Working group on “sepsis-related problems” of the European Society of Intensive Care Medicine. Crit Care Med 1998, 26, 1793–1800. [Google Scholar] [CrossRef]
- Gourd, N.M.; Nikitas, N. Multiple Organ Dysfunction Syndrome. J Intensive Care Med 2020, 35, 1564–1575. [Google Scholar] [CrossRef]
- Vincent, J.L. Organ failure in the intensive care unit. Semin Respir Crit Care Med 2011, 32, 541–542. [Google Scholar] [CrossRef] [PubMed]
- Wu, Q.; Yang, H.; Kang, Y. Combined assessment of ΔPCT and ΔCRP could increase the ability to differentiate candidemia from bacteremia. Crit Care 2019, 23, 271. [Google Scholar] [CrossRef] [PubMed]
- Song, J.; Park, D.W.; Moon, S.; Cho, H.J.; Park, J.H.; Seok, H.; Choi, W.S. Diagnostic and prognostic value of interleukin-6, pentraxin 3, and procalcitonin levels among sepsis and septic shock patients: a prospective controlled study according to the Sepsis-3 definitions. BMC Infect Dis 2019, 19, 968. [Google Scholar] [CrossRef]
- Chenevier-Gobeaux, C.; Trabattoni, E.; Roelens, M.; Borderie, D.; Claessens, Y.E. Presepsin (sCD14-ST) in emergency department: the need for adapted threshold values? Clin Chim Acta 2014, 427, 34–36. [Google Scholar] [CrossRef]
- Pizzolato, E.; Ulla, M.; Galluzzo, C.; Lucchiari, M.; Manetta, T.; Lupia, E.; Mengozzi, G.; Battista, S. Role of presepsin for the evaluation of sepsis in the emergency department. Clin Chem Lab Med 2014, 52, 1395–1400. [Google Scholar] [CrossRef]
- Jin, M. Unique roles of tryptophanyl-tRNA synthetase in immune control and its therapeutic implications. Exp Mol Med 2019, 51, 1–10. [Google Scholar] [CrossRef]
- Ahn, Y.H.; Oh, S.C.; Zhou, S.; Kim, T.D. Tryptophanyl-tRNA Synthetase as a Potential Therapeutic Target. Int J Mol Sci 2021, 22. [Google Scholar] [CrossRef]
- Jobin, P.G.; Solis, N.; Machado, Y.; Bell, P.A.; Kwon, N.H.; Kim, S.; Overall, C.M.; Butler, G.S. Matrix metalloproteinases inactivate the proinflammatory functions of secreted moonlighting tryptophanyl-tRNA synthetase. J Biol Chem 2019, 294, 12866–12879. [Google Scholar] [CrossRef]
- Ahn, Y.H.; Park, S.; Choi, J.J.; Park, B.K.; Rhee, K.H.; Kang, E.; Ahn, S.; Lee, C.H.; Lee, J.S.; Inn, K.S.; et al. Secreted tryptophanyl-tRNA synthetase as a primary defence system against infection. Nat Microbiol 2016, 2, 16191. [Google Scholar] [CrossRef]
- Ellis, C.N.; LaRocque, R.C.; Uddin, T.; Krastins, B.; Mayo-Smith, L.M.; Sarracino, D.; Karlsson, E.K.; Rahman, A.; Shirin, T.; Bhuiyan, T.R.; et al. Comparative proteomic analysis reveals activation of mucosal innate immune signaling pathways during cholera. Infect Immun 2015, 83, 1089–1103. [Google Scholar] [CrossRef]
- Wieland, S.; Thimme, R.; Purcell, R.H.; Chisari, F.V. Genomic analysis of the host response to hepatitis B virus infection. Proc Natl Acad Sci U S A 2004, 101, 6669–6674. [Google Scholar] [CrossRef] [PubMed]
- Choi, J.S.; Yoon, B.R.; Shin, J.H.; Lee, S.H.; Leem, A.Y.; Park, M.S.; Kim, Y.S.; Chung, K.S. Clinical value of full-length tryptophanyl-tRNA synthetase for sepsis detection in critically ill patients - A retrospective clinical assessment. Int J Infect Dis 2020, 97, 260–266. [Google Scholar] [CrossRef] [PubMed]
- Bagshaw, S.M.; Lapinsky, S.; Dial, S.; Arabi, Y.; Dodek, P.; Wood, G.; Ellis, P.; Guzman, J.; Marshall, J.; Parrillo, J.E.; et al. Acute kidney injury in septic shock: clinical outcomes and impact of duration of hypotension prior to initiation of antimicrobial therapy. Intensive Care Med 2009, 35, 871–881. [Google Scholar] [CrossRef] [PubMed]
- Uchino, S.; Kellum, J.A.; Bellomo, R.; Doig, G.S.; Morimatsu, H.; Morgera, S.; Schetz, M.; Tan, I.; Bouman, C.; Macedo, E.; et al. Acute renal failure in critically ill patients: a multinational, multicenter study. Jama 2005, 294, 813–818. [Google Scholar] [CrossRef]
- Zarbock, A.; Koyner, J.L.; Gomez, H.; Pickkers, P.; Forni, L. Sepsis-associated acute kidney injury-treatment standard. Nephrol Dial Transplant 2023, 39, 26–35. [Google Scholar] [CrossRef]
- Petrosillo, N.; Granata, G.; Boyle, B.; Doyle, M.M.; Pinchera, B.; Taglietti, F. Preventing sepsis development in complicated urinary tract infections. Expert Rev Anti Infect Ther 2020, 18, 47–61. [Google Scholar] [CrossRef]
- Balkrishna, A.; Sinha, S.; Kumar, A.; Arya, V.; Gautam, A.K.; Valis, M.; Kuca, K.; Kumar, D.; Amarowicz, R. Sepsis-mediated renal dysfunction: Pathophysiology, biomarkers and role of phytoconstituents in its management. Biomed Pharmacother 2023, 165, 115183. [Google Scholar] [CrossRef]
- Lee, S.; Song, J.; Park, D.W.; Seok, H.; Ahn, S.; Kim, J.; Park, J.; Cho, H.J.; Moon, S. Diagnostic and prognostic value of presepsin and procalcitonin in non-infectious organ failure, sepsis, and septic shock: a prospective observational study according to the Sepsis-3 definitions. BMC Infect Dis 2022, 22, 8. [Google Scholar] [CrossRef]
- Paraskevas, T.; Chourpiliadi, C.; Demiri, S.; Micahilides, C.; Karanikolas, E.; Lagadinou, M.; Velissaris, D. Presepsin in the diagnosis of sepsis. Clin Chim Acta 2023, 550, 117588. [Google Scholar] [CrossRef]
- Miyoshi, M.; Inoue, Y.; Nishioka, M.; Ikegame, A.; Nakao, T.; Kishi, S.; Doi, T.; Nagai, K. Clinical evaluation of presepsin considering renal function. PLoS One 2019, 14, e0215791. [Google Scholar] [CrossRef]
- Nagata, T.; Yasuda, Y.; Ando, M.; Abe, T.; Katsuno, T.; Kato, S.; Tsuboi, N.; Matsuo, S.; Maruyama, S. Clinical impact of kidney function on presepsin levels. PLoS One 2015, 10, e0129159. [Google Scholar] [CrossRef]
- Uhlén, M.; Björling, E.; Agaton, C.; Szigyarto, C.A.; Amini, B.; Andersen, E.; Andersson, A.C.; Angelidou, P.; Asplund, A.; Asplund, C.; et al. A human protein atlas for normal and cancer tissues based on antibody proteomics. Mol Cell Proteomics 2005, 4, 1920–1932. [Google Scholar] [CrossRef]
- Cheong, J.H.; Yang, H.K.; Kim, H.; Kim, W.H.; Kim, Y.W.; Kook, M.C.; Park, Y.K.; Kim, H.H.; Lee, H.S.; Lee, K.H.; et al. Predictive test for chemotherapy response in resectable gastric cancer: a multi-cohort, retrospective analysis. Lancet Oncol 2018, 19, 629–638. [Google Scholar] [CrossRef]
- Ghanipour, A.; Jirström, K.; Pontén, F.; Glimelius, B.; Påhlman, L.; Birgisson, H. The prognostic significance of tryptophanyl-tRNA synthetase in colorectal cancer. Cancer Epidemiol Biomarkers Prev 2009, 18, 2949–2956. [Google Scholar] [CrossRef] [PubMed]
- Patil, P.A.; Blakely, A.M.; Lombardo, K.A.; Machan, J.T.; Miner, T.J.; Wang, L.J.; Marwaha, A.S.; Matoso, A. Expression of PD-L1, indoleamine 2,3-dioxygenase and the immune microenvironment in gastric adenocarcinoma. Histopathology 2018, 73, 124–136. [Google Scholar] [CrossRef] [PubMed]
- Lee, C.W.; Chang, K.P.; Chen, Y.Y.; Liang, Y.; Hsueh, C.; Yu, J.S.; Chang, Y.S.; Yu, C.J. Overexpressed tryptophanyl-tRNA synthetase, an angiostatic protein, enhances oral cancer cell invasiveness. Oncotarget 2015, 6, 21979–21992. [Google Scholar] [CrossRef] [PubMed]
- Guo, M.; Yang, X.L.; Schimmel, P. New functions of aminoacyl-tRNA synthetases beyond translation. Nat Rev Mol Cell Biol 2010, 11, 668–674. [Google Scholar] [CrossRef]
- Xu, X.; Zhou, H.; Zhou, Q.; Hong, F.; Vo, M.N.; Niu, W.; Wang, Z.; Xiong, X.; Nakamura, K.; Wakasugi, K.; et al. An alternative conformation of human TrpRS suggests a role of zinc in activating non-enzymatic function. RNA Biol 2018, 15, 649–658. [Google Scholar] [CrossRef] [PubMed]
- Nakamoto, T.; Miyanokoshi, M.; Tanaka, T.; Wakasugi, K. Identification of a residue crucial for the angiostatic activity of human mini tryptophanyl-tRNA synthetase by focusing on its molecular evolution. Sci Rep 2016, 6, 24750. [Google Scholar] [CrossRef] [PubMed]
- Tzima, E.; Schimmel, P. Inhibition of tumor angiogenesis by a natural fragment of a tRNA synthetase. Trends Biochem Sci 2006, 31, 7–10. [Google Scholar] [CrossRef] [PubMed]
Figure 1.
Flowchart of the study population.
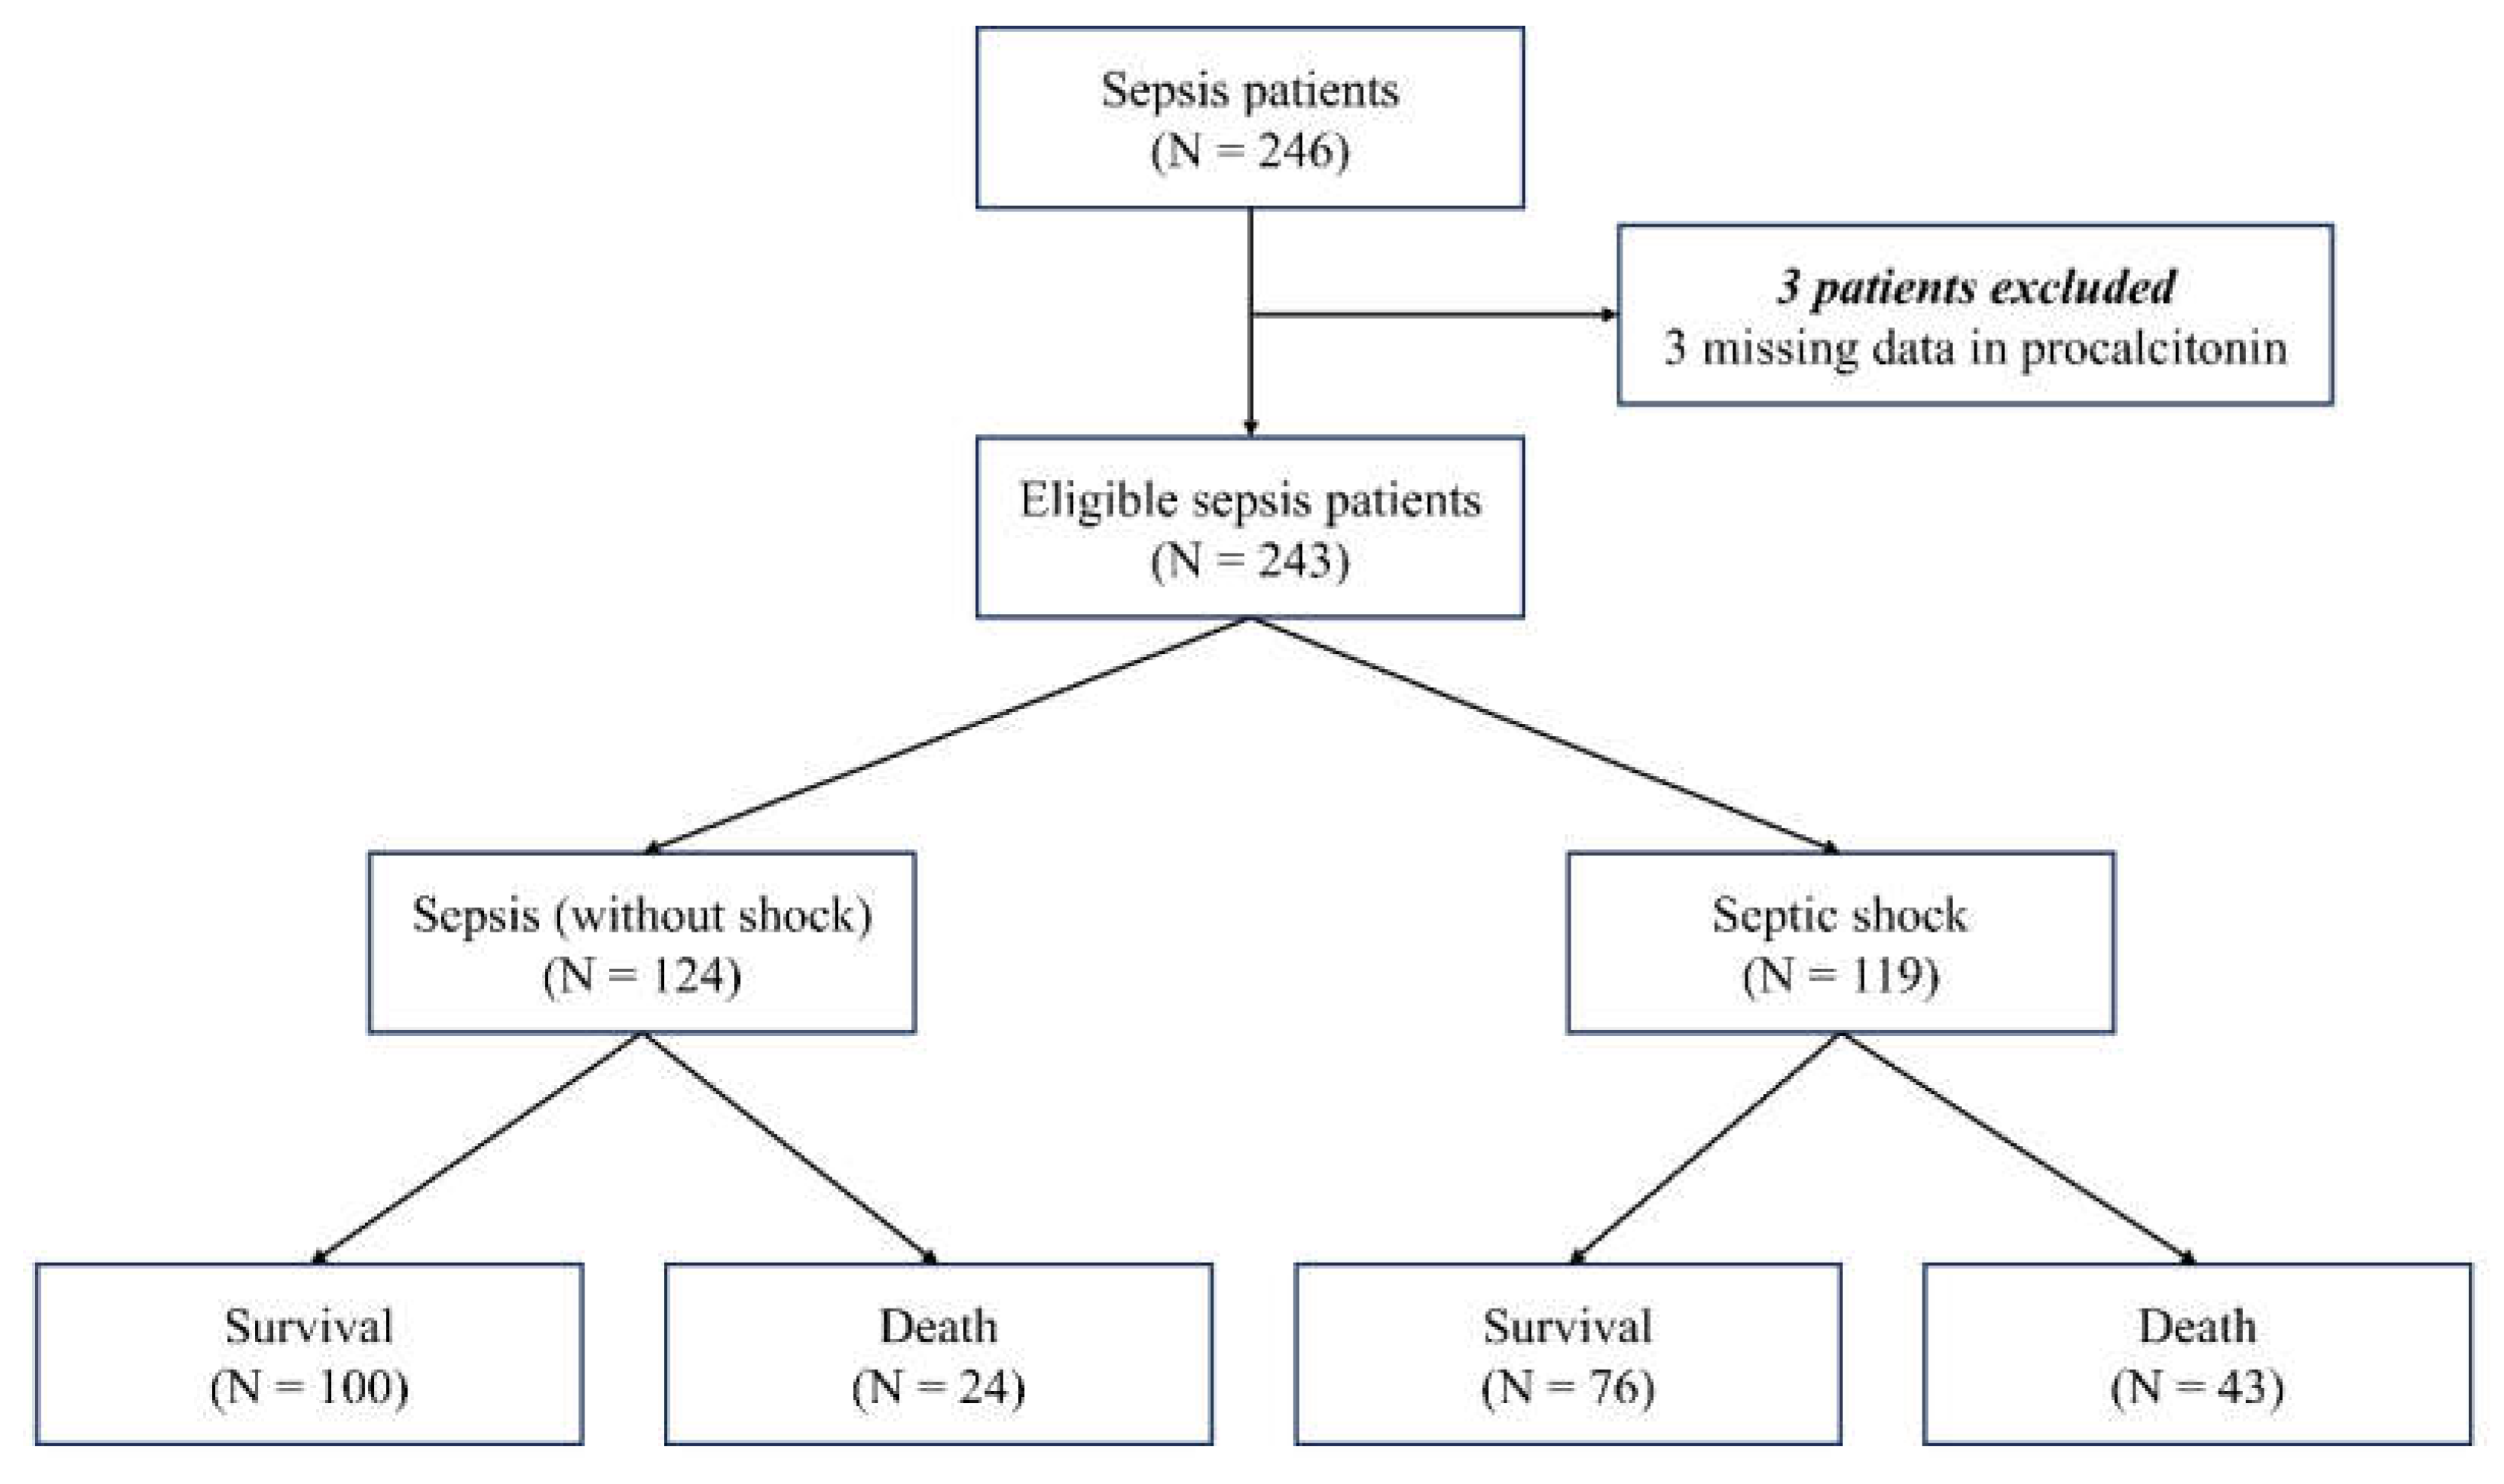
Figure 2.
Receiver operating characteristic curves analysis (A) Diagnostic value of biomarkers for discriminating septic shock from sepsis. (B) Prognostic value of biomarkers for predicting 30-day mortality. (C) Prognostic value of early warning scores or severity indices for predicting 30-day mortality. (D) Combinations of the SOFA score with biomarkers for predicting 30-day mortality. WRS, tryptophanyl-tRNA synthetase; P-SEP, presepsin; CRP, C-reactive protein; PCT, procalcitonin; SOFA, sequential organ failure assessment; NEWS, national early warning score; MEWS, modified early warning score; APACHE Ⅱ, acute physiology and chronic health evaluation Ⅱ; AUC, area under the curve.
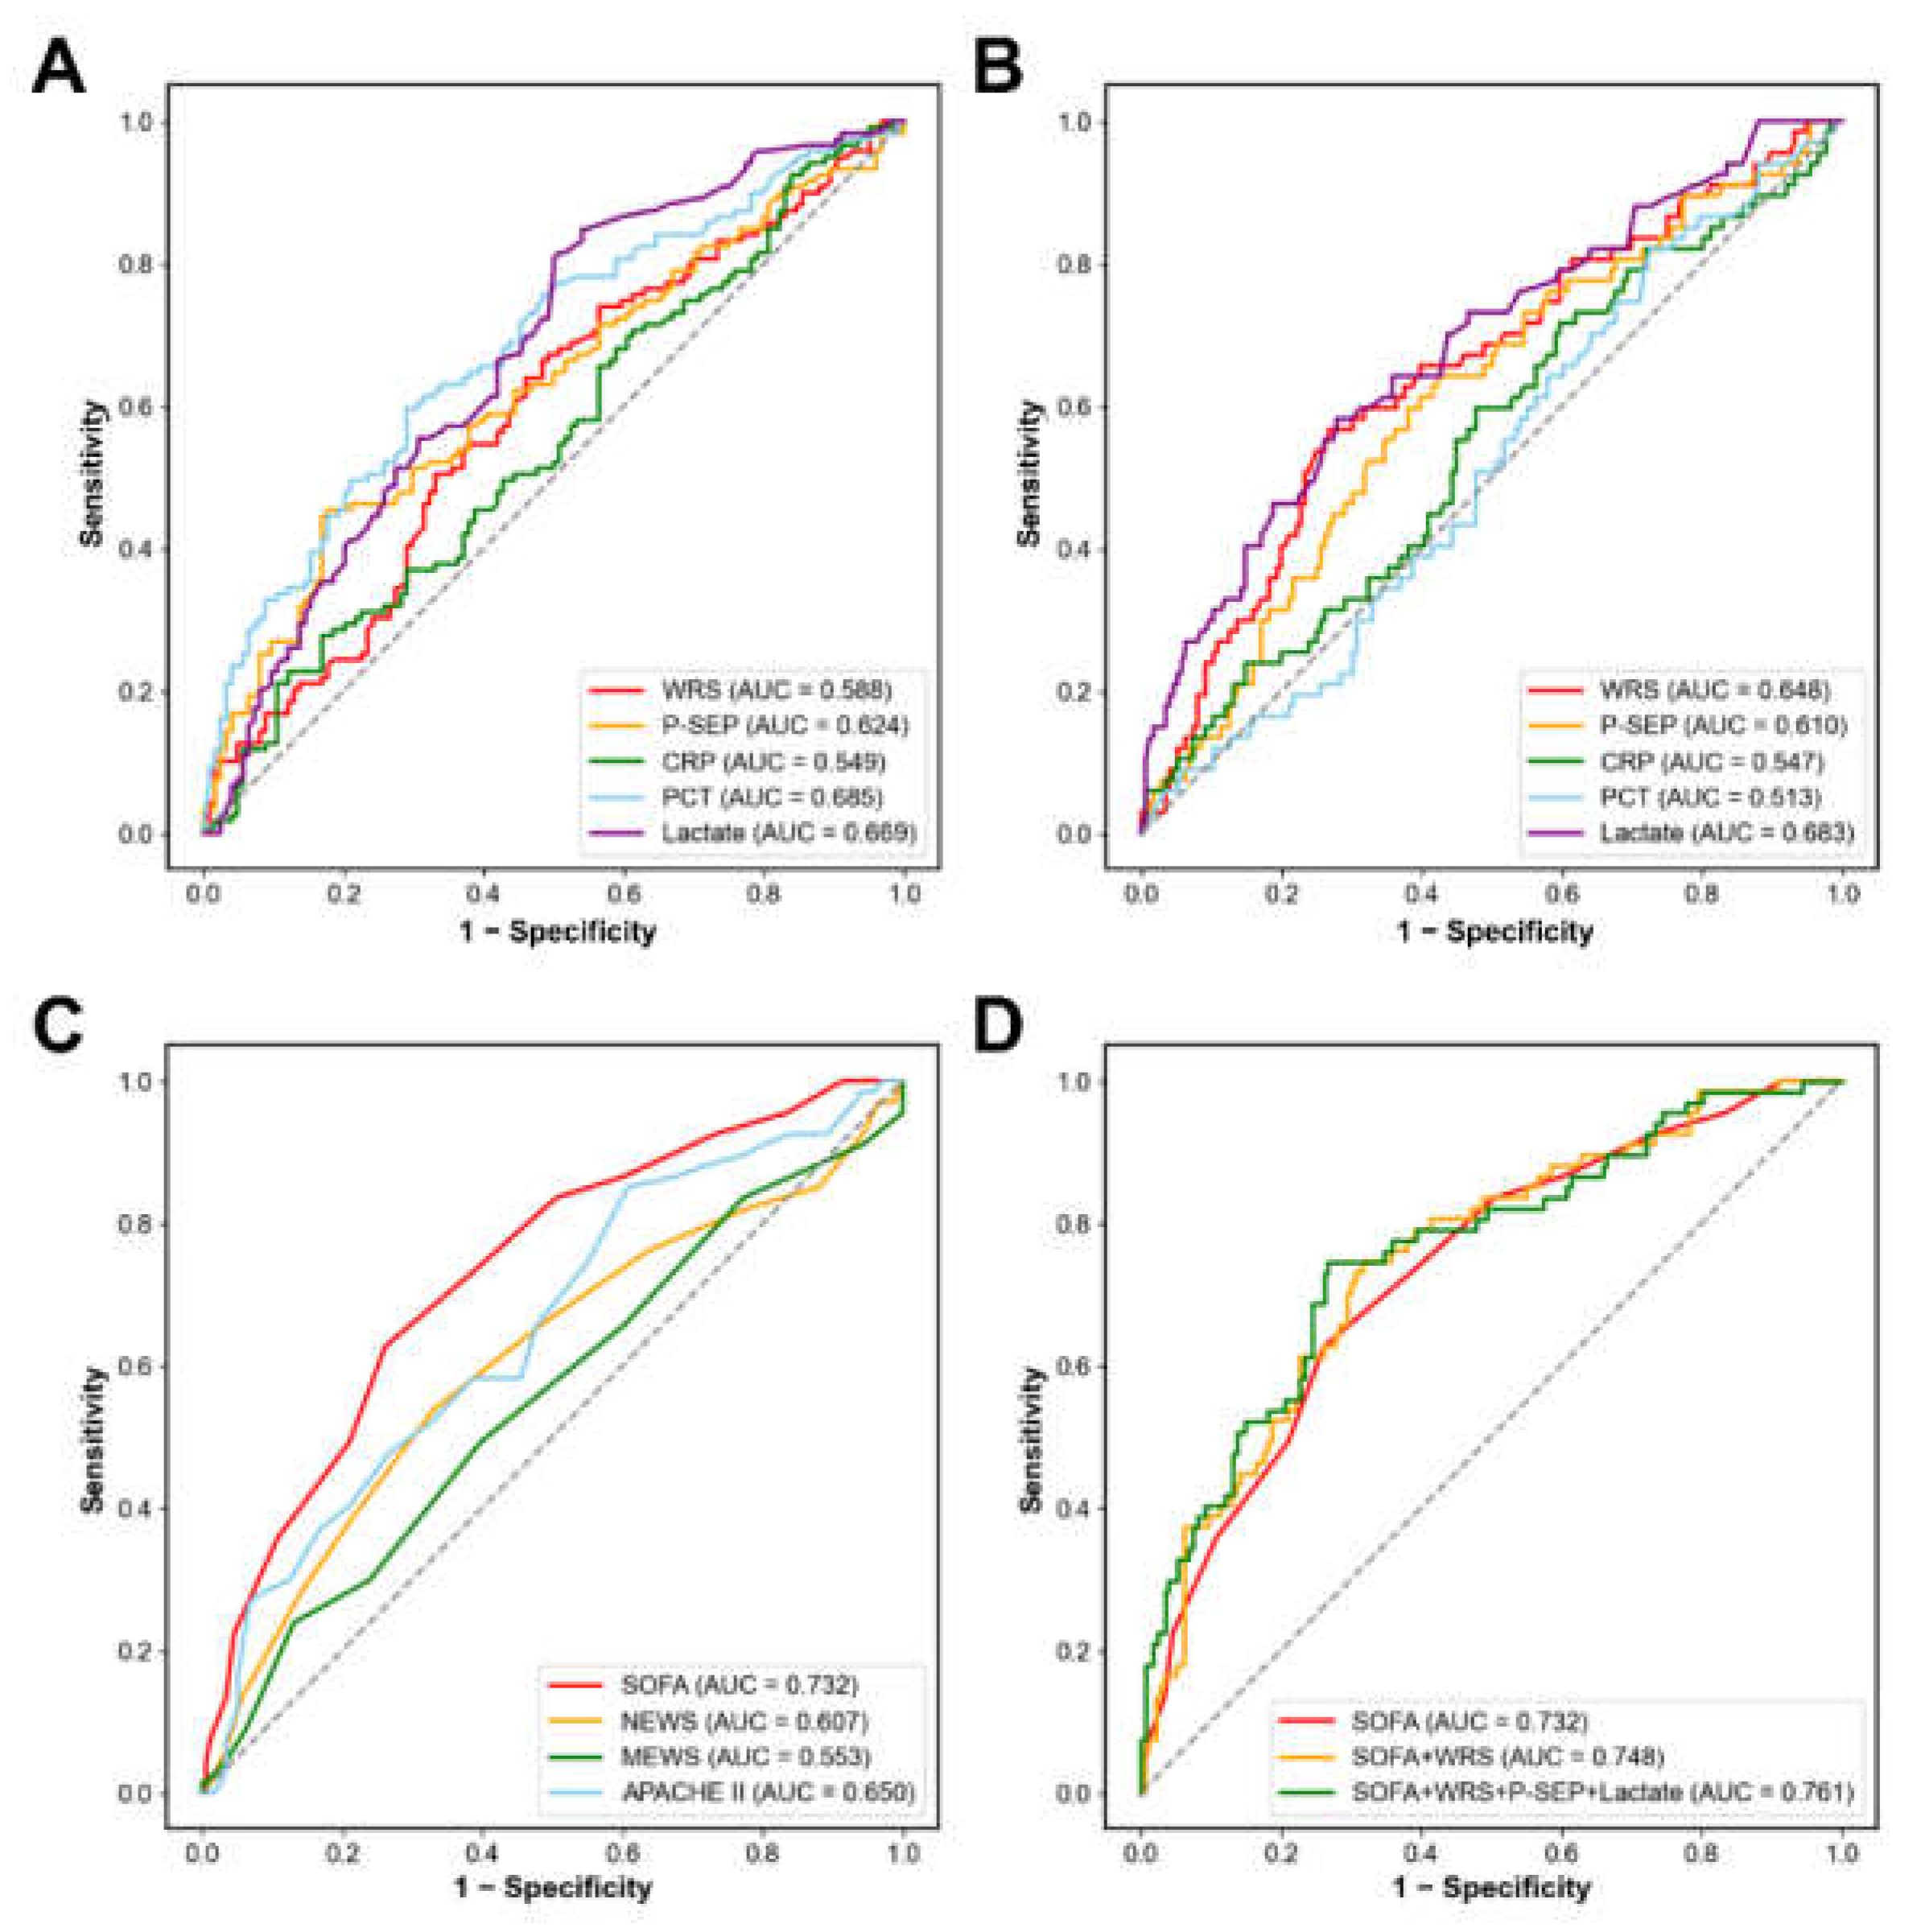
Figure 3.
Kaplan–Meier survival curves analysis according to microorganism culture test results. (A–D) WRS. (E–H) P-SEP. (I–L) Lactate. (A, E, I) Biomarker levels over the cut-off value vs below the cut-off value. (B, F, J) Biomarker levels over the cut-off value with blood culture positive vs negative. (C, G, K) Biomarker levels over the cut-off value with sputum culture positive vs negative. (D, H, L) Biomarker levels over the cut-off value with urine culture positive vs negative. *p < 0.05, **p < 0.01, ***p < 0.001. WRS, tryptophanyl-tRNA synthetase; P-SEP, presepsin.
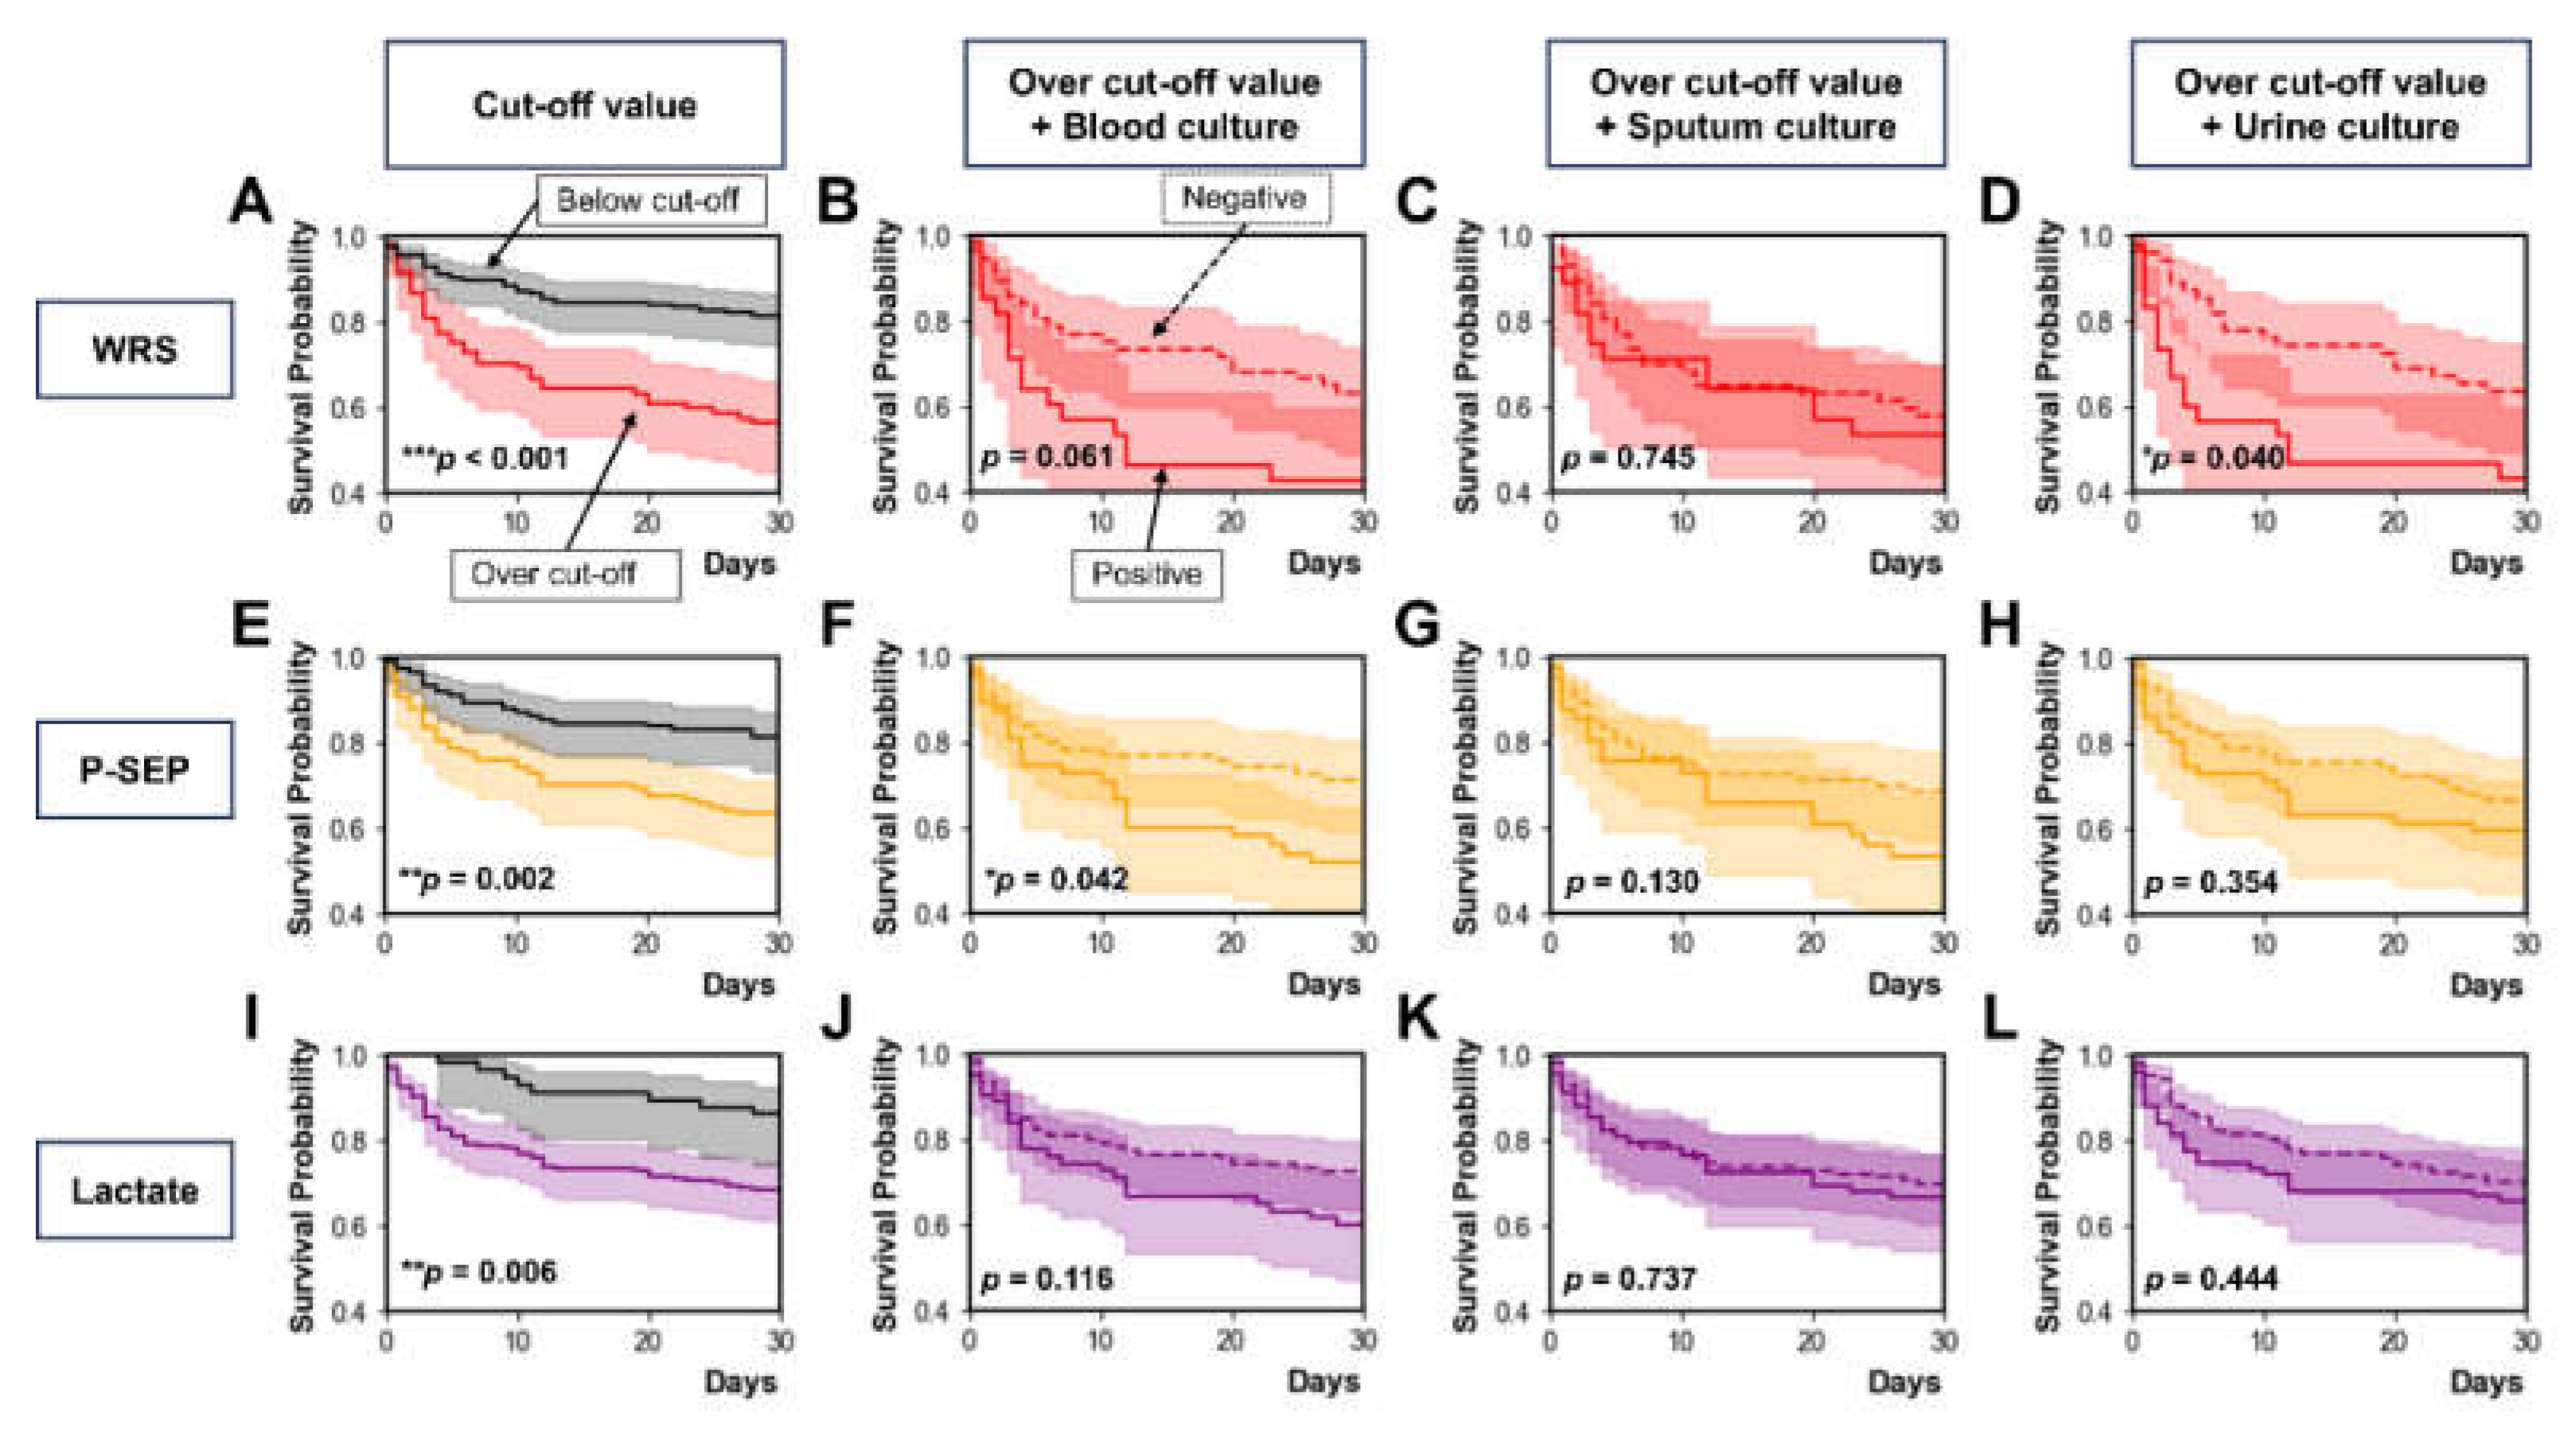
Figure 4.
Kaplan–Meier survival curves analysis according to SOFA score. (A–F) WRS. (G–L) P-SEP. (M–R) Lactate. (A, G, M) GCS SOFA score ≥ 1 vs GCS SOFA score of 0. (B, H, N) BP SOFA score ≥ 1 vs BP SOFA score of 0. (C, I, O) PLT SOFA score ≥ 1 vs PLT SOFA score of 0. (D, J, P) Cr SOFA score ≥ 1 vs Cr SOFA score of 0. (E, K, Q) Bili SOFA score ≥ 1 vs Bili SOFA score of 0. (F, L, R) Resp SOFA score ≥ 1 vs GCS SOFA score of 0. *p < 0.05, **p < 0.01, ***p < 0.001. WRS, tryptophanyl-tRNA synthetase; P-SEP, presepsin; GCS SOFA, central nervous system SOFA; BP SOFA, cardiovascular SOFA; PLT SOFA, coagulation SOFA; Cr SOFA, renal SOFA score; Bili SOFA, liver SOFA; Resp SOFA, respiration SOFA.
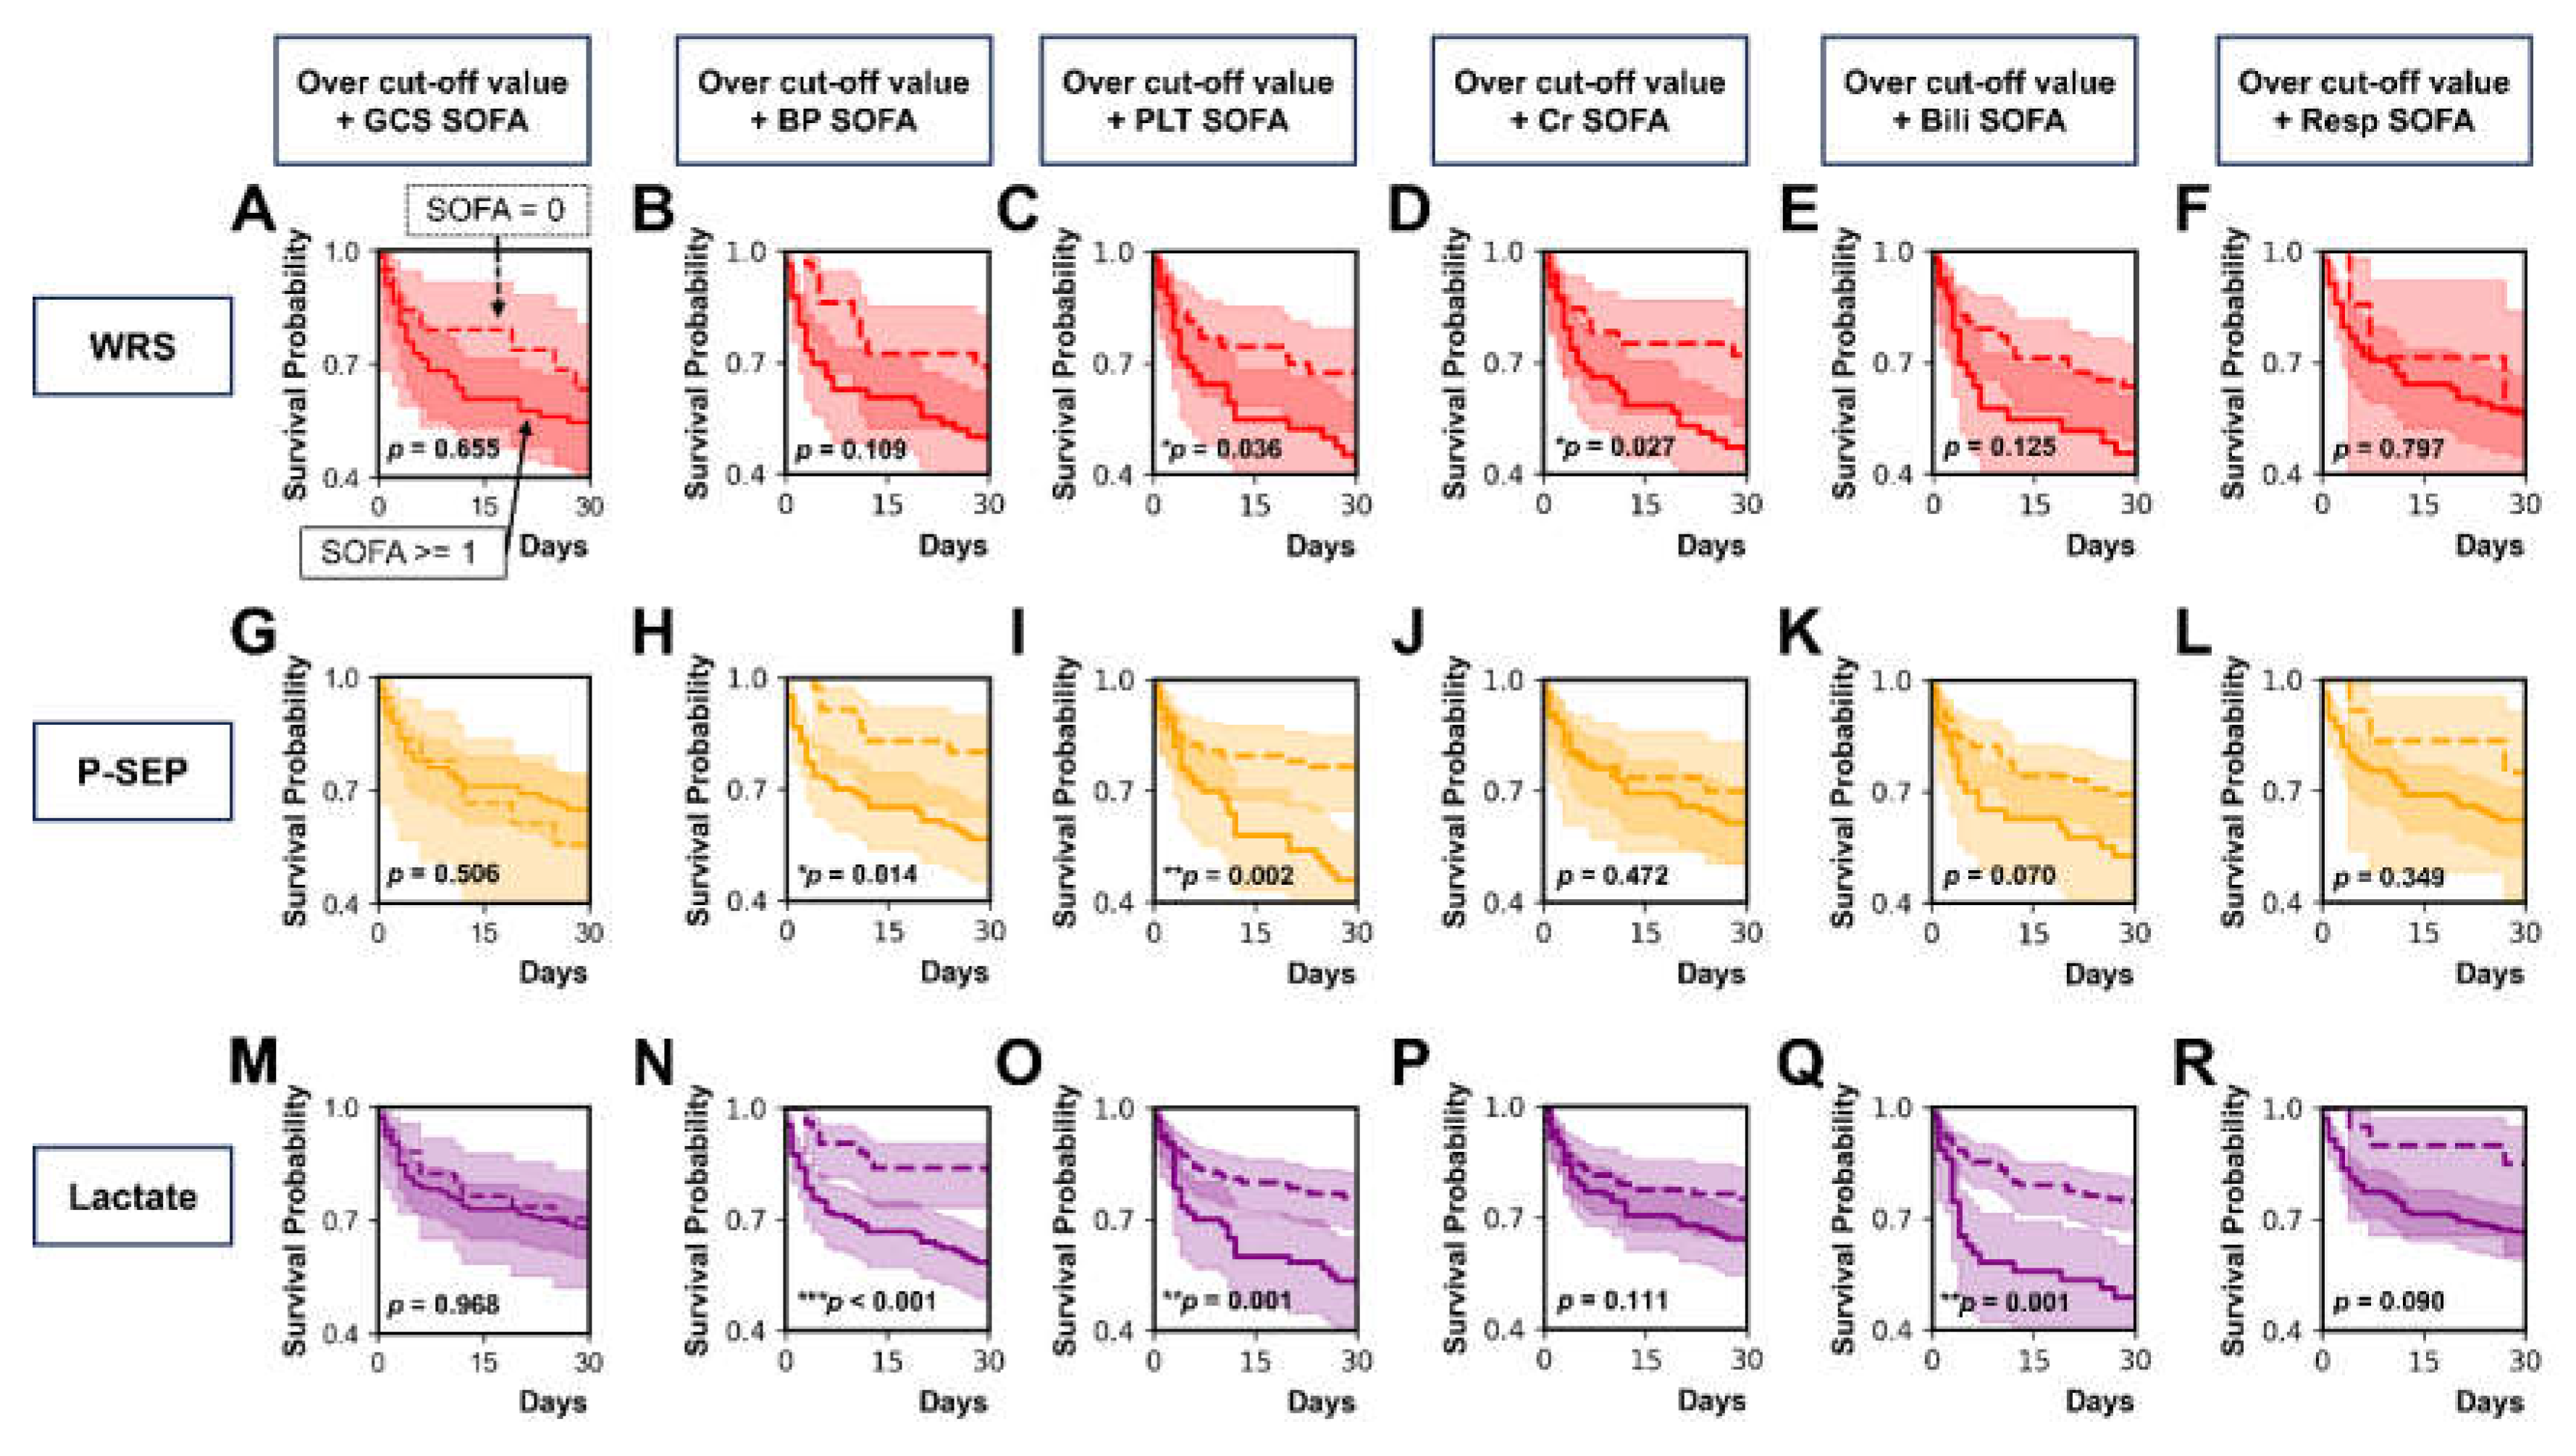
Figure 5.
Comparison of serum biomarker levels according to Cr SOFA score. (A) WRS. (B) P-SEP. (C) CRP. (D) PCT. (E) Lactate. *p < 0.05, **p < 0.01, ***p < 0.001. WRS, tryptophanyl-tRNA synthetase; P-SEP, presepsin; CRP, C-reactive protein; PCT, procalcitonin; Cr SOFA, renal SOFA.
Figure 5.
Comparison of serum biomarker levels according to Cr SOFA score. (A) WRS. (B) P-SEP. (C) CRP. (D) PCT. (E) Lactate. *p < 0.05, **p < 0.01, ***p < 0.001. WRS, tryptophanyl-tRNA synthetase; P-SEP, presepsin; CRP, C-reactive protein; PCT, procalcitonin; Cr SOFA, renal SOFA.
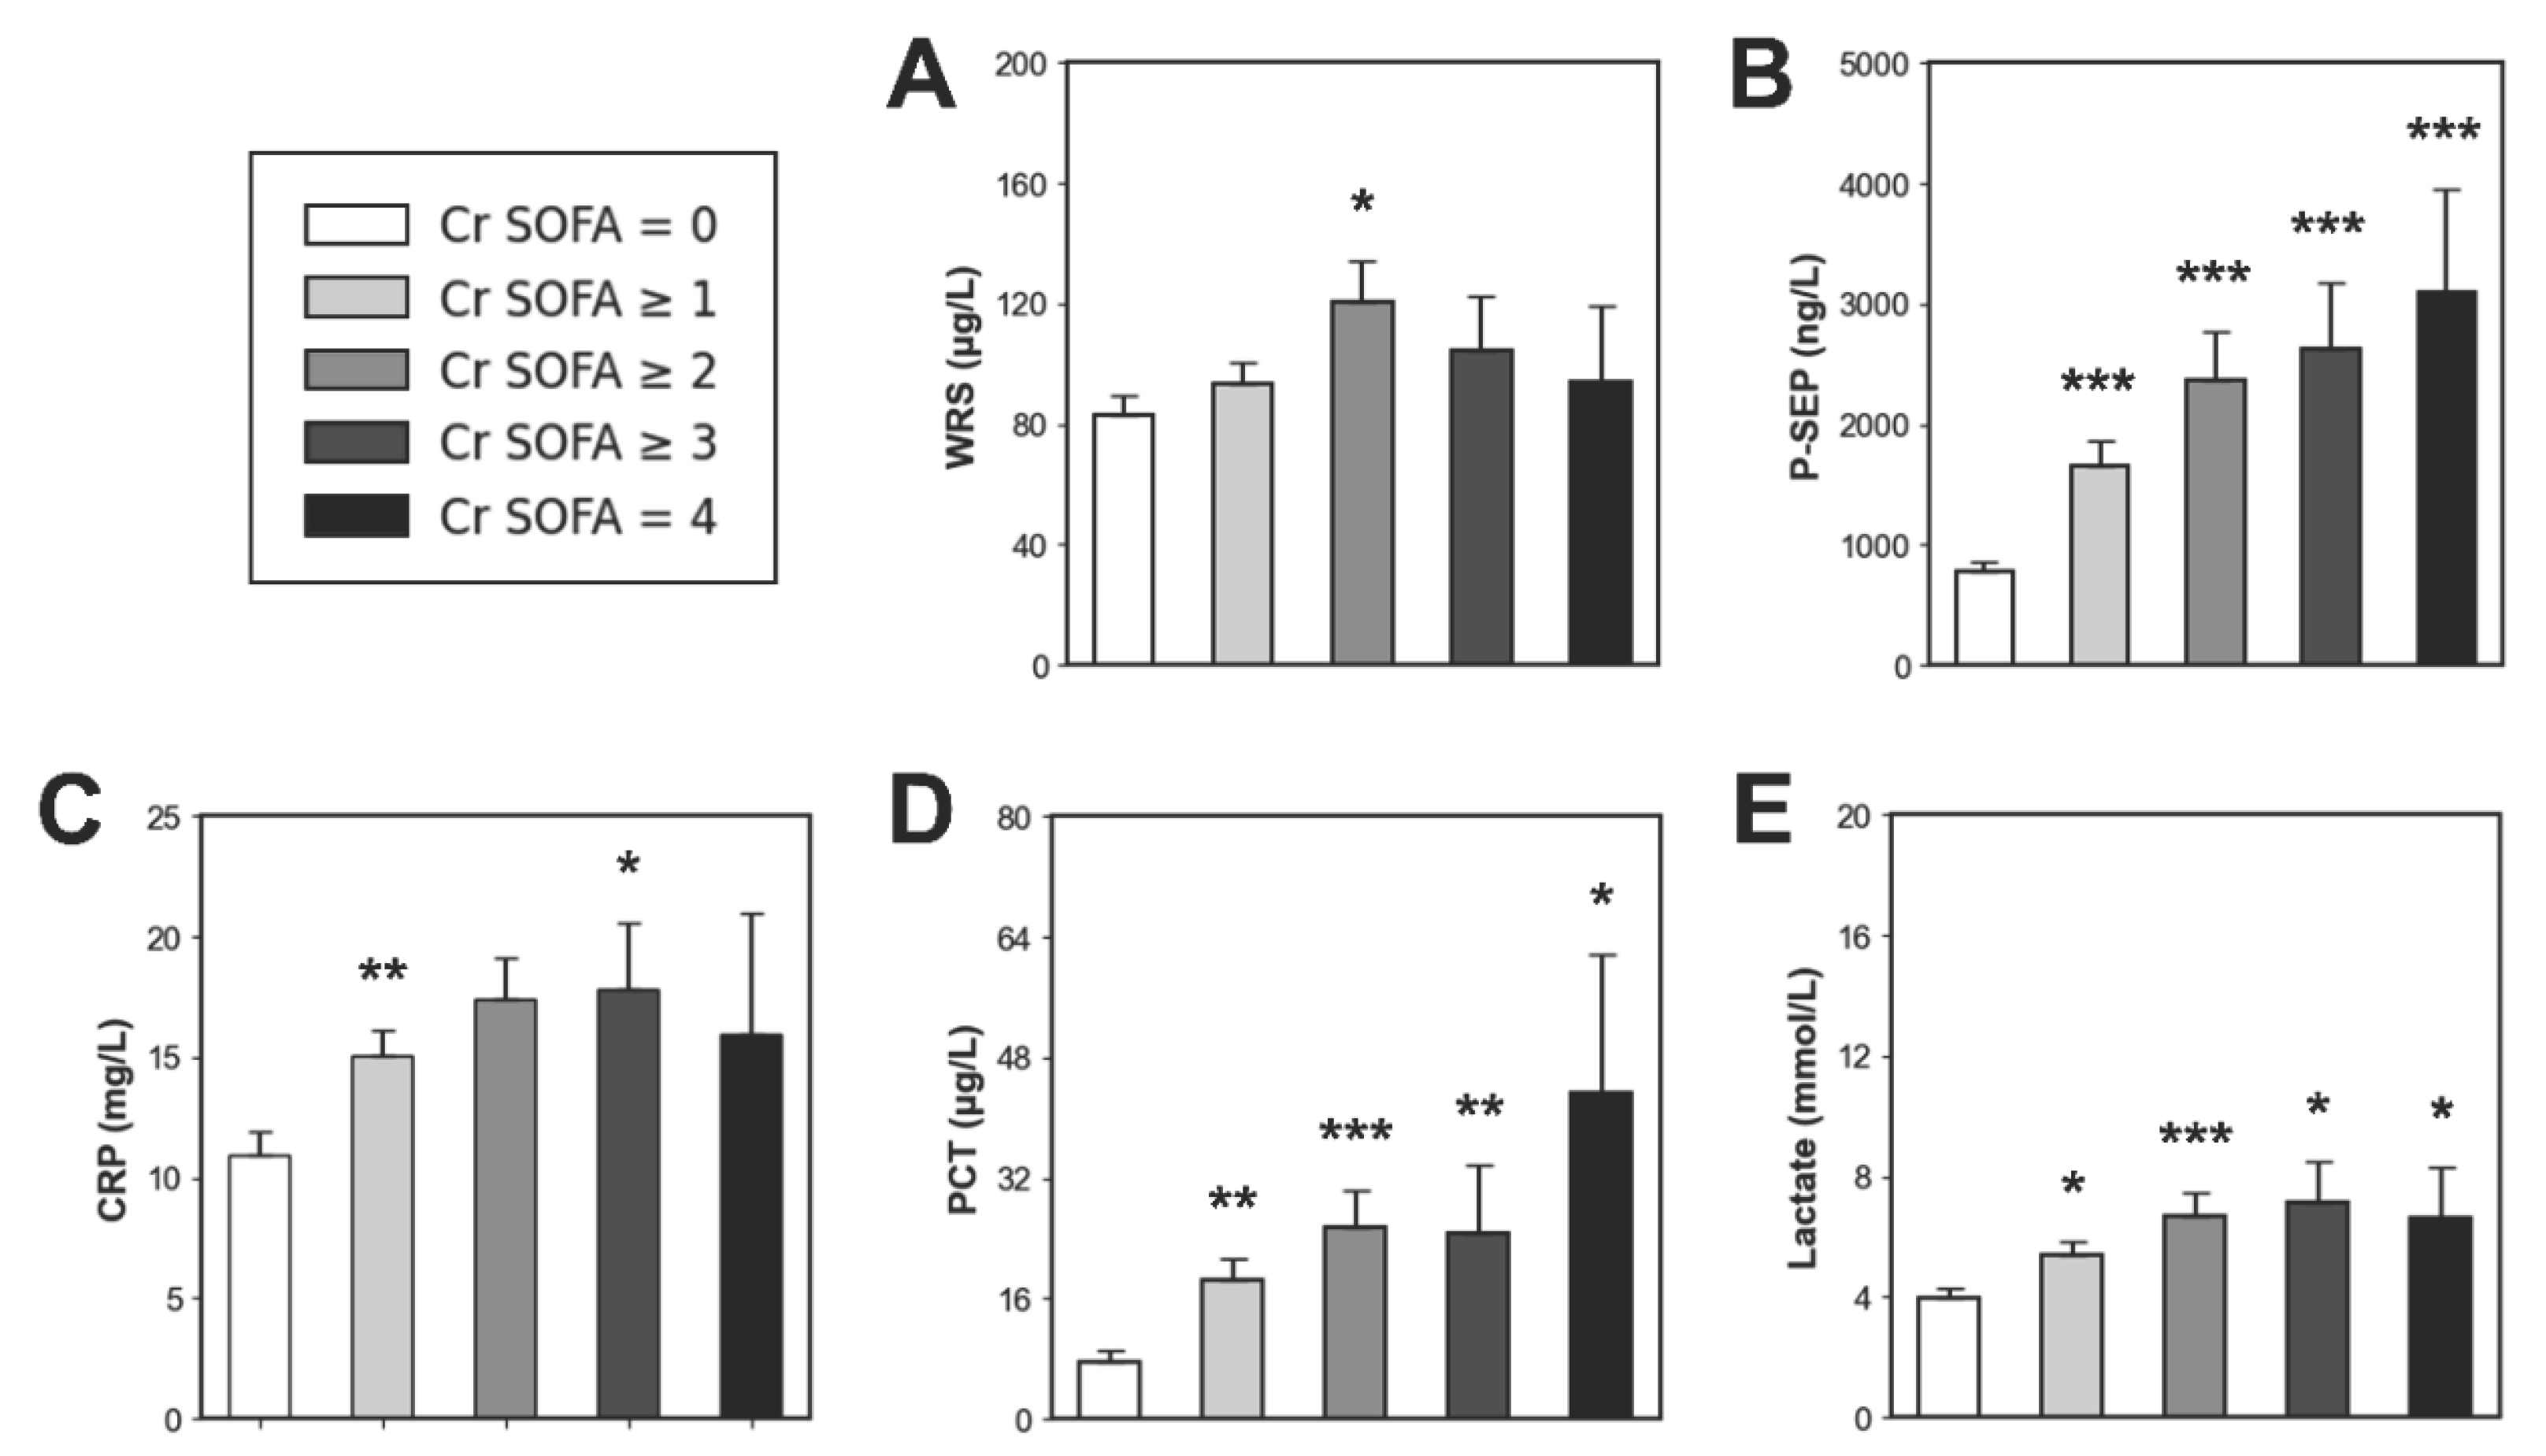

Table 1.
Baseline characteristics of the study population.
| Variable | All patients (n = 243) |
Sepsis (n = 124) |
Septic shock (n = 119) |
p-Value |
|---|---|---|---|---|
| Demographics | ||||
| Age, median (IQR) | 78 (67−84) | 78 (69−84) | 78 (67−84) | 0.973 |
| Male, n (%) | 144 (59.3) | 77 (62.1) | 67 (56.3) | 0.358 |
| Comorbidity, n (%) | ||||
| Diabetes mellitus | 90 (37.0) | 45 (36.3) | 45 (37.8) | 0.806 |
| Hypertension | 127 (52.3) | 70 (56.5) | 57 (47.9) | 0.182 |
| Malignancy | 40 (16.5) | 24 (19.4) | 16 (13.4) | 0.214 |
| Chronic lung disease | 20 (8.2) | 7 (5.6) | 13 (10.3) | 0.134 |
| Chronic liver disease | 10 (4.1) | 3 (2.4) | 7 (5.9) | 0.209 |
| Chronic kidney disease | 20 (8.2) | 9 (7.3) | 11 (9.2) | 0.573 |
| Cardiovascular disease | 23 (9.5) | 10 (8.1) | 13 (10.9) | 0.446 |
| Cerebrovascular disease | 56 (23.0) | 28 (22.6) | 28 (23.5) | 0.861 |
| Infection sites, n (%) | ||||
| Respiratory | 163 (67.1) | 87 (70.2) | 76 (63.9) | 0.296 |
| Genitourinary | 79 (32.5) | 34 (27.4) | 45 (37.8) | 0.084 |
| Gastrointestinal | 18 (7.4) | 8 (6.5) | 10 (8.4) | 0.561 |
| Others | 17 (7.0) | 10 (8.1) | 7 (5.9) | 0.505 |
| Vital sign, median (IQR) | ||||
| SBP (mmHg) | 96 (84−122) | 104 (92−136) | 89 (77−102) | < 0.001 |
| DBP (mmHg) | 59 (50−71) | 63 (56−74) | 53 (48−65) | < 0.001 |
| MAP (mmHg) | 72 (62−87) | 75 (70−96) | 65 (57−78) | < 0.001 |
| Heart rate (bpm) | 108 (88−124) | 108 (88−125) | 107 (88−125) | 0.639 |
| Respiratory rate (breaths/min) |
24 (20−28) | 23 (20−26) | 24 (20−28) | 0.663 |
| Body temperature (℃) | 37.2 (36.3−38.2) | 37.4 (36.6−38.4) | 37.2 (36.2−38.1) | 0.028 |
| SpO2 (%) | 95 (90−98) | 96 (93−99) | 93 (88−97) | < 0.001 |
| Clinical scores, median (IQR) | ||||
| SOFA score | 8 (6−11) | 6 (5−8) | 10 (8−12) | < 0.001 |
| NEWS | 11 (9−13) | 10 (8−12) | 11 (9−14) | 0.003 |
| MEWS | 6 (5−8) | 6 (5−7) | 6 (5−8) | 0.076 |
| APACHE Ⅱ score | 27 (23−32) | 26 (21−30) | 28 (24−33) | 0.001 |
|
Laboratory results, median (IQR) |
||||
| White blood cell (×106/L) | 11.6 (7.8−18.4) | 12.7 (8.9−17.2) | 11.0 (6.2−19.8) | 0.343 |
| Hemoglobin (g/dL) | 10.7 (8.9−12.4) | 10.7 (8.9−12.6) | 10.7 (8.6−12.3) | 0.708 |
| Platelet (×106/L) | 199 (120−290) | 207 (141−303) | 188 (104−263) | 0.010 |
| Total bilirubin (mg/dL) | 0.7 (0.4−1.2) | 0.7 (0.4−1.2) | 0.7 (0.5−1.2) | 0.749 |
| Creatinine (mg/dL) | 1.4 (0.9−2.2) | 1.2 (0.9−1.9) | 1.6 (1.0−2.5) | 0.007 |
| Sodium (mmol/L) | 138 (133−141) | 137 (133−141) | 138 (133−141) | 0.840 |
| Potassium (mmol/L) | 4.2 (3.7−4.8) | 4.1 (3.7−4.7) | 4.3 (3.6−5.1) | 0.430 |
| Biomarkers, median (IQR) | ||||
| WRS (µg/L) | 66.70 (46.10−105.60) | 60.95 (43.80−101.38) | 76.30 (52.60−111.40) | 0.018 |
| P-SEP (ng/L) | 804 (450−1612) | 693 (412−1080) | 1002 (515−2170) | < 0.001 |
| CRP (mg/L) | 10.72 (4.79−17.84) | 10.54 (4.51−17.10) | 11.58 (5.19−21.46) | 0.187 |
| PCT (µg/L) | 2.31 (0.64−10.27) | 1.04 (0.41−4.79) | 4.92 (1.11−23.85) | < 0.001 |
| Lactate (mmol/L) | 3.00 (1.90−6.00) | 2.35 (1.52−4.71) | 4.10 (2.40−7.60) | < 0.001 |
| Mechanical ventilator, n (%) | 70 (28.8) | 15 (12.1) | 55 (46.2) | < 0.001 |
| Clinical outcomes, n (%) | ||||
| 7-day mortality | 40 (16.5) | 11 (8.9) | 29 (24.4) | 0.001 |
| 14-day mortality | 54 (22.2) | 18 (14.5) | 36 (30.3) | 0.003 |
| 30-day mortality | 67 (27.6) | 24 (19.4) | 43 (36.1) | 0.003 |
Statistical significance refers to the comparison between the sepsis and septic shock groups. IQR, interquartile range; SBP, systolic blood pressure; DBP, diastolic blood pressure; MAP, mean arterial pressure; SpO2, peripheral capillary oxygen saturation; SOFA, sepsis-related organ failure assessment; NEWS, National Early Warning Score; MEWS, Modified Early Warning Score; APACHE Ⅱ, Acute Physiology and Chronic Health Evaluation Ⅱ; WRS, tryptophanyl-tRNA synthetase; P-SEP, presepsin; CRP, C-reactive protein; PCT, procalcitonin.
Table 2.
Discriminating abilities of tested biomarkers and clinical severity scores presented as areas under the curve (95% CI).
Table 2.
Discriminating abilities of tested biomarkers and clinical severity scores presented as areas under the curve (95% CI).
| To discriminate septic shock from sepsis | |||||
| Variable | AUC (95% CI) | p-value | Cut-off value | Sensitivity | Specificity |
| WRS | 0.588 (0.516–0.660) | 0.018 | 61.20 (µg/L) | 67.2% | 50.8% |
| P-SEP | 0.624 (0.554–0.695) | 0.001 | 1286 (ng/L) | 45.4% | 82.3% |
| CRP | 0.549 (0.477–0.621) | 0.187 | 20.34 (mg/L) | 74.8% | 23.4% |
| PCT | 0.685 (0.618–0.751) | < 0.001 | 3.08 (µg/L) | 59.7% | 71.0% |
| Lactate | 0.669 (0.602–0.737) | < 0.001 | 2.08 (mmol/L) | 93.3% | 13.7% |
| To predict 30-day mortality in patients with sepsis, including septic shock | |||||
| Variable | AUC (95% CI) | p-value | Cut-off value | Sensitivity | Specificity |
| WRS | 0.648 (0.569–0.726) | < 0.001 | 84.15 (µg/L) | 56.7% | 73.3% |
| P-SEP | 0.610 (0.531–0.689) | 0.008 | 823 (ng/L) | 64.2% | 57.4% |
| CRP | 0.547 (0.465–0.628) | 0.262 | 7.24 (mg/L) | 95.5% | 11.4% |
| PCT | 0.513 (0.434–0.592) | 0.759 | 0.63 (µg/L) | 82.1% | 27.3% |
| Lactate | 0.683 (0.606–0.759) | < 0.001 | 4.42 (mmol/L) | 88.1% | 28.4% |
| SOFA score | 0.732 (0.662–0.802) | < 0.001 | |||
| NEWS | 0.607 (0.523–0.691) | 0.010 | |||
| MEWS | 0.553 (0.469–0.636) | 0.206 | |||
| APACHE Ⅱ | 0.650 (0.572–0.727) | < 0.001 | |||
| SOFA score + WRS | 0.748 (0.680–0.816) | < 0.001 | |||
| SOFA score + WRS + P-SEP + lactate |
0.761 (0.692–0.830) | < 0.001 | |||
WRS: tryptophanyl-tRNA synthetase; P-SEP: presepsin; CRP: C-reactive protein; PCT: procalcitonin; SOFA: Sequential Organ Failure Assessment; NEWS: National Early Warning Score; MEWS: Modified Early Warning Score; APACHE II: Acute Physiology and Chronic Health Evaluation II; AUC: area under the curve; CI: confidence interval
Table 3.
Risk factors for 30-day mortality among patients with sepsis using the Cox proportional hazards model.
Table 3.
Risk factors for 30-day mortality among patients with sepsis using the Cox proportional hazards model.
| Variable | Univariable HR (95% CI) | p-value | Multivariable HR (95% CI) | p-value |
|---|---|---|---|---|
| WRS | 1.003 (1.001–1.005) | 0.002 | 1.003 (1.001–1.005) | 0.014 |
| P-SEP | 1.000 (1.000–1.000) | 0.091 | ||
| CRP | 1.015 (0.995–1.037) | 0.148 | ||
| PCT | 1.002 (0.992–1.011) | 0.694 | ||
| Lactate | 1.116 (1.075–1.160) | < 0.001 | 1.110 (1.068–1.154) | < 0.001 |
WRS, tryptophanyl-tRNA synthetase; P-SEP, presepsin; CRP, C-reactive protein; PCT, procalcitonin; HR, hazard ratio; CI, confidence interval
Disclaimer/Publisher’s Note: The statements, opinions and data contained in all publications are solely those of the individual author(s) and contributor(s) and not of MDPI and/or the editor(s). MDPI and/or the editor(s) disclaim responsibility for any injury to people or property resulting from any ideas, methods, instructions or products referred to in the content. |
© 2025 by the authors. Licensee MDPI, Basel, Switzerland. This article is an open access article distributed under the terms and conditions of the Creative Commons Attribution (CC BY) license (http://creativecommons.org/licenses/by/4.0/).
Copyright: This open access article is published under a Creative Commons CC BY 4.0 license, which permit the free download, distribution, and reuse, provided that the author and preprint are cited in any reuse.


