1. Introduction
Electrolyte and non-electrolyte solutions play a crucial role in numerous scientific and industrial fields, such as biology, pharmaceuticals, chemistry, and biochemistry, as well as in a wide range of practical applications.One notable example is atmospheric aerosol, which consists primarily of suspended solid particles, particularly electrolytes, and exerts a crucial influence on the environment. This impact encompasses aspects such as air quality, cloud formation, and the regulation of the climate system.
Ammonium nitrate (AN, NH
4NO
3) has emerged as a potential substitute for ammonium perchlorate as a solid propellant oxidizer [
1,
2]. This compound holds immense importance in both the chemical industry and agriculture, making it one of the most widely utilized ammonium compounds. Notably, it finds extensive application in nitrogen-based fertilizers and explosives. While it serves as a vital source of ammonia and nitrate ions, crucial for plant growth as a nitrogen fertilizer, its role in explosives and propellants lies in providing oxygen as an oxidizer.
Ammonium nitrate has garnered attention from researchers across various disciplines for several reasons. Firstly, its inherent phase transitions have been extensively investigated in the field of solid-state physics, aiming to unravel the intricacies of these transformations [
3,
4]. Secondly, ammonium nitrate is frequently employed as a fertilizer, but it often experiences undesired agglomeration. Researchers in the field of fertilizer technology are therefore interested in exploring methods to mitigate such phenomena, with a particular focus on the solid’s phase transitions occurring at or near ambient temperatures (20–30°C) [
5,
6]. Thirdly, due to its explosive nature, it is crucial to thoroughly examine and avoid the conditions that may lead to disastrous consequences, considering the large-scale production of ammonium nitrate [
7,
8,
9].
Sucrose is a disaccharide composed of two monosaccharides, glucose and fructose, with a chemical formula of C12H22O11. The connection between the fructose and glucose molecules in a C12H22O11 molecule occurs through a glycosidic bond, which is a type of linkage for two monosaccharides. Sucrose possesses a monoclinic crystal structure and is highly soluble in water, exhibiting its characteristic sweet taste.
The term “sucrose” was coined by William Miller, an English chemist, in 1857. It is widely utilized as a sweetener in the food industry. C12H22O11 can be obtained from sugar beets or sugar canes, but it requires refinement to ensure suitability for human consumption. Refined sucrose, commonly known as sugar, is a popular ingredient in various food recipes due to its sweet taste.
This study aims to investigate the physicochemical properties of a mixture system comprising ammonium nitrate, sucrose, and water using the hygrometric method [
14,
15,
16] at a temperature of 298.15 K. The relative humidities of the mixture at 298.15 K were measured for different molalities of sucrose (0.1, 0.3, 0.5, 1.0, 2.0, 3.0 and 4.0 mol.kg
-1) and different molalities of NH
4NO
3 (0.10, 0.50, 1.00, 2.00, 3.00, 4.00, 5.00, 6.00 mol
.kg
-1). To ensure the reliability of the experimental results for the mixed system, additional measurements were conducted on pure solutions of NH
4NO
3 (aq) and compared to existing literature data. Osmotic coefficients for these solutions were determined based on water activities. The Pitzer-Simonson-Clegg model [17−21] was utilized to calculate solute activity coefficients and excess Gibbs energies using the experimental data obtained in this study.
The solubilities of a ternary aqueous solution of NH4NO3-sucrose-water were measured using the hygrometric method and correlated with the PSC model. Powder X-ray diffraction (XRPD) and attenuated total reflection Fourier-transform infrared (ATR-FTIR) spectroscopy were employed to identify the crystallized solids from the supersaturated NH4NO3-sucrose-water solution.
No literature data are currently available on the thermodynamic parameters addressed in this study.
2. Experimental Section
Water activity was determined using a hygrometric method based on the measurement of relative humidity above aqueous solutions containing non-volatile electrolytes. Experiments were carried at 298.15 K (with a standard uncertainty of ±0.02 K) and under an atmospheric pressure of 0.1 MPa (with a standard uncertainty of ±0.002 MPa).
For preparing the NaCl, NH
4NO
3, and sucrose solutions, anhydrous materials from Merck and Fluka (
Table 1) were used, along with deionized distilled water with a conductivity of approximately 5.10
-6 S.cm
-1. The stock solutions were prepared by weighing and measuring volumes using pipettes. The uncertainty in the molality of the stock solution arises from the uncertainty in the analysis of the stock solution’s molality and the weighing error. The standard uncertainties were calculated using error propagation techniques and are at maximum u(m) = 0.01 mol.kg-1 (with a 0.68 level of confidence).
The molality (m) of the solution and its standard uncertainty (u (m)) are defined as follows. The mass of the component initially weighed for the experiment is denoted as (w), with a standard uncertainty of (u(w)) equal to 24.5.10-2 mg. The volume (V) of the solution and its standard uncertainty (u(V)) are 0.03 mL. The molar mass (M) of the component and its standard uncertainty (u(M)) are 18.10-3 g·mol-1 (The standard uncertainties for the molar masses of different elements can be found on the IUPAC website). The purity of the component is represented as (p), with a standard uncertainty of (u(p)) equal to 1.44 .10-3. The specific volume of water (ρ) used is 998.20675 kg·m-3, and its standard uncertainty (u(ρ)) is 8.10-4 kg·m-3.
The relative uncertainty (ur (m)) in the calculated molality using Equation 1 is approximately 1.6 × 10⁻³. To verification of the molalities, the refractive index (nr) was measured using the Chemical Handbook, with a standard uncertainty (u(nr)) of 2.10-4.
2.1. Hygrometric Method
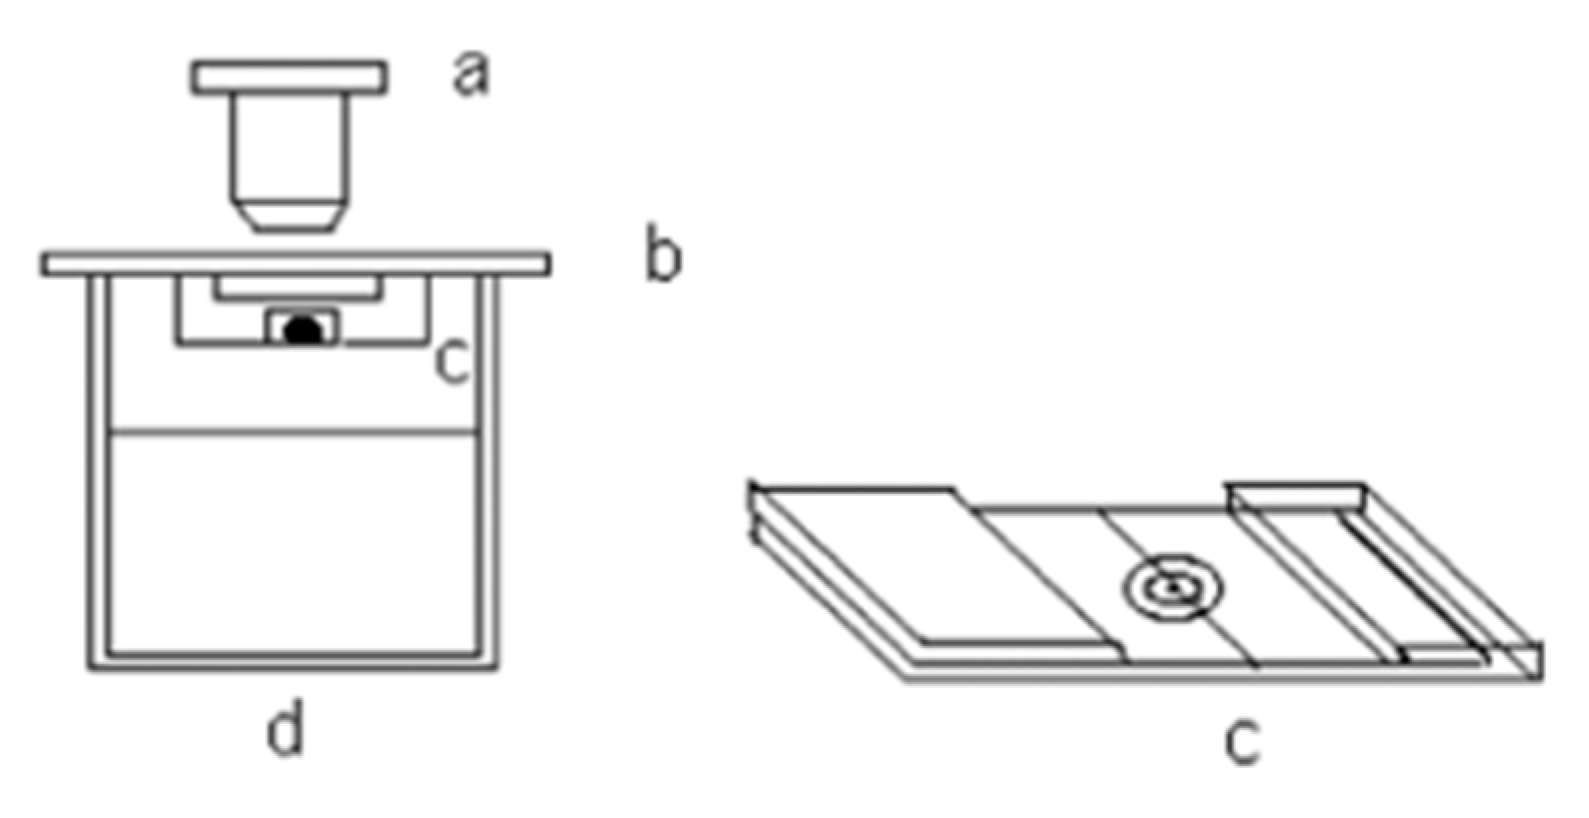
Water activity in electrolyte solutions can be evaluated by measuring the relative humidity above the solution. This is achieved by suspending a fine spider silk thread under tension above a container holding the test solution. Reference droplets—typically of aqueous NaCl or LiCl—are deposited onto the thread. The setup is placed in a temperature-regulated chamber, and a digital microscope is used to monitor the droplet diameter (see
Figure 1).
Assuming thermodynamic equilibrium between the water in the liquid phase and its surrounding vapor, the water activity in the electrolyte solution can be expressed accordingly:
The water partial pressure above the aqueous solution (Pw) and the saturation vapor pressure of pure water (P0w) at the same temperature play a crucial role.
The practical identification of the relative humidity (h
r) of a salt solution is closely associated with the water activity of the solution.
Thermodynamic properties for the reference solutions NaCl(aq) and LiCl(aq) are available in the literature. Using this data, we can calculate the relationship between relative humidity and molar concentration. Consequently, we can determine how the diameter of the drops in the reference solutions varies with the surrounding relative humidity.
We consider the drop formed by the reference solution as a sphere with a diameter
D, its volume
V is:
The volume of the solution’s drop undergoes changes due to the evaporation or condensation of water from or onto the solution, respectively. Consequently, the diameter of the drop increases or decreases during these processes.
Using a reference relative humidity value of 0.84, the growth ratio
K can be introduced to account for the variation in droplet diameter relative to that of the reference solution. This ratio is defined as follows:
Here, D(aref), and D(aw) denote the diameters of the droplets at the reference relative humidity (typically 0.84 or 0.98) and at the unknown relative humidity aw, respectively.
The growth ratio K is related to the solute concentration as follows:
where
n represents the number of moles of solute in the droplet, and C denotes the solute concentration in the droplet solution. Consequently, the following relationship is obtained:
C(aref) and C(aw) represent the concentrations of solutions at the reference humidity level hr=0.84 (or 0.98) and the unknown relative humidity aw, respectively. The calibration procedure consists of correlating the droplet diameter of the reference solution with the relative humidity measured above the cup containing that same reference solution (D(0.84) or D(0.98)).
A droplet is placed above the cup containing the solution under investigation, and its diameter (D(aw)) is measured. The water activity (or relative humidity) is then determined by calculating the growth ratio K, which is derived from the relationship between K and the relative humidity of the reference solutions, typically aqueous NaCl or LiCl.
If the relative humidity is above 0.75, the reference NaCl solution is used. Conversely, the reference LiCl solution is employed for relative humidities below 0.75.
Determination of the K ratioenables the determination of the water activity of the solution being studied in this research. This is achieved by using the graph that illustrates the variation of the K ratio with the relative humidity of the reference solution, or alternatively, by applying the correlation equations derived from these curves:
For a relative humidity reference of NaCl (
hr = 0.84):
for reference
hr =0,98:
The relative uncertainty in the measured droplet diameter is approximately ur=0.0025. Consequently, the relative uncertainty in the relative humidity measurements can be determined using error propagation 22 methods as follows:
Accurate relative humidity measurements require careful control of experimental conditions, including proper hygrometric calibration and stable temperature maintenance. The standard uncertainty (at a 0.68 confidence level) associated with these measurements depends on the water activity (aw)value being measured. Specifically, the uncertainty ranges from u(aw)=0.0002 for dilute solutions up to u(aw)=0.005 for more concentrated solutions.
The saturation points of the water/D-sucrose/ammonium nitrate (NH4NO3) system were determined through the hygrometric technique.This approach involved gradually adding small amounts of D-Sucrose or NH4NO3 to pre-prepared mixtures of D-Sucrose-H2O or NH4NO3-H2O until the drop diameter variation became insignificant or constant. The solid phase was characterized using a LABXXRD-6100 Shimadzu powder X-ray diffractometer equipped with Cu radiation, operated at 40 kV and 25 mA. Diffraction patterns were recorded by scanning the samples over a 2θ range of 10° to 70°, with a scanning speed of 2.4° min−1 and a step size of 0.02°.
The FT-IR-ATR spectra of the composites were collected at a resolution of 4 cm⁻¹ using a Jasco FT/IR 4600 spectrometer equipped with a Pro One type attenuated total reflectance (ATR) accessory.
4. Results and Discussion
Experimental determinations were carried out to evaluate the water activities and osmotic coefficients of D-Sucrose and NH
4NO
3 at various molalities. The molalities investigated for D-Sucrose included 0.1, 0.3, 0.5, 1, 2, 3 and 4, whereas for NH
4NO
3, the tested molalities ranged from 0.1 to 6 mol.kg
-1. The relationship between water activities and osmotic coefficients can be expressed as follows:
where
is the molar mass of water,
is the number of ions released upon dissociation (with
for non-electrolytes), and
is the molality of solute i. The uncertainty
can be estimated using the error propagation law, expressed as:
Assuming that the uncertainties
and
are negligible, the uncertainty
can be determined using the following equation:
The estimated uncertainty in the osmotic coefficients is u(φ) = 0.009.
Table 2 presents the experimental data of osmotic coefficients (φ) and water activities (aw).
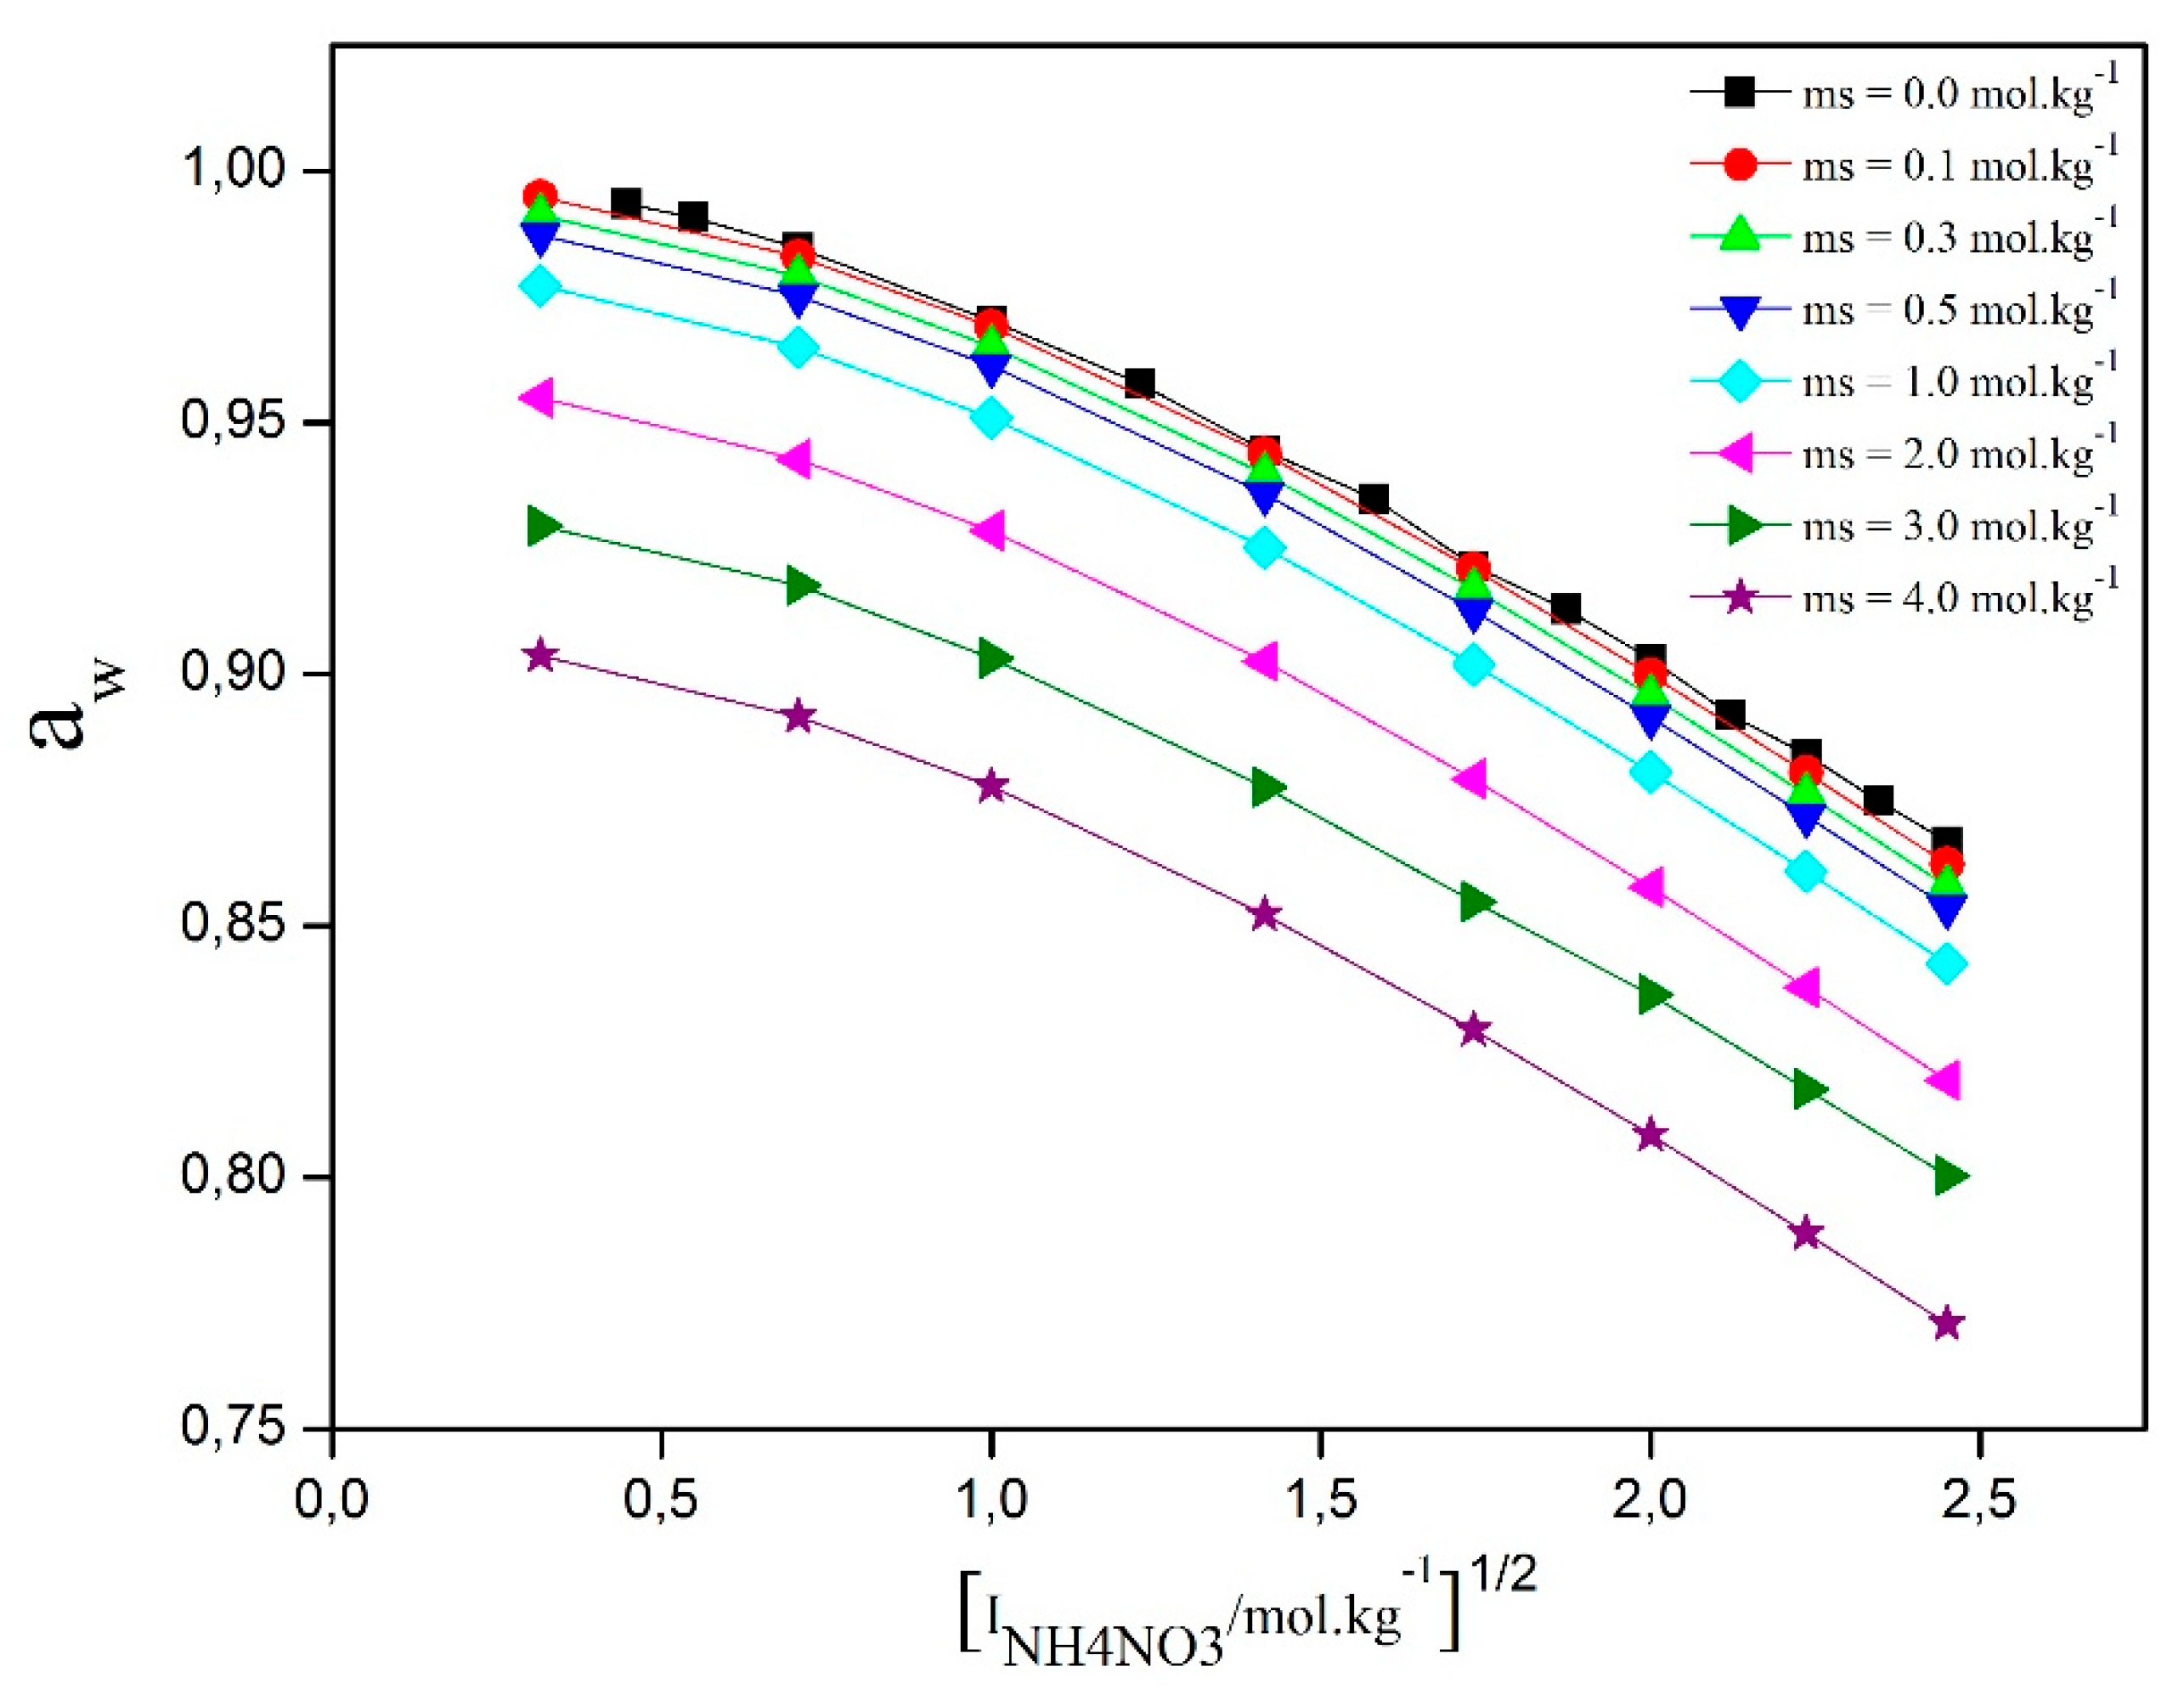
Figure 2 illustrates the variation of water activity as a function of the square root of ionic strength for different D-sucrose concentrations. For all D-sucrose contents, water activity decreases with increasing molality—a behavior commonly observed in aqueous solutions of non-volatileelectrolytes. The addition of NH₄NO₃ to the D-sucrose/water system significantly influences its thermodynamic properties. These changes result from the specific interactions between water and D-sucrose, NH₄NO₃ and water, and NH₄NO₃ and D-sucrose, as well as from the ternary interactions among all three components. This implies that the presence of NH₄NO₃ substantially disrupts the hydration structure of the sugar solution. These interactions are governed by the hydration degree of each species, which directly affects the system’s activity.
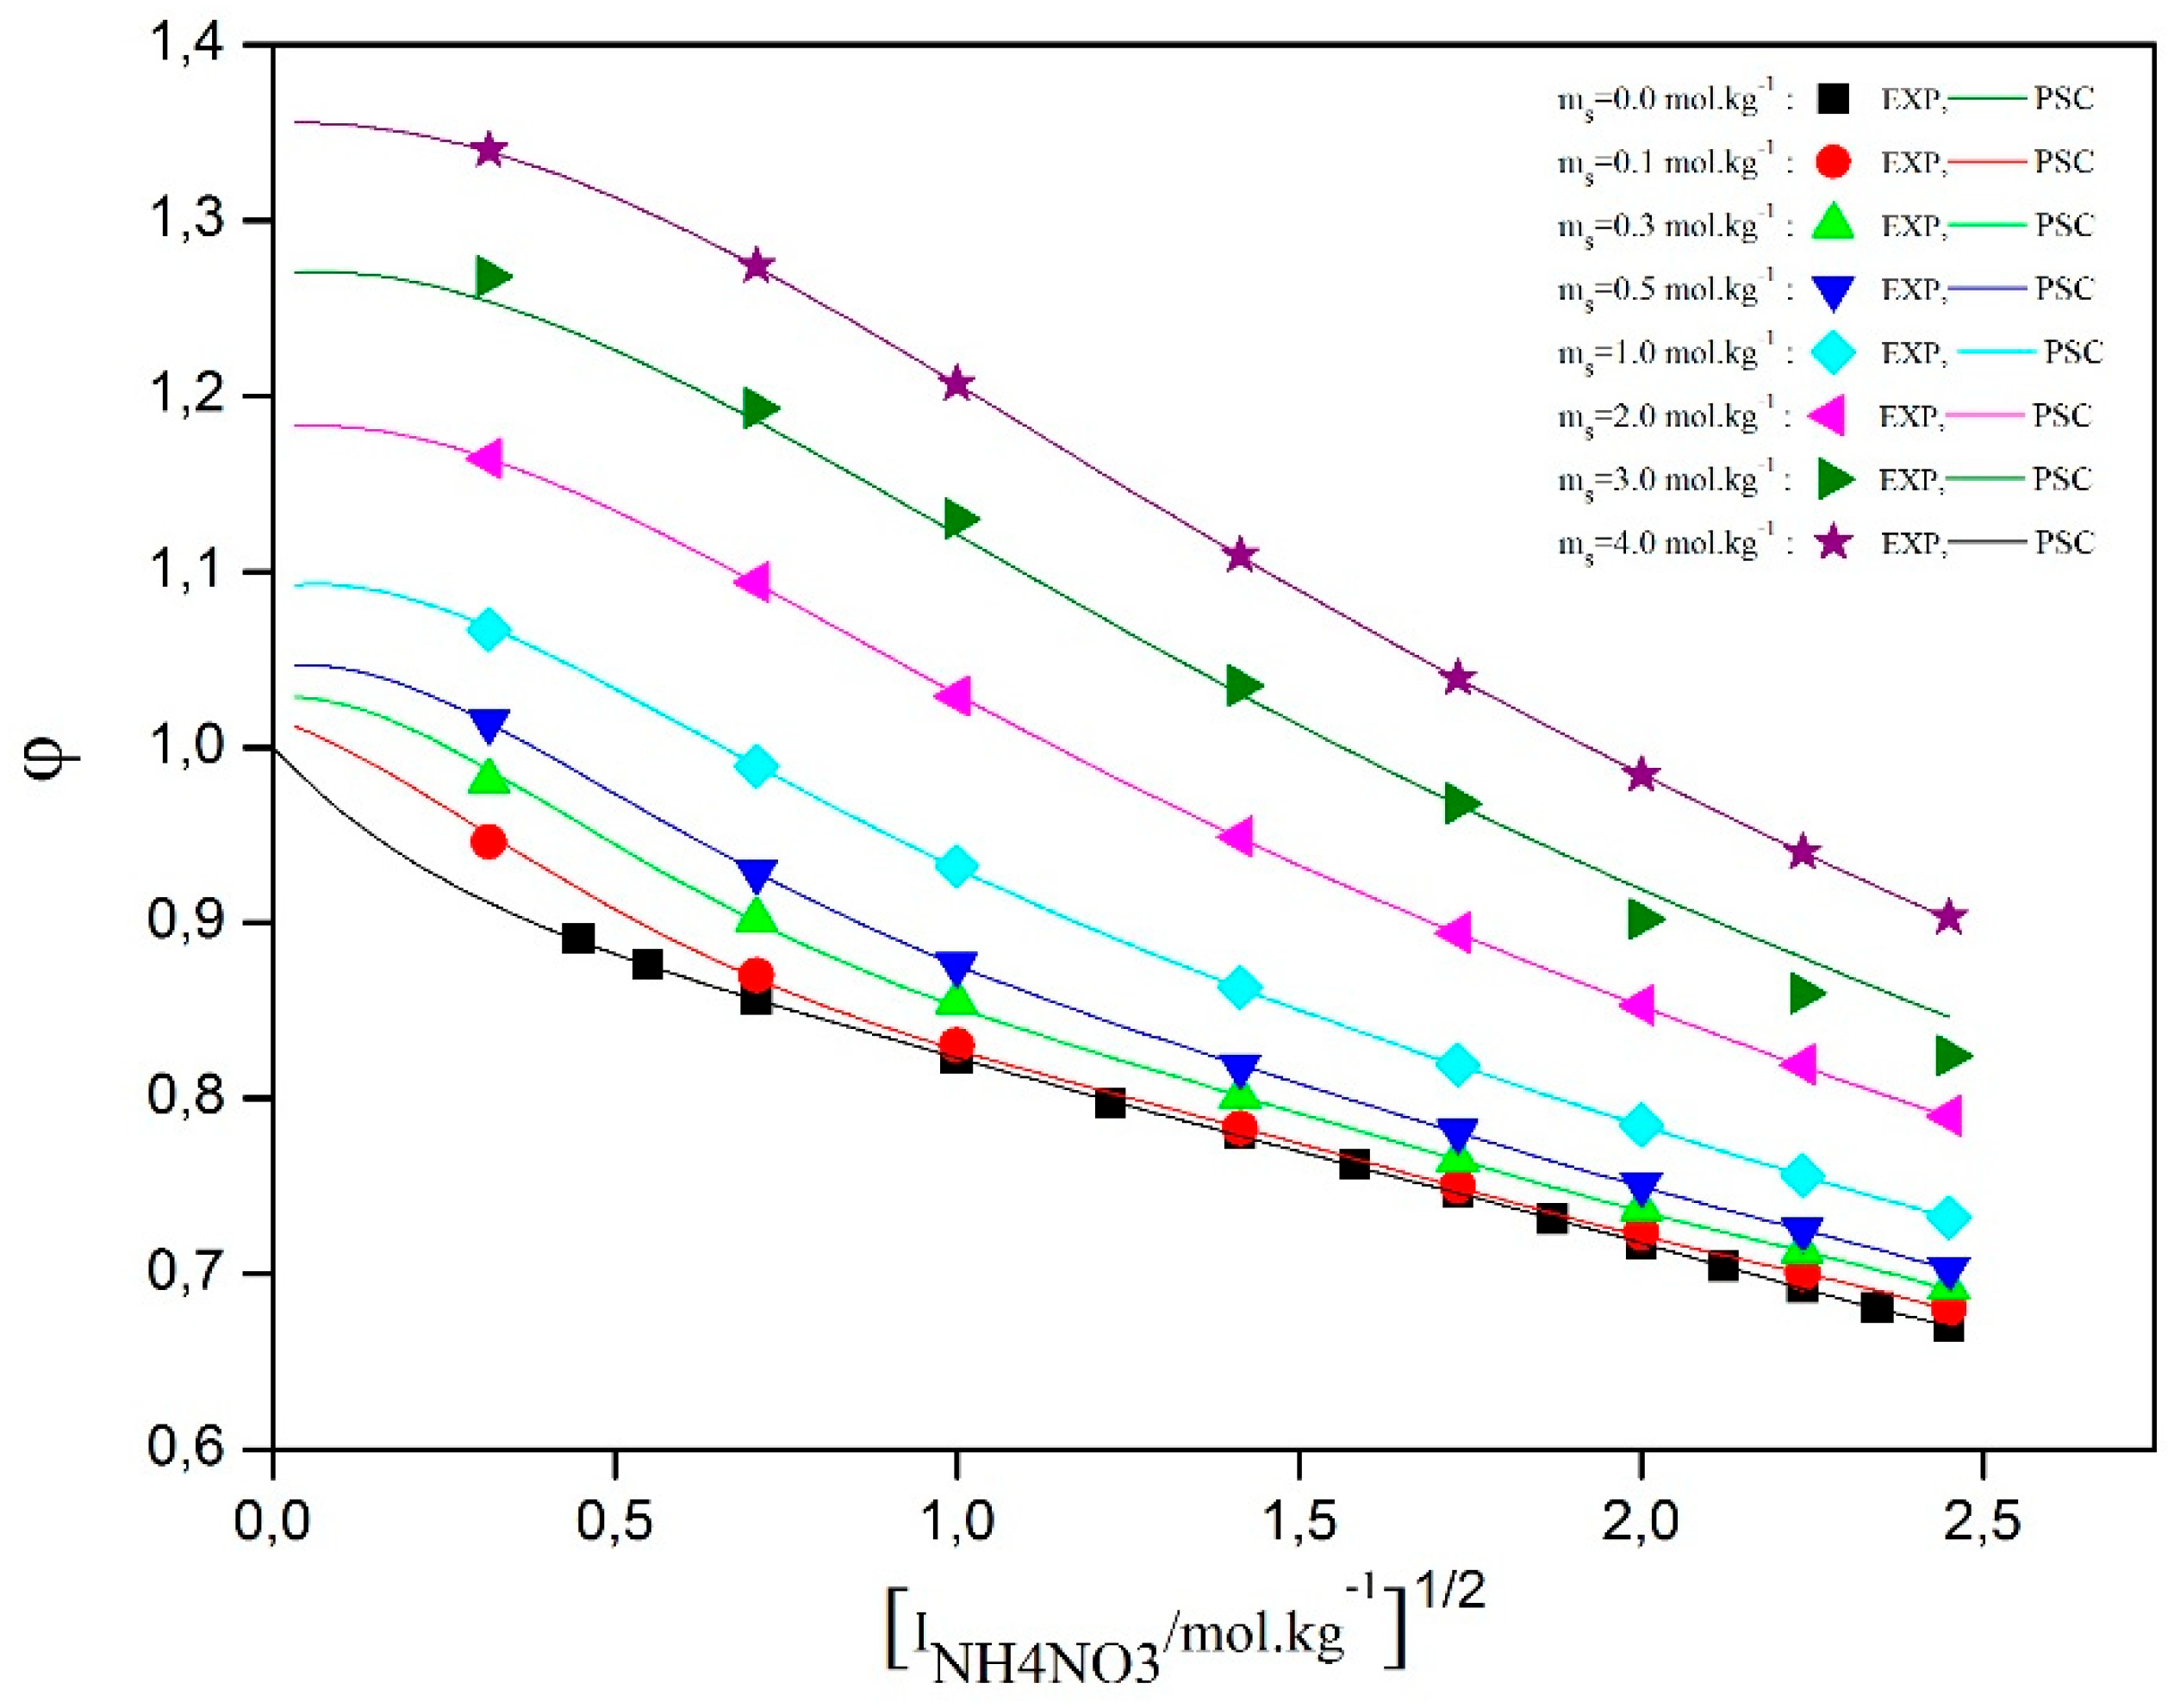
Figure 3 shows the osmotic coefficients derived from water activity measurements for the studied water/D-sucrose/ammonium nitrate (AN) system. The graph indicates that, at constant NH₄NO₃ concentration, the osmotic coefficient increases with rising D-sucrose content. However, the curves do not follow a uniform trend as a function of D-sucrose molality. Additionally, a slight decrease in the osmotic coefficient is observed with increasing NH₄NO₃ concentration.
These observations highlight the influence of molecular interactions within the solution. Ammonium ions (NH4+) and nitrate ions (NO3-) ions interact electrostatically with sucrose molecules (C12H22O11). More specifically, ammonium ions can form hydrogen bonds with the hydroxyl groups (OH-) of sucrose. Such interactions may disrupt sucrose–sucrose associations, thereby affecting the solution’s structure and thermodynamic properties, including viscosity and solubility.
Water activities were calculated using three models: the ECA equation [
24], the Lietzke and Stoughton (LS II) equation [
25,
26], and the Lin et al. correlation, all of which are provided in the appendix. The thermodynamic data used in these models were taken from Robinson and Stokes [
28] for aqueous D-sucrose and from reference [
29] for aqueous NH₄NO₃. For the water/D-sucrose/AN system, the parameter values used are:
For the ECA model: λ=0, 00438 (mol.kg-1)-2 and δ=0,000758 (mol.kg-1)-3.
For the Lin et al. model: C12=0,0000418.
The calculated values of water activity () and osmotic coefficient using the parameter sets from the ECA and Lin et al. equations show good agreement with the experimental data. In contrast, predictions obtained using the LS II equation exhibit significant deviations from the measured values. This discrepancy can be attributed to the inherent limitation of the LS model, which treats the behavior of the mixture as a simple sum of the behaviors of its individual components, thereby neglecting specific interactions present in the ternary system.
To calculate the unknown parameters of the PSC model for the water/D-sucrose/NH₄NO₃ system, a minimization method is used. The parameters B
MX, W
1.MX, U
1.MX, and V
1.MX are determined from experimental data on osmotic coefficients(φ) and mean ionic activity coefficients (γ
AN) for the water–NH₄NO₃ system [
29]. For the water/D-sucrose system, the Margules parameters w
12 and u
12 are taken from the data reported by Robinson et al. [
28].
The interaction parametersW
2.MX, U
2.MX, V
2.MX,Y
01.2.MX and Y
11.2.MXwere calculated using osmotic coefficient data from the ternary water–D-sucrose–ammonium nitrate system measured in this study.
Table 3 shows these parameters and their standard deviations.
The estimated standard deviations show that the activity and osmotic coefficients are more reliable for the D-sucrose/water and NH₄NO₃/water systems. This work focused on studying the optimized parameters of the mixing model for the water/D-sucrose/ammonium nitrate system. The results revealed important details about the interactions between the different substances in the solution.
The developed model was used to predict the activity coefficients of NH₄NO₃ and D-sucrose, as well as the excess Gibbs free energy, in the ternary water/D-sucrose/ammonium nitrate system at 298.15 K. The results are shown in
Table 4, and graphs are given in
Figure 4,
Figure 5 and
Figure 6.
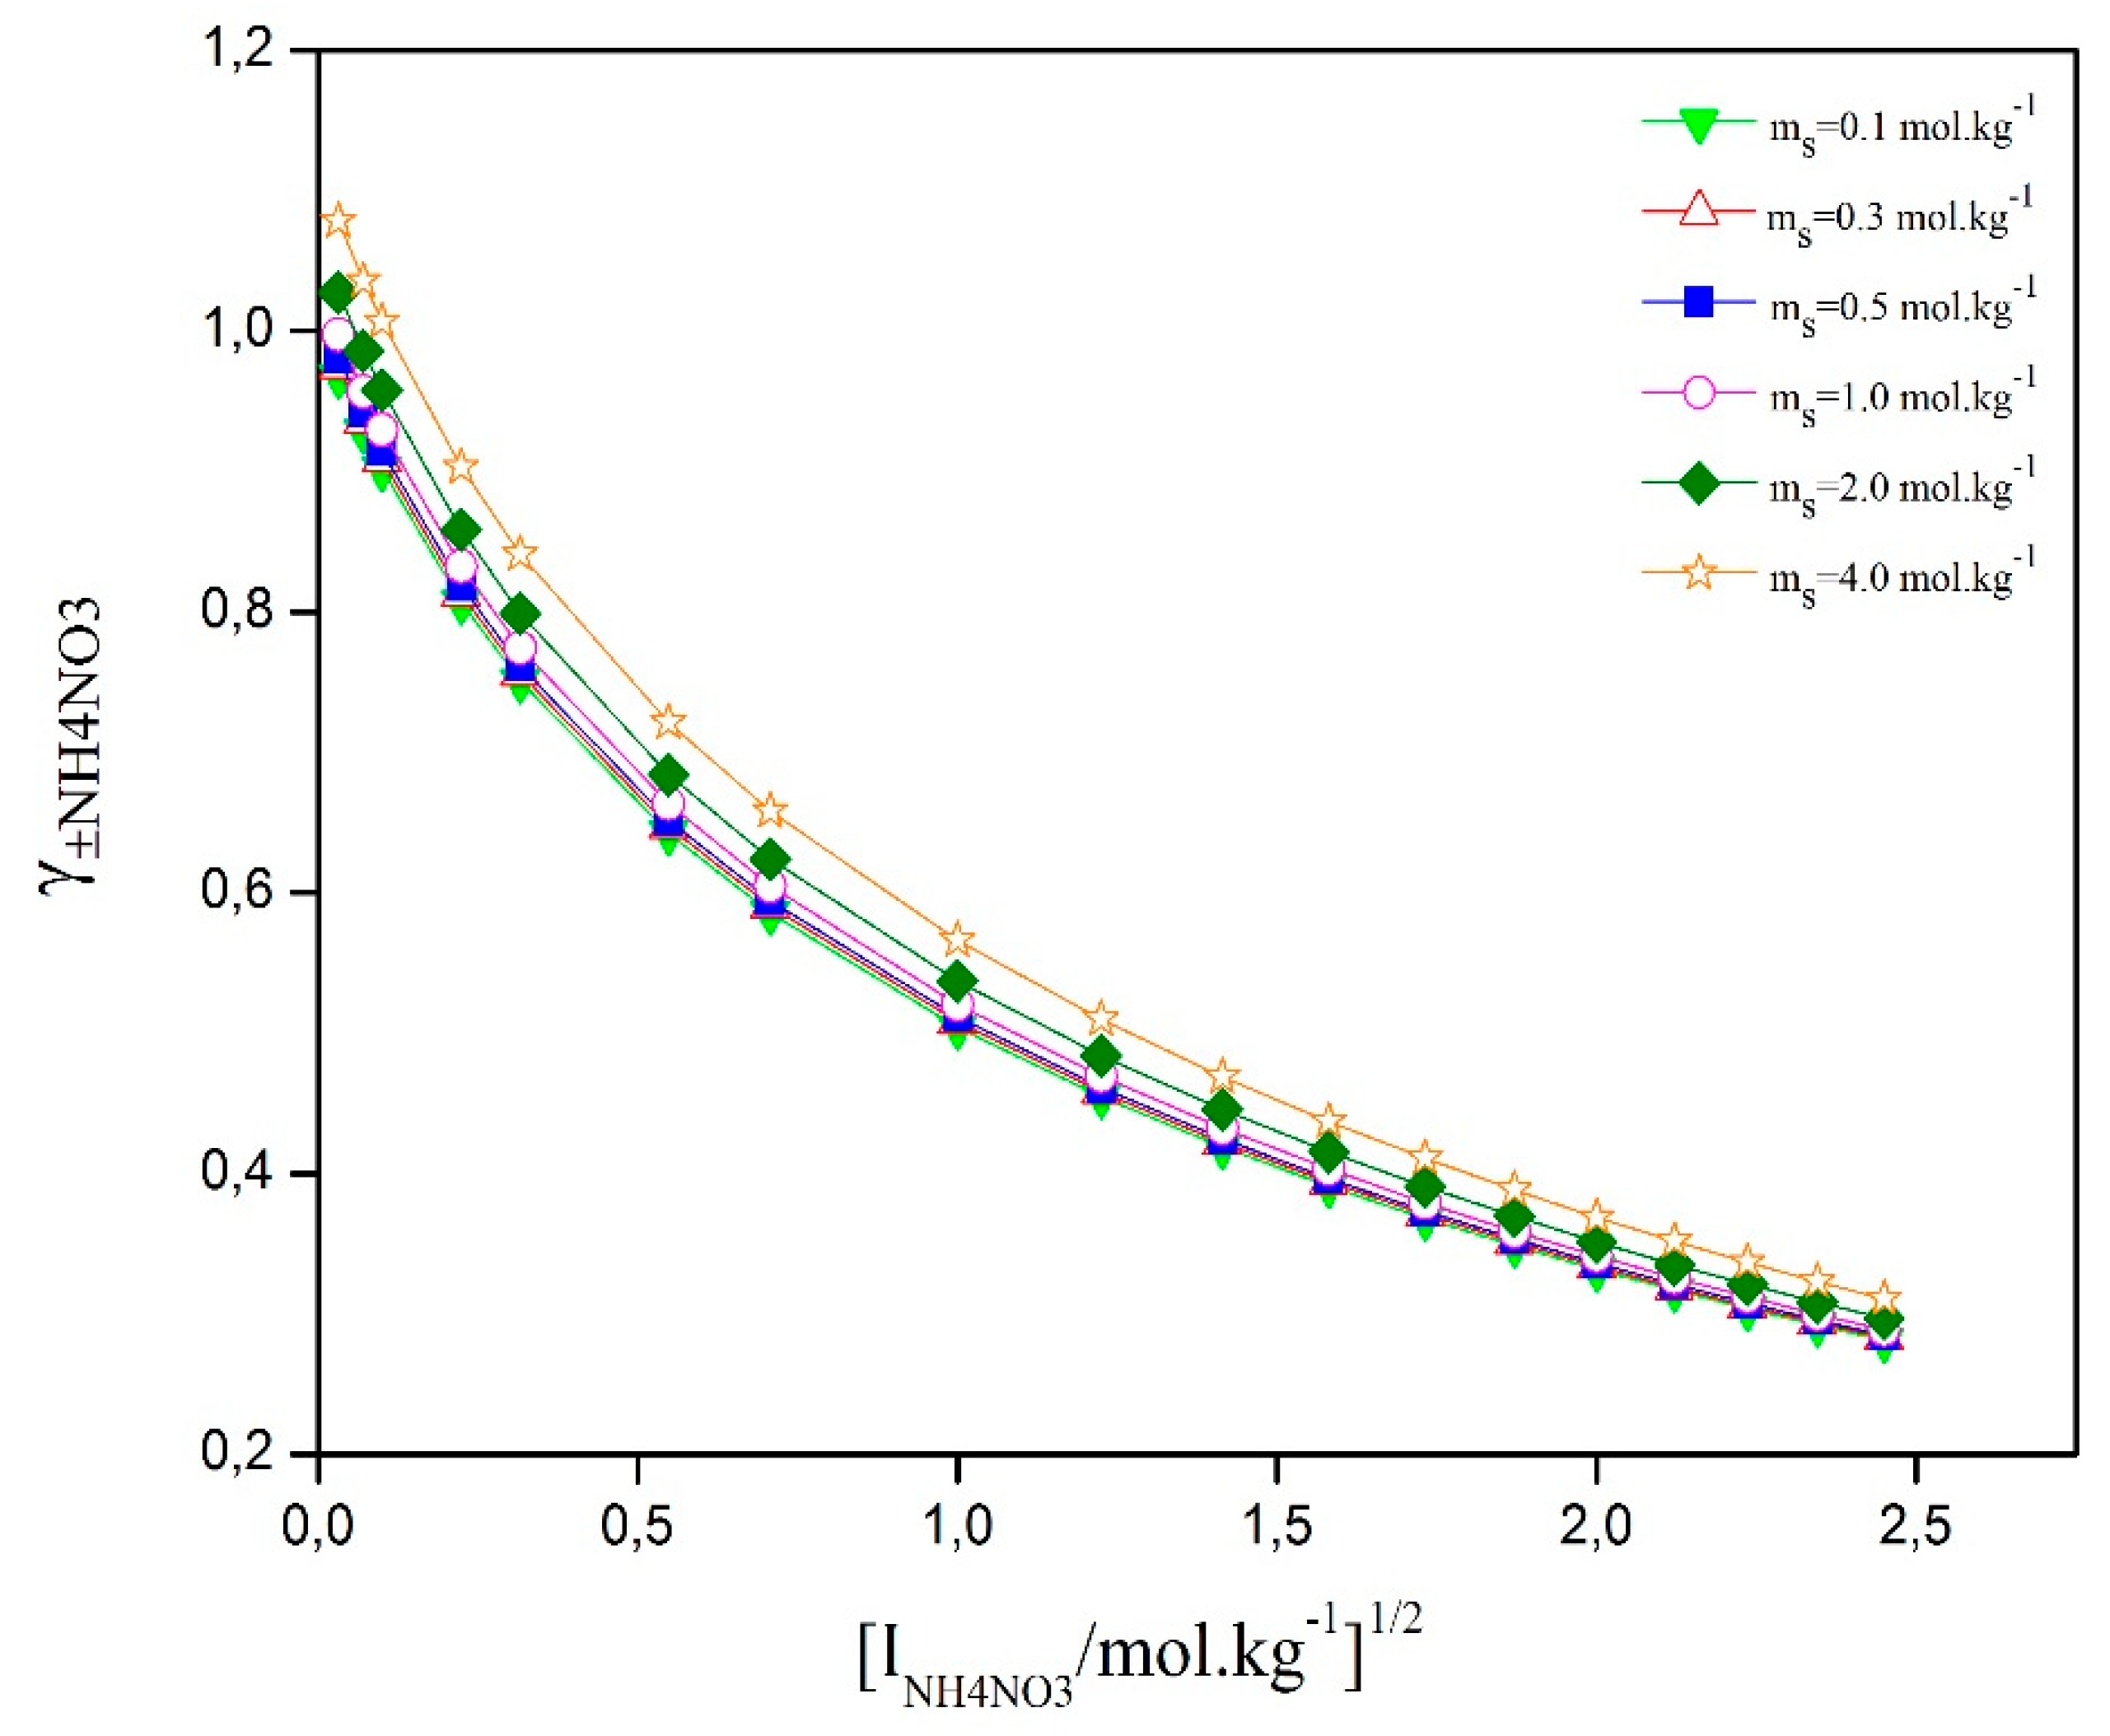
Figure 4 shows how the activity coefficient of ammonium nitrate (AN) changes with the square root of ionic strength in a ternary solution. The graph shows that the curves follow a clear pattern influenced by interactions between ions, ion-water solvation, and water-D-sucrose. In solutions with high AN concentration and less than about 1 mol·kg⁻¹ of D-sucrose, the activity coefficient of ammonium nitrate is very close to that of pure aqueous NH₄NO₃. However, when D-sucrose concentration exceeds 1 mol·kg⁻¹, the activity coefficient
decreases as ammonium nitrate concentration increases, but it slightly rises with more D-sucrose. This behavior is due to interactions between ions and D-sucrose, and between water and D-sucrose, which affect the solution’s thermodynamics.
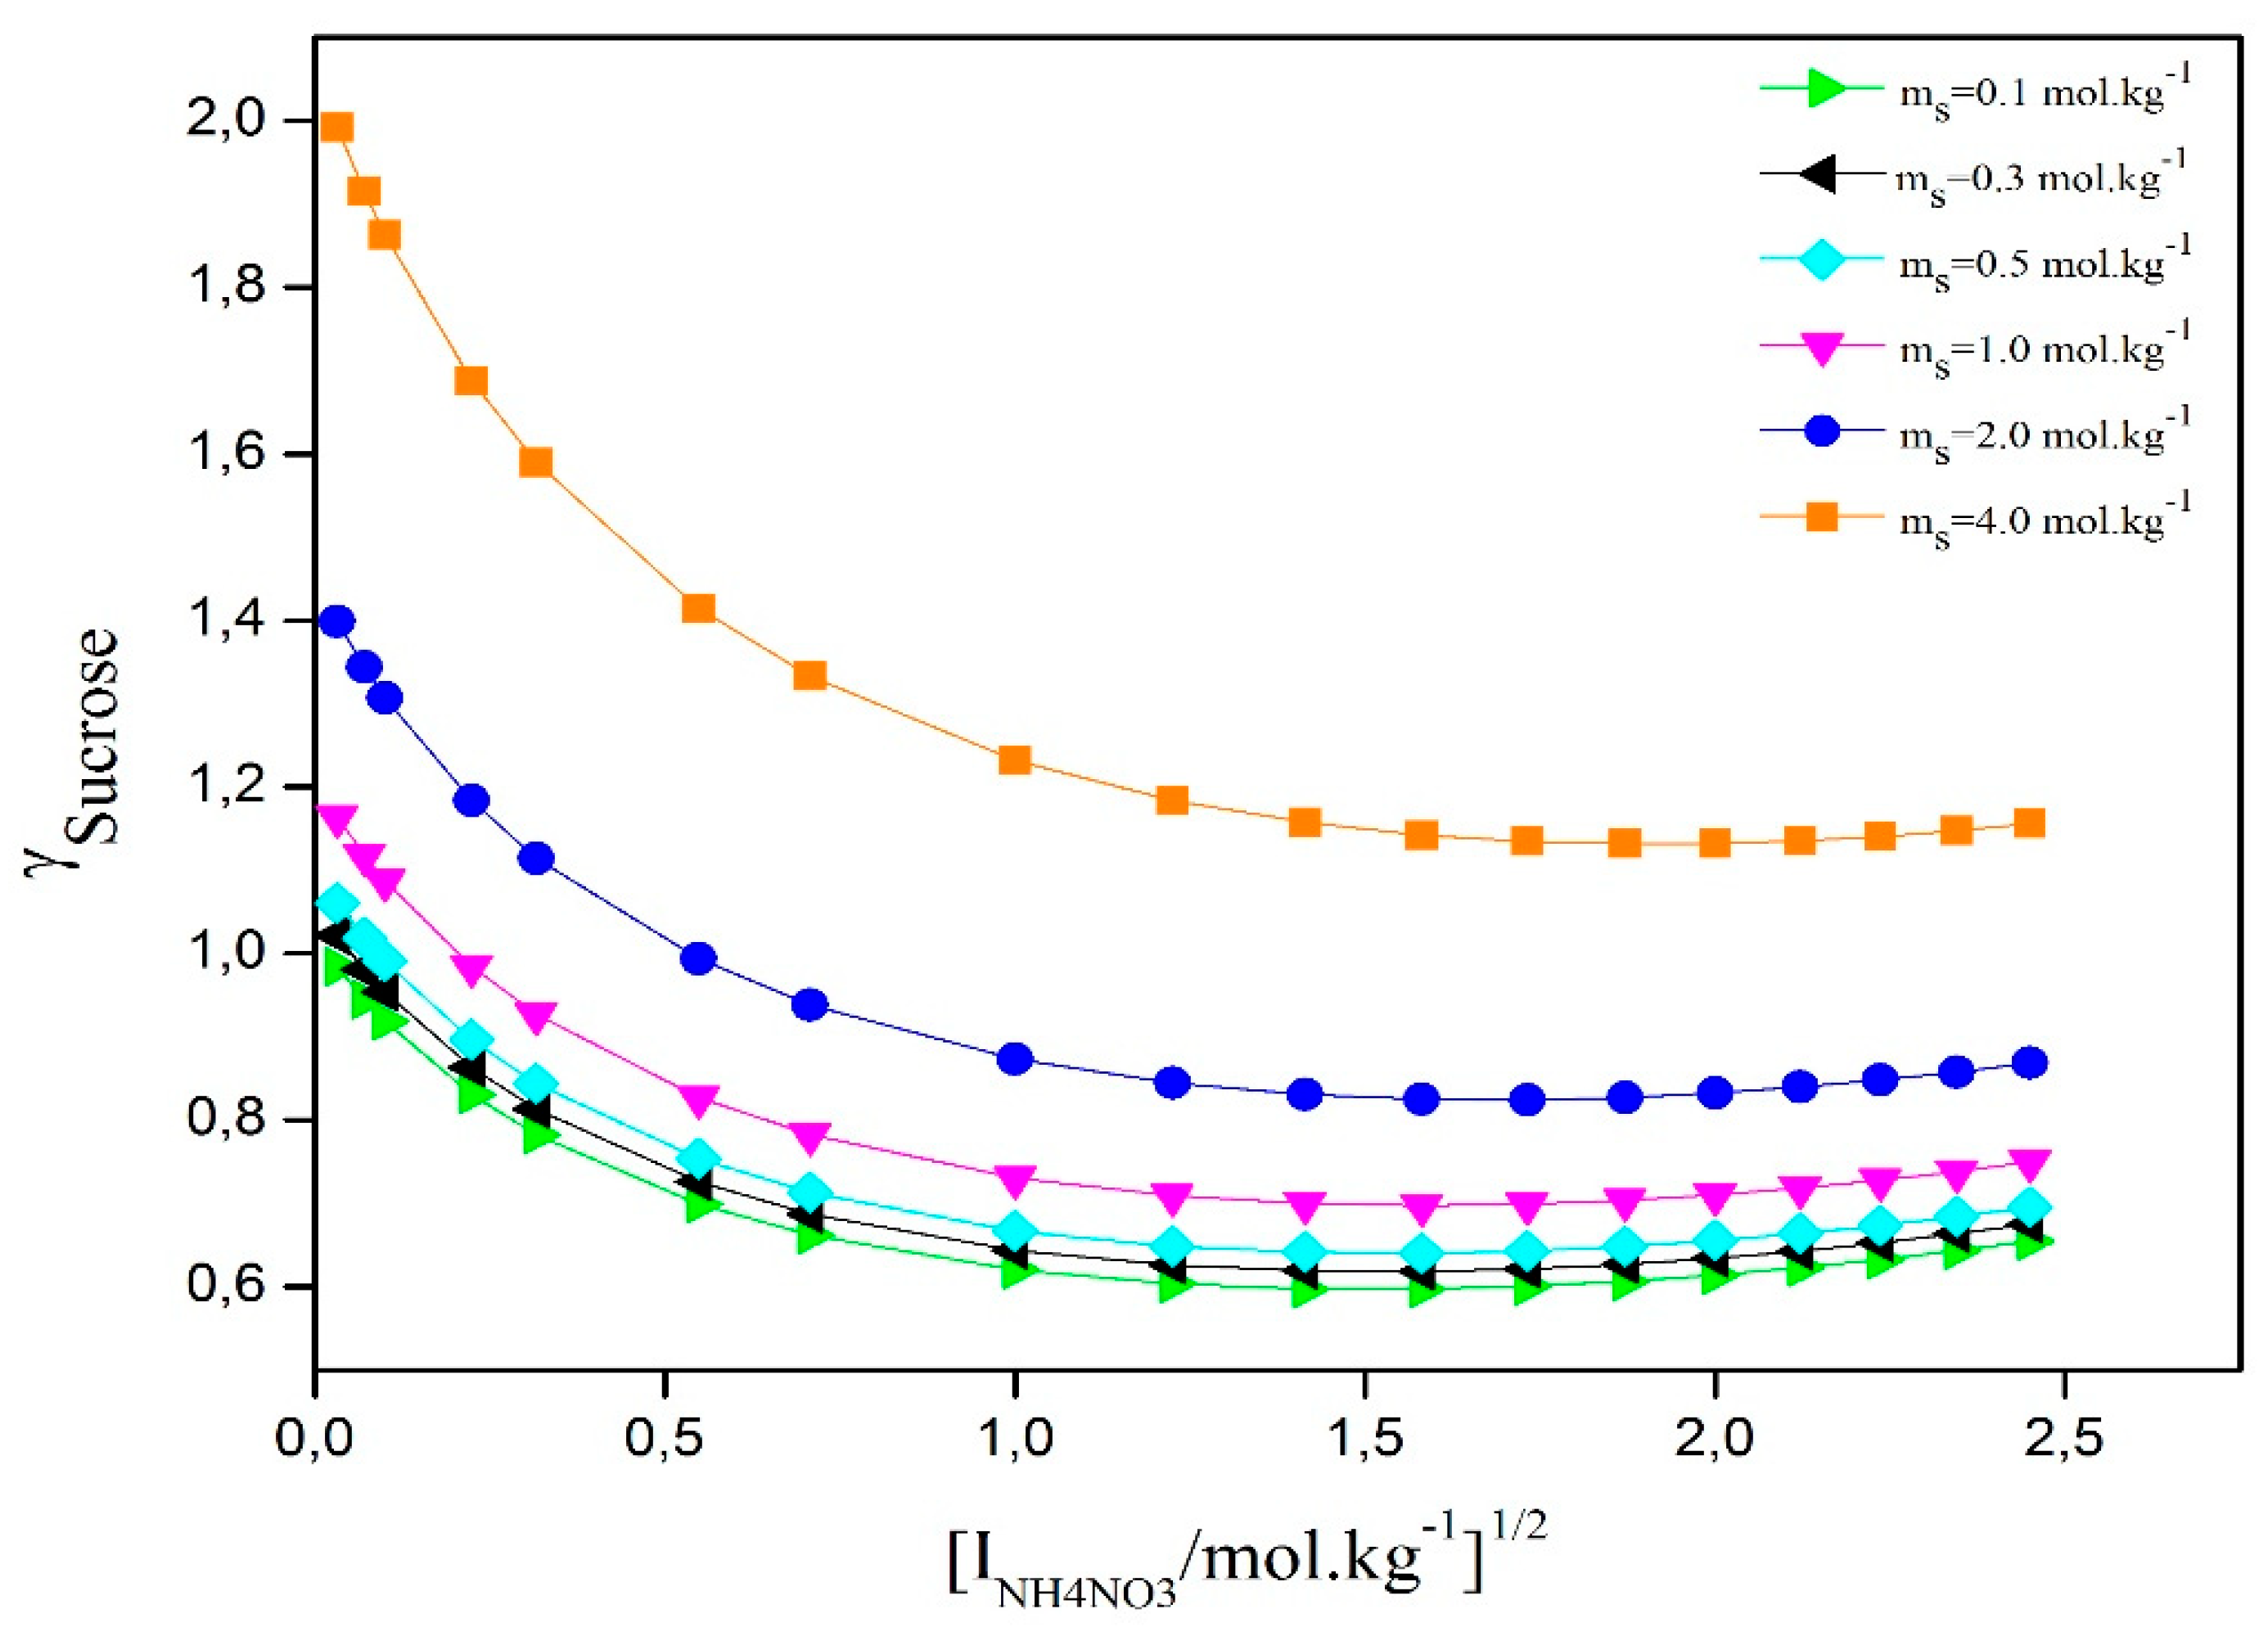
Figure 5 shows how the activity coefficient of D-sucrose changes with the square root of ionic strength in a ternary solution. All curves follow a similar trend depending on the amounts of D-sucrose and ammonium nitrate. The data indicate that the activity coefficient of D-sucrose in the ternary solutions is higher than in pure D-sucrose aqueous solutions. This suggests that NH₄NO₃ strongly affects the D-sucrose activity coefficient and causes a salting-out effect. Moreover, as ammonium nitrate concentration increases, both the D-sucrose activity coefficient and the salting-out effect become stronger.
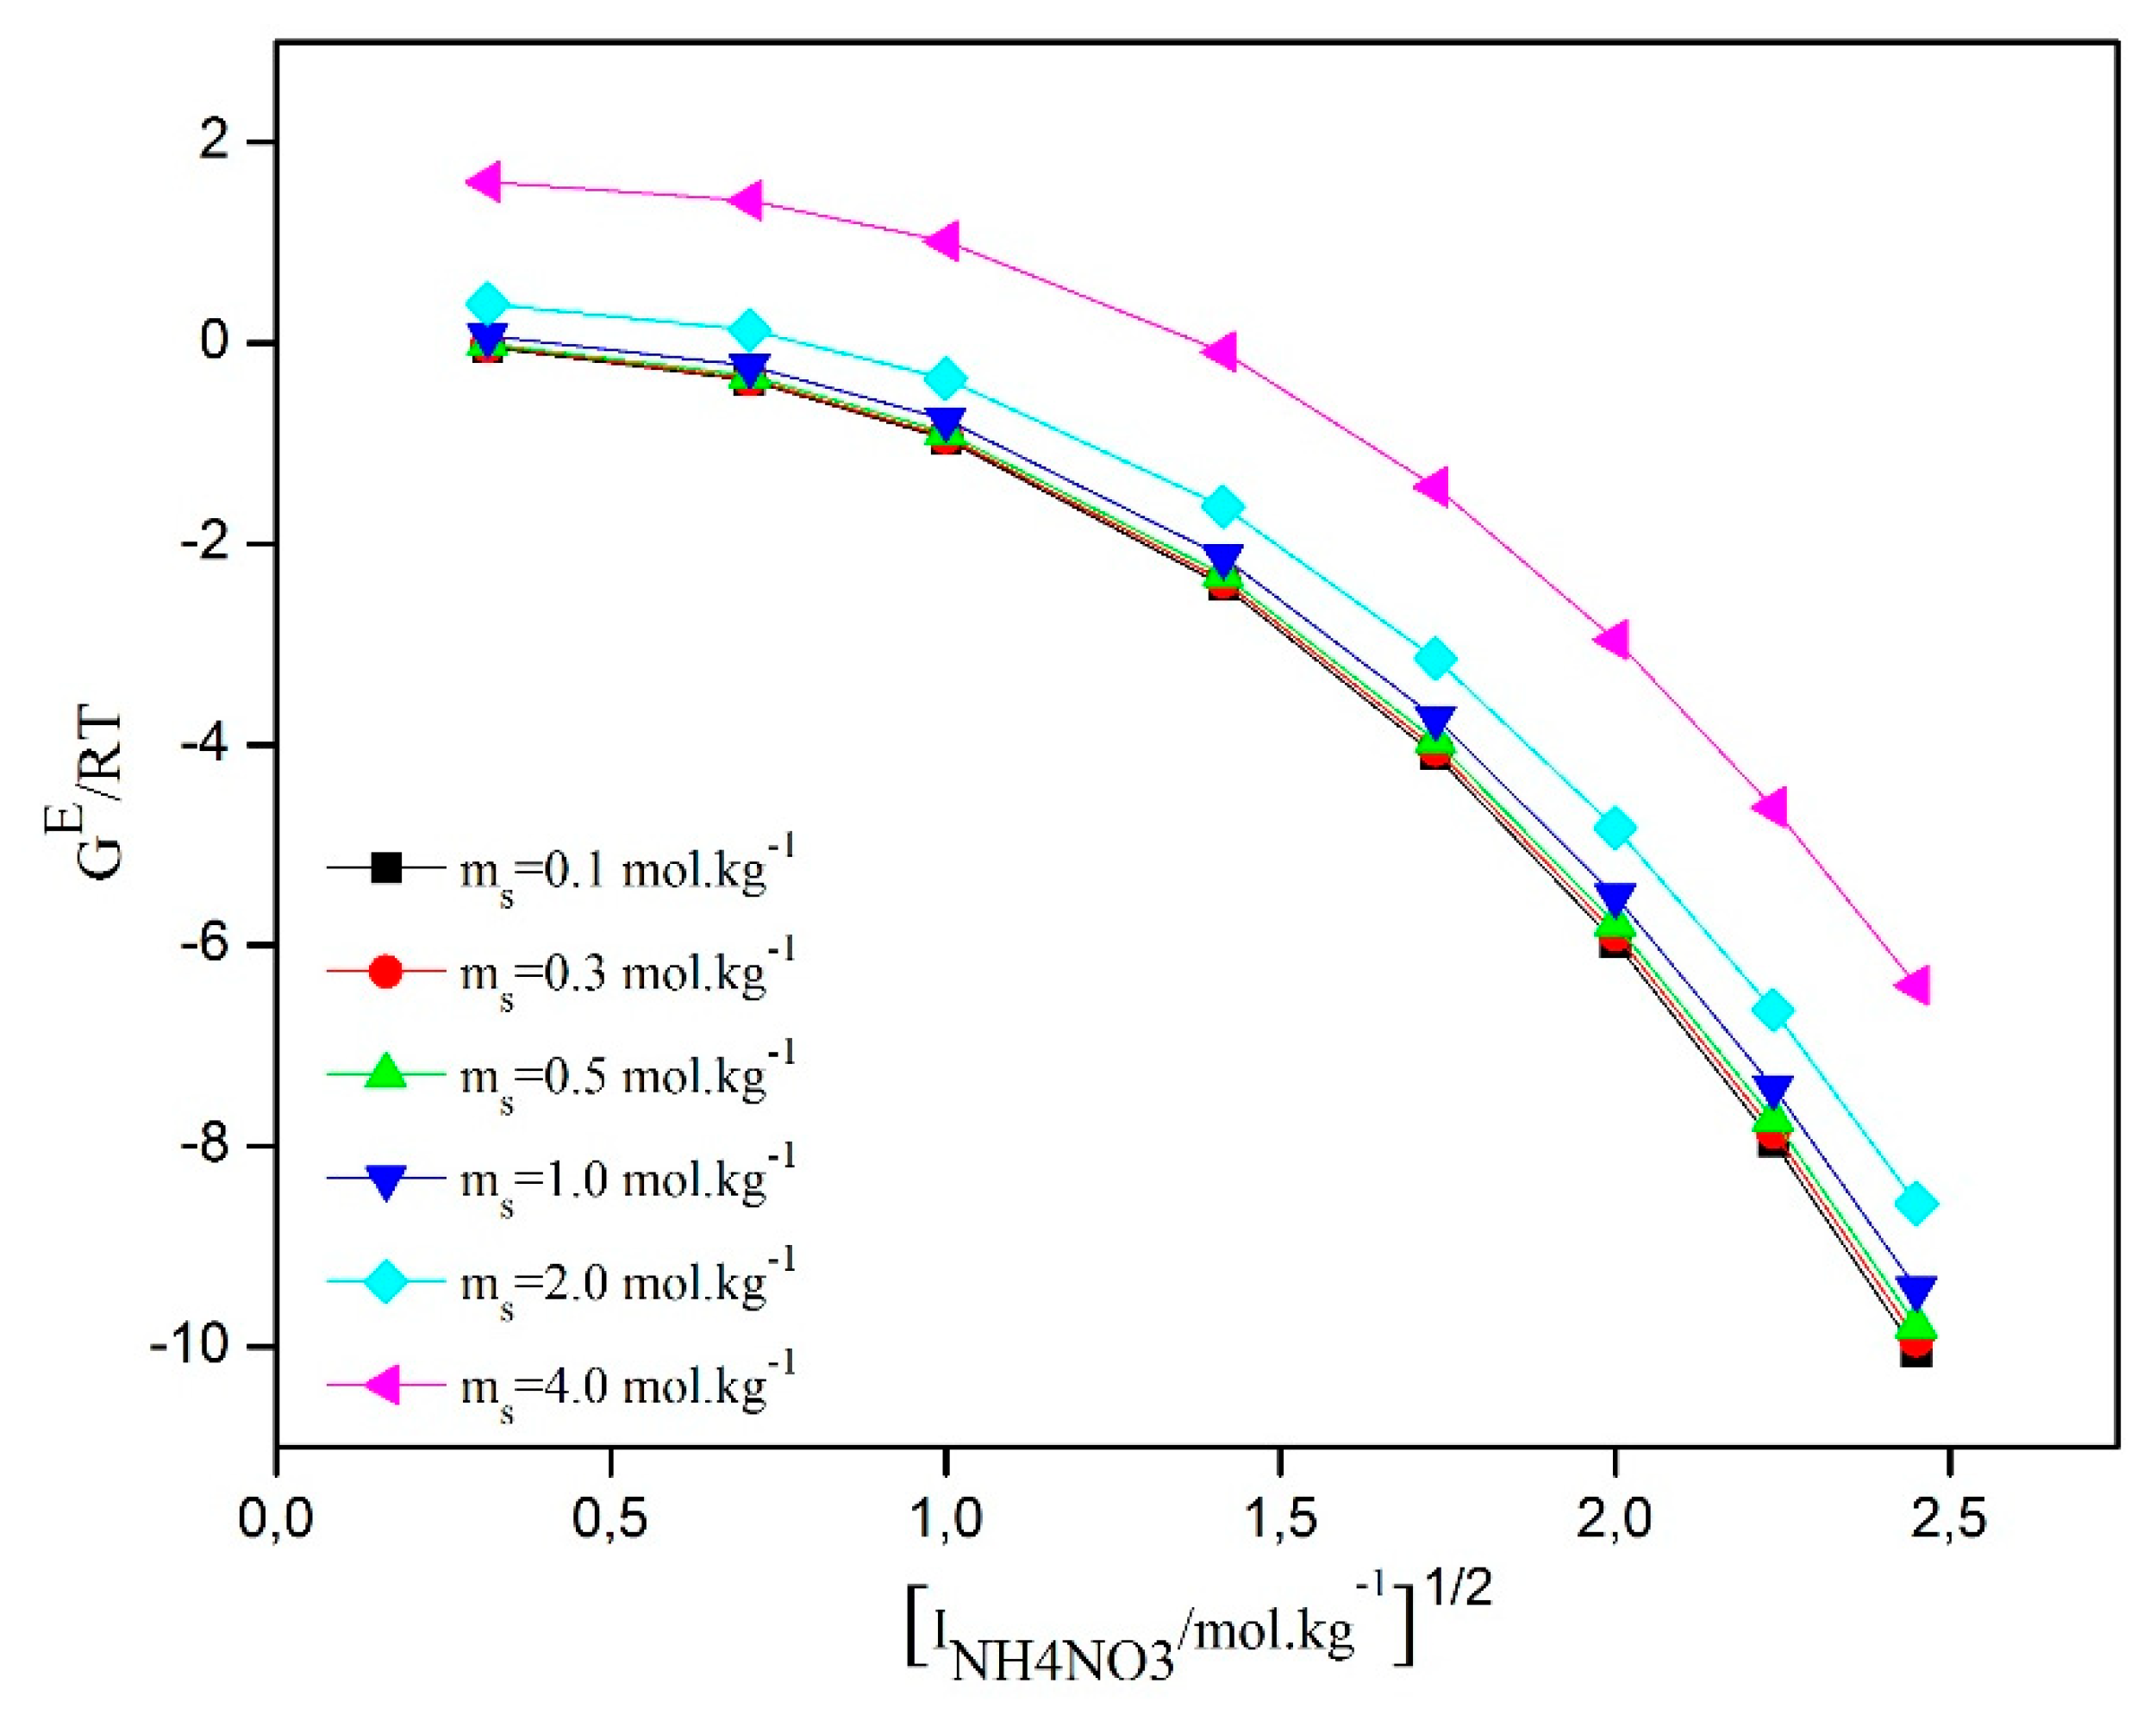
The data regarding the excess Gibbs free energies (g
E) have been determined for the entire range of molalities studied for NH
4NO
3 and D-Sucrose using the estimated parameters of the model and Equation (23). In
Table 4, the trends of excess Gibbs free energies are presented as a function of the square root of the ionic strength for the ternary system water/D-Sucrose/AN at different concentrations of D-Sucrose. The results show similar trends for this system. Specifically, as the concentration of D-Sucrose increases, the excess Gibbs free energy also increases. This suggests an increased interaction between D-Sucrose molecules and the other components of the system. On the other hand, as the ionic strength increases, the excess Gibbs free energy decreases. This indicates that the presence of ions has a reducing effect on the interaction of D-Sucrose molecules with other species present in the system. These observations are consistent with the data presented in the
Figure 6.
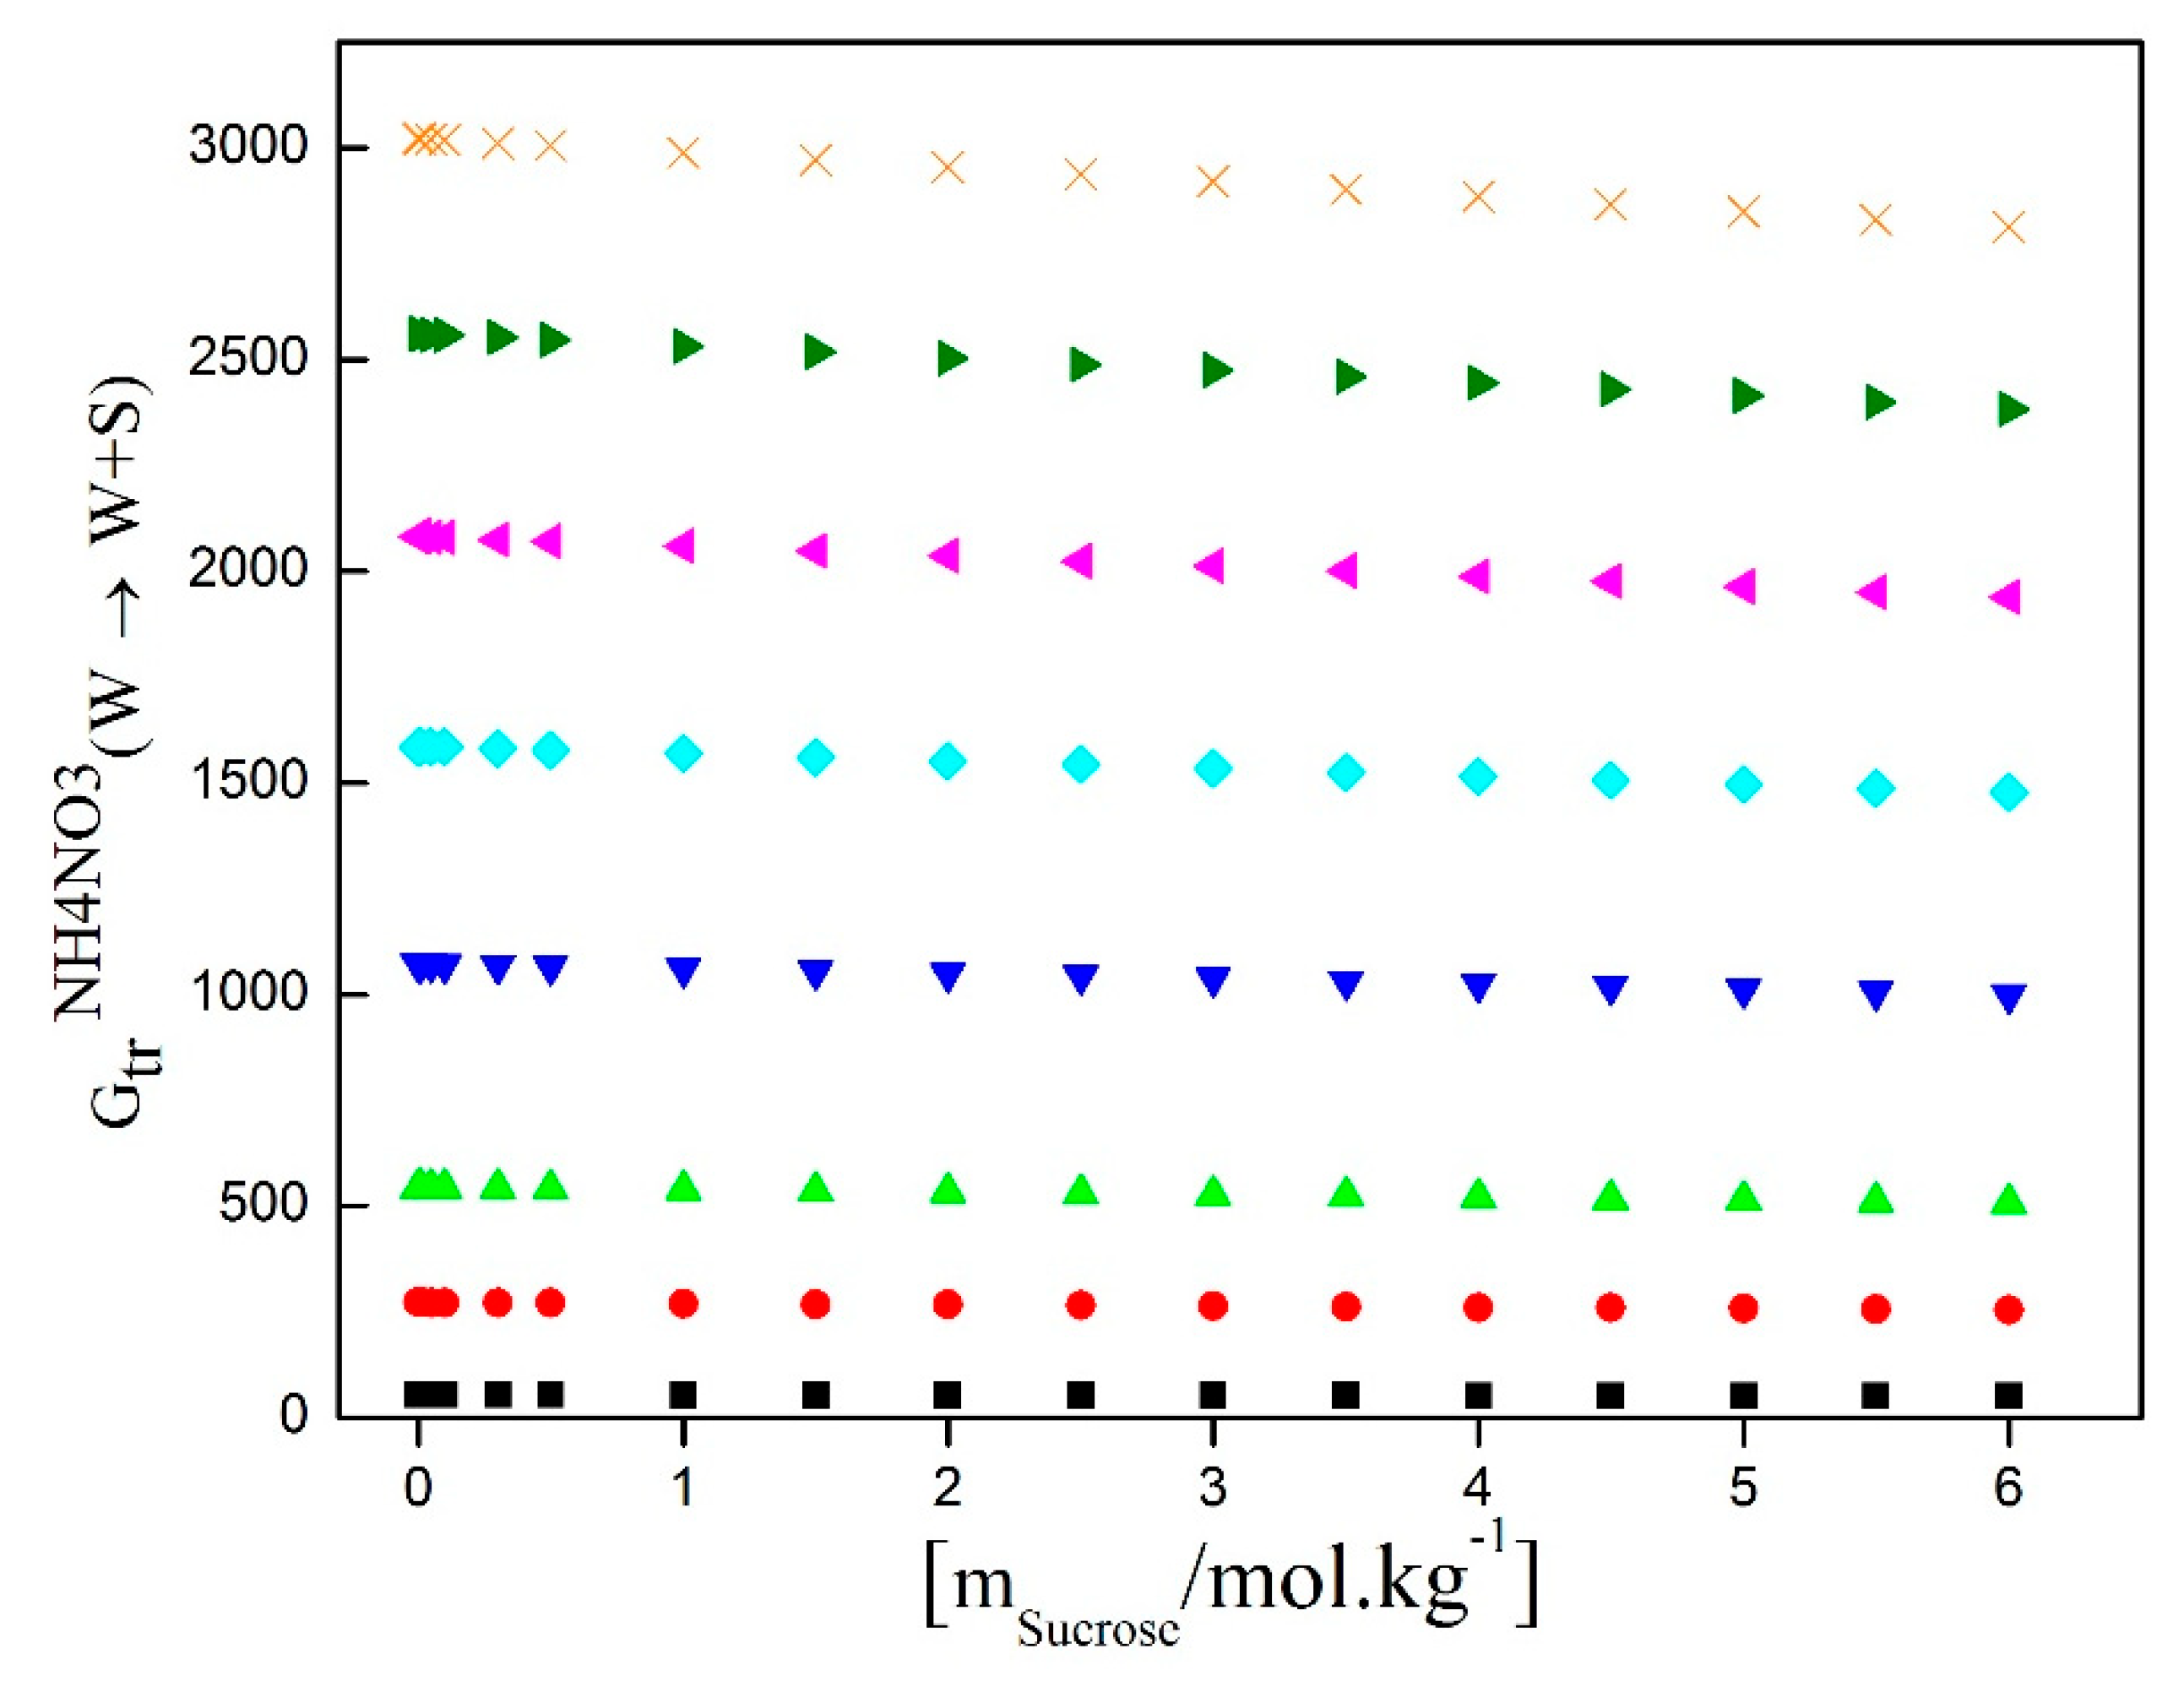
Figure 7 presents the calculated results of the AN transfer Gibbs energies from water to water/D-Sucrose mixtures as a function of salt molality and at various D-Sucrose molalities. This figure illustrates a positive correlation between the AN transfer Gibbs energy and the D-Sucrose content, indicating an increasingly unfavorable interaction between D-Sucrose and AN with higher D-Sucrose concentrations. However, it is important to note that the transfer Gibbs energy of ammonium nitrate remains constant for a single molality of sucrose, due to the establishment of a chemical equilibrium between ammonium nitrate and sucrose in the solution.
In the presence of a constant molality of sucrose, the hydration of ammonium nitrate is not directly affected. Upon dissolution of ammonium nitrate in water, NH4+ and NO3- ions hydrate through electrostatic interactions with water molecules. Simultaneously, sucrose dissolves by forming dipole-dipole interactions with water molecules. Although solute-solvent interactions can be altered in the presence of sucrose, the hydration of NH4+ and NO3- ions remains relatively constant. Therefore, the transfer Gibbs energy of ammonium nitrate remains unchanged, as the compensating effects of solute-solvent interactions maintain a dynamic equilibrium between the dissolved chemical species and water molecules.
The free energy parameters for the pairwise interaction g
NE (where E and N are assigned to the electrolyte and non-electrolyte, respectively) describe how the electrolyte interacts with D-sucrose in aqueous media. These values reflect the overall average of all individual interactions between D-sucrose molecules and the ions present in a specific salt. Based on the McMillan–Mayer solution theory, the Gibbs transfer energies of NH₄NO₃ from pure water to water/D-sucrose mixtures, under constant temperature and pressure conditions, can be determined using the following relationship:
where
and
are the molality of Nonelectrolyte (D-Sucrose) and Electrolyte (NH
4NO
3), respectively.
,
and
are the pair interaction and the triplet interaction parameters. The data of transfer Gibbs energy of NH
4NO
3from water to mixture water/D-Sucrose were used for optimization of
,
and
.
When both the electrolyte and non-electrolyte are present at low concentrations, triplet interaction terms can be neglected. Under these conditions, the salting coefficient can be evaluated from the pair interaction parameter using the following expression:
Table 5.
Interaction parameters of Gibbs energies of transfer of NH4NO3 from water to mixture water+D-Sucrose and salting constants ηs at 298.15 K.
Table 5.
Interaction parameters of Gibbs energies of transfer of NH4NO3 from water to mixture water+D-Sucrose and salting constants ηs at 298.15 K.
| |
gEN/J.kg.mol-2
|
gEEN/J.kg.mol-3
|
gENN/J.kg.mol-3
|
ηs |
| This work |
137.894 |
0.48253 |
-0.64843 |
0.2225 |
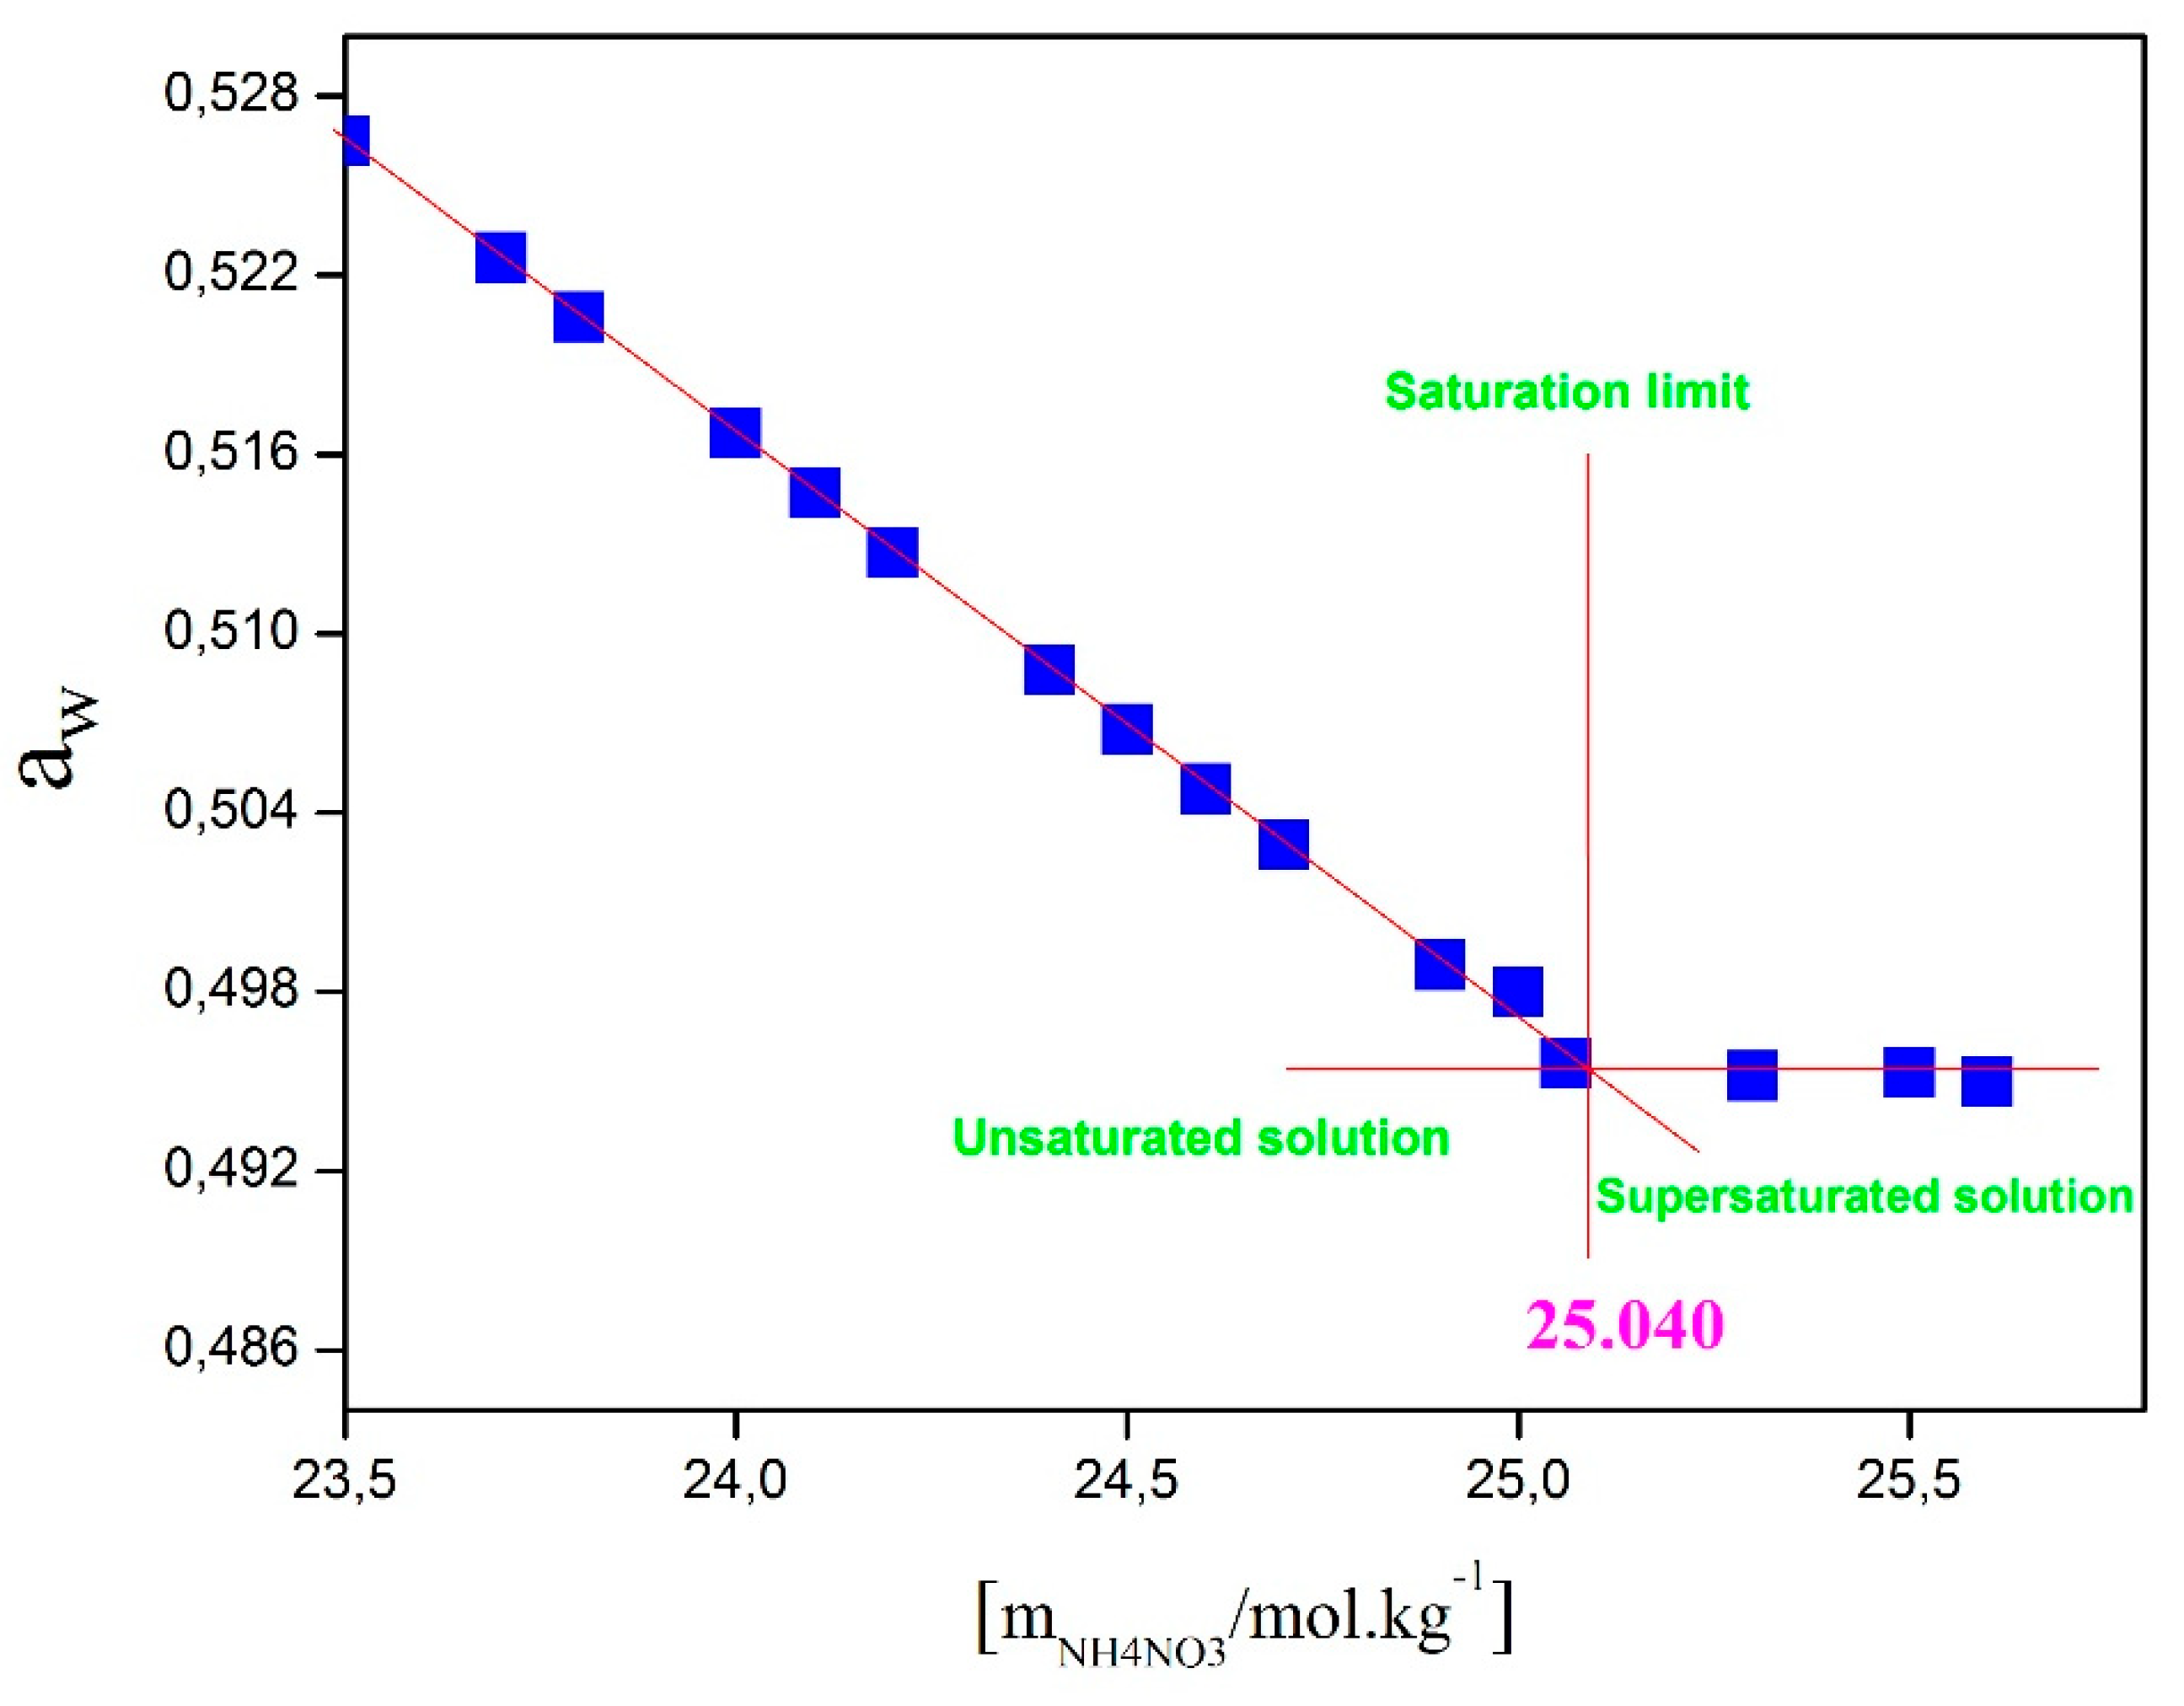
The hygrometric method can be employed to determine the saturation limit of an aqueous solution. Once the solution reaches saturation, both its relative humidity and the solute concentration in the liquid phase remain constant [
14,
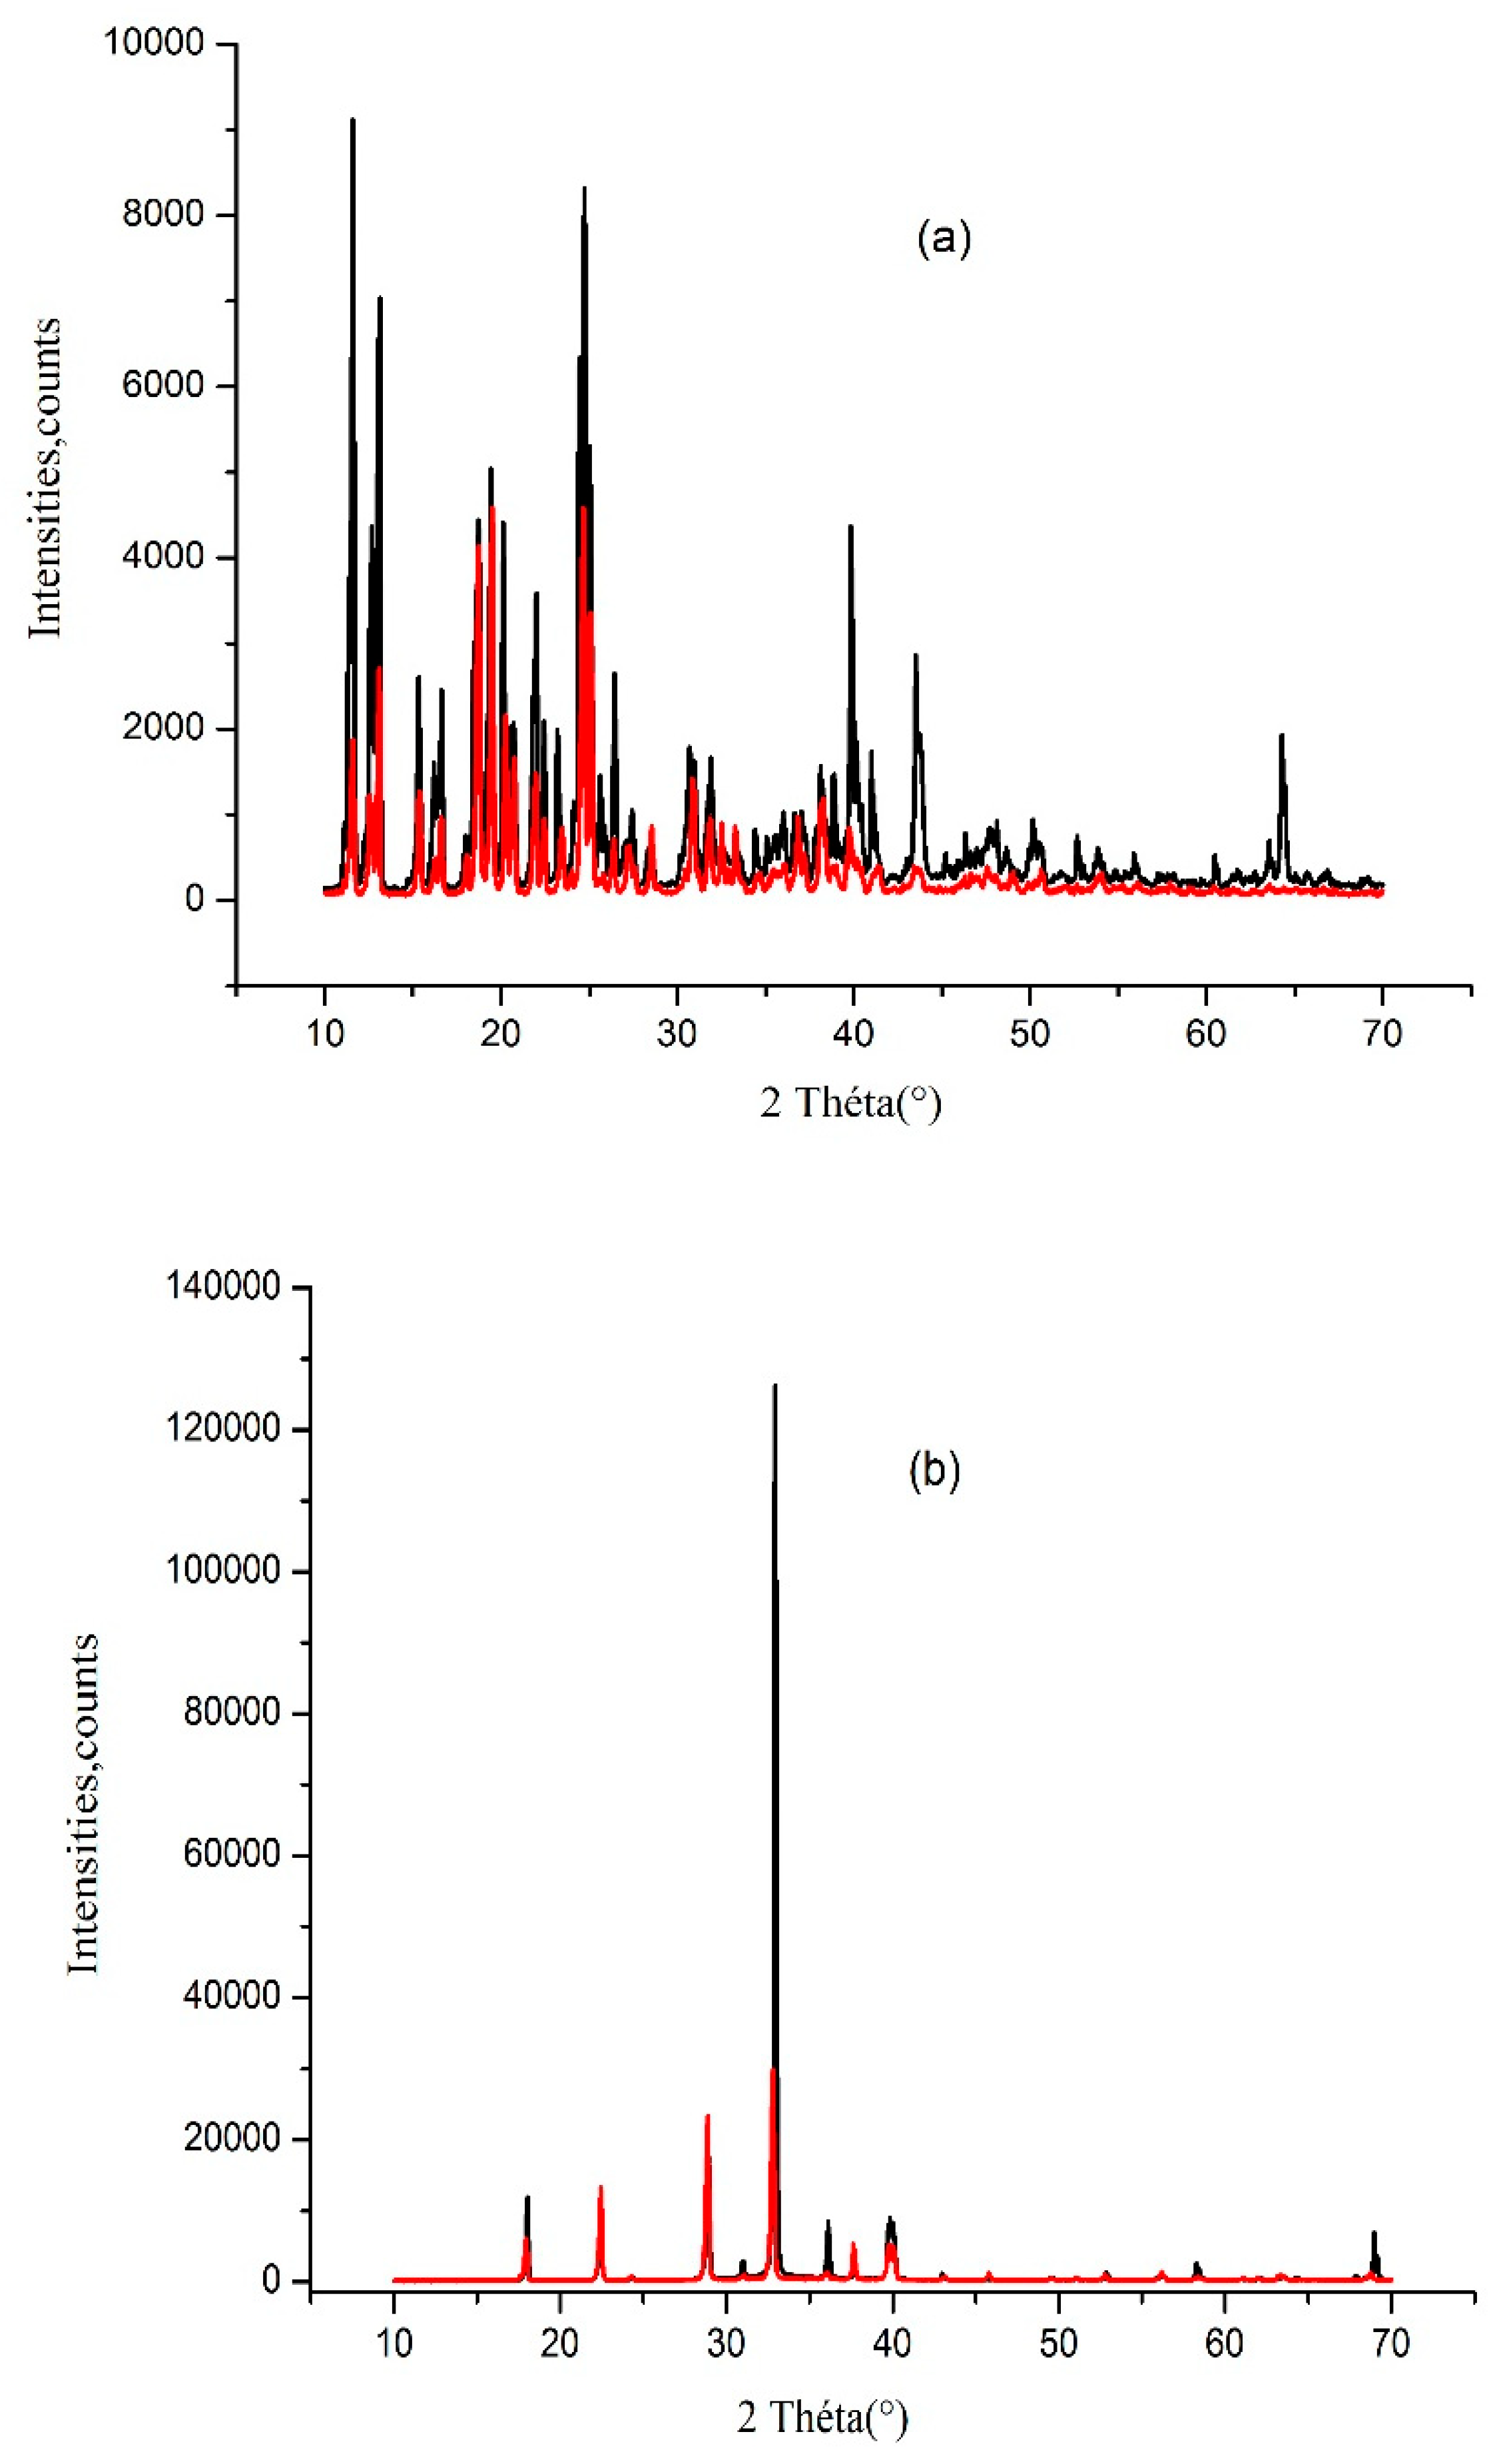
19]. In this work, the saturation limit was measured for an aqueous mixture composed of water, D-sucrose, and ammonium nitrate (AN). To identify the solid phases formed, ATR-FTIR spectroscopy and powder X-ray diffraction (PXRD) analyses were performed. The PXRD patterns of the obtained crystals are shown in
Figure 8, while the ATR-FTIR spectra are presented in
Figure 9. For comparison, crystallization results for sucrose and ammonium nitrate in pure water are also included in these figures.
As illustrated in
Figure 8a, PXRD analyses of solids crystallized from supersaturated sucrose–water mixtures and from water/D-sucrose/AN mixtures at high sucrose concentrations yielded identical diffraction patterns. The PXRD profile of crystalline sucrose (
Figure 8a) matches very well with reference data reported in the literature.
Figure 8b presents the PXRD patterns of crystals obtained from supersaturated water/D-sucrose/AN solutions with high ammonium nitrate content. These results indicate that dry AN crystals are formed both in the crystallization of ammonium nitrate from pure water and from supersaturated ammonium nitrate–sucrose–water systems at elevated AN concentrations.
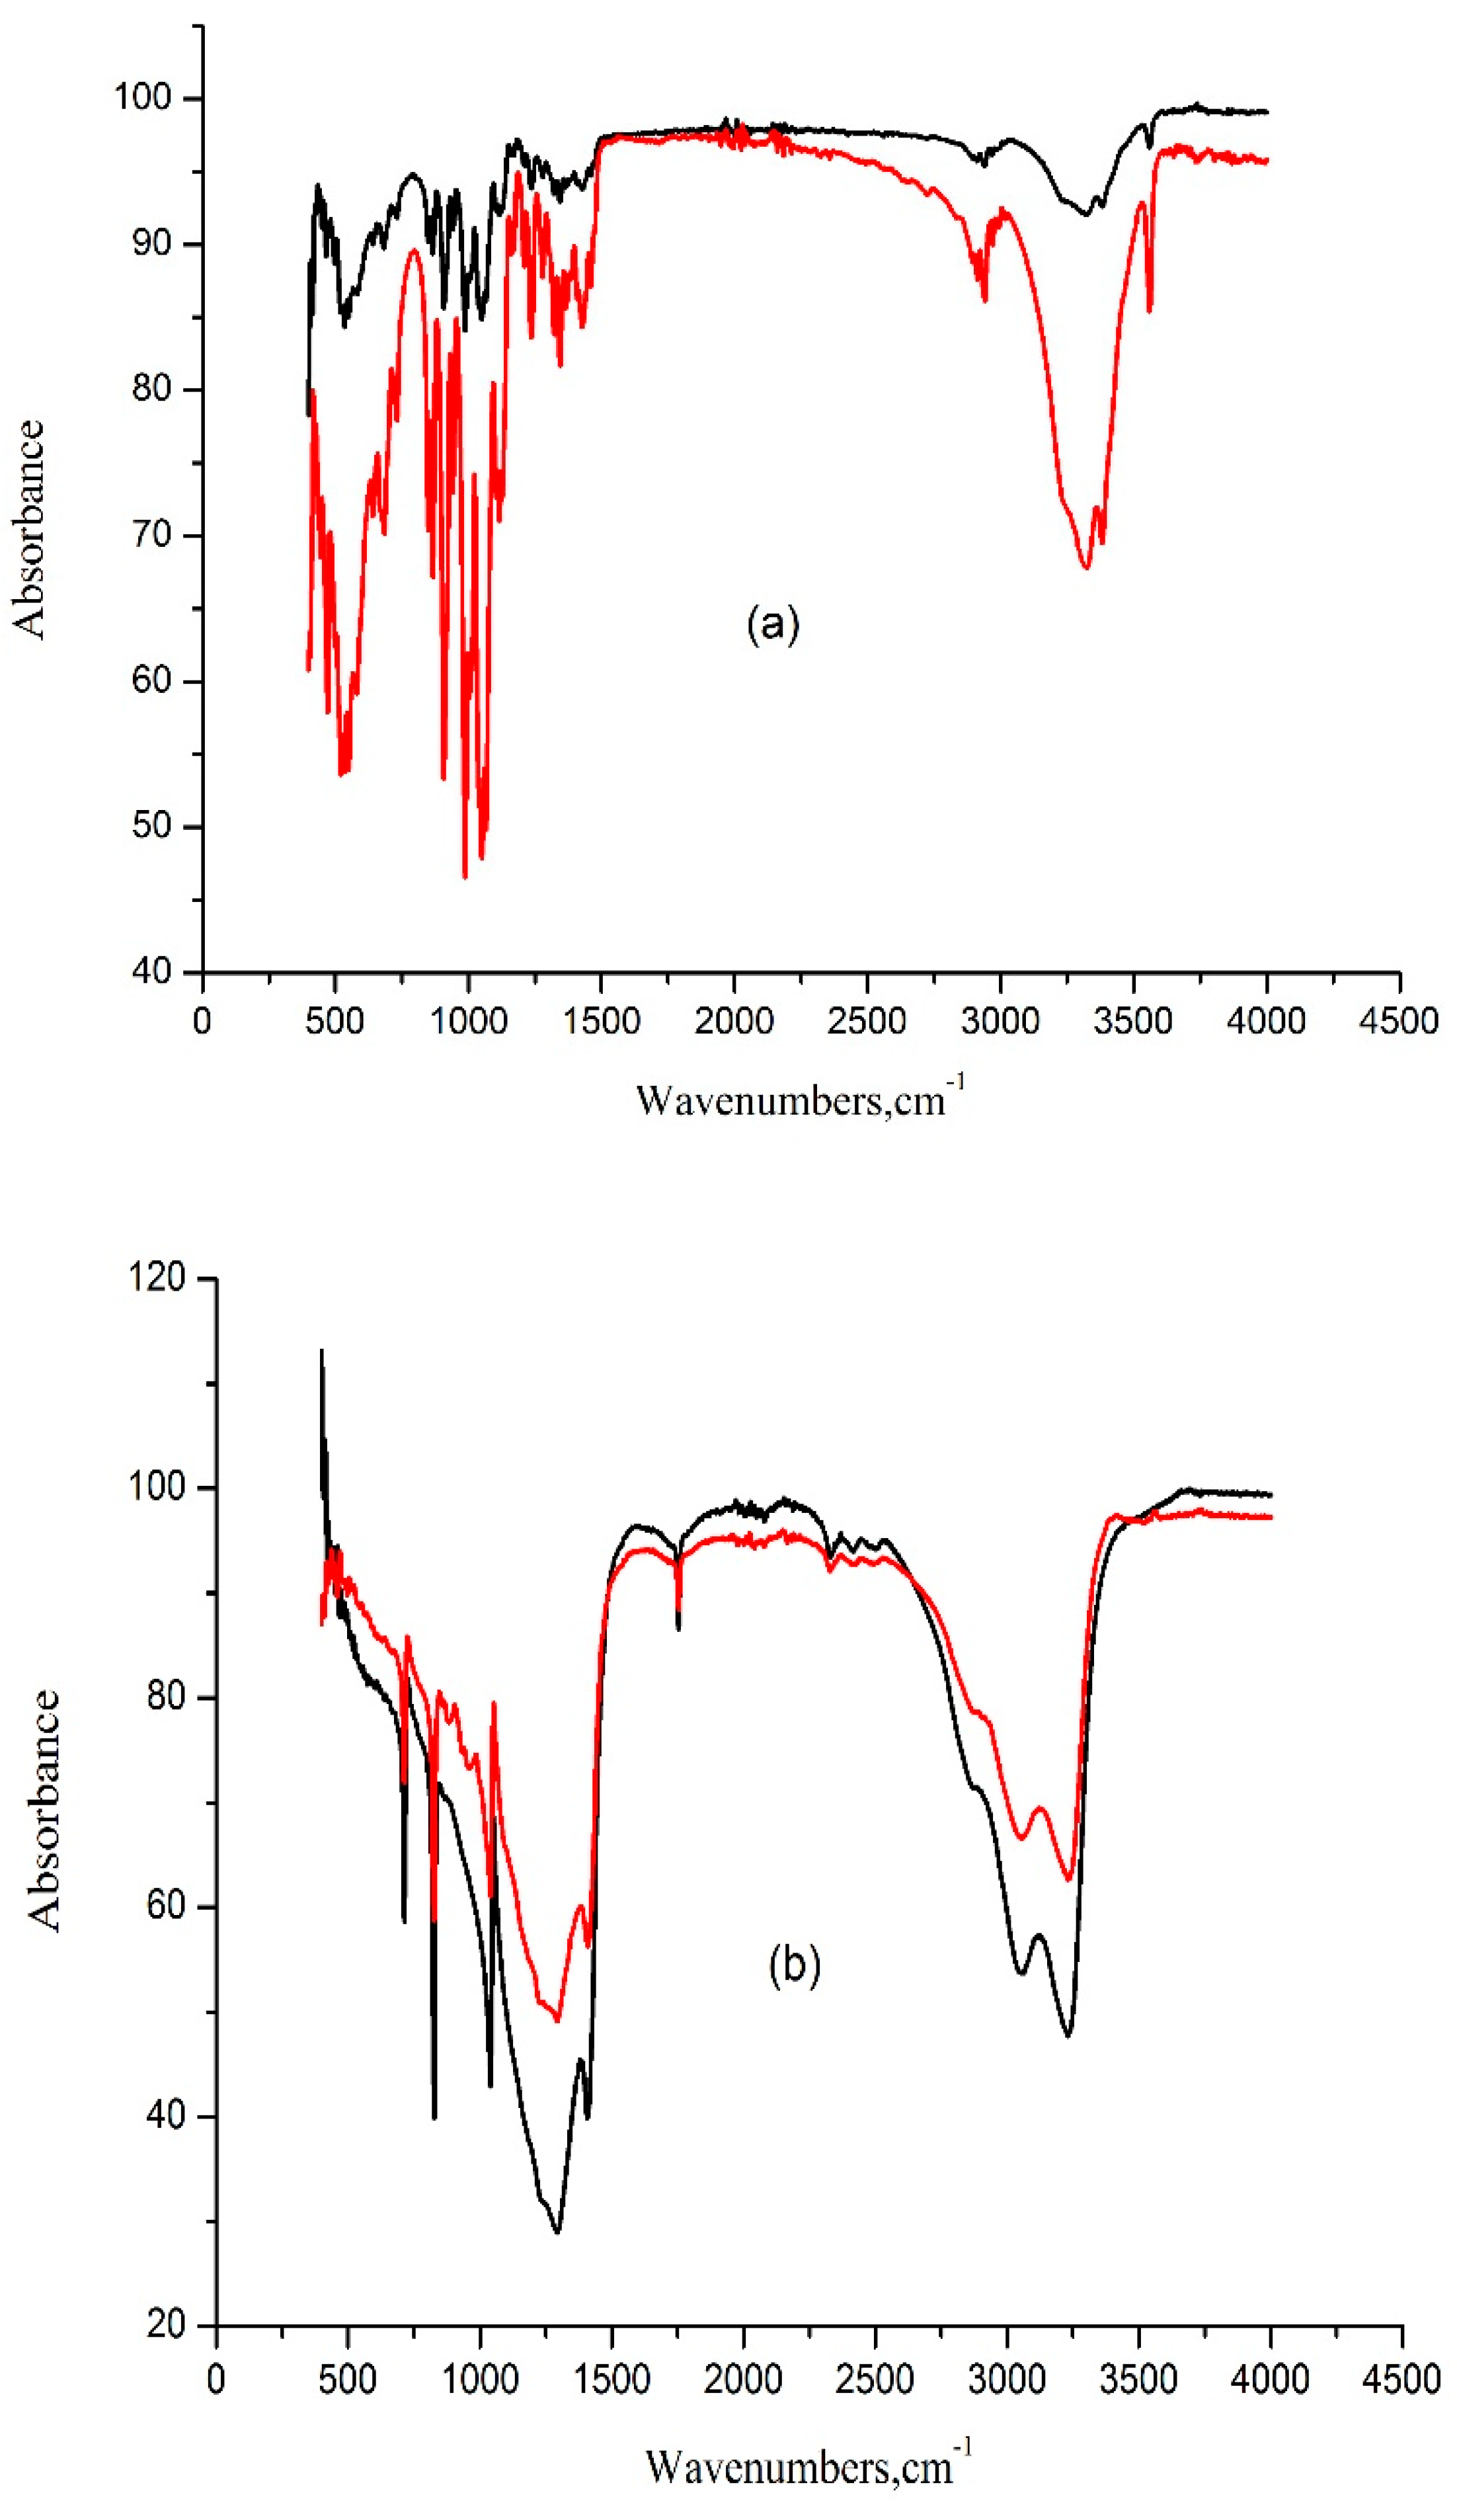
Figure 9 displays the ATR-FTIR spectra of solids recovered from supersaturated mixtures of ammonium nitrate, sucrose, and water, alongside the spectra of pure sucrose and pure ammonium nitrate crystallized from water for comparison.
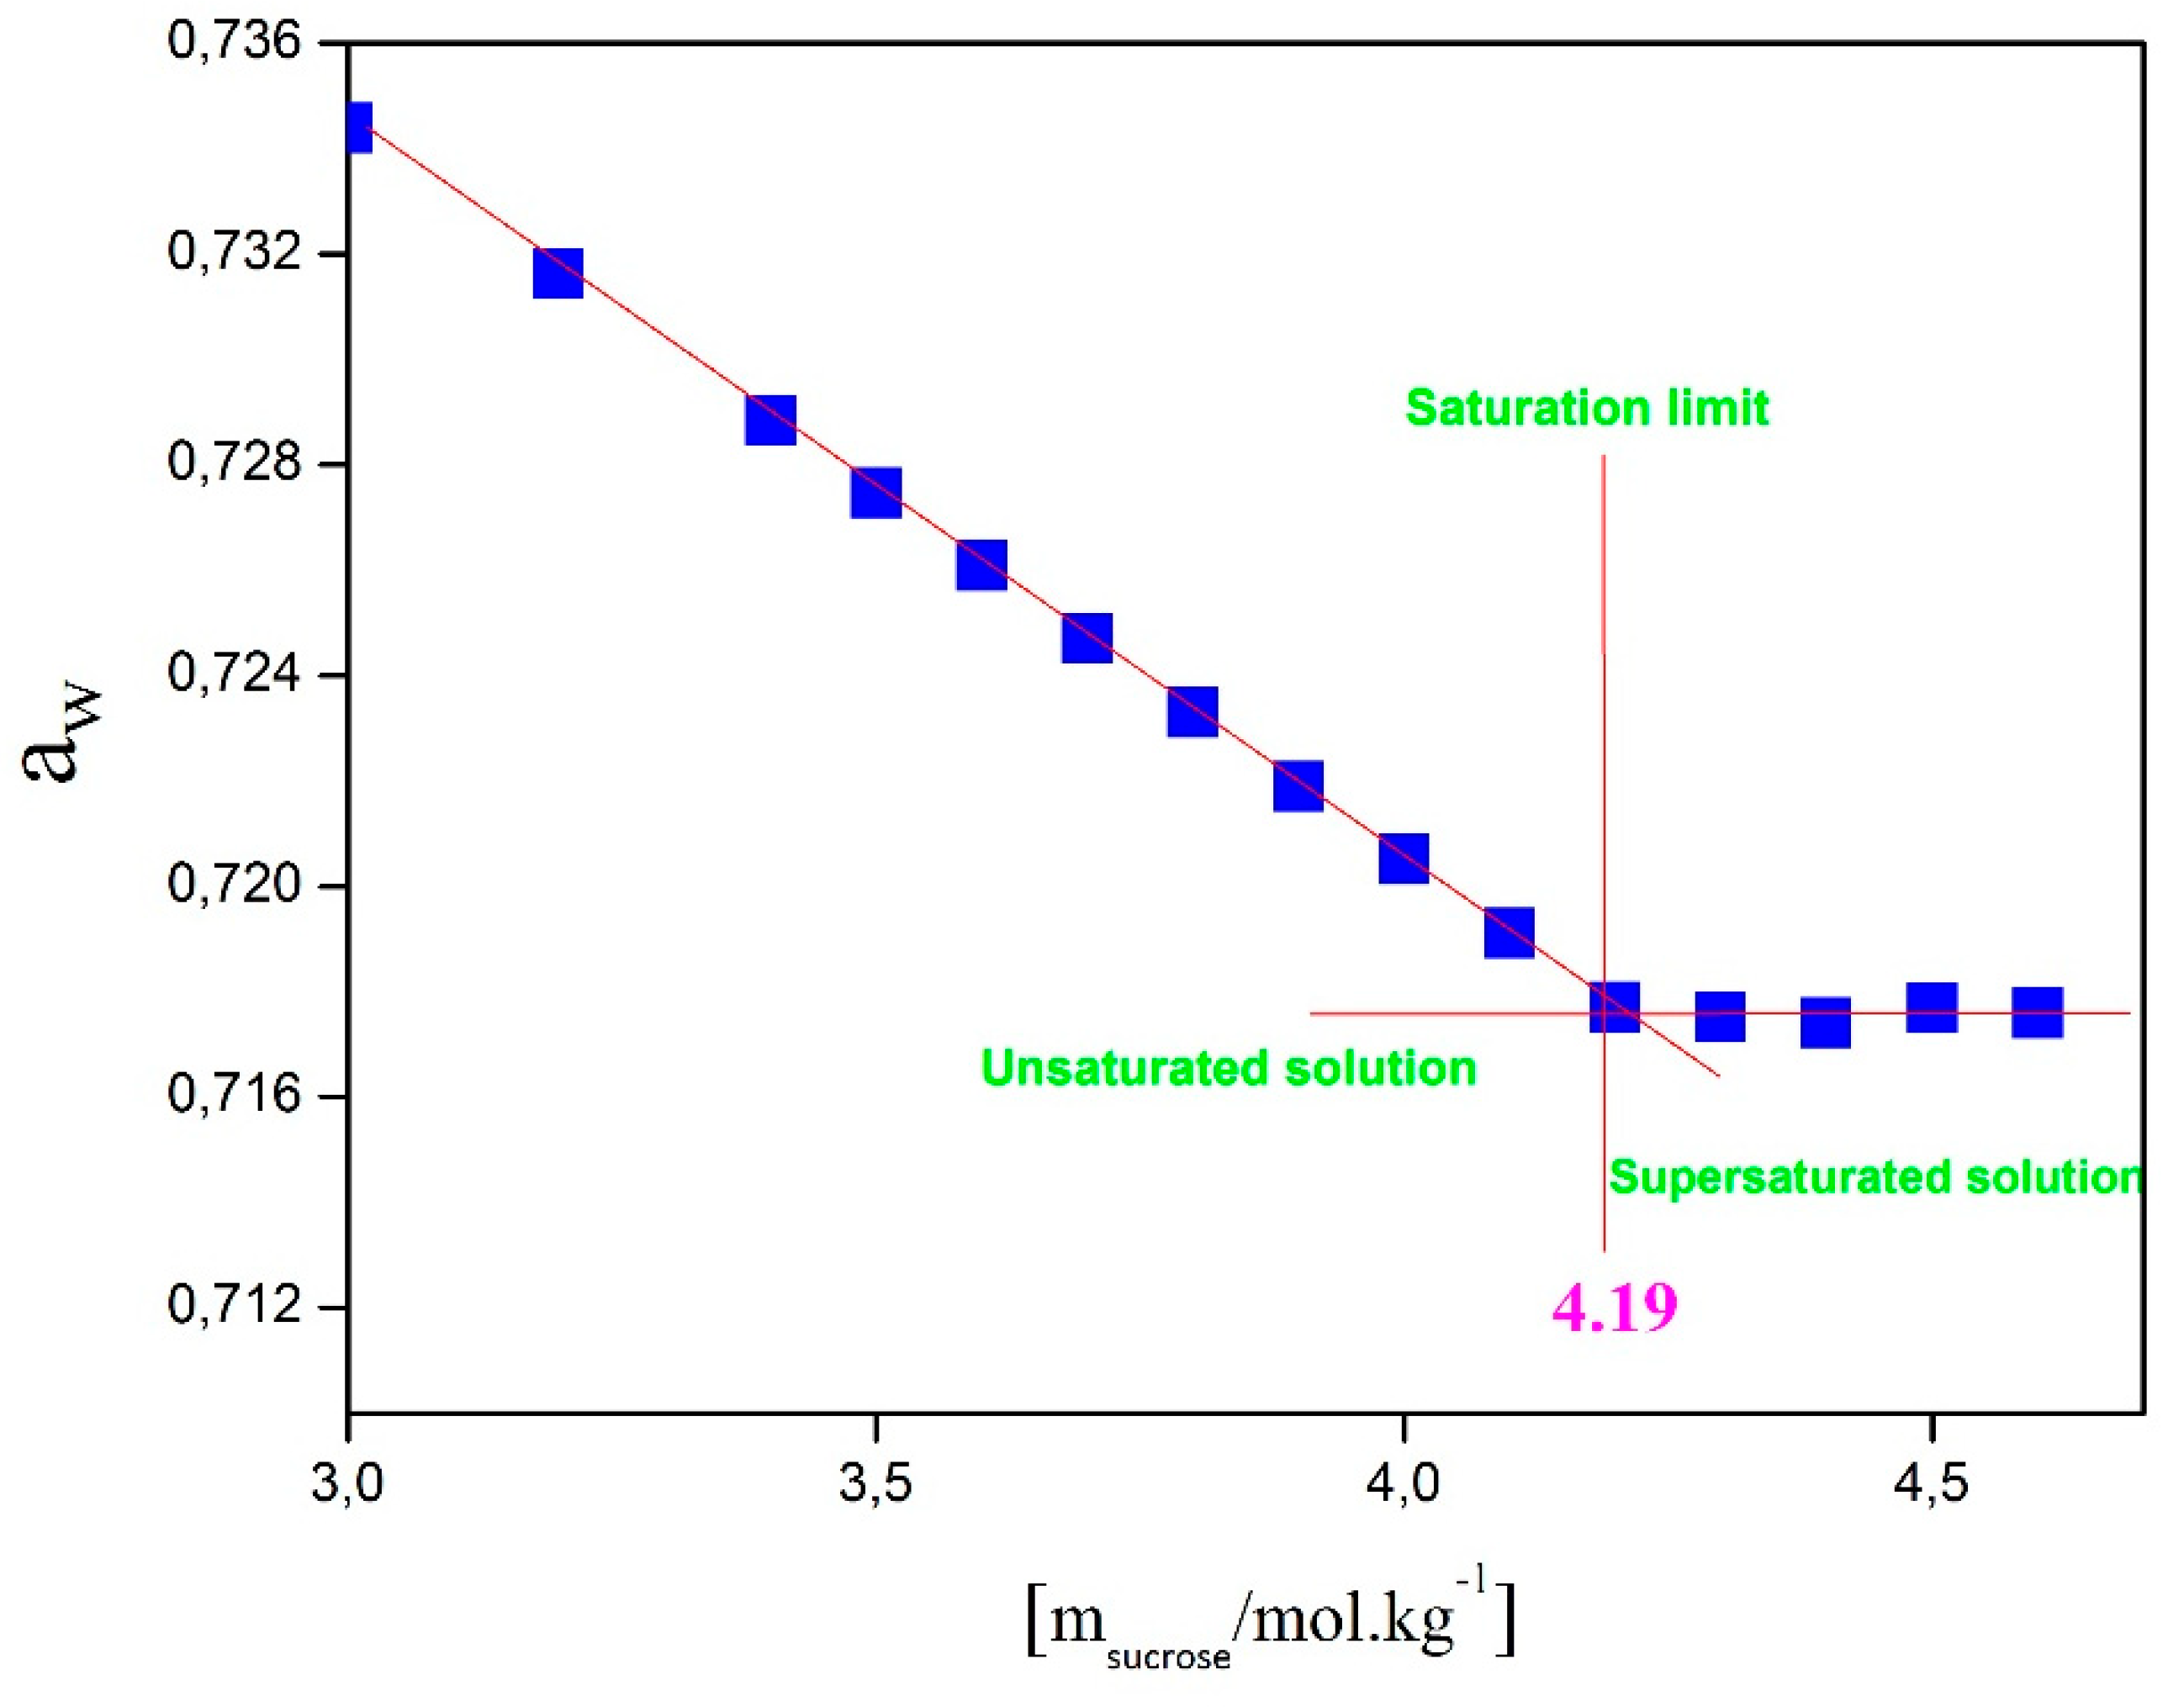
Figure 10 shows the variation of water activity in the NH₄NO₃-Sucrose-H₂O system as a function of sucrose molality, with a fixed NH₄NO₃ concentration set at 18.7 mol.kg⁻¹ and at a temperature of 25°C. In this graph, it is observed that water activity remains stable once the saturation limit is reached. The approximate value of this limit, extracted from Figure IV.8, is around 4.19 mol.kg⁻¹, corresponding to the solubility of sucrose in the aqueous solution of the NH₄NO₃-Sucrose-H₂O system containing 18.7 mol.kg⁻¹ of NH₄NO₃. The same methodology was applied to determine the solubility of sucrose at different NH₄NO₃ concentrations and the solubility of NH₄NO₃ at different sucrose concentrations (see
Figure 11).
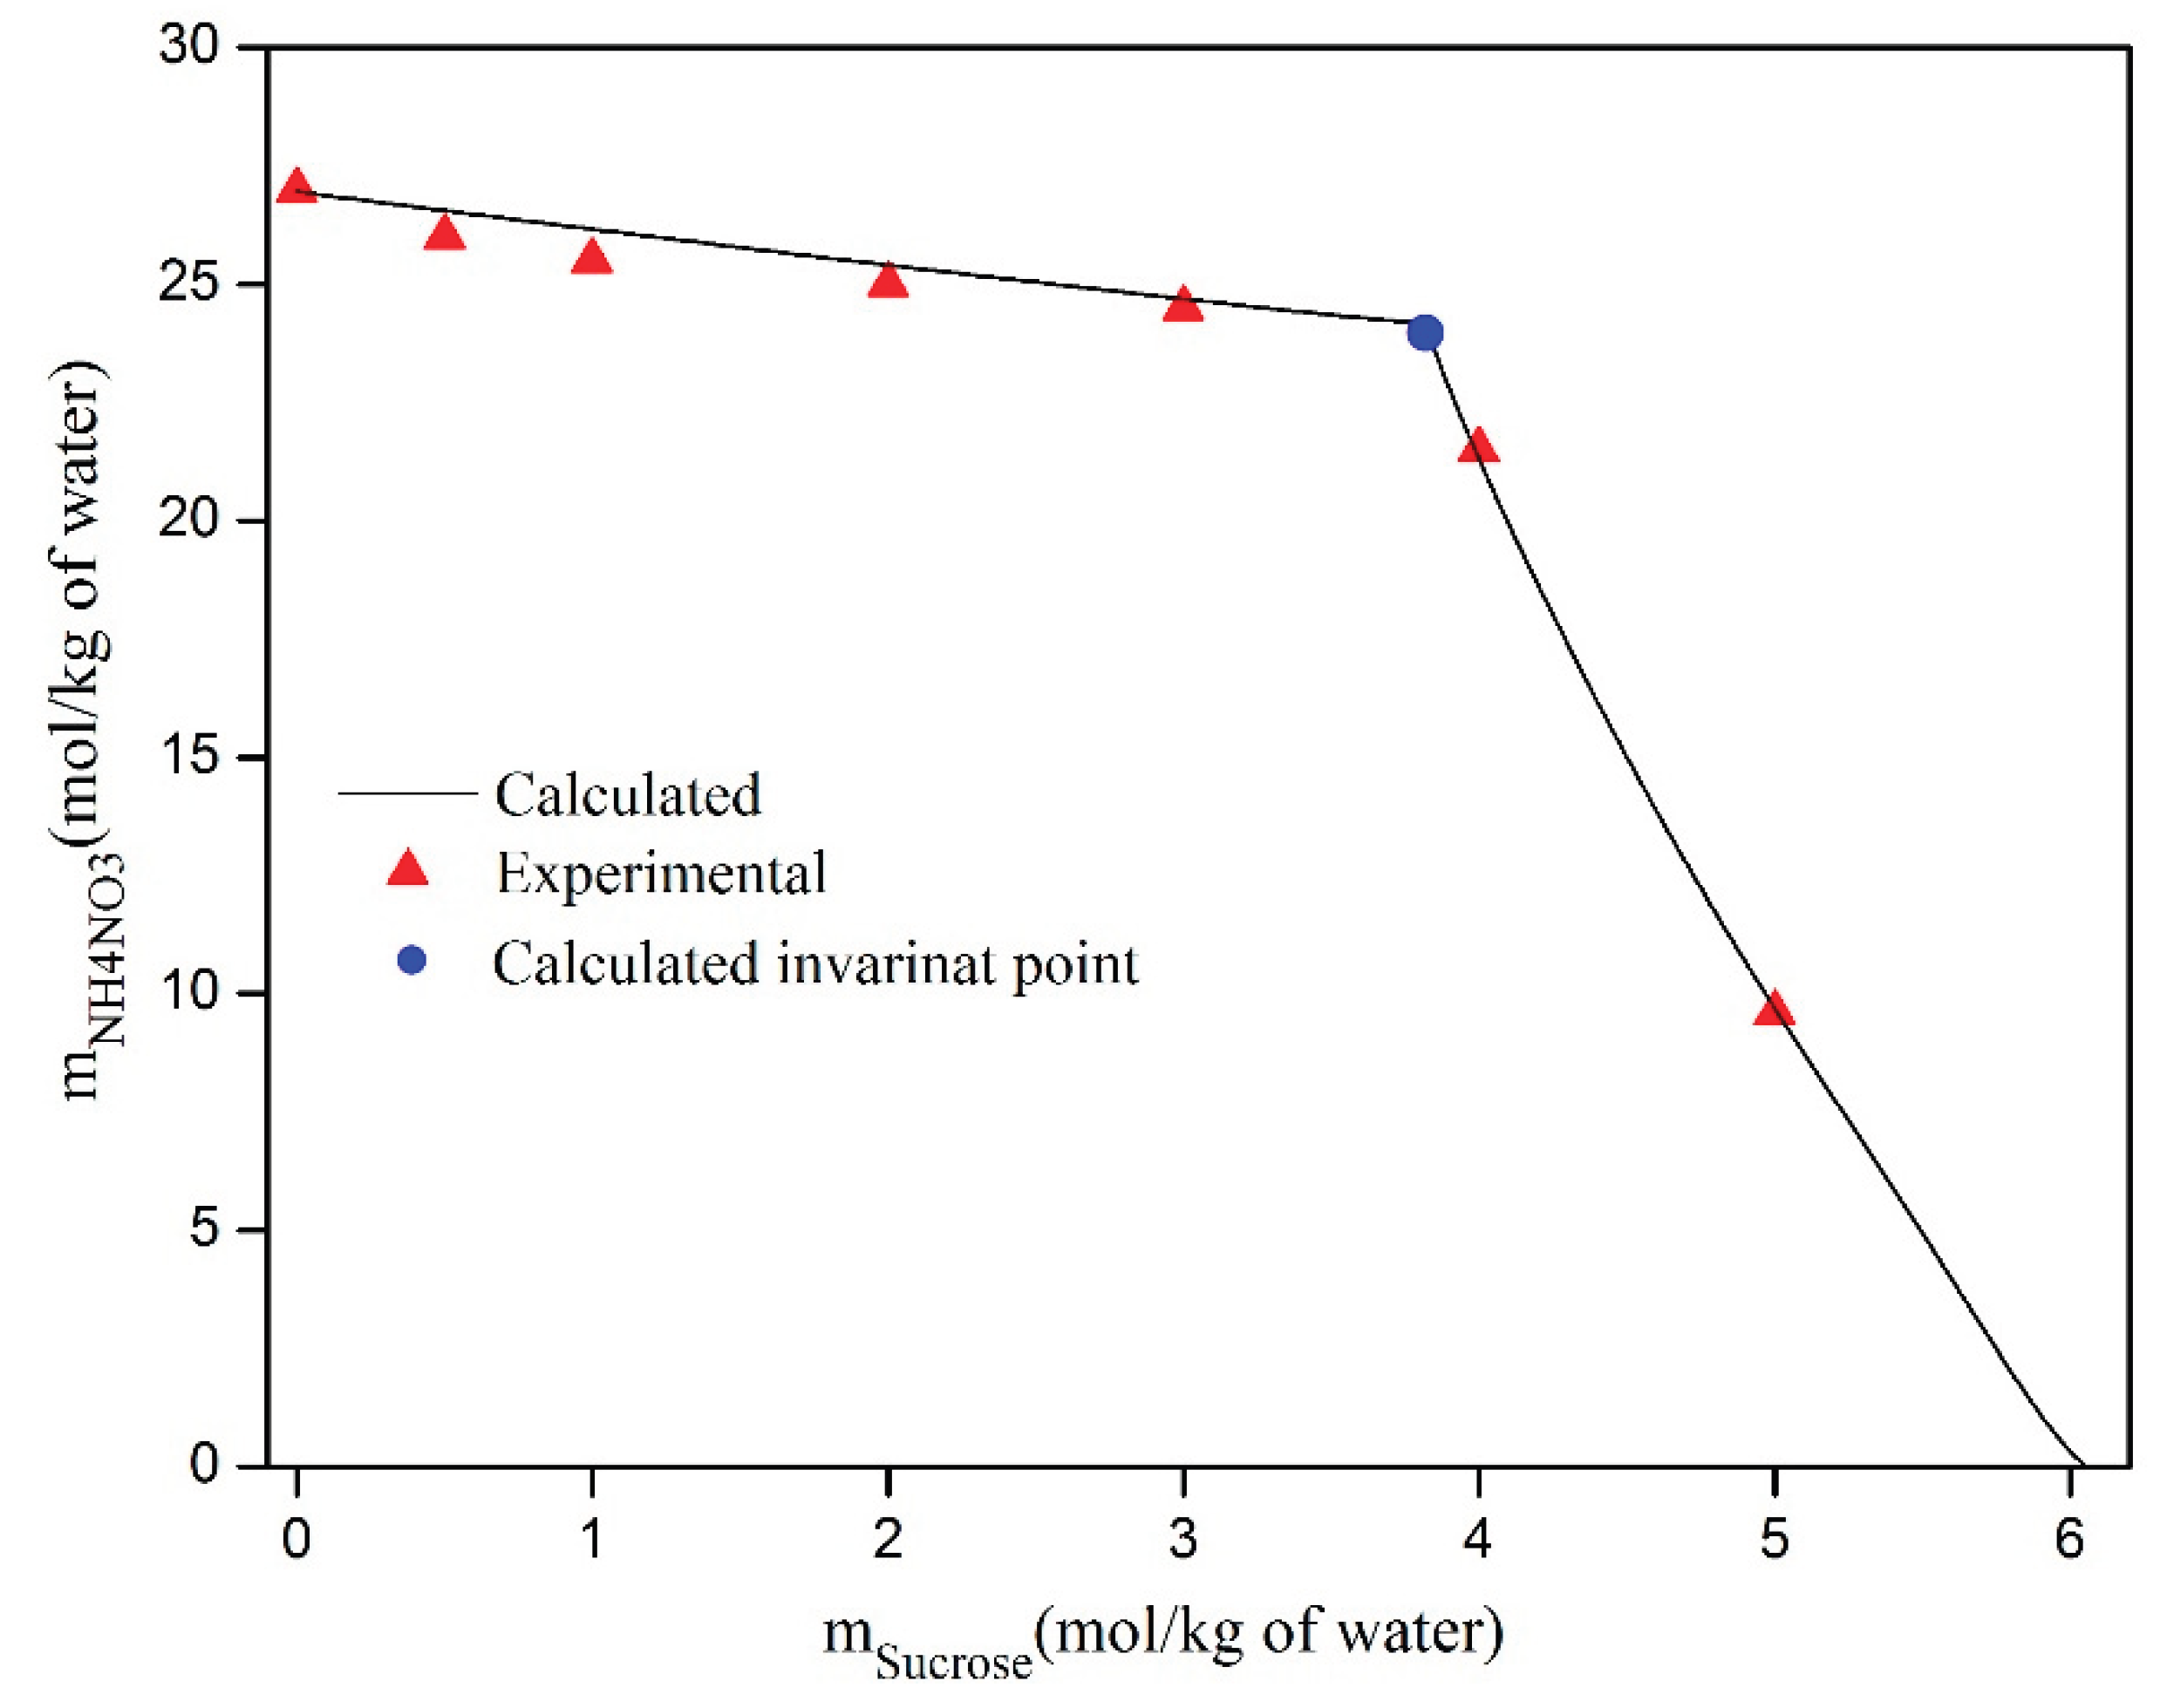
The calculated and experimental saturated aqueous solutions of mixtures of water, D-sucrose, and NH
4NO
3 at 298.15 K are presented in
Table 6 and shown in
Figure 12. This table clearly demonstrates the good agreement between the solubility measurements obtained in this study and those calculated. However,
Figure 12 reveals a significant disparity between the calculated and experimental values for the NH
4NO
3/D-sucrose/water saturated aqueous solutions at 298.15 K. The graphical determination of the inflection point can lead to a deviation in the measurement of the saturation point. From this figure, it is evident that the solubility of D-sucrose in the NH
4NO
3/D-sucrose/water system decreases slightly as the salt content increases. Similarly, the solubility of NH
4NO
3 decreases as the concentration of D-sucrose increases.
5. Conclusions
Sucrose is of considerable importance to scientific research in a variety of fields. Its importance stems from its role in biochemistry and molecular biology, where it serves as a crucial molecule for the study of carbohydrate metabolism and energy storage. In the field of plant biology and physiology, sucrose plays the role of primary transport carbohydrate, making it possible to understand the growth and development of plants and their reactions to the environment. In addition, in the field of food science and nutrition, the impact of sucrose on human health and its applications in the food industry are being studied in depth. Moreover, sucrose has applications in biotechnology and industrial processes, serving as a carbon source for microbial fermentation and contributing to the production of various valuable compounds. The unique chemical and physical properties of sucrose make it a fascinating subject of study.
The importance of sucrose in scientific research lies in its multiple roles and its potential to advance knowledge and applications in many disciplines. In this study, we are interested in the influence of the presence of an electrolyte salt on the thermodynamic properties of sucrose. NH4NO3, or ammonium nitrate, is of great importance in scientific research. It is widely used as a nitrogen fertilizer in agriculture, contributes to explosive formulations, and plays a significant role in atmospheric chemistry and air pollution.
The aim of this work is therefore to study the aqueous sucrose and ammonium nitrate electrolyte/non-electrolyte system. This ternary system was studied using the hygrometric method at a temperature of 298.15 K. Relative humidity measurements were carried out at 298.15 K to obtain water activities and osmotic coefficients for the water-sucrose/NH4NO3 system. This system was tested in a wide range of NH4NO3 molality, from 0.1 to 6 mol.kg-1, and for different sucrose contents from 0.1 to 4 mol.kg-1.
Three predictive equations for the properties of aqueous mixed electrolytes were applied to the system under investigation, and their outputs were compared with experimental water activity data. The Dinane ECA rule, the Lin et al. equation, and the Lietzke–Stoughton equation (LS II) were found to be well suited to the studied system. Overall, the predicted values showed excellent agreement with the measurements, with deviations remaining within experimental uncertainty. The obtained results were further used to determine the activity coefficients and solubilities of sucrose and ammonium nitrate in the ternary aqueous system, as well as the excess Gibbs free energy of the D-sucrose/NH4NO3mixture, using the PSC model. Complementary characterization was performed through X-ray powder diffraction and spectroscopic analyses.
Thermodynamic studies of electrolyte and non-electrolyte solutions enhance our understanding of the complex interactions between ions and water molecules. Their findings have broad implications in natural, industrial, biological, medical, water treatment, and mineral processing fields, improving our knowledge and ability to optimize a variety of processes.
List of symbols
| a |
Activity |
| Ax
|
Debye–Huckel parameter |
|
Parameter of single electrolyte |
| D |
Diameter of the drop |
| gex
|
Excess Gibbs energy per mole of particles |
| Gex
|
Excess Gibbs energy |
| hr
|
Relative humidity |
| K |
Ratio of drops |
| Ks |
Solubility product |
| M |
Molality |
| n |
Mole number |
| nr
|
Index of refraction |
| R |
Gas constant, J.mol-1.K-1
|
| T |
Absolute temperature |
| P |
Pressure |
| X |
Mole fraction |
| u(p) |
Standard uncertainty of parameter p |
| W12, U12
|
Parameters of PSC model |
|
, and
|
Short-range parameters between molecule j and salt MX |
|
and
|
Short-range ternary parameters molecule-molecule-Salt MX |
| Greek letters |
| α |
Constant |
| ρ |
Closest approach distance |
| φ |
Osmotic coefficient |
| γ |
Activity coefficient |
| σaw
|
Uncertainty of measured water activity |
| σφ
|
Uncertainty of measured osmotic coefficient |
| Subscripts |
| Calc |
Calculated |
| Exp |
Experimental |
| ref |
Reference |
| i, 1, 2 |
Indicate component |
| PSC |
Pitzer-Simonson-Clegg |
| PDH |
Pitzer-Debye-Hückel |
| Superscripts |
| Ex |
Excess |
| |
|
|
Figure 1.
Description of materials used in the hygrometric apparatus: (a) microscope, (b) lid, (c) support of the drops with the thin thread in which the droplet is pulverised, and (d) cup.
Figure 1.
Description of materials used in the hygrometric apparatus: (a) microscope, (b) lid, (c) support of the drops with the thin thread in which the droplet is pulverised, and (d) cup.
Figure 2.
Water activity versus square root of ionic strength at different modalities of D-Sucrose.
Figure 2.
Water activity versus square root of ionic strength at different modalities of D-Sucrose.
Figure 3.
Osmotic coefficient versus square root of ionic strenght at different molalities of D-Sucrose.
Figure 3.
Osmotic coefficient versus square root of ionic strenght at different molalities of D-Sucrose.
Figure 4.
Calculated of ionic mean activity coefficient of NH4NO3 versus square root of ionic strength at different molalities of D-Sucrose.
Figure 4.
Calculated of ionic mean activity coefficient of NH4NO3 versus square root of ionic strength at different molalities of D-Sucrose.
Figure 5.
Activity coefficient of D-Sucrose versus square root of ionic strength at different molalities of D-Sucrose.
Figure 5.
Activity coefficient of D-Sucrose versus square root of ionic strength at different molalities of D-Sucrose.
Figure 6.
Excess Gibbs free energies (GE).versus square root of ionic strength at different molalities of D-Sucrose.
Figure 6.
Excess Gibbs free energies (GE).versus square root of ionic strength at different molalities of D-Sucrose.
Figure 7.
Transfergibbs energy of NH4NO3 from water to water+D-Sucrose mixtures as function of molality of D-Sucrose at different molality of NH4NO3:mAN= 0.1 mol.kg-1 ∎; mAN= 0.5 mol.kg-1 •; mAN= 1.0 mol.kg-1 ▲; mAN= 2.0 mol.kg-1 ▼; mAN= 3.0 mol.kg-1 ◆; mAN= 4.0 mol.kg-1 ◄; mAN= 5.0 mol.kg-1 ►; mAN= 6.0 mol.kg-1 x.
Figure 8.
XRD pattern of the samples: (a) —sucrose crystallization in water; —sucrose crystallization in NH4NO3/water mixturesand (b) —NH4NO3crystallization in water; —NH4NO3 crystallization in sucrose/water mixtures.
Figure 8.
XRD pattern of the samples: (a) —sucrose crystallization in water; —sucrose crystallization in NH4NO3/water mixturesand (b) —NH4NO3crystallization in water; —NH4NO3 crystallization in sucrose/water mixtures.
Figure 9.
ATR-FTIR spectra of the samples: (a) —sucrose crystallization in water; —sucrose crystallization in NH4NO3/water mixturesand (b) —NH4NO3 crystallization in water; —NH4NO3 crystallization sucrose/water mixtures.
Figure 9.
ATR-FTIR spectra of the samples: (a) —sucrose crystallization in water; —sucrose crystallization in NH4NO3/water mixturesand (b) —NH4NO3 crystallization in water; —NH4NO3 crystallization sucrose/water mixtures.
Figure 10.
Saturation limit of pure solution of Sucrose(aq) at 25 °C.
Figure 10.
Saturation limit of pure solution of Sucrose(aq) at 25 °C.
Figure 11.
Saturation limit of pure solution of NH4NO3(aq) at 25 °C.
Figure 11.
Saturation limit of pure solution of NH4NO3(aq) at 25 °C.
Figure 12.
Measured and calculated saturation point of aqueoussolution of ternary system NH4NO3/D-Sucrose/H2O at 298.15 K.
Figure 12.
Measured and calculated saturation point of aqueoussolution of ternary system NH4NO3/D-Sucrose/H2O at 298.15 K.
Table 1.
Descriptions of the used Chemicals.
Table 1.
Descriptions of the used Chemicals.
| Compound |
Form |
Source |
Fraction Purity |
| NaCl |
Anhydrous |
Fluka |
≥ 0.995 |
| Sucrose |
Anhydrous |
Panreac |
≥ 0.990 |
| NH4NO3
|
Anhydrous |
Merck |
≥ 0.995 |
Table 2.
Water activities aw and osmotic coefficients φ of NH4NO3-D-Sucrose-H2O from 0.2 to 4 mol. kg-1 of D-Sucrose (mD-Sucrose, reported per 1 kg of water) in the molality range mNH4NO3 of NH4NO3 from 0.1 to 6.0 mol.kg-1 (reported per 1 kg of water) at the temperature 298.15 K and P=0.1 MPa.
Table 2.
Water activities aw and osmotic coefficients φ of NH4NO3-D-Sucrose-H2O from 0.2 to 4 mol. kg-1 of D-Sucrose (mD-Sucrose, reported per 1 kg of water) in the molality range mNH4NO3 of NH4NO3 from 0.1 to 6.0 mol.kg-1 (reported per 1 kg of water) at the temperature 298.15 K and P=0.1 MPa.
msucrose
(mol/kg of water)
|
mNH4NO3
(mol/kg of water)
|
aw
|
φ |
msucrose(mol/kg of water)
|
mNH4NO3(mol/kg of water)
|
aw
|
φ |
| 0.1 |
0.1 |
0.9949 |
0.946 |
1 |
3 |
0.9019 |
0.819 |
| 0.1 |
0.5 |
0.9829 |
0.870 |
1 |
4 |
0.8805 |
0.785 |
| 0.1 |
1 |
0.9691 |
0.830 |
1 |
5 |
0.8609 |
0.756 |
| 0.1 |
2 |
0.9438 |
0.783 |
1 |
6 |
0.8425 |
0.732 |
| 0.1 |
3 |
0.9209 |
0.750 |
2 |
0.1 |
0.9549 |
1.164 |
| 0.1 |
4 |
0.8999 |
0.723 |
2 |
0.5 |
0.9426 |
1.094 |
| 0.1 |
5 |
0.8804 |
0.700 |
2 |
1 |
0.9285 |
1.029 |
| 0.1 |
6 |
0.8622 |
0.680 |
2 |
2 |
0.9025 |
0.949 |
| 0.3 |
0.1 |
0.9912 |
0.981 |
2 |
3 |
0.8791 |
0.894 |
| 0,3 |
0.5 |
0.9791 |
0.902 |
2 |
4 |
0.8576 |
0.853 |
| 0.3 |
1 |
0.9652 |
0.855 |
2 |
5 |
0.8377 |
0.819 |
| 0.3 |
2 |
0.9398 |
0.801 |
2 |
6 |
0.8193 |
0.790 |
| 0.3 |
3 |
0.9168 |
0.765 |
3 |
0.1 |
0.9295 |
1.268 |
| 0.3 |
4 |
0.8957 |
0.737 |
3 |
0.5 |
0.9176 |
1.193 |
| 0.3 |
5 |
0.8761 |
0.713 |
3 |
1 |
0.9032 |
1.130 |
| 0.3 |
6 |
0.8578 |
0.692 |
3 |
2 |
0.8776 |
1.035 |
| 0.5 |
0.1 |
0.9873 |
1.014 |
3 |
3 |
0.8547 |
0.968 |
| 0.5 |
0.5 |
0.9752 |
0.929 |
3 |
4 |
0.8363 |
0.902 |
| 0.5 |
1 |
0.9613 |
0.876 |
3 |
5 |
0.8175 |
0.860 |
| 0.5 |
2 |
0.9358 |
0.818 |
3 |
6 |
0.8003 |
0.824 |
| 0.5 |
3 |
0.9126 |
0.781 |
4 |
0.1 |
0.9036 |
1.340 |
| 0.5 |
4 |
0.8914 |
0.751 |
4 |
0.5 |
0.8916 |
1.274 |
| 0.5 |
5 |
0.8718 |
0.725 |
4 |
1 |
0.8777 |
1.207 |
| 0.5 |
6 |
0.8536 |
0.703 |
4 |
2 |
0.8523 |
1.109 |
| 1 |
0.1 |
0.9772 |
1.067 |
4 |
3 |
0.8293 |
1.039 |
| 1 |
0.5 |
0.965 |
0.989 |
4 |
4 |
0.8084 |
0.984 |
| 1 |
1 |
0.9509 |
0.932 |
4 |
5 |
0.7889 |
0.940 |
| 1 |
2 |
0.9252 |
0.863 |
4 |
6 |
0.7708 |
0.903 |
Table 3.
Model Parameters for system NH4NO3-H2O, D-Sucrose-H2O and mixing model parameters for system NH4NO3-D-Sucrose-H2O at 298K and P=0.1 MPa.
Table 3.
Model Parameters for system NH4NO3-H2O, D-Sucrose-H2O and mixing model parameters for system NH4NO3-D-Sucrose-H2O at 298K and P=0.1 MPa.
| NH4NO3-H2O |
mmax(mol.kg-1) |
BMX
|
U1MX
|
V1MX
|
W1MX
|
SDφ*103
|
SDγ*103
|
| |
7.405 |
-9.9030 |
-0.7388 |
0.3779 |
0.2568 |
3.397a
|
1.65a
|
| Sucrose-H2O |
mmax(mol.kg-1) |
w12
|
u12
|
|
|
SDφx102
|
SDγx102
|
| |
6.00 |
-11.013 |
1.753 |
|
|
1.2124 |
2.0183 |
| NH4NO3-Sucrose-H2O |
Na
|
UNMX
|
VNMX
|
WNMX
|
Y0MNMX
|
Y1MNMX
|
SDx103
|
| |
57 |
2.306 |
0 |
-7.317 |
3.006 |
0 |
1.003 |
Table 4.
Mean activity coefficients of NH4NO3 (aq). Activity coefficients of D-Sucrose and excess Gibbs energy (J.mol-1) of NH4NO3-D-Sucrose (aq) at the temperature 298.15 K and P=0.1 MPa.
Table 4.
Mean activity coefficients of NH4NO3 (aq). Activity coefficients of D-Sucrose and excess Gibbs energy (J.mol-1) of NH4NO3-D-Sucrose (aq) at the temperature 298.15 K and P=0.1 MPa.
|
msucorse
|
mNH4NO3 |
γNH4NO3 |
γSucrose
|
GE
|
msucorse
|
mNH4NO3 |
γNH4NO3 |
γSucrose
|
GE
|
| 0.1 |
0.1 |
0.751 |
0.783 |
-0.038 |
1 |
0.1 |
0.774 |
0.927 |
0.073 |
| 0.1 |
0.5 |
0.586 |
0.662 |
-0.373 |
1 |
0.5 |
0.605 |
0.783 |
-0.224 |
| 0.1 |
1 |
0.504 |
0.620 |
-0.959 |
1 |
1 |
0.520 |
0.731 |
-0.763 |
| 0.1 |
2 |
0.419 |
0.598 |
-2.416 |
1 |
2 |
0.432 |
0.699 |
-2.128 |
| 0.1 |
3 |
0.368 |
0.601 |
-4.112 |
1 |
3 |
0.379 |
0.699 |
-3.734 |
| 0.1 |
4 |
0.332 |
0.614 |
-5.974 |
1 |
4 |
0.341 |
0.710 |
-5.510 |
| 0.1 |
5 |
0.304 |
0.633 |
-7.964 |
1 |
5 |
0.312 |
0.728 |
-7.416 |
| 0.1 |
6 |
0.281 |
0.655 |
-10.058 |
1 |
6 |
0.289 |
0.750 |
-9.429 |
| 0.3 |
0.1 |
0.756 |
0.813 |
-0.027 |
2 |
0.1 |
0.799 |
1.114 |
0.388 |
| 0.3 |
0.5 |
0.590 |
0.687 |
-0.354 |
2 |
0.5 |
0.624 |
0.939 |
0.130 |
| 0.3 |
1 |
0.508 |
0.643 |
-0.929 |
2 |
1 |
0.537 |
0.873 |
-0.360 |
| 0.3 |
2 |
0.422 |
0.619 |
-2.366 |
2 |
2 |
0.445 |
0.831 |
-1.630 |
| 0.3 |
3 |
0.371 |
0.621 |
-4.041 |
2 |
3 |
0.390 |
0.825 |
-3.143 |
| 0.3 |
4 |
0.334 |
0.634 |
-5.883 |
2 |
4 |
0.351 |
0.833 |
-4.829 |
| 0.3 |
5 |
0.306 |
0.653 |
-7.854 |
2 |
5 |
0.321 |
0.848 |
-6.648 |
| 0.3 |
6 |
0.283 |
0.675 |
-9.929 |
2 |
6 |
0.296 |
0.869 |
-8.577 |
| 0.5 |
0.1 |
0.761 |
0.844 |
-0.009 |
4 |
0.1 |
0.841 |
1.589 |
1.607 |
| 0.5 |
0.5 |
0.594 |
0.713 |
-0.327 |
4 |
0.5 |
0.658 |
1.333 |
1.418 |
| 0.5 |
1 |
0.512 |
0.667 |
-0.892 |
4 |
1 |
0.566 |
1.232 |
1.013 |
| 0.5 |
2 |
0.425 |
0.641 |
-2.307 |
4 |
2 |
0.469 |
1.157 |
-0.087 |
| 0.5 |
3 |
0.373 |
0.643 |
-3.963 |
4 |
3 |
0.411 |
1.134 |
-1.436 |
| 0.5 |
4 |
0.336 |
0.655 |
-5.785 |
4 |
4 |
0.369 |
1.132 |
-2.962 |
| 0.5 |
5 |
0.307 |
0.674 |
-7.737 |
4 |
5 |
0.336 |
1.140 |
-4.627 |
| 0.5 |
6 |
0.285 |
0.696 |
-9.795 |
4 |
6 |
0.310 |
1.156 |
-6.405 |
Table 6.
The solubility measured in the NH₄NO₃-Sucrose-H2O system at 25°C and atmospheric pressure P = 0.1 MPa.
Table 6.
The solubility measured in the NH₄NO₃-Sucrose-H2O system at 25°C and atmospheric pressure P = 0.1 MPa.
mSucrose
(mol.kg-1) |
Solubility of NH4NO3
(mol.kg-1) |
Uncertainty |
Crystalline
solid |
| 0.00 |
26.955 |
0.527 |
NH4NO3(S) |
| 2.50 |
25.040 |
0.415 |
NH4NO3(S) |
| 2.80 |
24.828 |
0.634 |
NH4NO3(S) |
| 3.10 |
24.620 |
0.293 |
NH4NO3(S) |
| 3.40 |
24.416 |
0.591 |
NH4NO3(S) |
Solubility of Sucrose
(mol.kg-1) |
mNH4NO3
(mol.kg-1) |
Uncertainty |
Crystalline
solid |
| 5.98 |
0.200 |
0.120 |
Sucrose(S) |
| 4.19 |
18.700 |
0.108 |
Sucrose(S) |
| 6.00 |
0.000 |
0.152 |
Sucrose(S) |