
Submitted:
26 August 2025
Posted:
26 August 2025
You are already at the latest version
Abstract
Avoiding highway infrastructure construction cost overruns and reducing associated claims and disputes continues to be a challenge in many countries. Research is needed in identifying notable project planning and management deficiencies that are likely to cause cost overruns. Literature sources suggest numerous potential causes of cost overrun but clustering of cause variables and relative importance of clusters has not been researched. Research reported here addresses this knowledge gap using predictive models developed with data contributed by several agencies in participating countries and suggests mitigation measures. Following a review of methods and data sources, a methodological framework is advanced that encompasses statistical methods well suited for providing a scientific basis for identifying important clusters of cost overrun variables. A questionnaire study enabled data acquisition from Canadian, United States, Middle East, and Australian sources. Starting from many variables, the principal component-supported factor analysis method identified clusters of cost overrun variables and their relative importance was inferred with developed logistic regression models. Deeper insights in causes of cost overruns obtained from this research suggest mitigation measures that are within reach of managers. The results can potentially enhance infrastructure planning and management practice including reduction of claims and disputes.
Keywords:
highway project
; cost overrun
; statistical analysis
; international data
; factor analysis
; logistic regression
; causes of cost overrun
; project planning and management
1. Introduction
Highway construction project cost estimates are developed first at the planning phase and revised when design, site, and other details become known. At the time of project completion, any deviation of the actual cost from the pre-construction budget (that usually includes the contingency component) is of much concern in project planning and management professional practice. Most transportation authorities around the world define this difference as the “cost overrun.” In the current practice, the contingency factor is intended to account for risk at the planning level as well as pre-construction cost estimates [1,2].
Projects of all sizes can cost more than the budget that commonly includes a contingency fund. In addition to adverse effect of the cost overrun phenomenon at the construction phase, the reliability of the life cycle cost estimate that supports investment decision can be compromised. For this reason, avoiding cost overrun using planning and management actions, including risk analysis of life cycle costs have become important research subjects [3,4,5,6].
The construction cost overrun is a complex problem to address within the broader subjects of project planning and construction management. Many causes can result in cost overrun. The record of claims and disputes in many countries tracked by a commercial entity provides an initial view of some issues [7,8]. But many other cost overruns that become necessary for project completion are covered without dispute.
At the current state of knowledge, there is lack of research on views of high level management (e.g., a state/provincial department of transportation) regarding notable causes of cost overrun, including those that have resulted in claims and disputes. These can potentially originate at the project planning level and materialize while construction is in progress. These are not well-researched, especially as clusters of cost overrun variables. If such issues are identified, these can be addressed prior to construction.
While studying cost overruns in local or state/provincial highway projects within a single country is useful, expanding the investigation to a broader geographic area can provide even better insights.
Treating the uncertainties in cost overrun continues to be a research challenge. In professional practice, there is general awareness of the stochastic nature of many cost overrun causes. But there is lack of information on the identification and effect of correlated stochastic causes of cost overrun. The availability of this information can lead to guidance on how to reduce their impact.
Given the above background, research reported here is intended to contribute knowledge on project planning and management actions needed to avoid cost overruns including those that may result in claims and disputes. Specifically, the objectives of research reported here are to:
- (1)
- obtain views of experienced managers on the causes of cost overrun using an international questionnaire survey,
- (2)
- find cluster of variables (i.e., commonly referred to as factors) that can be analyzed instead of many individual variables included in the questionnaire,
- (3)
- infer relative importance of factors from results of statistical methods,
- (4)
- identify causes of cost overrun that can be mitigated at the project planning stage prior to construction and while the construction is in progress, and
- (5)
- define role of risk analysis to reduce the impact of stochastic correlated cost overruns.
Figure 1 presents the methodological framework and it also serves as the roadmap for the contents of the paper.
A brief introduction to components of the framework is provided here and details are covered throughout the paper. Following the problem definition as presented in this introductory section, a literature review of methods and data sources leads to research steps to address knowledge gaps noted above. For enhancing the geographic scope of data, transportation agencies in Canada, the USA, the Middle East, and Australia were invited to share information on their cost overrun experience, including reasons for such overruns.
Given many variables included in the survey, the principal component analysis-supported factor analysis method enabled extraction of factors (i.e., clusters of variables) needed for the development of predictive logistic regression models. These probability-based models identify important causes of cost overrun.
2. Literature Review
2.1. Approaches to Curb Cost Overrun
The mission is to build or improve a highway facility according to agreed design and quality, within the specified time and budget [9,10,11]. Although the common objective is to curb highway project cost overrun, diverse approaches are reported in the literature. The following review includes academic research papers and technical reports published by government/public agencies for use as guides to reduce the likelihood of cost overrun.
As an example of a technical report, the Ministry of Transportation and Infrastructure (British Columbia) guidelines include methods for cost estimation and development of contingency estimate [1]. The contingency fund is intended to offset uncertainties and risks. Two methods are commonly applied. One is detailed item-by-item cost estimation method. The other is the historical bid-based approach which requires adjustments to be made to reflect current prices.
Approaches for developing contingency factor estimates to address common highway project-related risks that impact construction costs are described in reference [2]. The reviewed methods include simple deterministic formulas as well as complex probabilistic methods. Reference [5] reports best practices for developing cost estimates as well as guidance for overseeing and checking the process of developing such estimates. Developing and applying probabilistic cost estimates is encouraged.
An approach to reducing cost overrun, termed the Reference Class Forecasting (RCF), addresses assumed reasons for cost and schedule overrun in projects, including the tendency to produce optimistic estimates and strategic misrepresentation. If applicable, these actions can logically result in underestimation of project costs, leading to overrun. As a mitigation, this approach requires explicit, actual data-based adjustments to estimates obtained from past local projects or similar projects in other areas. In defining adjustments, unique characteristics of the project under study are considered. This method has been endorsed and used by some public agencies. The following references provide additional information [12,13,14,15,16].
The promotors of the RCF method suggest its application to preliminary estimates with the intent to address optimism bias and avoid strategic misrepresentation. Some applications have lowered cost overrun and improved time estimates. A limitation of this method is guidelines to be followed by analysts, which may not always be applicable.
2.2. Studies on Occurrence of Cost Overrun
Information on highway infrastructure cost overrun claims and disputes in many countries, reported in reference [8], implies the need for further research in cost overrun with the ultimate objective to improve project planning and management. Disputed transportation infrastructure cost cases for U.S., Canada, the Middle East, Australia, and many other countries show several causes of claims and disputes, including planning and design-related issues [8].
Many review papers relying only on literature sources identified diverse causes of cost overrun. References [17,18,19,20,21,22,23,24] serve as examples. Several research papers describe the application of cost overrun data, obtained from published sources or from public agencies, in modelling the extent of cost overrun using probability distributions. For example, reference [25] presents probability-based methods for investigation of risk in cost overrun estimates. But these studies could not obtain causes of cost overrun information from primary sources.
Some studies reported in the literature used questionnaires or group discussions to obtain cost overrun causes and data for developing linear multiple regression or other predictive models. An example is a Purdue University research project on Indiana Department of Transportation (INDOT) construction projects regarding experienced cost overrun, delays, and change orders. Also, causes for such problems were identified by this study. To compare the INDOT experience with other jurisdictions, data from other states were collected and analyzed with an array of statistical methods [26]. Other examples are presented in [27,28,29]
Several studies used the questionnaire approach to obtain data from a limited number of sources within a country. Following basic statistical analyses, linear regression models were developed to quantify cost overrun as a function of causal variables. This approach produces predictive models but has limitations in quantifying the importance of causal factors in probabilistic terms. Examples of this approach are reported in [30,31,32].
3. Need for Methodological Advances and Data Contributed by Experienced Managers
The literature review presented in Section 2.1 and Section 2.2 suggests the need for methodological advances in researching the complex highway construction cost overrun problem. Also, in order not to limit the scope of research to a part of a country or to one country, a multi-country information acquisition approach is needed. Further, due to the absence of studies based on data contributed by experienced managers who have overseen many projects, this source of knowledge is beneficial for inclusion in a research study on cost overrun.
Considering that the initial inclusion of many potentially applicable variables is necessary for a realistic scope of research, the statistical method of principal component-based factor analysis is selected for reducing many variables into a smaller number of clusters (factors) for use in further analysis without loss of information [33,34,35]. [A logical next research step is to develop probability-based predictive logistic regression models using the identified factors.
As compared to multiple linear regression modelling approach, the logistic regression models address the stochastic nature of the cost overrun phenomenon. That is, these models are better suited for inferring the importance of a factor in causing cost overrun in probabilistic terms. For the information of interested readers, studies that are not on highway cost overrun, but have applied the logistic regression tool to factor analysis outputs are reported in [36,37,38]. Further information on the logistic regression modelling, including the rationale for its use is provided in a later section of the paper.
4. International Questionnaire Survey
Tracked cost overrun claims and disputes suggest that these occur in many countries. Therefore, a study of root causes should aim to obtain detailed information from international sources [7,8]. In the planning phase of this research, the following options were considered for obtaining data.
- Crowed sourcing: construction industry members (e.g., contractors) in a country or in several countries could be asked to respond to survey questions. This could potentially result in a large database, but the necessary detailed knowledge of respondents cannot be assured.
- Agents of claims and disputes: although the transcripts provide real life information on causes, the agents are not likely to respond to questions on many potential causes of cost overrun.
- Experienced managers (e.g., executive officers in a provincial/state department of transportation) in selected countries: this option was selected for questionnaire implementation for reasons that these managers have knowledge and experience, and they are likely to participate for knowledge generation reason [7].
A questionnaire survey was identified as the most effective way to obtain data from government transportation departments, large construction company managers, and relevant institutes [39,40,41]. A detailed literature review resulted in variables/causes of cost overrun for inclusion in the questionnaire (Table 1). The variables cover applicable issues, categorized as policy, planning, regulations, design, finances, project type, construction-specific problems, qualification and experience of personnel, and many other potential causes of cost overrun. The respondent was requested to rate the causes on a 5-point Likert scale (i.e., very high, high, medium, low, and very low).
All aspects of the questionnaire study design were examined by the University Ethics Review Board. Following approval, about 150 questionnaires were forwarded to departments of transportation in Canadian provinces and USA states, professional infrastructure agencies/managers in the Middle East, and institutes in Australia. The responding organizations were requested to provide responses completed by high level experienced managers.
The survey responses (data sets) were used for factor extraction with the use of Statistical Package for Social Sciences (SPSS). The outputs of analysis enabled the development of logistic regression models. The mathematical functions used in the SPSS are not reproduced in this paper. But for explaining the theoretical basis of predictive logistic modelling approach, a limited number of equations are presented.
5. Identification of Cost Overrun Factors
Although the Likert scale-based results of the questionnaire study provided useful general information, it was decided to apply scientific methods to obtain details inherent in the database. Also, the study of stochastic characteristics of the cost overrun phenomenon necessitated the application of advanced statistical methods.
Statistical analysis of many variables requires the use of the principal component method-supported factor analysis to identify a few factors that retain the properties of the constituent larger number of variables [34,35,36]. Well-defined methodological steps shown in Figure 2 were followed for factor analysis. The rationale was that if successfully formed, these factors will enable the study of the cost overrun phenomenon captured by many variables included in the questionnaire without loss of inherent information.
5.1. Suitability of Survey Data
To check the suitability of data obtained with the use of Likert scale, the Cronbach’s Alpha (α) test of reliability was applied for this purpose [42]. Although Alpha can range from zero to one, for robust analysis a high value is necessary. For variables rated by respondents, the Cronbach’s Alpha was 0.98, which implies that the survey instrument (i.e., Likert scale) and resulting data were reliable.
5.2. Filtering Data and Adequacy Tests
Following the development of the correlation matrix, data were filtered to remove variables that showed correlation coefficient lower than 0.3 (considered to be a weak correlation) [43]. The objective was to include variables in factor analysis that correlate well with other variables. This strategy resulted in 31 variables. According to the histogram of correlation coefficients shown in Figure 3, 60% are above 0.6 and 83.7 percent exceed 0.5.
Before conducting factor analysis, the Kaiser-Meyer-Olkin (KMO) measure of sample adequacy is used to check if KMO>0.5 requirement based on Kaiser's criterion is met [44]. Table 2 shows that the KMO was 0.816, which is acceptable. Also, the Bartlett Test of Sphericity was performed to measure the strength of the relationship between variables [45]. The value of the Bartlett Test of Sphericity was 2189.718 and the associated significance level was 0.000 (P<0.05). Therefore, the data of 31 variables were suitable for factor analysis.
5.3. Factor Extraction
Although the use of the principal component analysis (PCA) to analyze 31 variables can produce many principal components (factors) (at most 31), the objective of factor analysis is to extract a smaller number of factors that can explain a very high percentage of variance [46] . The PCA transforms the correlated variables into a set of linearly uncorrelated principal components (factors) [47]. The choice of factors to retain for further analysis depends on variance explained. That is, the decision to retain the number of components is based on the cumulative percentage of variance explained.
There are two other considerations that can potentially guide the choice of factors. Kaiser’s criterion [44] suggests that factors with eigenvalues greater than 1 can be retained. Also, a scree plot of eigenvalue of factors presented later in this section, can help visualize the role of each factor. At cutoff of eigenvalue 1.0, the number of factors can be clearly seen for further analysis.
Based on the above noted theory, eigenvalues and variances are the basis for factor extraction. Table 3 shows eigenvalue and variance results that guided the factor extraction decision. The factors are arranged in descending order, based on “explained variance”. The first five factors have eigen values greater 1. These five factors account for 81.04% of total variance.
The next step in analysis was the application of the varimax rotation method to adjust the variance of each of the extracted factors. The adjustment process redistributed 81.04% of total variance over the extracted five factors. The purpose of the rotation process is to obtain a better balance of variance for the extracted factors for improved factor loads [33,36,48]. By rotating the factors, each factor can have a set of highly loaded variables. The results of the varimax rotation shown in the last two columns of Table 3 suggest that as compared to column 3 values based on initial eigen values, the percent variance explained by factors in column 5 are better balanced.
To explain the effect of rotation further, in the initial eigenvalue column, the first factor with eigenvalue of 19.70, accounted for 63.55% of the total variance for the data. The results also show that 81.04% of the total variance was attributable to the first five factors. After rotation, the first factor accounted for 18.64% of the total variance and the last factor explained 14.51% of the total variance.
A scree plot (Figure 4) was developed to illustrate the number of extracted factors. It is a graphical representation of the eigenvalue corresponding to factor numbers. As noted above, the eigenvalue of 1.0 defines the cutoff for factor retention. This illustration confirms that the first five factors should be sufficient for this research study. Therefore, these were included in the factor model, and their factor loadings were calculated.
As noted later, for improved interpretation, Factors 2, 3 and 4 were combined. In accordance with theory, the extracted factors have loadings on the cost overrun variable greater than 0.5.
5.4. Interpretation of Factors
From the rotated factor matrix, Factor 1 cluster consists of eight variables (Table 4). Figure 5 illustrates the categories of these variables defined in Table 1. As previously noted, Factor 1 accounts for 18.64% of the total variance. The relative impact of this factor on the cost overrun is examined later in the logistic regression model.
Table 5 presents information on Factors 2-4. The percent variance accounted by Factors 2-4 are 18.02%, 15.10%, and 14.77%, respectively. The total variance explained by combination of these factors is 47.89%. These are combined into one factor for further analysis because their constituent variables cluster well as shown in Figure 6. Most variables are categorized into design, construction, scheduling, estimation/budget, financial, and experience issues. Some of these causes of cost overrun, namely those that relate with deficient planning and design, have been reported in transcripts of claims and disputes [8].
As noted in Table 6, Factor 5 consisting of four variables, explains 14.51% of the total variance. Figure 7 illustrates these categories of cost overrun causes.
A summary of factor analysis results presented in Table 7 suggests that although as expected, diverse causes of cost overruns are identified by the statistical method, a few themes are becoming noticeable. These mainly relate to planning, design, qualifications, experience, and site management issues. As noted previously, at this stage of analysis, the relative importance (i.e., impact) of these factors on cost overrun could not be inferred. The results of logistic predictive models described next provided an answer to this question.
6. Probability-Based Logistic Regression Modelling
6.1. Methodological Components
The model is structured as follows.
Where
P = is the probability of cost overrun occurring (termed the dependent variable).
= Model constant.
= are coefficients.
= are explanatory factors -- cluster of variables obtained from factor analysis.
In logistic regression modelling, the maximum likelihood method is used to estimate the probability of cost overrun P, model constant B0, and coefficients (B1, B2,..) for the explanatory variables (X1, X2,…). The odds ratio is calculated to infer the strength of the effect of explanatory factors (cluster of variables) on P in terms of the likelihood of the occurrence of cost overrun.
The logistic regression model dependent variable P is coded in terms of the odds of an event occurring. The methodology uses the ratio of the probability that it will occur to the probability that it will not occur. If the odds ratio is greater than one (i.e., odds >1), it indicates that an explanatory factor (cluster of variables) is likely to cause a cost overrun and value of less than one (i.e., odds <1) indicates no effect.
When modeling a binary value, it is necessary to measure the fit of the model to the observed data [48]. The Pseudo R-Square measures the proportion of explained variance in the regression model. There are two types of R-Square in logistic regression analysis. These are Nagelkerke & Cox and Snell [48,50,51,52].
Smith and McKenna [51] noted other commonly used pseudo-R-Square indices (i.e., McFadden’s index, Cox-Snell index with or without Nagelkerke). The Nagelkerke R-Square is the most used statistic when interpreting the logistic regression model and the Cox and Snell R-Square only provides an approximate value of variance. According to Campbell [53], both the Nagelkerke and Cox and Snell R-Square values can be interpreted similarly; hence, the higher the R-Square value, the better the model fit.
The Cox and Snell’s R-Square is calculated using the following equation:
Where:
N: the sample size
LL: Log-likelihood
The Nagelkerke R-Square is calculated as follows:
The Log-likelihood (LL) can be used to assess the significance of the logistic regression model. The smaller the value of the log-likelihood, the better the fit of the model. A large value of the log-likelihood indicates poorly fitting models. Sometimes the log-likelihood is referred to as (−2LL).
Chi-square, another goodness of fit test measures the significance of the model. In SPSS software, the Chi-square model is labeled as the "Omnibus Test of model Coefficients". The chi-square measure is sometimes called the traditional fit measure. A significance value of less than (0.05) indicates that the model fits well.
6.2. Logistic Regression Model Results
Logistic regression models were developed using factors obtained from factor analysis. The process of calibrating the logistic regression models enabled adding factors one by one as explanatory factors. This step resulted in the estimate of their respective unique contribution to cost overrun. Statistics were compiled on odds ratio, log-likelihood, Pseudo R-Square, and chi-square values.
Results based on Factor 1, shown in Table 8, indicate an odds ratio of less than one. This result implies that the cost overrun is not occurring due to the inclusion of this factor in the regression model. Other results (i.e., the log-likelihood of 72.391, a very small chi-square of 0.155, non-significant at 0.693 (P>0.05)) indicate that the model does not fit well. Therefore, it can be inferred that Factor 1 does not seem to have any significant effect on cost overrun. We proceed with the next model by adding another factor.
The results of adding the Combined Factor (i.e., combination of Factors 2-4) to the regression model are shown in Table 9. The results also show that the Combined Factor has an odds ratio greater than one, indicating that the addition of the Combined Factor into the model increased the probability of the cost overrun occurring. This model is significant at 0.000 (P<0.05). The Log-likelihood decreased from 72.391 to 53.664, and the chi-square increased from 0.155 to 18.882, indicating that the model fitted well and was a significant improvement over the previous model (based only on Factor 1).
Moreover, the model accounts for between 30% and 40.2% of the variance (Cox and Snell R-Square and the Nagelkerke R-square), indicating a moderate to a good association between the explanatory factors and the dependent variable.
The next step in logistic regression modelling was to add Factor 5. The results are presented in Table 10. The overall test of this model was significant at (P< 0.05), indicating a good fit of the model. However, the odds of Factor 1 and Factor 5 show no effect on cost overrun and the odds of the Combined Factor continues to show an impact on the cost overrun variable.
The -2LL ratio decreased from 53.664 to 52.674, and the chi-square increased from 18.882 to 19.872. The Nagelkerke R-squared of this model was 41.9%, while the Cox and Snell R-squared was 31.3%. The model fit metrics and the R-square metric are quite like the previous model (shown in Table 9). Thus, this model shows a weak improvement.
7. Discussion
Literature sources supplemented by claims and disputes information are suitable for the identification of potential causes of cost overrun. Data contributed by experienced managers in selected countries reflect their detailed knowledge of conditions that may cause cost overrun. Although there are challenges in obtaining sensitive data on cost overrun experience in a country, this research study received the number of responses required for statistical analyses. The selected statistical methods are well suited for data analysis, and their output can potentially lead to improved project planning and management practices that are likely to avoid cost overruns.
The principle component-based factor analysis of questionnaire data resulted in a small number of factors for further study in the predictive logistic regression models that quantify their probable effect on cost overrun. Within each factor, the effect of a variable on the factor can be inferred from “factor loading”. The relative effect of a factor on cost overrun cannot be inferred using factor analysis results alone. This is the reason why the predictive regression model study was included in the research methodology.
The success of logistic regression model calibration was confirmed by log-likelihood, Pseudo R-square, and Chi-square statistics. The odds ratios served as an indicator of the strength of factors on occurrence of cost overrun. Given that all tests were satisfactory, the results can be used with confidence.
From the results of logistic regression models noted in Table 10 (i.e., the odds ratio), the following relative position of factors in contributing to cost overrun is inferred: (1) the Combined Factor (combination of Factors 2,3, and 4). (2) Factor 1. (3) Factor 5.
These results are consistent with “percent variance explained” by factors shown in Table 7. Figure 6 illustrates the category of variables included in the Combined Factor and Table 7 provides summary comments on constituent variables.
The variables that form the Combined Factor cluster fall into the following cost overrun-causing categories:
- Eight variables out of 19 fall in the category of design, issues arising during construction, and scheduling construction. Examples are complexity and scope, design changes during construction, type of contract, design errors, re-work due to construction errors, delay by subcontractor, changes by owner on the completion of the project, and acceleration to maintain schedule.
- Three variables out of 19 are in the estimation/budget and financial category. These are lack of expertise in setting budget, procurement issues, and absence of a detailed estimate plan.
- Three variables are in the category of lack of experience, quality assurance & quality control, and overly high expectations.
- Two variables are in the permits and approvals category. These are delays and approvals of shop drawings & installation procedures and issuing building permit to the construction contractor.
- Two variables are on site condition/environment (i.e., accidents due to poor site safety, poor site management).
- One variable on deal termination due to changes in law, government policy, or protocols.
Notable causes of cost overrun that appear in other factors (i.e., Factors 1 & 5) include estimation/budget, finances, delays in sending drawings to site, unnecessary practices, policy and regulatory issues, materials & equipment, and shortage of skilled labour.
The above described results of this research are consistent with claims and disputes transcripts regarding road and highway projects. A summary of frequently reported claims and disputes suggests the following notable issues: design was incomplete, design was incorrect, changes in scope, physical conditions were unforeseen, workman deficiencies, design information was issued late, contract management and/or administration failure [8].
Several identified causes of cost overrun can be avoided or mitigated at the project planning and design stage prior to construction. Also, project planners and designers can assist in mitigating cost overrun causes that occur while the construction is in progress. The stochastic characteristics of many cost overrun causes that are noticeable throughout this paper call for risk analysis to reduce the impact of uncertainties. The application of probability-based logistic regression model contributes to the objective of risk minimization. Additional information on risk analysis methods can be sourced from [3,5,6,54,55].
While viewing results, the reader is advised that this research paper cannot identify specific geographic and jurisdictional locations of international contributors of data due to the participation agreement. The rationale for this aspect of the survey design was for the benefit of global technical audience interested in knowing international experience in causes of cost overrun.
8. Conclusions
The methodological framework and the constituent methods worked well in achieving the research objectives. The comprehensive questionnaire survey produced sufficient data for analyses and model calibration. The factor analysis approach supported by the principal component analysis method enabled the extraction of a small number of well-defined factors from many variables for interpretation without loss of information. The extracted factors resulted in a statistically acceptable predictive probability-based logistic regression model used for assessing the effect of identified factors in causing cost overrun.
Based on their experience and context of their practice, the international respondents have contributed information on several important causes of cost overrun. As expected, these causes do not cluster around just a few issue areas. The implication is that many causes noted in the paper should be monitored for avoiding cost overruns.
The results of this research can be used to define measures for reducing the occurrence of cost overrun and avoiding claims and disputes. A high proportion of causes of cost overrun identified in this research relate to pre-construction activities and those that can be avoided while the construction is taking place. Most of these can be addressed by project planners and construction managers. Also, with knowledge of risk management methods, adverse effects can be minimized.
Author Contributions
Authors worked jointly in preparing this paper and they have read and approved the manuscript.
Funding
Financial support from the Natural Sciences and Engineering Research Council of Canada (NSERC) is acknowledged by the co-author.
Data Availability
Data are included in the paper.
Disclosure statement
No potential conflict of interest is reported by authors.
References
- Ministry of Transportation and Infrastructure of British Columbia. Project Cost Estimating Guidelines. Revised Report .Victoria, B.C., Canada. December 2020.
- National Cooperative Highway Infrastructure Research Program (NCHRP). Contingency Factors to Account for Risk in Early Construction Cost Estimates for Transportation Infrastructure Projects. Report 1025. National Academies of Sciences, Engineering, and Medicine. 2022. Washington, DC: The National Academies Press. [CrossRef]
- World Bank Institute (WBI). Economic analysis of investment operations, analytical tools and practical applications. WBI Development Studies, authored by Belli, P.; Anderson, J.R.; Barhum; J.N.,Dixon; J.A., Tan, J-P. 2001.
- National Academies of Sciences, Engineering, and Medicine. Life-Cycle Cost Analysis for Management of Highway Assets. Washington, DC: The National Academies Press. 2016. [CrossRef]
- Federal Highway Administration (FHWA) USA. Assessment of Federal Highway Administration Highway Project Cost Estimation Tools FHWA-HRT-22-075 July. 2022a.
- Federal Highway Administration (FHWA). Life-Cycle Cost Analysis Primer. Office of Asset Management. Washington, D.C. 2022b.
- Abdelsayed, M.; Moffat, R. Design on better outcomes, getting to the crux of time and cost overruns on capital projects. ReNew Canada, September/October 2023, pp.28-31.
- HKA Global Limited. Forewarned is forearmed. HKA Crux Insight. Sixth Annual Report. A regional and sector analysis of claims and disputes causation. 2023. HKA.com. CRUX@hka.com.
- Chitkara, K.K. Construction Project Management: Planning, Scheduling, and Controlling, 2nd Edition, McGraw Hills. 2011.
- Ministry of Transportation and Infrastructure of British Columbia. Project Cost Estimating Guidelines. 2013. Victoria, B.C., Canada.
- Cantarelli, C.C.; Chorus, C.G.; Cunningham, S.W. Explaining cost overruns of large-scale transportation infrastructure projects using a signaling game. Transportmetrica A Transp Sci. 2013. 9(3):239–258.
- Transport Infrastructure Ireland (nd). Reference Class Forecasting Guidelines for use in connection with National Roads Projects. Michael Nolan, CEO, Transport Infrastructure Ireland.
- Flyvbjerg, B. Curbing optimism bias and strategic misrepresentation in planning: Reference class forecasting in practice. European Planning Studies, 2008, 16: 3-21.
- Terrill, M. Cost Overruns in Transport Infrastructure. Grattan Institute Report No. 2016-13. 2016.
- Park, J. E. Curbing cost overruns in infrastructure investment: Has reference class forecasting delivered its promised success? European Journal of Transport and Infrastructure Research, 21(2), 2021, 120–136. [CrossRef]
- Gabel, M.; Sujka, M.; Davis, Z.W.; Keizur, A.E. Performance of Risk-Based Estimating for Capital Projects. 2021. Transportation Research Record: Journal of the Transportation Research Board. Volume 2677, Issue 1. [CrossRef]
- Al-Bahar, J. F.; Crandall, K. C. Systematic risk management approach for construction projects. J. Constr. Eng. Manage., 1990, 116(3), 533–546.
- Akinci, B.; Fischer, M. Factors affecting contractors’ risk of cost overburden. J. Manage. Eng., 1998, 14(1), 67–76.
- Cantarelli, C.C.; Flyvbjerg, B.; Molin, E.J.E.; van Wee, B. Cost overruns in large-scale transportation infrastructure projects: explanations and their theoretical embeddedness. European Journal of Transport and Infrastructure Research. 10(1): 5-18. 2010. Link to published article: http://www.sjtrir.tbm.tudelft.nl/issues/2010_01.
- Flyvbjerg, B.; Skamris Holm, M.; Buhl, S.L. What causes cost overrun in transport infrastructure projects. Transport Reviews, Volume 24, 2004 – Issue 1. 2011.
- Sharma, S.; Goyal, P.K. Cost overrun factors and project cost risk assessment in construction industry - a state of the art review. International Journal of Civil Engineering (IJCE)ISSN(P): 2278-9987; ISSN(E): 2278-9995Vol. 3, Issue 3, May 2014, 139-154© IASET.
- Ahiaga-Dagbui, D.; Love, P.; Smith, S.; Ackerman, F. Toward a systematic view to cost overrun causation in infrastructure projects: a review and implications for research. Project Management Journal, vol.48, no.2, pp.88-98. 2017.
- Herrera, R.F.; Sánchez, O.; Castañeda, K.; Porras, H. Cost Overrun Causative Factors in Road Infrastructure Projects: A Frequency and Importance Analysis. Appl. Sci. 2020, 10(16), 5506. [CrossRef]
- Ahmadi, I.A. Towards methodological adventure in cost overrun research: linking process and product. International Journal of Construction Management, Volume 23, 2023 – Issue 3.
- Berechman, J.; Chen, L. Incorporating Risk of Cost Overruns into Transportation Capital Projects Decision-Making. Journal of Transport Economics and Policy, Volume 45, Part 1, January 2011, pp. 83–104.
- Bordat, C.; McCullouch, B.G.; Labi, S.; Sinha, C. (2004). An Analysis of Cost Overruns and Time Delays of INDOT Projects. Joint Transportation Research Program, Purdue University, Prepared in cooperation with the Indiana Department of Transportation and Federal Highway Administration/IN/JTRP-2004/7. 2004.
- Daundkar, S.T.; Thakur, S.; Awad, S. Analysis of Construction Project Cost Overrun by Statistical Method. International Journal for Research in Applied Science & Engineering Technology (IJRASET) ISSN: 2321-9653. 2022.
- Sohu, S.; Halid, A.; Nagapan, S.; Fattah, A.; Latif, I.; Ullah, K. Causative factors of cost overrun in highway projects of Sindh province of Pakistan. GCoMSE2017 IOP Publishing IOP Conf. Series: Materials Science and Engineering 271 (2017) 012036 . [CrossRef]
- Kurniawan, D.; Mairizal, M.; Sam, A.M.; Abd Majid, M.Z. Critical Risk Factor Affecting Cost Overrun in Highway Project of West Sumatera. ICONCEES-2021, IOP Conf. Series: Earth and Environmental Science 1022 (2022) 012013, IOP Publishing, . [CrossRef]
- Creedy, G.D. Risk factors leading to cost overrun in delivery of highway construction projects. Ph.D. thesis. Queensland University of Technology. 2006.
- Creedy, G.D.; Skitmore, M.; Wong J.K.W. Evaluation of risk factors leading to cost overruns in the delivery of highway projects. J Constr Eng Manage. 136(5):528–537. 2010.
- Trost, S.M.; Oberlender, G.D. Predicting the accuracy of early cost estimates using factor analysis and multivariate regression. J. Constr Eng Manage. 129 (2):198–204. 2003.
- Field, A. Discovering statistics using SPSS (3rd edn). Sage Publications Ltd., London. 2009. [CrossRef]
- Hair, J. F.; Black, W. C.; Babin, B.J.; Anderson, R.E.; & Tatham, R. L. Multivariate Data Analysis (5th ed.). Vol. 5, No. 3, pp. 207-219. Upper Saddle River, NJ: Prentice-hall. 1998.
- Blaikie, N. Analyzing Quantitative Data from Description to Explanation. Sage. 2003. [CrossRef]
- Syed, S. I.; Khan, A. M. Factor Analysis for the Study of Determinants of Public Transit Ridership. Journal of Public Transportation, 3(3), 1–17. 2001. [CrossRef]
- Trudelle, R. C. Using Multiple and Logistic Regression to Estimate the Median Will-Cost and Probability of Cost and Schedule Overrun for Program Managers. Theses and Dissertations. 784. 2017. https://scholar.afit.edu/etd/784.
- White, E. D.; Sipple, V. P.; Greiner, M. A. Using logistic and multiple regression to estimate engineering cost risk, Journal of Cost Analysis and Management, 6(1), 67–79. 2004. [CrossRef]
- Gilbert, N. Researching Social Life (3rd ed.). London: Sage Publications Ltd. 2008.
- Sekaran, U.; Bougie, R. Research methods for business: A skill building approach. Long Range Planning, 26(2), 136. 2003. [CrossRef]
- Bryman A. Research methods and organization studies: contemporary social research. New York: Uwin Hyman Ltd. 1989.
- Cronbach, L.J. Coefficient alpha and the internal structure of tests. Psychometrika. 16 (3). Springer Science and Business Media LLC: 297–334. 1951. [CrossRef]
- Tabachnick, B.G.; Fidell, L.S. Using Multivariate Statistics. In Boston: Pearson Allyn and Bacon. 2007. [CrossRef]
- Kaiser, H. F. An index of factorial simplicity. Psychometrika, 39(1), 31–36.1974. [CrossRef]
- Mason, R.L.; Gunst, R.F.; Hess, J.L. Statistical Design and Analysis of Experiments: With Applications to Engineering and Science, 2nd Edition, Wiley on-line, February 2003. ISBN: 978-0-471-37216-5.
- Kim, J-O.; Mueller, C. Introduction to Factor Analysis. 2011. [CrossRef]
- Jolliffe, I.T.; Cadima, J. Principal component analysis: a review and recent developments. Philosophical Transactions of the Royal Society A: Mathematical, Physical and Engineering Sciences. 374 (2065): 20150202. 2016.
- Costello, A. B.; Osborne, J. W. Best Practices in Exploratory Factor Analysis: four recommendations for getting the most from your analysis. Practical Assessment, Research, and Evaluation, 10(1), 1–7. 2011. [CrossRef]
- Bangdiwala, S. I. Regression: binary logistic. International Journal of Injury Control and Safety Promotion, 25(3), 336–338.2018. [CrossRef]
- Hahs-Vaughn, D.L.; Lomax, R. G. (2013). An Introduction to Statistical Concepts. 2013. [CrossRef]
- Smith, T. J.; McKenna, C.M.A comparison of logistic regression pseudo R2 indices. Multiple Linear Regression Viewpoints, 39(2), 17–26. 2013. Retrieved from file:///C:/Users/Nga/Downloads/Smith_v39n2.pdf.
- Stevens, J.P. Applied Multivariate Statistics for The Social Sciences. 2012. [CrossRef]
- Campbell, M.J. Statistics at Square Two: Understanding Modern Statistical Applications in Medicine. 2008. [CrossRef]
- Alfasi, B.A. Modelling Risk in Highway Infrastructure Investments: Decision-Theoretic, Bayesian, and Factor Analysis Approaches. Doctor of Philosophy in Civil Engineering. Department of Civil and Environmental Engineering, Carleton University, Ottawa, Ontario. 2021. alfasi-modellingriskinhighwayinfrastructureinvestments.pdf.
- Alfasi, B.A.; Khan, A.M. Value of Bayesian Pre-Posterior Information for Enhancing Life-Cycle Cost Analysis of Highway Investments. CivilEng 2025, 6, 25. [CrossRef]
Figure 1.
Methodological framework.
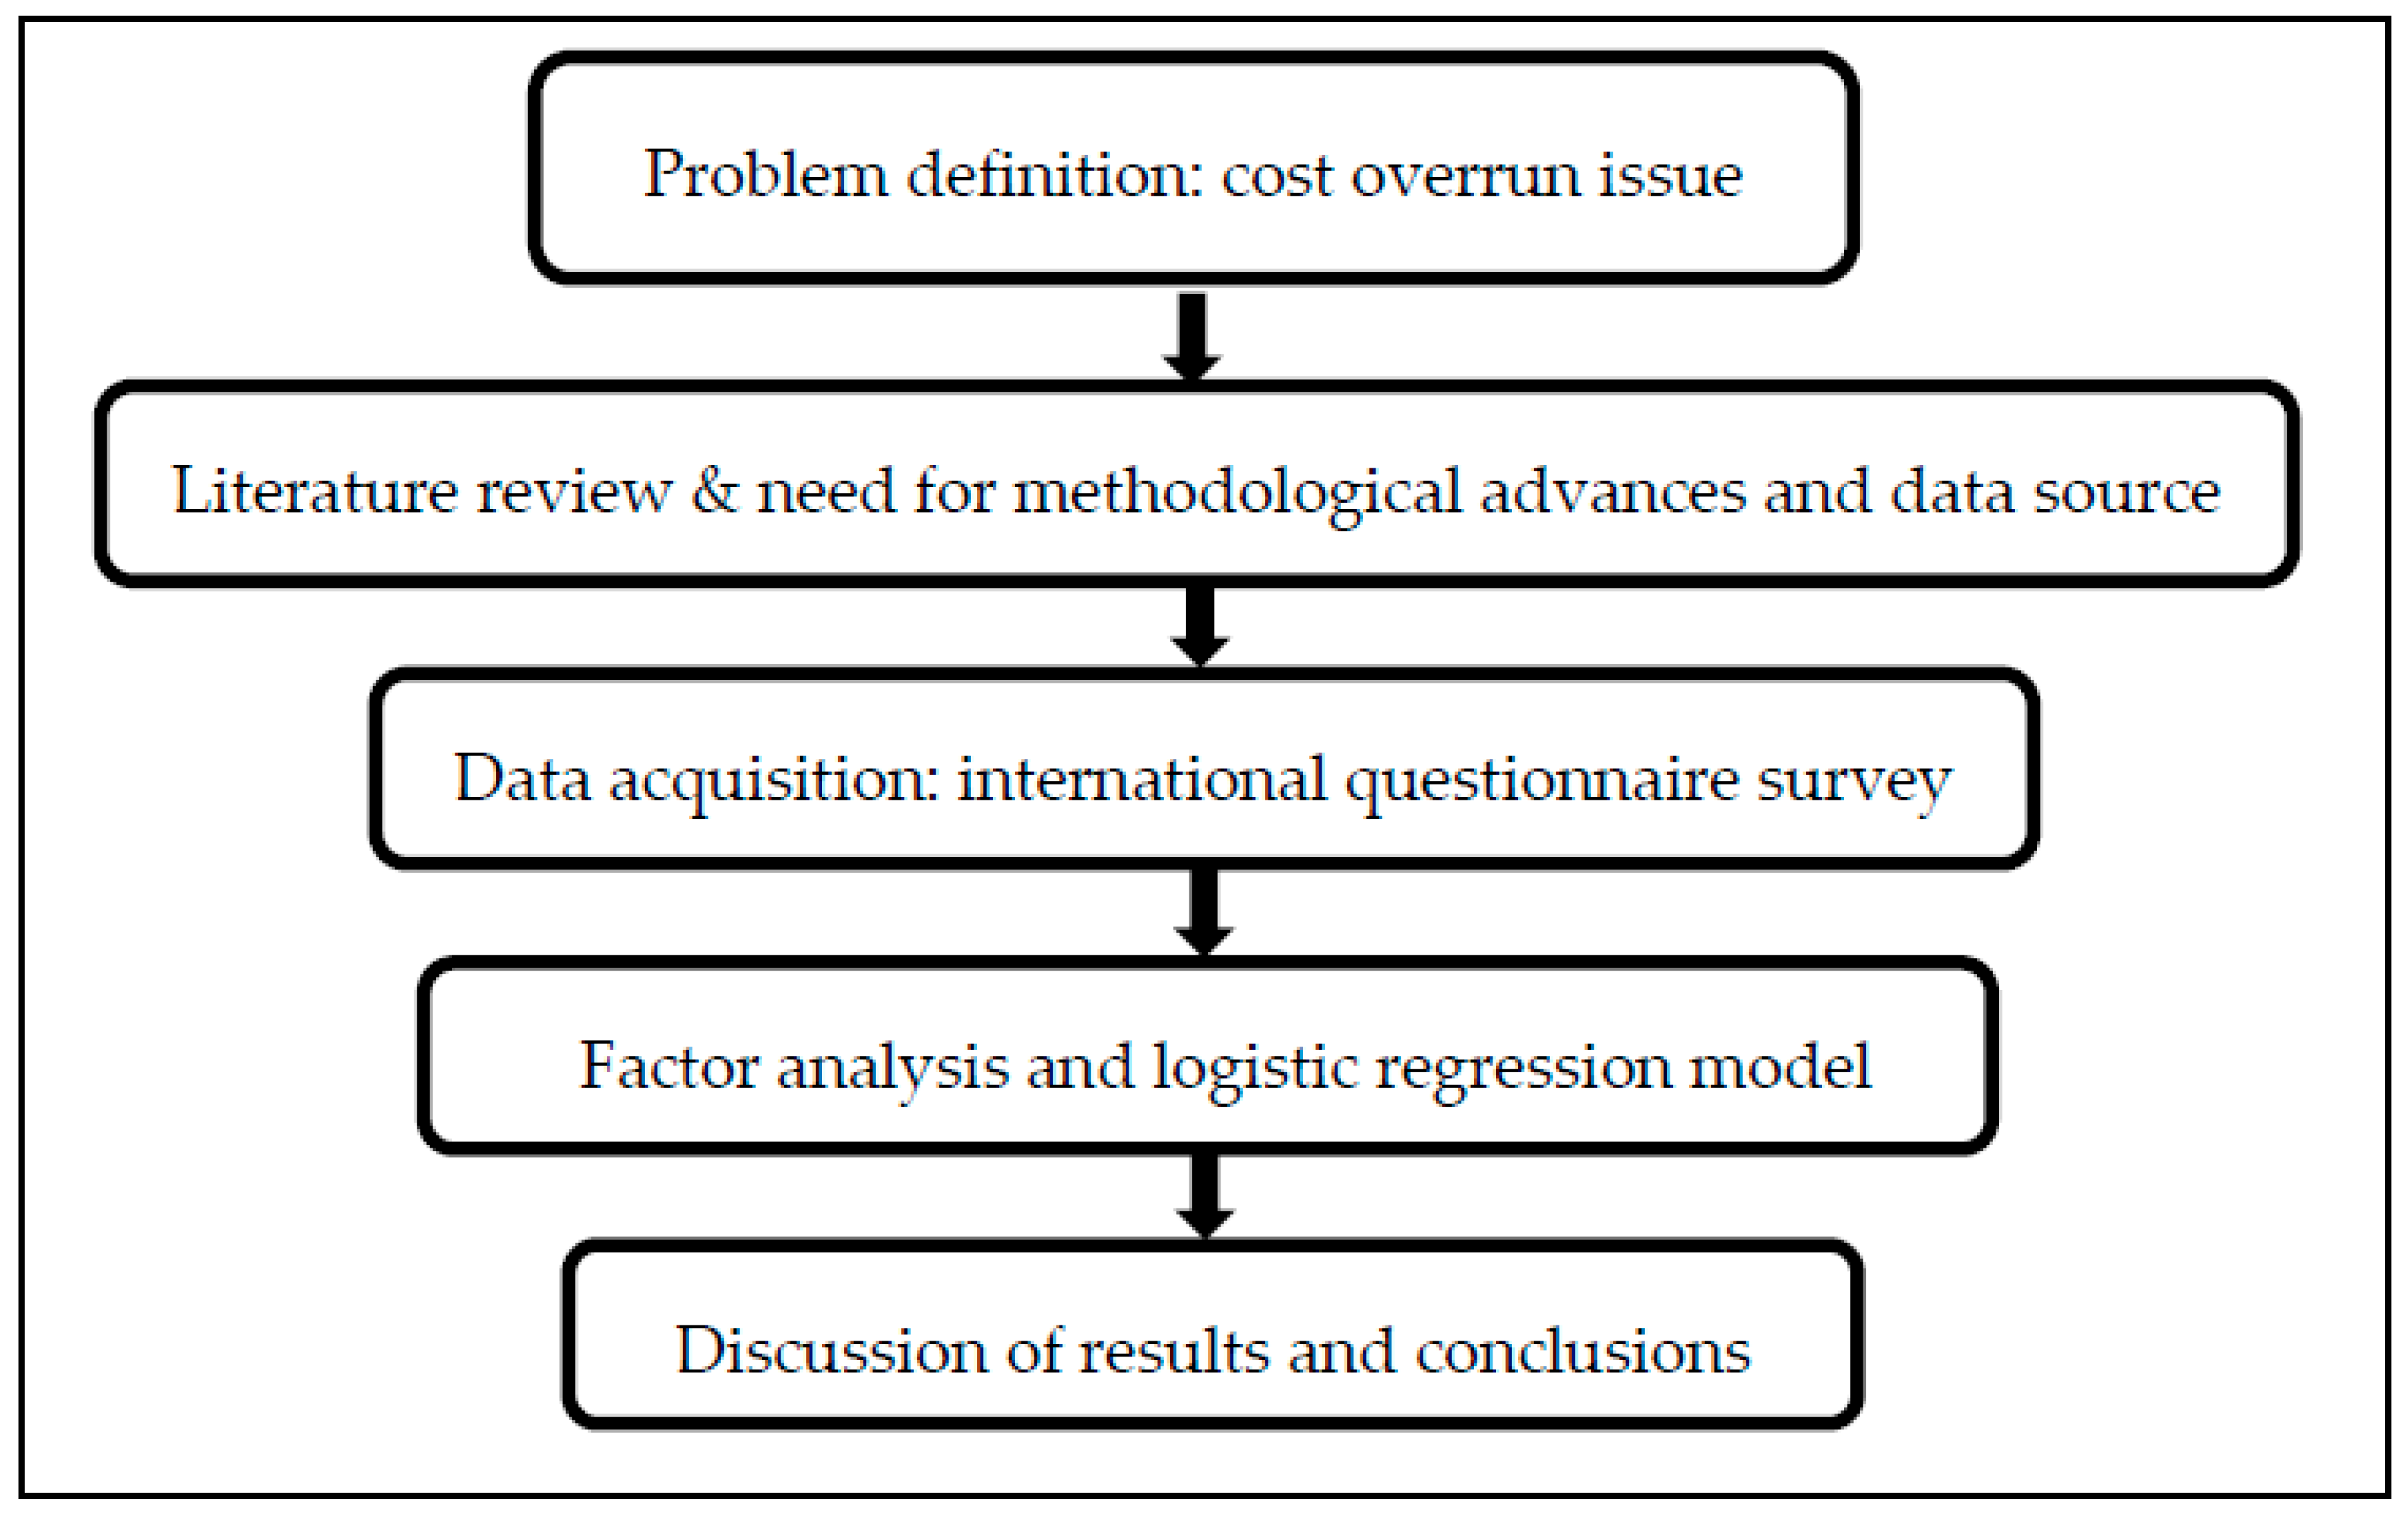
Figure 2.
Methodological steps for factor analysis.
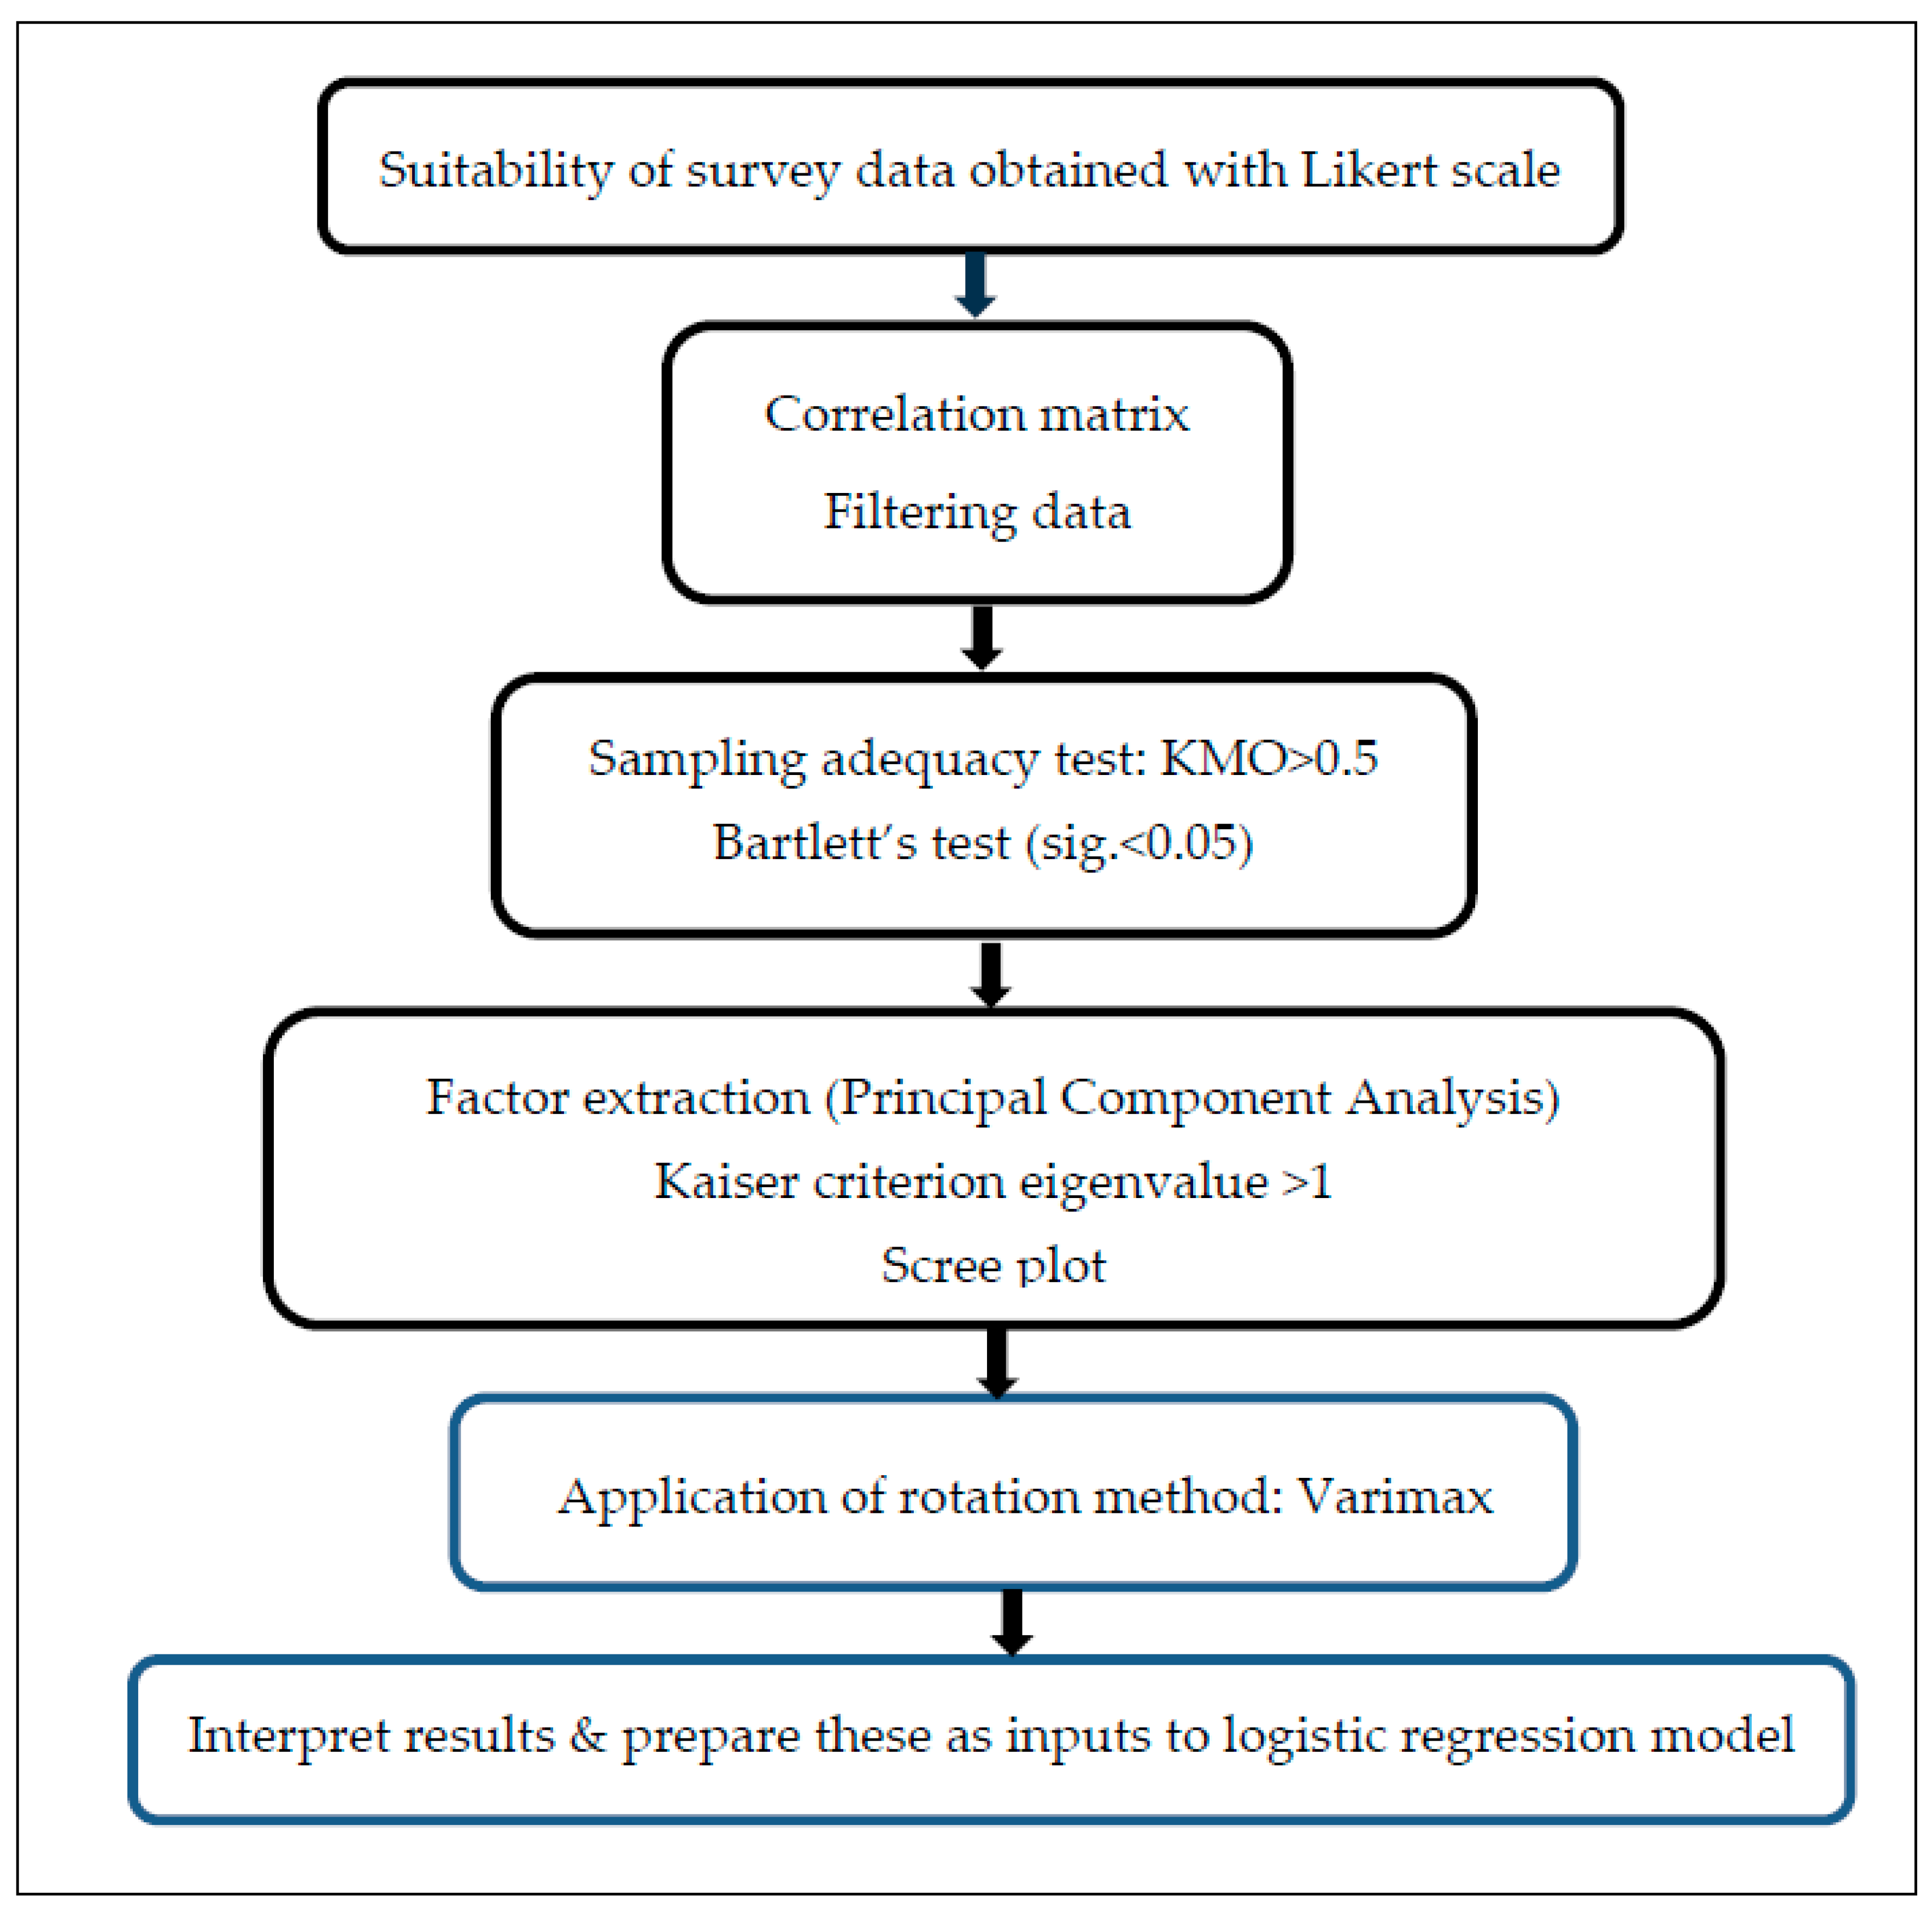
Figure 3.
Histogram of correlation coefficients.
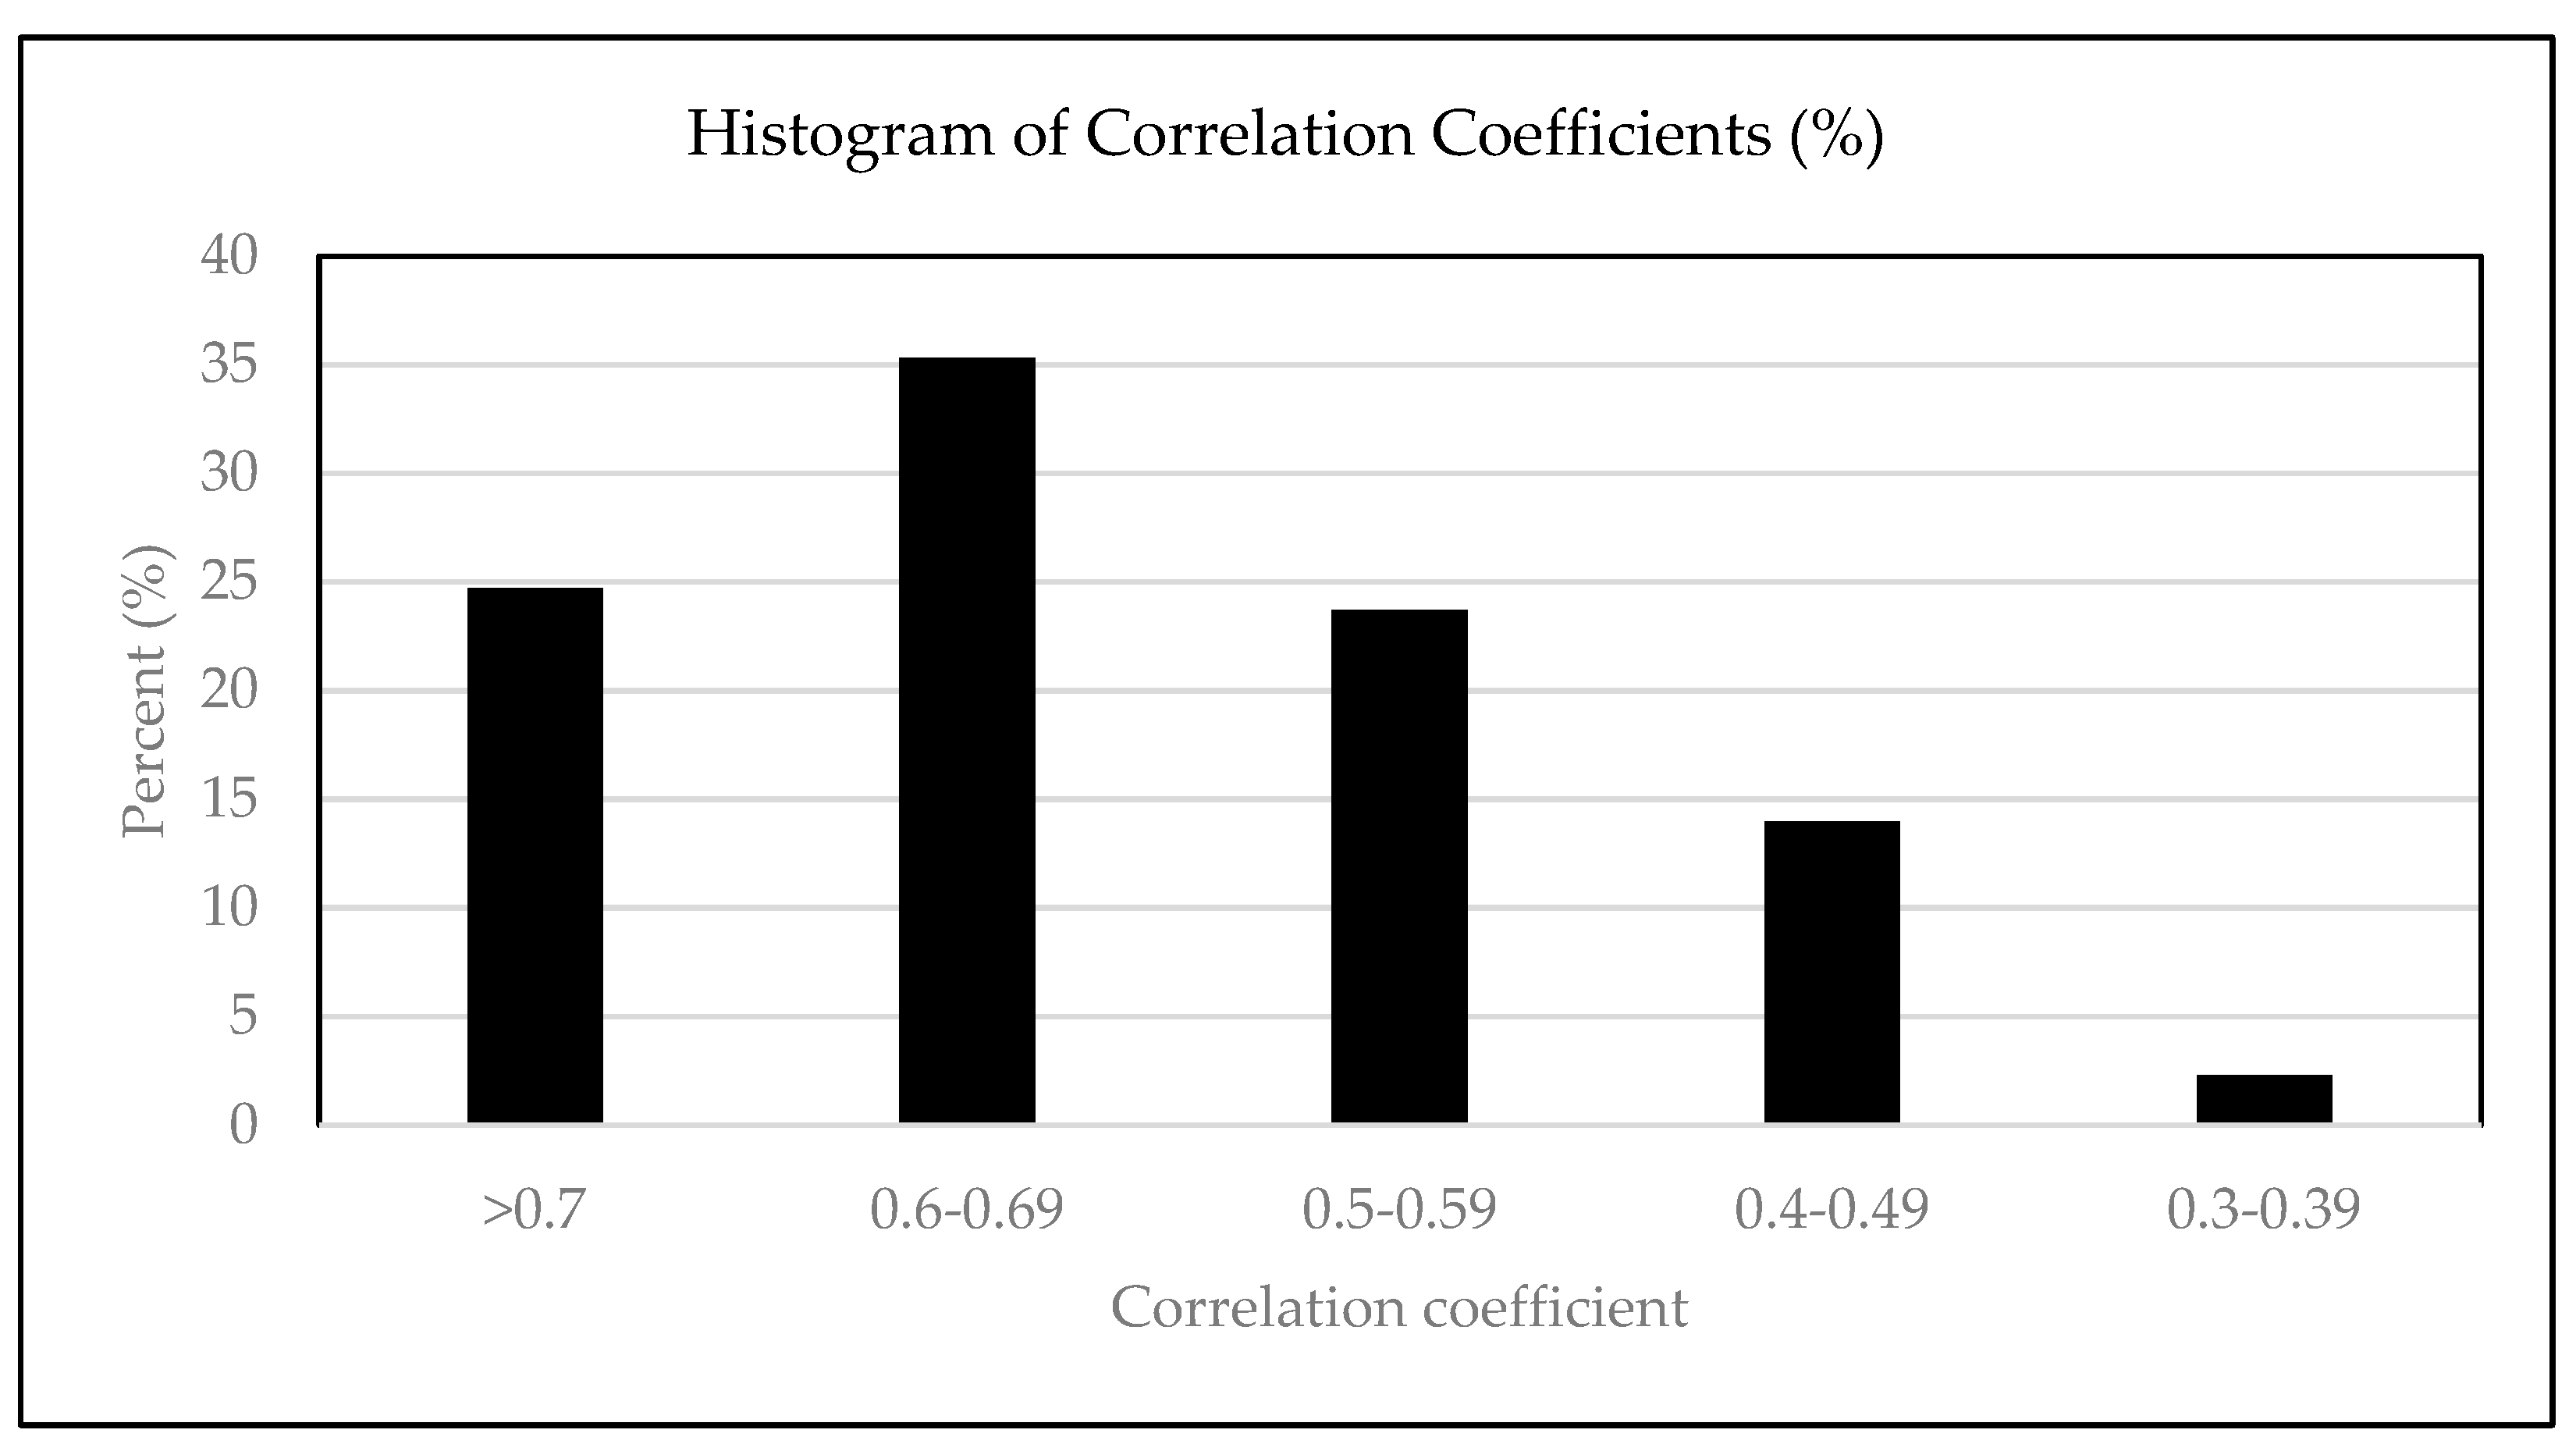
Figure 4.
Factor Scree Plot. Note: With 31 variables, up to 31 principal components (factors) can result with the use of Principal Components Analysis (PCA) method.
Figure 4.
Factor Scree Plot. Note: With 31 variables, up to 31 principal components (factors) can result with the use of Principal Components Analysis (PCA) method.
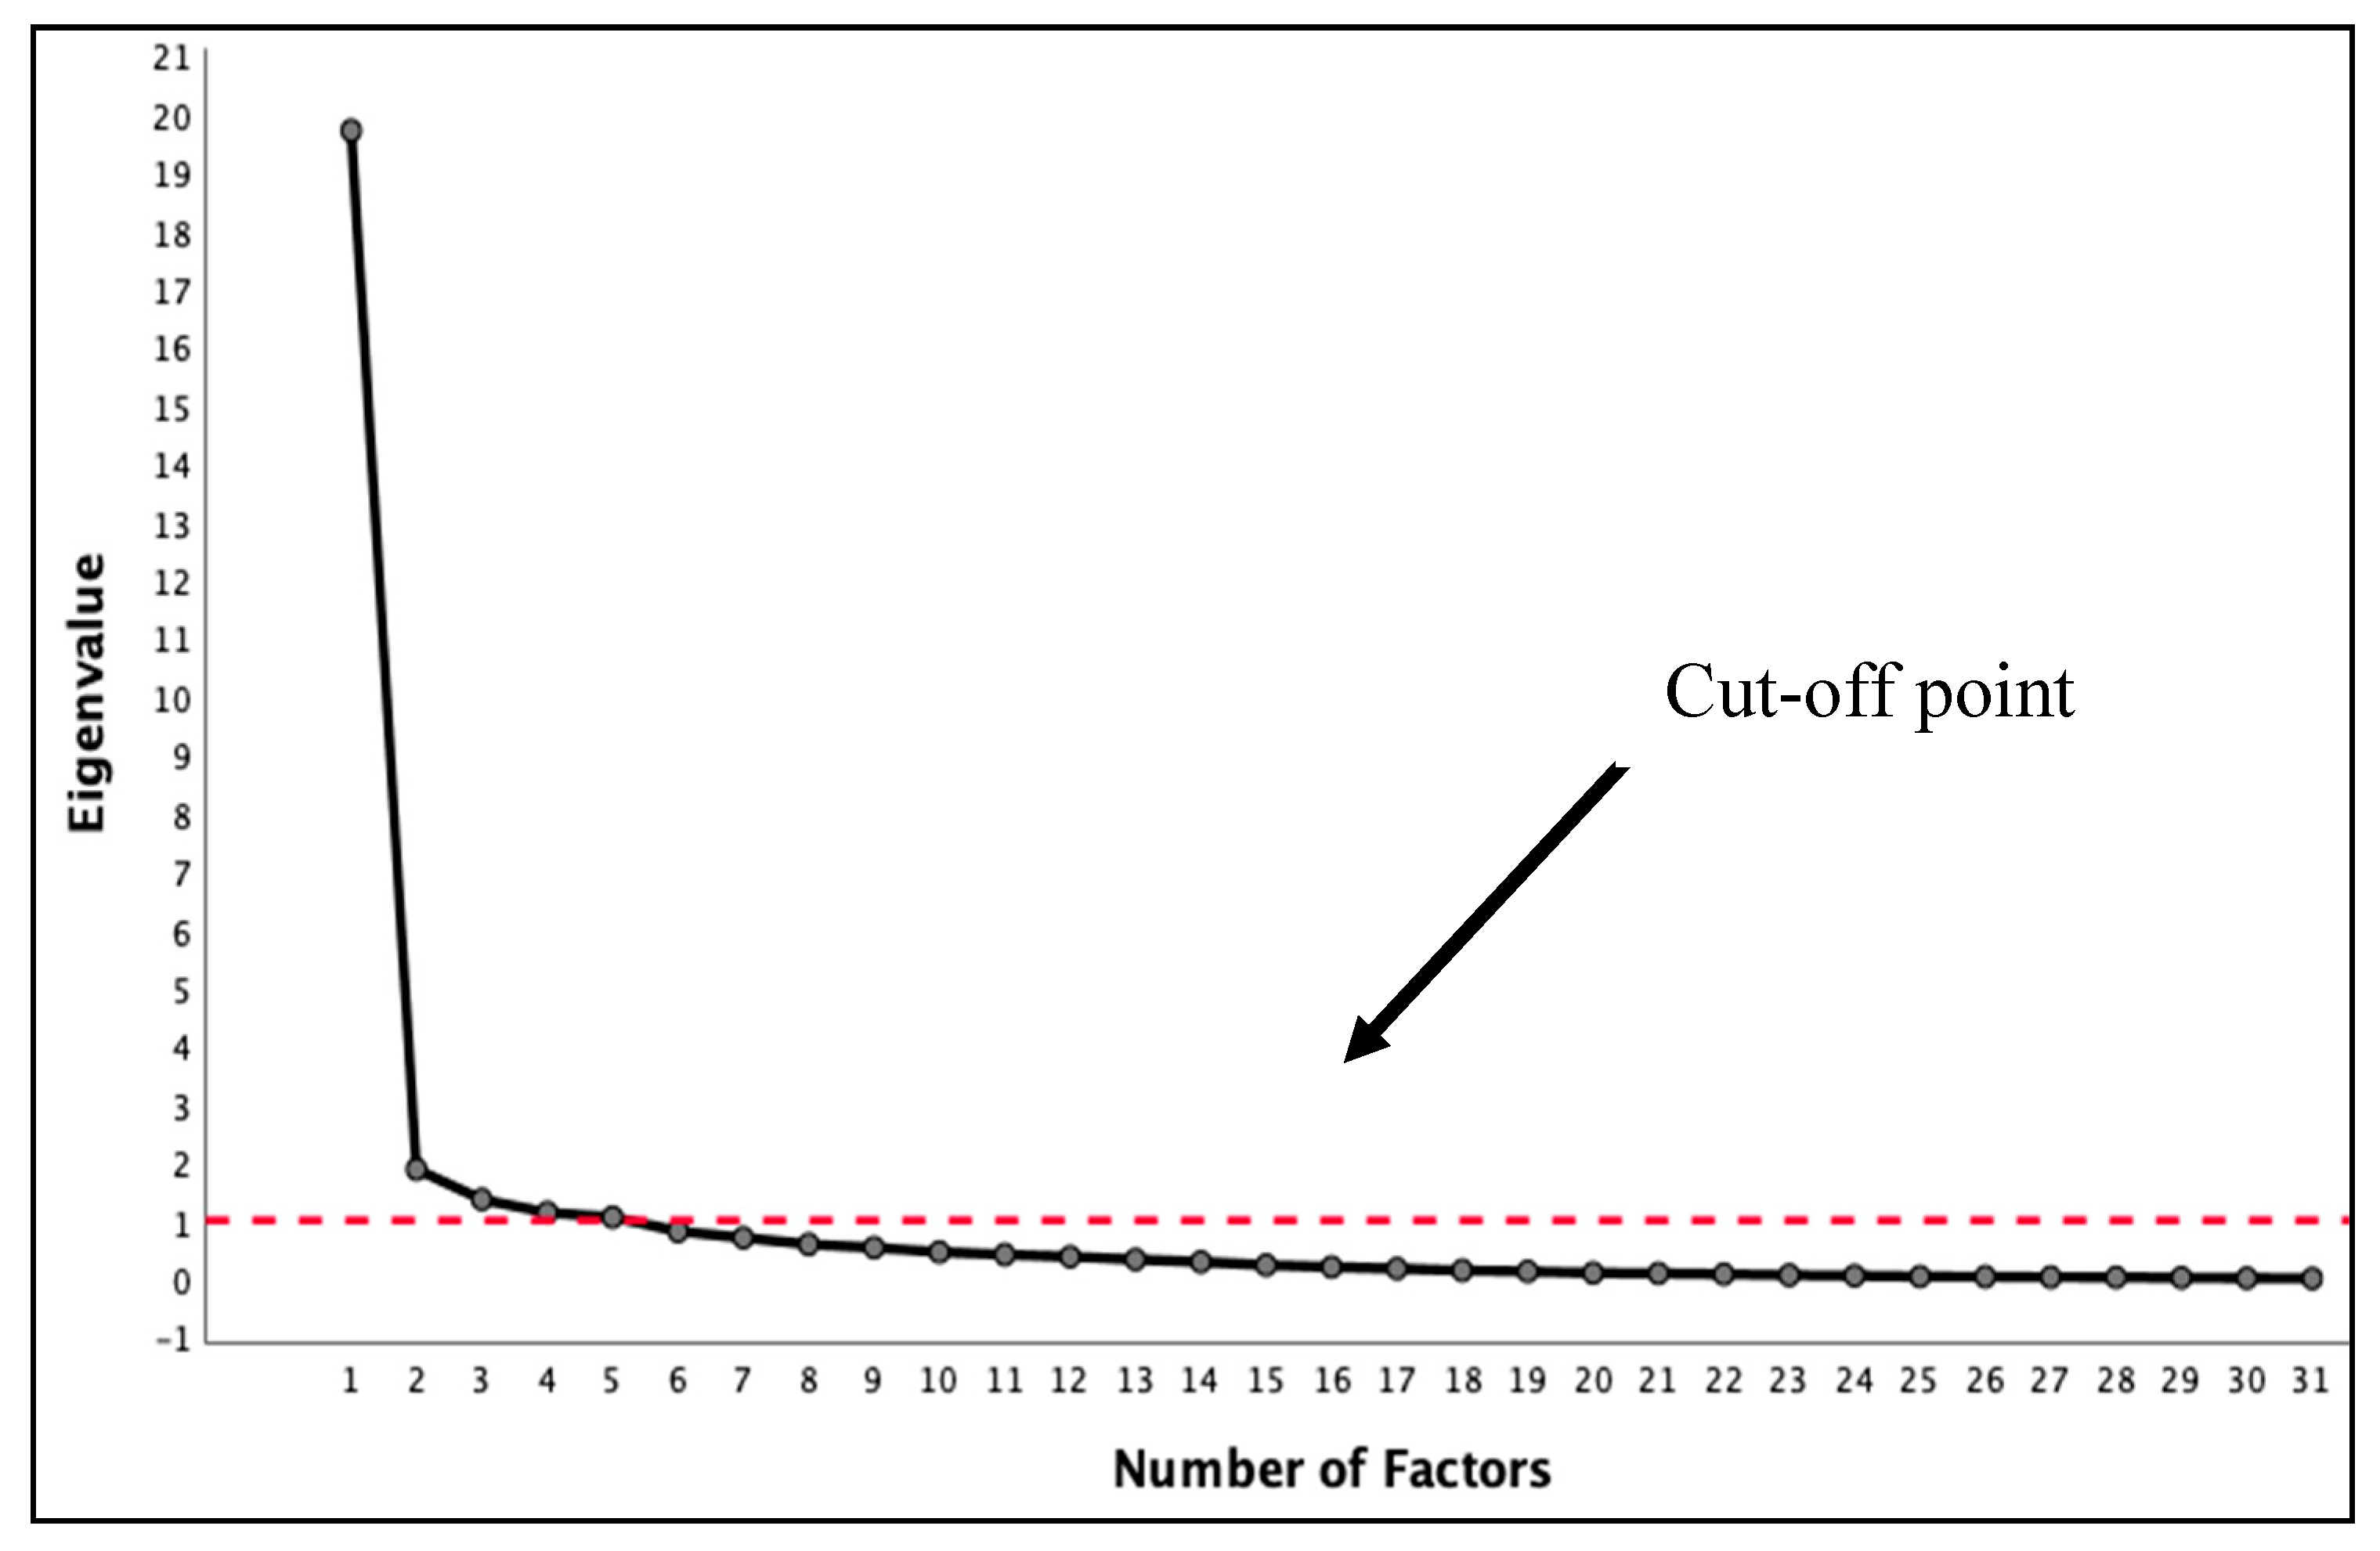
Figure 5.
Category of variables represented by Factor 1.
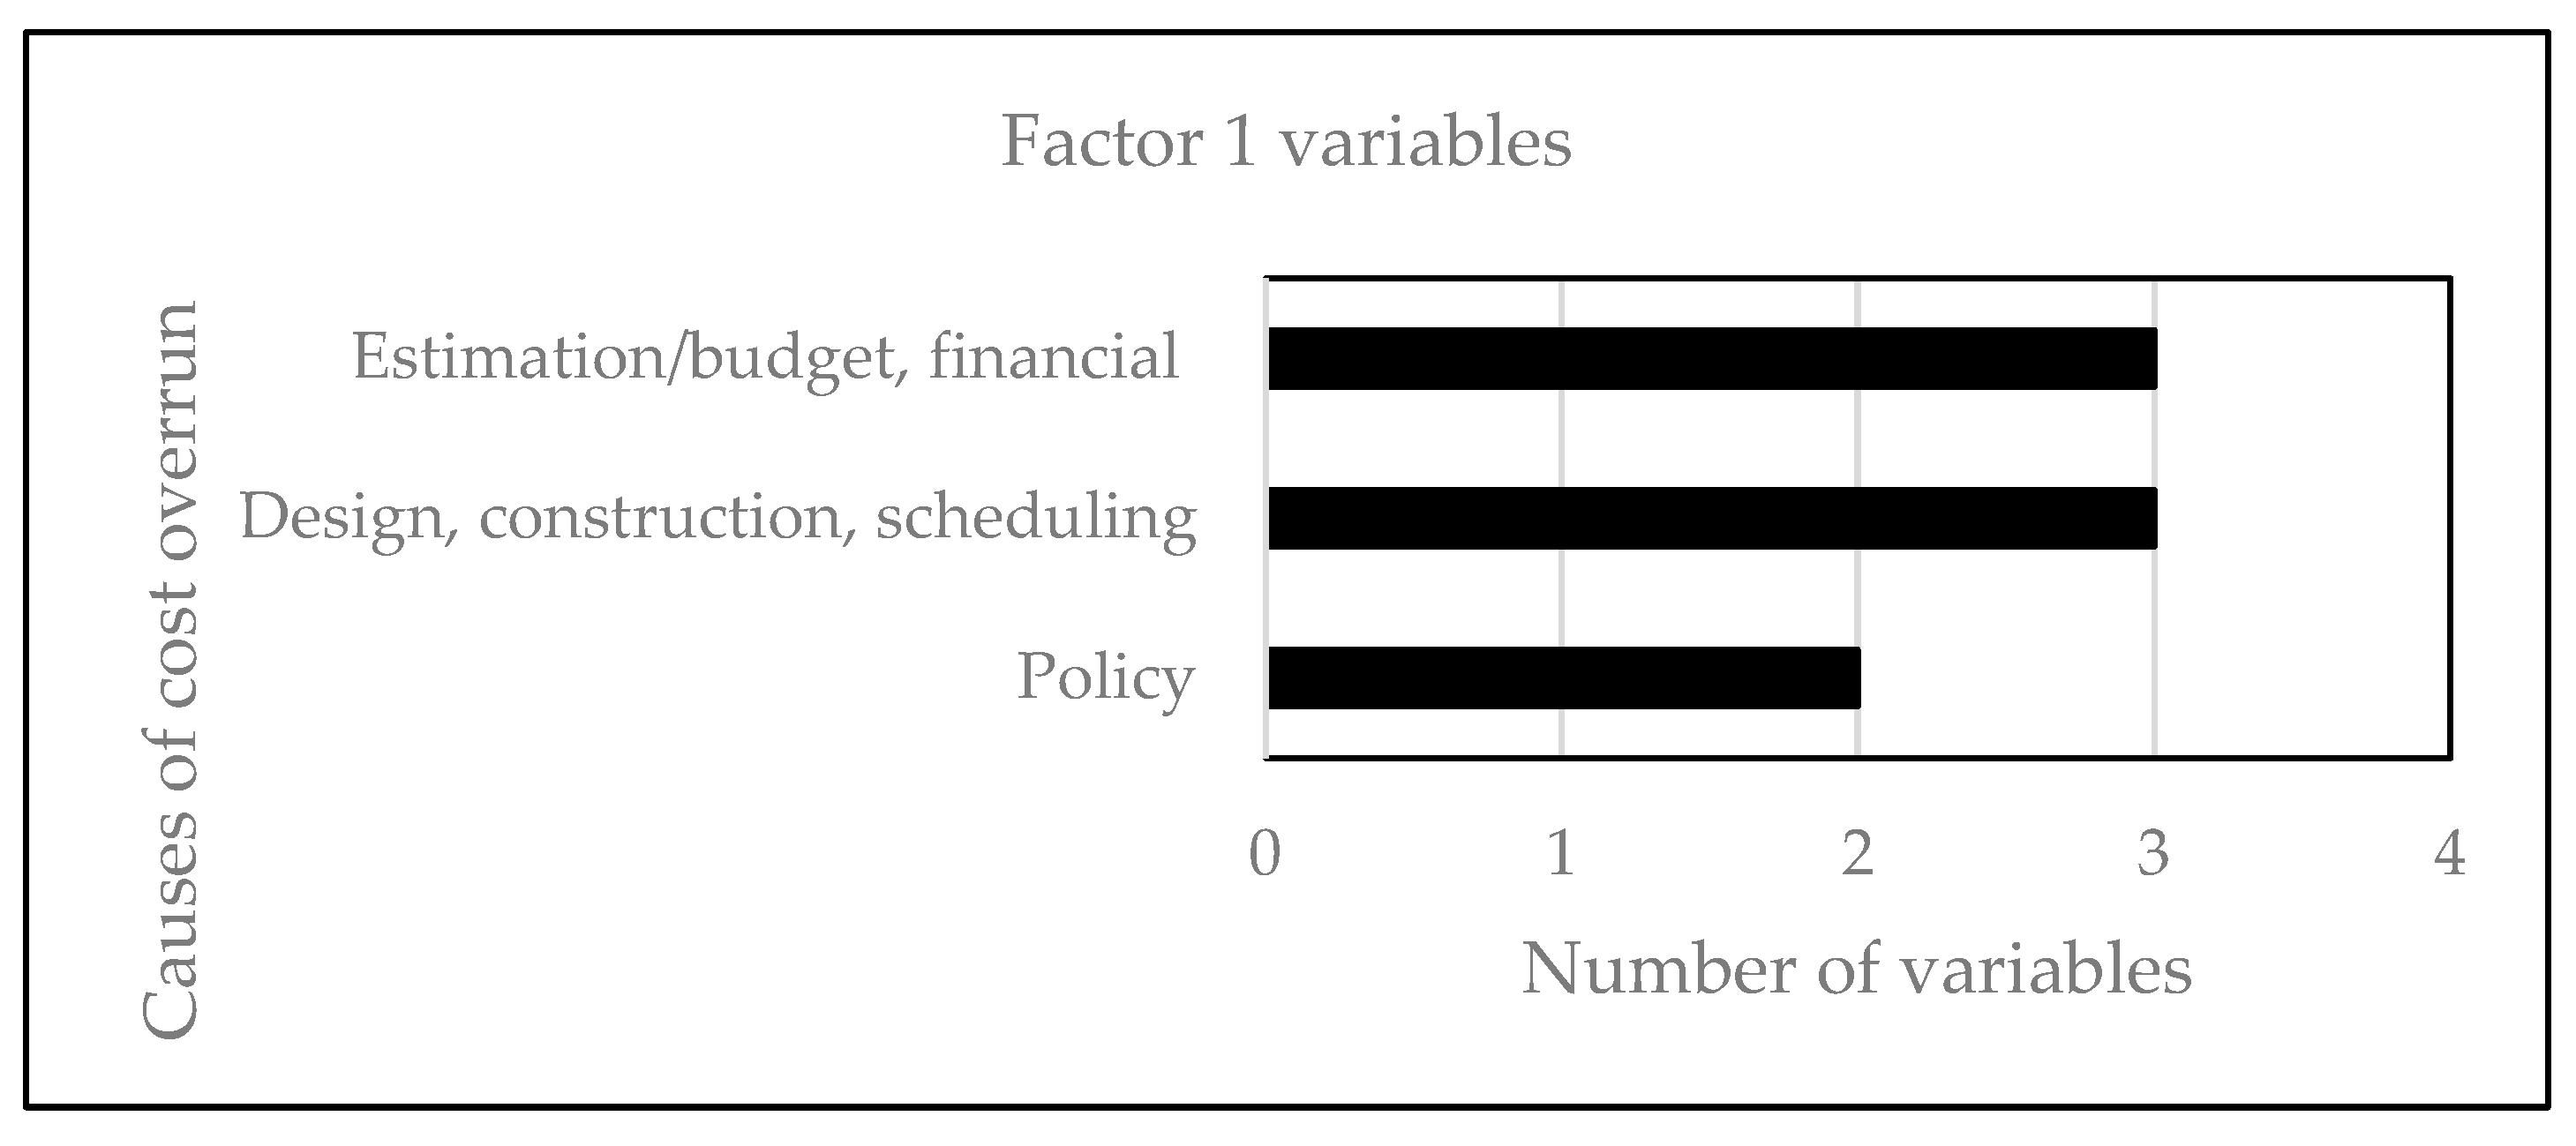
Figure 6.
Category of variables in the Combined Factors 2 to 4.
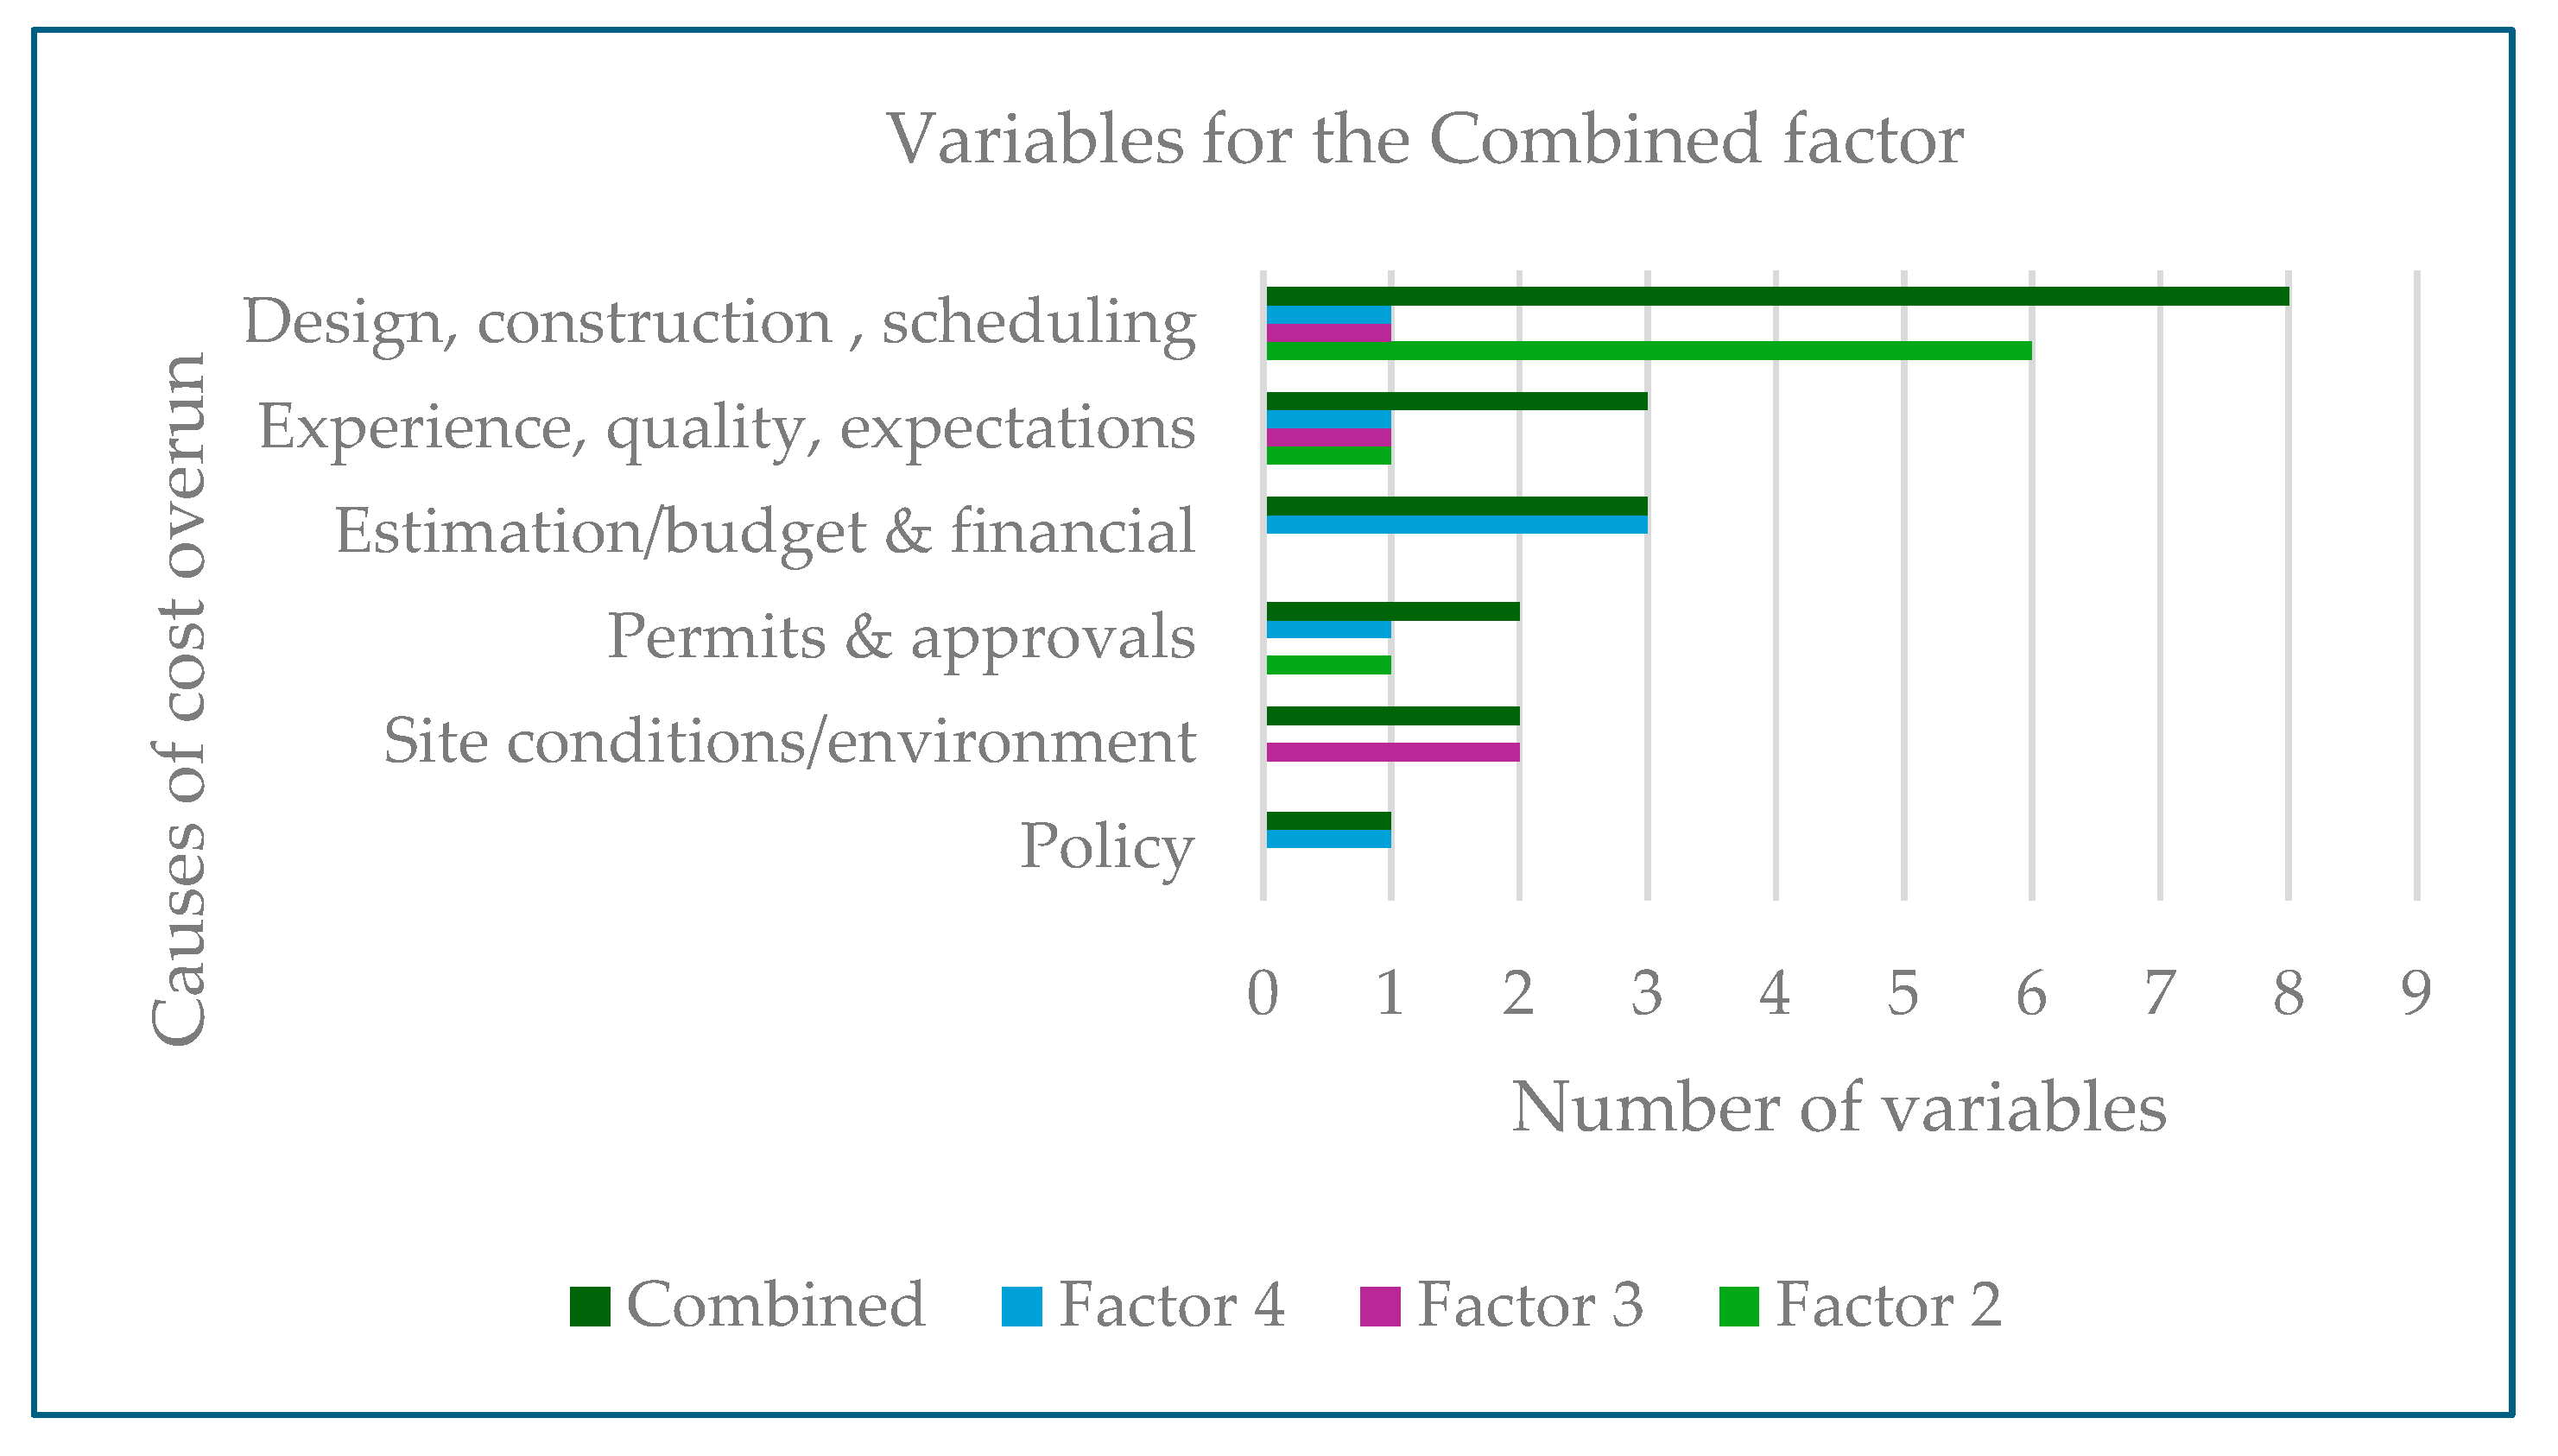
Figure 7.
Categories of variables included in Factor 5.
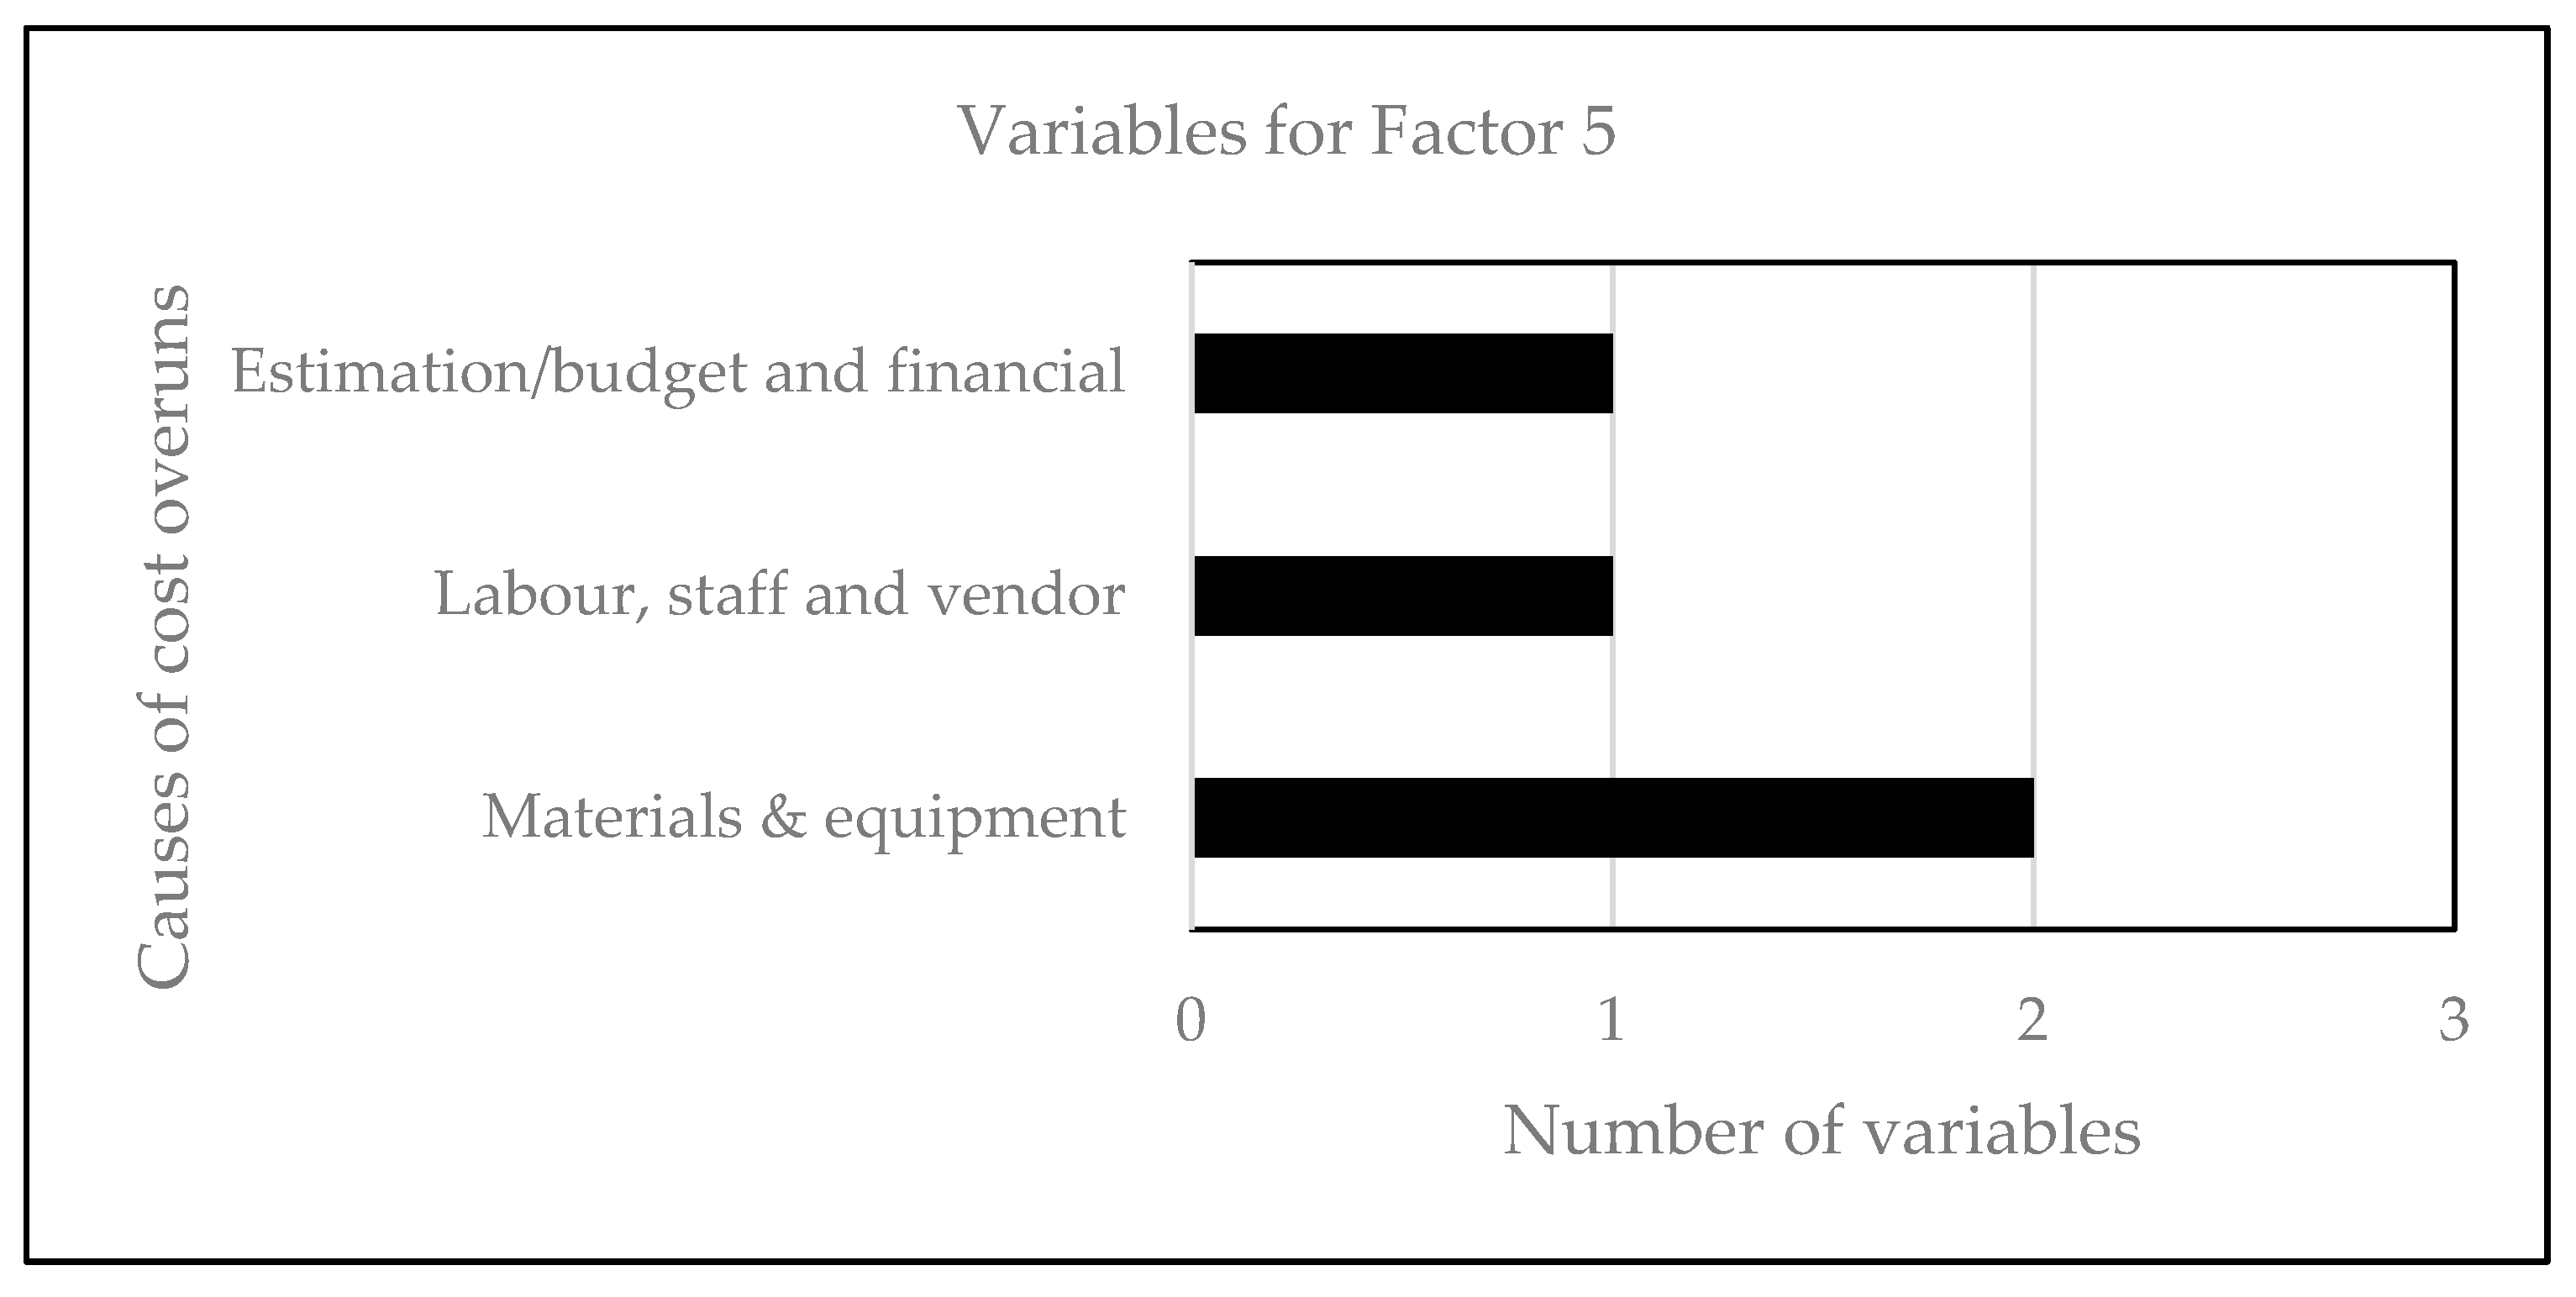

Table 1.
Cost overrun variables.
| Variable classification, number, and description |
|
POLICY V1 Changes in government funding policies V2 Deal termination due to changes in law, government policy or protocols V3 Change in regulations DESIGN, CONSTRUCTION AND SCHEDULING V4 Complexity of the project (e.g., Project size, Project type, scope of work) V5 Design changes during construction work V6 Re-work due to the construction errors V7 Unexpected technical problem V8 Design errors that represent insufficient deliverables V9 Changes by owner on the completion date of the project V10 Scope changes by Owner during construction V11 Delays related to owner or owner representative (e.g., stop work) V12 Unrealistic project scheduling V13 Acceleration to maintain schedule V14 Delays in sending important documents to construction site (e.g., drawings, design changes) V15 Type of construction contract (e.g., unit price contract) V16 Unnecessary practices, specifications, procedures, and documentation requirements forced onto the construction site workers V17 Replacing unsatisfactory subcontractors from site by hiring new subcontractors V18 Delay by subcontractor SITE CONDITIONS/ENVIRONMENT V19 Poor site management V20 Unexpected weather conditions V21 Accidents due to poor site safety MATERIALS AND EQUIPMENT V22 Shortage of materials & equipment on site V23 Damages in materials and equipment in transit to the construction site V24 Late delivery of materials & equipment at the construction site V25 Equipment Selection Changes V26 Construction variations due to equipment selection V27 Defective materials LABOUR, STAFF AND VENDOR V28 Shortage of skilled labor V29 Lack of staff at the time of construction V30 labor strikes & vendor strikes PERMITS AND APPROVALS V31 Delays and approval of shop drawings and installation procedures V32 Building Permit to the construction contractor V33 Government/ Municipal Approvals ESTIMATION/BUDGET AND FINANCIAL V34 Lack of expertise in setting the budget V35 The approved budget was too low V36 Absence of a detailed Estimate Plan V37 Changes in prices of items that have already been approved V38 Economic and financial factors V39 Inappropriate and inadequate procurement (e.g., payment terms, pricing) V40 Shortage of contingency and management reserve funds V41 Unaddressed overtime work or multiple shifts that was not included in the base estimate V42 Bankruptcy of subcontractors and vendors during construction work V43 Currency fluctuations OTHER FACTORS V44 Bad luck V45 Lack of technical qualifications of the client V46 Overly high expectations V47 Poor communication and coordination between all parties V48 Disputes between parties (designer, contractor, owner) V49 Political Factors V50 Technological risk V51 Land acquisition issues within right-of-way V52 Quality assurance and quality control V53 Inexperienced Project Managers, Estimators and Planners |
Table 2.
KMO and Bartlett's Tests.
| Test | Values |
| Kaiser-Meyer-Olkin Measure of Sampling Adequacy | 0.816 |
| Bartlett’s Test of Sphericity Approximate Chi-Square df Sig. |
2189.718 465 0.00 |
Table 3.
Factor extraction using initial eigenvalues (IEV) and rotation results.
| Factor | Initial eigenvalue (IEV) | IEV % of variance |
IEV Cumulative % |
Following rotation % of variance |
Following rotation Cumulative % |
| 1 2 3 4 5 |
19.70 1.88 1.36 1.13 1.06 |
63.55 6.06 4.38 3.65 3.40 81.04 |
63.55 69.61 73.99 77.64 81.04* |
18.64 18.02 15.10 14.77 14.51 81.04* |
18.64 36.66 51.76 66.53 81.04* |
NOTE: *81.04% of the total variance is accounted for by the first 5 factors.
Table 4.
Variables included in Factor 1 .
| Variable | Original Variable Descriptions | Factor Loading |
| V3 V17 V38 V1 V16 V42 V14 V40 |
Change in regulations Replacing unsatisfactory subcontractors from site by hiring new subcontractors Economic and financial factors Changes in government funding policies Unnecessary practices, specifications and procedures Bankruptcy of subcontractors and vendors during construction work Delays in sending important documents to construction site (e.g. drawings, design changes) Shortage of contingency and management reserve funds |
0.776 0.740 0.735 0.651 0.634 0.579 0.564 0.546 |
| Variance explained 18.64% |
Table 5.
Factors 2 to 4 cluster.
| Factor & Variables | Original variable descriptions | Factor loading | Variance explained |
| FACTOR 2 V4 V15 V53 V5 V8 V9 V13 V31 FACTOR 3 V21 V52 V6 V19 FACTOR 4 V36 V46 V32 V18 V39 V2 V34 |
• Complexity of the project (e.g. Project size, Project type, scope of work) • Type of construction contract (e.g. unit price contract) • Inexperienced Project Managers, Estimators and Planners • Design changes during construction work • Design errors that represent insufficient deliverables • Changes by owner on the completion date of the project • Acceleration to maintain schedule • Delays and approval of shop drawings and installation procedures • Accidents due to poor site safety • Quality assurance and quality control • Re-work due to the construction errors • Poor site management • Absence of a detailed Estimate Plan • Overly high expectations • Building Permit to the construction contractor • Delay by subcontractor • Inappropriate and inadequate procurement (e.g. payment terms, pricing) • Deal termination due to changes in law, government policy or protocols • Lack of expertise in setting the budget |
0.837 0.785 0.748 0.683 0.656 0.547 0.521 0.514 0.799 0.738 0.515 0.507 0.688 0.659 0.603 0.577 0.572 0.570 0.555 |
18.02% 15.10% 14.77% |
| Cumulative variance explained | 47.89% |
Table 6.
Variables represented by Factor 5.
| Variable | Original Variable Descriptions | Factor Loading |
| V41 V26 V28 V24 |
Unaddressed overtime work or multiple shifts that was not included in the base estimate Construction variations due to equipment selection Shortage of skilled labor Late delivery of materials & equipment at the construction site |
0.700 0.666 0.623 0.599 |
| Variance explained 14.51% |
Table 7.
Summary of interpreted factors.
| Factor | % of variance | Comment on constituent variables |
| Factor 1 (8 variables) | 18.64 | Most issues belong to estimation/budget, finances, design (delays in sending drawings to site, unnecessary practices). Policy and regulatory issues are also noted. See Table 5 & Figure 5. Table 1 shows variable classification and description. |
|
Combined Factor (based on Factor 2 + Factor 3 + Factor 4) (19 variables) |
47.89 | Most variables are classified as issues with planning, design, construction, scheduling, estimation/budget, finances, inexperience, quality, expectations, permits & approvals, site management, approvals. See Table 6 & Figure 6. Table 1 shows variable classification and description. |
| Factor 5 (4 variables) | 14.51 | Most variables relate to issues with materials & equipment. Alo, there are variables on estimation/budget, financial, shortage of skilled labour. See Table 7 & Figure 7. Table 1 shows variable classification and description. |
Table 8.
Logistic regression model statistics for Factor 1.
| Model Statistics | Result |
| Factor 1 Odds ratio Model Fit Information -2 Log likelihood (-2LL) Model Chi-square Sig. Pseudo R-square Cox & Snell R-Square Nagelkerke R-Square |
0.895 72.391 0.155 0.693 0.003 0.004 |
Table 9.
Logistic regression model statistics for Factor 1 plus the Combined Factor.
| Model Statistics | Result |
| Factor 1 Odds ratio Combined Factor (combination of Factors 2 – 4) Odds ratio Model Fit Information -2 Log likelihood (-2LL) Model Chi-square Sig. Pseudo R-square Cox & Snell R-Square Nagelkerke R-Square |
0.848 13.626 53.664 18.882 0.000 0.300 0.402 |
Table 10.
Logistic regression model statistics for Factor 1, the Combined Factor, and Factor 5.
| Model Statistics | Result |
| Odds Ratio Factor 1 Combined Factor (combination of Factors 2 – 4) Factor 5 Model Fit Information -2 Log likelihood (-2LL) Model Chi-square Significance. Pseudo R-square Cox & Snell R-Square Nagelkerke R-Square |
0.854 16.305 0.715 52.674 19.872 0.000 0.313 0.419 |
Disclaimer/Publisher’s Note: The statements, opinions and data contained in all publications are solely those of the individual author(s) and contributor(s) and not of MDPI and/or the editor(s). MDPI and/or the editor(s) disclaim responsibility for any injury to people or property resulting from any ideas, methods, instructions or products referred to in the content. |
© 2025 by the authors. Licensee MDPI, Basel, Switzerland. This article is an open access article distributed under the terms and conditions of the Creative Commons Attribution (CC BY) license (http://creativecommons.org/licenses/by/4.0/).
Copyright: This open access article is published under a Creative Commons CC BY 4.0 license, which permit the free download, distribution, and reuse, provided that the author and preprint are cited in any reuse.


