
Submitted:
25 August 2025
Posted:
26 August 2025
You are already at the latest version
Abstract
Direct pulp capping using mineral trioxide aggregate (MTA) is commonly used to preserve dental pulp tissue, but the molecular mechanisms underlying reparative dentin formation during this procedure and the restoration of pulp homeostasis remain unclear. To elucidate these mechanisms, we investigated the expression and function of intercellular adhesion molecule 2 (ICAM2) in dental pulp cells and tissue. ICAM2 expression in human dental pulp cells (HDPCs) was confirmed by gene and protein expression analysis. ICAM2 expression during reparative dentin formation after direct pulp capping was investigated using a rat direct pulp capping model. The effect of ICAM2 on odontoblast-like differentiation of HDPCs was assessed using siRNA and magnetic cell sorting (MACS). Gene and protein expression analysis showed that ICAM2 is expressed in approximately 10% of HDPCs. Immunofluorescence staining of rat mandibular bone sections showed that ICAM2 is expressed in dental pulp tissue. During reparative dentin formation, ICAM2 expression significantly increased on the third day after direct pulp capping and then returned to normal levels. ICAM2 knockdown by siRNA enhanced odontoblast-like differentiation of HDPCs. In contrast, supernatant from ICAM2-positive cells separated by MACS inhibited odontoblast-like differentiation of HDPCs. These findings suggest that ICAM2 may regulate reparative dentin formation in dental pulp tissue.
Keywords:
ICAM2
; dental pulp cells
; odontoblast-like differentiation
; direct pulp capping
; reparative dentin formation
1. Introduction
Dental caries, traumatic injuries and dental treatment can cause dentin defects and result in dental pulp exposure. In severe cases of dental pulp exposure or bacterial infection, endodontic treatment is required to remove inflamed and/or infected pulp tissue. Dental pulp, a highly vascularized and innervated tissue located within rigid dentin walls, performs several functions, such as responding to external signals, providing nutrients and reducing dental sensitivity by repairing pulp through mineralization [1]. After endodontic treatment, teeth are susceptible to altered pulp defense and sensory function due to pulp loss. Moreover, endodontically-treated teeth are at greater risk of root fracture than teeth with healthy dental pulp tissue [2,3]. Therefore, preservation of dental pulp tissue can lengthen the lifespan of teeth and thus, improve patient health.
Direct pulp capping can maintain pulp vitality in patients with pulp exposure due to caries or trauma. This method involves applying a healing agent directly to exposed pulp, promoting the formation of protective reparative dentin and maintaining pulp vitality [4]. While various materials have been used for direct pulp capping, mineral trioxide aggregate (MTA) is the material of choice due to its high biocompatibility, good sealing properties, antibacterial properties and promotion of mineralized tissue formation [5,6,7]. However, the molecular mechanisms underlying reparative dentin formation after direct pulp capping with MTA and restoration of pulp homeostasis following inflammation caused by pulp exposure remain unclear.
Intercellular adhesion molecules (ICAMs) are transmembrane glycoproteins belonging to the immunoglobulin superfamily [8]. They play important roles in inflammation, immune responses and intracellular signaling, and are involved in tissue homeostasis and regeneration [9]. The ICAM family has five members, ICAM1 through ICAM5 [8]. ICAM2 is involved in bone metabolism [10], however, the role of ICAM2 and other ICAM family members in dental pulp has not been reported. Therefore, in this study we investigated the expression, localization and function of ICAM2 in dental pulp cells and tissue.
2. Results
2.1. ICAM2 Localization in Rat Dental Pulp Tissues and ICAM2 Expression in Human Dental Pulp Cells
We first comprehensively analyzed the expression levels of five ICAM family members in a human dental pulp cell (HDPC), HDPC-5Y. Quantitative RT-PCR revealed that ICAM2 was more highly expressed in dental pulp cells than the other members (Figure 1A). We therefore focused on ICAM2, one of the ICAM members, and aimed to clarify its expression and localization in dental pulp tissue. Immunofluorescence staining results showed that ICAM2 was expressed in dental pulp tissue, mainly odontoblasts and around blood vessels (Figure 1B-E). We next investigated the expression of ICAM2 in dental pulp cells in vitro. Immunofluorescence staining showed that ICAM2 was expressed in HDPC-5Y (Figure 1F,G), and semi-quantitative RT-PCR demonstrated that ICAM2 gene was expressed in HDPCs (Figure 1H). Furthermore, flow cytometry analysis revealed that the percentage of ICAM2-positive cells in the heterogeneous HDPC population was approximately 10% (Figure 1I). These results indicate that ICAM2 is expressed in dental pulp tissue and cells, and suggest that ICAM2 may be involved in odontoblast differentiation in dental pulp tissue.
2.2. ICAM2 Expression in Rat Dental Pulp Tissue After Direct Pulp Capping
To further investigate the role of ICAM2 in odontoblast differentiation, we then assessed the dynamics of ICAM2 expression during reparative dentin formation in an established rat direct pulp capping model [11,12]. H&E staining of formalin-fixed, paraffin-embedded tissue showed that 3 days after treatment, induction of reparative dentin had begun, although the exposure site had not yet fully closed (Figure 2A,B). Immunohistochemical staining showed that ICAM2 protein was expressed at low levels in normal rat dental pulp tissue (Figure 2C,I). One day after treatment, the number of ICAM2-positive dental pulp cells (DPCs) increased in dental pulp tissue (Figure 2D,I). Three days after treatment, more intense staining of ICAM2 was detected, even beneath the pulp exposure site (Figure 2E,I). Then, the number of ICAM2-positive DPCs gradually decreased at 5 and 7 days after treatment (Figure 2F,G,I), reaching the same level as control animals at 14 days post-surgery (Figure 2H,I). These results suggest that ICAM2 plays a role in reparative dentin formation after direct pulp capping.
2.3. Effect of ICAM2 Knockdown on Odontoblast-like Differentiation of HDPCs
We next examined the effect of ICAM2 knockdown on odontoblast-like differentiation of HDPCs. Quantitative RT-PCR confirmed that ICAM2 mRNA expression in HDPC-5Y was downregulated by 48 hours of treatment with ICAM2 siRNA (Figure 3A). The alizarin red S (ARS)-positive area of HDPC-5Y treated with ICAM2 siRNA (HDPC_siICAM2) cultured in odontoblast-like differentiation medium was larger than that of HDPC-5Y treated with control siRNA (HDPC_siCont) (Figure 3B,C). In addition, expression of odontoblast-related genes, such as dentin sialophosphoprotein (DSPP), Nestin, tyrosine hydroxylase (TH) and osteopontin (OPN), was significantly higher in HDPC_siICAM2 cultured in osteoblastic differentiation medium than in HDPC_siCont (Figure 3D). These results suggest that ICAM2 knockdown promotes odontoblast-like differentiation of HDPCs.
2.4. Effect of ICAM2-Expressing HDPCs on Odontoblast-like Differentiation
To further clarify the role of ICAM2 in dental pulp tissue, we isolated ICAM2-positive HDPCs from a heterogeneous HDPC population using the magnetic-activated cell sorting (MACS) and analyzed the effect of these cells on odontoblast-like differentiation. We used MACS to separate HDPC-5Y into ICAM2-positive and ICAM2-negative cells, cultured the cells in normal medium for 24 hours and then collected the culture supernatant (Figure 4A). We confirmed ICAM2 expression in the sorted cells using quantitative RT-PCR and found that ICAM2-positive cells had significantly higher ICAM2 mRNA expression than ICAM2-negative cells (Figure 4B). We next cultured HDPC-5Y in odontoblast differentiation-inducing medium supplemented with culture supernatant collected from either ICAM2-positive or ICAM2-negative cells (Figure 4A). The ARS-positive area was significantly smaller in cells treated with ICAM2-positive cell culture supernatant that in cells cultured with supernatant from ICAM2-negative cells (Figure 4C,D). In addition, expression levels of odontoblast-related genes, such as DSPP, Nestin and TH was significantly higher in cells treated with ICAM2-positive cell culture supernatant than in those treated with ICAM2-negative cell culture supernatant (Figure 4E). To investigate the reasons for this, we analyzed the expression of mineralization inhibitors in ICAM2-positive and ICAM2-negative cells. ICAM2-positive cells had higher expression of transforming growth factor-β-induced gene product-h3 (βig-h3) and Wnt5a, both mineralization inhibitors [13,14], than ICAM2-negative cells (Figure 4F). These results suggest that ICAM2-positive HDPCs may suppress odontoblast-like differentiation through the action of mineralization inhibitors.
3. Discussion
Dental pulp tissue contains various cells, including stem cells, fibroblasts and odontoblasts, and is responsible for maintaining tooth vitality, and regulating pain transmission and immune responses [15,16]. Dental pulp stem cells (DPSCs) possess typical characteristics of mesenchymal stem cells, demonstrating plastic adherence and clonogenic properties with multilineage differentiation capabilities, including osteoblast differentiation in vitro [17,18]. When odontoblasts are damaged, DPSCs differentiate into odontoblast-like cells in response to inflammatory stimuli and form reparative dentin, preventing further destruction of pulp tissue and maintaining the dentin/pulp complex [4]. During direct pulp capping, the pulp capping material promotes odontoblast-like differentiation of pulp stem cells, thereby ensuring reparative dentin formation and increasing the probability of pulp protection. Although dental pulp contains stem cells capable of forming hard tissue, it never mineralizes under physiological conditions, and even after dental pulp capping, only a small amount of reparative dentin is formed locally. This suggests that there is an inhibitory mechanism preventing dental pulp cell differentiation into odontoblasts.
Our recent study showed that reparative dentin formation can be observed 7 days after pulp capping with MTA, with a dentin-bridge covering the exposed pulp area at 14 days post-treatment. These results are consistent with previous studies showing reparative dentin formation 7 days after pulp capping [19,20,21]. MTA releases calcium ions [22,23] and induces reparative dentin when it is applied as a direct pulp capping material on exposed pulp [24,25,26]. During repair of dental pulp tissue after injury, odontoblast-like differentiation of DPCs is essential for synthesis of reparative dentin at the pulp exposure site. Therefore, if reparative dentin is formed 7 days after pulp capping, it is possible that the molecular biological changes leading to odontoblast-like differentiation of pulp cells may be observed 1–5 days after pulp capping. Kuratake et al. reported that cells positive for nestin, a marker for newly formed odontoblast-like cells, appear directly below the pulp capping area on day 3 after direct pulp capping and then arrange themselves at the pulp-capping interface on day 5, resulting in the formation of reparative dentin on day 7 [19]. Moreover, previous studies have shown that expression of OPN and DMP1 [20], which regulate odontoblast-like differentiation of pulp cells, is increased near the pulp cap by day 1 after pulp capping. These findings suggest that the molecular signals for odontoblast-like differentiation of dental pulp cells are activated between 1 and 3 days after pulp capping.
ICAM2 has been reported to inhibit bone formation by mediating osteoclast differentiation [10]. While the relationship between pulp cell mineralization and ICAM2 has not been previously reported, our animal studies suggest that ICAM2 may play a role in preventing excessive pulp mineralization by inhibiting the promotion of odontoblast differentiation in pulp cells, thereby maintaining an appropriate level of reparative dentin formation immediately beneath the pulp cap. Our recent studies using a rat model showed that after direct pulp capping with MTA, ICAM2 expression increased immediately beneath the pulp capping site, peaking on day 3. In our pulp capping experiments, ICAM2 expression levels increased sharply on day 3, gradually decreased after day 5 and returned to physiological levels by day 14, which coincides with the formation of a reparative dentin-bridge. These data suggest that once ICAM2 has slowed excessive pulp mineralization, it returns to physiological expression levels. Therefore, we performed two in vitro analyses to clarify the function of ICAM2 after direct pulp capping. An ICAM2 siRNA knockdown assay demonstrated that suppression of ICAM2 in dental pulp cells promotes odontoblast differentiation, suggesting that ICAM2 may inhibit odontoblast-like differentiation of dental pulp cells.
Many reports have been published on factors that promote the differentiation of dental pulp cells into odontoblasts [11,27,28,29,30], but there have been no reports on factors that suppress excessive hard tissue formation and maintain pulp homeostasis during reparative dentin formation after direct pulp capping. In this study, we showed that paracrine application of culture supernatant from ICAM2-expressing human dental pulp cells significantly inhibited odontoblast-like differentiation. These results suggest that ICAM2-expressing dental pulp cells may secrete factors that inhibit odontoblast differentiation. Based on previous findings, we speculated that mineralization-inhibitory factors such as βig-h3 and Wnt5a may mediate this process. βig-h3 has been reported to suppress odontoblast-like differentiation of human dental pulp cells [13] and Wnt5a is known to have an inhibitory effect on mineralization in various cells [14,31,32]. Our study demonstrated significantly higher expression of βig-h3 and Wnt5a in ICAM2-positive dental pulp cells than in ICAM2-negative cells. However, further analysis is needed to clarify this mechanism.
4. Materials and Methods
4.1. Cell Culture
Three HDPC populations were isolated from the healthy third molars of a 29-year-old female (HDPC-5Y), a 21-year-old female (HDPC-5L) and a 24-year-old male (HDPC-5I) after informed consent as described previously [33]. HDPCs were cultured in alpha minimum essential medium (α-MEM; Gibco-BRL, Grand Island, NY) containing 10% fetal bovine serum (FBS; Sigma-Aldrich, St. Louis, MO; 10% FBS/α-MEM) supplemented with 50 µg/mL streptomycin and 50 U/mL penicillin (Gibco-BRL) at 37°C in a humidified atmosphere of 5% CO2 and 95% air. All procedures were approved by the Research Ethics Committee, Kyushu University.
4.2. Quantitative Reverse Transcription Polymerase Chain Reaction (RT-PCR)
Total cellular RNA was isolated with TRIzol Reagent (Invitrogen, Carlsbad, CA), in accordance with the manufacturer’s instructions. The purity and concentration of total RNA were measured using a NanoDrop Lite spectrophotometer (Thermo Fisher Scientific Inc., Walthum, MA). First-strand cDNA was synthesized from 1 μg of total RNA using an ExScript RT Reagent kit (Takara Bio Inc., Shiga, Japan). Total RNA was reverse-transcribed with random 6-mers and ExScript RTase for 15 min at 42°C, and the reaction was stopped by incubation for 2 min at 99°C, followed by 5 min at 5°C. PCR was performed using KAPA Express Extract (Kapa Biosystems, Woburn, MA) in a PCR Thermal Cycler Dice (Takara Bio Inc.) under the following conditions: 95°C for 10 s, then 40 cycles at 95°C for 5 s and 60°C for 30 s, followed by a dissociation protocol at 95°C for 15 s, 60°C for 30 s, and 95°C for 15 s. Primer sequences, annealing temperatures, cycle numbers and product sizes for ICAM1, ICAM2, ICAM3, ICAM4, ICAM5, DSPP, Nestin, TH, OPN, βig-h3, Wnt5a and β-actin are shown in Table 1. To calculate the relative mRNA expression, ΔΔCt values were applied using β-actin as an internal calibrator.
4.3. Histological Analysis
Ten-week-old male Sprague-Dawley (SD) rats (Kyudo, Saga, Japan) were perfused by intracardiac injection of 4% paraformaldehyde (PFA; Merck Millipore, Darmstadt, Germany) in phosphate-buffered saline (PBS) under anesthesia. The jaws were excised and immersed in 4% PFA for an additional 24 hours. The tissues were then washed with PBS and decalcified in 10% ethylenediaminetetraacetic acid (EDTA) for 4 weeks at 4°C before dehydration and embedding in paraffin. The embedded samples were then sectioned (5 μm in thickness). The sections were observed using a BZ800 microscope (Keyence Corporation, Osaka, Japan) after hematoxylin and eosin (H&E) staining.
4.4. Semi-Quantitative RT-PCR
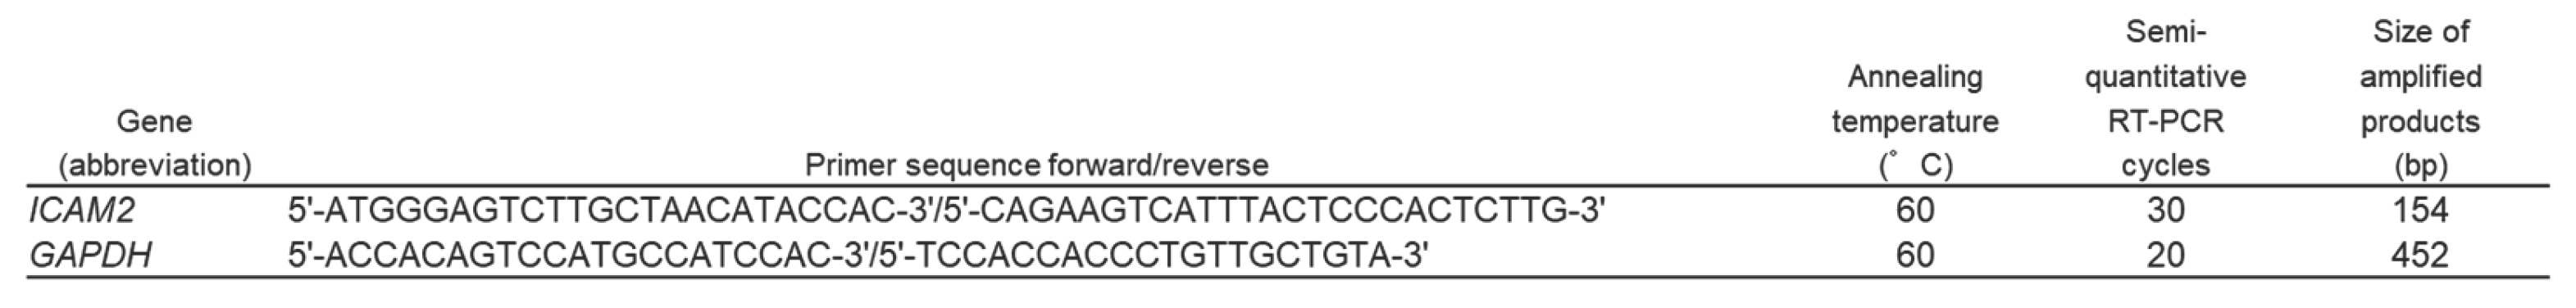
PCR was performed using Platinum Taq DNA polymerase (Invitrogen) in a PCR Thermal Cycler Dice (Takara Bio Inc.) under the following conditions: 94°C for 2 min and then the appropriate number of cycles at 94°C for 30 s; appropriate annealing temperature for 30 s; 72 °C for 30 s, and finally 72 °C for 7 min. Primer sequences, annealing temperatures, cycle number, and product sizes for ICAM2 and glyceraldehyde3-phosphate dehydrogenase (GAPDH) are shown in Table 2. GAPDH primers were used as internal standards. All PCR assays were performed within the exponential amplification range. PCR products were separated by electrophoresis on 2% agarose gels (Seakem ME; BioWhittaker Molecular Applications, Rockland, ME) and photographed under ultraviolet excitation after ethidium bromide staining.
4.5. Flow Cytometry
The expression of cell surface antigens on HDPCs was analyzed by flow cytometry. Cells (2×10⁵/tube) were prepared as a single cell suspension by trypsin/EDTA digestion and resuspended in flow cytometry buffer (R&D Systems, Minneapolis, MN), then incubated with antibodies (10 mg/mL) specific for surface markers or isotype control antibodies (10 mg/mL) on ice for 45 minutes. Anti-CD102 (ICAM2)-PE antibodies (eBioscience, San Diego, CA) and mouse IgG-PE isotype control were used. Cells were washed with flow cytometry staining buffer and analyzed using an EC800 cell analyzer (Sony Biotechnology, Tokyo, Japan).
4.6. Rat Direct Pulp Capping Model
The procedure was conducted as previously reported [11,12]. We used 10-week-old male Wistar rats (Kyudo) that were anesthetized with 0.15 mg/kg of medetomidine hydrochloride (Kyoritsu Seiyaku, Tokyo, Japan), 2 mg/kg of midazolam (Sandoz, Tokyo, Japan) and 2.5 mg/kg of butorphanol tartrate (Meiji Seika Pharma, Tokyo, Japan) administered by intraperitoneal injection. The access cavity was created with a #1/2 round steel bur (Dentsply Maillefer, Tienen, Belgium) on the occlusal surface of the upper left first molar and pulp was exposed using a sterile dental explorer. Direct pulp capping was performed with MTA cement (ProRoot, Dentsply Sirona, Charlotte, NC) and covered with glass ionomer cement (Fuji IX, GC Corporation, Tokyo, Japan). The upper right first molar of the same animal served as a control. The animals were transcardially perfused with 4% PFA at 1, 3, 5, 7 and 14 days after treatment. All procedures were approved by the Animal Ethics Committee of Kyushu University.
4.7. Immunofluorescent Staining
Tissue sections were deparaffinized and nonspecific antigens were blocked with 2% bovine serum albumin (BSA; Nacalai Tesque, Kyoto, Japan) in PBS for 1 hour at room temperature (RT). A rabbit polyclonal anti-ICAM2 antibody (1:50 dilution; Abcam) and normal rabbit IgG (Cell Signaling Technology, Danvers, MA) were applied as the primary antibody for 1 hour at RT. Following washing with PBS, sections were then incubated with an Alexa 488-conjugated chicken anti-rabbit IgG secondary antibody (1:200 dilution; Invitrogen) for 30 min at RT. Subsequently, sections were counterstained with 4✺,6-diamidino-2-phenylindole (DAPI; Vector Laboratories, Burlingame, CA). Tissue was imaged and analyzed using a BZ-9000 fluorescence microscope (Keyence Corporation).
4.8. Small Interfering RNA Transfection
Small interfering RNA (siRNA) for human ICAM2 (MISSION siRNA, Sigma-Aldrich, St. Louis, MO) or human control siRNA (MISSION siRNA Universal Negative Control; Sigma-Aldrich) were introduced into HDPCs using Lipofectamine RNAiMAX (Invitrogen), according to the manufacturer’s instructions, as described previously (14Hasegawa et al., 2018). Briefly, HDPCs were seeded onto 24-well plates (Becton Dickinson Labware, Lincoln Park, NJ) at a density of 1×10⁴ cells per well in Opti-MEM (Invitrogen) containing 10% FBS. After the cells reached 50%–70% confluency, siRNA was transduced. The siRNA-lipid complex was prepared by mixing 10 pmol siRNA and 1.5 µL of Lipofectamine RNAiMAX in 50 µL Opti-MEM. The complex was incubated for 5 min at room temperature, then added to cells and the mixture was incubated for 48 h.
4.9. Odontoblast-like Differentiation Assay
Cells were seeded at 2×10⁴ cells per well in 24-well plates (Becton Dickinson Labware) and cultured in 10% FBS/α-MEM as control medium (CM) or in CM containing 2 mM β-glycerophosphate (Sigma-Aldrich), 50 mg/ml ascorbic acid (Nacalai Tesque) and 10-7 M dexamethasone (Merck Millipore) as odontoblast-like differentiation medium (DM) [34]. Half of the medium in each well was exchanged every 2 days. After 4 weeks of culture, cells were fixed with 4% paraformaldehyde (PFA; Merck Millipore) and then washed with distilled water and exposed to alizarin red S (ARS; Sigma-Aldrich) stain as described previously [35]. The ARS-positive regions were imaged and measured using a Biozero digital microscope (Keyence Corporation). Total RNA was isolated from cells after 5 days of culture by a phenol/chloroform method [36] using TRIzol Reagent (Invitrogen) and chloroform (Nacalai Tesque), followed by alcohol precipitation.
4.10. Magnetic-Activated Cell Sorting (MACS)
HDPCs were sorted via MACS using a bead-conjugated antibody against CD102 (ICAM2; Miltenyi Biotec, Bergisch Gladbach, Germany) in accordance with the manufacturer’s instructions. Briefly, 6×10⁶ HDPCs were suspended in Flow Cytometry Staining Buffer (R&D Systems, Minneapolis, MN) and centrifuged at 300 xg for 10 min, resuspended in 80 µL of MACS buffer (Miltenyi Biotec) with 20 µL CD102 microbeads, and incubated in the dark at 4°C for 15 min. Cells were then washed with MACS buffer, resuspended in 500 µL MACS buffer, and loaded onto an LD column (Miltenyi Biotec) placed in the magnetic field of a MidiMACS separator (Miltenyi Biotec). Unlabeled cells that passed through the column were collected in a tube (ICAM2- HDPCs). Labeled cells that remained inside the column were flushed with buffer and collected in a different tube (ICAM2+ HDPCs).
4.11. Statistical Analysis
All data were obtained from more than three independent experiments and were presented as mean ± SD. The statistical analysis was performed by a one-way ANOVA, followed by the Bonferroni post hoc test. The normality of the data distribution was validated by the Shapiro–Wilk normality test before performing one-way ANOVA analysis. Statistical significance was defined as a p-value < 0.05.
5. Conclusions
Our results suggest that ICAM2-expressing pulp cells are recruited to the pulp capping area during reparative dentin formation after pulp capping and secrete proteins that inhibit odontoblast-like differentiation. This may contribute to the restoration of pulp homeostasis by balancing the promotion of reparative dentin formation by pulp capping. The findings from this study may help elucidate the poorly understood molecular mechanisms underlying reparative dentin formation and homeostasis after pulp capping and may contribute to the future development of pulp conservation therapy.
Author Contributions
Conceptualization, K.T. and D.H.; methodology, K.T. and Y.H.; validation, K.T., D.H. and H.M.; formal analysis, K.T. and D.H.; investigation, K.T.; resources, Y.H.; data curation, D.H. and H.Z.; writing—original draft preparation, K.T.; writing—review and editing, D.H. and H.M.; visualization, K.T. and H.Z.; supervision, D.H.; project administration, D.H. and H.M.; funding acquisition, D.H. and H.M. All authors have read and agreed to the published version of the manuscript.
Funding
This work was supported by JSPS KAKENHI grant numbers JP22K21018, JP24K12948, and JP22H03270.
Institutional Review Board Statement
The study was conducted in accordance with the Declaration of Helsinki, and approved by the regulation of the Research Ethics Committee, Kyushu University (approval number: 20A-3). The animal study protocol was approved by the Animal Ethics Committee of Kyushu University (approval number: A20-210-0).
Informed Consent Statement
Informed consent was obtained from all subjects involved in the study.
Data Availability Statement
The datasets generated during and/or analyzed during the current study are available from the corresponding author on reasonable request.
Acknowledgments
We thank Leah Cannon, PhD, from Edanz (https://jp.edanz.com/ac) for editing a draft of this manuscript. We also thank Drs. Hamano, Sugii, Yoshida, Itoyama, Kaneko, Kadowaki, and Tomokiyo for their great support in this work.
Conflicts of Interest
The authors have no conflicts of interest associated with this manuscript.
Abbreviations
The following abbreviations are used in this manuscript:
| MTA | mineral trioxide aggregate |
| ICAM2 | intercellular adhesion molecule 2 |
| HDPCs | human dental pulp cells |
| MACS | magnetic cell sorting |
| DSPP | dentin sialophosphoprotein |
| TH | tyrosine hydroxylase |
| OPN | osteopontin |
| βig-h3 | transforming growth factor-β-induced gene product-h3 |
| DMP1 | dentin matrix acidic phosphoprotein 1 |
| RT-PCR | reverse transcription polymerase chain reaction |
| α-MEM | alpha minimum essential medium |
| FBS | fetal bovine serum |
| SD rats | Sprague-Dawley rats |
| PFA | paraformaldehyde |
| PBS | phosphate-buffered saline |
| EDTA | ethylenediaminetetraacetic acid |
| H&A | hematoxylin and eosin |
| GAPDH | glyceraldehyde3-phosphate dehydrogenase |
| BSA | bovine serum albumin |
| RT | room temperature |
| siRNA | small interfering RNA |
| CM | control medium |
| DM | differentiation medium |
| ARS | alizarin red S |
References
- Goldberg M, Njeh A, Uzunoglu E. Is Pulp Inflammation a Prerequisite for Pulp Healing and Regeneration? Mediat Inflamm. 2015; 2015:347649.
- Su Y, Wang C, Ye L. Healing Rate and Post-obturation Pain of Single- versus Multiple-visit Endodontic Treatment for Infected Root Canals: A Systematic Review. J Endod. 2011; 37,125–132.
- Tang W, Wu Y, Smales RJ. Identifying and reducing risks for potential fractures inendodontically treated teeth. J Endod. 2010, 36, 609–617. [Google Scholar] [CrossRef] [PubMed]
- Tecles P, Laurent V. Aubut. Human tooth culture: a study model for reparative dentinogenesis and direct pulp capping materials biocompatibility. J Biomed Mater Res B Appl Biomater, 2008; 85 (1), 180-187.
- Zhu C, Ju B, Ni R. Clinical outcome of direct pulp capping with MTA or calcium hydroxide: A systematic review and meta-analysis. Int J Clin Exp Med. 2015; 8:17055–17060.
- Hilton TJ, Ferracane JL, Mancl L. Northwest Practice-based Research Collaborative in Evidence-based Dentistry (NWP) Comparison of CaOH with MTA for direct pulp capping: A PBRN randomized clinical trial. J Dent Res. 2013; 92((Suppl. 7)), 16S–22S.
- Farsi N, Alamoudi N, Balto K, Al Mushayt A. Clinical assessment of mineral trioxide aggregate (MTA) as direct pulp capping in young permanent teeth. J Clin Pediatr Dent., 2006; 31, 72–76.
- Gahmberg, CG. Leukocyte adhesion: CD11/CD18 integrins and intercellular adhesion molecules. Curr Opin Cell Biol. 1997, 9, 643–650. [Google Scholar] [CrossRef] [PubMed]
- Gahmberg CG, Tolvanen M, Kotovuori P. Leukocyte adhesion--structure and function of human leukocyte beta2-integrins and their cellular ligands. Eur J Biochem 1997; 245 (2), 215–232.
- Li X, Akiyama M, Nakahama K, Koshiishi T, Takeda S, Morita I. Role of intercellular adhesion molecule-2 in osteoclastogenesis. Genes Cells, 2012; 17, 568–575.
- Yoshida S, Wada N, Hasegawa D, Miyaji H, Mitarai H, Tomokiyo A, Hamano S, Maeda H. Semaphorin 3A induces odontoblastic phenotype in dental pulp stem cells. J Dent Res. 2016, 95, 1282–1290. [Google Scholar] [CrossRef] [PubMed]
- Kadowaki M, Yoshida S, Itoyama T, Tomokiyo A, Hamano S, Hasegawa D, Sugii H, Kaneko H, Sugiura R, Maeda H. Involvement of M1/M2 Macrophage Polarization in Reparative Dentin Formation. Life (Basel), 2022; 12(11), 1812.
- Serita S, Tomokiyo A, Hasegawa D, Hamano S, Sugii H, Yoshida S, Mizumachi H, Mitarai H, Monnouchi S, Wada N, Maeda. Transforming growth factor-β-induced gene product-h3 inhibits odontoblastic differentiation of dental pulp cells. Arch Oral Biol, 2017; 78, 135–143.
- Hasegawa D, Wada N, Yoshida S, Mitarai H, Arima M, Tomokiyo A, Hamano S, Sugii H, Maeda H. Wnt5a suppresses osteoblastic differentiation of human periodontal ligament stem cell-like cells via Ror2/JNK signaling. J Cell Physiol, 2018; 233, 1752-1762.
- Edgar LM, Víctor MMN, Edelmiro SO, E. Mesenchymal stem cells derived from dental pulp: a review. Stem Cells Int, 2016; Article 4709572.
- Simon SR, Berdal A, Cooper PR, Lumley PJ, Tomson PL, Smith AJ. Dentin-pulp complex regeneration: from lab to clinic. Adv. Dent Res. 2011; 23 (3), 340-345.
- Gronthos S, Mankani M, Brahim J, Robey PG, Shi S. Postnatal human dental pulp stem cells (DPSCs) in vitro and in vivo. Proc Natl Acad Sci U S A 2000; 97, 13625-13630.
- Gronthos S, Brahim J, Li W, Fisher LW, Cherman N, Boyde A, DenBesten P, Gehron RP, Shi S. Stem cell properties of human dental pulp stem cells. J Dent Res. 2002, 81, 531–535. [Google Scholar] [CrossRef] [PubMed]
- Kuratate M, Yoshiba K, Shigetani Y, Yoshiba N, Ohshima H, Okiji T. Immunohistochemical analysis of nestin, osteopontin, and proliferating cells in the reparative process of exposed dental pulp capped with mineral trioxide aggregate. J Endod. 2008; 34(8), 970-974.
- Shigetani Y, Yoshiba K, Kuratate M, Takei E, Yoshiba N, Yamanaka Y, Ohshima H, Okiji T. Temporospatial localization of dentine matrix protein 1 following direct pulp capping with calcium hydroxide in rat molars. Int Endod J. 2015, 48(6), 573–581. [Google Scholar] [CrossRef] [PubMed]
- Fujino S, Hamano S, Tomokiyo A, Sugiura R, Yamashita D, Hasegawa D, Sugii H, Fujii S, Itoyama T, Miyaji H, Maeda H. Dopamine is involved in reparative dentin formation through odontoblastic differentiation of dental pulp stem cells. Sci Rep. 2023, 13(1), 5668. [Google Scholar] [CrossRef] [PubMed]
- Camilleri J, Montesin FE, Brady K, Sweeney R, Curtis RV, Ford TR. The constitution of mineral trioxide aggregate. Dent Mater. 2005, 21, 297–303. [Google Scholar] [CrossRef]
- Yamashita K, Tomokiyo A, Ono T, Ipposhi K, Alhasan MA, Tsuchiya A, Hamano S, Sugii H, Yoshida S, Itoyama T, Maeda H. Mineral trioxide aggregate immersed in sodium hypochlorite reduce the osteoblastic differentiation of human periodontal ligament stem cells. Sci Rep. 2021, 11, 22091. [Google Scholar] [CrossRef]
- Li Z, Cao L, Fan M, Xu Q. Direct Pulp Capping with Calcium Hydroxide or Mineral Trioxide Aggregate: A Meta-analysis. J Endod. 2015; 41, 1412; 1417.
- Kunert M, Lukomska-Szymanska M. Bio-Inductive Materials in Direct and Indirect Pulp Capping—A Review Article. Materials, 2020; 13, 1204.
- Chicarelli LPG, Webber MBF, Amorim JPA, Rangel A, Camilotti V, Sinhoreti MAC, Mendonça MJ. Effect of Tricalcium Silicate on Direct Pulp Capping: Experimental Study in Rats. Eur J Dent, 2021; 15, 101–108.
- Ipposhi K, Tomokiyo A, Ono T, Yamashita K, Alhasan MA, Hasegawa D, Hamano S, Yoshida S, Sugii H, Itoyama T, Ogawa M, Maeda H. Secreted Frizzled-Related Protein 1 Promotes Odontoblastic Differentiation and Reparative Dentin Formation in Dental Pulp Cells. Cells, 2021; 10, 2491.
- Rombouts C, Jeanneau C, Bakopoulou A. Dental Pulp Stem Cell Recruitment Signals within Injured Dental Pulp Tissue. Dent J. 2016, 4, 8. [Google Scholar] [CrossRef] [PubMed]
- Couve E, Schmachtenberg O. Schwann Cell Responses and Plasticity in Different Dental Pulp Scenarios. Front Cell Neurosci. 2018, 12, 299. [Google Scholar] [CrossRef] [PubMed]
- Eramo S, Natali A, Pinna R, Milia E. Dental pulp regeneration via cell homing. Int Endod J. 2018, 51, 405–419. [Google Scholar] [CrossRef] [PubMed]
- Maeda K, Kobayashi Y, Udagawa N, Uehara S, Ishihara A, Mizoguchi T, Kikuchi Y, Takada I, Kato S, Kani S, Nishita M, Marumo K, Martin TJ, Minami Y, Takahashi N. Wnt5a-Ror2 signaling between osteoblast-lineage cells and osteoclast precursors enhances osteoclastogenesis. Nat Med, . 2012; 18, 405-412.
- Yamada A, Iwata T, Yamato M, Okano T, Izumi Y. Diverse functions of secreted frizzled-related proteins in the osteoblastogenesis of human multipotent mesenchymal stromal cells. Biomaterials, 2013; 34; 3270-3208.
- Wada N, Maeda H, Tanabe K, Tsuda E, Yano K, Nakamuta H, Akamine A. Periodontal ligament cells secrete the factor that inhibits osteoclastic differentiation and function: the factor is osteoprotegerin/osteoclastogenesis inhibitory factor. J Periodontal Res, . 2001; 36, 56-63.
- Mizumachi H, Yoshida S, Tomokiyo A, Hasegawa D, Hamano S, Yuda A, Sugii H, Serita S, Mitarai H, Koori K, Wada N, Maeda H. Calcium-sensing receptor-ERK signaling promotes odontoblastic differentiation of human dental pulp cells. Bone. 2017; 101, 191–201.
- Wada N, Maeda H, Hasegawa D, Gronthos S, Bartold PM, Menicanin D, Fujii S, Yoshida S, Tomokiyo A, Monnouchi S, Akamine A. Semaphorin3A induces mesenchymal-stem-like properties in human periodontal ligament cells. Stem Cells Dev, 2014; 23; 2225-2236.
- Chomczynslci P, Sacchi N. Single-step method of RNA isolation by acid guanidinium thiocyanate-phenol chloroform extraction. Anal Biochem. 1987; 162, 156–159.
Figure 1.
Figure 1. ICAM2 localization in rat dental pulp tissues and ICAM2 expression in human dental pulp cells. (A) The mRNA expression of ICAM1, ICAM2 (black column), ICAM3, ICAM4, ICAM5 in HDPC-5Y was assessed by quantitative RT-PCR. It was normalized against β-actin expression. All values are means ± S.D. (error bars) of quadruplicate assays. **p<0.01. (B) Hematoxylin-eosin staining of tissue sections (sagittal sections) of mandibular first molars from SD rats. The right panel is the higher magnification view of boxed area in the left panel. PU: dental pulp tissue, De: Dentin. (C-E) Immunofluorescence staining of ICAM2 in the normal dental pulp tissue (C). The higher magnification view of boxed area in C (D). Positive staining was indicated by arrow heads (odontoblasts) and arrow (dental pulp cells). Negative control: rabbit IgG (cIgG; E). Nuclei were stained with DAPI (Blue). Bars = 100 μm. (F, G) The expression of ICAM2 in HDPC-5Y was examined by immunofluorescence staining. Anti-ICAM2: Green (F), anti-rabbit IgG (control IgG: cIgG; G). Nuclei were stained with DAPI (Blue). Arrow heads indicate ICAM2-positive dental pulp cells. Bars = 100 μm. (H) The gene expression of ICAM2 in three HPDCs (HDPC-5Y, 5L and 5L) was examined by semi-quantitative RT-PCR. It was normalized against GAPDH expression. (I) The expression intensities of ICAM2 (CD102) of HDPC-5Y (orange line) was demonstrated by flow cytometry. In the gated region, positive cells. Gray line indicates negative control (rabbit IgG).
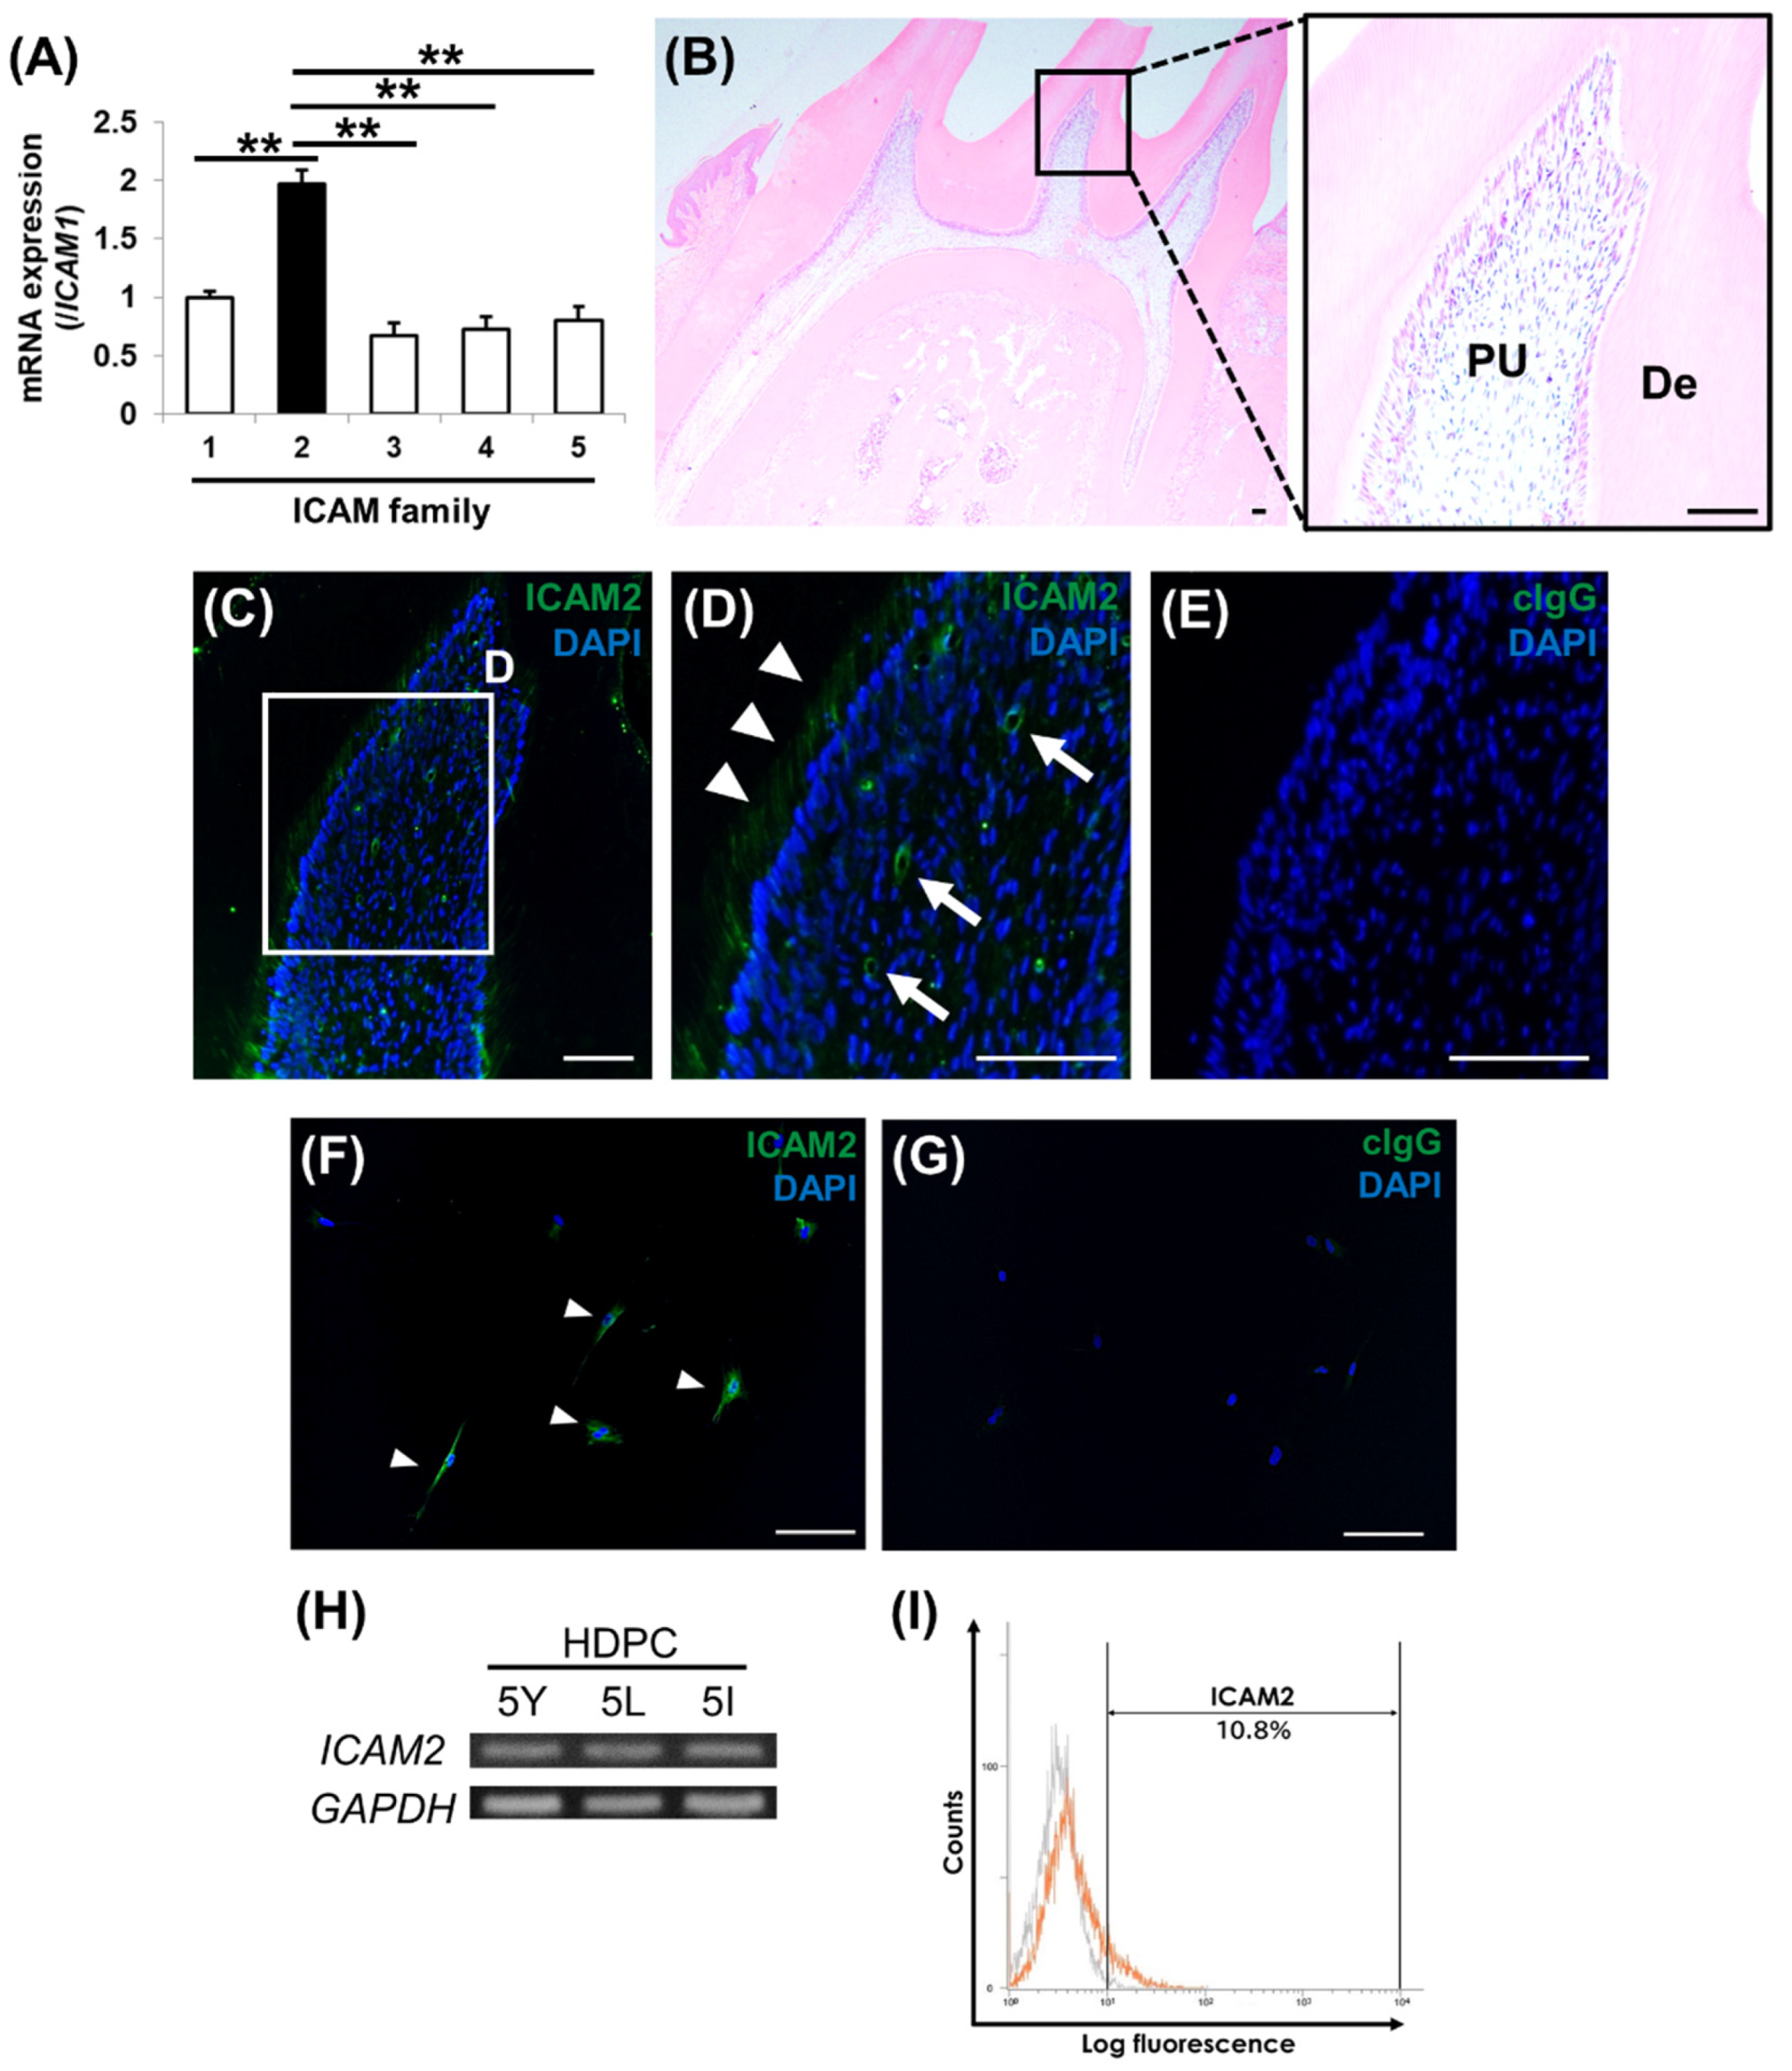
Figure 2.
ICAM2 expression in rat dental pulp tissue after direct pulp capping. (A, B) Hematoxylin-eosin staining of the rat dental pulp tissue after 7 days of treatment. (B) Higher magnification views of the boxed area in A. DP: dental pulp tissue, DE: dentin, Arrow head: reparative dentin. Bars = 100 μm. (C-I) Immunofluorescence staining of ICAM2 in the normal dental pulp tissue (C) and dental pulp tissue at 1 (D), 3 (E), 5 (F), 7 (G), and 14 days (H) post-direct pulp capping operation. Anti-ICAM2 and cIgG, Nuclei were stained with DAPI (Blue). Bars = 100 μm. (I) The number of ICAM2 immuno-positive cells was quantified. All values are means ± S.D. (error bars) of quadruplicate assays. **p<0.01.
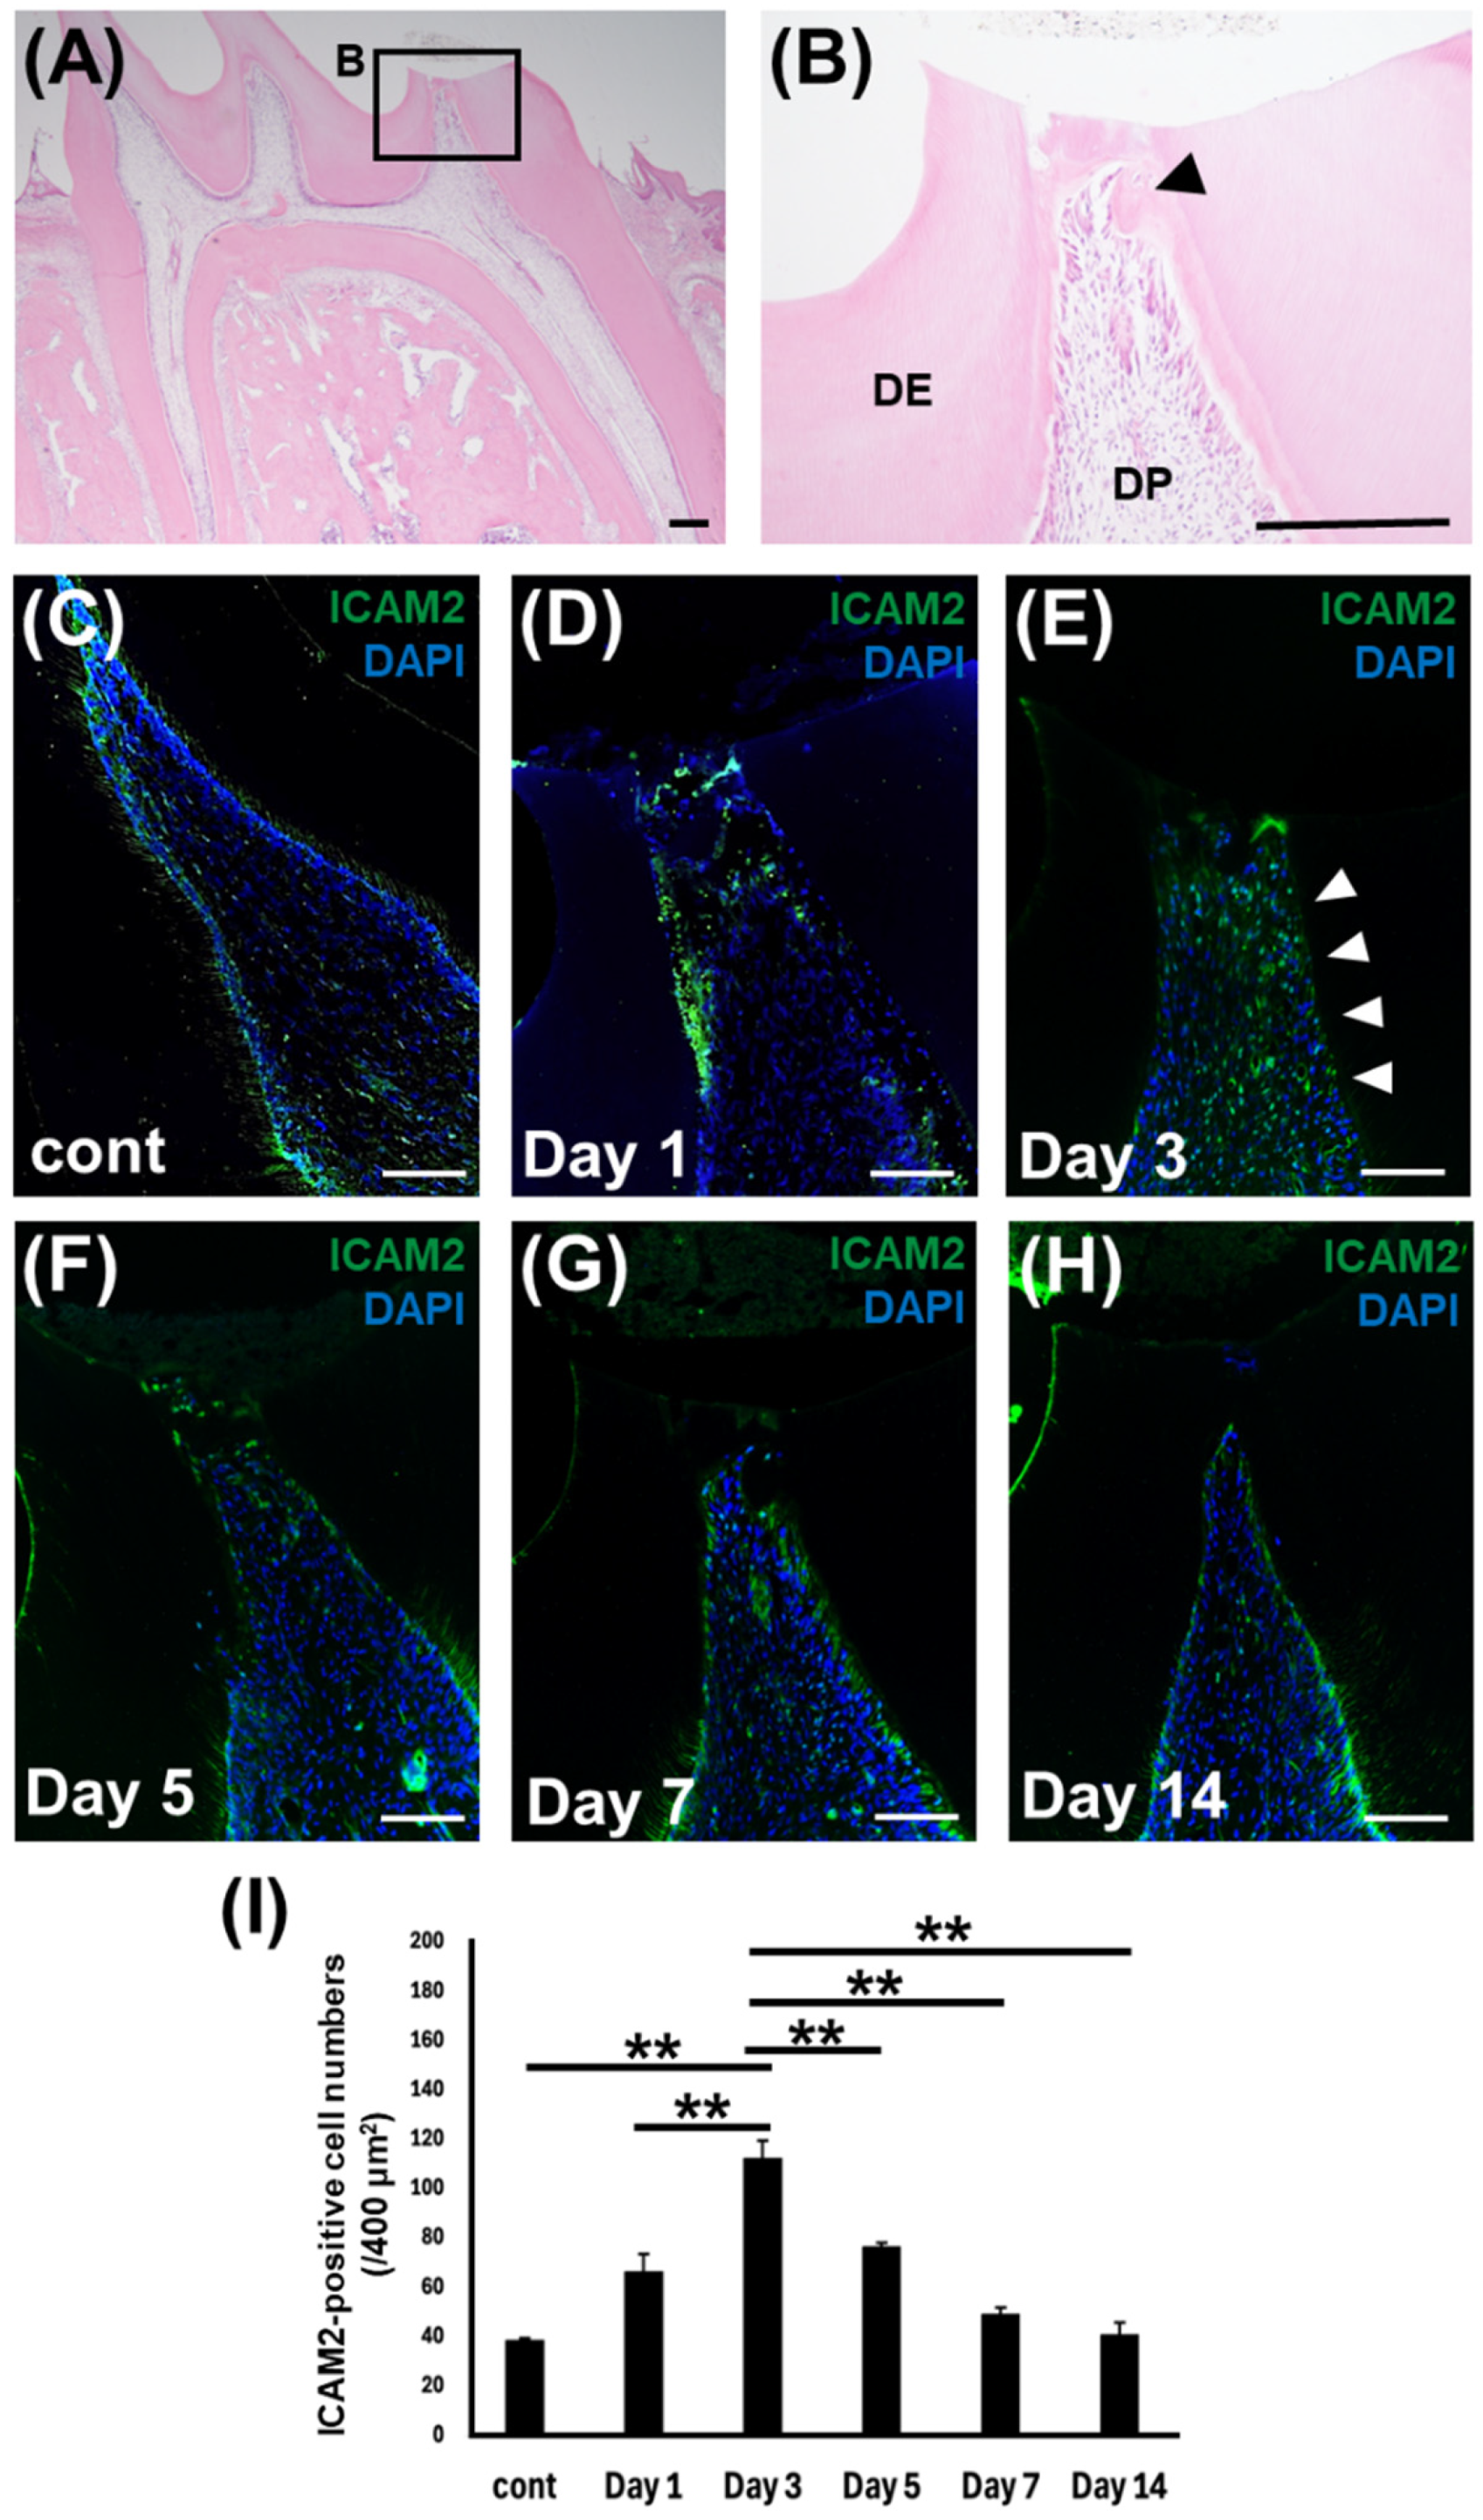
Figure 3.
Figure 3. Effect of ICAM2 knockdown on odontoblast-like differentiation of HDPCs. (A) The expression of ICAM2 mRNA in HDPC-5Y transfected with negative control siRNA (siCont.) or ICAM2 siRNA (siICAM2) was assessed by quantitative RT-PCR. (B, C) The formation of mineralized nodules in HDPC-5Y transfected with siCont or siICAM2 was examined by Alizarin red S (ARS) staining after culture in osteoblastic differentiation medium (DM) for 3 weeks. (C) The graph shows quantitative analysis of the area of each ARS-positive region, which was imaged and measured using a Biozero digital microscope. (D) The gene expression of DSPP, Nestin, TH and OPN in HDPC-5Y transfected with siCont or siICAM2, which were cultured with DM for 7 days, was assessed by quantitative RT-PCR. It was normalized against β-actin expression. All values are means ± S.D. (error bars) of quadruplicate assays. **p<0.01, *p<0.05.
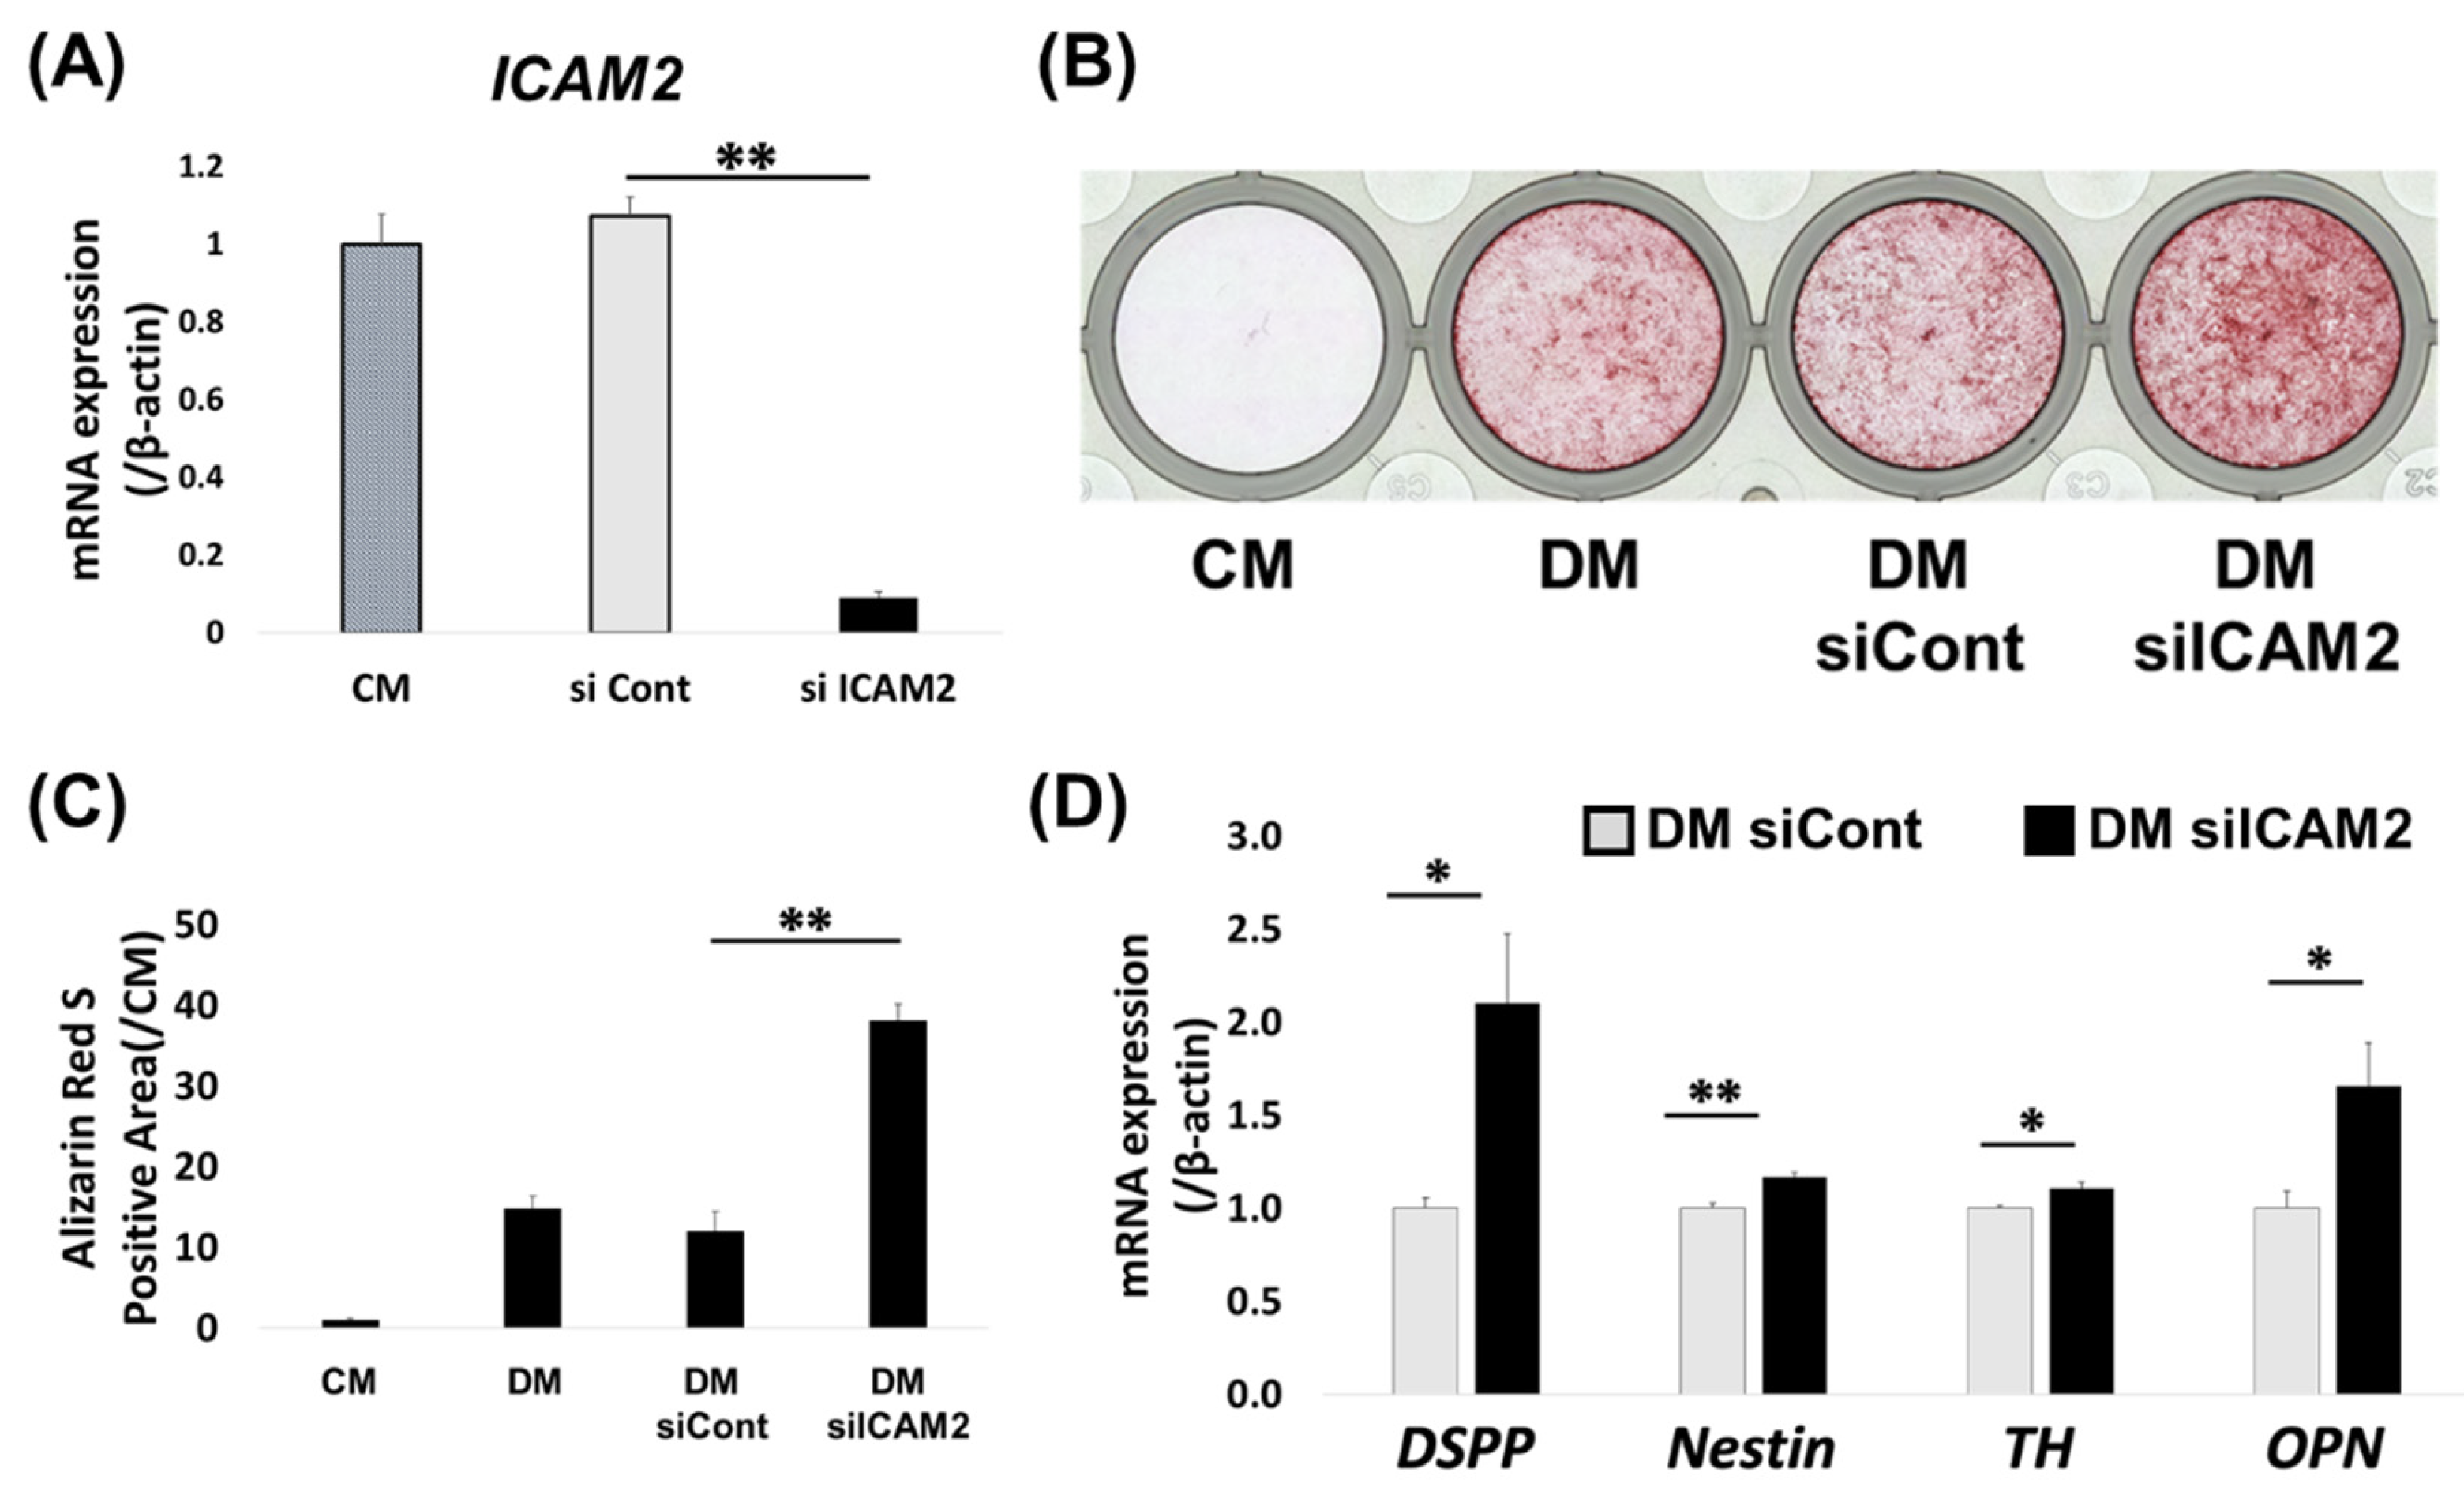
Figure 4.
Effect of ICAM2-expressing HDPCs on odontoblast-like differentiation. (A) Schema of HDPCs separated using magnetic cell sorting (MACS) and the culture supernatants of each separated cell collected. (B) The gene expression of ICAM2 in ICAM2-negative cells (ICAM2(-) HDPCs) and ICAM2-positive cells (ICAM2(+) HDPCs) after separation using MACS was assessed by quantitative RT-PCR. (C) The formation of mineralized nodules in HDPC-5Y was examined by ARS staining after culture in DM with ICAM2(-) HDPCs or ICAM2(+) HDPCs supernatant for 3 weeks. (D) The graph shows quantitative analysis of the area of each ARS-positive region, which was imaged and measured using a Biozero digital microscope. (E) The gene expression of DSPP, Nestin, TH and OPN in HDPC-5Y cultured in DM with ICAM2(-) HDPCs or ICAM2(+) HDPCs supernatant for 7 days, was assessed by quantitative RT-PCR. (F) The gene expression of βig-h3 and Wnt5a in HDPC-5Y cultured in DM with ICAM2(-) HDPCs or ICAM2(+) HDPCs supernatant for 7 days, was assessed by quantitative RT-PCR. It was normalized against β-actin expression. All values are means ± S.D. (error bars) of quadruplicate assays. **p<0.01, *p<0.05.
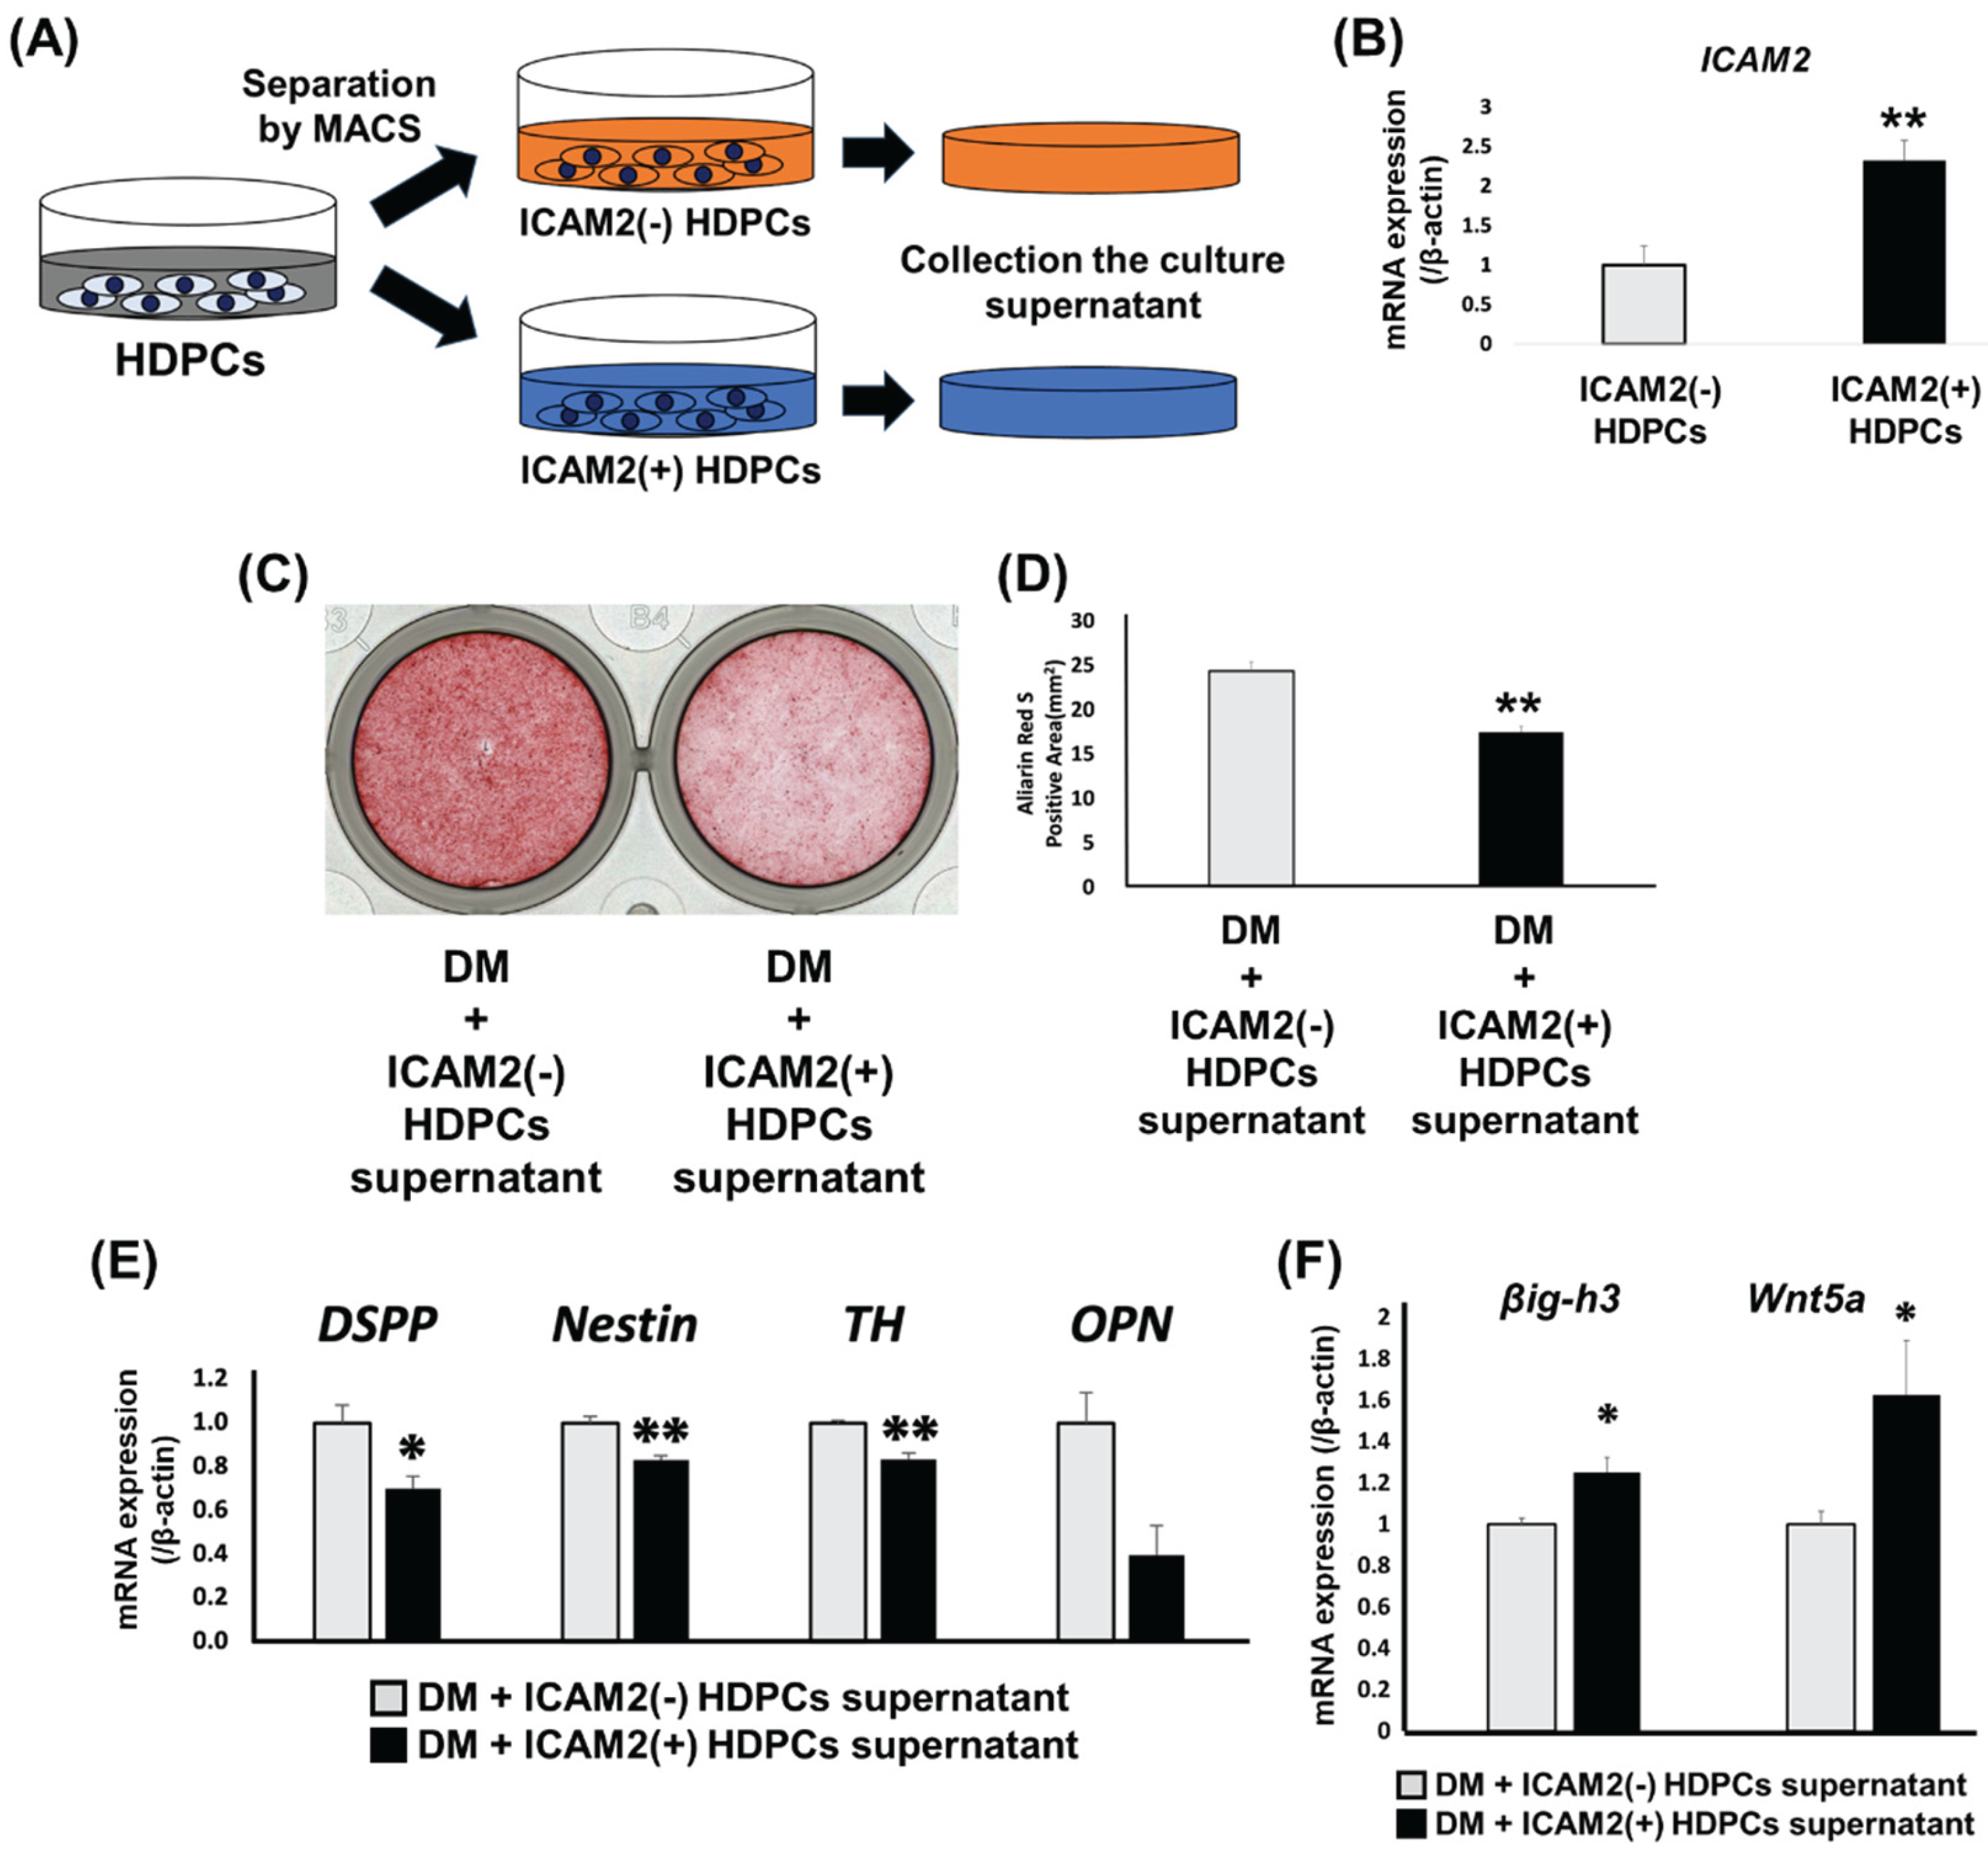

Table 1.
Primer sequences, annealing temperatures, cycle numbers, and product sizes for quantitative RT-PCR.
Table 1.
Primer sequences, annealing temperatures, cycle numbers, and product sizes for quantitative RT-PCR.
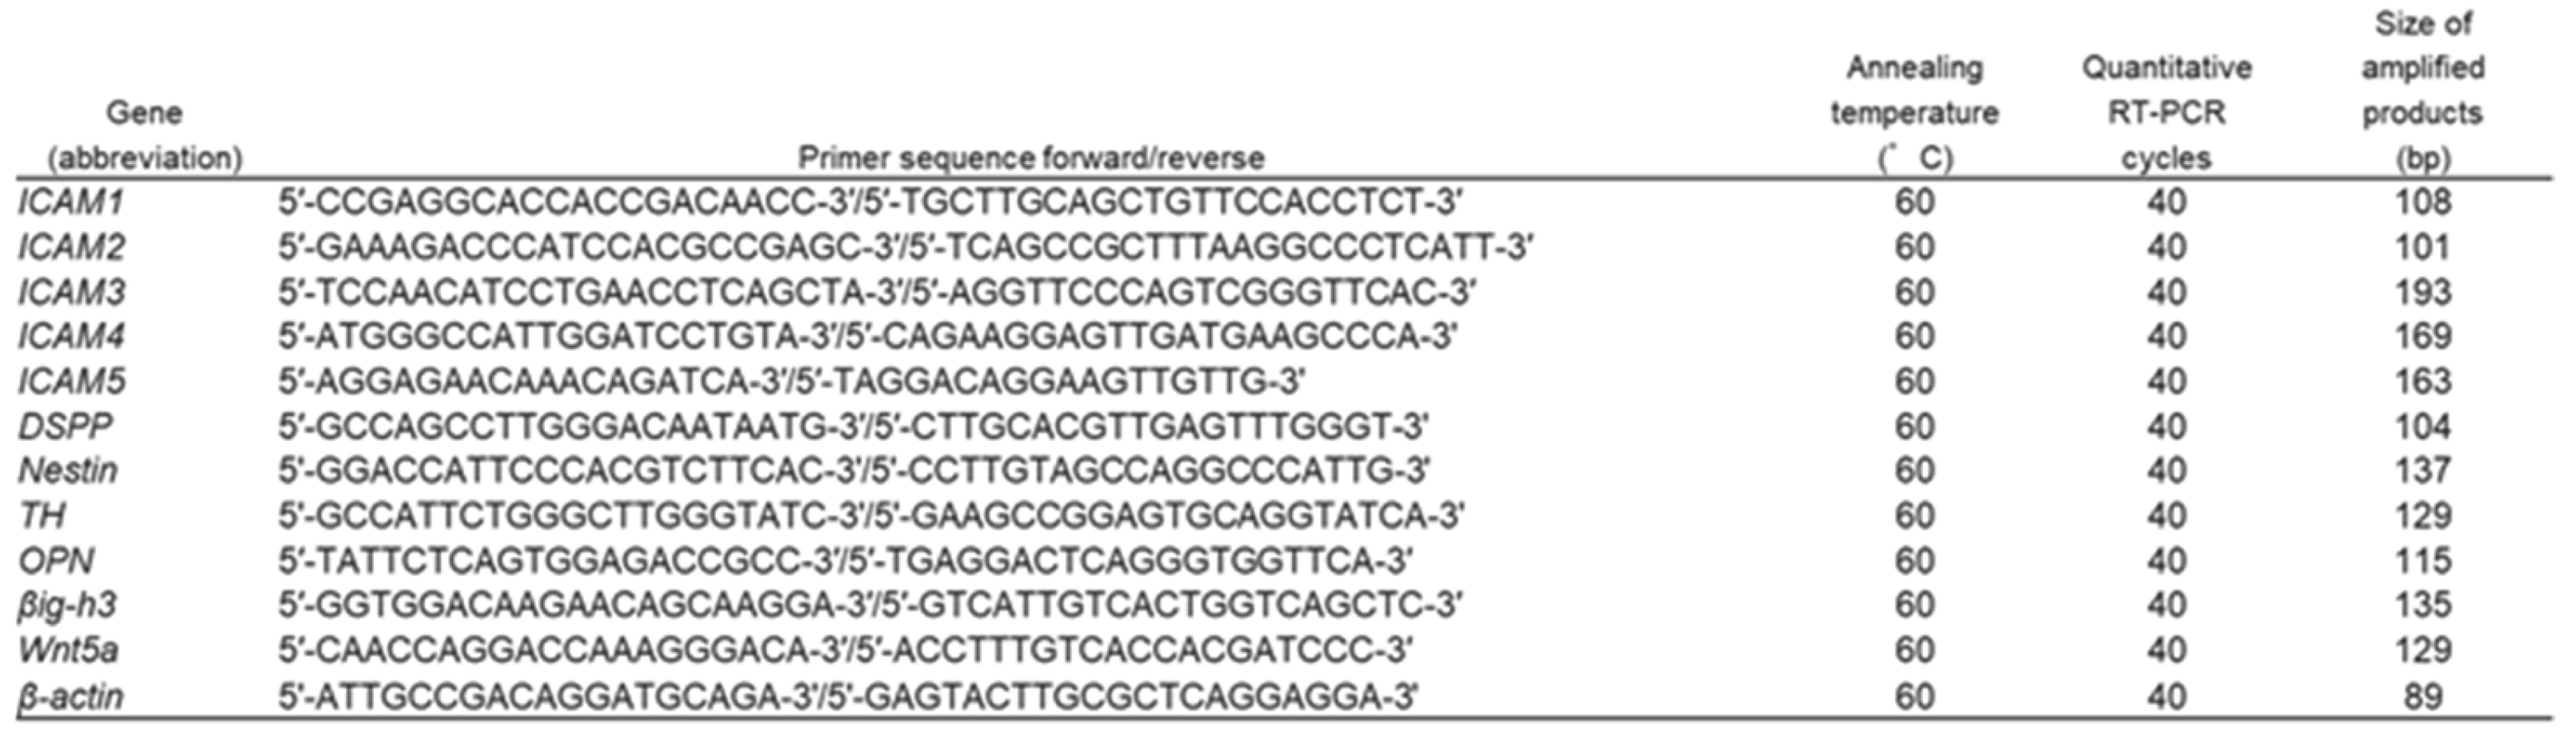
Table 2.
Primer sequences, annealing temperatures, cycle numbers, and product sizes for semi-quantitative RTPCR.
Table 2.
Primer sequences, annealing temperatures, cycle numbers, and product sizes for semi-quantitative RTPCR.
Disclaimer/Publisher’s Note: The statements, opinions and data contained in all publications are solely those of the individual author(s) and contributor(s) and not of MDPI and/or the editor(s). MDPI and/or the editor(s) disclaim responsibility for any injury to people or property resulting from any ideas, methods, instructions or products referred to in the content. |
© 2025 by the authors. Licensee MDPI, Basel, Switzerland. This article is an open access article distributed under the terms and conditions of the Creative Commons Attribution (CC BY) license (http://creativecommons.org/licenses/by/4.0/).
Copyright: This open access article is published under a Creative Commons CC BY 4.0 license, which permit the free download, distribution, and reuse, provided that the author and preprint are cited in any reuse.


