Submitted:
25 August 2025
Posted:
26 August 2025
You are already at the latest version
Abstract
Elevated levels of circulating β2-microglobulin (β2M) are linked to an increased risk of developing hypertension and hyperglycemia. The mechanism of this association, however, remains unclear. One hypothesis which has recently gained traction is that environmental pollutants, particularly cadmium (Cd) and lead (Pb), by inducing kidney tubular cell toxicity, promote the development and progression of diabetic kidney disease. Herein, we analyzed data from a Thai cohort of 72 diabetics and 65 non-diabetic controls who were chronically exposed to low levels of Cd and Pb. Serum concentrations of β2M inversely correlated with the estimated glomerular filtration rate (eGFR) (r = −0.265), and directly with age (r = 0.200), fasting plasma glucose (r = 0.210) and systolic blood pressure (r = 0.229). The prevalence odds ratio (POR) for hyperglycemia increased 7.7% per every 1-year increase in age (p = 0.004), and increased 3.9-fold, 3.1-fold, and 3.7-fold in those with serum β2M levels ≥ 5 mg/L (p = 0.002), Cd/Pb exposure category 2 (p = 0.021), and category 3 (p = 0.014), respectively. The POR for hypertension was increased 2.9-fold, 3-fold, and 4-fold by hyperglycemia (p = 0.011), Cd/Pb exposure category 2 (p = 0.050) and category 3 (p = 0.008). The POR for albuminuria was increased 3.5-fold by hyperglycemia (p = 0.005). In conclusion, albuminuria was particularly pronounced in diabetics who have serum β2M above 5 mg/dL plus chronic exposure to low-dose Cd and Pb.
Keywords:
cadmium
; diabetic kidney disease
; hyperglycemia
; hypertension
; lead
; serum β2-microglobulin
1. Introduction
Hypertension, defined as systolic blood pressure (SBP) and/or diastolic blood pressure (DBP) ≥ 140/90 mm Hg, affects approximately one third of the adult population in economically developed countries [1,2]. Resistance hypertension in whom a regular antihypertensive medication formula fails to achieve target blood pressure control can be found in 10-15% of those with primary or essential hypertension [3,4].
Epidemiological data linking risk for kidney injury and hypertension to the environmental pollutants cadmium (Cd) and lead (Pb) are abundant [5,6,7,8], given that hypertension is known to be both a cause and a consequence of kidney damage [9,10,11,12,13,14]. A dose-response relationship between Cd exposure and hypertension risk has been reported in in a meta-analysis by Verzelloni et al. (2024) [15].
Concerningly, hypertension and diabetes are major causes of kidney failure, the estimated glomerular filtration rate (eGFR) falls below 15 mL/min/1.73 m2), when dialysis or a kidney transplant is required for survival [16,17,18]. Surprisingly, however, studies into the effects of Cd and Pb exposure on diabetic kidneys are limited [19,20,21]. In a Dutch prospective cohort study, a high rate of eGFR deterioration was noted in patients with diabetes, exposed to Cd [19]. A cross-sectional study on U.S. population observed that Pb exposure may have increased risk of CKD, especially in non-smoking diabetic women with body mass index (BMI) higher than 25 kg/m2 [20]. In a cohort of Swedish women aged 64 years, an increased risk of elevated albumin excretion (15 mg/12 h) was found only in those with diabetes who had blood Cd within the top quartile [21].
This study was to investigate, within a case-control design, hypertension risk, fasting plasma glucose concentration ([Glc]p), eGFR, SBP, DBP, and albumin excretion in Cd and Pb exposed diabetics and matched controls. Also, it was to explore association of serum β2-microglobulin (β2M) with risk of hypertension and/or kidney damage in Cd- and Pb-exposed people with and without diabetes. We focused on potential role of circulating β2M because no prior knowledge to link hypertension in diabetics to the SH2B3-β2M axis of blood pressure regulation, which has been unveiled recently [22,23,24].
2. Results
2.1. Description of Participants
The characteristics of participants can be found in Table 1, where they were assigned according to the tertile of serum concentration of β2M ([β2M]s).
As data in Table 1 indicate, this cohort participants were predominantly women (78.1%), which distributed equally across the [β2M]s tertiles. The highest proportion of participants with diagnosed diabetes (72%), hypertension (69%), albuminuria (39%), fasting plasma glucose (FPG) ≥ 110 mg/dL (69.6%) and FPG ≥ 126 mg/dL (58.7%) were found in the [β2M]s top tertile. The parameters showing significant variations across the [β2M]s tertiles were SBP, eGFR, FPG, blood Cd and blood Pb concentrations. The variations in age, BMI, DBP, ECd/Ecr, ECd/Ccr, Ealb/Ecr (ACR) and Ealb/Ccr across the [β2M]s tertiles did not differ statistically as did the distribution of those with low eGFR.
2.2. Bivariate Correlation Analysis
The relationships of serum β2M with other variables were assessed with the Spearman’s rank correlation analysis. Nine variables tested were age, BMI, FPG, SBP/DBP, eGFR (a clinical kidney function measure), Ealb/Ccr (a sign of kidney damage and diabetic kidney disease), and toxic metal exposure, reflected by ECd/Ccr and blood Cd/Pb levels. Results are tabulated (Table 2).
Serum β2M concentration ([β2M]s) varied directly with age (r = 0.200), FPG (r = 0.210) and SBP (r = 0.229), while showing an inverse correlation with eGFR (r = −0.265). The strength of all four correlations were moderate. The correlation between [β2M]s and BMI, DBP, Ealb/Ccr, ECd/Ccr, and Cd/Pb exposure levels were statistically insignificant.
Interestingly, FPG varied directly with SBP (r = 0.250), Ealb/Ccr (r = 0.273) and Cd/Pb exposure (r = 0.181). Other notable correlations were SBP vs. Ealb/Ccr (r = 0.372), eGFR vs. ECd/Ccr (r = −0.227) and ECd/Ccr vs. Cd/Pb exposure categories (r = 0.301).
Because a reduction of eGFR to 60 mL/min/1.73 m2 or below signifies chronic kidney disease (CKD), and eGFR falls as blood pressure rises, the relationships of [β2M]s with SBP were examined further using scatterplots and regression analysis. Results are presented in Figure 1.
An association of SBP with [β2M]s was significant in both eGFR subgroups (Figure 1a). The SBP and [β2M]s association was especially strong in those with eGFR levels commensurate to CKD (R2 = 0.252). The association of SBP and [β2M]s in the normal eGFR group was also statistically significant although R2 value was small (0.039). However, unlike SBP, [β2M]s was associated in DBP only in the low eGFR group (R2 = 0.312) (Figure 1b).
Figure 2 provides additional subgroup analyses for Ealb/Ccr vs. blood pressure, given the moderate correlation between Ealb/Ccr and SBP (r = 0.372) evident from the correlation analysis and the fact that albuminuria is indicative of diabetic kidney disease.
2.3. Logistic Regresssion Model for Serum β2M Higher than the Median 5 mg/L
Logistic regression modeling was employed to identify determinants of high serum β2M concentrations, and the modelling results are presented in Table 3.
The prevalence odds ratio (POR) for a high serum β2M was influenced minimally by age, BMI, ECd/Ccr, gender, smoking, and hypertension. It was affected by two variables, diagnosed diabetes and eGFR. The POR for a high serum β2M rose 4-fold (p = 0.001) in people diagnosed with diabetes. A 4% decrease in the POR for the high serum β2M was associated with 1 mL/min/1.73 m2 higher eGFR (p = 0.005).
2.4. Logistic Regresssion Model for Hyperglycemia
To ascertain an association between [β2M]s ≥ 5 mg/L and diagnosed diabetes, logistic regression analyses of measured FPG was conducted. Two logistic regression models were undertaken, one of which was for FPG ≥ 110 mg/dL, and the other was for FPG ≥ 126 mg/dL (Table 4).
In those with a high serum β2M, the POR for FPG concentrations ≥110 mg/dL rose 3.4-fold (p = 0.002), and 2.8-fold (p = 0.004) in those with Cd/Pb exposure category 3. In comparison, the POR for FPG ≥ 126 mg/dL rose with age, a high serum β2M (POR 3.8, p = 0.002), Cd/Pb exposure category 2 (POR 3.1, p = 0.021), and category 3 (POR 3.7, p = 0.014). The POR for FPG ≥ 126 mg/dL increased 7.7% per every 1-year increase in age (p = 0.004).
2.5. Logistic Regresssion Model for Hypertension and Albuminuria
In the bivariate correlation analysis, FPG varied directly with SBP (r = 0.250), Ealb/Ccr (r = 0.273) and Cd/Pb exposure categories (r = 0.181). To further explore the interrelationships of these variables, additional logistic regressions were conducted for hypertension and albuminuria, and results are presented in (Table 5 and Table 6).
As data in Table 5 indicate, age, BMI, and gender had little effects on the POR for hypertension and albuminuria. The POR for hypertension was increased 7-fold in non-smokers (p = 0.020), 3.7-fold in those with FPG ≥ 110 mg/dL (p = 0.001), 3.1-fold and 4.4-fold in those with the Cd/Pb exposure category 2 (p = 0.046), and category 3 (p = 0.005). In comparison, the POR for albuminuria was increased 2.95-fold in those with FPG ≥ 110 mg/dL (p = 0.013), but was not affected by other six variables.
Data in Table 6 indicate that the POR for hypertension rose 8-fold in non-smokers (p = 0.018), while it rose 2.9-fold, 3-fold, and 4-fold in those with FPG ≥ 126 mg/dL (p = 0.011), Cd’Pb exposure category 1 (p = 0.050) and category (p = 0.008). The POR for albumin rose 3.5-fold in those with FPG ≥ 126 mg/dL (p = 0.005).
The scatterplots and regression analysis for Ealb/Ccr vs. FPG and Ealb/Ccr vs. blood pressure are presented in Figure 3.
Ealb/Ccr was associated with FPG only in participants who had hypertension (Figure 3a). The Ealb/Ccr and FPG association was much tighter in the low eGFR group (R2 = 0.303), compared to the normal eGFR group (R2 = 0.065) (Figure 3b). Ealb/Ccr varied more closely with SBP in the high serum β2M (R2 = 0.155), compared to the low β2M group (R2 = 0.099) (Figure 3c). Ealb/Ccr was associated with DBP only in the high serum β2M group (R2 = 0.103) (Figure 3d).
3. Discussion
3.1. Hypertension Associated with Hyperglycemia and Environmental Cd and Pb
Consistent with numerous literature reports, risk of hypertension among participants was increased by exposure to low doses of Cd and Pb (Table 5). Such low environmental exposure to Cd and Pb was suggested by mean values for blood Pb (4.49 mg/dL), blood Cd (0.57 µg/L) and the urinary Cd excretion rate (0.98 µg/g creatinine) (Table 1). These low exposure levels were comparable to those found in most environmentally exposed populations, reported in a recent dose-response meta-analysis [15]. Notably, risk of resistance hypertension in the representative U.S. population was increased 30-35% by Cd exposure, assessed with blood Cd levels [9]. Risk of hypertension in Korean population was increased 29, 47, and 78% by exposure to Pb and Cd only and Cd plus Pb, respectively [13].
Previously, rising SBP after Cd exposure has been causally linked to a fall of eGFR due to Cd-induced nephron destruction [25]. In the same study, a two-fold increase in risk of hypertension was associated with urinary Cd excretion of 1 µg/g creatinine, and a blood Cd of 0.61 µg/L. In line with such finding, herein, we observed an inverse correlation between SBP and Ccr-normalized Cd excretion rate (ECd/Ccr) (r = −0.227) (Table 2). A rise in SBP as eGFR falls, thus, explains a universally high prevalence of hypertension among those with low eGFR. (eGFR ≤ 60 mL/min/1.73 m2). Interestingly, a rapid fall in eGFR (≥ 3 mL/min/1.73 m2 per year) has been causally linked to Cd excretion in a prospective cohort study from Switzerland [26], but an effect of the eGFR decline on blood pressure was not investigated.
Another notable result was that risk of hypertension among participants was influenced also by hyperglycemia (FPG ≥ 110 and ≥ 126 mg/dL) (Table 5 and Table 6). In a bivariate analysis, FPG correlated positively with SBP (r = 0.250), albumin excretion (r = 0.273) and Cd/Pb exposure (r = 0.181) (Table 2). The increased risk of hypertension among those with hyperglycemia may be a consequence of kidney damage, assessed with elevated levels of albumin excretion. A nonlinear relationship was observed between FBG and ACR in a representative U.S. population [27]. In a Chinese prospective cohort of non-diabetics, the risk of incident albuminuria rose 71% per every 18 mg/dL increment of FPG level [28]. A higher risk of hypertension was associated with an elevation in ACR within the normal range in a meta-analysis, and ACR was suggested to be a predictor of incident hypertension in the general population [29].
3.2. The SH3B-β2M Axis: A Novel Blood Pressure Regulator
The protein β2M is a non-polymorphic and non-glycosylated low-molecular-weight protein, forming an extracellular domain of the class I human leukocyte antigens or class I major histocompatibility complex, which is shed into the blood stream [30,31]. Its involvement in blood pressure control and hypertension development were deduced from the genome-wide association [22], the single nucleotide polymorphism in the SH2B3 locus, which encodes for the regulator of cytokine signaling and cell proliferation [23], and a human longitudinal study [24]. Data from knockout mouse models have provided additional support to the involvement of SH3B-β2M axis in hypertension development plus kidney damage [23,24]. Comparing participants in top plasma β2M to the bottom quartile, the prevalence and incidence of hypertension among the participants in the Framingham Heart Study rose 29% and 59%, respectively [24].
In the present study, we found that serum β2M correlated with both FPG and SBP (Table 2). The SBP vs. [β2M]s was particular strong in those with low eGFR (Figure 2), and the odds of having high serum β2M fell 4% per 1 mL/min/1.73 m2 higher eGFR in the regression analysis (Table 3). A high serum β2M was 4 times more prevalent in diagnosed diabetics group (Table 3). FPG ≥110 and ≥126 mg/dL both were more prevalent in those with a high serum β2M (Table 4) and those with albuminuria (Table 5 and Table 6).
Subgroup analysis indicated that Ealb/Ccr vs. SBP was tighter in the high serum β2M (R2 = 0.155) than the low serum β2M group (R2 = 0.099) (Figure 3c). These may reflect the independent effect of β2M (SH3B-β2M axis) on SBP. It may also reflect more extensive kidney damage in those with [β2M]s ≥ 5 mg/L. In agreement with our study, an investigation from China observed elevated serum β2M levels in patients with diabetes together with a 17% increase in prevalence of left ventricular hypertrophy per one standard deviation increase in serum β2M [32].
To the best of our knowledge, the present study was the first to evaluate the potential functionality of the SH3B-β2M axis of blood pressure control in people with diabetics, who were also exposed to Cd and Pb.
4. Materials and Methods
4.1. Selection of Study Subjects
We used a purposive sampling technique to recruit type 2 diabetics and non-diabetic controls during annual checkups at a health promoting center in Pakpoon Municipality, Nakhon Si Thammarat Province, Thailand. Diabetics and controls were matched for age, gender, and residential locality, and all subjects were at least 40 years old. Diabetes was defined as fasting plasma glucose [Glc]p levels ≥ 126 mg/dL or a physician’s diagnosis.
Exclusion criteria were non-resident status, pregnancy and/or breastfeeding, and hospital records or a physician’s diagnosis of an advanced chronic disease, including heart disease, stroke, and cancer. Non-diabetic controls were apparently healthy and met all exclusion criteria.
We applied the structured interview questionnaires to collect sociodemographic data, educational attainment, occupation, health status, family history of diabetes, use of dietary supplements, alcohol consumption, and smoking status.
4.2. Collection of Blood and Urine Samples
Subjects were requested to fast overnight, and collection of blood and urine samples was undertaken at the Pakpoon health center on the morning of the following day. Blood samples for the glucose assay were collected in tubes containing fluoride that inhibited glycolysis. Blood samples for Cd and Pb analysis were collected in separate tubes containing ethylene diamine tetra-acetic acid (EDTA) as an anticoagulant.
Blood and urine samples were kept on ice and transported within one hour to the laboratory of Walailak University, where samples of plasma and serum were prepared. Aliquots of urine, whole blood, serum, and plasma were stored at −80 °C for later analysis.
4.3. Quantification of Exposure to Cd, Pb and Biomarkers of Kidney Effects
We used the human beta-2 microglobulin/β2M ELISA pair set (Sino Biological Inc., Wayne, PA, USA) to determine serum concentration of β2M ([β2M]s), with a lower limit of detection of 3.13 pg/mL. The plasma glucose assay was based on the oxidase-peroxidase method (Glu Colorimetric Assay Kit, Elabscience, Houston, TX, USA) [33]. Assays of creatinine in urine and plasma were based on Jaffe’s alkaline picrate method, as described previously [34]. The urinary albumin assay was based on the immunoturbidimetric method [35,36]
Urinary and whole blood Cd and Pb concentrations were determined with GBC System 5000 graphite furnace atomic absorption spectrometry (AAS) (GBC Scientific Equipment, Hampshire, IL, USA) [37]. Standards with As, Be, Cd, Cr (VI), Hg, Ni, Pb, Se, and Tl were used to calibrate the instrument (Merck KGaA, Darmstadt, Germany). Reference urine metal levels 1, 2, and 3 (Lyphocheck, Bio-Rad, Hercules, CA, USA) were used for quality control, analytical accuracy, and precision assurance. When urinary and blood concentrations of Cd and Pb were less than their detection limits, the concentration assigned were the detection limit values divided by the square root of 2 [38].
4.4. Calculation and Cut-Off Values for Albuminuria
Estimated GFR (eGFR) was computed with Chronic Kidney Disease Epidemiology Collaboration (CKD-EPI) equations [39]. CKD stages 1, 2, 3, 4, and 5 corresponded to eGFR of 90–119, 60–89, 30–59, 15–29, and < 15 mL/min/1.73 m2, respectively.
In the present study, urine samples were collected at a single time point (voided urine). This necessitated a correction for interindividual differences in urine volume (dilution). To achieved this, we normalized excretion of Cd (ECd) and albumin (Ealb) to creatinine excretion (Ecr) and creatinine clearance (Ccr), using below equations.
Ex/Ecr = [x]u/[cr]u, where x = Cd or alb; [x]u = urine concentration of x (mass/volume) and [cr]u = urine creatinine concentration (mg/dL). Ex/Ecr was expressed as an amount of x excreted per g of creatinine. Albumin-to-creatinine ratio (ACR) is a well-known expression of Ealb/Ecr.
Ex/Ccr = [Cd]u[cr]p/[cr]u, where x = Cd or alb; [x]u = urine concentration of x (mass/volume); [cr]p = plasma creatinine concentration (mg/dL); and [cr]u = urine creatinine concentration (mg/dL). Ex/Ccr was expressed as an amount of x excreted per volume of the glomerular filtrate [40].
For Ealb/Ecr (ACR) data, albuminuria is defined as ACR values ≥ 20 and 30 mg/g creatinine in men and women, respectively [1,2,3]. A higher cut-off value for ACR in women is to compensate for their universally lower Ecr values, due to smaller muscle mass than men. In comparison, Ccr-normalization is not affected by muscle mass. Hence, for Ealb/Ccr data, albuminuria is defined as Ealb/Ccr values ≥ 0.2 mg/L filtrate in both men and women.
4.5. Statistical Analysis
Data were analyzed with IBM SPSS Statistics 21 (IBM Inc., New York, NY, USA). The variation of any continuous variable and differences in percentages across the tertile of serum β2M concentrations ([β2M]s) (Table 1) were assessed by the Kruskal–Wallis’s test, and the Pearson chi-squared test, respectively. Spearman’s rank correlation analysis was employed to produce the correlation matrices of nine variables; [β2M]s, age, BMI, [Glc]p, SBP, DBP, eGFR, Ealb/Ccr, ECd/Ccr, and Cd/Pb exposure category (Table 2). The one-sample Kolmogorov–Smirnov test was used to assess a deviation from a normal distribution of any continuous variable. Logarithmic transformation was applied to fasting the concentration of plasma glucose ([Glc]p), and the excretion rate of albumin and Cd (Ealb/Ecr and ECd/Ccr) that showed rightward skewing before they were subjected to parametric statistics analysis, scatterplots, and linear regressions (Figure 1, Figure 2 and Figure 3).
5. Conclusions
Hyperglycemia, a falling eGFR, and rising SBP could be toxic manifestation of chronic exposure to low-level Cd and Pb, leading to hypertension, kidney damage and albuminuria. These findings underscore the metabolic and kidney disease coexistence, recognized by the American Heart Association as the cardiovascular–kidney–metabolic (CKM) syndrome. For the first time, evidence is presented herein to link circulating β2M to rising SBP and kidney damage independently of Cd and Pb.
Author Contributions
Conceptualization, S.S., D.A.V. and S.Y.; methodology, S.Y., D.W. and P.P.; formal analysis, S.Y. and S.S.; investigation, S.Y., D.W. and P.P.; resources, S.Y. and D.A.V.; original draft preparation, S.S., D.A.V. and S.Y.; review and editing, S.S. and D.A.V. All authors have read and agreed to the published version of the manuscript.
Funding
This research project was funded by the Research Grant, WU-IRG-63-026, of Walailak University, Nakhon Si Thammarat Province, Thailand.
Institutional Review Board Statement
This study was adhered to the guidelines of the Declaration of Helsinki and approved by the Office of the Human Research Ethics Committee of Walailak University, Nakhon Si Thammarat Province, Thailand. Approval number WUEC-24-275-01 (7 August 2024).
Informed Consent Statement
Written informed consent was obtained from all subjects involved in the study.
Data Availability Statement
All data are contained within this article.
Acknowledgments
We thank the staff of a health promoting center in Pakpoon Municipality, Nakhon Si Thammarat Province, Thailand for their assistance with collection of biospecimens and data.
Conflicts of Interest
The authors declare no conflicts of interest.
References
- Unger, T.; Borghi, C.; Charchar, F.; Khan, N.A.; Poulter, N.R.; Prabhakaran, D.; Ramirez, A.; Schlaich, M.; Stergiou, G.S.; Tomaszewski, M.; Wainford, R.D.; Williams, B.; Schutte, A.E. 2020 International Society of Hypertension Global Hyperten-sion Practice Guidelines. Hypertension 2020, 75, 1334–1357. [Google Scholar] [CrossRef]
- Murray, C.J.L.; Aravkin, A.Y.; Zheng, P.; Abbafati, C.; Abbas, K.M.; Abbasi-Kangevari, M.; Abd-Allah, F.; Abdelalim, A.; Abdollahi, M.; Abdollahpour, I.; et al. Global burden of 87 risk factors in 204 countries and territories, 1990–2019: a systematic analysis for the Global Burden of Disease Study 2019. Lancet 2020, 396, 1223–1249. [Google Scholar] [CrossRef]
- Calhoun, D.A.; Jones, D.; Textor, S.; Goff, D.C.; Murphy, T.P.; Toto, R.D.; White, A.; Cushman, W.C.; White, W.; Sica, D.; et al. Resistant hypertension: Diagnosis, evaluation, and treatment. A scientific statement from the American Heart Association Professional Education Committee of the Council for High Blood Pressure Research. Hypertension 2008, 51, 1403–1419. [Google Scholar] [CrossRef]
- Park, S.; Shin, J.; Ihm, S.H.; Kim, K.I.; Kim, H.L.; Kim, H.C.; Lee, E.M.; Lee, J.H.; Ahn, S.Y.; Cho, E.J.; et al. Resistant hyper-tension: Consensus document from the Korean society of hypertension. Clin. Hypertens. 2023, 29, 30. [Google Scholar] [CrossRef]
- Guyton, A.C. 1991. Blood pressure control-special role of the kidneys and body fluids. Science 1991, 252, 1813–1816. [Google Scholar] [CrossRef] [PubMed]
- Leite, A.P.O.; Li, X.C.; Nwia, S.M.; Hassan, R.; Zhuo, J.L. Angiotensin II and AT1a Receptors in the Proximal Tubules of the Kidney: New Roles in Blood Pressure Control and Hypertension. Int. J. Mol. Sci. 2022, 23, 2402. [Google Scholar] [CrossRef] [PubMed]
- Bloch, M.J.; Basile, J.N. Review of recent literature in hypertension: Updated clinical practice guidelines for chronic kidney disease now include albuminuria in the classification system. J. Clin. Hypertens. 2013, 15, 865–867. [Google Scholar] [CrossRef]
- Qiu, L.; Wu, B. The relationship between the age of onset of hypertension and chronic kidney disease: A cross-sectional study of the American population. Front. Cardiovasc. Med. 2024, 11, 1426953. [Google Scholar] [CrossRef]
- Chen, H.; Zou, Y.; Leng, X.; Huang, F.; Huang, R.; Wijayabahu, A.; Chen, X.; Xu, Y. Associations of blood lead, cadmium, and mercury with resistant hypertension among adults in NHANES, 1999–2018. Environ. Health Prev. Med. 2023, 28, 66. [Google Scholar] [CrossRef]
- Zhang, J.; Wang, X.; Ma, Z.; Dang, Y.; Yang, Y.; Cao, S.; Ouyang, C.; Shi, X.; Pan, J.; Hu, X. Associations of urinary and blood cadmium concentrations with all-cause mortality in US adults with chronic kidney disease: A prospective cohort study. Environ. Sci. Pollut. Res. Int. 2023, 30, 61659–61671. [Google Scholar] [CrossRef]
- Yin, G.; Zhao, S.; Zhao, M.; Xu, J.; Ge, X.; Wu, J.; Zhou, Y.; Liu, X.; Wei, L.; Xu, Q. Complex interplay of heavy metals and renal injury: New perspectives from longitudinal epidemiological evidence. Ecotoxicol. Environ. Saf. 2024, 278, 116424. [Google Scholar] [CrossRef]
- Yin, G.; Xin, M.; Zhao, S.; Zhao, M.; Xu, J.; Chen, X.; Xu, Q. Heavy metals and elderly kidney health: A multidimensional study through Enviro-target Mendelian Randomization. Ecotoxicol. Environ. Saf. 2024, 281, 116659. [Google Scholar] [CrossRef]
- Kim, D.H.; Lee, S.; Jang, M.; Kim, K. Effect of combined exposure to lead, mercury, and cadmium on hypertension: The 2008-2013 Korean National Health and Nutrition Examination Surveys. Int. J. Occup. Med. Environ. Health 2025, 28, 264. [Google Scholar] [CrossRef]
- Yeon, J.; Kang, S.; Park, J.; Ahn, J.H.; Cho, E.A.; Lee, S.H.; Ryu, K.H.; Shim, J.G. Association between blood cadmium levels and the risk of chronic kidney disease in Korea, based on the Korea National Health and Nutrition Examination Survey 2016-2017. Asian Biomed. (Res. Rev. News) 2025, 19, 60–66. [Google Scholar] [CrossRef] [PubMed]
- Verzelloni, P.; Giuliano, V.; Wise, L.A.; Urbano, T.; Baraldi, C.; Vinceti, M.; Filippini, T. Cadmium exposure and risk of hy-pertension: A systematic review and dose-response meta-analysis. Environ. Res. 2024, 263 Pt 1, 120014. [Google Scholar] [CrossRef]
- Murton, M.; Goff-Leggett, D.; Bobrowska, A.; Garcia Sanchez, J.J.; James, G.; Wittbrodt, E.; Nolan, S.; Sörstadius, E.; Pecoits-Filho, R.; Tuttle, K. Burden of Chronic Kidney Disease by KDIGO Categories of Glomerular Filtration Rate and Albuminuria: A Systematic Review. Adv. Ther. 2021, 38, 180–200. [Google Scholar] [CrossRef] [PubMed]
- Kalantar-Zadeh, K.; Jafar, T.H.; Nitsch, D.; Neuen, B.L.; Perkovic, V. Chronic kidney disease. Lancet 2021, 398, 786–802. [Google Scholar] [CrossRef] [PubMed]
- Farrell, D.R.; Vassalotti, J.A. Screening, identifying, and treating chronic kidney disease: Why, who, when, how, and what? BMC Nephrol. 2024, 25, 34. [Google Scholar] [CrossRef]
- Oosterwijk, M.M.; Hagedoorn, I.J.M.; Maatman, R.G.H.J.; Bakker, S.J.L.; Navis, G.; Laverman, G.D. Cadmium, active smoking and renal function deterioration in patients with type 2 diabetes. Nephrol. Dial. Transplant. 2023, 38, 876–883. [Google Scholar] [CrossRef]
- Zhao, H.; Yin, R.; Wang, Y.; Wang, Z.; Zhang, L.; Xu, Y.; Wang, D.; Wu, J.; Wei, L.; Yang, L.; Zhao, D. Association between blood heavy metals and diabetic kidney disease among type 2 diabetic patients: a cross-sectional study. Sci. Reports 2024, 14, 26823. [Google Scholar] [CrossRef]
- Barregard, L.; Bergström, G.; Fagerberg, B. Cadmium, type 2 diabetes, and kidney damage in a cohort of middle-aged women. Environ. Res. 2014, 135, 311–316. [Google Scholar] [CrossRef]
- Huan, T.; Meng, Q.; Saleh, M.A.; Norlander, A.E.; Joehanes, R.; Zhu, J.; Chen, B.H.; Zhang, B.; Johnson, A.D.; Ying, S.; et al. Integrative network analysis reveals molecular mechanisms of blood pressure regulation. Mol. Syst. Biol. 2015, 11, 799. [Google Scholar] [CrossRef]
- Alexander, M.R.; Hank, S.; Dale, B.L.; Himmel, L.; Zhong, X.; Smart, C.D.; Fehrenbach, D.J.; Chen, Y.; Prabakaran, N.; Tirado, B.; et al. A single nucleotide polymorphism in SH2B3/LNK promotes hypertension development and renal damage. Circ. Res. 2022, 131, 731–747. [Google Scholar] [CrossRef]
- Keefe, J.A.; Hwang, S.J.; Huan, T.; Mendelson, M.; Yao, C.; Courchesne, P.; Saleh, M.A.; Madhur, M.S.; Levy, D. Evidence for a causal role of the SH2B3-β2M axis in blood pressure regulation. Hypertension 2019, 73, 497–503. [Google Scholar] [CrossRef] [PubMed]
- Satarug, S.; Vesey, D.A.; Yimthiang, S.; Khamphaya, T.; Pouyfung, P.; Đorđević, A.B. Environmental Cadmium Exposure Induces an Increase in Systolic Blood Pressure by Its Effect on GFR. Stresses 2024, 4, 436–451. [Google Scholar] [CrossRef]
- Xie, S.; Perrais, M.; Golshayan, D.; Wuerzner, G.; Vaucher, J.; Thomas, A.; Marques-Vidal, P. Association between urinary heavy metal/trace element concentrations and kidney function: A prospective study. Clin. Kidney J. 2024, 18, sfae378. [Google Scholar] [CrossRef] [PubMed]
- Song, J.; Wang, P.; Li, H. U-shaped relationship between fasting blood glucose and urinary albumin-to-creatinine ratio in the general United States population. Front. Endocrinol. 2024, 15, 1334949. [Google Scholar] [CrossRef]
- Jiang, Y.; Jia, J.; Li, J.; Huo, Y.; Fan, F.; Zhang, Y. Impaired fasting blood glucose is associated with incident albuminuria: Data from a Chinese community-based cohort. J. Diabetes Complications 2022, 36, 108125. [Google Scholar] [CrossRef]
- Ren, F.; Li, M.; Xu, H.; Qin, X.; Teng, Y. Urine albumin-to-creatinine ratio within the normal range and risk of hypertension in the general population: A meta-analysis. J. Clin. Hypertens. (Greenwich) 2021, 23, 1284–1290. [Google Scholar] [CrossRef]
- Argyropoulos, C.P.; Chen, S.S.; Ng, Y.-H.; Roumelioti, M.-E.; Shaffi, K.; Singh, P.P.; Tzamaloukas, A.H. Rediscovering Beta-2 Microglobulin As a Biomarker across the Spectrum of Kidney Diseases. Front. Med. 2017, 4, 73. [Google Scholar] [CrossRef]
- Sivanathan, P.C.; Ooi, K.S.; Mohammad Haniff, M.A.S.; Ahmadipour, M.; Dee, C.F.; Mokhtar, N.M.; Hamzah, A.A.; Chang, E.Y. Lifting the Veil: Characteristics, Clinical Significance, and Application of β-2-Microglobulin as Biomarkers and Its Detection with Biosensors. ACS Biomater. Sci. Eng. 2022, 8, 3142–3161. [Google Scholar] [CrossRef]
- Zhang, Y.; Peng, G.; Leng, W.; Li, Y.; Li, H.; Zhou, L.; Ge, L.; Shao, J.; Li, X.; Long, M. Association between serum β2-microglobulin and left ventricular hypertrophy in patients with type 2 diabetes mellitus: A cross-sectional study. J. Diabetes 2024, 16, e13599. [Google Scholar] [CrossRef] [PubMed]
- Xu, R.; Tan, X.; Li, T.; Liu, S.; Li, Y.; Li, H. Norepinephrine-induced AuPd aerogels with peroxidase- and glucose oxidase-like activity for colorimetric determination of glucose. Mikrochim. Acta 2021, 188, 362. [Google Scholar] [CrossRef] [PubMed]
- Apple, F.; Bandt, C.; Prosch, A.; Erlandson, G.; Holmstrom, V.; Scholen, J.; Googins, M. Creatinine clearance: Enzymatic vs Jaffé determinations of creatinine in plasma and urine. Clin. Chem. 1986, 32, 388–390. [Google Scholar] [CrossRef] [PubMed]
- Bargnoux, A.S.; Barrot, A.; Fesler, P.; Kuster, N.; Badiou, S.; Dupuy, A.M.; Ribstein, J.; Cristol, J.P. Evaluation of five immunoturbidimetric assays for urinary albumin quantification and their impact on albuminuria categorization. Clin. Biochem. 2014, 47, 250–253. [Google Scholar] [CrossRef]
- Kok, M.B.; Tegelaers, F.P.; van Dam, B.; van Rijn, J.L.; van Pelt, J. Carbamylation of albumin is a cause for discrepancies between albumin assays. Clin. Chim. Acta 2014, 434, 6–10. [Google Scholar] [CrossRef]
- Trzcinka-Ochocka, M.; Brodzka, R.; Janasik, B. Useful and Fast Method for Blood Lead and Cadmium Determination Using ICP-MS and GF-AAS; Validation Parameters. J. Clin. Lab. Anal. 2016, 30, 130–139. [Google Scholar] [CrossRef]
- Hornung, R.W.; Reed, L.D. Estimation of average concentration in the presence of nondetectable values. Appl. Occup. Environ. Hyg. 1990, 5, 46–51. [Google Scholar] [CrossRef]
- Levey, A.S.; Stevens, L.A.; Scmid, C.H.; Zhang, Y.; Castro, A.F., III; Feldman, H.I.; Kusek, J.W.; Eggers, P.; Van Lente, F.; Greene, T.; et al. A new equation to estimate glomerular filtration rate. Ann. Intern. Med. 2009, 150, 604–612. [Google Scholar] [CrossRef]
- Phelps, K.R.; Gosmanova, E.O. A generic method for analysis of plasma concentrations. Clin. Nephrol. 2020, 94, 43–49. [Google Scholar] [CrossRef]
Figure 1.
Blood pressure in relation to the serum concentration of β2-microglobin. Scatterplots related serum β2M concentration to SBP (a) and DBP (b) in participants with normal eGFR and low eGFR. SBP, systolic blood pressure; DBP, diastolic blood pressure. The normal and low eGFR were defined as eGFR > 60 and ≤ 60 mL/min/1.73 m2, respectively.
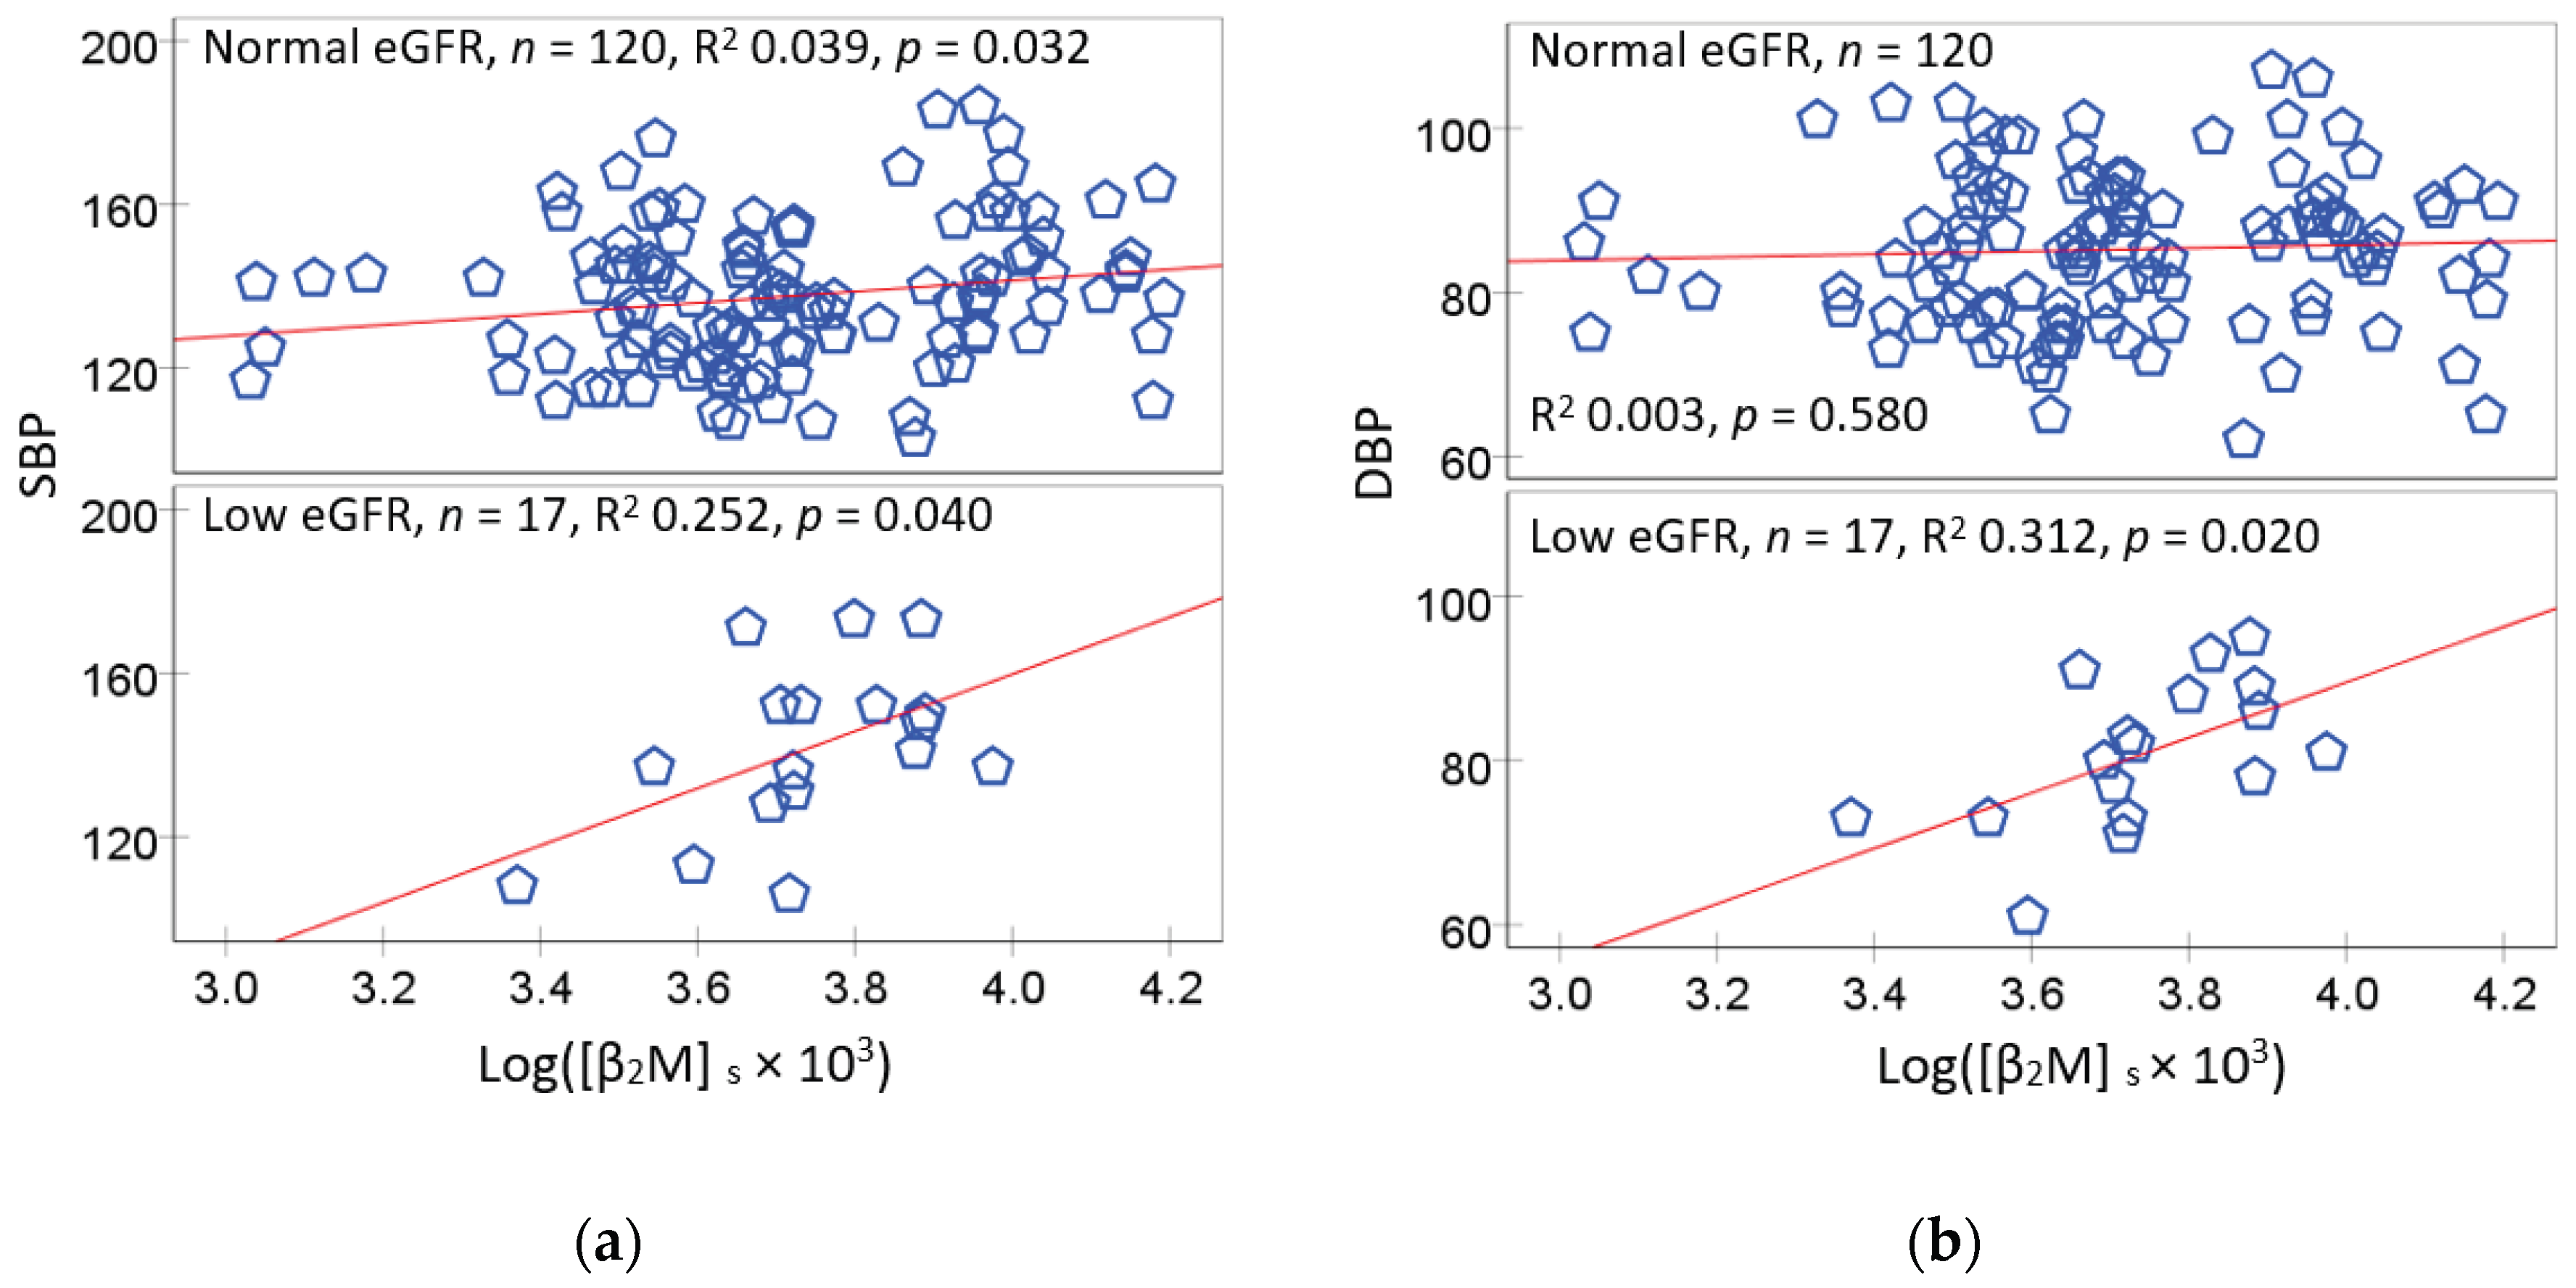
Figure 2.
Albumin excretion in relation to blood pressure increment. Scatterplots related Ealb/Ccr to SBP in diabetics and controls (a) and those with or without hyperglycemia (b). Scatterplots related Ealb/Ccr to DBP in diabetics and controls (c) and those with or without hyperglycemia (d).
Figure 2.
Albumin excretion in relation to blood pressure increment. Scatterplots related Ealb/Ccr to SBP in diabetics and controls (a) and those with or without hyperglycemia (b). Scatterplots related Ealb/Ccr to DBP in diabetics and controls (c) and those with or without hyperglycemia (d).
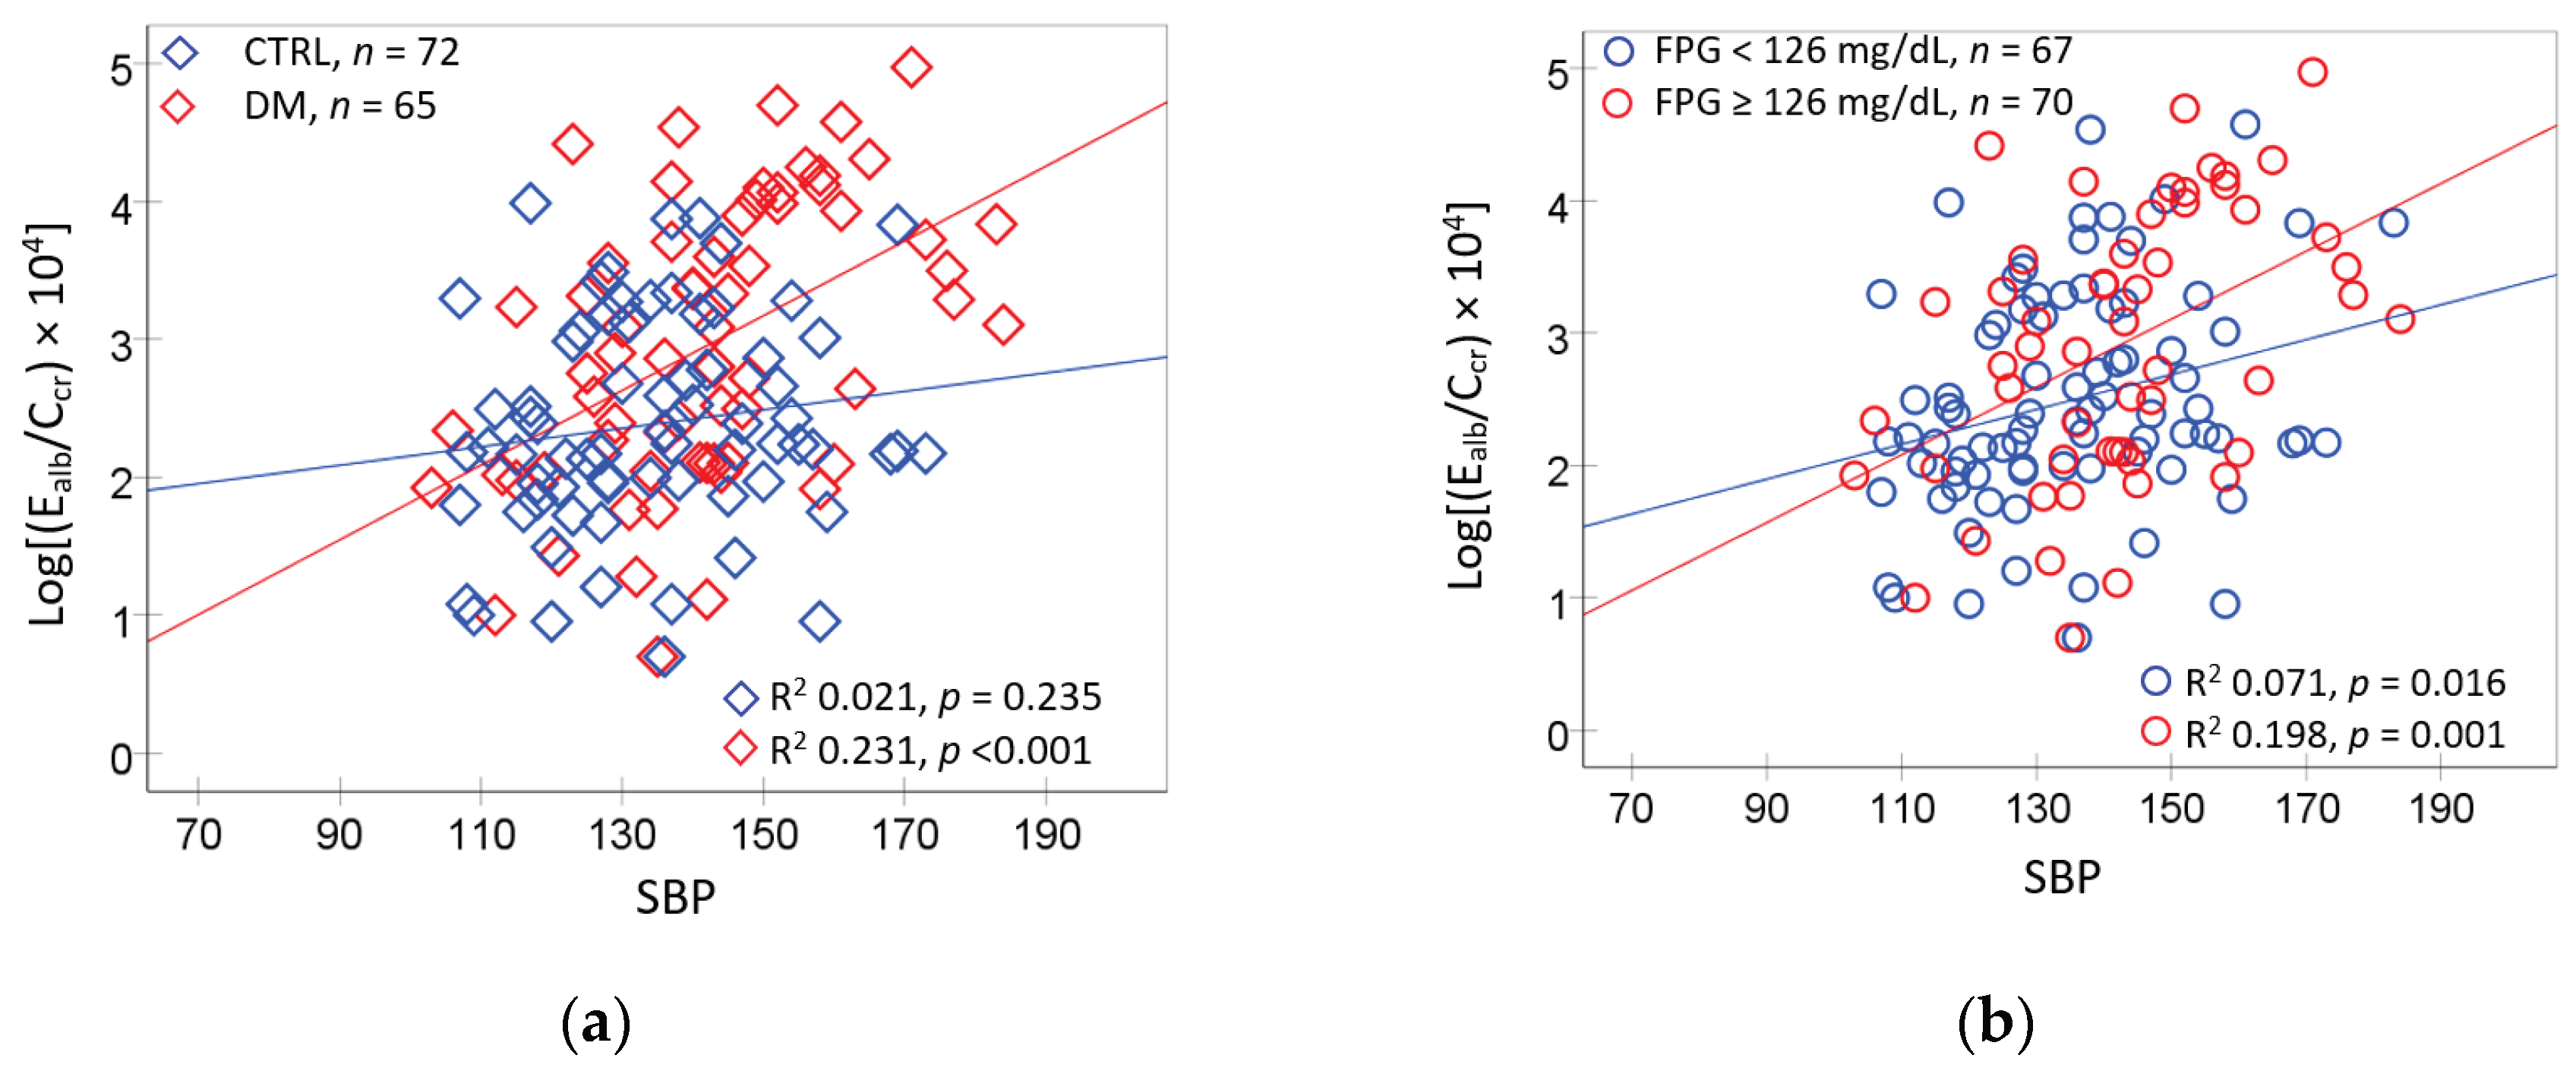
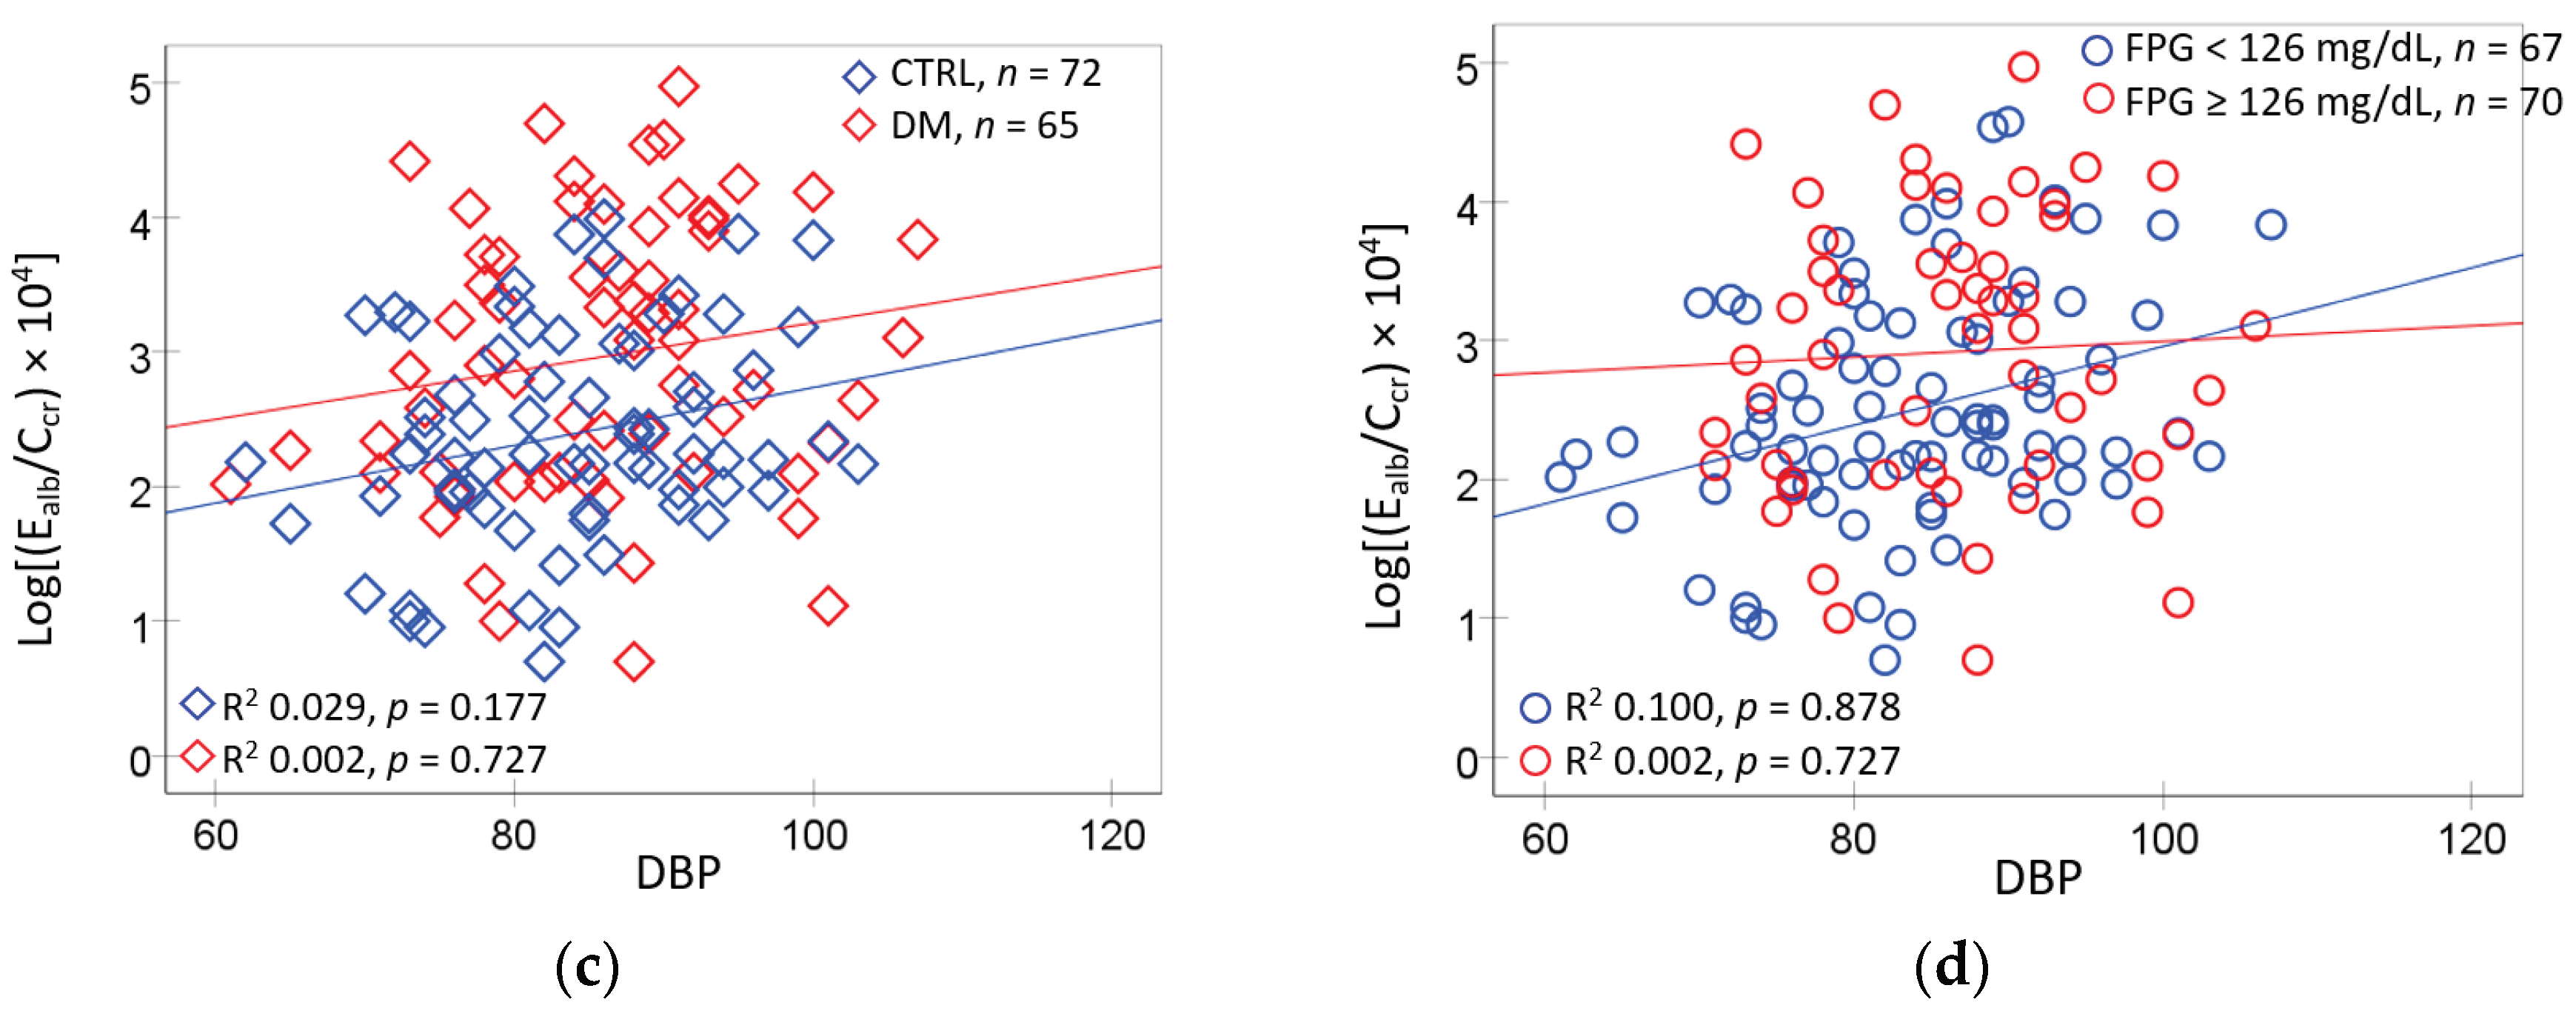
Figure 3.
Albumin excretion in relation to fasting plasma glucose concentration and blood pressure. Scatterplots related serum Ealb/Ccr to [Glc]p (a,b), SBP (c) and DBP (d) in participants with normotension vs. hypertension, normal eGFR vs. low eGFR (b), low vs high serum β2M. [Glc]p = fasting plasma glucose concentration. The normal and low eGFR were defined as eGFR > 60 and ≤ 60 mL/min/1.73 m2, respectively. Serum β2M levels < 5 and ≥ 5 mg/L were indicative of low and high serum β2M levels, respectively.

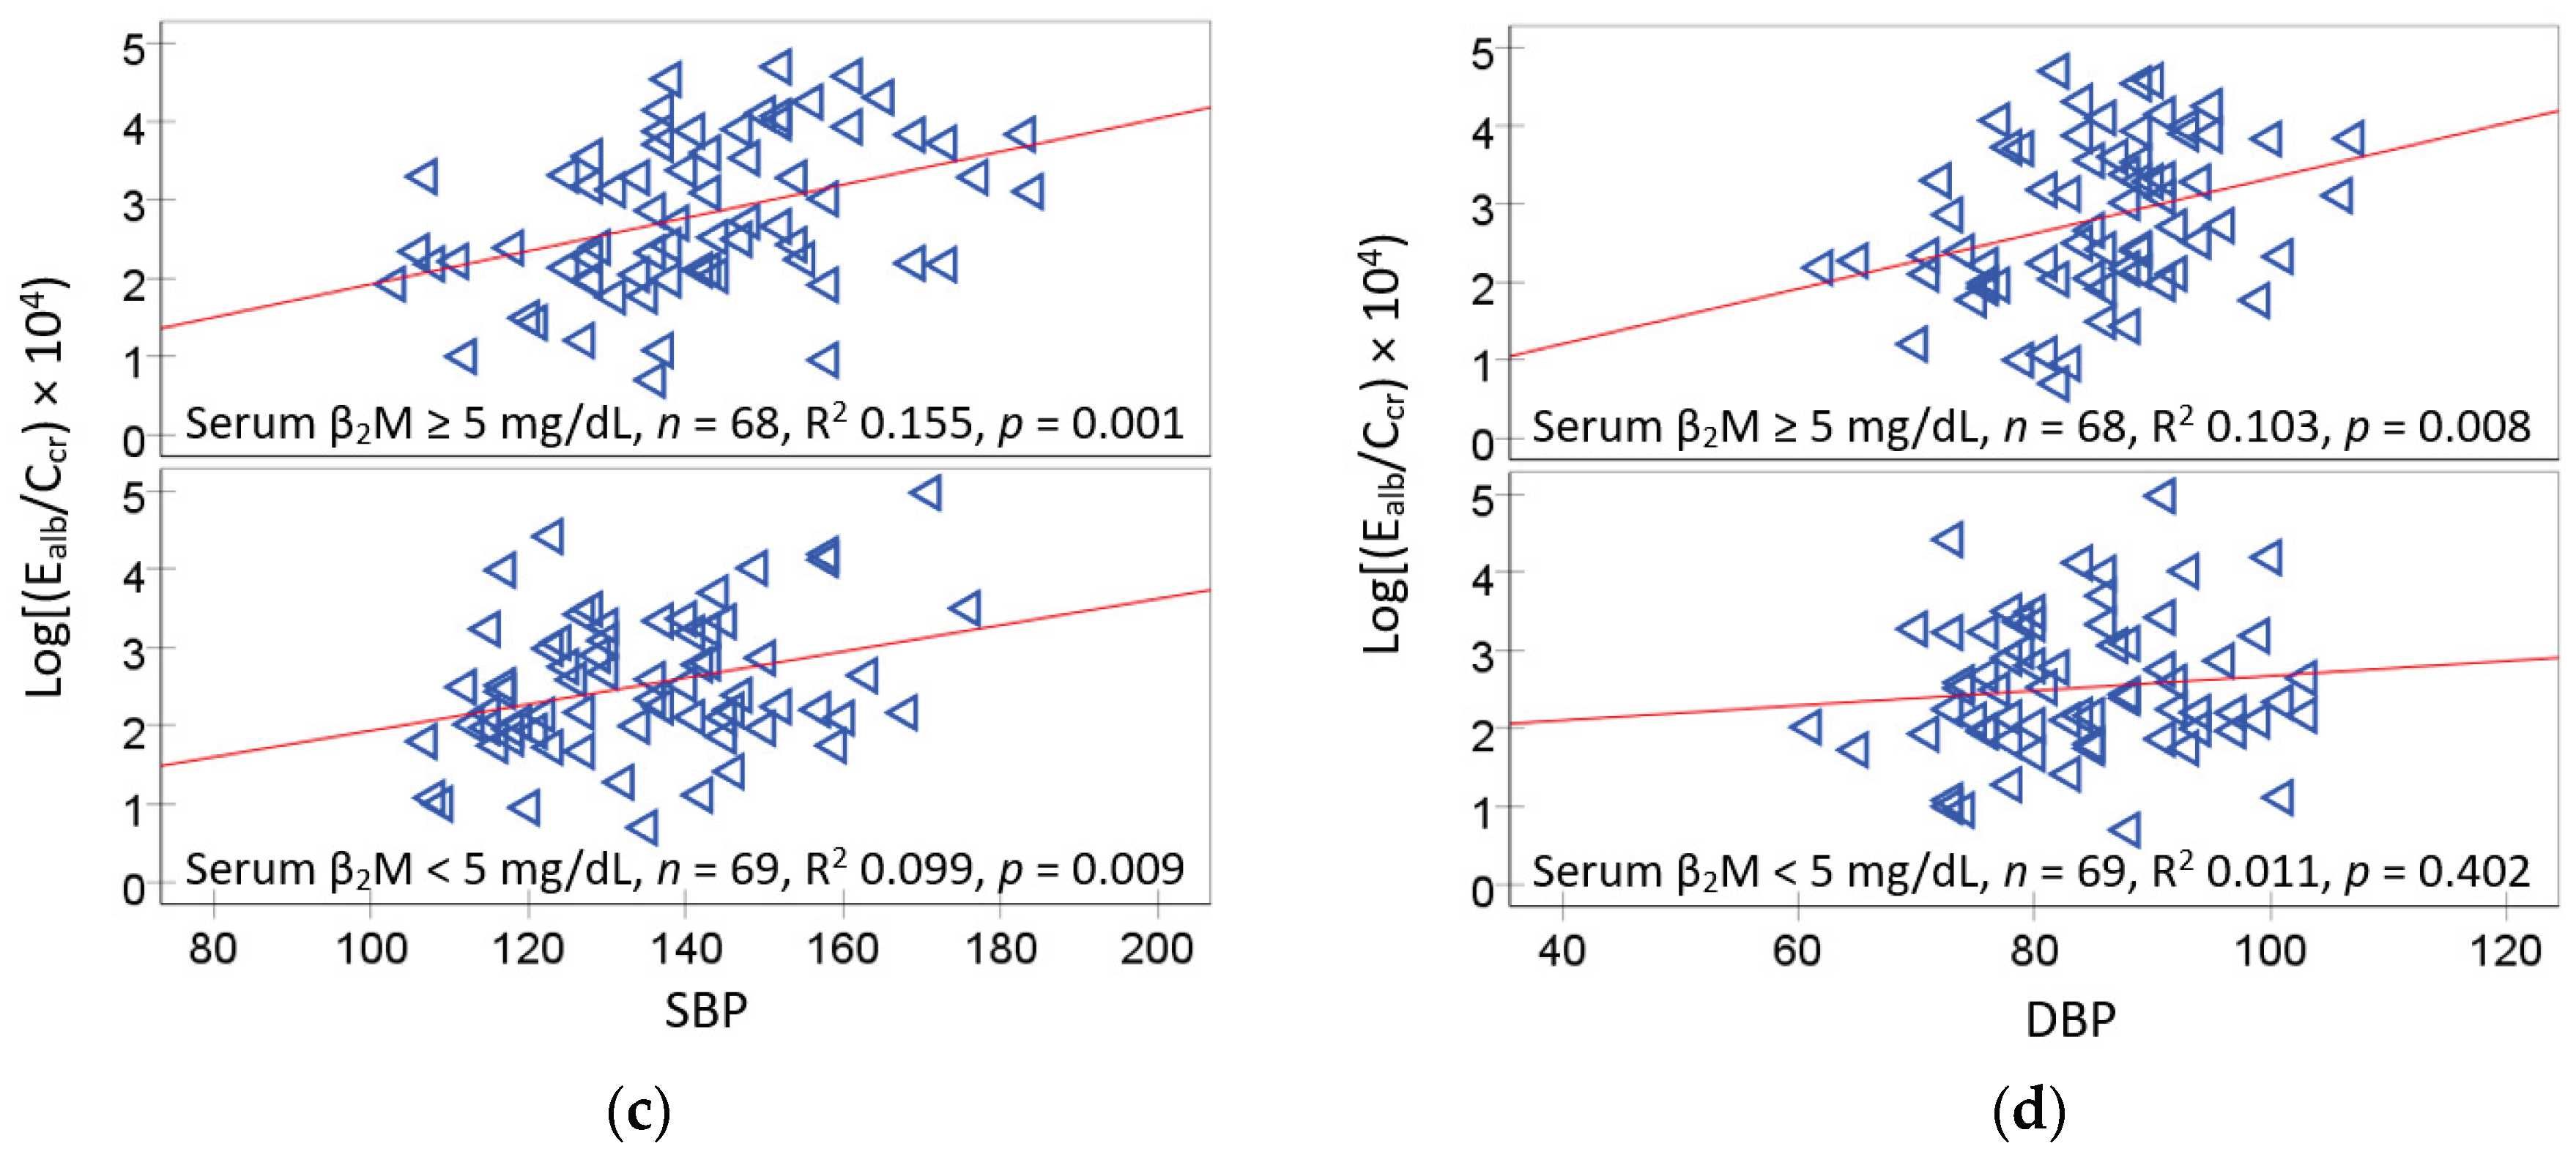

Table 1.
Participant characteristics according to tertile of serum β2-microglobulin.
| Variables |
All subjects N = 137 |
Tertile of serum β2M concentration, mg/L | p | ||
| T1: 1−3.9 n = 45 |
T2: 4.0 – 5.9 n = 46 |
T3: 6.0 −16 n = 46 |
|||
| Women, % | 78.1 | 80.0 | 82.6 | 71.1 | 0.421 |
| Smoking, % | 10.2 | 4.4 | 8.7 | 17,4 | 0.115 |
| Diagnosed diabetes | 47.4 | 42.2 | 28.3 | 71.7 | < 0.001 |
| Age, years | 59.7 (9.1) | 57.2 (9.7) | 60.4 (8.3) | 61.4 (8.9) | 0.060 |
| BMI, kg/m2 | 25.6 (4.8) | 26.3 (5.7) | 25.1 (3.9) | 25.4 (4.6) | 0.751 |
| SBP, mm Hg | 138 (18) | 136 (17) | 133 (15) | 145 (19) | 0.004 |
| DBP, mm Hg | 85 (9) | 84 (10) | 83 (8) | 87 (9) | 0.129 |
| Hypertension, % | 54.5 | 54.5 | 40.0 | 68.9 | 0.023 |
| eGFR, mL/min/1.73 m2 | 79 (16) | 86 (16) | 75 (15) | 77 (15) | 0.002 |
| Low eGFR a, % | 12.7 | 6.7 | 15.2 | 15.2 | 0.326 |
| FPG, mg/dL | 129 (61) | 135 (83) | 119 (51) | 134 (41) | 0.007 |
| [Cd]b, µg/L | 0.57 (0.70) | 0.40 (0.56) | 0.59 (0.69) | 0.70 (0.81) | 0.041 |
| [Pb]b, mg/dL | 4.49 (4.78) | 4.73 (5.11) | 3.07 (2.13) | 5.68 (5.96) | 0.002 |
| ECd/Ecr, µg/g creatinine | 0.98 (1.86) | 1.05 (1.87) | 1.09 (2.14) | 0.79 (1.53) | 0.567 |
| ECd/Ccr, (µg/L filtrate) × 100 | 0.86 (1.68) | 0.86 (1.56) | 1.01 (2.00) | 0.69 (1.45) | 0.796 |
| ACR (Ealb/Ecr), mg/g creatinine | 40 (102) | 26 (70) | 43 (134) | 50 (90) | 0.463 |
| Ealb/Ccr, (mg/L filtrate) × 100 | 37 (106) | 20 (49) | 44 (155) | 47 (84) | 0.366 |
| Ealb/Ccr ≥ 0.2 mg/L filtrate, % | 26.3 | 17.8 | 21.7 | 39.1 | 0.048 |
| FPG ≥ 110 mg/dL, % | 48.9 | 42.2 | 34.8 | 69.6 | 0.002 |
| FPG ≥ 126 mg/dL, % | 39.4 | 35.6 | 23.9 | 58.7 | 0.002 |
eGFR, estimated glomerular filtration rate; a Low eGFR was defined as eGFR values ≤ 60 mL/min/1.73 m2; FPG, fasting plasma glucose; β2M, β2-microglobulin; Cd; cadmium; Pb, lead; [x]p, plasma concentration of x; [x]u, urine concentration of x; Ecr, creatinine excretion; Ccr, creatinine clearance; ACR, albumin-to-creatinine ratio. Values for continuous variables are mean (standard deviation, SD). Mean (SD) values for [β2M]s in all subjects and the serum β2M tertiles 1, 2 and 3 are 5.98 (3.29), 3.03 (0.81), 4.95 (0.50), and 9.90 (2.53) mg/L, respectively. The variability of continuous variables across [β2M]s tertile was assessed with the Kruskal-Wallis test. The distribution of categorial variables was assessed with Chi-square test. For all tests, p-values ≤ 0.05 indicate statistical significance.
Table 2.
Bivariate correlation analysis of the serum concentration of β2-microglobulin.
| Variables | Spearman’s correlation coefficient | ||||||||
| [β2M]s | Age | BMI | FPG | SBP | DBP | eGFR | Ealb/Ccr | ECd/Ccr | |
| Age | 0.200* | ||||||||
| BMI | −0.061 | −0.262** | |||||||
| FPG | 0.210* | −0.222** | 0.184* | ||||||
| SBP | 0.229** | 0.224** | 0.072 | 0.250** | |||||
| DBP | 0.117 | −0.123 | 0.043 | 0.168 | 0.552** | ||||
| eGFR | −0.265** | −0.356** | 0.161 | 0.089 | −0.048 | 0.042 | |||
| Ealb/Ccr | 0.138 | 0.085 | 0.076 | 0.273** | 0.372** | 0.232** | −0.136 | ||
| ECd/Ccr | 0.021 | 0.078 | −0.083 | 0.166 | 0.133 | 0.123 | −0.227** | 0.106 | |
| Cd/Pb exposure a | 0.158 | 0.009 | −0.012 | 0.181* | 0.114 | 0.194* | −0.013 | 0.095 | 0.301** |
β2M, β2-microglobulin; [β2M]s, serum concentration of β2M; BMI, body mass index; FPG, fasting plasma glucose concentration; SBP, systolic blood pressure; DBP, diastolic blood pressure; eGFR, estimated glomerular filtration rate. a Median blood Cd of 0.3 µg/L and median blood Pb of 2.12 µg/dL were used to describe Cd/Pb exposure levels. The Cd/Pb exposure category 1, 2 or 3 was assigned respectively, when blood Cd or blood Pb below its median, blood Cd or blood Pb above its median, or blood Cd and blood Pb both were above medians. * Significant correlation at the 0.05 level. ** Significant correlation at the 0.01 level.
Table 3.
Determinants of the prevalence odds ratios for an elevated serum β2M concentration
| Independent Variables/Factors |
[β2M] s ≥ 5 mg/L | ||||
|---|---|---|---|---|---|
| β Coefficients | POR | 95% CI | p | ||
| (SE) | Lower | Upper | |||
| Age, years | 0.025 (0.025) | 1.025 | 0.976 | 1.076 | 0.320 |
| BMI, kg/m2 | −0.026 (0.046) | 0.974 | 0.890 | 1.067 | 0.574 |
| eGFR, mL/min/1.73 m2 | −0.041 (0.014) | 0.960 | 0.933 | 0.988 | 0.005 |
| Log10[(ECd/Ccr) × 105], µg/ L filtrate | 0.257 (0.281) | 1.293 | 0.746 | 2.240 | 0.360 |
| Gender | 0.136 (0.607) | 1.146 | 0.349 | 3.763 | 0.822 |
| Smoking | 1.410 (0.856) | 4.098 | 0.765 | 21.95 | 0.100 |
| Diagnosed diabetes | 1.411 (0.425) | 4.099 | 1.783 | 9.421 | 0.001 |
| Hypertension | 0.436 (0.406) | 1.547 | 0.699 | 3.425 | 0.282 |
[β2M]s, serum β2-microglobulin concentration; POR, prevalence odds ratio; CI, confidence interval; BMI, body mass index; eGFR, estimated glomerular filtration rate. For all tests, p-values ≤ 0.05 indicate statistical significance.
Table 4.
Independent association of serum β2M and the prevalence odds of hyperglycemia.
| Independent Variables | FPG ≥ 110 mg/dL | FPG ≥ 126 mg/dL | ||
|---|---|---|---|---|
| POR (95% CI) | p | POR (95% CI) | p | |
| Age, years | 1.046 (0.999, 1.096) | 0.056 | 1.077 (1.023, 1.133) | 0.004 |
| BMI, kg/m2 | 0.929 (0.855, 1.011) | 0.088 | 0.942 (0.865, 1.027) | 0.177 |
| Gender | 1.574 (0.505, 4.910) | 0.434 | 1.338 (0.424, 4.225) | 0.620 |
| Smoking | 3.087 (0.628, 15.18) | 0.165 | 2.881 (0.538, 15.42) | 0.216 |
| [β2M]s ≥ 5 mg/dL | 3.392 (1.554, 7.406) | 0.002 | 3.875 (1.673, 8.977) | 0.002 |
| Cd/Pb exposure category a | ||||
| 1 | Referent | Referent | ||
| 2 | 2.107 (0.825, 5.378) | 0.119 | 3.141 (1.185, 8.328) | 0.021 |
| 3 | 2.802 (1.026, 7.651) | 0.044 | 3.702 (1.299, 10.54) | 0.014 |
FPG, fasting plasma glucose concentration; POR, prevalence odds ratio; CI, confidence interval; BMI, body mass index; [β2M]s, serum concentration of β2-microglobulin. a Median blood Cd of 0.3 µg/L and median blood Pb of 2.12 µg/dL were used to describe Cd/Pb exposure levels. The Cd/Pb exposure category 1, 2 or 3 was assigned respectively, when blood Cd or blood Pb below its median, blood Cd or blood Pb above its median, or blood Cd and blood Pb both were above medians. For all tests, p-values ≤ 0.05 indicate statistical significance.
Table 5.
Association of the prevalence odds for hypertension and albuminuria with hyperglycemia the pre-diabetes range.
Table 5.
Association of the prevalence odds for hypertension and albuminuria with hyperglycemia the pre-diabetes range.
| Independent Variables | Hypertension a | Albuminuria b | ||
|---|---|---|---|---|
| POR (95% CI) | p | POR (95% CI) | p | |
| Age, years | 0.964 (0.920, 1.009) | 0.114 | 0.974 (0.927, 1.023) | 0.295 |
| BMI, kg/m2 | 0.975 (0.894, 1.063) | 0.561 | 0.980 (0.898, 1.070) | 0.653 |
| Gender | 2.299 (0.690, 7.662) | 0.175 | 2.490 (0.763, 8.122) | 0.130 |
| Non-smoker | 7.920 (1.381, 45.42) | 0.020 | 3.187 (0.559, 18.18) | 0.192 |
| FPG ≥ 110 mg/dL | 3.664 (1.658, 8.097) | 0.001 | 2.955 (1.254, 6.965) | 0.013 |
| Cd/Pb exposure category c | ||||
| 1 | Referent | Referent | ||
| 2 | 3.063 (1.022, 9.186) | 0.046 | 1.369 (0.513, 3.650) | 0.530 |
| 3 | 4.413 (1.555, 12.53) | 0.005 | 1.993 (0.664, 5.980) | 0.219 |
a Hypertension was based on physician diagnosis and/or use of anti-hypertensive medication. b Albuminuria was defined as Ealb/Ccr ≥ 0.2 mg/ L filtrate. FPG, fasting plasma glucose concentration; POR, prevalence odds ratio; CI, confidence interval; BMI, body mass index. c Median blood Cd of 0.3 µg/L and median blood Pb of 2.12 µg/dL were used to describe Cd/Pb exposure levels. The Cd/Pb exposure category 1, 2 or 3 was assigned respectively, when blood Cd or blood Pb below its median, blood Cd or blood Pb above its median, or blood Cd and blood Pb both were above medians. For all tests, p-values ≤ 0.05 indicate statistical significance.
Table 6.
Association of the prevalence odds for hypertension and albuminuria with hyperglycemia in diabetes range.
Table 6.
Association of the prevalence odds for hypertension and albuminuria with hyperglycemia in diabetes range.
| Independent Variables | Hypertension a | Albuminuria b | ||
|---|---|---|---|---|
| POR (95% CI) | p | POR (95% CI) | p | |
| Age, years | 0.963 (0.920, 1.008) | 0.101 | 0.965 (0.917, 1.016) | 0.172 |
| BMI, kg/m2 | 0.969 (0.880, 1.056) | 0.469 | 0.976 (0/895, 1.065) | 0.586 |
| Gender | 2.356 (0.732, 7.577) | 0.151 | 2.671 (0.817, 8.737) | 0.104 |
| Non-smoker | 8.030 (1.429, 45.11) | 0.018 | 3.275 (0.572, 18.76) | 0.183 |
| FPG ≥ 126 mg/dL | 2.905 (1.275, 6.622) | 0.011 | 3.482 (1.458, 8.312) | 0.005 |
| Cd/Pb exposure category c | ||||
| 1 | Referent | Referent | ||
| 2 | 2.966 (0.998, 8.811) | 0.050 | 1.196 (0.439, 3.260) | 0.726 |
| 3 | 4.053 (1.445, 11.36) | 0.008 | 1.846 (0.603, 5.449) | 0.283 |
a Hypertension was based on physician diagnosis and/or use of anti-hypertensive medication. b Albuminuria was defined as Ealb/Ccr ≥ 0.2 mg/ L filtrate. FPG, fasting plasma glucose concentration; POR, prevalence odds ratio; CI, confidence interval; BMI, body mass index. c Median blood Cd of 0.3 µg/L and median blood Pb of 2.12 µg/dL were used to describe Cd/Pb exposure levels. The Cd/Pb exposure category 1, 2 or 3 was assigned respectively, when blood Cd or blood Pb below its median, blood Cd or blood Pb above its median, or blood Cd and blood Pb both were above medians. For all tests, p-values ≤ 0.05 indicate statistical significance.
Disclaimer/Publisher’s Note: The statements, opinions and data contained in all publications are solely those of the individual author(s) and contributor(s) and not of MDPI and/or the editor(s). MDPI and/or the editor(s) disclaim responsibility for any injury to people or property resulting from any ideas, methods, instructions or products referred to in the content. |
© 2025 by the authors. Licensee MDPI, Basel, Switzerland. This article is an open access article distributed under the terms and conditions of the Creative Commons Attribution (CC BY) license (http://creativecommons.org/licenses/by/4.0/).
Copyright: This open access article is published under a Creative Commons CC BY 4.0 license, which permit the free download, distribution, and reuse, provided that the author and preprint are cited in any reuse.


