
Submitted:
24 August 2025
Posted:
27 August 2025
You are already at the latest version
Abstract
This study investigates how digital infrastructure contributes to smart city performance in emerging economy contexts, and whether its impact is shaped by governance models.We estimate the effect of a Digital Technology Index on a composite Smart City Index, employing a generalized least squares (GLS) random-effects model to address heteroskedasticity and serial correlation. The analysis reveals a robust and statistically significant relationship: a one-standard-deviation increase in digital infrastructure corresponds to a 0.7-standard-deviation rise in smart city performance with a potential evidence of diminishing returns at higher levels of digital maturity. To interpret these results, we draw on a qualitative case study of Wang Chan Valley (WCV), a science and innovation hub in Thailand’s Eastern Economic Corridor. WCV exemplifies how early-stage digital investment can amplify smart development outcomes and generate spillover effects across the broader urban region [1,4]. The case reinforces our hypothesis that digital infrastructure embedded within participatory innovation ecosystems yields greater and more sustainable smart city gains than technology investment alone. Taken together, our findings contribute to the literature by integrating econometric evidence with governance-sensitive perspectives on smart urban transformation in emerging economies.
Keywords:
smart city
; digital infrastructure
; urban governance
; quadruple helix
; innovation ecosystem
; sustainable urban development
; technology adoption
1. Introduction
Over the past decade, “smart city” strategies have become increasingly central to urban development agendas, particularly in regions seeking to address sustainability, livability, and innovation simultaneously [1,2]. As cities around the world embrace digital transformation, investments in digital infrastructure, such as broadband, sensor networks, and data platforms, are often assumed to drive smart urban performance. However, a growing body of research suggests that technology alone is not a panacea; its effectiveness depends on the institutional, economic, and societal systems in which it is embedded [3,4]. The debate has thus shifted from “how much digital infrastructure” to “under what governance conditions” digitalization generates lasting and inclusive urban benefits.
This study contributes to that debate by examining the relationship between urban digital infrastructure and smart city performance in the context of emerging economies. Using a multi-city panel dataset spanning 11 years, we estimate the average effect of digital infastructure on smart city outcomes, while also investigating whether the marginal returns to digitalization exhibit non-linear behavior. Our core empirical contribution lies in showing that while early-stage digital investment yields significant gains in smart city development, these effects plateau at higher levels of digital maturity, surfacing the presence of diminishing returns. This has yet to be found in developing countries in which advanced development in digital infrastructure is difficult to find [5]. Thus, the definitive conclusion is hard to draw as the samples with highest implementation is extremely low.
Beyond estimating these effects, this study introduces a theoretical and policy-oriented lens rooted in the Quadruple Helix (QH) model. The QH framework emphasizes co-evolutionary innovation through collaboration among four sectors: government, industry, academia, and civil society [6,7]. When applied to urban transformation, this perspective suggests that digital infrastructure delivers the greatest returns when implemented within a participatory, cross-sectoral governance ecosystem—rather than through top-down or market-driven approaches alone. We hypothesize that digital infrastructure development, when guided by Quadruple Helix principles, produces positive spillover effects that enhance smart city performance across the broader urban region.
To explore this hypothesis, we use the case of Wang Chan Valley (WCV) in Thailand as a strategic anchor for interpreting our quantitative results. Located within the Eastern Economic Corridor (EEC), WCV is a national innovation hub designed to integrate cutting-edge ICT infrastructure with educational institutions, research facilities, and community co-creation platforms. Although WCV is not included in our panel sample due to its classification as an innovation district rather than a municipality, it offers a compelling instance of how early digital investment, when coupled with QH-oriented governance, can catalyze smart urban development beyond the boundaries of the project itself. As such, WCV serves not only as an illustrative case but also as a conceptual bridge linking our econometric findings with the broader literature on innovation ecosystems and place-based policy [8,9].
By integrating panel econometric analysis with a governance-aware interpretation grounded in the Quadruple Helix model, this paper seeks to move beyond linear, technology-determinist accounts of smart city development. We argue that understanding when and how digital infrastructure translates into urban transformation requires attention to institutional design, human capital, and civic engagement. The paper proceeds as follows: Section 2 presents the methodology and data sources; Section 3 reports the quantitative findings; Section 4 discusses the WCV case and its alignment with our model; and Section 5 concludes with theoretical and policy implications for smart city governance in the Global South.
2. Literature Review
2.1. Digital Infrastructure and Smart City Performance
Smart city development has been widely conceptualised as the integration of physical infrastructure with digital infastructure to enhance urban services, governance, and quality of life [1,2]. A significant strand of the literature has focused on how information and communication technology (ICT) investment underpins various smart city domains, including energy, mobility, environment, and governance [4,9]. The logic is that digital platforms and data-driven tools enable cities to become more responsive, efficient, and inclusive.
Empirical studies in developed economies provide robust evidence for this linkage. For example, [6] finds that the presence of broadband networks and digital public services correlates positively with economic competitiveness and citizen satisfaction across European cities. Similarly, [3], using a composite Smart City Impact Index, show that higher levels of ICT deployment are associated with stronger innovation ecosystems and better governance outcomes.
However, relatively fewer studies have rigorously quantified this relationship in emerging economy contexts, where digital infrastructure is less mature, and institutional capacity more variable. In Chinese cities, for example, the returns from digitalisation vary sharply based on local readiness and governance conditions [10]. This observation motivates the present study’s empirical focus on city-level performance across developing urban systems.
2.2. Non-Linearity and Diminishing Returns in Smart City Development
Recent literature has questioned the assumption of a linear, ever-increasing benefit from digital investment. Instead, a number of scholars propose a non-linear or threshold-based relationship, where digital infrastructure delivers strong early benefits, but marginal gains diminish as cities reach higher levels of digital maturity [8,11].
This insight mirrors broader economic theories of diminishing returns and inverted-U effects, long observed in innovation studies [12,13]. [14] and [15] provide econometric frameworks for modelling such threshold dynamics, suggesting that policy interventions must be context-sensitive to a system’s saturation point.
In urban terms, this means that once cities achieve foundational ICT layers, fiber networks, open-data portals, smart grids, the incremental benefit of further digital investment depends increasingly on the city’s ability to manage, govern, and co-produce services effectively. This insight is particularly relevant for high-investment innovation districts that risk technological redundancy without institutional support.
2.3. The Quadruple Helix Model and Innovation Ecosystems
To understand why some cities translate digital infrastructure into smart performance more effectively than others, scholars have increasingly turned to innovation systems theory, particularly the Quadruple Helix (QH) model. This framework expands on the Triple Helix of university–industry–government by incorporating civil society as a fourth co-creator of knowledge and innovation [6,7].
In the smart city literature, the QH model has been applied to explain successful cases of participatory innovation, where infrastructure is embedded within networks of knowledge exchange, trust, and multi-actor collaboration [4]. For instance, in their modelling of smart city performance, [4] shows that cities with high levels of institutional coordination and civic engagement tend to outperform purely tech-centric ones.
This governance-oriented perspective is echoed in recent critiques of “smartness without democracy,” where smart city initiatives fail due to a lack of community inclusion, regulatory readiness, or skills alignment [16]. The QH model therefore provides a valuable lens through which to interpret not only the presence of infrastructure but its capacity to enable transformative and inclusive urban outcomes.
2.4. Positioning This Study
While existing research has addressed the digital–smart city link, non-linear effects, and the value of participatory governance, few studies have integrated these strands empirically in emerging economy contexts. This study contributes in three ways: (1) it estimates the marginal effects of digital infastructure on smart city performance using multi-year panel data from secondary cities; (2) it models potential non-linearity in that relationship; and (3) it interprets these findings through the lens of Wang Chan Valley (WCV), a flagship smart innovation hub in Thailand that exemplifies the Quadruple Helix approach.
In doing so, this paper answers recent calls to link technology metrics with institutional dynamics in assessing smart city success [3,9], and provides a grounded hypothesis: that digital infrastructure, when guided by QH principles, generates positive externalities that extend beyond the immediate project site, improving performance across the broader urban ecosystem.
3. Method
This study employs a balanced panel dataset of 12 cities observed over 11 years provided from Digital Economy Promotion Agency [17] to examine the relationship between digital infrastructure and smart city performance in emerging economy contexts. The analysis focuses on two standardized composite indicators: the Smart City Index (ranging from 0 to 5) and the Digital Technology Index (ranging from 0 to 1). The Smart City Index captures multidimensional urban performance across key domains, including economy, environment, governance, mobility, living, and people [1,2]. The Digital Technology Index reflects the degree of digital infrastructure adoption within each city, including broadband coverage, ICT service availability, and digital platform implementation [3]. For clarity, the underlying concept measured by this index will be referred to as 'digital infrastructure' throughout the paper. The baseline model specification is a linear panel data model:
where is the Smart City Index for city at time , is a vector of explanatory variables, is the vector of coefficients to be estimated, and is the composite error term.
A key advantage of panel data is the ability to model unobserved city-specific heterogeneity. We decompose the error term into two components:
Here, represents the unobserved, time-invariant specific effect for each city (e.g., stable governance quality, geographical location), and is the idiosyncratic error term that varies across both city and time.
All variables were normalized to a 0–1 scale to ensure comparability across cities and over time. In addition to the main explanatory variable, the model incorporates several controls to address potential confounding factors: (1) economic prosperity, proxied by gross product per capita (GPP per capita), (2) income inequality, measured by the Gini coefficient, and (3) public investment in research and development (R\&D). Due to strong multicollinearity between GPP per capita and the Digital Technology Index (correlation coefficient ), GPP was excluded from models 2 and 3 to preserve estimator stability and interpretability [14,15].
To estimate the effect of digital infrastructure on smart city performance, we apply a generalized least squares (GLS) regression model suitable for panel data. The GLS estimator is given by:
where is the variance-covariance matrix of the error term. The GLS procedure effectively transforms the data to eliminate the serial correlation in the errors, thereby producing estimates that are both consistent and efficient [18,19]. The GLS estimator is selected to correct for heteroskedasticity across cities and serial correlation within them—issues that may compromise the efficiency of ordinary least squares (OLS) estimates [20,21]. In practice, this corresponds to a random-effects model, under the assumption that city-specific unobserved effects are uncorrelated with the regressors. The Hausman test is used to determine if the unique, unobserved characteristics of each city are correlated with the variables in the model [22]. A statistically insignificant result, as found in this study (), indicates no such correlation exists, which justifies using the more statistically efficient random-effects model [22,23]. However, the trade-off is that a random-effects model does not control for unique, city-specific characteristics as directly as a fixed-effects model.
The primary specification regresses the Smart City Index on the Digital Technology Index, controlling for inequality and government R\&D, with robust standard errors to account for model uncertainty. In supplementary models, we explore non-linear dynamics by including a squared term for the Digital Technology Index, allowing us to assess the possibility of diminishing marginal returns to digitalization. All estimations were conducted in a statistical computing environment, with standard diagnostic checks (residual analysis, goodness-of-fit tests) employed to validate model assumptions.
4. Results
4.1. Results from Models
Table 1 displays the descriptive statistics for 132 samples collected from 12 different cities over 11 years. Table 2 shows the pairwise correlations among the Smart City Index, its Supporting Index, the Digital Technology Index, GPP per capita, Annual GINI, and Government R&D. The Smart City Index strongly correlated with the Supporting Index (r = 0.878), confirming their conceptual alignment. Its correlation with the Digital Technology Index is also substantial (r = 0.702), indicating that smarter cities tend to have more advanced digital infrastructures. The Digital Technology Index and GPP per capita exhibit an exceptionally high correlation (r = 0.968), suggesting that economic growth and digital capacity advance in correlation. In contrast, Annual GINI and Government R&D show only weak associations with the Smart City Index (r = 0.092 and r = -0.105, respectively), implying that neither income inequality nor public research spending bears a strong direct relationship to overall smart city performance.
A more detailed sub-index correlation matrix (Table 3) reveals that the seven domain sub-indices are themselves highly intercorrelated (pairwise r ≈ 0.809˘0.933). The Digital Technology Index maintains moderate correlations with each domain, ranging from 0.610 (Living) to 0.751 (Energy), showing that while digital capacity is integral to every smart city dimension, it does not fully subsume them. GPP per capita again correlates strongly with both digital capacity and each sub-index. Annual GINI and Government R&D remain only marginally related to the sub-indices (|r| < 0.14), reinforcing the view that these factors play a limited cross-sectional role in shaping individual smart city domains.
The GLS estimation in Table 4 reveals a positive and statistically significant relationship between the Digital Technology Index and the Smart City Index, supporting prior research that highlights digital infrastructure as crucial to urban innovation and effectiveness [8,13]. In practical terms, cities with higher levels of digital infrastructure implementation tend to score better on the smart city scale. The coefficient on the Digital Technology Index is positive and significant (p < 0.01), confirming that digital infrastructure is a key driver of smart city performance. Substantively, the magnitude of this effect is considerable: a one-standard-deviation increase in the Digital Technology Index is associated with roughly a 0.7 standard deviation increase in the Smart City Index. This finding aligns with prior research suggesting that digital advancement propels smart urban development. It also corresponds to the strong bivariate correlation (r ≈ 0.70) observed between the two indices in Table 2, indicating that nearly half of the variance in smart city outcomes can be explained by variation in digital infrastructure alone. Results of sub-index can be found in Table A1, Table A2, Table A3 and Table A4.
The GLS model’s constant term is positive, implying that even at very low levels of digitalization there is a baseline smart-city capacity, likely reflecting foundational urban factors or other dimensions of smartness not entirely captured by digital infrastructure. Crucially, even after controlling other factors, the Digital Technology Index remains a robust predictor. Neither the inequality measure (Gini) nor government R&D spending shows a significant effect on the Smart City Index in this specification. Their coefficients are small and not statistically distinguishable from zero. This suggests that, within our sample, socio-economic inequality and public R&D investment do not directly translate into measurable differences in overall smart city performance (at least not in the short-run or in the presence of high multicollinearity among development indicators). The dominance of digitalization variable in explaining smart city rankings underscores the central role of technological implementation in urban innovation outcomes, consistent with the notion that smarter cities are fundamentally enabled by ICT infrastructure and digital services [11].
While the linear GLS model confirms a positive linkage, the overall goodness-of-fit is only modest, and diagnostic plots shown in Figure 1 and Figure 2 suggest that the relationship may not be strictly linear. The model’s R-squared is moderate, indicating that a substantial portion of variability in the Smart City Index remains unexplained by our linear specification. More revealingly, a visual examination of the data points in Figure 3 to a piecewise pattern. The slope of the relationship appears steeper at lower to mid-range values of the Digital Technology Index and then tapers off at higher values. In other words, improvements in digital infrastructure may yield diminishing returns for smart city outcomes once a city passes a certain threshold of digital maturity [ 12 ,21 ,24 ]. For cities on the lower end of digital implementation, incremental gains in digital infrastructure correspond to relatively large jumps in the Smart City Index. These are cases where initial ICT investments likely enable new smart services and efficient governance, significantly boosting the city’s smart performance. However, for cities that are already highly digitalized, further increases in digitalization confer only marginal improvements [20,22,25].
This non-linear trend was reflected in the residuals of the GLS model: we observed systematic patterns indicating that the linear fit over-predicts smart city scores for the most digitally advanced cities while under-predicting for moderately digitalized cities. Such patterns are a classic sign of model misspecification in functional form. Indeed, the evidence hints at a threshold effect or an inverted-U relationship rather than a single constant slope. Our findings resonate with those of [ 11], who hypothesize the presence of a tipping point in the digitalization–urban outcome nexus beyond which additional technology implementation yields diminishing benefits. In their analysis of Italian cities, an excess of digital infrastructure was found to eventually reduce the marginal gains for attracting innovative companies. Similarly, in our study, there appears to be a point of saturation where the Smart City Index no longer rises proportionally with the Digital Technology Index. For example, some of the top-tier digital cities in our sample (with Digital Technology Index values above 0.8 on a 0–1 scale) register Smart City Index scores that cluster near the upper limit (around 5 out of 5), suggesting a ceiling effect. This piecewise relationship is consistent with an S-curve dynamics often noted in technology adoption and city development literatures. However, because our current model is purely linear, it captures only an average effect across the whole range and therefore underestimates the smart city advantages of going from very low to moderate digitalization, while overestimating the gains from pushing digitalization from an already high level to an even higher one. These results imply that the true impact of digital infrastructure on smart city performance is more complex than a straight line, and a single linear coefficient cannot fully describe the nuanced interplay between them.
4.2. Stakeholder Interview Insights
To complement the quantitative analysis, we conducted semi-structured interviews with key stakeholders involved in Thailand's smart city initiatives between October and December 2024. Two interviews were particularly informative: one with a senior digital innovation official from the Eastern Economic Corridor Office (Respondent A), and another with a municipal smart city coordinator from the broader EEC region (Respondent B).
Validation of Diminishing Returns Hypothesis: Respondent A, confirmed our quantitative findings regarding non-linear returns to digital investment. They noted that while initial digital deployments produced rapid improvements in management and energy efficiency within 18 months, subsequent technology additions yielded progressively smaller gains. This experiential evidence aligns with our econometric results showing diminishing marginal returns at higher levels of digital maturity.
Governance as Critical Mediator: Both respondents emphasized that the transition from technology-driven to sustainable smart city gains required fundamental shifts toward collaborative governance. They described moving from "top-down technology deployment" to "collaborative innovation" involving universities, businesses, and residents. This institutional evolution supports our theoretical framework linking digital infrastructure effectiveness to Quadruple Helix governance arrangements.
Regional Spillover Effects: Respondent B provided evidence of positive externalities from Wang Chan Valley's Quadruple Helix approach. They described how neighboring municipalities adapted WCV's digital systems and, more importantly, its stakeholder engagement methods. Spillover mechanisms included knowledge transfer workshops, regional supply chain development, and workforce training programs—confirming our hypothesis about innovation hubs generating broader urban benefits.
Institutional Constraints in Scaling: Both respondents highlighted challenges in replicating WCV's success across smaller municipalities, particularly regarding institutional capacity for multi-stakeholder collaboration. Respondent B noted that while technology costs are declining, the human capital and coordination requirements for effective implementation may actually increase as cities move beyond basic digitalization.
These interviews validate key aspects of our theoretical framework while revealing important contextual factors specific to emerging economy contexts. The stakeholder perspectives confirm that digital infrastructure effectiveness is mediated by governance quality and that innovation hubs can generate positive spillovers through deliberate knowledge transfer mechanisms. However, they also suggest that the S-curve dynamic we observed quantitatively may be more pronounced in developing urban systems due to uneven institutional capacity, potentially creating new forms of digital divide based on governance capability rather than technological access alone.
5. Discussion
The empirical results provide robust evidence that digital infrastructure exerts a significant positive influence on smart city performance, particularly during the early stages of digital adoption. This finding reinforces the prevailing view in the literature that investments in ICT infrastructure—such as broadband connectivity, digital platforms, and smart public services—play a central role in enhancing urban efficiency, governance, and livability [1,2,3]. For cities in the initial phases of digital transformation, targeted expansions in technological capacity can yield disproportionate benefits across multiple domains, including mobility, governance, and service delivery.
Nonetheless, the analysis also identifies a non-linear dynamic with potential of diminishing returns to digitalization at higher levels of digital maturity. This suggests that the marginal impact of further investment in ICT infrastructure declines as cities move beyond foundational digital thresholds. Such dynamics are consistent with the theoretical predictions of threshold-based development models and the inverted-U pattern frequently observed in innovation economics [8,13,14]. In the urban context, this implies that digital infrastructure, while essential, becomes insufficient as a sole driver of performance beyond a certain saturation point. However, this requires more samples to draw conclusions as it may be due to noise.
The experience of Wang Chan Valley (WCV) exemplifies this trajectory. As a flagship innovation zone in Thailand's Eastern Economic Corridor, WCV demonstrated rapid gains in smart service deployment following early investments in 5G networks, sensor grids, and data platforms. These technological upgrades enabled the provision of integrated services such as e-government portals, telehealth systems, and intelligent energy management. However, further progress required not just the expansion of digital hardware, but also the alignment of institutional capacity, human capital, and multi-actor governance mechanisms. Local initiatives—such as resident energy awareness programmes and the establishment of digital training centres—illustrate the necessity of complementing infrastructure with social and institutional development.
Such a transition aligns closely with the Quadruple Helix (QH) model of innovation, which emphasises the co-evolutionary interaction between government, industry, academia, and civil society [6,7]. According to this framework, digital infrastructure alone cannot sustain innovation unless embedded within inclusive, participatory, and coordinated governance systems. In WCV, the creation of collaborative platforms, public-private partnerships, and participatory planning mechanisms supports the view that long-term urban transformation is contingent on institutional as much as technological readiness.
A further dimension of significance concerns the potential for innovation zones like WCV to generate spillover effects beyond their immediate geographic boundaries. Although not directly estimated in the panel model, WCV was designed with the strategic intent to act as a regional catalyst for knowledge transfer, workforce development, and innovation-led growth. Evidence from analogous contexts suggests that such externalities—ranging from supply chain stimulation to inter-firm collaboration—can emerge under conditions of spatial connectivity and institutional openness [9,10]. However, absent deliberate policy frameworks and cross-jurisdictional governance, smart zones may instead become spatial enclaves, delivering concentrated benefits without broader regional integration.
The institutional and socio-economic constraints frequently encountered in emerging economy contexts must also be acknowledged. Limited fiscal space, regulatory inertia, and skills shortages often undermine the scaling of smart city projects beyond pilot initiatives [16]. While WCV benefited from substantial public and corporate investment, the replication of such models elsewhere will depend on adaptive governance, decentralised capacity-building, and sustained political support. The risk of deepening digital divides—wherein access to infrastructure and digital services remains uneven—also underscores the importance of civic inclusion as a foundational design principle.
The QH framework thus offers not only a conceptual model but also a practical governance ethos. By facilitating interaction among public institutions, private sector actors, academic organisations, and local communities, this approach provides the structural flexibility needed to translate technological potential into sustainable urban development outcomes.
Our econometric findings are confirmed by interviews with key stakeholders in Thailand's smart city programs. A senior official from the Eastern Economic Corridor Office verified the non-linear relationship we found, explaining that initial digital systems in Wang Chan Valley quickly improved traffic management and energy efficiency, but later additions produced smaller gains. This confirms our results showing diminishing returns at higher digital maturity levels and highlights the shift from technology-focused to governance-focused development in mature smart cities.
A municipal coordinator from the broader EEC region described how neighboring municipalities replicated WCV's approach through knowledge transfer workshops and regional coordination meetings. Cities adopted both digital infrastructure and stakeholder engagement protocols, creating a replication model for other regions. However, both respondents identified capacity gaps that prevent successful scaling: smaller municipalities lack dedicated digital teams, have limited budgets for cross-sector collaboration, and struggle across departments.
This suggests cities should prioritize building governance capacity before major technology investments. Policy recommendations would include establishing regional coordination hubs, creating standardized stakeholder frameworks, and developing tiered implementation strategies that match technology deployment to local institutional capacity.
6. Discussion
This study examined the relationship between digital infrastructure and smart city performance using a multi-city panel dataset from an emerging economy context. The results indicate that digital infrastructure has a strong and statistically significant association with improvements in smart city indicators across multiple domains. However, the effect is non-linear: smart city only improves after a certain threshold of digital infrastructure with a potential of diminishing returns in higher indicator. This finding highlights the limits of purely technology-driven urban strategies and supports the proposition that institutional and social systems must co-evolve alongside infrastructure deployment.
The case of Wang Chan Valley illustrates this trajectory. While initial gains were driven by state-of-the-art digital infrastructure, continued progress has depended on capacity-building, inter-sectoral coordination, and inclusive governance. The experience of WCV reinforces the relevance of the Quadruple Helix model in shaping effective innovation ecosystems. When technology is implemented through collaborative frameworks that engage the public sector, industry, academia, and civil society, the likelihood of long-term, inclusive, and adaptive smart urban development increases substantially.
Several policy implications arise from these findings. First, cities should view digital infrastructure not as an end in itself but as a strategic enabler within a broader innovation ecosystem. Second, governance mechanisms that facilitate stakeholder participation, regulatory flexibility, and institutional learning should be prioritised. Third, regional planning frameworks must be designed to maximise spillover effects from innovation hubs to surrounding urban and rural areas.
Future research may build on these findings in multiple directions. First, micro-level analyses—including survey-based evaluations or process tracing—could clarify the specific mechanisms through which digital infrastructure affects smart city outcomes. Second, spatial econometric approaches may help estimate the regional spillover effects of innovation districts like WCV. Third, disaggregated studies of particular technological domains (e.g. AI, 5G, or digital twins) may reveal heterogeneity in impacts across smart city components. Finally, comparative studies across Global South contexts would contribute to a more generalisable understanding of how institutional structures mediate digital transformation trajectories.
In sum, the findings underscore that the path to smart urbanism in emerging economies is neither linear nor solely technological. Instead, it demands an integrated approach—one that combines digital infrastructure with adaptive governance, inclusive participation, and long-term institutional resilience.
Funding
This research received no external funding
Data Availability Statement
This will be available upon request to the corresponding authors.
Conflicts of Interest
The authors declare no conflict of interest.
Abbreviations
The following abbreviations are used in this manuscript:
| WCV | Wang Chan Valley |
| GLS | generalized least squares |
Appendix A. Regression Results for Sub-Indices
Appendix A.1
The following tables present the disaggregated results of the Generalized Least Squares (GLS) regression models for each of the seven sub-indices that constitute the composite Smart City Index. Table A1, Table A2, Table A3 and Table A4 show the estimated effects of the Digital Technology Index and other control variables on the Environment, Energy, Economy, Governance, Living, Mobility, and People indices, respectively. This granular analysis provides a more detailed view of the relationships explored in the main body of the paper, highlighting how digital infrastructure impacts specific domains of smart city performance.

Table A1.
GLS result on Environment and Energy indices.
| Environment | Energy | |||||||||||
|---|---|---|---|---|---|---|---|---|---|---|---|---|
| Model 1 | Model 2 | Model 3 | Model 1 | Model 2 | Model 3 | |||||||
| Coeff. | S.E. | Coeff. | S.E. | Coeff. | S.E. | Coeff. | S.E. | Coeff. | S.E. | Coeff. | S.E. | |
| Digital technology index | 4.354 | 0.716 | 4.156 | 0.669 | 4.404 | 0.654 | 3.755 | 0.635 | 3.726 | 0.595 | 3.744 | 0.58 |
| Digital technology index squared | 0.13 | 1.973 | -0.264 | 1.969 | -0.358 | 1.749 | -0.702 | 1.753 | ||||
| GPP per capita | 0.415 | 0.734 | 0.492 | 0.651 | ||||||||
| Annual GINI value | -0.192 | 0.236 | -0.203 | 0.234 | -0.31 | 0.209 | -0.325 | 0.207 | ||||
| Government R&D | -0.568 | 0.302 | -0.555 | 0.298 | -0.568 | 0.268 | -0.56 | 0.265 | ||||
| R-Squared | 0.289 | 0.267 | 0.287 | 0.291 | 0.263 | 0.288 | ||||||
| Chi-Squared | 51.226 | 47.057 | 51.58 | 51.757 | 46.074 | 51.695 | ||||||
Table A2.
GLS result on Economy and Governance indices.
| Environment | Energy | |||||||||||
|---|---|---|---|---|---|---|---|---|---|---|---|---|
| Model 1 | Model 2 | Model 3 | Model 1 | Model 2 | Model 3 | |||||||
| Coeff. | S.E. | Coeff. | S.E. | Coeff. | S.E. | Coeff. | S.E. | Coeff. | S.E. | Coeff. | S.E. | |
| Digital technology index | 4.354 | 0.716 | 4.156 | 0.669 | 4.404 | 0.654 | 3.755 | 0.635 | 3.726 | 0.595 | 3.744 | 0.58 |
| Digital technology index squared | 0.13 | 1.973 | -0.264 | 1.969 | -0.358 | 1.749 | -0.702 | 1.753 | ||||
| GPP per capita | 0.415 | 0.734 | 0.492 | 0.651 | ||||||||
| Annual GINI value | -0.192 | 0.236 | -0.203 | 0.234 | -0.31 | 0.209 | -0.325 | 0.207 | ||||
| Government R&D | -0.568 | 0.302 | -0.555 | 0.298 | -0.568 | 0.268 | -0.56 | 0.265 | ||||
| R-Squared | 0.289 | 0.267 | 0.287 | 0.291 | 0.263 | 0.288 | ||||||
| Chi-Squared | 51.226 | 47.057 | 51.58 | 51.757 | 46.074 | 51.695 | ||||||
Table A3.
GLS result on Living and Mobility indices.
| Living | Mobility | |||||||||||
|---|---|---|---|---|---|---|---|---|---|---|---|---|
| Model 1 | Model 2 | Model 3 | Model 1 | Model 2 | Model 3 | |||||||
| Coeff. | S.E. | Coeff. | S.E. | Coeff. | S.E. | Coeff. | S.E. | Coeff. | S.E. | Coeff. | S.E. | |
| Digital technology index | 3.189 | 0.699 | 2.87 | 0.655 | 3.721 | 0.647 | 4.896 | 0.718 | 4.498 | 0.673 | 5.343 | 0.661 |
| Digital technology index squared | 3.728 | 1.926 | 3.288 | 1.93 | 2.987 | 1.977 | 2.538 | 1.981 | ||||
| GPP per capita | 0.139 | 0.716 | 0.393 | 0.735 | ||||||||
| Annual GINI value | -0.159 | 0.231 | -0.151 | 0.231 | -0.028 | 0.237 | -0.03 | 0.236 | ||||
| Government R&D | -0.612 | 0.295 | -0.554 | 0.295 | -0.548 | 0.303 | -0.494 | 0.302 | ||||
| R-Squared | 0.245 | 0.216 | 0.223 | 0.366 | 0.342 | 0.353 | ||||||
| Chi-Squared | 40.94 | 35.593 | 36.663 | 72.789 | 66.924 | 69.962 | ||||||
Table A4.
GLS result on People index.
| People | ||||||
|---|---|---|---|---|---|---|
| Model 1 | Model 2 | Model 3 | ||||
| Coeff. | S.E. | Coeff. | S.E. | Coeff. | S.E. | |
| Digital technology index | 9.602 | 1.602 | 9.24 | 1.493 | 9.093 | 1.465 |
| Digital technology index squared | -3.779 | 4.414 | -4.565 | 4.395 | ||
| GPP per capita | 0.24 | 1.642 | ||||
| Annual GINI value | -0.534 | 0.529 | -0.553 | 0.524 | ||
| Government R&D | -1.225 | 0.677 | -1.272 | 0.669 | ||
| R-Squared | 0.264 | 0.245 | 0.26 | |||
| Chi-Squared | 45.248 | 41.861 | 44.924 | |||
References
- Caragliu, A.; Del Bo, C.; Nijkamp, P. Smart Cities in Europe. J. Urban Technol. 2011, 18, 65–82. [Google Scholar] [CrossRef]
- Albino, V.; Berardi, U.; Dangelico, R.M. Smart Cities: Definitions, Dimensions, Performance, and Initiatives. Cities 2015, 43, 3–25. [Google Scholar] [CrossRef]
- Lim, Y.; Edelenbos, J.; Gianoli, A. What is the impact of smart city development? Empirical evidence from a Smart City Impact Index. Urban Gov. 2022, 4, 47–55. [Google Scholar] [CrossRef]
- Lombardi, P.; Giordano, S.; Farouh, H.; Yousef, W. Modelling the smart city performance. Innov. Eur. J. Soc. Sci. Res. 2012, 25, 137–149. [Google Scholar] [CrossRef]
- Myovella, G.; Karacuka, M.; Haucap, J. Digitalization and economic growth: A comparative analysis of developed and developing countries. Telecommunications Policy 2020, 44, 101856. [Google Scholar] [CrossRef]
- Caragliu, A.; Del Bo, C. Smartness and European urban performance: assessing the local impacts of smart urban attributes. Innov. Eur. J. Soc. Sci. Res. 2012, 25, 97–113. [Google Scholar] [CrossRef]
- Laursen, K.; Salter, A. Open for innovation: the role of openness in explaining innovation performance among U.K. manufacturing firms among U.K. manufacturing firms. K. manufacturing firms among U.K. manufacturing firms. Strat. Manag. J. 2006, 27, 131–150. [Google Scholar] [CrossRef]
- Aghion, P.; Bloom, N.; Blundell, R.; Griffith, R.; Howitt, P. Competition and Innovation: an Inverted-U Relationship. Q. J. Econ. 2005, 120, 701–728. [Google Scholar] [CrossRef]
- Neirotti, P.; De Marco, A.; Cagliano, A.C.; Mangano, G.; Scorrano, F. Current trends in Smart City initiatives: Some stylised facts. Cities 2014, 38, 25–36. [Google Scholar] [CrossRef]
- Ji, M.; Jin, M.; Chen, L.; Liu, Y.; Tian, Y. Promoting Urban Innovation through Smart Cities: Evidence from a Quasi-Natural Experiment in China. Land 2023, 13, 619. [Google Scholar] [CrossRef]
- Senna, P.P.; Roca, J.B.; Barros, A.C. Overcoming barriers to manufacturing digitalization: Policies across EU countries. Technol. Forecast. Soc. Chang. 2023, 196. [Google Scholar] [CrossRef]
- Grossman, G.M.; Krueger, A.B. Economic Growth and the Environment. Q. J. Econ. 1995, 110, 353–377. [Google Scholar] [CrossRef]
- Semlali, A.S.; Khan, M.S. Threshold Effects in the Relationship Between Inflation and Growth. IMF Work. Pap. 2001, 48, 1–21. [Google Scholar] [CrossRef]
- Hansen, B.E. Sample Splitting and Threshold Estimation. Econometrica 2000, 68, 575–603. [Google Scholar] [CrossRef]
- Azariadis, C.; Drazen, A. Threshold Externalities in Economic Development. Q. J. Econ. 1990, 105, 501–526. [Google Scholar] [CrossRef]
- Yigitcanlar, T.; Desouza, K.C.; Butler, L.; Roozkhosh, F. Contributions and Risks of Artificial Intelligence (AI) in Building Smarter Cities: Insights from a Systematic Review of the Literature. Energies 2021, 118, 103270. [Google Scholar] [CrossRef]
- Digital Economy Promotion Agency. (2025). Homepage. Retrieved from https://www.depa.or.th/en/home.
- Greene, W. H. (2003). Econometric Analysis (5th ed.). Prentice Hall.
- Wooldridge, J. M. (2010). Econometric Analysis of Cross Section and Panel Data (2nd ed.). The MIT Press.
- Wallace, T.D.; Hussain, A. The Use of Error Components Models in Combining Cross Section with Time Series Data. Econometrica 1969, 37, 55. [Google Scholar] [CrossRef]
- Parks, R.W. Efficient Estimation of a System of Regression Equations when Disturbances are Both Serially and Contemporaneously Correlated. J. Am. Stat. Assoc. 1967, 62, 500–509. [Google Scholar] [CrossRef]
- Hausman, J.A. Specification Tests in Econometrics. Econometrica 1978, 46, 1251–1271. [Google Scholar] [CrossRef]
- Clark, T.S.; Linzer, D.A. Should I Use Fixed or Random Effects? Politi- Sci. Res. Methods 2015, 3, 399–408. [Google Scholar] [CrossRef]
- Inglesi-Lotz, R.; Hakimi, A.; Karmani, M.; Boussaada, R. Threshold effects in the patent-growth relationship: a PSTR approach for 60 developed and developing countries. Appl. Econ. 2020, 52, 3512–3524. [Google Scholar] [CrossRef]
- Beck, N.; Katz, J.N. What To Do (and Not to Do) with Time-Series Cross-Section Data. Am. Politi- Sci. Rev. 1995, 89, 634–647. [Google Scholar] [CrossRef]
- Bell, A.; Jones, K. Explaining Fixed Effects: Random Effects Modeling of Time-Series Cross-Sectional and Panel Data. Politi- Sci. Res. Methods 2015, 3, 133–153. [Google Scholar] [CrossRef]
- Durlauf, S.N.; Johnson, P.A. Multiple regimes and cross-country growth behaviour. J. Appl. Econ. 1995, 10, 365–384. [Google Scholar] [CrossRef]
Figure 1.
Shows a binned plot of Smart City Index and Digital Index.
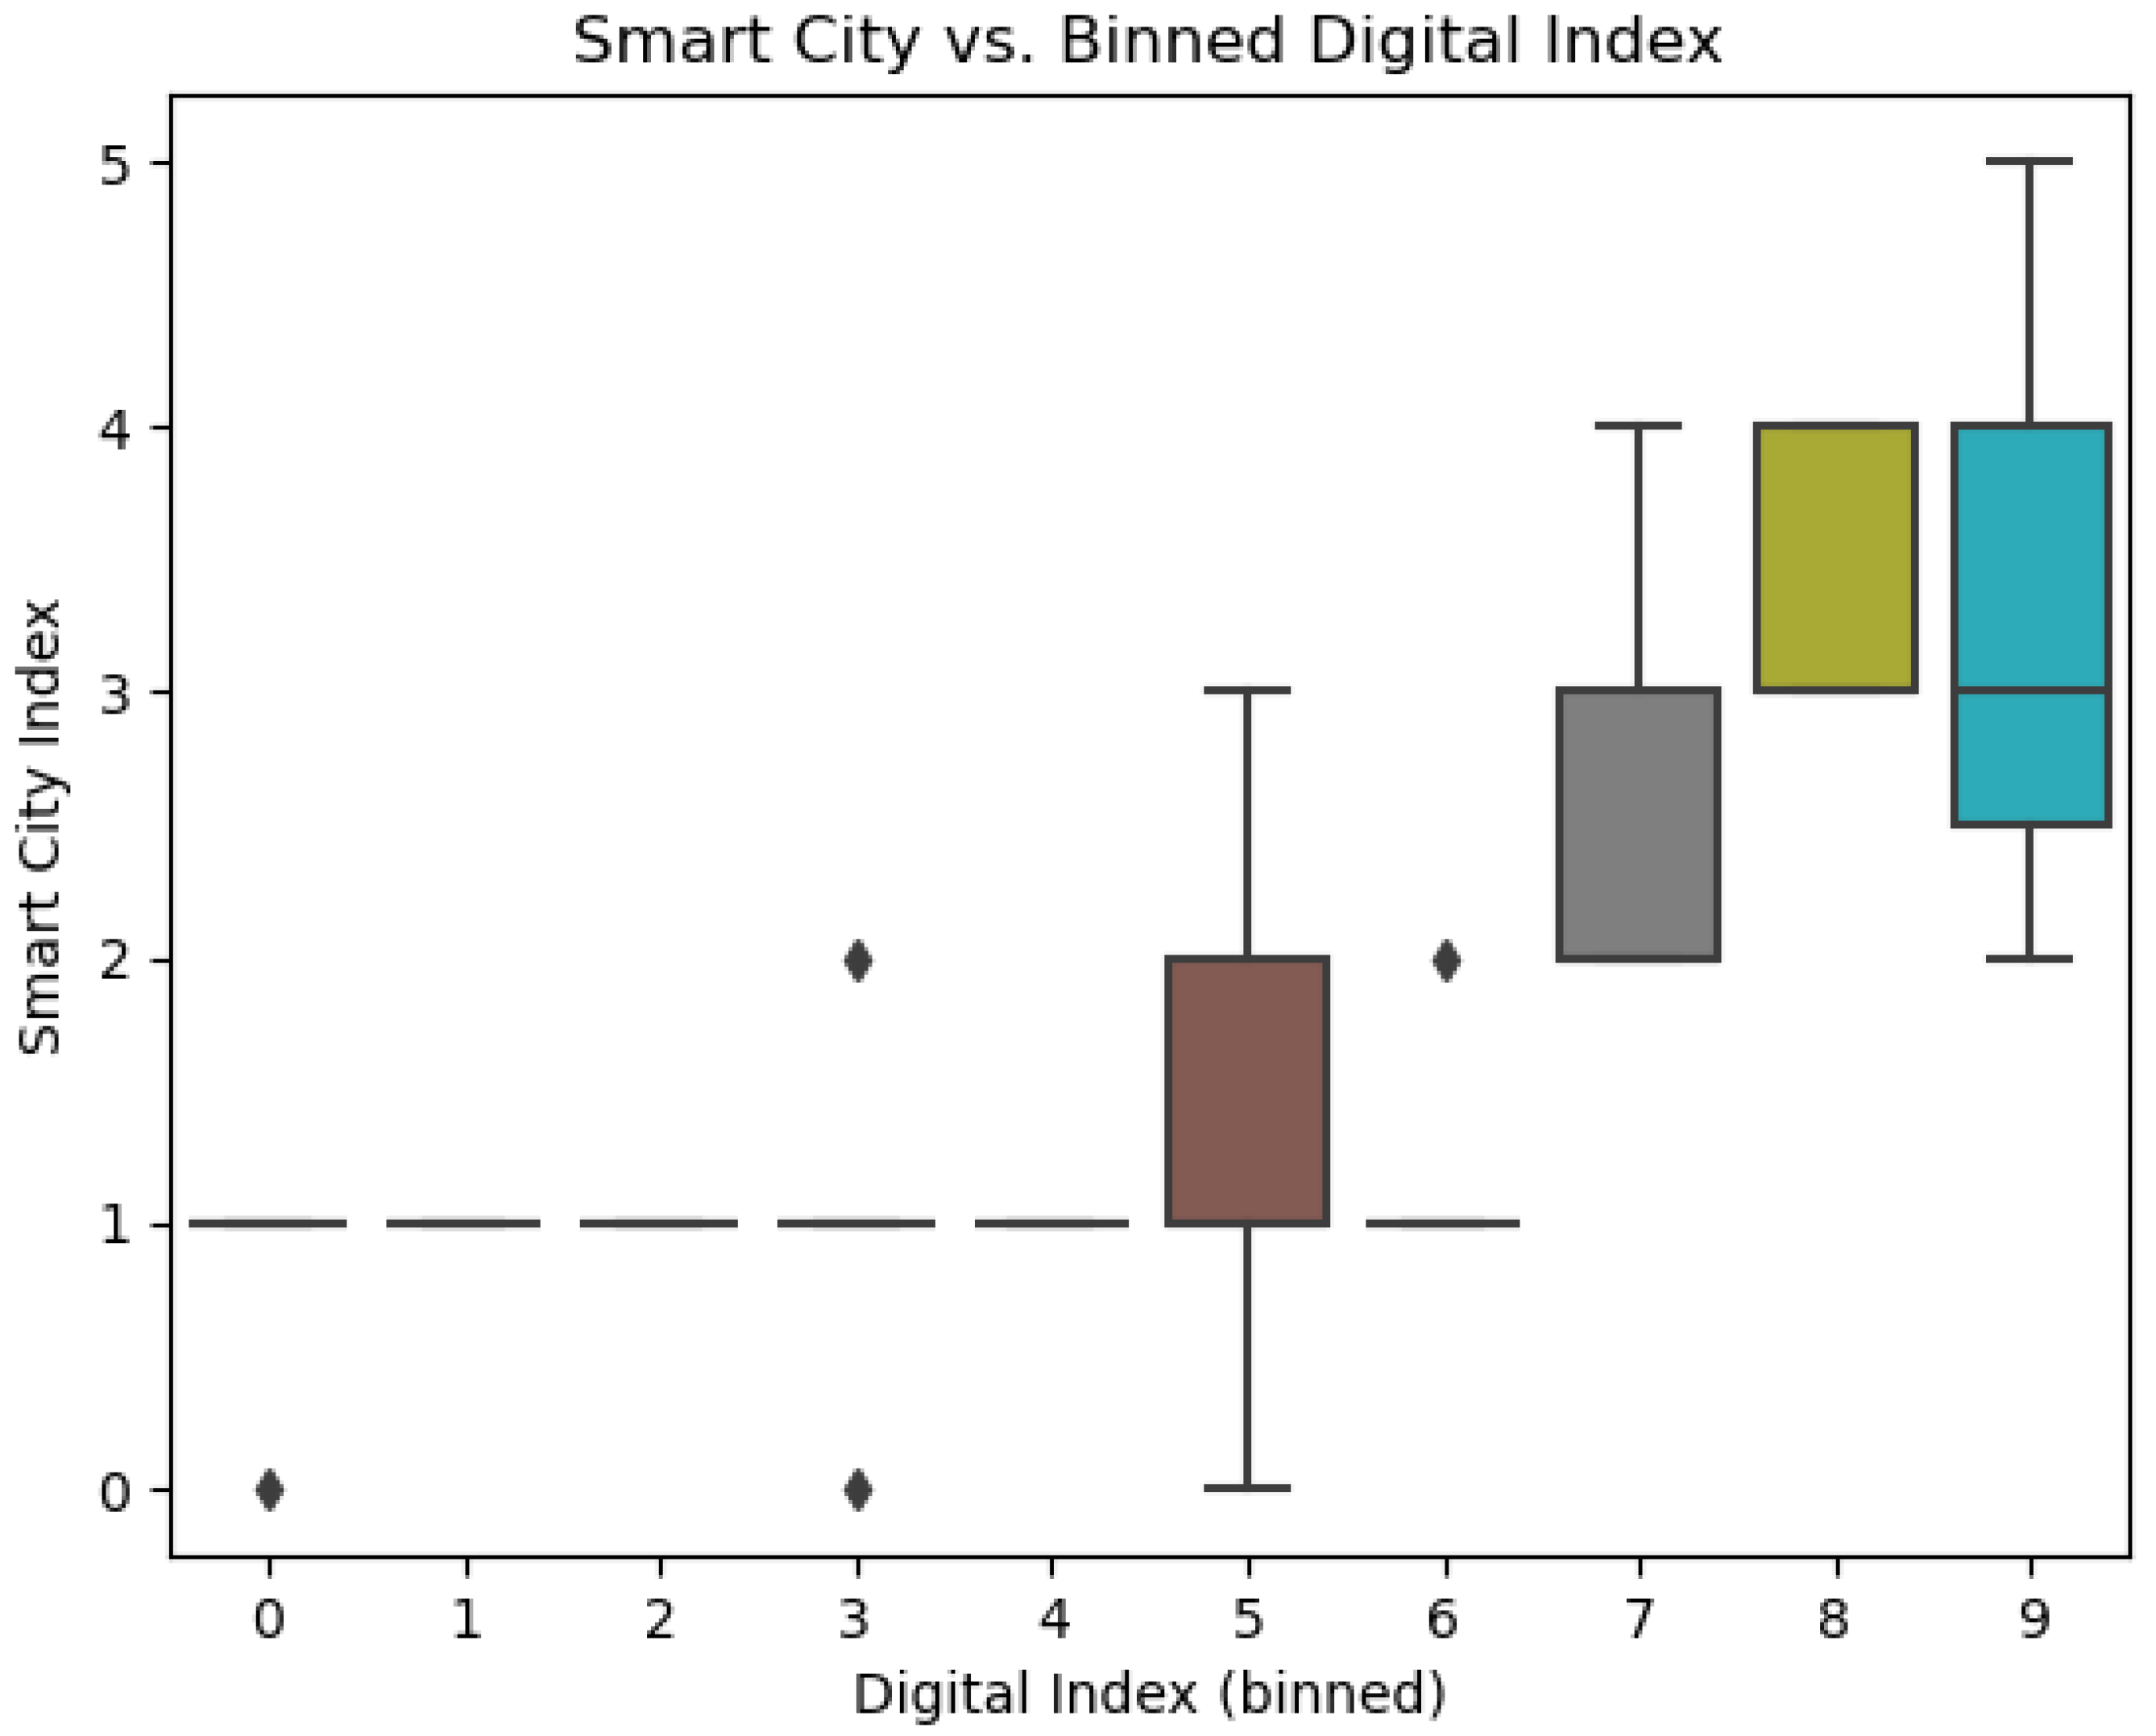
Figure 2.
Shows a probabilistic plot of Smart City Index and Digital Index.
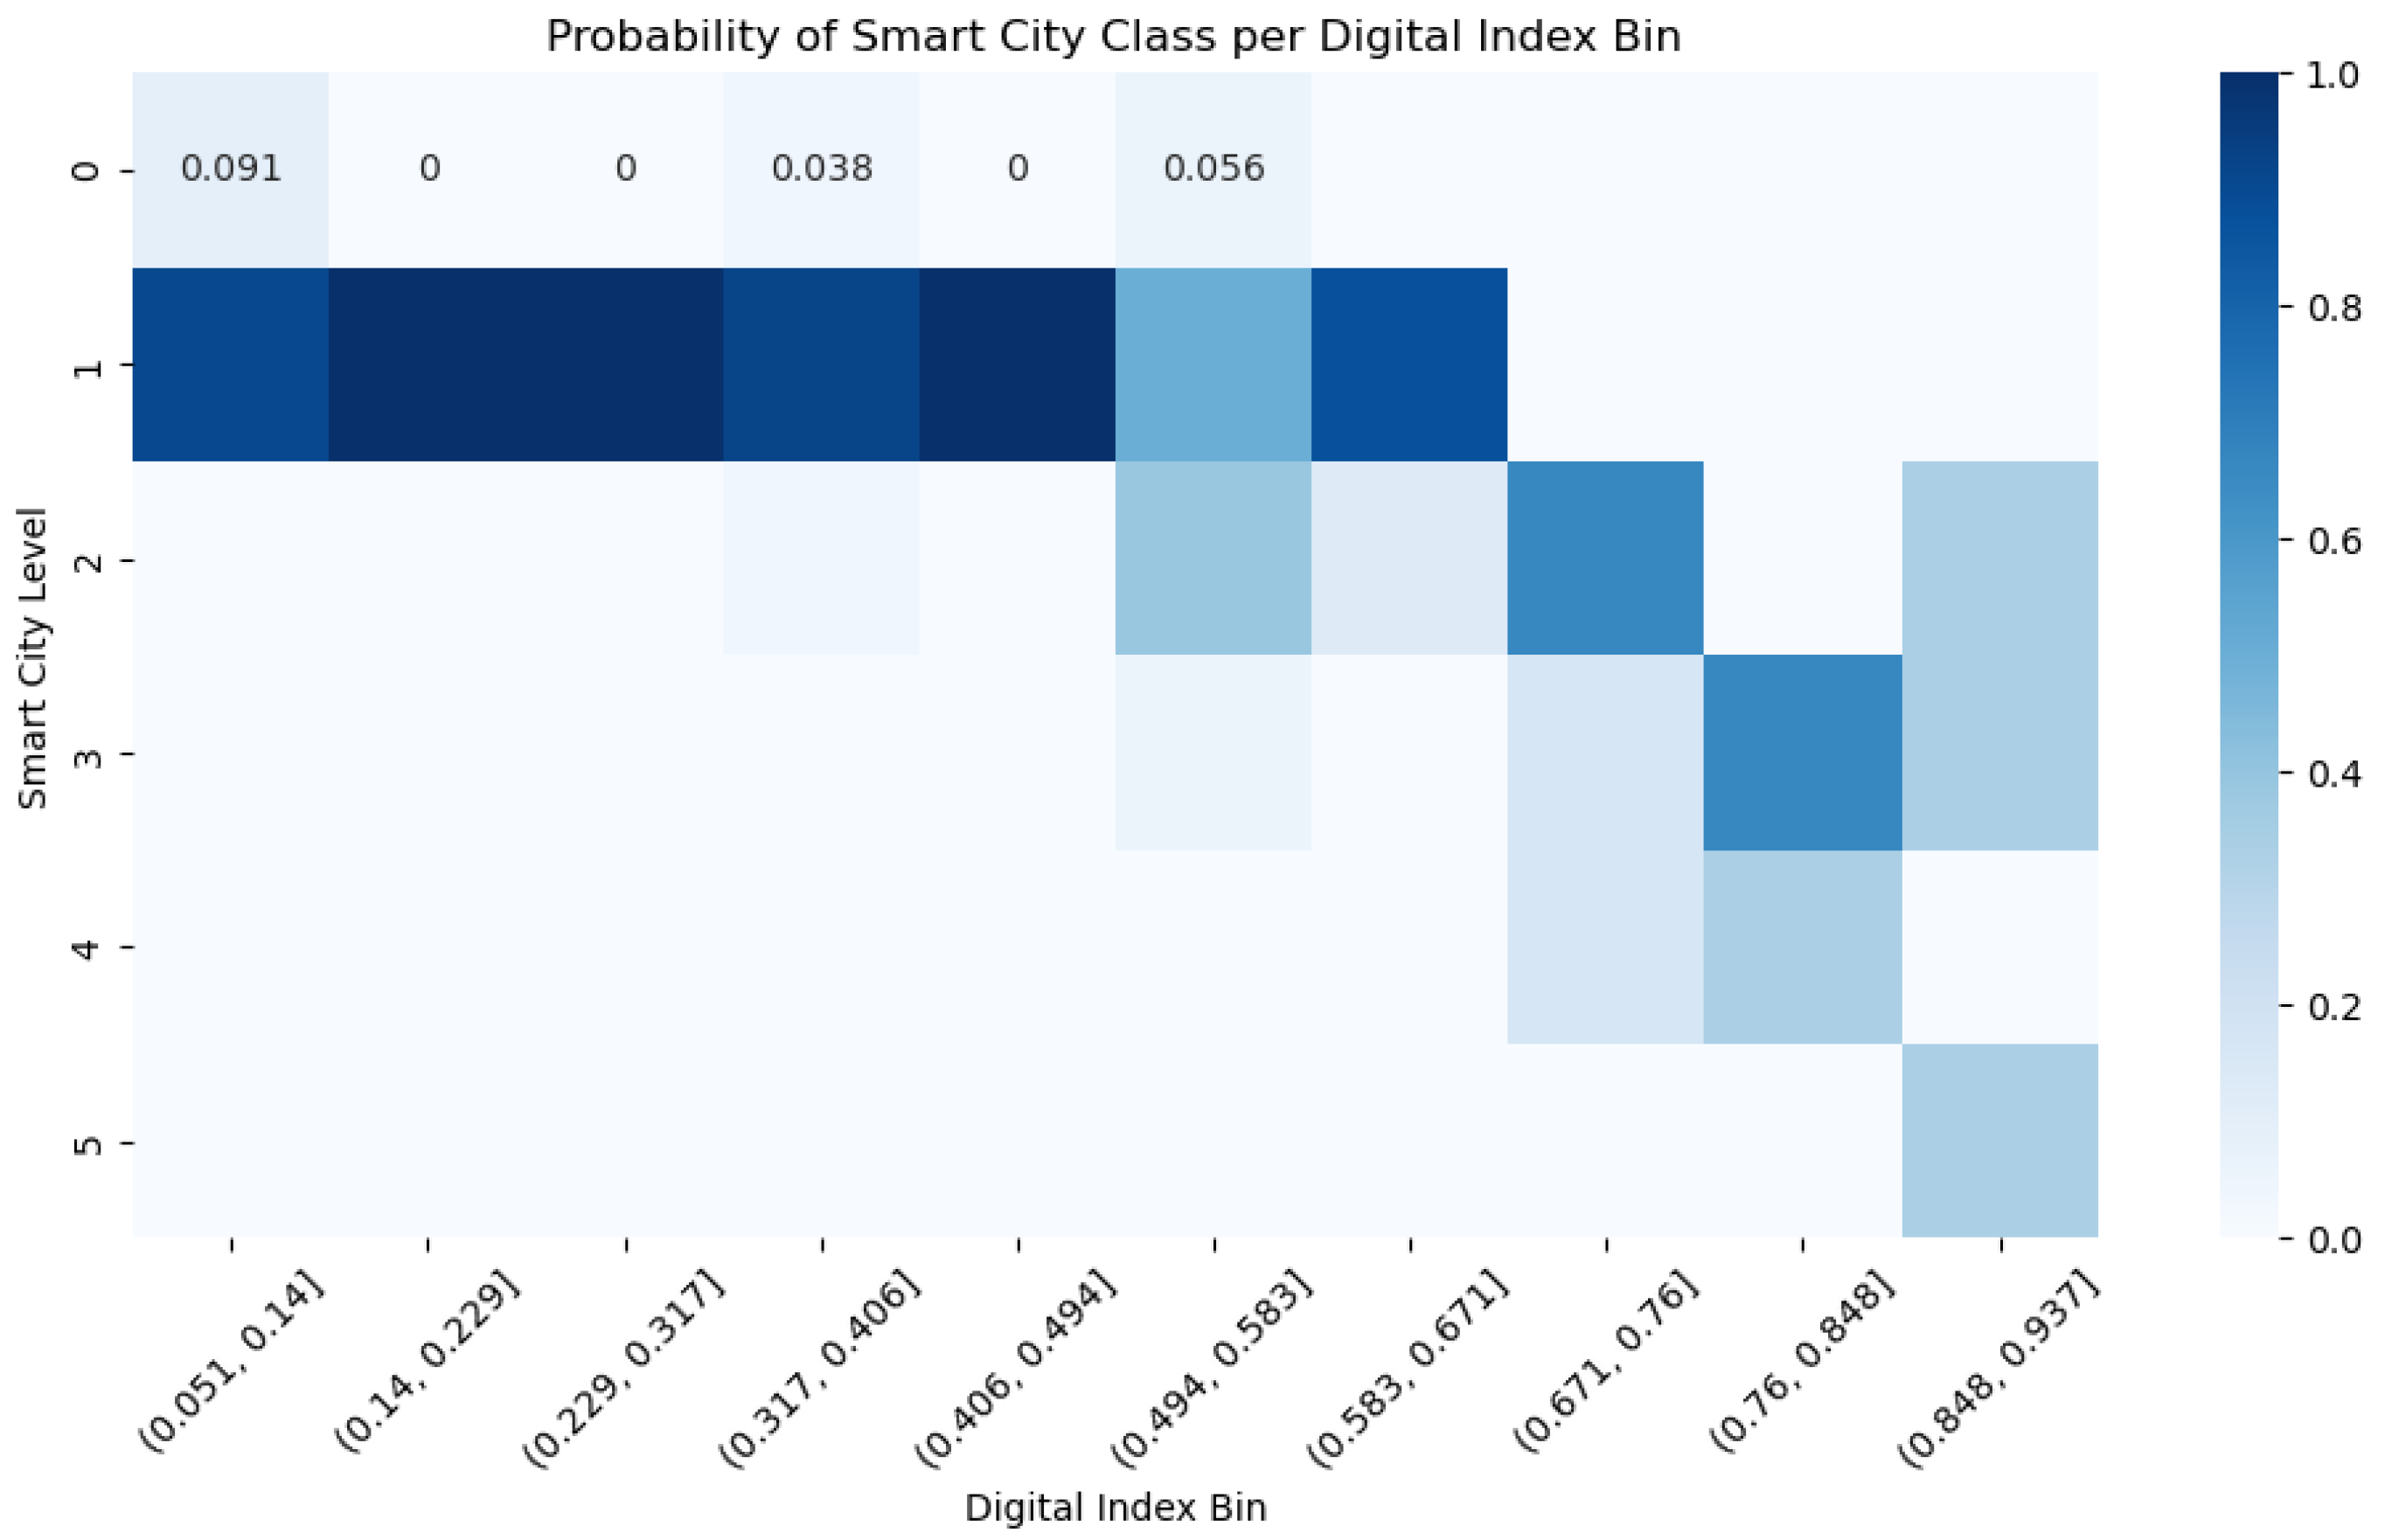
Figure 3.
Shows a scatter plot of Smart City Index and Digital Index with fitted pierce-wise function.
Figure 3.
Shows a scatter plot of Smart City Index and Digital Index with fitted pierce-wise function.
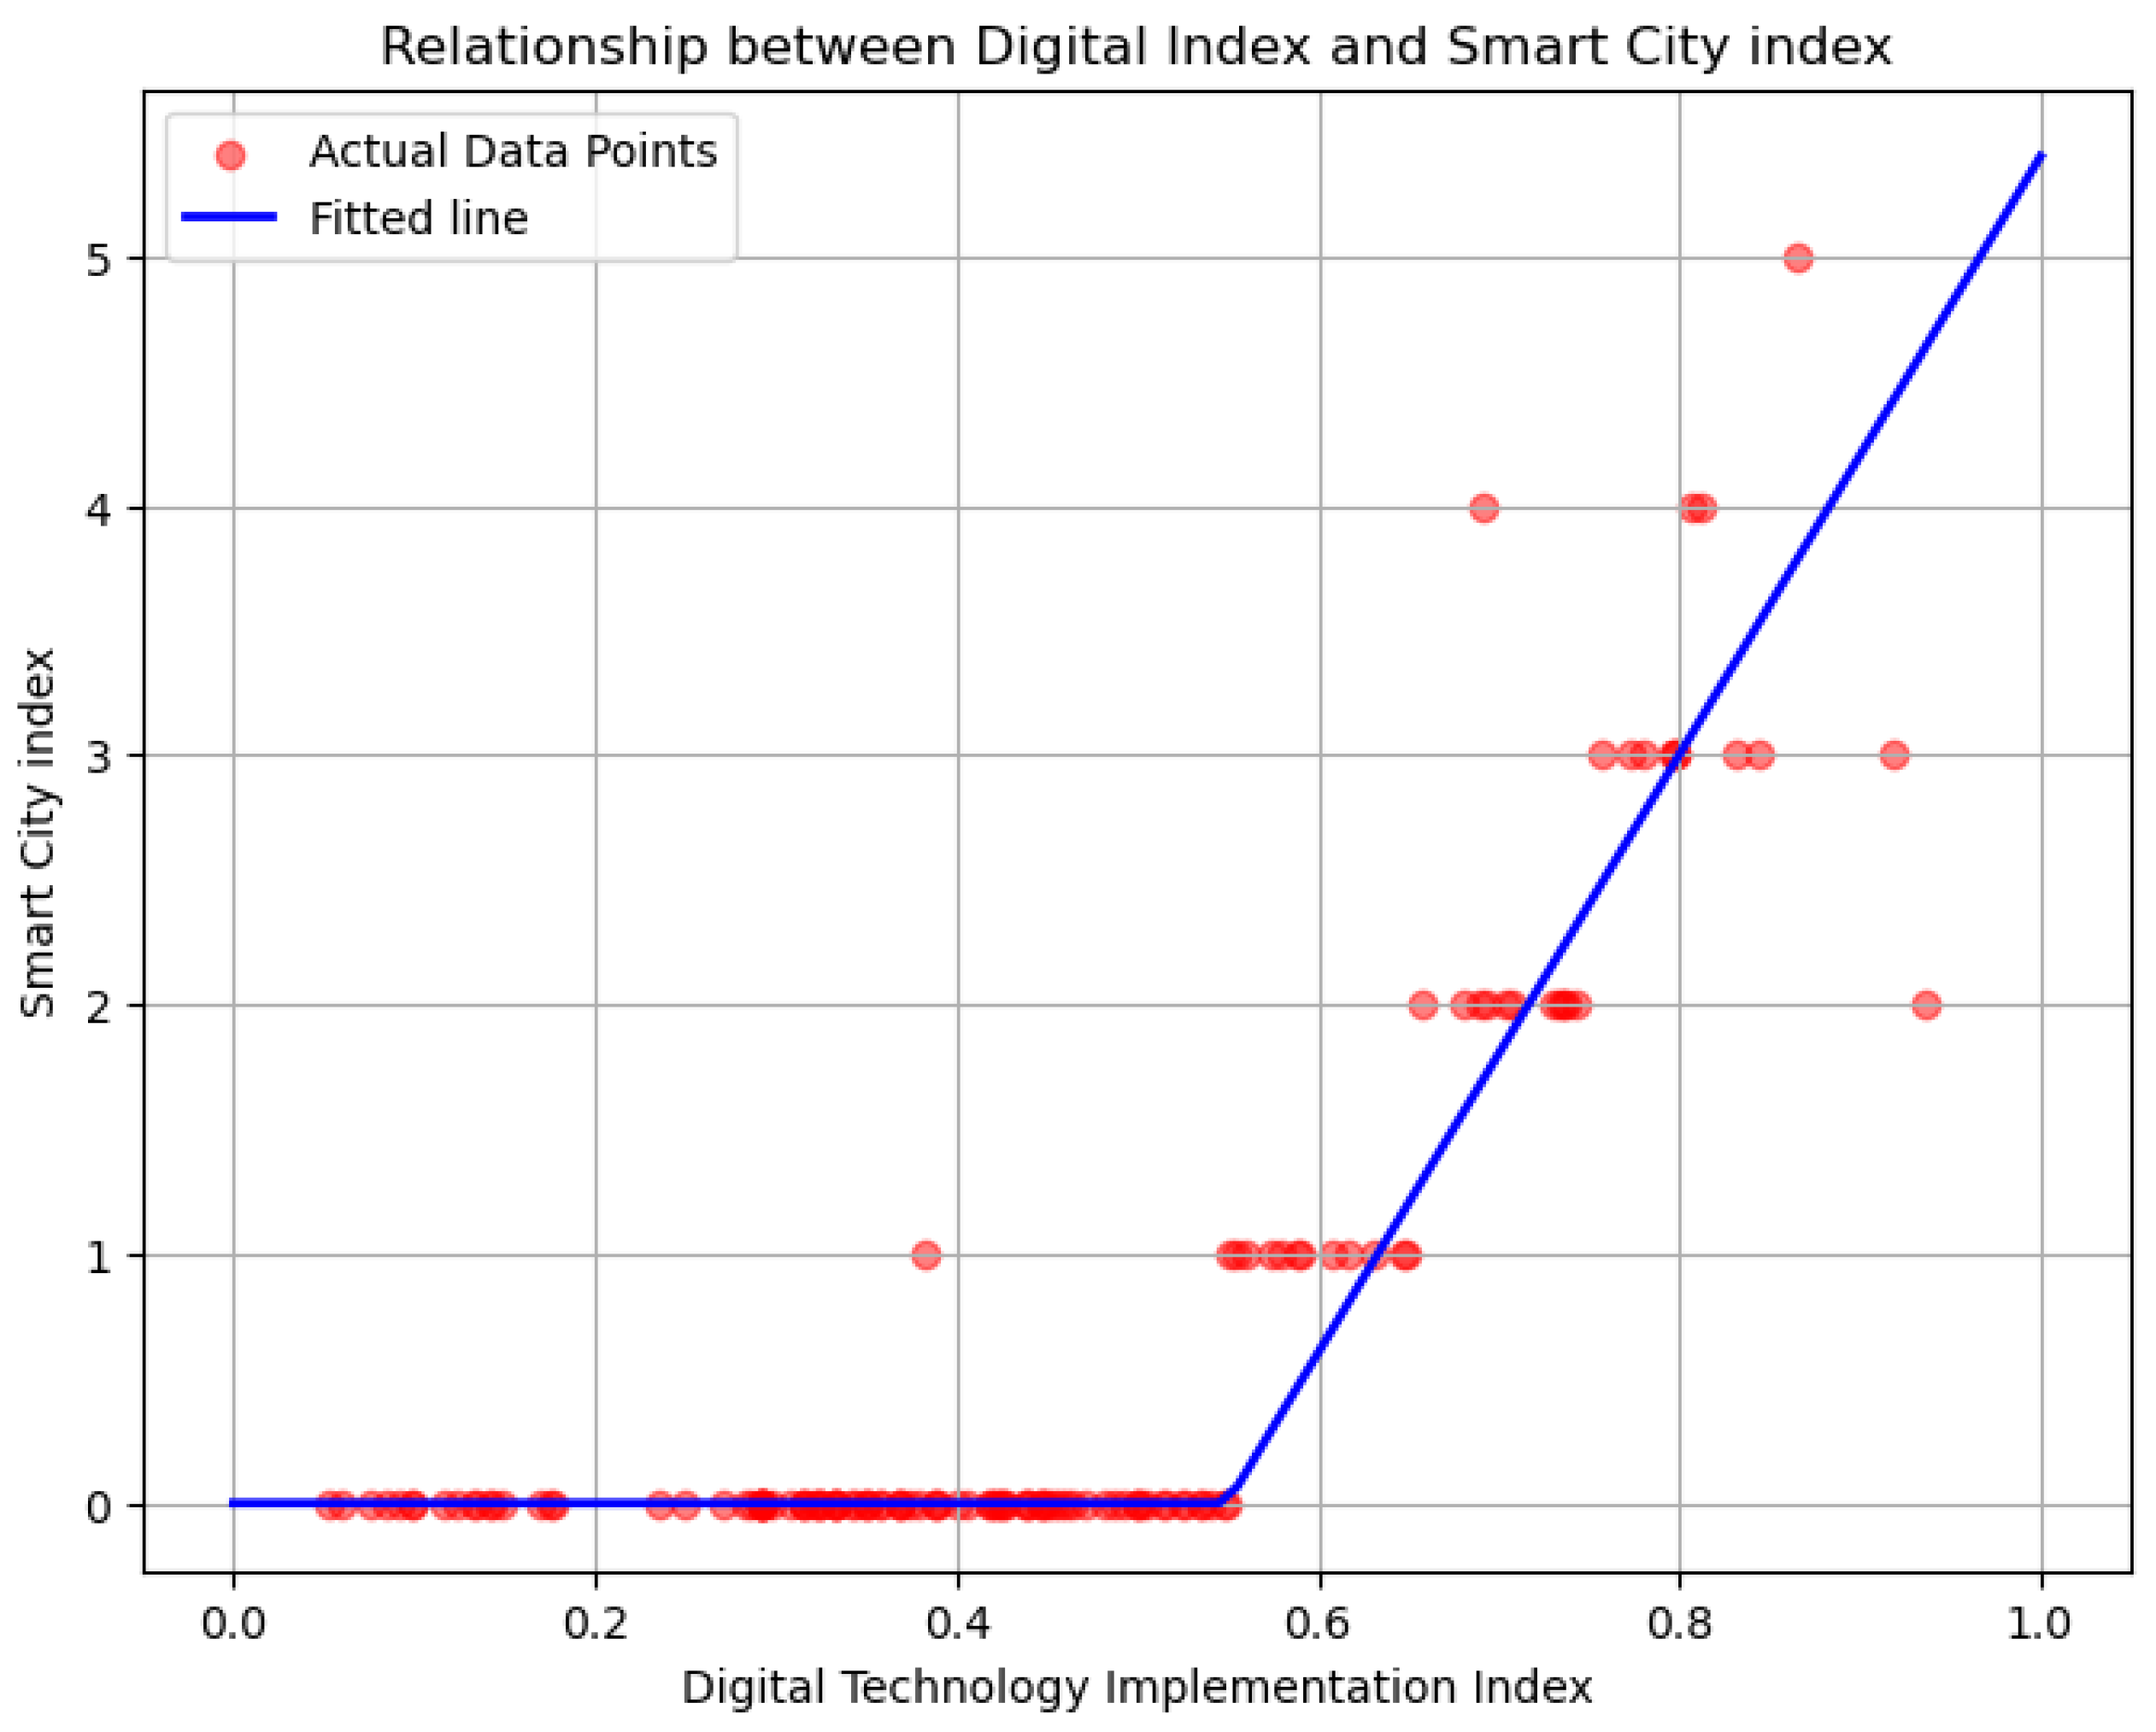
Table 1.
Descriptive statistics of the data.
| Variables | Obs. | Mean | Standard deviation | Min | Max |
|---|---|---|---|---|---|
| Smart city index | 132 | 1.409 | 0.873 | 0.0 | 5.0 |
| Supporting smart city index | 132 | 4.0 | 3.057 | 1.0 | 15.0 |
| Environment index | 132 | 2.197 | 1.244 | 1.0 | 7.0 |
| Energy index | 132 | 1.0 | 1.091 | 0.0 | 5.0 |
| Economy index | 132 | 1.735 | 1.341 | 0.0 | 7.0 |
| Governance index | 132 | 1.78 | 1.333 | 0.0 | 7.0 |
| Living index | 132 | 2.485 | 1.037 | 1.0 | 7.0 |
| Mobility index | 132 | 0.818 | 1.247 | 0.0 | 5.0 |
| People index | 132 | 1.833 | 2.45 | 0.0 | 11.0 |
| Digital technology index | 132 | 0.449 | 0.207 | 0.052 | 0.937 |
| GPP per capita | 132 | 0.223 | 0.256 | 0.0 | 1.0 |
| Annual GINI value | 132 | 0.49 | 0.346 | 0.0 | 1.0 |
| Government R&D | 132 | 0.266 | 0.269 | 0.0 | 1.0 |
Table 2.
Smart city index and supporting smart city index correlations.
| 1 | 2 | 3 | 4 | 5 | 6 | |
|---|---|---|---|---|---|---|
| 1. Smart city index | 1.0 | |||||
| 2. Supporting smart city index | 0.878 | 1.0 | ||||
| 3. Digital technology index | 0.702 | 0.744 | 1.0 | |||
| 4. GPP per capita | 0.775 | 0.809 | 0.968 | 1.0 | ||
| 5. Annual GINI value | 0.092 | 0.113 | 0.131 | 0.146 | 1.0 | |
| 6. Government R&D | -0.105 | -0.135 | -0.185 | -0.204 | -0.07 | 1.0 |
Table 3.
Sub-index correlation matrix.
| Smart Index Correlation matrix | 1 | 2 | 3 | 4 | 5 | 6 | 7 | 8 | 9 | 10 | 11 |
|---|---|---|---|---|---|---|---|---|---|---|---|
| 1. Environment index | 1.0 | ||||||||||
| 2. Energy index | 0.866 | 1.0 | |||||||||
| 3. Economy index | 0.855 | 0.876 | 1.0 | ||||||||
| 4. Governance index | 0.859 | 0.861 | 0.881 | 1.0 | |||||||
| 5. Living index | 0.842 | 0.809 | 0.883 | 0.867 | 1.0 | ||||||
| 6. Mobility index | 0.825 | 0.903 | 0.916 | 0.867 | 0.895 | 1.0 | |||||
| 7. People index | 0.885 | 0.899 | 0.892 | 0.933 | 0.873 | 0.887 | 1.0 | ||||
| 8. Digital technology index | 0.706 | 0.751 | 0.662 | 0.635 | 0.61 | 0.745 | 0.671 | 1.0 | |||
| 9. GPP per capita | 0.745 | 0.778 | 0.715 | 0.672 | 0.682 | 0.802 | 0.705 | 0.968 | 1.0 | ||
| 10. Annual GINI value | 0.091 | 0.133 | 0.029 | 0.095 | 0.04 | 0.138 | 0.067 | 0.131 | 0.146 | 1.0 | |
| 11. Government R&D | -0.111 | -0.141 | -0.105 | -0.121 | -0.09 | -0.1 | -0.126 | -0.185 | -0.204 | -0.07 | 1.0 |
Table 4.
GLS result on smart city index and supporting smart city index using different models.
| GLS Models | Smart City | Supporting Smart City | ||||||||||
|---|---|---|---|---|---|---|---|---|---|---|---|---|
| Model 1 | Model 2 | Model 3 | Model 1 | Model 2 | Model 3 | |||||||
| Variables | Coeff. | S.E. | Coeff. | S.E. | Coeff. | S.E. | Coeff. | S.E. | Coeff. | S.E. | Coeff. | S.E. |
| Digital technology index | 2.948 | 0.504 | 2.648 | 0.475 | 3.606 | 0.48 | 12.226 | 1.586 | 11.496 | 1.488 | 13.717 | 1.478 |
| Digital technology index squared | 4.681 | 1.388 | 4.315 | 1.399 | 10.322 | 4.368 | 9.276 | 4.382 | ||||
| GPP per capita | 0.052 | 0.516 | 0.647 | 1.624 | ||||||||
| Annual GINI value | -0.104 | 0.166 | -0.091 | 0.172 | -0.355 | 0.523 | -0.34 | 0.528 | ||||
| Government R&D | -0.496 | 0.213 | -0.427 | 0.219 | -1.436 | 0.669 | -1.27 | 0.674 | ||||
| Model Metrics | ||||||||||||
| R-Squared | 0.381 | 0.349 | 0.325 | 0.454 | 0.431 | 0.429 | ||||||
| Chi-Squared | 77.58 | 69.181 | 61.69 | 104.573 | 97.582 | 96.08 | ||||||
Disclaimer/Publisher’s Note: The statements, opinions and data contained in all publications are solely those of the individual author(s) and contributor(s) and not of MDPI and/or the editor(s). MDPI and/or the editor(s) disclaim responsibility for any injury to people or property resulting from any ideas, methods, instructions or products referred to in the content. |
© 2025 by the authors. Licensee MDPI, Basel, Switzerland. This article is an open access article distributed under the terms and conditions of the Creative Commons Attribution (CC BY) license (http://creativecommons.org/licenses/by/4.0/).
Copyright: This open access article is published under a Creative Commons CC BY 4.0 license, which permit the free download, distribution, and reuse, provided that the author and preprint are cited in any reuse.


