
Submitted:
21 August 2025
Posted:
21 August 2025
You are already at the latest version
Abstract
Background/Objectives: Non-nutritive sweeteners (NNSs) often taste less palatable than glucose-containing sugars, potentially because they differentially engage sweet taste pathways. We developed a low-calorie rebaudioside D–glucose–sodium (RebD mix) sweetener designed to engage T1R2/T1R3 and sodium–glucose cotransporter 1 (SGLT1) pathways. We tested whether the RebD mix matches sucrose in palatability and neural responses.
Methods: A within-subject fMRI study was performed on 28 healthy adults. Participants received three gustatory conditions: sucrose, RebD mix, and RebD mix without sodium (Na+), which is known to enhance SGLT1 activation. Liking and wanting ratings for gustatory stimuli were obtained at scanning. The imaging analyses focused on the orbitofrontal cortex (OFC), which is associated with palatability.
Results: Liking and wanting did not differ across the three conditions. OFC response to the RebD mix did not differ from sucrose, whereas the RebD without Na+ condition showed greater OFC–postcentral gyrus connectivity than the other two conditions. Across participants, OFC–postcentral connectivity in the RebD without Na+ condition was negatively associated with fullness measured at the scan.
Conclusion: The RebD mix matched sucrose in subjective palatability and OFC responses, while removal of Na+ altered OFC– postcentral connectivity linked to satiety. These findings suggest that oral SGLT1–linked signaling may contribute to satiety-related aspects of sweet taste, and that the RebD mix can provide sucrose-comparable palatability with reduced calories.
Keywords:
non-nutritive sweeteners
; functional MRI
; stevia
; rebaudioside D
1. Introduction
The global prevalence of overweight and obesity has been rapidly increasing, with prevalence nearly doubling between 1990 and 2021 [1]. The global increase in obesity and obese-related noncommunicable diseases, including metabolic disorders (e.g., type 2 diabetes mellitus), cardiovascular diseases, and some cancers, may be closely associated with the widespread consumption of sugar-sweetened beverages (SSBs), which are a major source of added sugars in the diet [2,3]. Given these public health concerns, non-nutritive sweeteners (NNSs) have emerged as popular alternatives to sugar, aiming to provide sweetness with minimal caloric impact. However, the low palatability of NNSs would impede their widespread utilization. For example, sucralose in Splenda® (Heartland Food Products Group, LLC., Indiana, USA), one of the most widely used NNSs, has a bitter, metallic, and chemical taste compared to sucrose [4]. Furthermore, brain imaging studies have indicated that, compare to sugar-sweetened solutions, NNSs would elicit smaller responses in brain regions including the insula/operculum, orbitofrontal cortex (OFC) and striatum [5]. Moreover, brain responses to a NNS solution that was matched to the sweetness level of sucrose differed significantly from brain responses to the sucrose solution [6]. Therefore, even if the sweetness level of NNSs is matched to sucrose, these NNSs would elicit different brain responses in regions associated with palatability than sucrose and thus would be less palatable.
More recently, in addition to artificial sweeteners such as the sucralose, naturally occurring NNSs like stevia has been introduced into the market [7]. Steviol glycosides, which are the sweet-tasting compounds found in the plant stevia Rebaudiana, are perceived as 200–300 times sweeter than sucrose [8,9]. Steviol glycosides are often perceived by consumers as a healthier alternative due to its plant-derived origin [10]. Moreover, in comparison with the two-week glucose intake trial, sucralose or saccharin intake for two weeks impaired glucose tolerance, whereas stevia intake did not [11]. Therefore, steviol glycosides are less likely than other artificial NNSs to disturb sugar metabolism.
Among the steviol glycosides, rebaudioside D (RebD) is more palatable due to its lower bitterness compared to other steviol glycosides, such as rebaudioside A [12,13]. Thus, RebD is a potential candidate for better substitute for sugar than other NNSs. Additionally, recent studies have revealed differences in sweet taste receptors between glucose-containing sugars, such as sucrose, and NNSs [14,15]. Therefore, adding components to RebD that stimulate glucose-containing sugar receptors but not NNS receptors could improve the sweet taste quality of the RebD mixture to make it comparable to sucrose. Traditionally, it is well known that glucose-containing sugars, such as sucrose and glucose, as well as NNSs, are detected by T1r2/T1r3 receptors on taste cells [16,17]. In addition to these receptors, a recent study has suggested that the sodium-glucose cotransporter (SGLT1), which is one of metabolic sensors that serve as sugar sensors in the gut [18], mediates the T1r2/T1r3-independent detection of sugars [19]. Furthermore, the addition of a sodium ion (Na⁺) has a beneficial impact on the detection of glucose-containing sugars, but not NNSs [15]. This Na⁺-induced enhanced response of the gustatory nerves (chorda tympani and glossopharyngeal) to glucose-containing sugars is blocked by a specific SGLT1 antagonist [20]. Together, since SGLT1-related sweet taste detection is enhanced by adding Na⁺ [20] and this beneficial effect is observed for glucose-containing sugars, but not for NNSs [15], the sensing pathways for glucose-containing sugars include T1r2/T1r3 and SGLT1, while the pathway for NNSs would primarily include T1r2/T1r3, not SGLT1. Therefore, it is possible that SGLT1-related sweet taste signals from the oral cavity would play a role in detecting nutrient sugars. Such differences in related sweet taste receptors could result in different brain response to glucose-containing sugars and NNSs, leading to low palatability or satisfaction with NNSs. Thus, to improve sweet taste induced by RebD to be comparable to that induced by sucrose, stimulating the SGLT1 would be essential. We therefore previously invented a new sweetener by combining RebD, glucose, and Na⁺ (the RebD mix), which achieved moderate sweetness while keeping the energy content of the mixture low [13]. RebD component of the RebD mix should initiate the activation of the T1R2/T1R3-related sensing pathways, while the glucose and Na⁺ components of the RebD mix should elicit the SGLT1-related sensing pathways. Therefore, it is reasonable to assume that the RebD mix would activate the similar signaling pathways as sucrose. However, the palatability of the RebD mix compared to sucrose has not been well examined. Additionally, it is unclear whether the brain response to the RebD mix would be similar to its response to glucose-containing sugars, such as sucrose.
In this study, we therefore aimed to compare the brain response to the RebD mix, the RebD mix without Na+, and sucrose, specifically in the OFC, as the OFC is known as the secondary gustatory cortex [21] and processes the palatability of gustatory stimuli [22]. It was hypothesized that, given that the RebD mix, but not the RebD mix without Na+, is believed to elicit the T1r2/T1r3 and SGLT1 sensing pathways in the same way that sucrose does, the RebD mix would elicit a brain response in the OFC that is analogous to the response observed with sucrose.
2. Materials and Methods
2.1. Participants
A total of 28 participants were included in the current study (mean age 22.36 ± standard deviation [SD] 5.20 years; male = 22, female = 6; body mass index [BMI] kg/m2= 20.34 ± 2.22 SD) (Table 1). Individuals with a history of neurological injury; known genetic or medical disorders; food allergies; current or previous use of psychotropic medications; current or previous use of tobacco, cigarettes, or electronic cigarettes; or any exclusion criteria for MRI were excluded. The study procedures were approved by the Ethics Committee of the Department of Arts and Sciences at The University of Tokyo (Approval No. 955). Written informed consent was obtained from all participants.
2.2. fMRI Session
On the day of the fMRI session, participants were instructed to abstain from food or beverages except water for a minimum of three hours prior to their visit to the laboratory. Subsequent to their arrival, the subjects were measured for height and weight. These measurements were used to calculate the subjects' BMI. Approximately 30 minutes before the fMRI scanning, the participants were instructed to consume the predetermined snack (300 kcal), with the objective of standardizing their internal state (hunger and fullness sensations). Following consumption of the snack, participants undertook a brief version (two blocks) of the liquid consumption task for the fMRI scan. Subsequently, the participants were escorted to the MRI room. Immediately before the fMRI scan, participants were instructed to rate their internal state (hunger and fullness) using a visual analog scale (VAS) ranging from 0 to 100. The left end of the scale was labeled "not at all" and the right end was labeled "more than ever". Additionally, after consuming a small amount of each gustatory solution for the liquid consumption task, they rated their liking (“How much do you like this juice?'), wanting ('How much do you want to drink this juice?'), and intensity ('How thick is this juice?') using the VAS that used for their internal state ratings (Table 2). Subsequently, participants were instructed to complete four runs of the liquid consumption task. However, two participants completed only two runs. Thus, a total of 26 participants completed four runs. The average length of one run was 7 min 16.8 ± 6.5 sec (mean ± SD) (Figure 1).
2.2.1. Solutions for the Liquid Consumption Task at the fMRI Session
For the liquid consumption task, sucrose solution (234 mM, 32kcal/100ml), the RebD mix solution (29.2 mM sucrose + 194.3 mM glucose + 0.156 mM RebD + 5mM sodium gluconate, 18kcal/100ml), and the RebD mix without Na+ solution (29.2 mM sucrose + 194.3 mM glucose + 0.184mM RebD, 18kcal/100ml) were used as gustatory solutions. To match the intensity of sweetness, the RebD mix included a smaller amount of RebD compared to the RebD mix without Na+, as Na+ enhances sweetness when mixed with glucose. In addition to these solutions, a tasteless solution was used as a control. For the tasteless solution, first, four tasteless solutions were prepared, including the original tasteless solution (25 mM KCl + 2.5 mM NaHCO3) and solutions with 25 %, 50 %, and 75 % of the original concentration. Participants tasted a small amount of each solution and selected the one that tasted “the most like nothing” as their tasteless solution.
2.2.2. Solution Delivery
The timing and amount of solution delivered were controlled using programmable syringe pumps (NE-1000 One Channel Syringe Pump, NEW ERA PUMP SYSTEMS Inc., NY, USA). Details of the solution delivery system can be found elsewhere [23]. In brief, through a clear polyvinyl chloride plastic tube, the syringe pumps delivered 0.80 mL of each solution over 2 s following a 1 s break.
2.2.3. The Liquid Consumption Task
For the fMRI session, participants performed four runs of the liquid consumption task. In this task, gustatory and tasteless solutions were delivered to a participant through a mouthpiece placed between the participant's upper and lower lips.
Each solution was delivered randomly in ten blocks over four runs. Two or three blocks of each solution were performed in random order within a run. Within a block, a solution was delivered six to eight times (18–24 s), followed by three rinses (9 s). A tasteless solution was used for rinse, and the next block commenced after a short break (14–16 s)(Figure 1).
2.2.4. MR Image Acquisition
All images were collected using a MAGNETOM Prisma 3.0 Tesla scanner with a 64-channel head coil (Siemens Healthineers, Erlangen, Germany). All high-resolution structural images of the brain were collected using a T1-weighted 3D MPRAGE protocol (repetition time (TR) = 1900 ms, echo time (TE) = 2.53 ms, flip angle = 9°, field-of-view (FOV) = 256 × 256 mm2, resolution 1.0 × 1.0 × 1.0 mm3). As functional images, T2*-weighted images reflecting blood-oxygen-level-dependent (BOLD) signals were acquired using 2D gradient-echo echo-planar imaging (EPI) with an isotropic resolution (3.0 × 3.0 × 3.0 mm3), parallel acquisition factor = 3, TR = 2000 ms, TE = 25 ms, 39 slices, and flip angle = 80° in a 192 mm2 FOV, transverse slices with phase encoding in the P > > A direction. All the images were acquired in an interleaved manner.
2.3. Statistical Analysis
All functional and anatomical data underwent preprocessing using Statistical Parametric Mapping 12 (SPM12)[24] software with the CONN functional connectivity toolbox (CONN, version 22a)[25,26]. Functional and anatomical data were preprocessed using a modular preprocessing pipeline [27] including slice timing correction, creation of voxel-displacement maps, realignment with susceptibility distortion correction using fieldmaps, outlier detection, indirect segmentation and MNI-space normalization, and smoothing. Temporal misalignment between different slices of the functional data (acquired in interleaved bottom-up order) was corrected following SPM slice-timing correction (STC) procedure [28,29], using sinc temporal interpolation to resample each slice BOLD timeseries to a common mid-acquisition time. Functional data were realigned using SPM realign & unwarp procedure [30] integrating fieldmaps for susceptibility distortion correction, where all scans were coregistered to a reference image (first scan of the first session) using a least squares approach and a 6 parameter (rigid body) transformation, and resampled using b-spline interpolation [31] to simultaneously correct for motion, magnetic susceptibility geometric distortions, and their interaction. Potential outlier scans were identified using ART [32] as acquisitions with framewise displacement above 0.9 mm or global BOLD signal changes above 5 standard deviations [33], and a reference BOLD image was computed for each subject by averaging all scans, excluding outliers. Functional and anatomical data were coregistered and normalized into standard MNI space, segmented into grey matter, white matter, and cerebrospinal fluid (CSF) tissue classes, and resampled to 2 mm isotropic voxels following an indirect normalization procedure [34] using SPM unified segmentation and normalization algorithm [35,36] with the default IXI-549 tissue probability map template. Last, functional data were smoothed using spatial convolution with a Gaussian kernel of 6 mm full width half maximum (FWHM).
Preprocessed functional images from a total of 28 participants were brought to the individual level (first-level). The condition-specific effects (gustatory, tasteless, and rinse) at each voxel were estimated using a general linear model (GLM). The canonical hemodynamic response function provided by SPM12 was used to model the responses to the events. In the time-series analysis, a high-pass filter (270 s) was included in the filtering matrix to remove low-frequency noise and slow drifts from the signal. Confounding regressors from the preprocessing stage were also included in the model as covariates of no interest. Then, the [sucrose > tasteless], [RebD mix > tasteless], and [RebD mix without Na+ > tasteless] contrast images were created for individual participants.
Each contrast image was used in the subsequent group level (second-level) analysis. To examine the effect of each gustatory condition, a repeated measure analysis of variance (ANOVA) was performed using a voxel-wise GLM including ratings for intensity as a covariate-of-no-interest since there was a difference in ratings for intensity at a trend revel (p = 0.063) across three gustatory conditions. The predicted effect of these analyses was tested using the region of interest (ROI) approach. The ROI was created based on the Neurosynth [37] meta-analytic functional map for the term ‘taste’ (80 studies, downloaded 15 February 2025). First, the downloaded brain map was thresholded at 60 % of probability (greater than 60 % of the peak z-value), then masked with the anatomical mask of the OFC crated with the automatic anatomical labeling (AAL) atlas [38] using the WFU Pickatlas toolbox [39,40]. Then, the sphere with 6 mm radius centered on the peak voxel ([x, y, z] = [-21.8, 33.5, -16.7]) of the masked brain map was created as the ROI in the OFC. The unpredicted effect of these analyses was tested using whole brain analysis. The threshold was set at pfamily-wise error rate (FWE)-corrected < 0.05 for the ROI and whole brain approaches, respectively.
Subsequently, whole-brain searchlight Multivoxel Pattern Analysis (MVPA) [41] was employed to identify the brain regions that exhibited varied responses to each solution using the Decoding Toolbox [42] for 28 participants. This analysis was executed in accordance with a linear support vector machine approach. The training and testing of the analysis were conducted on individual-level regression coefficient maps derived from the individual level analysis, employing a leave-one-run-out cross-validation strategy. For this analysis, fMRI data was preprocessed using a modular preprocessing pipeline without MNI-space normalization and smoothing. Then, to generate the regression coefficient maps used as input for the MVPA, a separate individual-level regression model was applied to the fMRI data, which modeled each of the five conditions (sucrose, RebD mix, RebD mix without Na+, tasteless, and rinse) including confounding regressors. For each participant, a separate searchlight analysis was performed using a searchlight with a radius of 3 voxels, evaluating all three pairwise gustatory contrasts (sucrose vs. RebD mix, sucrose vs. RebD mix without Na+, RebD mix vs. RebD mix without Na+). The output of this searchlight analysis was a voxelwise map of average classification accuracy minus chance (33% for the multiclass comparisons). To evaluate the classification results at the group level, the resulting classification maps were warped to the standard MNI space, and applied a spatial smoothing (6 mm FWHM) to normalize the distribution of scores. Then, a group-level voxel-wise GLM was applied using permutation-based non-parametric testing with 5,000 permutations [43]. Threshold-free cluster enhancement (TFCE) was employed to assess cluster significance[44], with threshold of pFWE-corrected < 0.05.
Finally, for seed to whole brain functional connectivity analysis, the generalized psychophysiological interaction (gPPI) [45,46] analysis was adapted using preprocessed functional images. Since two participants completed only two runs, these two participants were excluded from this analysis, and a total of 26 participants were included in the gPPI. For this, the ROI used for the ANOVA was adapted as a seed. In addition, a sphere with a radius of 6 mm centered on the peak voxel ([x, y, z] = [34, 18, 6]) of the results from the whole-brain searchlight MVPA was used as a seed. At the individual level, separately, for each pair of seed and target areas, a gPPI was defined with BOLD time-series extracted from the seed as physiological factors, boxcar signals characterizing each individual gustatory or taste condition convolved with an SPM canonical hemodynamic response function as psychological factors, and the product of the two as psychophysiological interaction terms. Functional connectivity changes across conditions were characterized by the multivariate regression coefficient of the psychophysiological interaction terms in each model. At the group level, a GLM was estimated with first-level connectivity maps as dependent variables and conditions (sucrose, RebD mix, RebD mix without Na+) as independent variables to test for differences in connectivity across conditions using F-test. Inferences were drawn at the level of individual clusters. Cluster-level inferences were based on parametric statistics from Gaussian Random Field theory [47]. Results were thresholded using a combination of a cluster-forming p < 0.001 voxel-level threshold, and a pfalse discovery rate (FDR)-corrected < 0.05 cluster-size threshold [48]. Two seeds, the OFC and the insula, were used to create seed-to-whole brain connectivity maps separately. Thus, the significance level was set at pFDR-corrected < 0.025 (0.05 / 2).
Previous studies have shown that SGLT1-related sweet taste signals from the oral cavity may play a role in detecting sugars [15,20], and sweet taste rapidly inhibits hunger-promoting agouti-related peptide-expressing (AgRP) neurons in the brain [49]. Therefore, differences in connectivity among the three gustatory conditions could be related to internal states. Thus, the correlations between the connectivity that showed a significant difference across the three conditions and the internal states were compared between conditions. First, correlations between hunger or fullness and connectivity, controlling for BMI as a potential confounder were calculated. For this, partial correlations with the ppcor package [50] in R (version 4.4.1, R Foundation for Statistical Computing, Vienna, Austria) was used. Each internal state was tested three times. Thus, statistical significance was set at α = 0.0167 (0.05 / 3). Then, to compare the strength of partial correlations, Steiger's test [51] for dependent correlations using the cocor package [52] was employed. This test is specifically designed to compare correlations that share a common variable and accounts for the intercorrelations between predictor variables. Each correlation coefficient was tested twice. Thus, statistical significance was set at α = 0.025 (0.05 / 2).
3. Results
3.1. Brain Response to Each Gustatory Condition
There was significant averaged brain response to each gustatory contrast in the ROI ([x, y, z] = [-20, 36, -16], z = 3.07, pFWE-corrected = 0.028, cluster size = 3 voxels), while there was no significant difference in brain response to each gustatory contrast (Figure 2). The whole-brain analysis showed that there were no unexpected effects of gustatory contrasts.
3.2. Results of Whole-Brain Searchlight MVPA
The whole-brain searchlight MVPA identified the brain region that exhibited significant, above chance classification accuracy for discriminating between gustatory conditions in the anterior insula at a trend level ([x, y, z] = [-34, 18, 6], pFWE-corrected = 0.072, t = 4.68, an averaged accuracy at the peak voxel = 40.71%) (Figure 3).
3.3. Connectivity Analysis with the gPPI
Firstly, an examination was conducted to detect any differences in functional connectivity with the seed areas (OFC or insula) across the three conditions. Functional connectivity between the left OFC and the left postcentral gyrus significantly differs across three conditions ([x, y, z] = [-38, -24, 54], pFDR-corrected = 0.010, F(2, 50) > 7.96, cluster size = 62 voxels) (Figure 4A). There were no differences in insula-to-whole-brain connectivity maps across the three conditions.
Post-hoc analysis using extracted connectivity values showed that the connectivity between the OFC and left postcentral gyrus in the RebD mix without Na+ condition was greater than that in the RebD mix or sucrose conditions (psBonferroni-corrected < 0.001). The connectivity in the RebD mix condition did not significantly differ from that in the sucrose condition.
Partial correlations between fullness and connectivity measures, controlling for BMI, were as follows: connectivity in the sucrose condition (r = -0.034, p = 0.871), in the RebD mix condition (r = -0.220, p = 0.291), and in the RebD mix without Na+ (r = -0.628, p < 0.001). Thus, there was a significant negative association between connectivity in the RebD without Na+ and fullness. Hunger was not significantly correlated with any connectivity (p > 0.157). Steiger's test revealed no significant difference in correlation strength between the sucrose and RebD mix conditions (z = 0.679, p = 0.500). However, there was a significant difference between the sucrose and RebD mix without Na⁺ conditions (z = 2.591, p = 0.001). Additionally, there was a trend toward a significant difference in correlation strength between the RebD mix and the RebD mix without Na⁺ conditions (z = 2.008, p = 0.045) (Figure 4B).
4. Discussion
The current study examined the brain response to the newly developed sweetener RebD mix, RebD mix without Na+, and sucrose in the OFC, which processes the palatability of gustatory stimuli [22]. Additionally, the brain response to these sweeteners was examined throughout the entire brain, and the anterior insula was found to be associated with the decoding of these sweeteners. Functional connectivity analysis revealed significantly greater connectivity between the OFC and postcentral gyrus in the RebD without Na+ condition than in the other two solution conditions. Furthermore, this connectivity in the RebD without Na⁺ condition was negatively correlated with fullness measured at the fMRI scan.
There were no significant differences in OFC responses to each sweet solution, which corresponded to the ratings comparison results for liking, wanting, and intensity. However, there was a significant averaged brain response to each sweet solution in the OFC. Since liking or wanting ratings for all sweet solutions were nearly or greater than half of the rating range, those solutions would be equally palatable and represented by the OFC response, which could have a role in processing palatability of gustatory stimuli [22].
MVPA analysis indicated that the anterior insula is related to discriminating between sweet taste solutions. This region of the insula is involved in taste detection [53] and taste discrimination [54]. Thus, although participants were not instructed to distinguish between three different sweet solutions, differences in the composition of the sweet substances would automatically be reflected in the anterior insula, even if the participants did not recognize the differences.
Connectivity analysis revealed that connectivity between the OFC and postcentral gyrus was greater in the RebD mix without Na+ condition compared to other two gustatory conditions. The postcentral gyrus has been reported to be connected with impulsivity [55]. In addition, the postcentral gyrus showed a significant response to marijuana cues in regular marijuana users who had abstained from use for three days [56]. Furthermore, working for the preferred food resulted in a stronger response in the postcentral gyrus [57]. Thus, connectivity between the OFC and the postcentral gyrus could be involved in cravings or motivation for food. Since the connectivity in the RebD mix without Na⁺ was greater than in the other two conditions, the SGLT1-related signal would reduce this connectivity, as the RebD mix and sucrose are expected to stimulate the SGLT1-related signal [15,19]. Additionally, this connectivity in the RebD mix without Na+ condition was negatively associated with fullness measured at the fMRI scan, while the connectivity in other two conditions were not significantly associated with fullness. Thus, sweet taste associated with SGLT1-related signals might mediate the OFC-postcentral gyrus connectivity to reduce cravings for sweet tastes.
Glucose-induced intestinal SGLT1 activation modulates the secretion of intestinal hormones that regulate glucose homeostasis, including glucagon-like peptide-1 (GLP-1) and glucose-dependent insulinotropic peptide (GIP) [58,59,60], which are well known as satiety hormones [61]. Therefore, sweet taste associated with SGLT1-related signals may be linked to feelings of satiety. In addition, sweet taste rapidly inhibits hunger-promoting AgRP neurons in the brain, and the reduction in AgRP neuron activity was much larger following consumption of nutritive foods (e.g., sucrose) than their non-nutritive counterparts (e.g., sucralose) [49]. Overall, SGLT1-related sweet taste signals from the oral cavity may play a role in detecting nutritive sugars [15,20], and glucose-induced intestinal SGLT1 activation modulates satiety sensation [58,59,60,61], and nutritive sweet taste significantly reduces hunger-promoting neural activation [49]. Therefore, SGLT1-related sweet taste could be related to satiety sensation, although there is no conclusive evidence indicating that the sweet taste sensation elicited by SGLT1 plays a role in satiety for sweet tastes.
The current study has several limitations. First, the sample size would be relatively small. A previous study that performed a similar analysis included only 20 participants [54], and the median sample size for fMRI experiments with gustatory stimuli was 24 [62]. Thus, the sample size of the current study would be acceptable. However, future studies should have a greater sample size. Second, the current study did not examine the brain response to the detailed characteristics of the sweet taste quality of the RebD mix, such as aftertaste or sense of viscosity. Future studies should examine differences in brain responses to the detailed characteristics of sweet taste quality between sucrose and the RebD mix to further understand the neural mechanisms of RebD mix perception.
5. Conclusions
The current study examined brain response to the RebD mix, the RebD mix without Na+, and sucrose. There was no significant difference in ratings for those solutions and the OFC response to them. However, the anterior insula response pattern differed across three solutions, reflecting differences in compounds of each sweetener. Additionally, connectivity analysis indicated that the RebD mix without Na+, rather than the RebD mix or sucrose, would be associated with reduced satiety for sweet tastes, as the OFC-postcentral gyrus connectivity in the RebD mix without Na+ condition was negatively correlated with fullness measured at the fMRI scan. This result would suggest that SGLT1 activation, enhanced by Na⁺, is important for satiety in response to sweet tastes. Overall, the RebD mix is a less nutritious sweetener, yet it would be comparable to sucrose with respect to palatability and satisfaction.
Author Contributions
Design and concept of the work, Y.N.; data collection, R.T. and Y.N.; analysis and interpretation of the work, Y.N.; writing of the manuscript, Y.N.; review and editing of the manuscript, T.O. and Y.N.; supervision, Y.N.; funding acquisition, Y.N. All authors have read and agreed to the published version of the manuscript.
Funding
This research was supported by the division of the Research & Development Departmen, the Suntory Beverage and Food Limited and the Grant-in-Aid for Transformative Research Areas (A) of Japan Society for the Promotion of Science (JP21H05172).
Institutional Review Board Statement
This study was conducted in accordance with the Declaration of Helsinki and approved by the Ethics Committee of the Department of Arts and Sciences at The University of Tokyo (Approval No. 955; November 28, 2023).
Informed Consent Statement
The authors declare no competing interests. The funding sources had no role in the study design, data collection and analysis, or decision to publish.
Data Availability Statement
The datasets generated and/or analyzed during this study are available from the corresponding author on reasonable request.
Acknowledgments
We would like to express our sincere gratitude to all the participants and staff who were involved in this study. We appreciate their valuable collaboration and support throughout the research process.
Conflicts of Interest
The authors declare no competing interests. The funding source had no role in the study design, data collection and analysis, or decision to publish.
References
- Sørensen, T.I.A. Forecasting the global obesity epidemic through 2050. The Lancet 2025, 405, 756–757. [Google Scholar] [CrossRef]
- Malik, V.S.; Hu, F.B. The role of sugar-sweetened beverages in the global epidemics of obesity and chronic diseases. Nature Reviews Endocrinology 2022, 18, 205–218. [Google Scholar] [CrossRef]
- Nguyen, M.; Jarvis, S.E.; Tinajero, M.G.; Yu, J.; Chiavaroli, L.; Mejia, S.B.; Khan, T.A.; Tobias, D.K.; Willett, W.C.; Hu, F.B. , et al. Sugar-sweetened beverage consumption and weight gain in children and adults: a systematic review and meta-analysis of prospective cohort studies and randomized controlled trials. The American Journal of Clinical Nutrition 2023, 117, 160–174. [Google Scholar] [CrossRef] [PubMed]
- Tan, V.W.K.; Wee, M.S.M.; Tomic, O.; Forde, C.G. Temporal sweetness and side tastes profiles of 16 sweeteners using temporal check-all-that-apply (TCATA). Food Research International 2019, 121, 39–47. [Google Scholar] [CrossRef] [PubMed]
- Yeung, A.W.K.; Wong, N.S.M. How Does Our Brain Process Sugars and Non-Nutritive Sweeteners Differently: A Systematic Review on Functional Magnetic Resonance Imaging Studies. Nutrients 2020, 12. [Google Scholar] [CrossRef]
- Frank, G.K.W.; Oberndorfer, T.A.; Simmons, A.N.; Paulus, M.P.; Fudge, J.L.; Yang, T.T.; Kaye, W.H. Sucrose activates human taste pathways differently from artificial sweetener. NeuroImage 2008, 39, 1559–1569. [Google Scholar] [CrossRef]
- Lohner, S.; Toews, I.; Meerpohl, J.J. Health outcomes of non-nutritive sweeteners: analysis of the research landscape. Nutrition Journal 2017, 16, 55. [Google Scholar] [CrossRef]
- Ceunen, S.; Geuns, J.M.C. Steviol Glycosides: Chemical Diversity, Metabolism, and Function. Journal of Natural Products 2013, 76, 1201–1228. [Google Scholar] [CrossRef]
- Lemus-Mondaca, R.; Vega-Gálvez, A.; Zura-Bravo, L.; Ah-Hen, K. Stevia rebaudiana Bertoni, source of a high-potency natural sweetener: A comprehensive review on the biochemical, nutritional and functional aspects. Food Chem 2012, 132, 1121–1132. [Google Scholar] [CrossRef]
- Prakash, I.; Dubois, G.E.; Clos, J.F.; Wilkens, K.L.; Fosdick, L.E. Development of rebiana, a natural, non-caloric sweetener. Food Chem Toxicol 2008, 46 Suppl 7, S75–82. [Google Scholar] [CrossRef] [PubMed]
- Suez, J.; Cohen, Y.; Valdés-Mas, R.; Mor, U.; Dori-Bachash, M.; Federici, S.; Zmora, N.; Leshem, A.; Heinemann, M.; Linevsky, R. , et al. Personalized microbiome-driven effects of non-nutritive sweeteners on human glucose tolerance. Cell 2022, 185, 3307–3328.e3319. [Google Scholar] [CrossRef]
- Hellfritsch, C.; Brockhoff, A.; Stähler, F.; Meyerhof, W.; Hofmann, T. Human psychometric and taste receptor responses to steviol glycosides. J Agric Food Chem 2012, 60, 6782–6793. [Google Scholar] [CrossRef]
- Yokoo, Y.; Ohkuri, T.; Fujie, A. Food and drink with increased sweetness. JP6705945B2, 2020-06-03, 2020.
- Vandenbeuch, A.; Kinnamon, S.C. Why low concentrations of salt enhance sweet taste. Acta Physiol (Oxf) 2020, 230, e13560. [Google Scholar] [CrossRef] [PubMed]
- Breslin, P.A.S.; Izumi, A.; Tharp, A.; Ohkuri, T.; Yokoo, Y.; Flammer, L.J.; Rawson, N.E.; Margolskee, R.F. Evidence that human oral glucose detection involves a sweet taste pathway and a glucose transporter pathway. PLOS ONE 2021, 16, e0256989. [Google Scholar] [CrossRef] [PubMed]
- Nelson, G.; Hoon, M.A.; Chandrashekar, J.; Zhang, Y.; Ryba, N.J.; Zuker, C.S. Mammalian sweet taste receptors. Cell 2001, 106, 381–390. [Google Scholar] [CrossRef]
- Zhao, G.Q.; Zhang, Y.; Hoon, M.A.; Chandrashekar, J.; Erlenbach, I.; Ryba, N.J.; Zuker, C.S. The receptors for mammalian sweet and umami taste. Cell 2003, 115, 255–266. [Google Scholar] [CrossRef] [PubMed]
- Wright, E.M.; Loo, D.D.F.; Hirayama, B.A. Biology of Human Sodium Glucose Transporters. Physiological Reviews 2011, 91, 733–794. [Google Scholar] [CrossRef]
- Yee, K.K.; Sukumaran, S.K.; Kotha, R.; Gilbertson, T.A.; Margolskee, R.F. Glucose transporters and ATP-gated K<sup>+</sup> (K<sub>ATP</sub>) metabolic sensors are present in type 1 taste receptor 3 (T1r3)-expressing taste cells. Proceedings of the National Academy of Sciences 2011, 108, 5431–5436. [Google Scholar] [CrossRef]
- Yasumatsu, K.; Ohkuri, T.; Yoshida, R.; Iwata, S.; Margolskee, R.F.; Ninomiya, Y. Sodium-glucose cotransporter 1 as a sugar taste sensor in mouse tongue. Acta Physiol (Oxf) 2020, 230, e13529. [Google Scholar] [CrossRef]
- Rolls, E.T. The functions of the orbitofrontal cortex. Brain Cogn 2004, 55, 11–29. [Google Scholar] [CrossRef]
- Small, D.M.; Bender, G.; Veldhuizen, M.G.; Rudenga, K.; Nachtigal, D.; Felsted, J. The role of the human orbitofrontal cortex in taste and flavor processing. Ann N Y Acad Sci 2007, 1121, 136–151. [Google Scholar] [CrossRef]
- Nakamura, Y.; Ishida, T. The effect of multiband sequences on statistical outcome measures in functional magnetic resonance imaging using a gustatory stimulus. NeuroImage 2024, 300, 120867. [Google Scholar] [CrossRef]
- Penny, W.D.; Friston, K.J.; Ashburner, J.T.; Kiebel, S.J.; Nichols, T.E. Statistical Parametric Mapping: The Analysis of Functional Brain Images; Academic Press: 2011.
- Nieto-Castanon, A.; Whitfield-Gabrieli, S. CONN functional connectivity toolbox: RRID SCR_009550, release 22; Hilbert Press: 2022. [CrossRef]
- Whitfield-Gabrieli, S.; Nieto-Castanon, A. Conn: a functional connectivity toolbox for correlated and anticorrelated brain networks. Brain Connect 2012, 2, 125–141. [Google Scholar] [CrossRef]
- Nieto-Castanon, A. FMRI minimal preprocessing pipeline. In Handbook of functional connectivity Magnetic Resonance Imaging methods in CONN, Hilbert Press: 2020. 3–16. [CrossRef]
- Henson, R.; Buechel, C.; Josephs, O.; Friston, K.J. The slice-timing problem in event-related fMRI. NeuroImage 1999. [Google Scholar]
- Sladky, R.; Friston, K.J.; Tröstl, J.; Cunnington, R.; Moser, E.; Windischberger, C. Slice-timing effects and their correction in functional MRI. Neuroimage 2011, 58, 588–594. [Google Scholar] [CrossRef] [PubMed]
- Andersson, J.L.; Hutton, C.; Ashburner, J.; Turner, R.; Friston, K. Modeling geometric deformations in EPI time series. Neuroimage 2001, 13, 903–919. [Google Scholar] [CrossRef]
- Friston, K.J.; Ashburner, J.; Frith, C.D.; Poline, J.-B.; Heather, J.D.; Frackowiak, R.S.J. Spatial registration and normalization of images. Human Brain Mapping 1995, 3. [Google Scholar] [CrossRef]
- Whitfield-Gabrieli, S.; Nieto-Castanon, A.; Ghosh, S. Artifact detection tools (ART). Cambridge, MA. Release Version 2011, 7, 11. [Google Scholar]
- Power, J.D.; Mitra, A.; Laumann, T.O.; Snyder, A.Z.; Schlaggar, B.L.; Petersen, S.E. Methods to detect, characterize, and remove motion artifact in resting state fMRI. Neuroimage 2014, 84, 320–341. [Google Scholar] [CrossRef]
- Calhoun, V.D.; Wager, T.D.; Krishnan, A.; Rosch, K.S.; Seymour, K.E.; Nebel, M.B.; Mostofsky, S.H.; Nyalakanai, P.; Kiehl, K. The impact of T1 versus EPI spatial normalization templates for fMRI data analyses. Hum Brain Mapp 2017, 38, 5331–5342. [Google Scholar] [CrossRef]
- Ashburner, J.; Friston, K.J. Unified segmentation. Neuroimage 2005, 26, 839–851. [Google Scholar] [CrossRef]
- Ashburner, J. A fast diffeomorphic image registration algorithm. Neuroimage 2007, 38, 95–113. [Google Scholar] [CrossRef] [PubMed]
- Yarkoni, T.; Poldrack, R.A.; Nichols, T.E.; Van Essen, D.C.; Wager, T.D. Large-scale automated synthesis of human functional neuroimaging data. Nature Methods 2011, 8, 665–670. [Google Scholar] [CrossRef]
- Tzourio-Mazoyer, N.; Landeau, B.; Papathanassiou, D.; Crivello, F.; Etard, O.; Delcroix, N.; Mazoyer, B.; Joliot, M. Automated Anatomical Labeling of Activations in SPM Using a Macroscopic Anatomical Parcellation of the MNI MRI Single-Subject Brain. NeuroImage 2002, 15, 273–289. [Google Scholar] [CrossRef]
- Maldjian, J.A.; Laurienti, P.J.; Kraft, R.A.; Burdette, J.H. An automated method for neuroanatomic and cytoarchitectonic atlas-based interrogation of fMRI data sets. Neuroimage 2003, 19, 1233–1239. [Google Scholar] [CrossRef]
- Maldjian, J.A.; Laurienti, P.J.; Burdette, J.H. Precentral gyrus discrepancy in electronic versions of the Talairach atlas. Neuroimage 2004, 21, 450–455. [Google Scholar] [CrossRef]
- Kriegeskorte, N.; Goebel, R.; Bandettini, P. Information-based functional brain mapping. Proceedings of the National Academy of Sciences 2006, 103, 3863–3868. [Google Scholar] [CrossRef] [PubMed]
- Hebart, M.N.; Görgen, K.; Haynes, J.-D. The Decoding Toolbox (TDT): a versatile software package for multivariate analyses of functional imaging data. Frontiers in Neuroinformatics 2015, 8. [Google Scholar] [CrossRef]
- Winkler, A.M.; Ridgway, G.R.; Webster, M.A.; Smith, S.M.; Nichols, T.E. Permutation inference for the general linear model. Neuroimage 2014, 92, 381–397. [Google Scholar] [CrossRef]
- Smith, S.M.; Nichols, T.E. Threshold-free cluster enhancement: Addressing problems of smoothing, threshold dependence and localisation in cluster inference. NeuroImage 2009, 44, 83–98. [Google Scholar] [CrossRef] [PubMed]
- Friston, K.J.; Buechel, C.; Fink, G.R.; Morris, J.; Rolls, E.; Dolan, R.J. Psychophysiological and modulatory interactions in neuroimaging. Neuroimage 1997, 6, 218–229. [Google Scholar] [CrossRef] [PubMed]
- McLaren, D.G.; Ries, M.L.; Xu, G.; Johnson, S.C. A generalized form of context-dependent psychophysiological interactions (gPPI): a comparison to standard approaches. Neuroimage 2012, 61, 1277–1286. [Google Scholar] [CrossRef]
- Worsley, K.J.; Marrett, S.; Neelin, P.; Vandal, A.C.; Friston, K.J.; Evans, A.C. A unified statistical approach for determining significant signals in images of cerebral activation. Hum Brain Mapp 1996, 4, 58–73. [Google Scholar] [CrossRef]
- Chumbley, J.; Worsley, K.; Flandin, G.; Friston, K. Topological FDR for neuroimaging. NeuroImage 2010, 49, 3057–3064. [Google Scholar] [CrossRef]
- Aitken, T.J.; Liu, Z.; Ly, T.; Shehata, S.; Sivakumar, N.; La Santa Medina, N.; Gray, L.A.; Zhang, J.; Dundar, N.; Barnes, C.; et al. Negative feedback control of hypothalamic feeding circuits by the taste of food. Neuron 2024, 112, 3354–3370.e3355. [Google Scholar] [CrossRef]
- Kim, S. ppcor: An R Package for a Fast Calculation to Semi-partial Correlation Coefficients. Commun Stat Appl Methods 2015, 22, 665–674. [Google Scholar] [CrossRef]
- Steiger, J.H. Tests for comparing elements of a correlation matrix. Psychological Bulletin 1980, 87, 245–251. [Google Scholar] [CrossRef]
- Diedenhofen, B.; Musch, J. cocor: A Comprehensive Solution for the Statistical Comparison of Correlations. PLOS ONE 2015, 10, e0121945. [Google Scholar] [CrossRef]
- Veldhuizen, M.G.; Gitelman, D.R.; Small, D.M. An fMRI Study of the Interactions Between the Attention and the Gustatory Networks. Chemosens Percept 2012, 5, 117–127. [Google Scholar] [CrossRef] [PubMed]
- Avery, J.A.; Liu, A.G.; Ingeholm, J.E.; Gotts, S.J.; Martin, A. Viewing images of foods evokes taste quality-specific activity in gustatory insular cortex. Proceedings of the National Academy of Sciences 2021, 118, e2010932118. [Google Scholar] [CrossRef] [PubMed]
- Pan, N.; Wang, S.; Zhao, Y.; Lai, H.; Qin, K.; Li, J.; Biswal, B.B.; Sweeney, J.A.; Gong, Q. Brain gray matter structures associated with trait impulsivity: A systematic review and voxel-based meta-analysis. Human Brain Mapping 2021, 42, 2214–2235. [Google Scholar] [CrossRef]
- Filbey, F.M.; Schacht, J.P.; Myers, U.S.; Chavez, R.S.; Hutchison, K.E. Marijuana craving in the brain. Proceedings of the National Academy of Sciences 2009, 106, 13016–13021. [Google Scholar] [CrossRef]
- Wegman, J.; van Loon, I.; Smeets, P.A.M.; Cools, R.; Aarts, E. Top-down expectation effects of food labels on motivation. Neuroimage 2018, 173, 13–24. [Google Scholar] [CrossRef] [PubMed]
- Song, P.; Onishi, A.; Koepsell, H.; Vallon, V. Sodium glucose cotransporter SGLT1 as a therapeutic target in diabetes mellitus. Expert Opin Ther Targets 2016, 20, 1109–1125. [Google Scholar] [CrossRef]
- Gorboulev, V.; Schürmann, A.; Vallon, V.; Kipp, H.; Jaschke, A.; Klessen, D.; Friedrich, A.; Scherneck, S.; Rieg, T.; Cunard, R. , et al. Na(+)-D-glucose cotransporter SGLT1 is pivotal for intestinal glucose absorption and glucose-dependent incretin secretion. Diabetes 2012, 61, 187–196. [Google Scholar] [CrossRef]
- Moriya, R.; Shirakura, T.; Ito, J.; Mashiko, S.; Seo, T. Activation of sodium-glucose cotransporter 1 ameliorates hyperglycemia by mediating incretin secretion in mice. Am J Physiol Endocrinol Metab 2009, 297, E1358–1365. [Google Scholar] [CrossRef] [PubMed]
- Astrup, A. Reflections on the discovery GLP-1 as a satiety hormone: Implications for obesity therapy and future directions. European Journal of Clinical Nutrition 2024, 78, 551–556. [Google Scholar] [CrossRef] [PubMed]
- Yeung, A.W.K.; Wong, N.S.M.; Eickhoff, S.B. Empirical assessment of changing sample-characteristics in task-fMRI over two decades: An example from gustatory and food studies. Hum Brain Mapp 2020, 41, 2460–2473. [Google Scholar] [CrossRef]
Figure 1.
The experimental procedures. Participants were instructed to abstain from food and beverages, except for water, for at least three hours before visiting the laboratory. Anthropometric assessments were performed. Then, approximately 30 minutes before the fMRI scan, participants were instructed to consume the predetermined 300-kcal snack. Subsequently, practice for the liquid consumption task was performed. Immediately before the scan, they were asked to rate their internal state, as well as their liking, wanting, and intensity for each stimulus. Participants were then instructed to complete four runs of the liquid consumption task while being scanned.
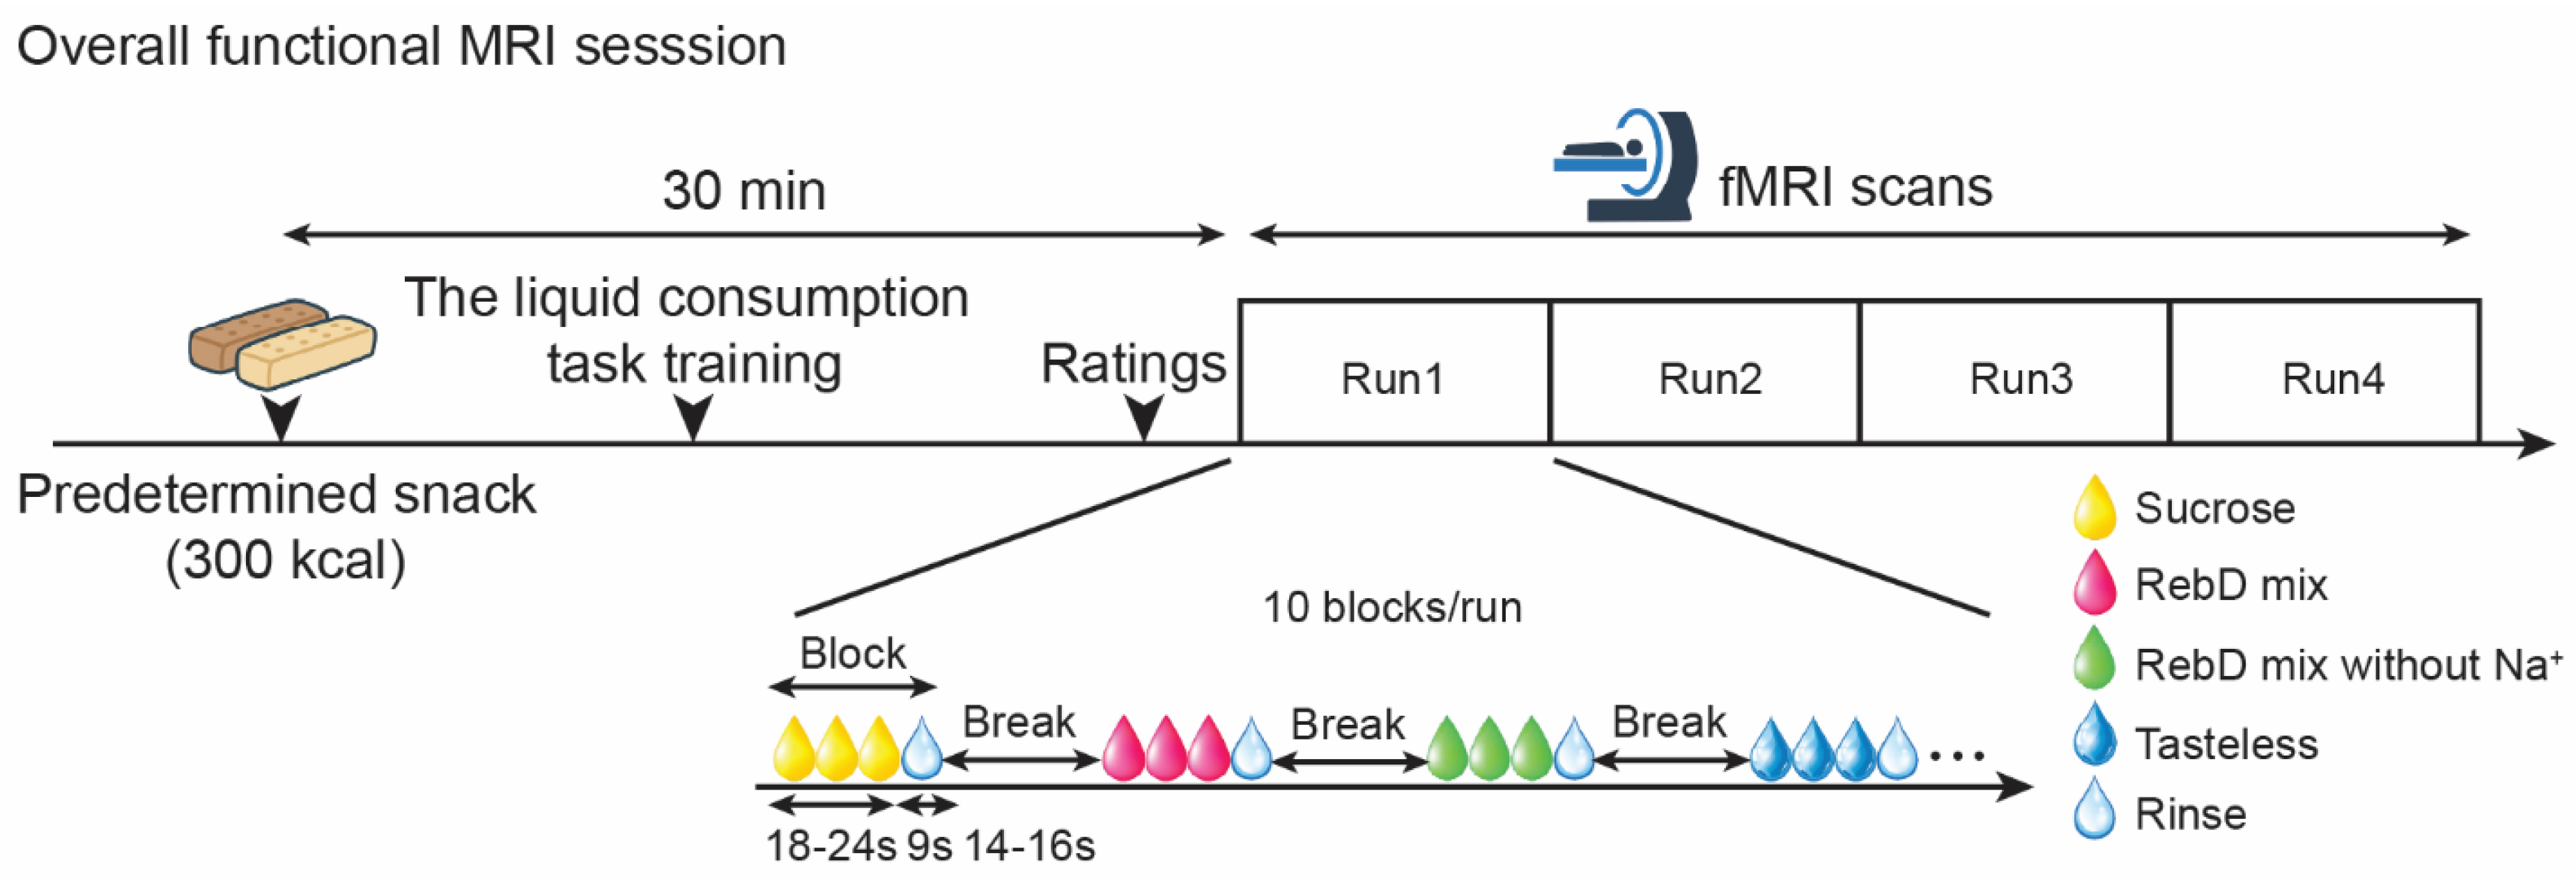
Figure 2.
Averaged brain response to each gustatory solution. The scatter plot indicates the left orbitofrontal cortex response to each gustatory solution. The color bar indicates F-value.
Figure 2.
Averaged brain response to each gustatory solution. The scatter plot indicates the left orbitofrontal cortex response to each gustatory solution. The color bar indicates F-value.
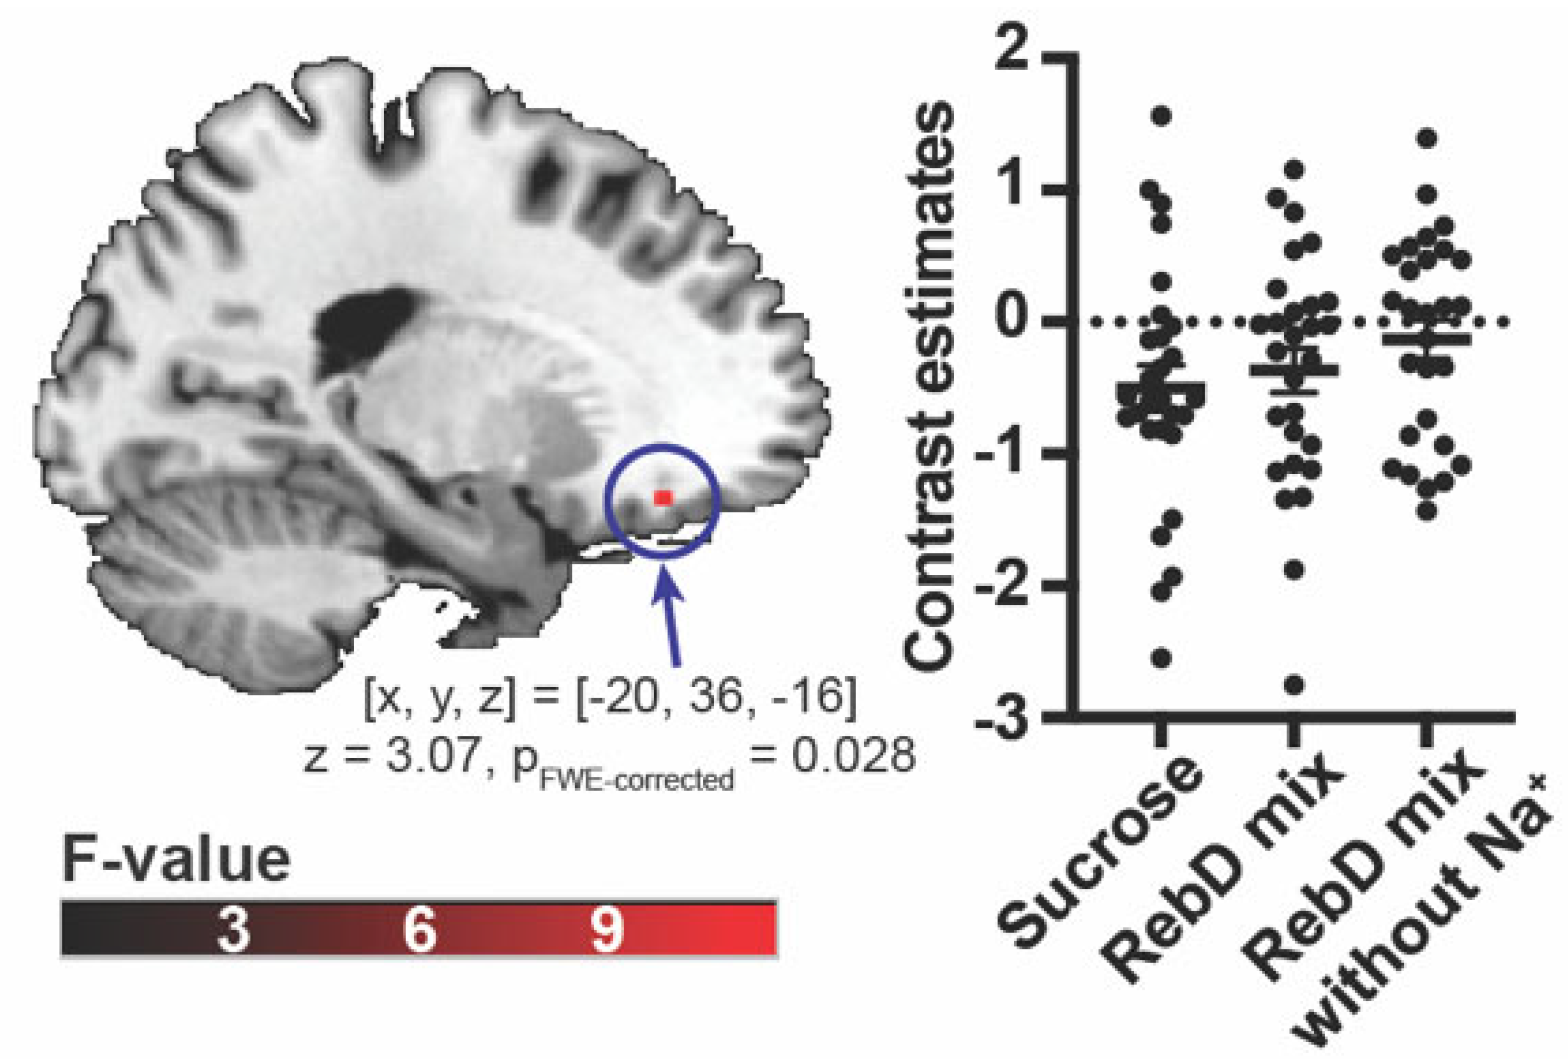
Figure 3.
The brain region identified using a multivariate searchlight analysis, trained to distinguish between sucrose, the RebD mix, and the RebD mix without Na+ solutions. The color bar indicates T-value.
Figure 3.
The brain region identified using a multivariate searchlight analysis, trained to distinguish between sucrose, the RebD mix, and the RebD mix without Na+ solutions. The color bar indicates T-value.
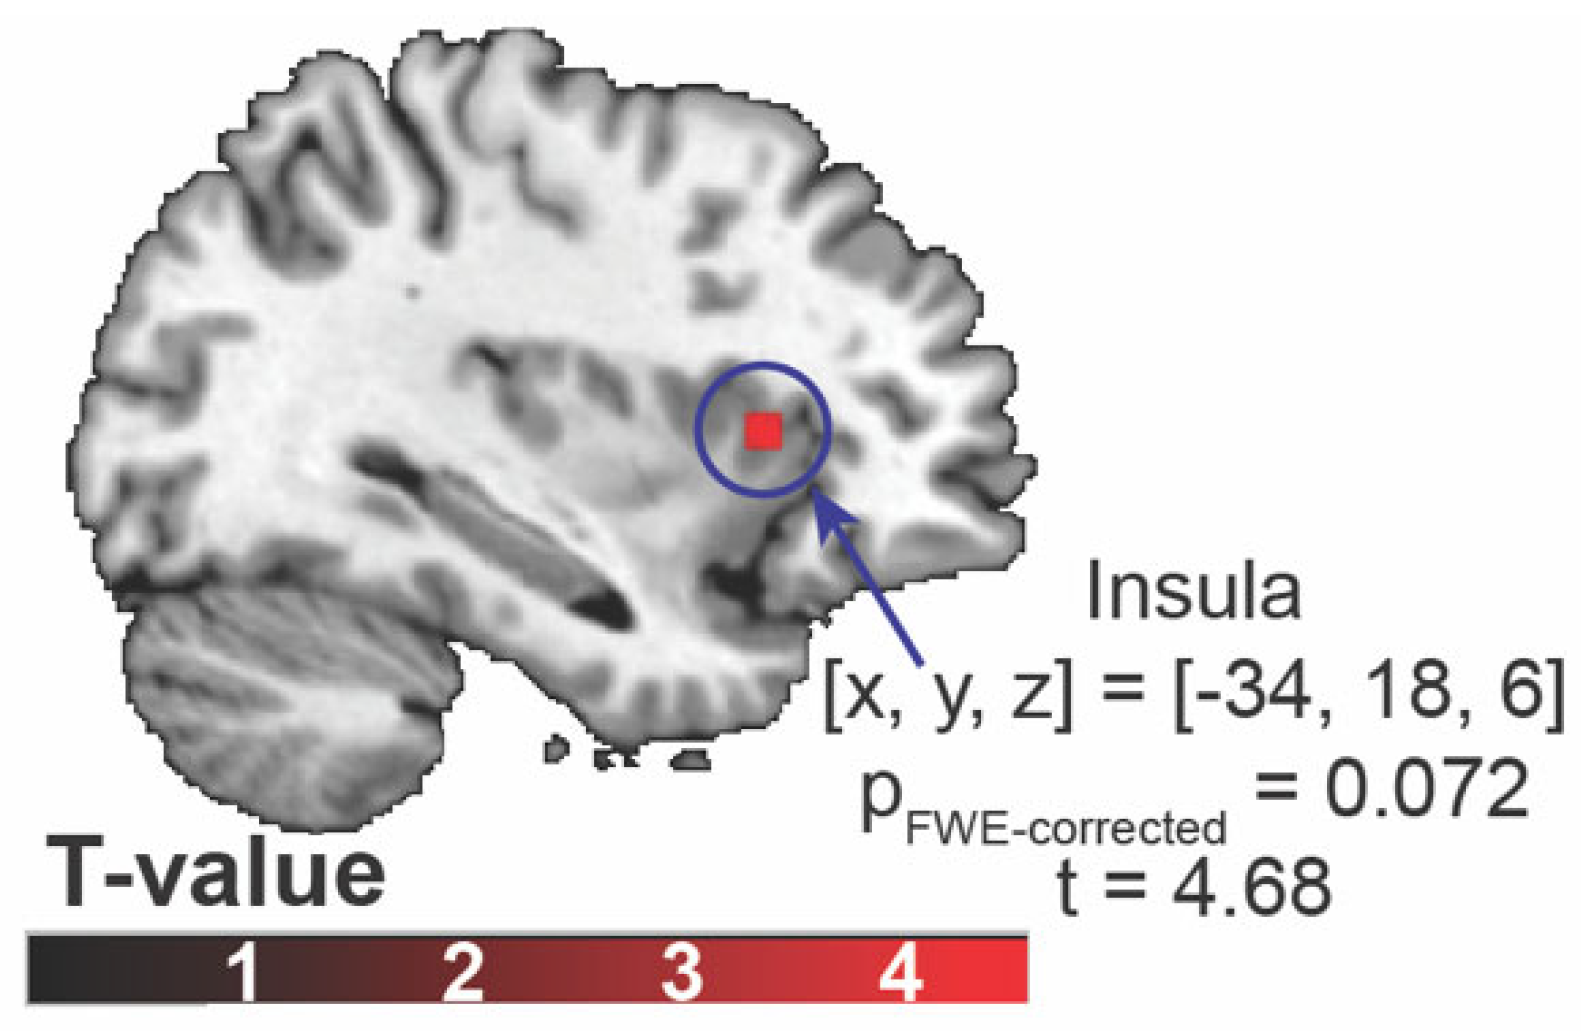
Figure 4.
Results of the generalized psychophysiological interaction analysis. (A) The brain region that showed significantly different connectivity with the left orbitofrontal cortex across three distinct gustatory conditions. The scatter plot represents connectivity between the left orbitofrontal cortex and the postcentral gyrus in each gustatory condition. The color bar indicates F-value. (B) Associations between ratings for fullness and the left orbitofrontal cortex-the postcentral gyrus connectivity in each condition. The y-axis indicates ratings for fullness, and the x-axis indicates connectivity.
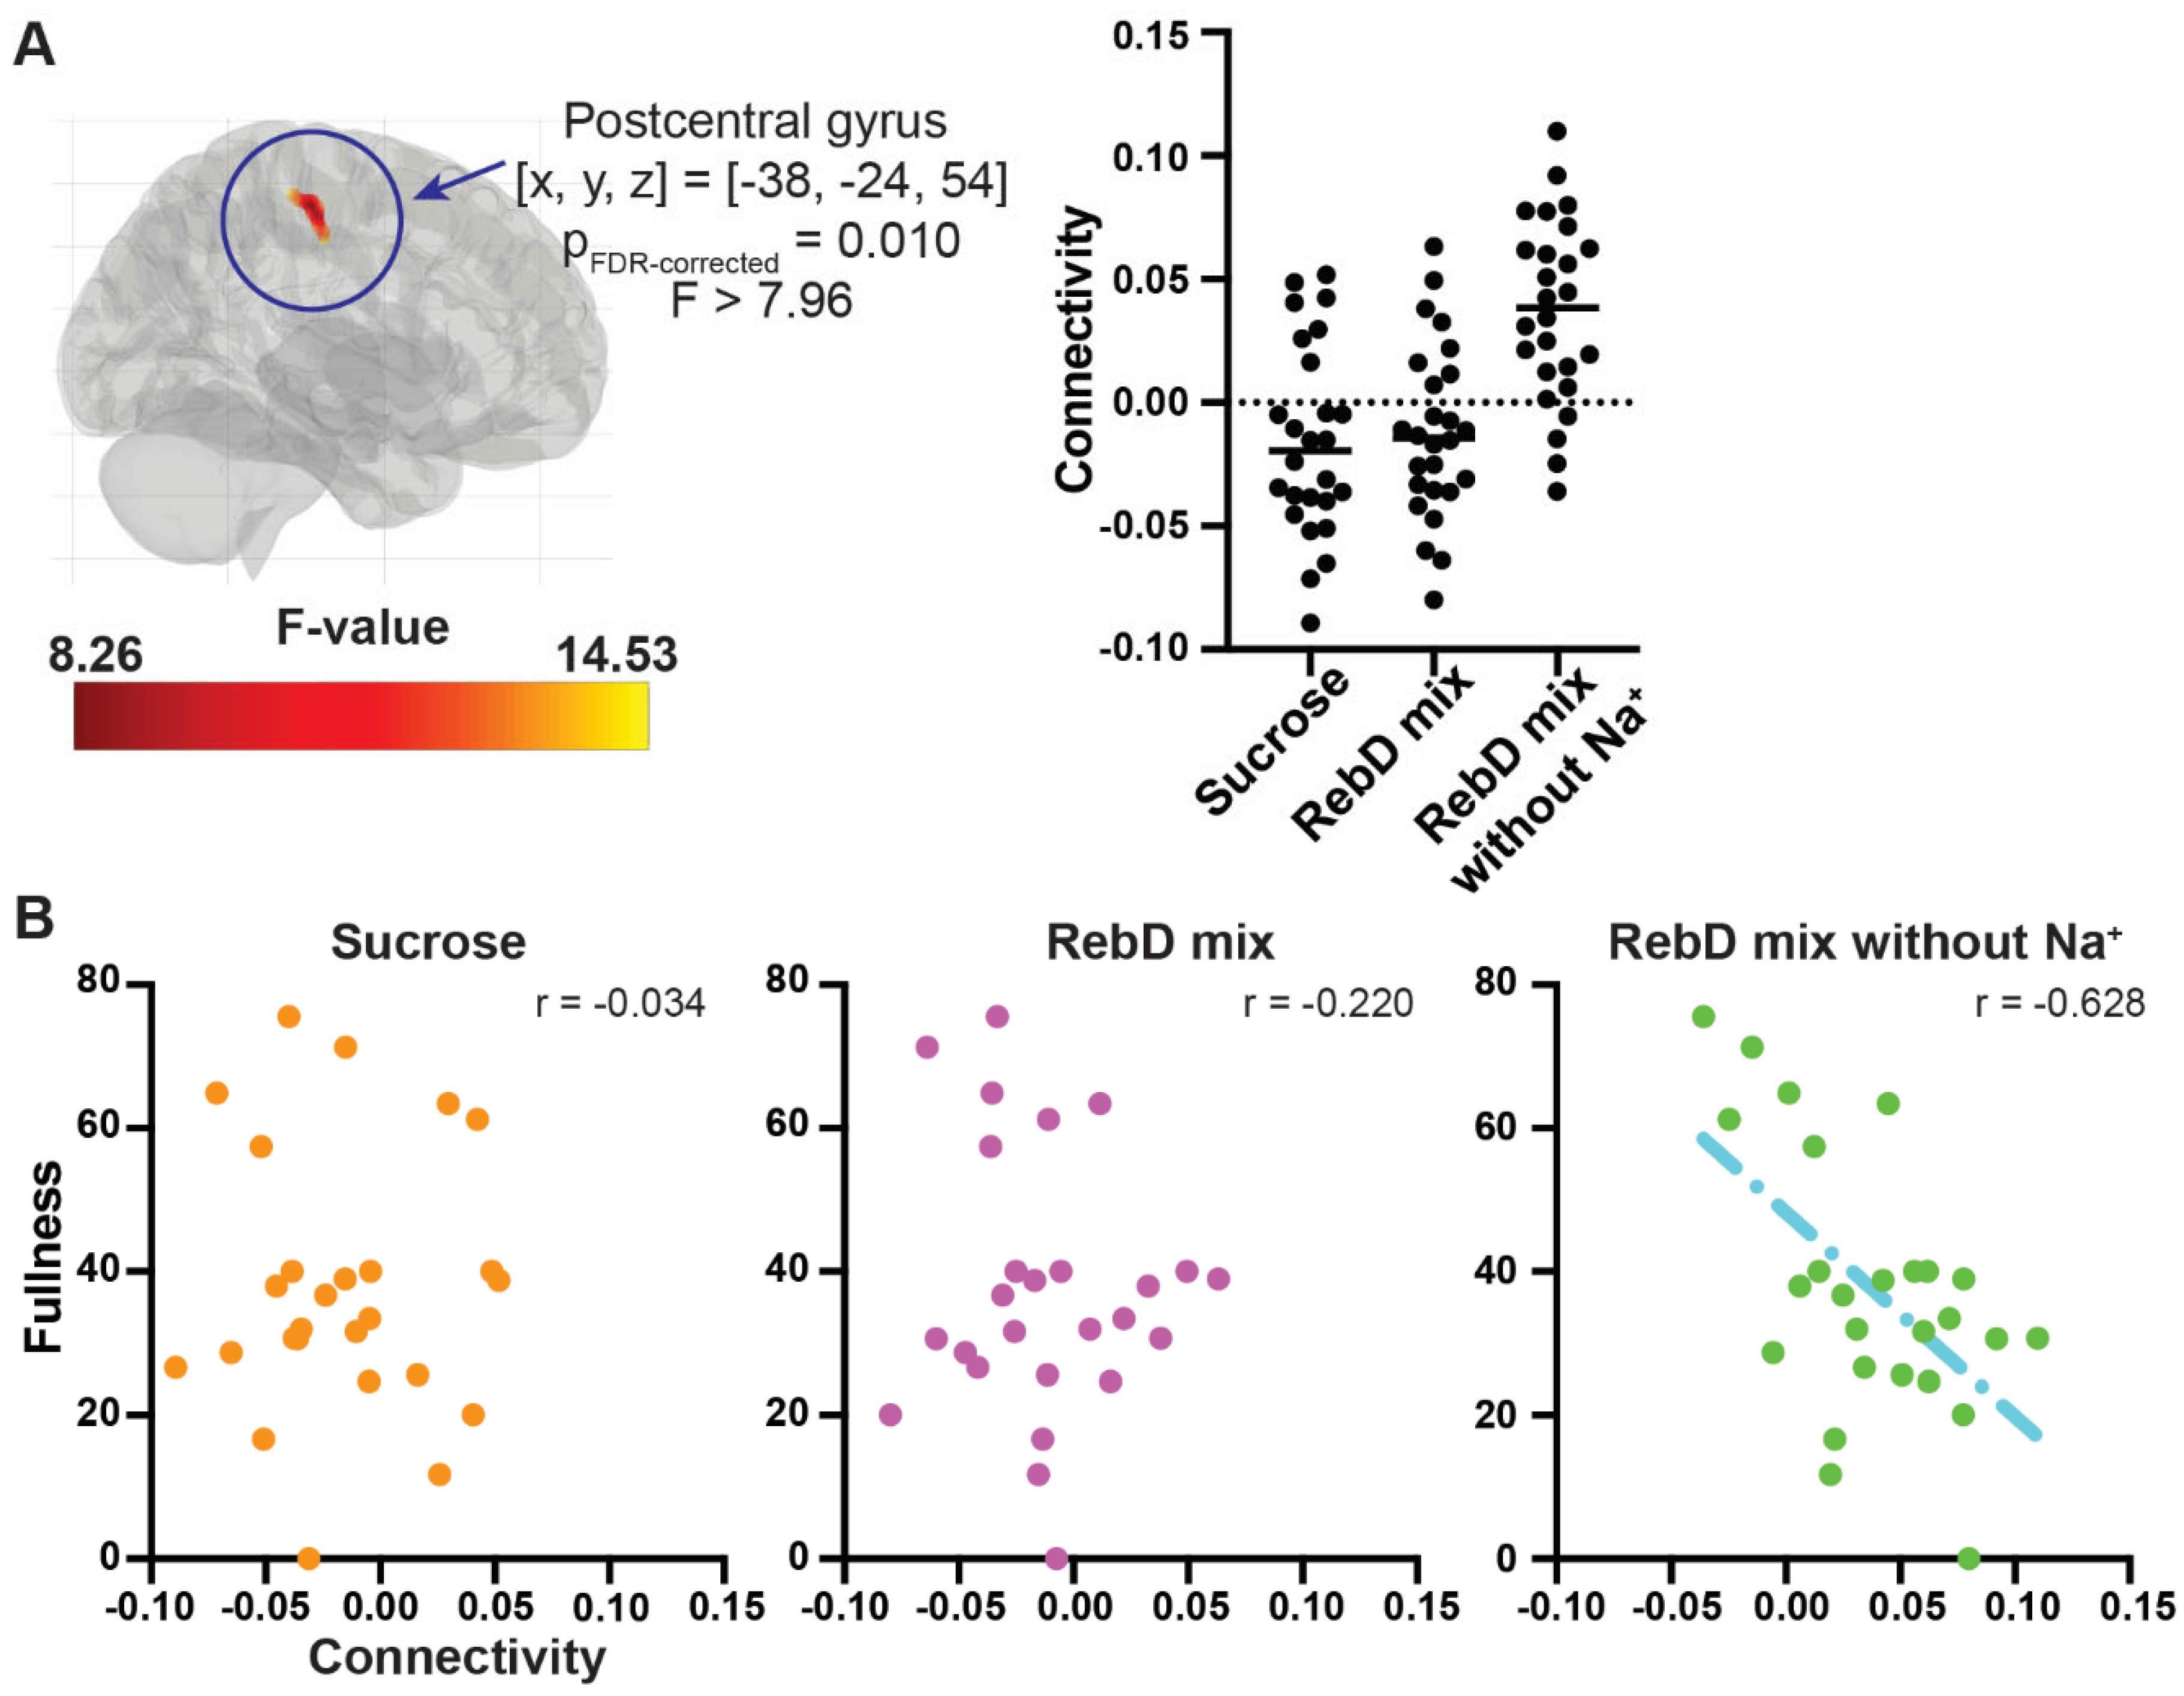

Table 1.
Demographics of participants and ratings for internal state at the fMRI session.
| Age (years) |
Sex (male / female) |
Body mass index (kg/m2) |
Fullness | Hunger | |
| Mean ± S.D. | 22.36 ± 5.20 | 22 / 6 | 20.34 ± 2.22 | 45.56 ± 20.63 | 37.97 ± 18.68 |
| Range | 18 - 42 | 15.41 - 24.91 | 13.62 - 90.40 | 0.00 - 75.55 |
Range of hunger and fullness is 0 – 100. S.D.: Standard deviation2.
Table 2.
Ratings for liking, wanting, and intensity of each gustatory solution at the fMRI session.
| Sucrose | RebD mix | RebD mix without Na+ | p-value* | ||
| Liking | Mean ± S.E. | 56.21 ± 3.61 | 55.54 ± 4.03 | 57.44 ± 2.62 | 0.937 |
| Range | 21.53 - 83.46 | 8.11 - 87.29 | 31.84 - 91.89 | ||
| Wanting | Mean ± S.E. | 54.56 ± 3.55 | 53.11 ± 4.03 | 49.88 ± 3.58 | 0.895 |
| Range | 22.57 - 96.11 | 23.74 - 86.71 | 16.02 - 86.64 | ||
| Intensity | Mean ± S.E. | 51.79 ± 3.43 | 50.43 ± 3.85 | 49.14 ± 3.35 | 0.063 |
| Range | 7.39 - 80.61 | 0.00 - 89.95 | 21.73 - 89.36 |
Range of each rating is 0 – 100. *p-value of the Friedman test. S.E.: Standard error.
Disclaimer/Publisher’s Note: The statements, opinions and data contained in all publications are solely those of the individual author(s) and contributor(s) and not of MDPI and/or the editor(s). MDPI and/or the editor(s) disclaim responsibility for any injury to people or property resulting from any ideas, methods, instructions or products referred to in the content. |
© 2025 by the authors. Licensee MDPI, Basel, Switzerland. This article is an open access article distributed under the terms and conditions of the Creative Commons Attribution (CC BY) license (http://creativecommons.org/licenses/by/4.0/).
Copyright: This open access article is published under a Creative Commons CC BY 4.0 license, which permit the free download, distribution, and reuse, provided that the author and preprint are cited in any reuse.


