
Submitted:
19 January 2025
Posted:
20 January 2025
You are already at the latest version
Abstract
Obesity results from a combination of genetic and environmental factors. However, in diet-induced obesity, individuals with the same genetic background exhibit different sensitivity to obesity, termed diet-induced obesity (DIO) and diet-induced obesity resistance (DR). The hypothalamus is crucial in regulating energy homeostasis. This study conducted a comparative hypothalamic proteomic analysis in DIO and DR rats to identify differentially expressed proteins (DEPs) associated with changes in body weight. In the hypothalamus of DR rats compared to DIO rats, 31 proteins (FDR<1%) were identified as DEPs (14 upregulated and 17 downregulated). Gene ontology analysis of DEPs revealed an enrichment in ion-binding proteins (such as Fe2+, Zn2+, Ca2+, and Se) and those involved in neuronal activity and function, which may positively influence neuronal development and cognition in DR rats. The DEPs were further analyzed using the KEGG pathway, which principally involved in starch and sucrose metabolism, antigen processing and presentation, and inflammatory mediator regulation of TRP channels. The changes of TRPV4, CaMKV, RSBN1, and BASP1, as detected by western blotting, were consistent with those obtained from TMT proteomic. In conclusion, this study provides a comprehensive and functional analysis of the hypothalamic proteome in DIO and DR rats, offering novel insights into important proteins that may be targets for the prevention and treatment of obesity.
Keywords:
proteomic
; obesity
; diet-induced obesity resistance
; hypothalamus
1. Introduction
Obesity is a major risk factor for cardiovascular disease, type 2 diabetes, cancer and other diseases. With the improvement of living standards and changes in lifestyle, the prevalence of obesity has increased year by year, becoming a critical global public health issue [1]. It is reported that there are currently nearly 1.9 billion overweight individuals worldwide, including over 650 million classified as obese. Each year, approximately 2.8 million deaths are attributed to obesity and obesity-related diseases [2]. Therefore, identifying effective therapeutic targets for obesity has become an urgent priority.
Apart from hereditary predispositions, a considerable number of obesity cases can be correlated with chronic intake of hypercaloric diets, leading to an imbalance in energy homeostasis and subsequent adiposity accumulation. However, a small group of individuals, known as obesity-resistant, remain lean despite consuming high-calorie diets [3,4]. Similarly, in rodent models, individual differences in sensitivity to obesity are observed. For example, feeding with a high-fat diet (HFD) for four months, more than 50% Sprague-Dawley (SD) rats will develop obesity, known as diet-induced obesity (DIO). Conversely, approximately 20% of the rats remain resistant to obesity, designated as diet-induced obesity resistance (DR) [5,6]. Previous research has shown that DR rats exhibit increased UCP1 protein expression in brown adipose tissue (BAT), which enhances thermogenesis and promotes weight maintenance [4,7]. Other studies suggest that DR mice have superior fat oxidation capabilities compared to their DIO counterparts [8]. Additionally, Piché et al. reported that gut microbiota composition and their metabolites play an important role in the development of DR [9]. Despite these findings, the precise mechanism underlying obesity resistance remain unclear.
The imbalance of energy metabolism is the key driver of obesity. The hypothalamus, a central brain region, plays a crucial role in regulating energy homeostasis and food intake [10]. Within the hypothalamus, specialized neurons monitor peripheral metabolic status to maintain the balance between food consumption and energy metabolism. Disruption in the development of key hypothalamic nuclei can impair this balance between energy intake and expenditure, leading to rapid and excessive weight gain. Cornier et al. demonstrated that DR individuals exhibit greater sensitivity to short-term energy fluctuations [11]. For example, neuronal responses to food intake vary significantly under conditions of undereating and overeating. Similarly, Souza proposed that insufficient activity of hypothalamic neurons contributes to obesity development [12]. Additionally, abnormal expression of dysregulated proteins in the hypothalamus is also an important cause of obesity. For instance, downregulation of hypothalamic TGR5 exacerbates obesity by reducing sympathetic nerve activity [13]. Therefore, identifying differentially expressed proteins (DEPs) in the hypothalamus of DIO and DR rats will provide new targets for the prevention and treatment of obesity.
In this study, we performed a comparative proteomic analysis of the hypothalamus in DR and DIO rats using the Tandem Mass tag (TMT) methodology. Our objective was to identify DEPs between the two groups and explore the underlying mechanisms contributing to obesity.
2. Results
2.1. The Differences in Metabolic Characteristics between DIO and DR Rats
Compared with rats fed with a standard chow diet (Control), HFD feeding significantly increased body weight in DIO rats. In contrast, HFD did not induce weight gain in DR rats, with DR rats remaining the lightest among all groups (Figure 1A). After calculating the caloric content in the diets, both DIO and DR rats showed higher caloric intake than the control group (Figure 1B). HFD feeding markedly increased fat mass and decreased lean mass in DIO and DR rats compared to control rats (Figure 1C). In the WAT, HFD notably increased adipocytes volume. However, compared to DIO group, DR rats exhibited smaller white adipocyte volume and a higher frequency of small-volume adipocytes (10~20 μm) (Figure 1D and 1E). The H&E staining revealed an increased number of lipid droplets in the BAT of DIO rats compared to DR rats, suggesting alteration in adipocyte composition (Figure 1F). Besides, DR rats also had lower levels of the TC, TG, HDL-C and LDL-C concentrations compared to control and DIO rats (Figure 1G-J). These results suggest that DR rats are able to maintain normal weight despite being exposed to the same HFD conditions indicating that their energy balance regulation system has strong compensatory capacity.
2.2. Proteomics Analysis of Hypothalamus in DIO and DR Rats
To identify potential proteins involved in regulating obesity susceptibility, we utilized a well-characterized rat model of high-fat diet induced obesity and obesity resistance. The hypothalamus, a critical brain region for energy balance regulation, was examined for DEPs. After trypsin digestion and HPLC/MS analysis, we identified 51,559 distinct peptides and 6,189 proteins with a false discovery rate (FDR) <0.01(Figure 2A and 2B). Comparative analysis between DR and DIO rats revealed 31 DEPs (14 upregulated and 17 downregulated in DR rats), with significant changes defined by FDR <0.01 and log2 fold change>1.2(Table 1 and 2). A heatmap illustrating protein expression patterns is shown in Figure 2C, while a volcano plot of the DEPs is presented in Figure 2D. Interestingly, analysis of datasets revealed that the DEPs in the hypothalamus of DR rats were primarily classified into two categories: ion-binding proteins (e.g., Fe2+, Zn2+, Ca2+, Se-binding proteins) and proteins associated with neuronal activity and function. For instance, calcium-related proteins included brain acid soluble protein 1(BASP1), CaM kinase-like vesicle-associated protein (CaMKV), transient receptor potential cation channel subfamily V member 4 (TRPV4) and guanylate cyclase activator 1A (GUCA1A). Zinc-binding proteins included solute carrier family 39 member 12(SLC39A12), actin-binding LIM protein 2(ABLIM2) and Zinc finger MYM-type-containing 3 (ZMYM3). These results suggest that multiple ion channels may be altered in DR rats. Additionally, the differentially abundant proteins were associated with axon-genesis (BASP1, CNTN5 and FLRT3), neuron development (GNG8, SLC39A12) and neuronal project (KIRREL3, TRPV4 and PTPRG). Previous studies have found that zinc ions in the brain are positively correlated with cognitive levels [14]. Excessive deposition of calcium ions may also lead to neuronal damage. These results suggest that the neural development and cognitive levels in the hypothalamus of DR rats may be different from those of DIO rats.
2.3. GO Analysis of DEPs
GO analysis provided insights into the biological functions of DEPs across three categories: biological process, cellular component, and molecular function. For 14 up-regulated proteins in DR vs. DIO comparison, GO annotation of biological processes indicated significant enrichment in the positive regulation of protein binding and the regulation of angiogenesis (Figure 3A). In contrast, for down-regulated proteins, the two most enriched biological processes were embryonic morphogenesis and the negative regulation of nervous system development. Notably, the proteins TRPV4, CaMKV, PTPRG and CNTN5 proteins were significantly down-regulated in these processes (Table 2).
In the cellular component category, enriched terms for downregulated proteins included growth cone, axon terminus, and neuron projection terminus, emphasizing that impact of obesity on neuronal function (Figure 3D). However, the up-regulated proteins mainly affect the cell nucleus (Figure 3C). Therefore, in terms of molecular function, the up-regulated proteins are mainly involved in DNA binding, while the down-regulated proteins mainly act on the binding of neural microtubules (Figure 3E and 3F).
2.4. KEGG Pathway Enrichment Analysis of DEPs
Figure 4A-D showed the GO enrichment analysis results of DEPs using directed acyclic graph. The circles in the figure represented the GO classification in which the differential proteins are located, with red representing extremely significant DEPs (P value 0.01), yellow representing significant differential proteins (P value 0.05), and blue representing non-significant enrichment. The lines with arrows represented the upper and lower levels of the GO classification, and the circle size denoted the degree of enrichment. Figure 4A-C showed the network connections of cellular components, biological processes, and molecular functions involved in upregulated proteins. The results showed that the network connections involved in upregulating DEPs were relatively simple, and the relationship between upstream molecules and downstream molecules was clear. On the contrary, the network connections involved in downregulating the molecular functions of proteins were complex (Figure 4D).
KEGG pathway analysis revealed that up-regulated proteins in the DR groups were associated with starch and sucrose metabolism, antigen processing and presentation, as well as glutamatergic synapse (Figure 4E). The down-regulation of proteins predominantly included those involved in the regulation of TRP channels by inflammatory mediators and cellular senescence [15]. Chronic consumption of a HFD disrupts glucose metabolism and triggers persistent low-grade inflammation. These findings underscore a distinctive protein expression profile in the hypothalamus of DR rats, which may account for their resilience to obesity.
2.5. Analysis of Upregulated Proteins in Hypothalamus of DIO and DR Rats
Focusing on DEPs with fold changes > 1.5 times and P<0.05 (FDR<0.01), six upregulated proteins were identified in the DR group: RHOX12, BASP1, CCDC196, SLC39A12, HSPA4 and RSBN1(Table 3). Western blotting confirmed increased expression of RSBN1 and BASP1 in the DR group, consistent with proteomic data (Figure 5B and 5C). Antibodies for RHOX12 and CCDC196 were unavailable, while SLC39A12 and HSPA4 showed no significant differences.
2.6. Analysis of Downregulated Proteins in Hypothalamus of DIO and DR Rats
Two proteins, TRPV4 and CaMKV, were significantly downregulated in the DR group [15]. Western blotting validated their reduced expression (Figure 6A and 6B). TRPV4, a calcium-permeable ion channel, and CaMKV, a pseudo kinase in the Ca2+/calmodulin-dependent kinase family, paly critical roles in neuronal function, axon growth, and synaptic plasticity. The abnormal expression of these proteins implies a role in obesity-related neuronal dysfunction and may serve as potential therapeutic targets.
3. Discussion
In this study, we identified changes in the hypothalamic proteome of DR and DIO rats. While proteomic changes in obesity models have been previously investigated, the comparison of the hypothalamus proteomes between DR and DIO groups using the TMT approach represents a novel contribution. Moreover, a comprehensive analysis of the hypothalamic global proteome uncovered a range of proteins that have been not been previously reported in studies on obesity or energy metabolism. For instance, cation binding proteins, such as CaMKV and TRPV4, were identified as particularly abundant and pivotal in the central nervous system (CNS). The dysregulation of these proteins appears to plays a crucial role in the function of hypothalamic neuronal, axon growth and other processes.
It is well widely recognized that besides genetic factors, the two primary contributors to obesity are excessive energy intake and reduced energy expenditure. This study reveals that, under the same genetic background, DIO rats exhibited a more rapid increase in body weight starting from 4 weeks compared to DR rats, with this difference being statistically significant. Upon measuring daily food intake and converting it into consume energy, no difference in energy intake was observed between DIO and DR rats. However, the body weight of DR rats was significantly lower than that of DIO rats and even comparable to the control rats. The size of white adipocytes in DR rats was similar to that of control rats, but significantly smaller than those in DIO rats. Additional, BAT is a thermogenic organ that contributes to non-shivering thermogenesis [16]. Long term HFD can cause brown adipocytes to become white. However, the brown adipocytes of the DR rats were similar to those of the control rats, with no significant accumulation of fat droplets. In addition, we also measured the concentrations of leptin and thyroid hormones in the serum. We found that compared with control and DR rats, the concentration of leptin in the serum of DIO rats was significantly increased. The serum leptin content of DR rats is the lowest. Leptin is a hormone secreted by adipose tissue that can inhibit food intake. Research has confirmed that the content of leptin is positively correlated with fat mass. Our results are also consistent with previous reports. An increase in thyroid hormones can enhance the body's basal metabolic rate. Research has shown that patients with significant hypothyroidism typically experience weight gain, while those with hyperthyroidism often experience weight loss [17]. In this study, there was no change in thyroid hormone levels in DIO and DR rats, indicating that weight loss in DR rats is not attributed to thyroid dysfunction. These results suggest that DR rats have strong compensatory ability for long-term HFD.
The hypothalamus is an important part of the balance system that regulates appetite and energy balance. Located near the median eminence, this is an area rich in capillaries that can be utilized by circulating hormones, nutrients, and metabolites. Hypothalamus acts as an ideal relay center to transmit circulating peripheral signals to the brain [18]. Proteomic analysis revealed 31 DEPs in the hypothalamus of DR rats compared to DIO rats (with FDR<1%). Notably,14 proteins were upregulated and 17 proteins were downregulated in DR rats. Western blotting confirmed the proteomic findings of TRPV4 and CaMKV, which are highly expressed in the hypothalamus of DR rats, consistent with the results of TMT proteomic analysis. TRPV4, a member of the transient receptor potential (TRP) channel family, functions as a calcium-permeable ion channel protein and is widely expressed in neurons and glial cells [19]. Studies have underscored the multifaceted role of TRPV4 in maintaining adipose tissue stability, promoting BAT production, and regulating macrophage function and energy metabolism [20,21]. Kumar et al. have reported that TRPV4 promotes macrophage activity in lung inflammation [22], while Ye Li et al. have identified that TRPV4 as a key regulator of fat oxidation metabolism, inflammation, and energy balance [23]. Notably, TRPV4 knockout mice exhibited elevated thermogenic gene expression in adipose tissue, ameliorated HFD-induced obesity, and decreased levels of inflammatory cytokines such as TNF-α and IL-6. However, conflicting evidence suggest that mice lacking TRPV4 genes are more susceptible to obesity, which underscores the debate regarding its role in obesity regulating [24]. In our previous study, we demonstrated that hypothalamic TRPV4 overexpression increased obesity susceptibility [15]. Conversely, adipose tissue-specific TRPV4 knockout mice exhibited obesity resistance by promoting the browning of white adipocytes [25]. These findings imply that the impact of TRPV4 on obesity may by tissue-dependent, warranting further investigation. Collectively, these findings suggest that dysregulated TRPV4 expression could be a promising therapeutic target for the prevention and treatment of obesity.
CaMKV is a calmodulin binding protein, which plays an important role in dendritic spine activity, synaptic plasticity and hippocampal memory function. Studies have confirmed that dendritic protein synthesis is a key mechanism underlying the development and plasticity of neural circuits [26]. CaMKV modulates the density of dendritic spines through Ca2+/calmodulin signaling pathway. In the present study, we observed a significant downregulation of proteins involved in the negative regulation of nervous system development in the hypothalamus of DR rats, including CaMKV. Conversely, CaMKV protein expression was significantly increased in DIO rats. Several studies have shown that obesity and diabetes can impair hippocampal plasticity, potentially leading to cognitive decline, emotional disturbances and overeating. The decrease in CaMKV expression that we observed may alleviate the adverse of HFD on neural plasticity, which needs further verification.
GO enrichment analysis identified “binding” as the main molecular function. Notably, the DEP associated with protein binding are involved in the binding of various cations, including calcium (Ca2+), zinc (Zn2+), and iron (Fe2+). Ca2+-related proteins include CaMKV, TRPV4, BASP1 and GUCA1A. Calcium has been identified as a pivotal mediator in the communication between neuronal synapses and the nucleus, governing synaptic activity. Decreased intracellular Ca2+ levels have been shown to be neurotoxic and pathogenic factor driving the advancement of neurodegenerative diseases, as well as to the augmentation of neuronal autophagy [27]. Zinc (Zn2+), the second most abundant essential trace element in human, plays an important role in various physiological processes, such as cell proliferation, apoptosis, transcription, growth and immunity. Studies have shown that individuals with obesity often exhibit reduced serum zinc level, and zinc supplementation has been shown to improve weight and insulin resistance in the obese [7,28]. De Oliveira et al. found that zinc supplementation in rats reduced obesity-related neuroinflammation and enhanced metabolic function and memory in rats [28]. Recent studies suggest that the dysfunction of Zn2+ is linked to a range of CNS disorders, including Alzheimer's disease, depression and Parkinson’s disease. SLC39A12, a member of the SLC39 zinc transporter family (commonly known as ZIP proteins), promotes neurite outgrowth, neuronal differentiation, and microtubule aggregation and stabilization by transporting zinc to the cytoplasm [29]. Davis et al. has shown that SLC39A12 is crucial for nervous system development [30]. In this study, proteomic analysis revealed an upregulation of SLC39A12, also known as ZIP12, in the hypothalamus of DR rats compared to DIO rats. However, western blotting did not detect any significant changes in SLC39A12 expression between the two groups. The discrepancy observed might be attributed to the presence of variants or polymorphisms within the SLC39A12 gene. Variations in the length of these gene variants can result in the production of distinct proteins from the same transcript, each potentially exhibiting unique biological functions. Scarr and colleagues identified two such variants of the SLC39A12 protein, designated as NP001138667.1 and NP689938.2 [31], which may contribute to the differential expression and function observed in our study. we will verify the expression of polymorphisms and variants to reveal the potential molecular mechanism in the future. Iron metabolism is also pivotal a vital role in various brain functions. Disruptions in iron homeostasis have been associated with several neurodegenerative diseases. These findings suggest that abnormal expression of ion-binding proteins might underlie cognition impairments, learning defects, and diminished neuronal activity in DIO rats.
Compared to DIO rats, DR rats exhibited a significantly upregulation of six proteins in the hypothalamus: RHOX12, BASP1, CCDC196, SLC39A12, HSPA4, and RSBN1. Rhox12, a member of the Rhox (reproductive homeobox) gene cluster located on the X chromosome, is primarily expressed in reproductive tissues and the placenta [32]. Although the role of Rhox12 in obesity is yet to be explored, it may be implicated in the enhanced reproductive capacity in rodents. BASP1, a member of the brain acid soluble protein family, is associated with neuron growth and cytoskeletal regulation. It is highly expressed in the nervous system, as well as in the kidney, testicles, spleen and thymus [33]. Notably, increased expression of BASP1 has been detected in the 61.5 % metastatic tumor. Additionally, under stress conditions, BASP1 has been found to regulate progenitor cell polarity and neuronal development. These findings suggest that higher levels of BASP1 could potentially contribute to the development of obesity by modulating neuronal activity. HSPA4, a member of the heat shock protein A family, has been predominantly studied in cancer, contexts, including breast, lung and prostate cancer. In the CNS, HSPA4 has been shown to inhibit the expression of inflammatory cytokines in microglia [34]. In a Parkinson’s mouse model, SIRT1-mediated dehydrated to HSPA4 was shown to reduce neuritis. Elevated HSPA4 expression has been correlated with improved survival in glioma patients [35]. Nevertheless, research examining the relationship between HSPA4 and obesity is limited. In this study, we conducted a comprehensive proteomic analysis of DEPs in the hypothalamus of DIO and DR rats to identify potential targets for improving obesity. However, there are several limitations in this study. Firstly, since our research focuses on rats, further research is required to validate whether these findings are applicable to other rodents, such as mice. Secondly, our analysis of DEPs may have overlooked other potential therapeutic targets. Thirdly, although we have determined that the expression of four proteins is consistent with the group results through western blotting, the specific role in obesity still needs to be further investigated.
In summary, our study identified 31 DEPs in the hypothalamus of DR and DIO rats, providing insights into the molecular mechanisms underlying energy balance and resistance to obesity. Proteins such as TRPV4 and CaMKV emerge as promising target for future obesity treatment. This work enhances our understanding of the proteomic changes associated with obesity and lays the groundwork for the development of novel therapeutic strategies.
4. Materials and Methods
4.1. Animals
Male SD rats, aged 8 to 10 weeks, were used for this study. The animals were maintained in a controlled laboratory environment with a temperature range of 21-23°C, humidity levels between 50% and 60%, and a 12-hour light-dark cycle in an air-conditioned facility. All experimental procedures were conducted in accordance with the ethical requirements of the Animal Ethics Committee of Tianjin Medical University.
The rats were acclimatized to laboratory conditions for one week before the experiment. Following acclimatization, the animals were divided into two groups. The control group fed a standard chow fat diet (CFD, containing 3.8 kcal/g, n=6/group) ad libitum, while the experimental group was fed a high-fat diet (HFD, containing 4.77 kcal/g, n=15/group) for 12 weeks to establish the DIO and DR models. As previously reported, CFD composes of 10% fat, 70% carbohydrate and 20% protein (3.85 kJ, 10% fat calories, Beijing, China); HFD is composed of 45% fat, 35% carbohydrate and 20% protein (4.73 kJ, 45% calories from fat, Beijing, China) [15].Food intake was measured daily, and body weight was monitored weekly. Rats in the HFD group whose body weight exceeded 1.2 times the average weight of the control group were classified as obese (DIO). Rats in the HFD group whose body weight was lower than the control group’s average were classified as resistant to obesity (DR). At the end of the experiment, epididymal white adipose tissue (WAT), BAT, blood samples, and hypothalamic tissues were collected and stored at -80°C for further analysis.
4.2. Body Mass Analysis
Body composition, including fat mass and lean mass, was assessed using X-ray absorptiometry as described by Xi et al [36].
4.3. Hematoxylin and Eosin Staining
WAT and BAT samples were fixed in a 4 % polymerized formaldehyde for 24 hours. The fixed tissue was dehydrated through a graded ethanol series (75%, 80%, 90%, 95%, and 100%), cleared with xylene, and embedded in paraffin. Tissue sections, 6 μm in thickness, were prepared and stained with hematoxylin-eosin (H&E). Microscopic analysis was conducted at 400× magnification, ensuring that all histological examinations were performed in a blinded manner. The average size of the adipocytes was quantified using ImageJ software.
4.4. Blood Lipid Analysis
Serum levels of total cholesterol (TC), triglycerides (TG), high-density lipoprotein cholesterol (HDL-C), and low-density lipoprotein cholesterol (LDL-C) were measured using an immunosorbent assay following the manufacturer’s protocols.
4.5. Protein Extraction and Proteomics Sample Preparation
Hypothalamic tissues were subjected to sonication on ice three times using a high-intensity processor in a lysis buffer containing 8 M urea and 1% protease inhibitor cocktail. The lysate was centrifuged at 12,000 g for 10 minutes at 4°C to remove cellular debris. The supernatant was transferred into new tubes, and protein concentrations were measured using a BCA assay kit. Equal amounts of protein were precipitated 2-3 times with pre-cooled acetone. After drying the precipitate, 200 mM TEAB (triethylammonium bicarbonate) was added, and the precipitate was sonicated until dissolved. Proteins were digested with trypsin at a 1:50 ratio overnight. The following day, dithiothreitol was added to a final concentration of 5 mM and reduced at 56°C for 30 min to reduce the proteins. Iodoacetamide was subsequently added and incubated at room temperature in the dark for 15 minutes.
4.6. TMT Labeling
Trypsin-digested peptides were desalted using with Strata X C18 (Phenomenex) cartridges, freeze-dried and vacuum-sealed. The peptides were reconstituted in 0.5 M TEAB and labeled using a TMT kit according to manufacturer’s instructions. Briefly, the labeling reagent was thawed, dissolved in acetonitrile, and incubated with the peptide mixtures at room temperature for 2 hours. The labeled peptides were then mixed, desalted, and freeze-dried under vacuum.
4.7. HPLC Fractionation
Peptide fragments were fractionated using high-pH reverse-phase HPLC (Agilent 300Ex tend C18 column, 5 μm particles, 4.6 mm inner diameter and 250 mm length). The peptides were separated using an acetonitrile gradient of 8%~32% over 6 minutes. The resulting fractions were pooled into nine combined fractions and dried using freeze centrifugation.
4.8. Liquid Phase Enzyme Analyzer Using LC-MC/MC Analysis
Peptides were dissolved in solvent A (0.1% formic acid and 2% acetonitrile) and separated using an EASY-nLC 1200 ultrahigh-pressure liquid chromatography system. Mobile phase A contains 0.1% formic acid and 2% acetonitrile, while mobile phase B contained 0.1% formic acid and 80% acetonitrile. The gradient elution was set as follows, 6-28% B for 0-42 minutes, 28-40% B for 42-50 minutes, and 40-50% B for 50-54 minutes, and 100% B for 54-60 min, at a flow rate of 300 nL/min.
Peptides were ionized in a nano-spray ion source and analyzed using a Q Exactive HF-X MS mass spectrometer. Data acquisition was conducted using a data-dependent acquisition mode, with automatic gain control set to 1E5, a signal threshold of 83000 ions/s, and a maximum injection time was 60 ms. The dynamic exclusion time for tandem mass spectrum scans was set to 30 seconds to prevent repeated scans.
4.9. Bioinformatics Analysis
Gene ontology (GO) analysis was conducted to annotate the functions of DEPs in terms of biological aggregates, cellular components, and molecular functions. Enrichment analysis was performed using the KEGG pathway to identify associated signaling pathways. Protein trimerization and functional predictions were carried out using the Inter-Pro database.
4.10. Western Blotting Analysis
Hypothalamic tissue was homogenized in radioimmunoprecipitation assay buffer (Solarbio, China) supplemented with phosphatase inhibitor (Roche, Sweden) and PMSF (Solarbio, China). After incubation for 30 min on ice, lysate was centrifuged at 12,000×g for 30 min. Protein concentration was measured using bicinchoninic acid assay (Solarbio, China). Protein samples (30 µg) were separated by 10% SDS-PAGE and transferred onto polyvinylidene fluoride (PVDF) membranes (Millipore, Bedford, MA). Next, the membrane was sealed with 5% skim milk at room temperature to prevent non-specific protein binding. Thereafter, membranes were incubated with specific antibodies against TRPV4 (Abclonal, A5660, 1:1000), RSBN1 (bioss, bs-18865R, 1:1000), BASP1 (Huabio, ER1904-13, 1:1000), SLC39A12 (Huabio, ER1706-33, 1:1000) HSPA4 (proteintech, 21206-1-AP, 1:1000), CAMKV (proteintech, 14788-1-AP, 1:1000) and GAPDH (Abways, P04406, 1:10000 ) at 4℃ overnight. Three times washes in TBST for 30 min, the blots were exposed to a secondary antibody (Cell Signaling, 7074s, 1:10000). Follow the blots were washed three times, signals were visualized by chemiluminescence (Millipore, Bedford, MA). The protein intensities were analyzed using Image J.
4.11. Statistical Analysis
Values are presented as mean ± SEM. Data analysis was performed using GraphPad Prism (version 8, GraphPad Software, San Diego, CA). For more than two groups, data were analyzed for statistical significance using one-way ANOVA and LSD. P value 0.05 were considered statistically significant.
Supplementary Materials
The following supporting information can be downloaded at the website of this paper posted on Preprints.org, Figure S1. A-B. The concentrations of leptin and thyroxine hormone in the serum. C. The body weight of control, DR and DIO rats after feed for 3 months. D. Food intake was measured every day. Data were presented as mean ± SEM. *P < 0.05 and ***P < 0.001 vs. control group; #P < 0.05 vs. DR group. ns: no significant.
Author Contributions
Pengjiao Xi: Writing-original draft, Formal analysis, Methodology, Investigation, Conceptualization, Funding acquisition. Shuhui Ma: Methodology, Investigation. Derun Tian: Supervision. Yanna Shen: Writing-review & editing, Supervision, Conceptualization.
Funding
This work was supported by the Scientific Research Project of Tianjin Education Commission, Tianjin, China (grant number 2020KJ205).
Institutional Review Board Statement
The animal experiments performed in the present study were approved by the institutional guidelines of the Animal Care Committee of Tianjin Medical University (TMUaMEC 2021053).
Informed Consent Statement
Not applicable.
Acknowledgments
We thank Yan Zhang from department of Clinical Laboratory, the First Affiliated Hospital of USTC, University of Science and Technology of China for invaluable assistance.
Conflicts of Interest
All authors declare that they have no competing financial interest.
Abbreviations
The following abbreviations are used in this manuscript:
| DIO | diet-induced obesity |
| DR | diet-induced obesity resistance |
| TC | total cholesterol |
| TG | triglyceride |
| HDL-C | high-density lipoprotein cholesterol |
| LDL-C | low-density lipoprotein cholesterol |
| CFD | chow-fat diet |
| HFD | High-fat diet |
| WAT | white adipose tissue |
| BAT | Brown adipose tissue |
| HE | hematoxylin-eosin |
| HPLC | reverse-phase high performance liquid chromatography |
| GO | Gene ontology |
| KEGG | Kyoto Encyclopedia of Genes and Genomes |
| HSPA4 | Heat Shock Protein A Family 4 |
| BASP1 | Brain acid soluble protein 1 |
| TRPV4 | transient receptor potential vanilloid 4 |
| TMT | Tandem Mass tag |
| DEPs | differentially expressed proteins |
| TEAB | triethylammonium bicarbonate |
| SD | Sprague-Dawley |
| FDR | false discovery rate |
| GUCA1A | guanylate cyclase activator 1A |
| SLC39A12 | solute carrier family 39-member 12 |
| ABLIM2 | actin-binding LIM protein 2 |
| ZMYM3 | Zinc finger MYM-type-containing 3 |
| CNS | central nervous system |
| PVDF | polyvinylidene fluoride |
References
- Mouton, A.J.; Li, X.; Hall, M.E.; Hall, J.E. Obesity, Hypertension, and Cardiac Dysfunction: Novel Roles of Immunometabolism in Macrophage Activation and Inflammation. Circ Res 2020, 126, 789–806. [Google Scholar] [CrossRef] [PubMed]
- Caballero, B. Humans against Obesity: Who Will Win? Adv Nutr 2019, 10, S4–S9. [Google Scholar] [CrossRef]
- Lu, Y.; Li, Y.; Sun, Y.; Ma, S.; Zhang, K.; Tang, X.; Chen, A. Differences in energy metabolism and mitochondrial redox status account for the differences in propensity for developing obesity in rats fed on high-fat diet. Food Sci Nutr 2021, 9, 1603–1613. [Google Scholar] [CrossRef] [PubMed]
- Poret, J.M.; Souza-Smith, F.; Marcell, S.J.; Gaudet, D.A.; Tzeng, T.H.; Braymer, H.D.; Harrison-Bernard, L.M.; Primeaux, S.D. High fat diet consumption differentially affects adipose tissue inflammation and adipocyte size in obesity-prone and obesity-resistant rats. Int J Obes (Lond) 2018, 42, 535–541. [Google Scholar] [CrossRef] [PubMed]
- Wang, C.; Duan, M.; Lin, J.; Wang, G.; Gao, H.; Yan, M.; Chen, L.; He, J.; Liu, W.; Yang, F.; et al. LncRNA and mRNA expression profiles in brown adipose tissue of obesity-prone and obesity-resistant mice. iScience 2022, 25, 104809. [Google Scholar] [CrossRef]
- Wang, Q.M.; Yang, H.; Tian, D.R.; Cai, Y.; Wei, Z.N.; Wang, F.; Yu, A.; Han, J.S. Proteomic analysis of rat hypothalamus revealed the role of ubiquitin-proteasome system in the genesis of DR or DIO. Neurochem Res 2011, 36, 939–946. [Google Scholar] [CrossRef] [PubMed]
- González-Domínguez, Á.; Millán-Martínez, M.; Domínguez-Riscart, J.; Mateos, R.M.; Lechuga-Sancho, A.M.; González-Domínguez, R. Altered Metal Homeostasis Associates with Inflammation, Oxidative Stress, Impaired Glucose Metabolism, and Dyslipidemia in the Crosstalk between Childhood Obesity and Insulin Resistance. Antioxidants 2022, 11. [Google Scholar] [CrossRef] [PubMed]
- Liu, Y.; Li, Y.; Cheng, B.; Feng, S.; Zhu, X.; Chen, W.; Zhang, H. Comparison of visceral fat lipolysis adaptation to high-intensity interval training in obesity-prone and obesity-resistant rats. Diabetology & Metabolic Syndrome 2022, 14. [Google Scholar] [CrossRef]
- Piché, M.-E.; Tchernof, A.; Després, J.-P. Obesity Phenotypes, Diabetes, and Cardiovascular Diseases. Circulation Research 2020, 126, 1477–1500. [Google Scholar] [CrossRef] [PubMed]
- Gan, H.-W.; Cerbone, M.; Dattani, M.T. Appetite- and Weight-Regulating Neuroendocrine Circuitry in Hypothalamic Obesity. Endocrine Reviews 2024, 45, 309–342. [Google Scholar] [CrossRef]
- Cornier, M.A.; McFadden, K.L.; Thomas, E.A.; Bechtell, J.L.; Bessesen, D.H.; Tregellas, J.R. Propensity to obesity impacts the neuronal response to energy imbalance. Front Behav Neurosci 2015, 9, 52. [Google Scholar] [CrossRef]
- Souza, G.F.; Solon, C.; Nascimento, L.F.; De-Lima-Junior, J.C.; Nogueira, G.; Moura, R.; Rocha, G.Z.; Fioravante, M.; Bobbo, V.; Morari, J.; et al. Defective regulation of POMC precedes hypothalamic inflammation in diet-induced obesity. Sci Rep 2016, 6, 29290. [Google Scholar] [CrossRef] [PubMed]
- Castellanos-Jankiewicz, A.; Guzman-Quevedo, O.; Fenelon, V.S.; Zizzari, P.; Quarta, C.; Bellocchio, L.; Tailleux, A.; Charton, J.; Fernandois, D.; Henricsson, M.; et al. Hypothalamic bile acid-TGR5 signaling protects from obesity. Cell metabolism 2021, 33, 1483–1492. [Google Scholar] [CrossRef] [PubMed]
- Wang, B.; Fang, T.; Chen, H. Zinc and Central Nervous System Disorders. Nutrients 2023, 15. [Google Scholar] [CrossRef] [PubMed]
- Xi, P.; Zhu, W.; Zhang, Y.; Wang, M.; Liang, H.; Wang, H.; Tian, D. Upregulation of hypothalamic TRPV4 via S100a4/AMPKalpha signaling pathway promotes the development of diet-induced obesity. Biochim Biophys Acta Mol Basis Dis 2024, 1870, 166883. [Google Scholar] [CrossRef]
- Marcelin, G.; Gautier, E.L.; Clement, K. Adipose Tissue Fibrosis in Obesity: Etiology and Challenges. Annu Rev Physiol 2022, 84, 135–155. [Google Scholar] [CrossRef]
- Pearce, E.N. Thyroid hormone and obesity. Current Opinion in Endocrinology, Diabetes & Obesity 2012, 19, 408–413. [Google Scholar] [CrossRef]
- Herrera Moro Chao, D.; Kirchner, M.K.; Pham, C.; Foppen, E.; Denis, R.G.P.; Castel, J.; Morel, C.; Montalban, E.; Hassouna, R.; Bui, L.C.; et al. Hypothalamic astrocytes control systemic glucose metabolism and energy balance. Cell metabolism 2022, 34, 1532–1547. [Google Scholar] [CrossRef]
- Sanchez, J.C.; Valencia-Vasquez, A.; Garcia, A.M. Role of TRPV4 Channel in Human White Adipocytes Metabolic Activity. Endocrinol Metab (Seoul) 2021, 36, 997–1006. [Google Scholar] [CrossRef] [PubMed]
- Hu, W.; Ding, Y.; Li, Q.; Shi, R.; He, Y. Transient receptor potential vanilloid 4 channels as therapeutic targets in diabetes and diabetes-related complications. J Diabetes Investig 2020, 11, 757–769. [Google Scholar] [CrossRef] [PubMed]
- Yu, Q.; Wang, D.; Wen, X.; Tang, X.; Qi, D.; He, J.; Zhao, Y.; Deng, W.; Zhu, T. Adipose-derived exosomes protect the pulmonary endothelial barrier in ventilator-induced lung injury by inhibiting the TRPV4/Ca(2+) signaling pathway. Am J Physiol Lung Cell Mol Physiol 2020, 318, L723–L741. [Google Scholar] [CrossRef] [PubMed]
- Kusudo, T.; Wang, Z.; Mizuno, A.; Suzuki, M.; Yamashita, H. TRPV4 deficiency increases skeletal muscle metabolic capacity and resistance against diet-induced obesity. J Appl Physiol (1985) 2012, 112, 1223–1232. [Google Scholar] [CrossRef]
- Ye, L.; Kleiner, S.; Wu, J.; Sah, R.; Gupta, R.K.; Banks, A.S.; Cohen, P.; Khandekar, M.J.; Bostrom, P.; Mepani, R.J.; et al. TRPV4 is a regulator of adipose oxidative metabolism, inflammation, and energy homeostasis. Cell 2012, 151, 96–110. [Google Scholar] [CrossRef]
- O'Conor, C.J.; Griffin, T.M.; Liedtke, W.; Guilak, F. Increased susceptibility of Trpv4-deficient mice to obesity and obesity-induced osteoarthritis with very high-fat diet. Ann Rheum Dis 2013, 72, 300–304. [Google Scholar] [CrossRef]
- Zhang, Y.; Xue, J.; Zhu, W.; Wang, H.; Xi, P.; Tian, D. TRPV4 in adipose tissue ameliorates diet-induced obesity by promoting white adipocyte browning. Translational Research 2024, 266, 16–31. [Google Scholar] [CrossRef]
- Liang, Z.; Zhan, Y.; Shen, Y.; Wong, C.C.; Yates, J.R., 3rd; Plattner, F.; Lai, K.O.; Ip, N.Y. The pseudokinase CaMKv is required for the activity-dependent maintenance of dendritic spines. Nature communications 2016, 7, 13282. [Google Scholar] [CrossRef] [PubMed]
- Mozolewski, P.; Jeziorek, M.; Schuster, C.M.; Bading, H.; Frost, B.; Dobrowolski, R. The role of nuclear Ca2+ in maintaining neuronal homeostasis and brain health. Journal of Cell Science 2021, 134. [Google Scholar] [CrossRef] [PubMed]
- de Oliveira, S.; Feijó, G.d.S.; Neto, J.; Jantsch, J.; Braga, M.F.; Castro, L.F.d.S.; Giovenardi, M.; Porawski, M.; Guedes, R.P. Zinc Supplementation Decreases Obesity-Related Neuroinflammation and Improves Metabolic Function and Memory in Rats. Obesity 2020, 29, 116–124. [Google Scholar] [CrossRef] [PubMed]
- Shen, Z.; Fan, C.; Ding, C.; Xu, M.; Wu, X.; Wang, Y.; Xing, T. Loss of Slc39a12 in hippocampal neurons is responsible for anxiety-like behavior caused by temporomandibular joint osteoarthritis. Heliyon 2024, 10. [Google Scholar] [CrossRef] [PubMed]
- Davis, D.N.; Strong, M.D.; Chambers, E.; Hart, M.D.; Bettaieb, A.; Clarke, S.L.; Smith, B.J.; Stoecker, B.J.; Lucas, E.A.; Lin, D.; et al. A role for zinc transporter gene SLC39A12 in the nervous system and beyond. Gene 2021, 799. [Google Scholar] [CrossRef]
- Scarr, E.; Udawela, M.; Greenough, M.A.; Neo, J.; Suk Seo, M.; Money, T.T.; Upadhyay, A.; Bush, A.I.; Everall, I.P.; Thomas, E.A.; et al. Increased cortical expression of the zinc transporter SLC39A12 suggests a breakdown in zinc cellular homeostasis as part of the pathophysiology of schizophrenia. npj Schizophrenia 2016, 2. [Google Scholar] [CrossRef]
- Lee, S.-E.; Lee, S.-Y.; Lee, K.-A. Rhoxin mammalian reproduction and development. Clinical and Experimental Reproductive Medicine 2013, 40. [Google Scholar] [CrossRef]
- Manganas, L.N.; Durá, I.; Osenberg, S.; Semerci, F.; Tosun, M.; Mishra, R.; Parkitny, L.; Encinas, J.M.; Maletic-Savatic, M. BASP1 labels neural stem cells in the neurogenic niches of mammalian brain. Scientific Reports 2021, 11. [Google Scholar] [CrossRef]
- Yuan, X.; Sun, X.; Zhou, B.; Zhao, S.; Li, Y.; Ming, H. HSPA4 regulated glioma progression via activation of AKT signaling pathway. Biochem Cell Biol 2024, 102, 159–168. [Google Scholar] [CrossRef]
- Yang, Y.; Zhang, S.; Guan, J.; Jiang, Y.; Zhang, J.; Luo, L.; Sun, C. SIRT1 attenuates neuroinflammation by deacetylating HSPA4 in a mouse model of Parkinson's disease. Biochimica et Biophysica Acta (BBA) - Molecular Basis of Disease 2022, 1868. [Google Scholar] [CrossRef]
- Xi, P.; Du, J.; Liang, H.; Han, J.; Wu, Z.; Wang, H.; He, L.; Wang, Q.; Ge, H.; Li, Y.; et al. Intraventricular Injection of LKB1 Inhibits the Formation of Diet-Induced Obesity in Rats by Activating the AMPK-POMC Neurons-Sympathetic Nervous System Axis. Cellular physiology and biochemistry : international journal of experimental cellular physiology, biochemistry, and pharmacology 2018, 47, 54–66. [Google Scholar] [CrossRef]
Figure 1.
Metabolic characteristics of DR and DIO rats were assessed. (A) Body weights (n=6/group). (B) Average daily energy intake (kcal/day). (C) Fat mass and lean mass. (D) Representative images of white adipose tissue (WAT) stain with H&E (magnification: 200×, scale bar: 50 μm), (n=6/group). (E) Quantification of adipocyte size of WAT described in D. (F) H&E staining of brown adipose tissue (BAT) (magnification: 100×, scale bar: 100 μm; magnification: 200×, scale bar: 50 μm), (n=6/group). (G-J) The concentrations of triglycerides (G), total cholesterol (H), HDL-C (I), and LDL-C (J) were determined, (n=3-4/group). Data were presented as mean ± SEM. *P < 0.05, **P < 0.01 and ***P < 0.001 vs. control group; #P < 0.05 vs. DR group.
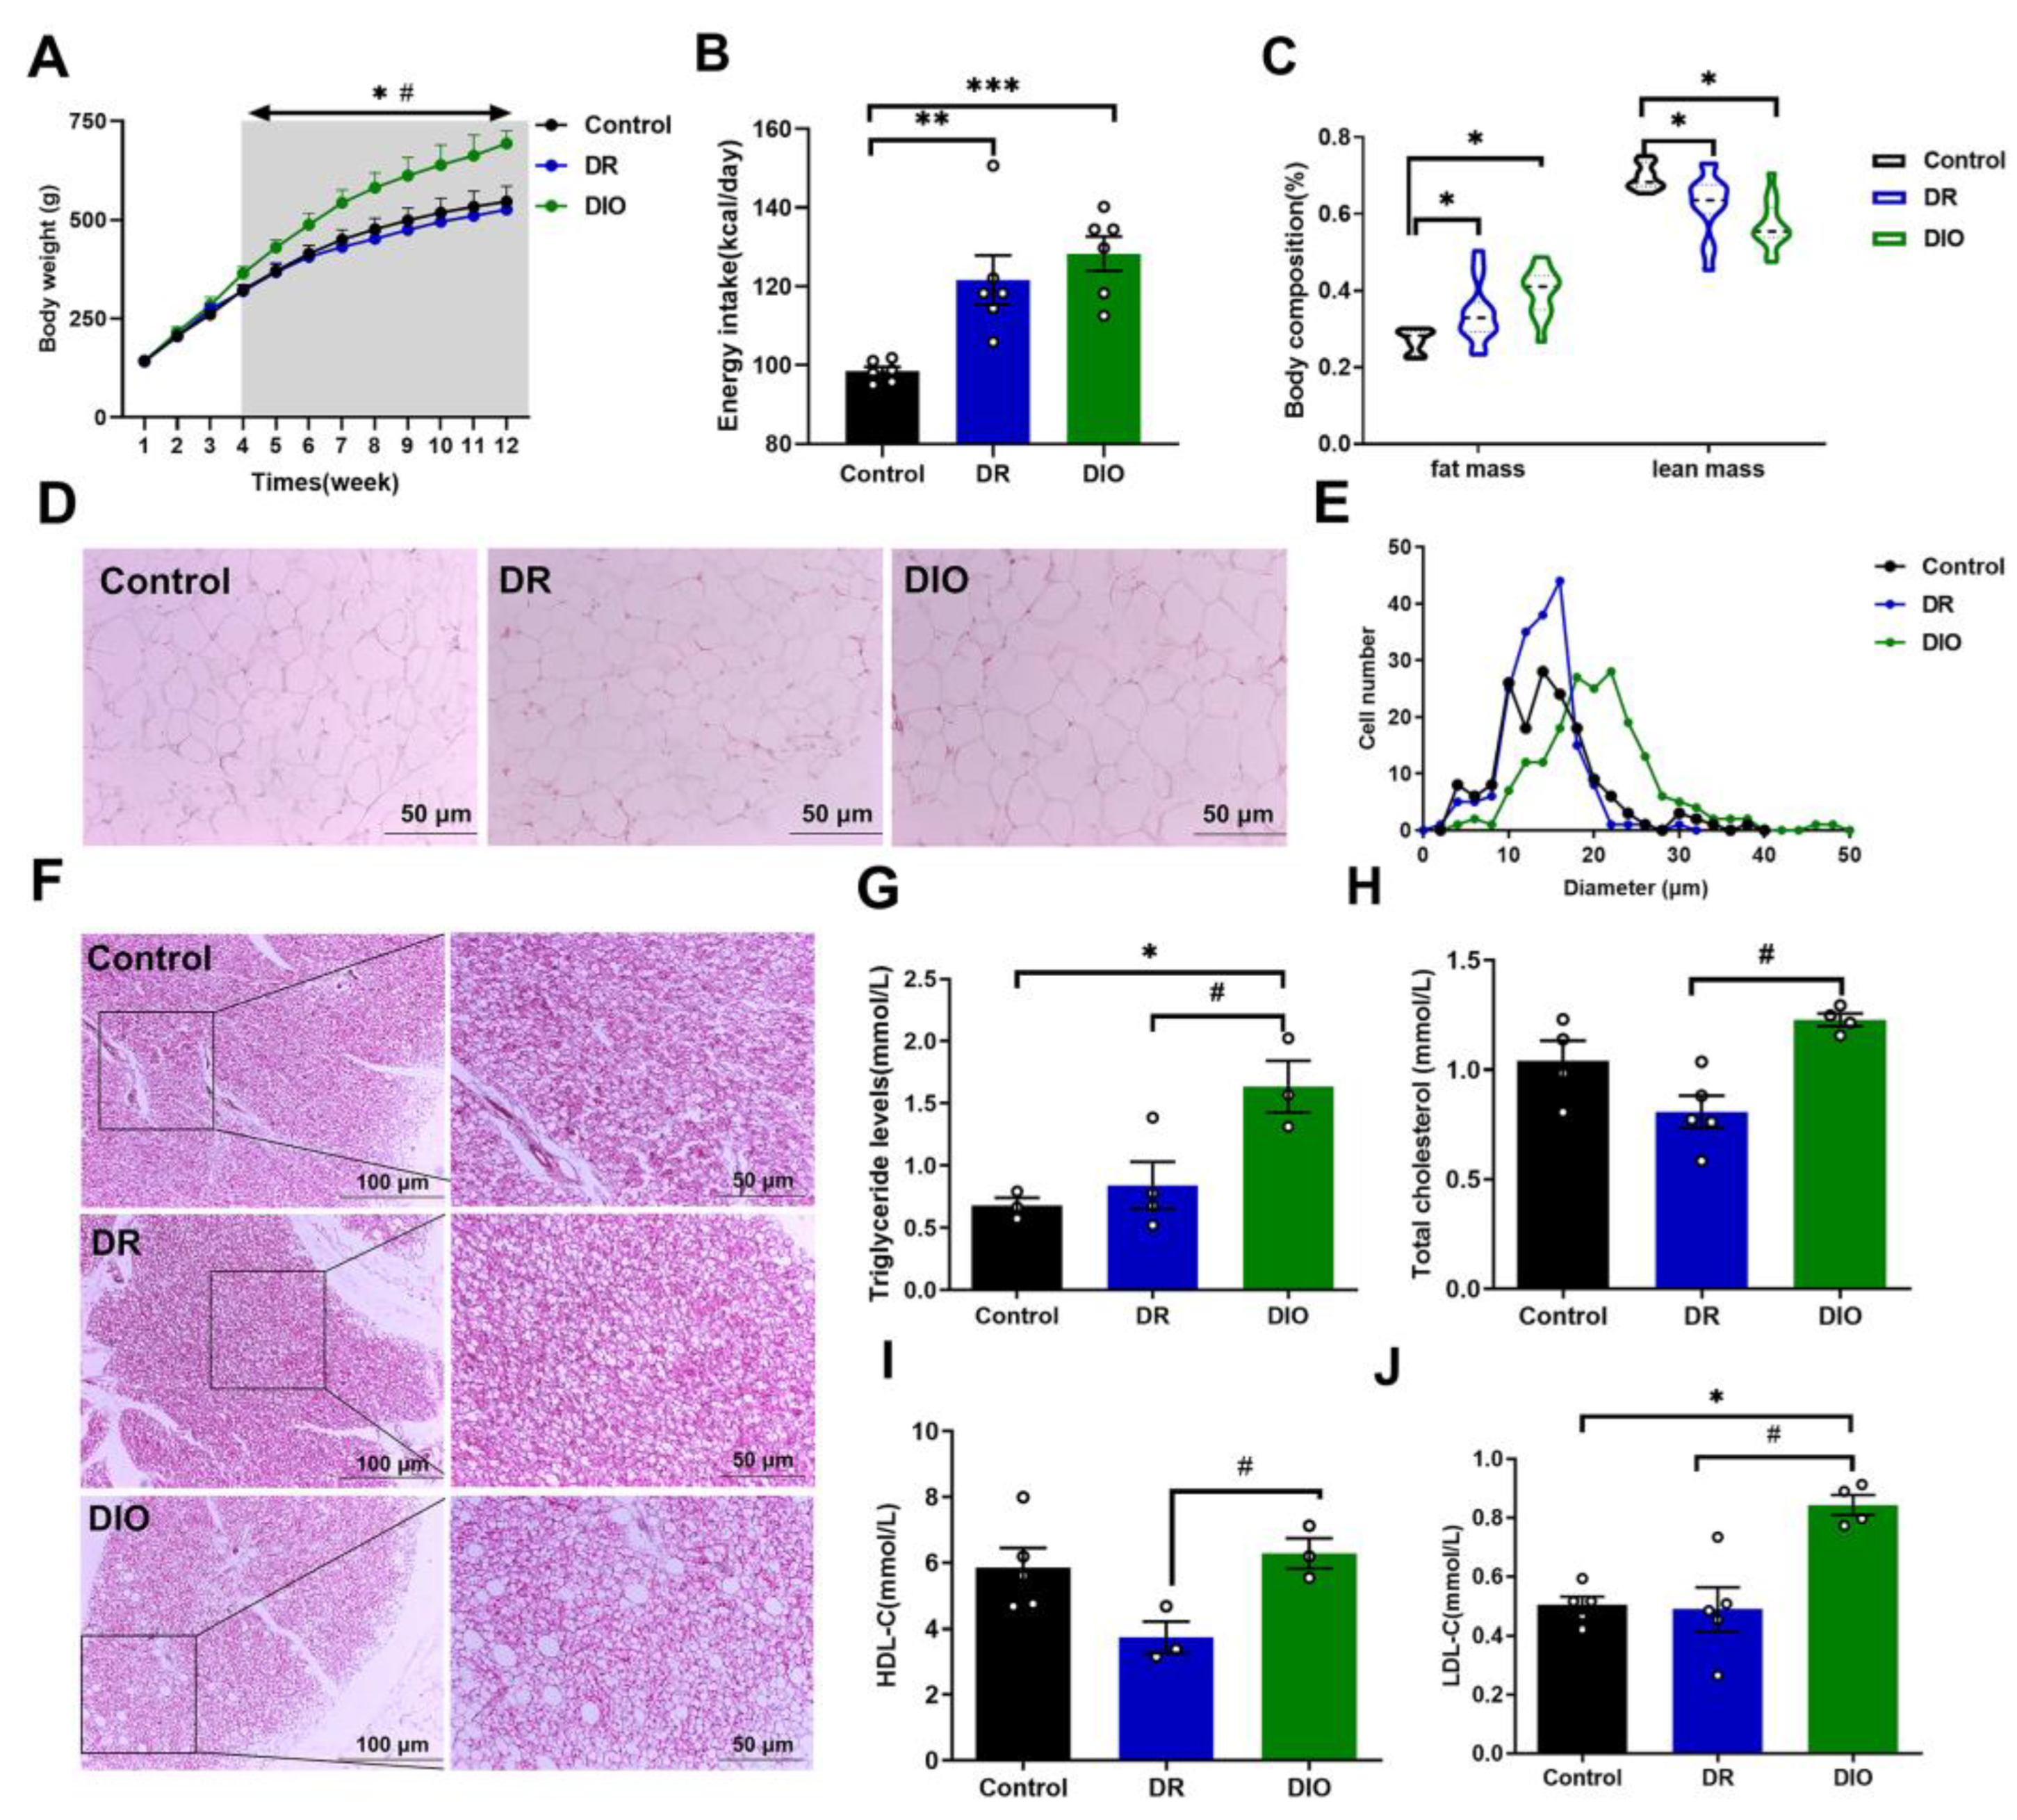
Figure 2.
Differentially expressed proteins (DEPs) in DR vs. DIO group. (A) Distribution of protein mass and coverage. (B) Statistical analysis of mass spectrometry data results. (C) A heatmap of DEPs in the hypothalamus of DR and DIO rats. Protein expression changes were fold change >1.2 or <1.2 and P<0.05. Up- and downregulated proteins are represented as red and blue dots, respectively. Proteins that were not differentially expressed are presented as gray dots. (D) Volcano diagrams of DEPs. The abscissa represented the difference in proteins folds difference (Log 2), the vertical axis represented P value (-log10).
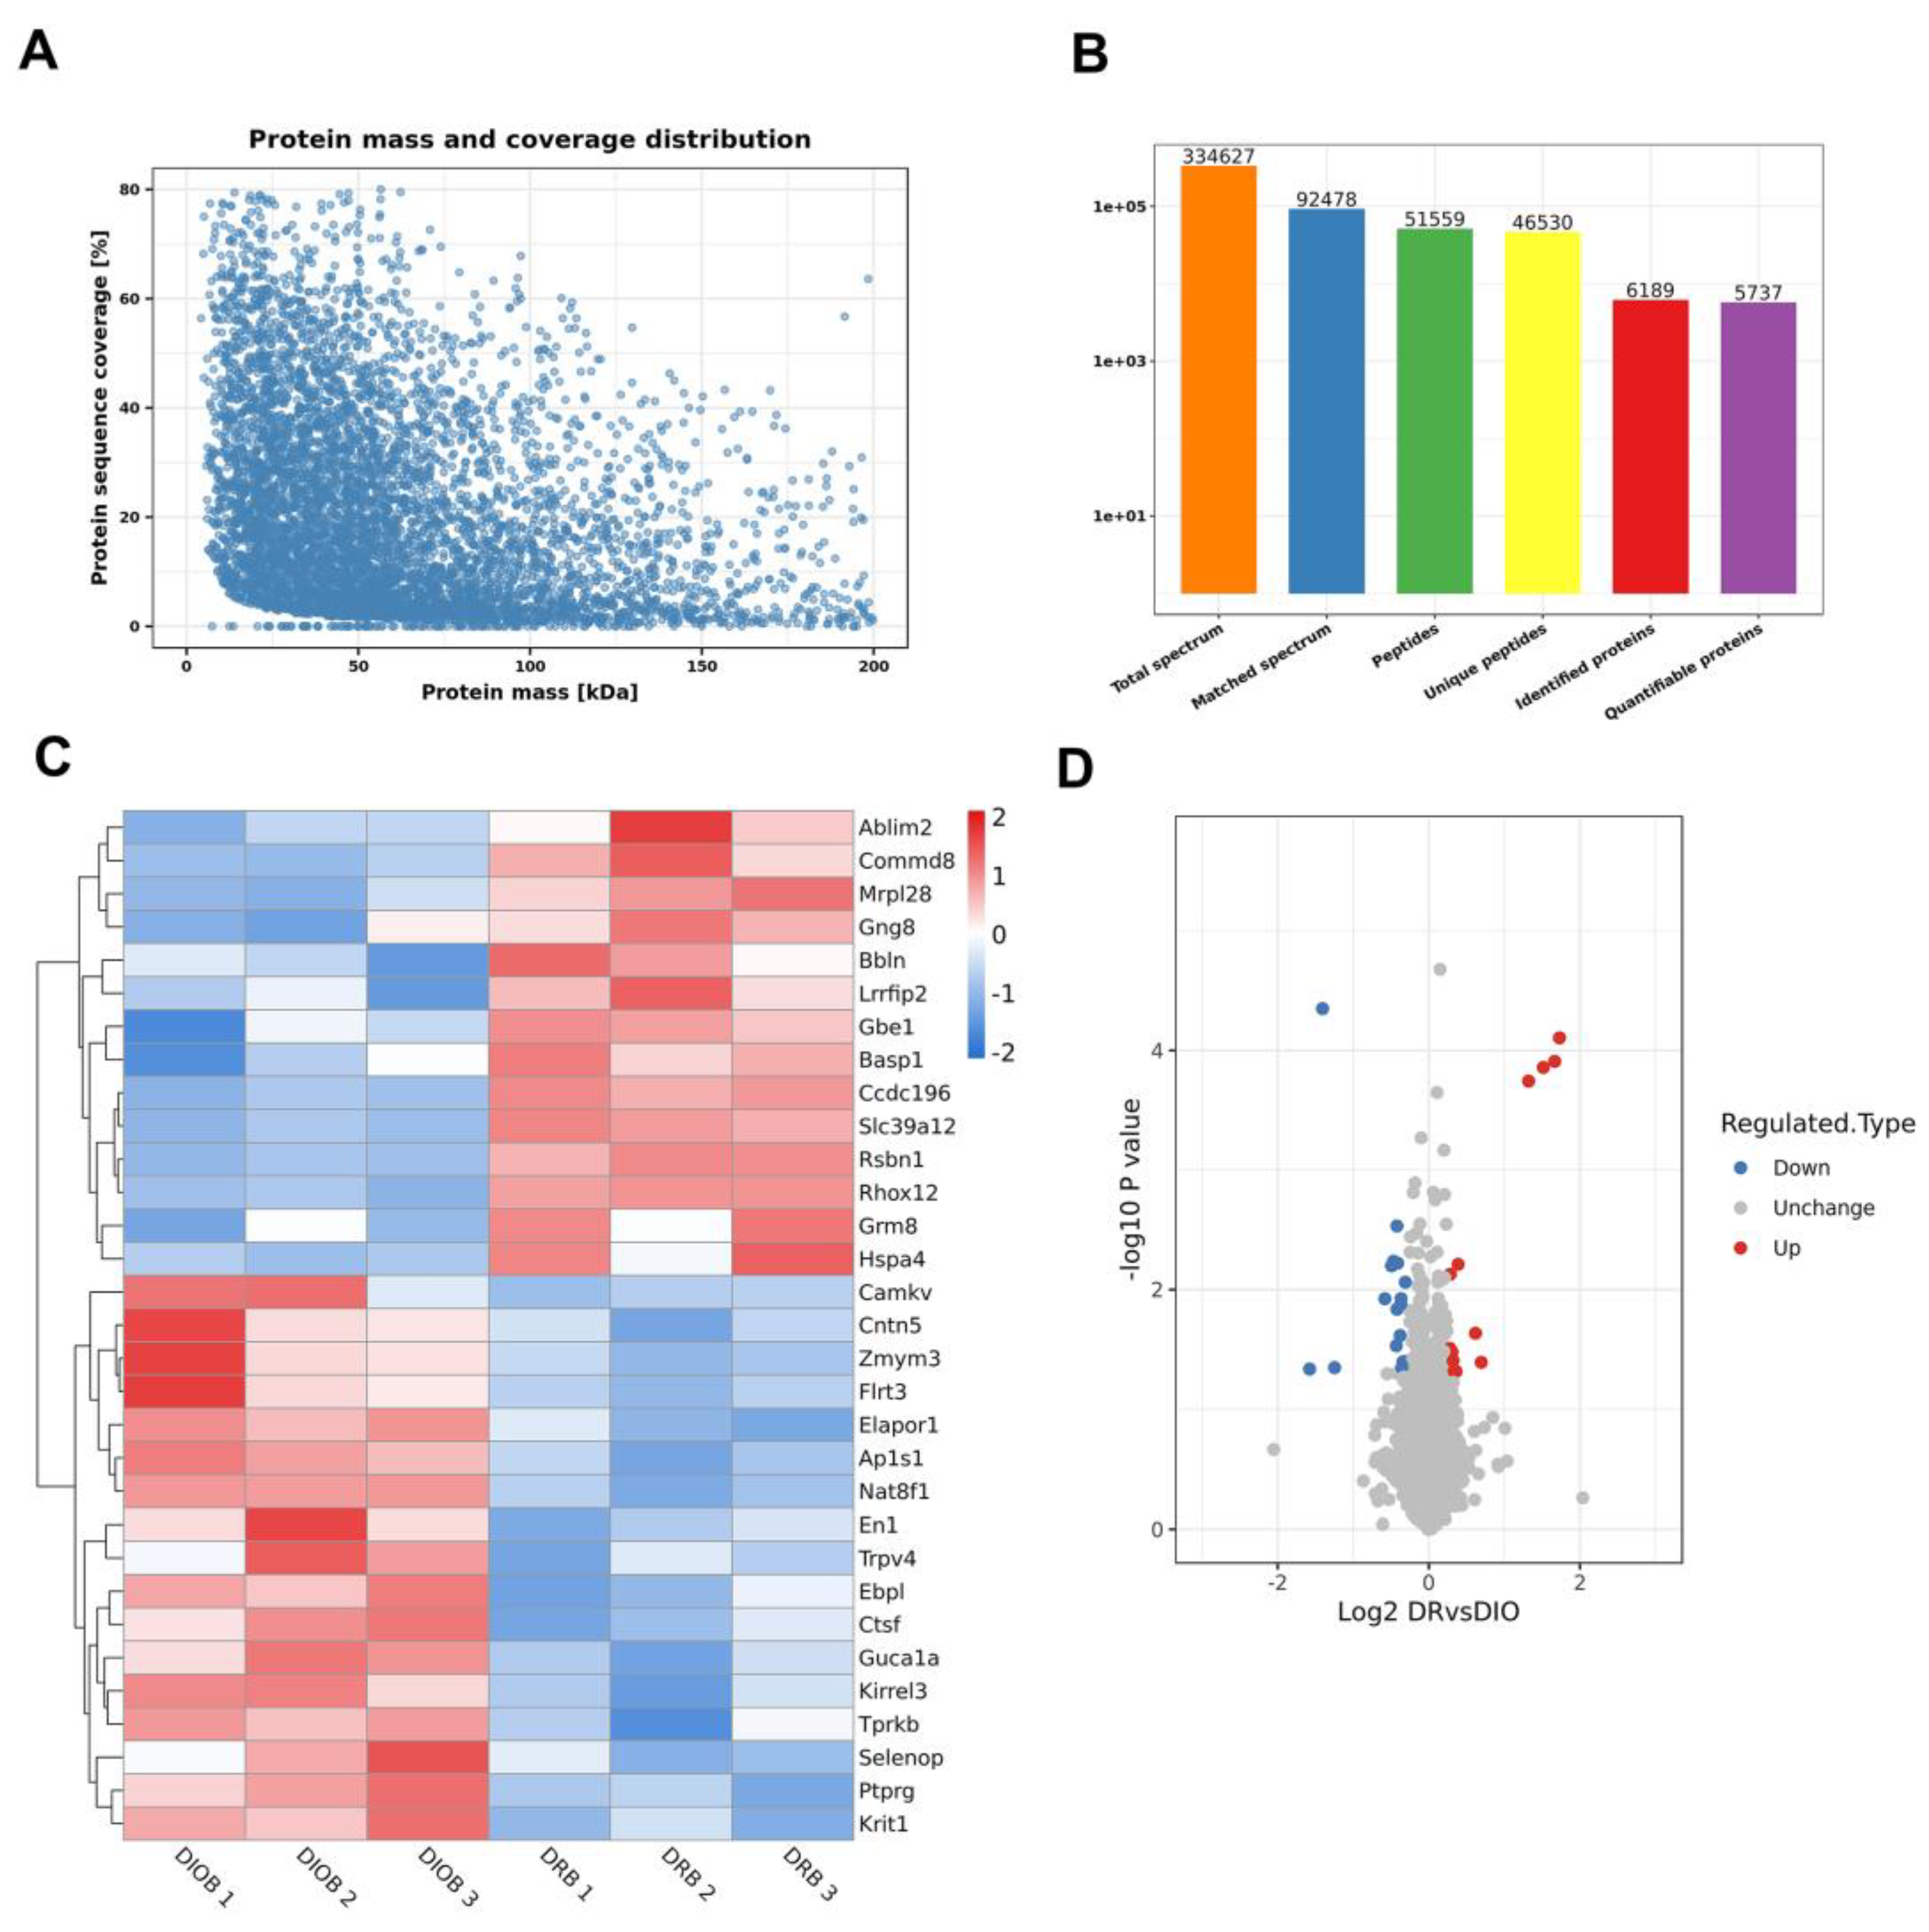
Figure 3.
GO enrichment analysis in DR vs. DIO group. The graph showed enrichment results in the three categories: biological process, cellular component and molecular function. (A, C and E) Upregulated proteins in DR vs. DIO rats were conducted. (B, D and F) Downregulated proteins were analysis by GO enrichment.
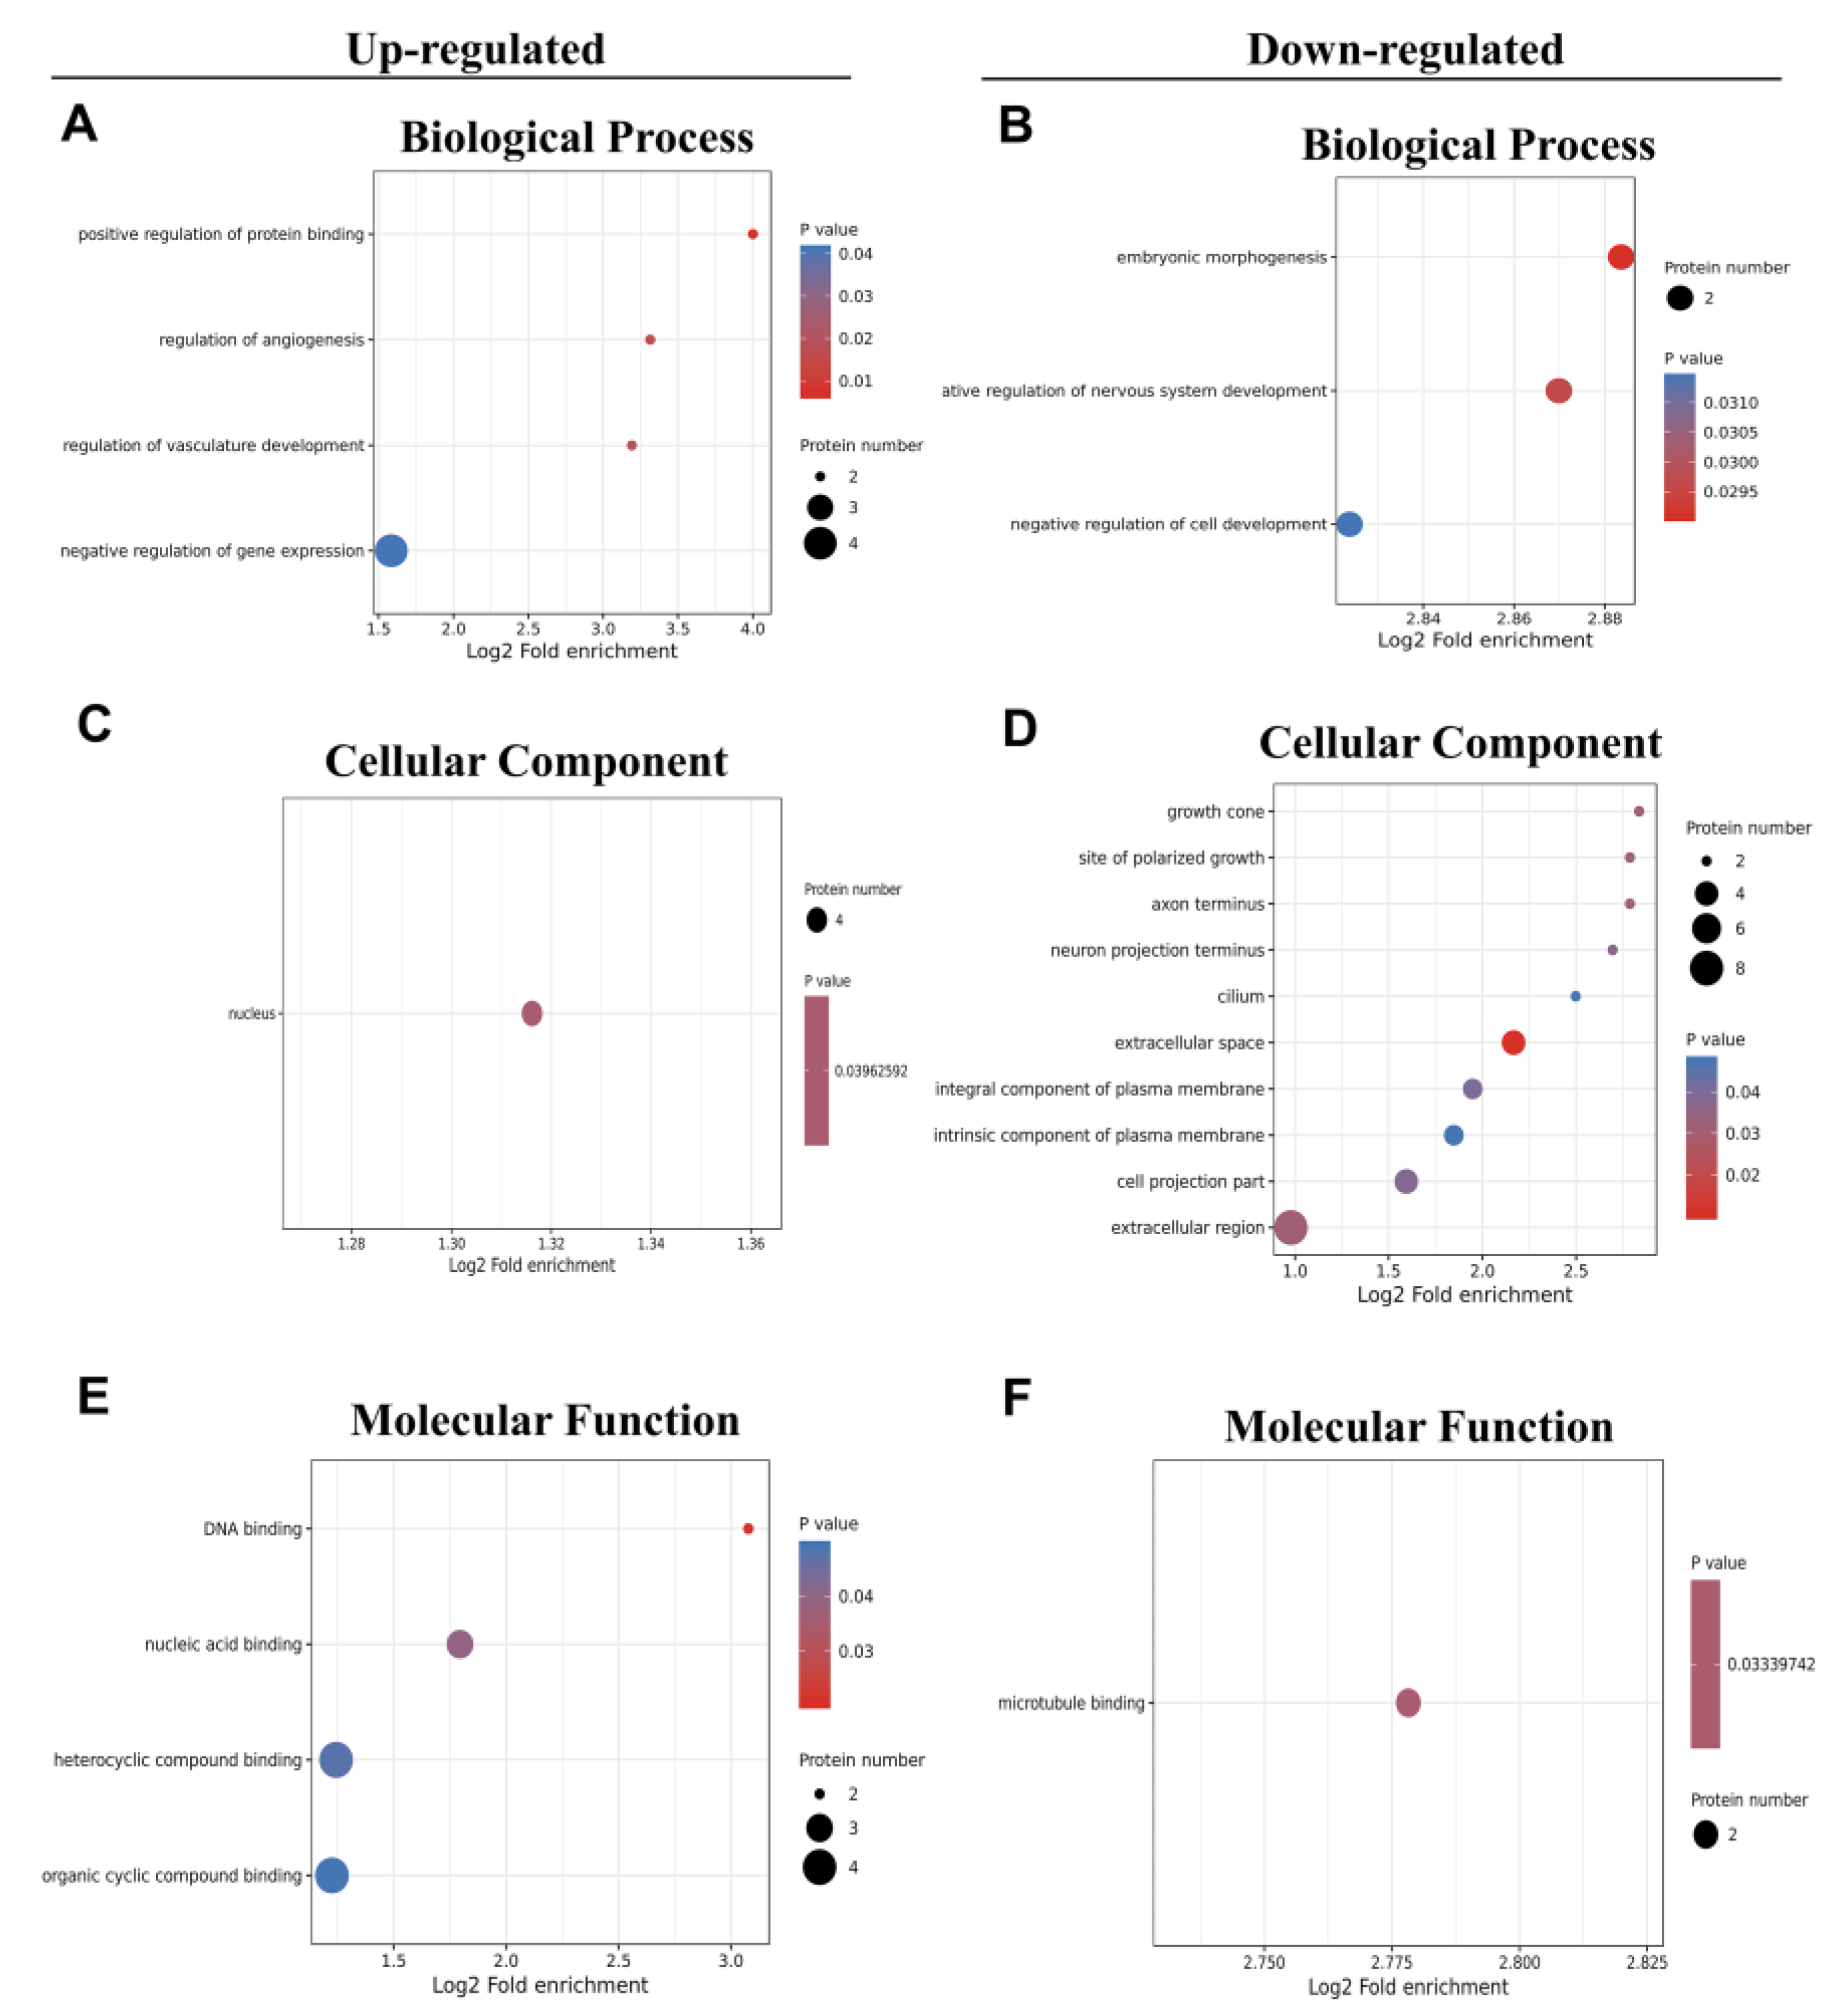
Figure 4.
(A-C) Directed acyclic map of GO enrichment of up-regulated proteins in hypothalamus of DR rats. (D) Directed acyclic map of GO enrichment of down-regulated proteins in hypothalamus of DR rats. (E) Enrichment of upregulated proteins in KEGG pathway.
Figure 4.
(A-C) Directed acyclic map of GO enrichment of up-regulated proteins in hypothalamus of DR rats. (D) Directed acyclic map of GO enrichment of down-regulated proteins in hypothalamus of DR rats. (E) Enrichment of upregulated proteins in KEGG pathway.
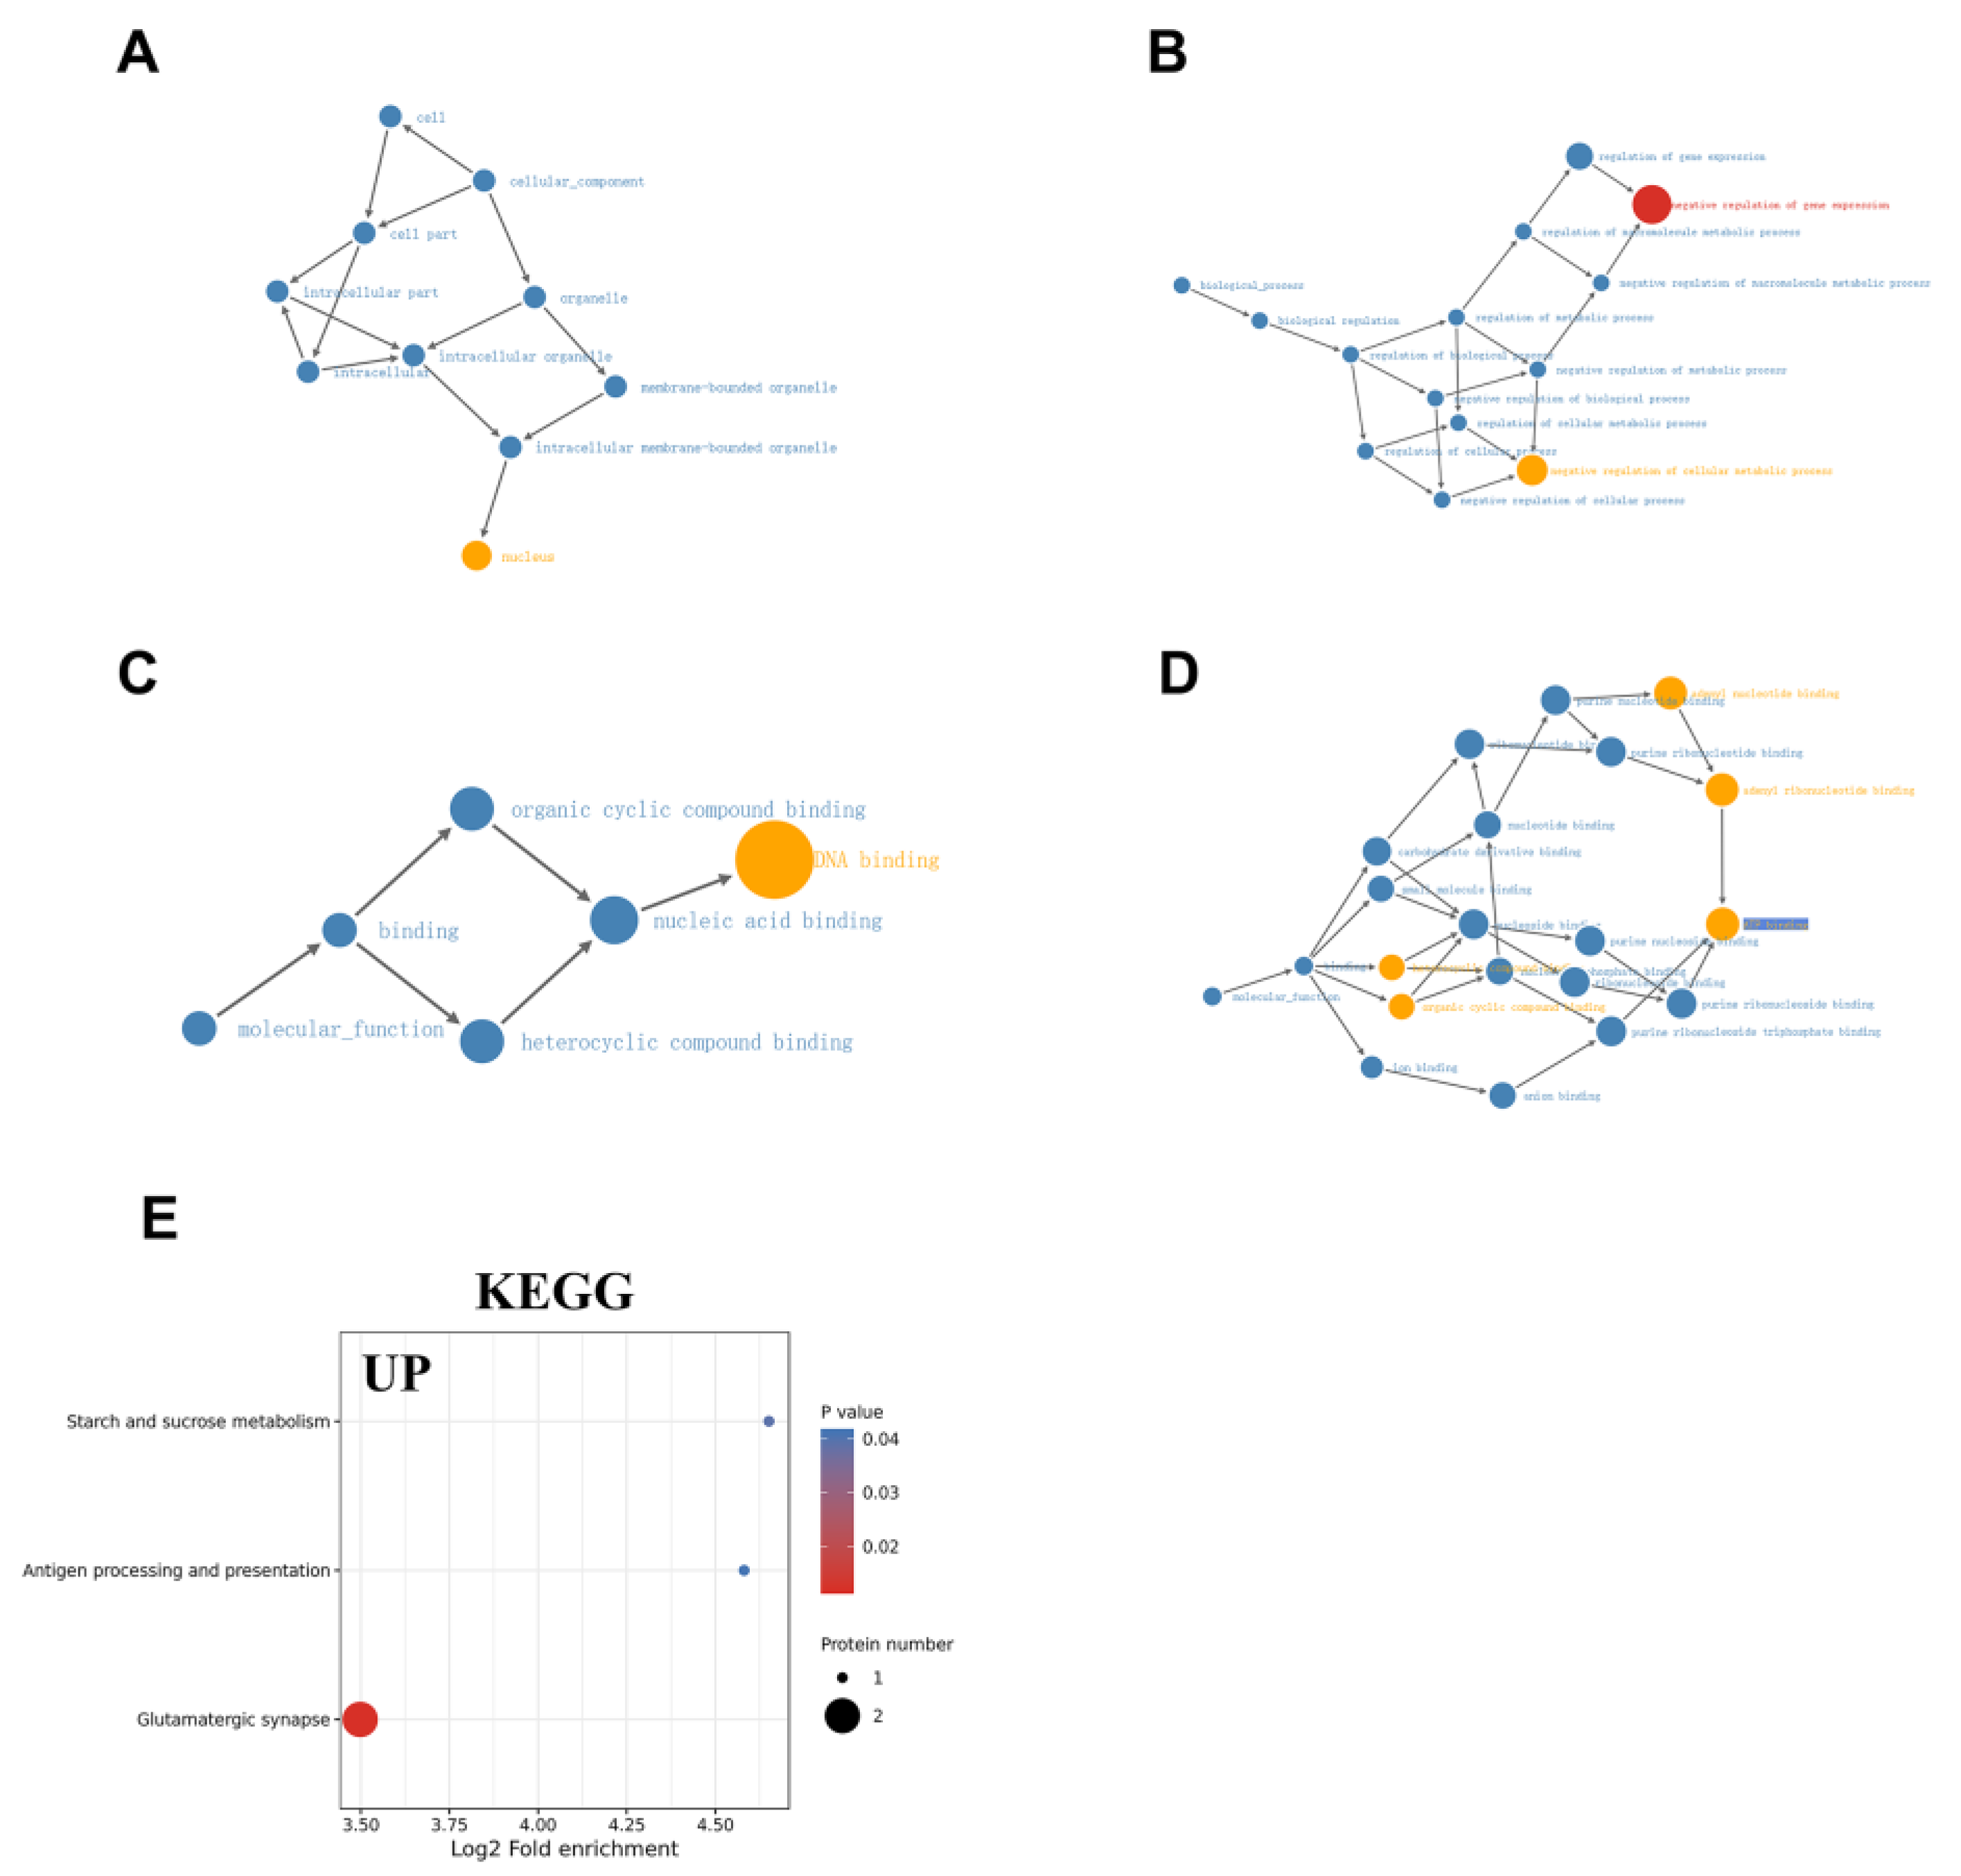
Figure 5.
(A) The expression levels of upregulated proteins were assessed using western blotting, (n=6/group). (B) Densitometric analysis quantified the expression levels of proteins. *P < 0.05 vs. Control group; #P < 0.05 DR vs. DIO group. Table 4: list of differentially upregulation proteins (fold changes exceed 1.5 times and P value 0.05) from DR vs. DIO group.
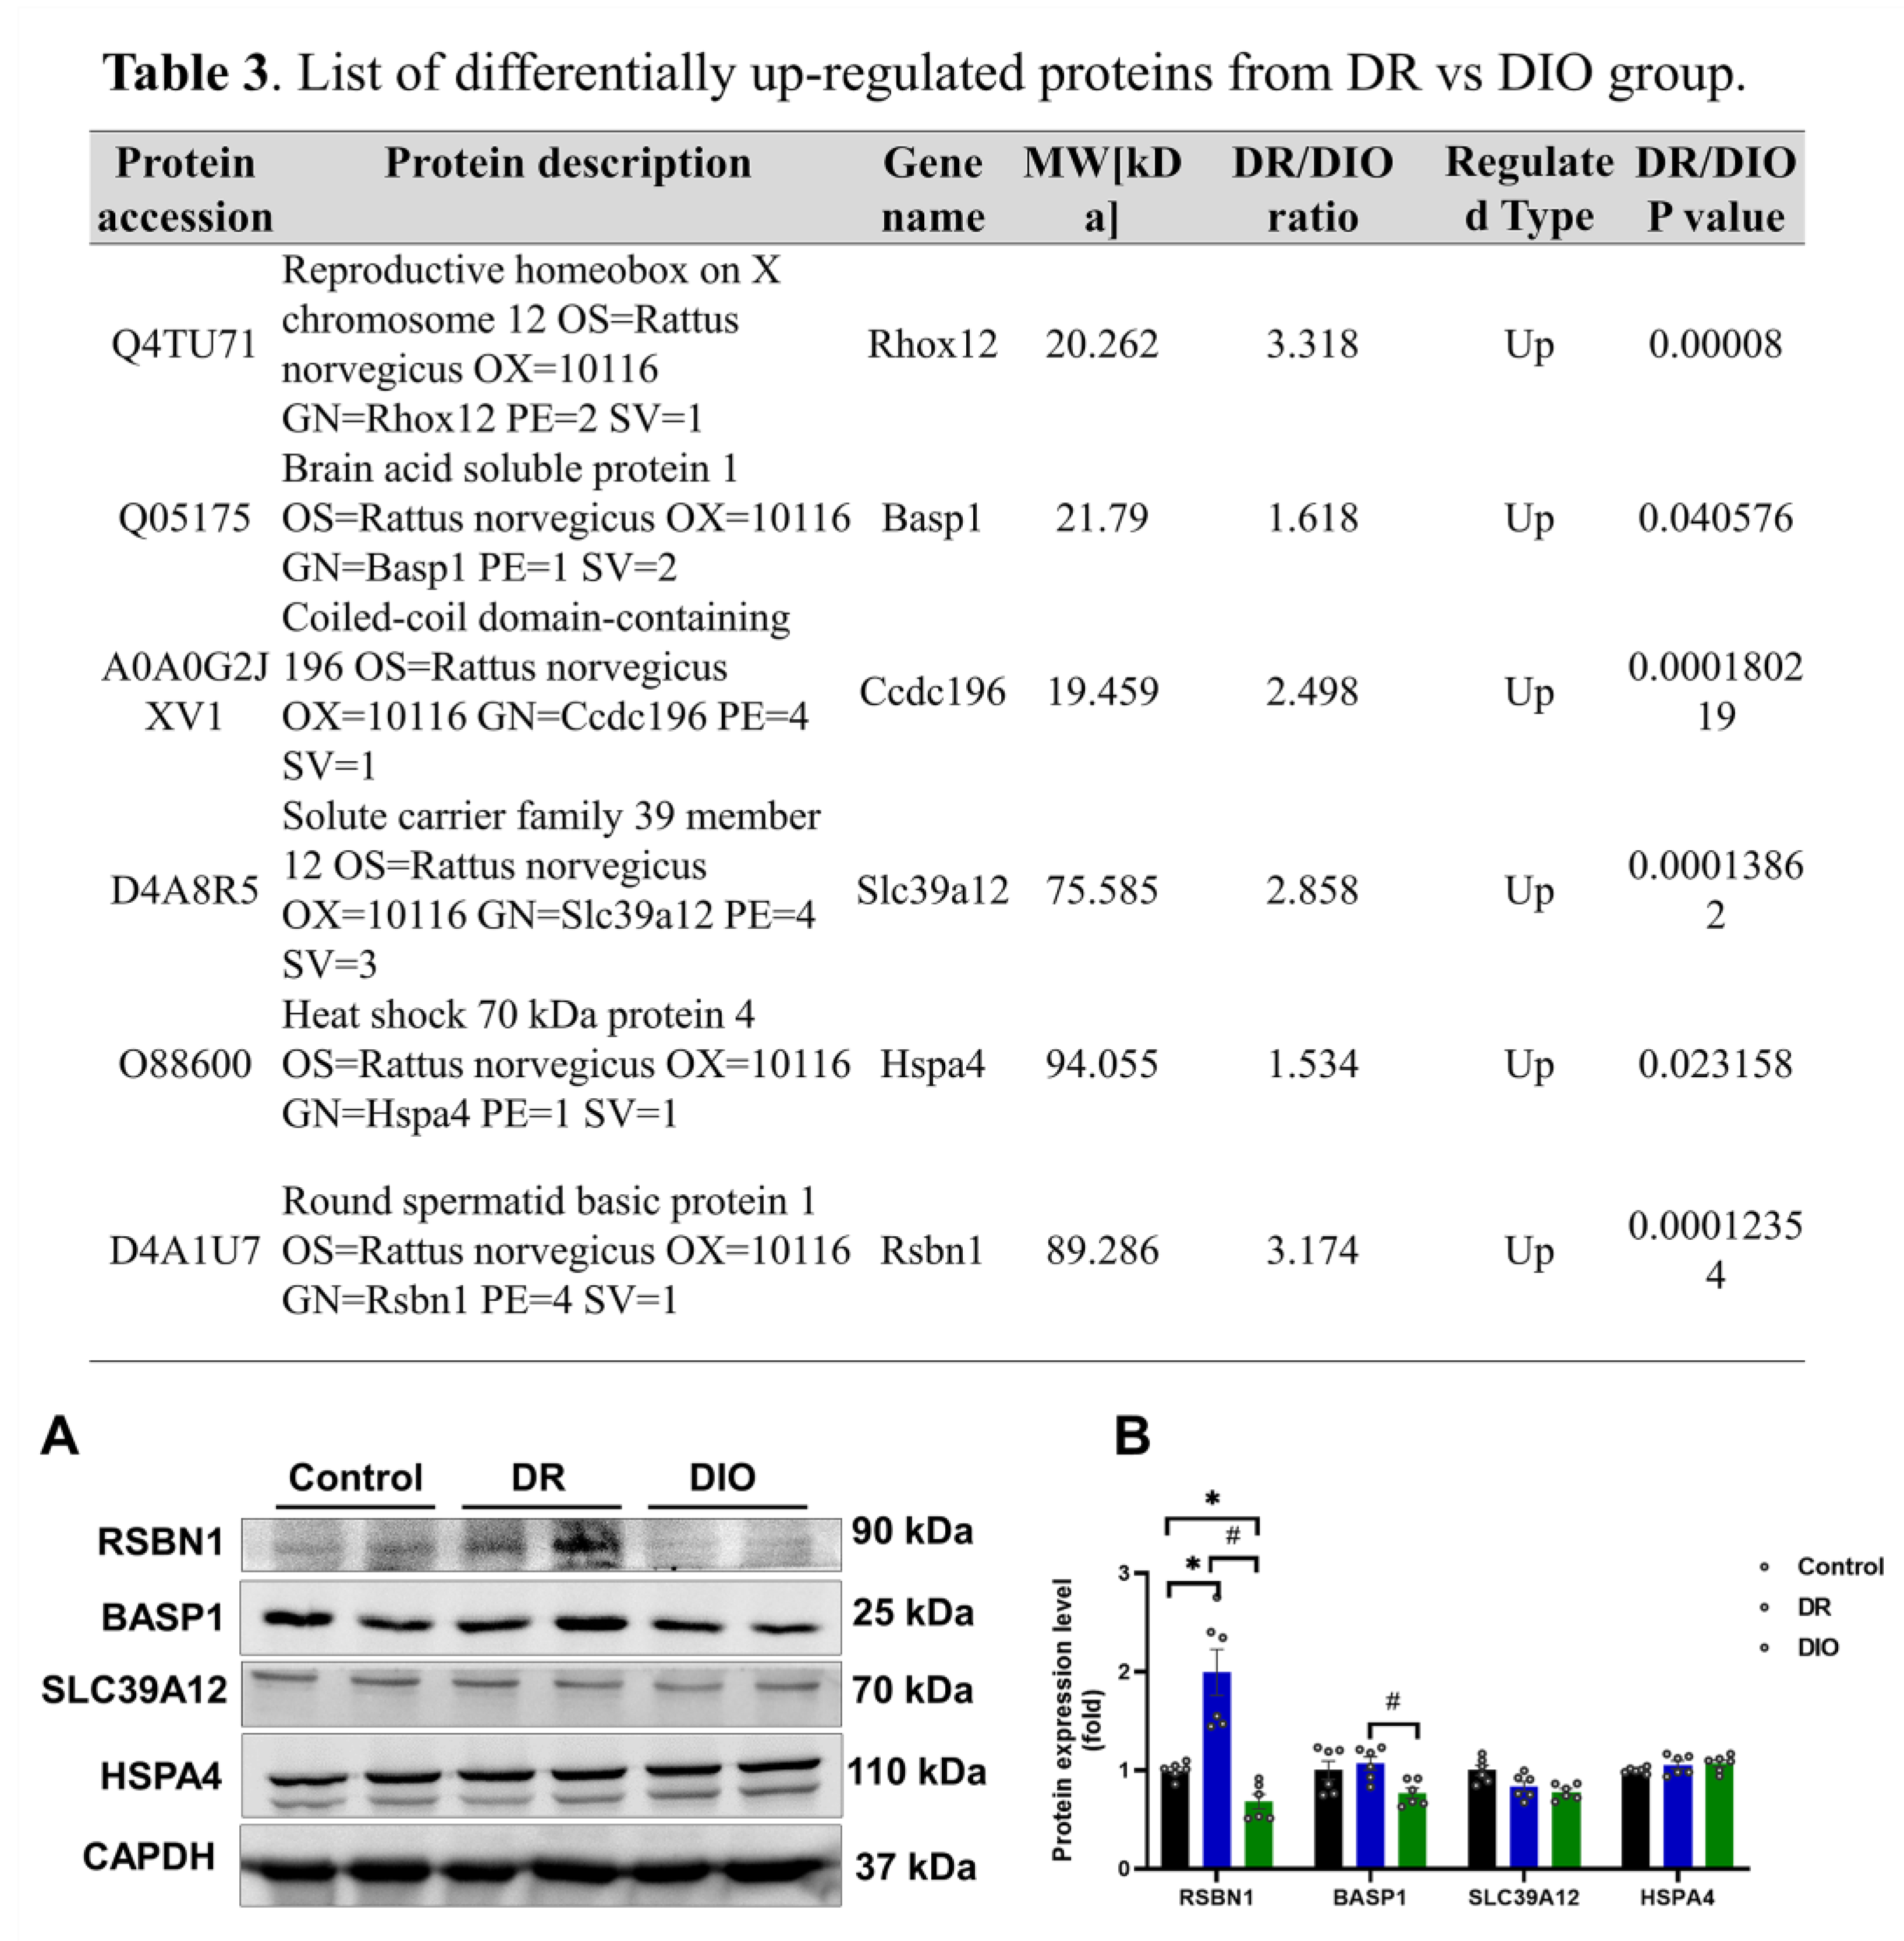
Figure 6.
(A) The expression levels of downregulated proteins TRPV4 and CaMKV were assessed by western blotting, (n=6/group). (B) Densitometric analysis quantified the expression levels of TRPV4 and CaMKV proteins. *P < 0.05 vs. Control group;#P < 0.05 DR vs. DIO group.
Figure 6.
(A) The expression levels of downregulated proteins TRPV4 and CaMKV were assessed by western blotting, (n=6/group). (B) Densitometric analysis quantified the expression levels of TRPV4 and CaMKV proteins. *P < 0.05 vs. Control group;#P < 0.05 DR vs. DIO group.
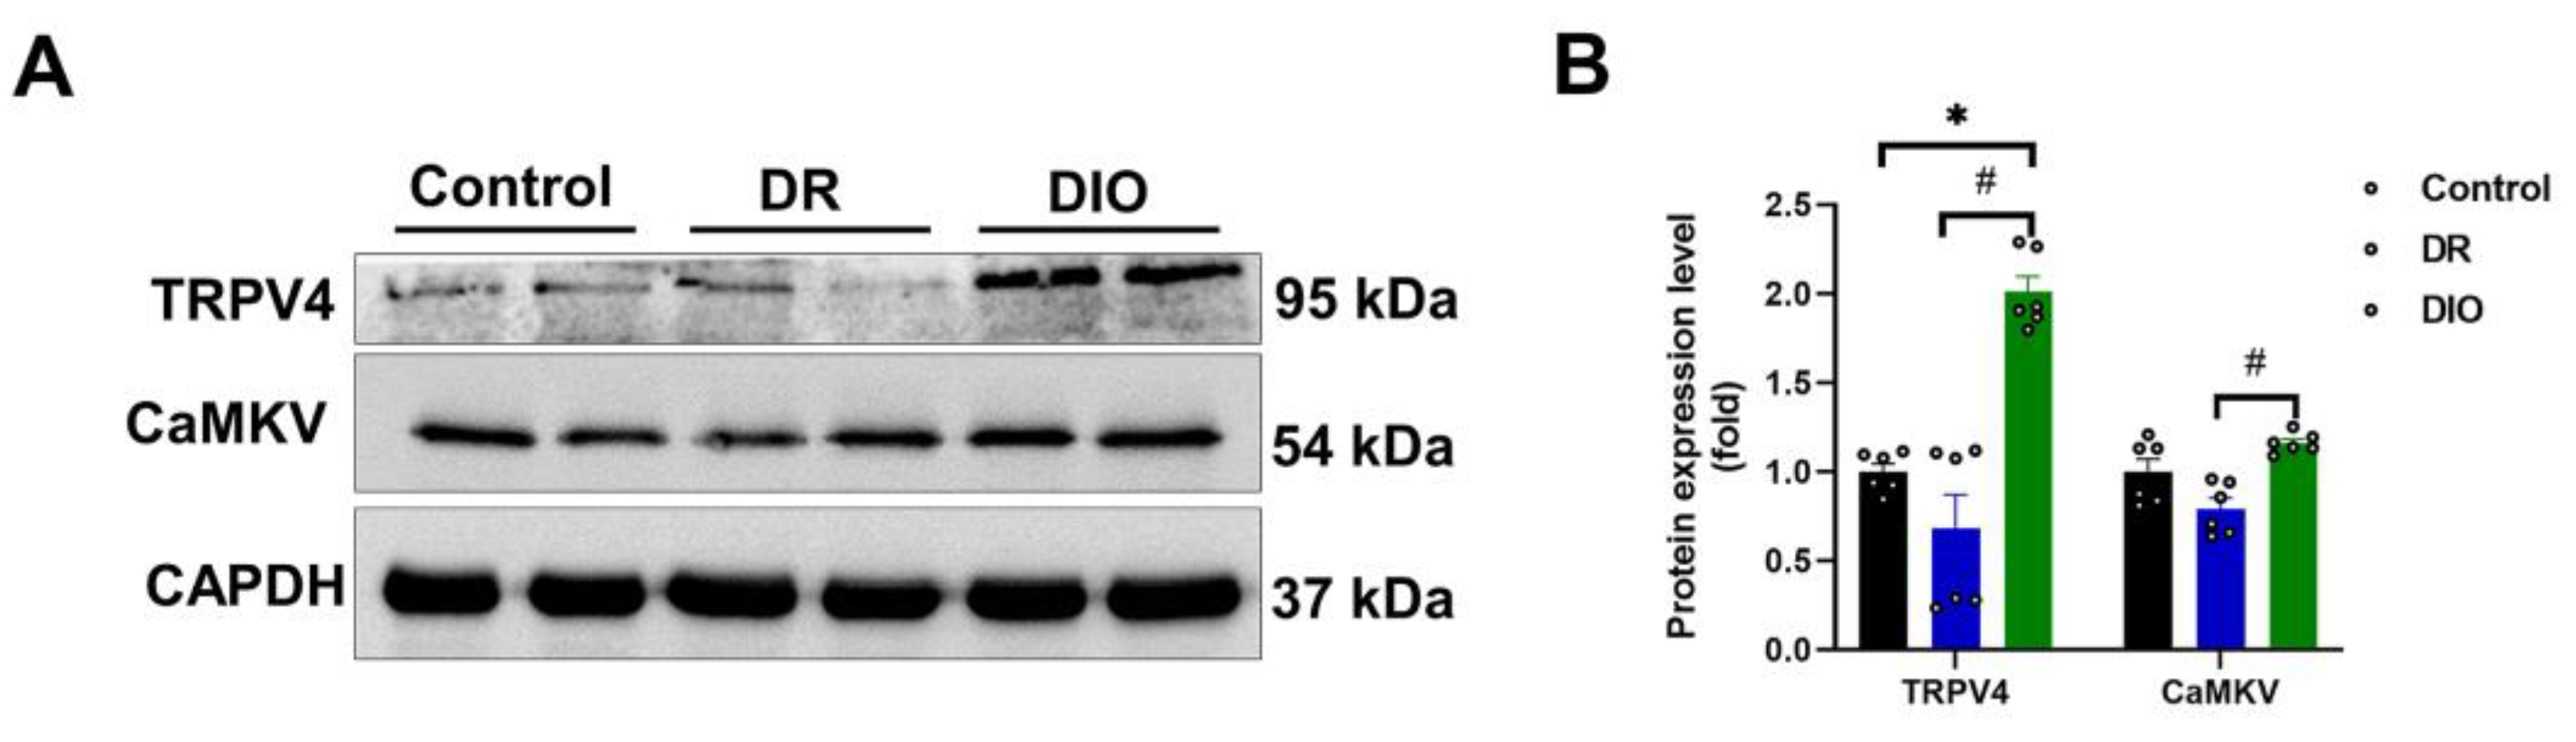

Table 1.
The increased differentially expressed proteins in DR group.
| Increased proteins | Gene name | Accession | Fold increase | P value |
|---|---|---|---|---|
| Reproductive homeobox on X chromosome 12 | Rhox12 | A6JMJ3 | 3.318 | 7.8339E-05 |
| Lysine-specific demethylase 9 | Rsbn1 | D4A1U7 | 3.174 | 0.00012354 |
| Solute carrier family 39-member 12 | Slc39a12 | D4A8R5 | 2.858 | 0.00013862 |
| Coiled-coil domain-containing 196 | Ccdc196 | D4A4F0 | 2.498 | 0.00018022 |
| Brain acid soluble protein 1 | Basp1 | Q05175 | 1.618 | 0.040576 |
| Heat shock 70 kDa protein 4 | Hspa4 | O88600 | 1.534 | 0.023158 |
| Mitochondrial ribosomal protein L28 | Mrp128 | D3ZJY1 | 1.308 | 0.0061432 |
| Actin-binding LIM protein 2 | Ablim2 | A0A0G2JXC7 | 1.284 | 0.048341 |
| Metabotropic glutamate receptor 8 | Grm8 | M0RBY2 | 1.264 | 0.048403 |
| Guanine nucleotide-binding protein G | Gng8 | P63077 | 1.259 | 0.048143 |
| Bublin coiled coil protein | Bbln | D3ZBT2 | 1.249 | 0.039317 |
| Leucine-rich repeat flightless-interacting protein 2 | Lrrfip2 | Q4V7E8 | 1.238 | 0.033423 |
| COMM domain containing 8 | Commd8 | B0K015 | 1.217 | 0.0074358 |
| Glucan (1,4-alpha-), branching enzyme 1 (Fragment) | Gbel | A0A096MJY6 | 1.213 | 0.031024 |
Table 2.
The decreased differentially expressed proteins in DR group.
| Decreased proteins | Gene name | Accession | Fold increase | P value |
|---|---|---|---|---|
| CaM kinase-like vesicle-associated protein | Camkv | A0A0G2K1R5 | 0.335 | 0.04622 |
| Transient receptor potential cation channel subfamily V member 4 | Trpv4 | Q9ERZ8 | 0.421 | 0.044919 |
| Kirre-like nephrin family adhesion molecule 3 | Kirrel3 | A0A0G2K5L4 | 0.668 | 0.0119211 |
| KRIT1, ankyrin repeat-containing | Krit1 | G3V8Z6 | 0.71 | 0.0063187 |
| Endosome-lysosome associated apoptosis and autophagy regulator 1 | Elapor1 | F1MAB2 | 0.723 | 0.0057844 |
| Zinc finger MYM-type-containing 3 (Fragment) | Zmym3 | A0A096MK81 | 0.742 | 0.029479 |
| Cathepsin F | Ctsf | Q499S6 | 0.746 | 0.0145954 |
| AP complex subunit sigma | Ap1s1 | B5DFI3 | 0.746 | 0.0029365 |
| Protein tyrosine phosphatase, receptor type, G | Ptprg | A0A0G2K561 | 0.751 | 0.0060037 |
| EKC/KEOPS complex subunit Tprkb | Tprkb | Q5PQR8 | 0.769 | 0.024203 |
| EBP-like OS=Rattus norvegicus | Ebpl | D3ZXC8 | 0.774 | 0.0131801 |
| Guanylate cyclase activator 1A | Guca1a | D3ZII9 | 0.775 | 0.0118963 |
| Selenoprotein P | Selenop | P25236 | 0.78 | 0.044981 |
| Homeobox protein engrailed-like | En1 | A0A0G2JT82 | 0.788 | 0.040136 |
| Contactin-5 | Cntn5 | F1M173 | 0.79 | 0.048221 |
| N-acetyltransferase 8 (GCN5-related) family member 1 | Nat8f1 | V9GZ80 | 0.806 | 0.0086754 |
| Leucine-rich repeat transmembrane protein FLRT3 | Flrt3 | B1H234 | 0.812 | 0.039741 |
Disclaimer/Publisher’s Note: The statements, opinions and data contained in all publications are solely those of the individual author(s) and contributor(s) and not of MDPI and/or the editor(s). MDPI and/or the editor(s) disclaim responsibility for any injury to people or property resulting from any ideas, methods, instructions or products referred to in the content. |
© 2025 by the authors. Licensee MDPI, Basel, Switzerland. This article is an open access article distributed under the terms and conditions of the Creative Commons Attribution (CC BY) license (http://creativecommons.org/licenses/by/4.0/).
Copyright: This open access article is published under a Creative Commons CC BY 4.0 license, which permit the free download, distribution, and reuse, provided that the author and preprint are cited in any reuse.


