
Submitted:
21 August 2025
Posted:
21 August 2025
You are already at the latest version
Abstract
Low power consumption is critical for wireless communication, particularly for the Internet of Things (IoT) applications. Addressing these energy conservation requirements, 5G-Advanced (5G-A) introduces the Reduced Capability (RedCap) concept, incorporating techniques such as Discontinuous Reception (DRX), Extended DRX (eDRX), Wake-up Signal (WUS), and Wake-up Receiver (WUR). Nevertheless, scope for further optimization remains. Focusing on improving energy efficiency for 5G-A and 6G, in this study we propose a simultaneous wireless information and power transfer (SWIPT) cooperative communication scheme leveraging environment backscattering and wake-up receiver technology, specifically designed to enhance the energy conservation performance of internet of things (IoT) devices and the energy efficiency of communication links, while extending the application scenarios for WUS. By establishing a backscattering system comprising a base station, a sensor equipped with a WUR module, and a receiving terminal, the system harvests both energy and information from ambient sources utilizing SWIPT technology. This approach reduces the sensor's communication power consumption and formulates an energy efficiency optimization problem for the communication link, subject to constraints on base station transmit power and the power splitting ratio. This research ultimately maximizes communication link energy efficiency with WUS participation, satisfying current IoT energy conservation requirements and contributing significantly to the sustainable development of batteryless IoT and future communication networks.
Keywords:
WUS
; SWIPT
; backscattering
; energy efficiency optimization
1. Introduction
The widespread adoption of 5G across diverse industries has spurred extended industrial chains, demanding higher precision and enhanced communication capabilities. Consequently, 5G-Advanced (5G-A) has emerged, targeting approximately tenfold improvements in core network capabilities such as connection rates and latency [1]. A key application scenario for 5G-A is massive Internet of Things (IoT), where wireless sensor networks and ambient backscatter communication play pivotal roles in meeting the stringent low-energy requirements of IoT. Advances in Wake-up Receiver (WUR) technology are crucial for enabling the extensive deployment of large-scale tag type nodes. Such system architectures can operate for years under energy constraints, with limited flexibility and minimal maintenance, potentially relying on ambient energy harvesting instead of conventional batteries. Within each node, the WUR primarily monitors for sporadic Wake-up Signals (WUS), while dedicating non-monitoring periods to energy harvesting or sensor data acquisition. Regardless of the communication architecture or protocol employed, systems inherently experience substantial idle time. As the WUR signals the main receiver, the remainder of the node remains in an idle state, thereby achieving significant energy savings. By integrating a WUR with a sensor tag, the timing of tag data transmission can be controlled by the base station's WUS, activating backscatter communication only when necessary to reduce node energy consumption. This "advance notification" signal triggers subsequent operations only after activating the User Equipment (UE), preventing it from remaining persistently in a high-power state. Its core objective is to extend device battery life by minimizing unnecessary UE monitoring time.
Since 3GPP Release 16 edition, continuous research and standardization efforts have focused on 5G terminal energy-saving techniques. Technologies including the Discontinuous Reception (DRX) mechanism, Paging Early Indication (PEI), and the Connected-state WUS have been incorporated into relevant energy-saving standards [2]. Currently, 5G predominantly utilizes the DRX mechanism to reduce UE energy consumption. Operating in distinct communication modes, DRX comprises Connected DRX (CDRX) for connected devices to reduce energy consumption during active periods [3], and Idle/Inactive DRX (IDRX) for idle or inactive states. WUS is specifically introduced as an indicator signal for UEs in Radio Resource Control (RRC) connected or inactive states. The recently proposed lightweight 5G aims to extend 5G capabilities to mid-to-low-speed IoT scenarios by reducing terminal costs [4]. Consequently, WUS presents greater potential for providing adaptable energy-saving strategies across diverse terminal types, flexibly accommodating varied service requirements. Research on WUS not only enhances terminal energy efficiency and optimizes signal transmission strategies but also advances the vision of ubiquitous connectivity. It fundamentally redefines the interaction logic between terminals and the communication network based on an "on-demand communication" paradigm, establishing a robust foundation for massive low-power device access to 5G-A networks.
Regarding WUS application scenarios, terminals typically operating in CDRX states detect the presence of a WUS transmitted by the base station before each DRX cycle. A detected WUS activates the radio frequency module to monitor subsequent data [5]. Beyond extending battery life, WUS supports large-scale IoT deployments, particularly in dense multi-sensor environments. Frequent terminal wake-ups in such scenarios could otherwise lead to network congestion and resource wastage. Estimates indicate energy savings gains of 30% to 50% across different services after WUS implementation. The WUR, responsible for continuously monitoring for WUS in the absence of communication demands, allows the terminal's main receiver to remain in idle mode. Given its simple hardware design and microwatt-level power consumption, the WUR is ideally suited for integration into relevant communication devices. WUS application remains limited to specific energy-saving scenarios. Significant variations exist in the latency and power consumption sensitivity across different services, and numerous scenarios still lack tailored energy-saving signaling solutions. Therefore, further exploration of WUS application scenarios is imperative, necessitating the design of service-specific energy-saving strategies. This paper extends the application scope of WUS within batteryless IoT contexts. We propose integrating WUS into environments characterized by massive tag reflection, aiming to minimize communication node power consumption while maximizing the energy efficiency of the communication process. This approach addresses the limitations inherent in traditional WUS deployment scenarios.
The proliferation of IoT and Reduced Capability (RedCap) devices, coupled with challenges in high-frequency band coverage, has positioned energy-saving signals—particularly the WUS—as a focal research area due to their lightweight and simplified characteristics. Research on WUS has evolved from initial applications in early Narrowband IoT (NB-IoT) to dynamic adaptation with Power Saving Mode (PSM) and Extended Discontinuous Reception (eDRX), marking a transition from proof-of-concept to commercial deployment. In 2019, Wang Runzhang et al. investigated precise single-target tracking in underwater wireless sensor networks [6]. Utilizing a distributed architecture for target state estimation, they proposed a WUS-based algorithm to enhance sensor node energy efficiency. An interactive multiple model filter was integrated into the distributed architecture, combining different motion models and calculating their probabilities to address target mobility. Simulation results demonstrated high estimation accuracy and energy efficiency. In 2020, Nafiseh Mazloum’s team explored integrating WURs into Orthogonal Frequency Division Multiplexing (OFDM) systems [7]. To prevent interference with co-channel transmissions, WUS transmission was designed to comply with OFDM principles. By modifying the OFDM transmitter to emit WUS on a subset of carriers while preserving orthogonality, the scheme’s feasibility for ultra-low-power operation was validated across diverse system parameters and channel conditions. In 2021, B. G. Padmageetha et al. conducted a comparative survey of cross-layer protocols based on WURs [8], synthesizing their design attributes. In wireless sensor networks, WUR-based cross-layer designs emerged as the most energy-efficient duty-cycling protocols. Broadcasting WUS to trigger idle states in network topologies eliminated idle and overhearing overhead. In 2022, Pan Xueming et al. examined energy-efficient solutions for low-power, compact terminals in wearable and IoT applications [9]. Their analysis identified gaps between existing energy-saving techniques and IoT terminal power requirements, specifically investigating application scenarios for WUR and WUS technologies. In 2024, Qualcomm Technologies proposed a UE location-based WUS resource selection scheme for non-terrestrial networks [10]. Satellites dynamically allocate WUS monitoring resources according to UE geographic regions, reducing signal collision and interference in wide-area coverage. Simulations indicated a 25% energy savings gain in low-density deployment scenarios. This approach achieves intelligent spatial matching of WUS resources within integrated space-air-ground networks.
In summary, the burgeoning development of 5G-Advanced and IoT has amplified the significance of WUS-related research, revealing substantial potential for advancement. Continued technological innovation and expanding application scenarios are poised to drive further optimization and widespread adoption of wake-up technologies. This progress will contribute significantly to building more efficient and energy-conscious communication frameworks for IoT devices, facilitating sustainable industry evolution.
This study aims to explore novel application scenarios that enhance link energy efficiency while reducing power consumption at IoT relay nodes. Leveraging simultaneous wireless information and power transfer (SWIPT) and backscatter communication technologies [11,12,13], we construct an energy efficiency optimization framework with transmission tags serving as Wake-up Receiver (WUR) carriers. Our approach addresses energy conservation requirements across terminal devices, communication links, and network nodes to ensure practical applicability of the WUS optimization scheme. The principal innovations are as follows:
(1) SWIPT-WUS Synergy for Passive IoT: Addressing the demand for batteryless operation and ultra-low power consumption in massive IoT deployments, we integrate SWIPT with WUS technology within ambient backscatter systems. This innovation specifically targets energy conservation at sensor nodes and across communication links. The proposed system architecture comprises a base station, sensors equipped with WUR modules functioning as backscatter tags, and receiving terminals. Sensors harvest essential operational energy through SWIPT-enabled backscatter communication.
(2) Adaptive WUS Transmission Protocol: We propose dynamic adjustment of WUS transmission cycles without compromising service latency requirements. Given the minimal duration of short DRX cycles, selectively omitting WUS transmissions in certain periods yields significant power savings with negligible system impact. Our proportional transmission scheme is defined by Numerator and Denominator: Numerator is the number of consecutive DRX cycles activated after WUS reception, while Denominator is the number of consecutive idle cycles maintained without WUS detection. This mechanism enables single WUS transmissions to control multiple operational cycles.
(3) Cross-Layer Energy Efficiency Optimization: While WUR implementation reduces sensor node power consumption, we further optimize full-link energy efficiency through a constrained optimization problem. This formulation considers base station transmission power constraints, SWIPT power splitting ratios, and optimal WUS transmission proportion. The solution simultaneously minimizes tag power consumption and maximizes link energy efficiency. We solve this using an alternating optimization algorithm based on Dinkelbach's fractional programming framework, with comprehensive theoretical derivation, simulation validation, throughput and energy efficiency comparisons across WUS transmission ratios, as well as complexity and convergence analysis.
2. System Model
2.1. Channel Model
Symbiotic backscatter systems represent an emerging wireless communication paradigm that integrates backscatter communication with primary systems through mutualistic cooperation. This symbiotic relationship enhances overall spectral and energy efficiency. Within this framework, backscatter devices operate without dedicated RF sources, instead leveraging signals from the primary system as carriers. Information transmission occurs through modulated reflections of these signals, enabling ultra-low-power operation while sharing spectral resources with the primary communication system.
The channel model, depicted in Figure 1, comprises a source transmitter (S), a relay node (R) functioning as a tag endowed with energy harvesting and reflection capabilities, and a receiver (C). The relay node implements SWIPT via power splitting, simultaneously harvesting energy and reflecting modulated information towards the receiver (C). Consequently, the receiver acquires information from two distinct sources: the direct link carrying the original signal from the source (S), and the backscatter link carrying the reflected signal from the relay node (R). The relationship between the symbol periods of the reflected information signal, denoted with period , and the direct signal, denoted with period , significantly impacts the signal reception characteristics at the receiver. This chapter specifically considers the scenario where =N , with N being a positive integer significantly greater than one (N >> 1). Under this condition, the direct link serves as the primary communication channel, while the backscatter link operates as an auxiliary channel. Leveraging the cooperative nature of this communication scheme, the receiver employs joint decoding techniques to recover both the primary information and the secondary information . This approach effectively mitigates potential interference issues, enabling highly reliable backscatter communication. Importantly, the information conveyed by can facilitate the decoding process of .
The base station transmits with power . The channel coefficient is modeled as a complex Gaussian random variable, with the distance between nodes denoted as All inter-node channels are assumed to be mutually independent and experience Rayleigh flat fading. Under these conditions, the signal received at node R is given by:
where represents the path loss exponent, and denotes additive white Gaussian noise (AWGN) at R with zero mean and variance . The received signal undergoes power splitting controlled by parameter . This process divides the signal power into two components: is allocated for energy harvesting, while is dedicated to information transmission. Considering node R operates with a DRX cycle duration of , during which it transitions between idle and wake states, we define M as the number of cycles (out of total N cycles) where node R is either awakened from idle or maintains an active state. Consequently, the tag participates in both energy harvesting and information transmission for a cumulative duration of The total harvested energy at node R is therefore expressed as:
where (0< ≤1) represents the energy conversion efficiency. The received signal-to-noise ratio (SNR) at node R is subsequently derived as:
The relay node R transmits its signal to receiver C via backscatter modulation. The reflected signal incorporates both the direct signal from the base station and a composite signal formed by the interaction of and Consequently, the information received at C from R is expressed as:
Simultaneously, the information received at C is given by:
where denotes the backscatter reflection coefficient. Under this cooperative communication framework, the primary system and backscatter device collaboratively transmit information. The receiver employs joint decoding to simultaneously detect and decode both the primary signal and the backscattered signal, leveraging their statistical correlation to enhance decoding performance. The aggregate system rate and energy efficiency are thus determined by the combined contribution of both signals. Notably, tag R performs energy harvesting and backscatter transmission exclusively during its M active wake cycles. Consequently, receiver C only receives backscattered signals from R during these M active periods. However, C continuously receives the direct signal from the base station (S) during all cycles. The received SNR at C therefore differs based on R's state.
During R's active cycles (M periods):
During R's idle cycles (N-M periods):
Energy Efficiency (EE), a critical performance metric in wireless communication systems, quantifies the information transmitted per unit energy consumed. It is defined as the ratio of the total transmitted data to the total energy expenditure. Within our transmission model, the aggregate data throughput Rsum results from the combined contributions of tag R and receiver C:
The total energy consumption Esum of the network comprises:
where signifies the circuit power consumption of node R, and represents the aggregate circuit power consumption of source S and receiver C. Therefore, the energy efficiency is derived as:
2.2. WUS Based Transmission Scheme
In traditional DRX operation, UE must monitor the control channel during every active period. The WUS mechanism enhances energy efficiency by providing advance notification of data transmission requirements, thereby reducing unnecessary wake-ups. When the network has downlink data or signaling pending, it transmits a WUS immediately preceding the end of the DRX dormancy period, instructing the UE to wake up for the subsequent active period. Conversely, if no data scheduling is required, the network omits the WUS transmission, allowing the UE to bypass the monitoring cycle entirely and remain dormant. This approach yields significant energy savings in scenarios with extremely low traffic volume. However, in moderate traffic conditions, the fixed overhead associated with WUS detection windows can diminish these gains. Furthermore, during bursty traffic periods—such as when IoT devices report data multiple times within short intervals—frequent WUS reception may result in wake-up patterns approaching those of conventional DRX, substantially weakening the energy conservation benefit. Consequently, adaptive relaxation and adjustment of the WUS transmission cycle warrant consideration, provided service latency requirements remain unaffected. Given the inherently short duration of DRX cycles, selectively omitting WUS transmissions during specific intervals offers substantial power savings with negligible impact on overall system performance.
Building upon this rationale, we introduce a proportional transmission scheme governed by two key parameters:
(1) Continuous Monitoring Duration (): The number of consecutive DRX cycles the relay node R will execute upon receiving a WUS.
(2) Continuous Suppression Duration (): The number of consecutive cycles R will remain dormant following periods where no WUS is detected.
This scheme enables a single WUS transmission to control the operational state of the node across multiple subsequent cycles. Figure 2 illustrates an example configuration where : = 2:2, demonstrating this control mechanism.
The ratio : directly influences the number of active cycles (M) within a given observation window of N total cycles, consequently impacting overall system energy efficiency. Therefore, adapting this ratio according to specific traffic characteristics becomes crucial for optimization. Subsequent performance evaluations will systematically assess the effect of varying : ratios on achievable energy efficiency, facilitating the identification of optimal parameter settings for diverse operational scenarios.
3. Problem Analysis
3.1. Optimization Problem Formulation
The optimization objective is to maximize the system's EE. Based on the EE formulation derived in Section 2.1, the optimization problem is formally expressed as:
subject to the following constraints:
The optimization problem incorporates two primary constraint variables: the base station transmit power and the power splitting ratio Constraints and establish linear boundaries for the base station transmit power and the power splitting ratio Specifically, C1 enforces that remains below the maximum allowable transmit power Pmax, while C2 confines within the fundamental interval [0,1]. Further quality-of-service requirements are imposed by constraints C3-C5. C3 guarantees that the transmission rate from source S to relay R during R's active state meets or exceeds the minimum required rate Rmin, Similarly, C4 ensures the transmission rate from R to receiver C during R's active periods satisfies Rmin, and C5 maintains the minimum rate Rmin between R and C during R's idle periods.
Given the fractional form of the objective function and the non-negative nature of all constraints, Dinkelbach's algorithm—a classical method for fractional programming—is adopted. This approach efficiently transforms the originally intractable fractional optimization into a sequence of more tractable parametric non-fractional subproblems through iterative procedures.
A parametric auxiliary variable is introduced, converting the fractional problem into the parametric form . The optimal solution is found iteratively, satisfying F(*) = 0. The corresponding solution pair (*, *) then yields the global optimum for the original energy efficiency maximization problem.
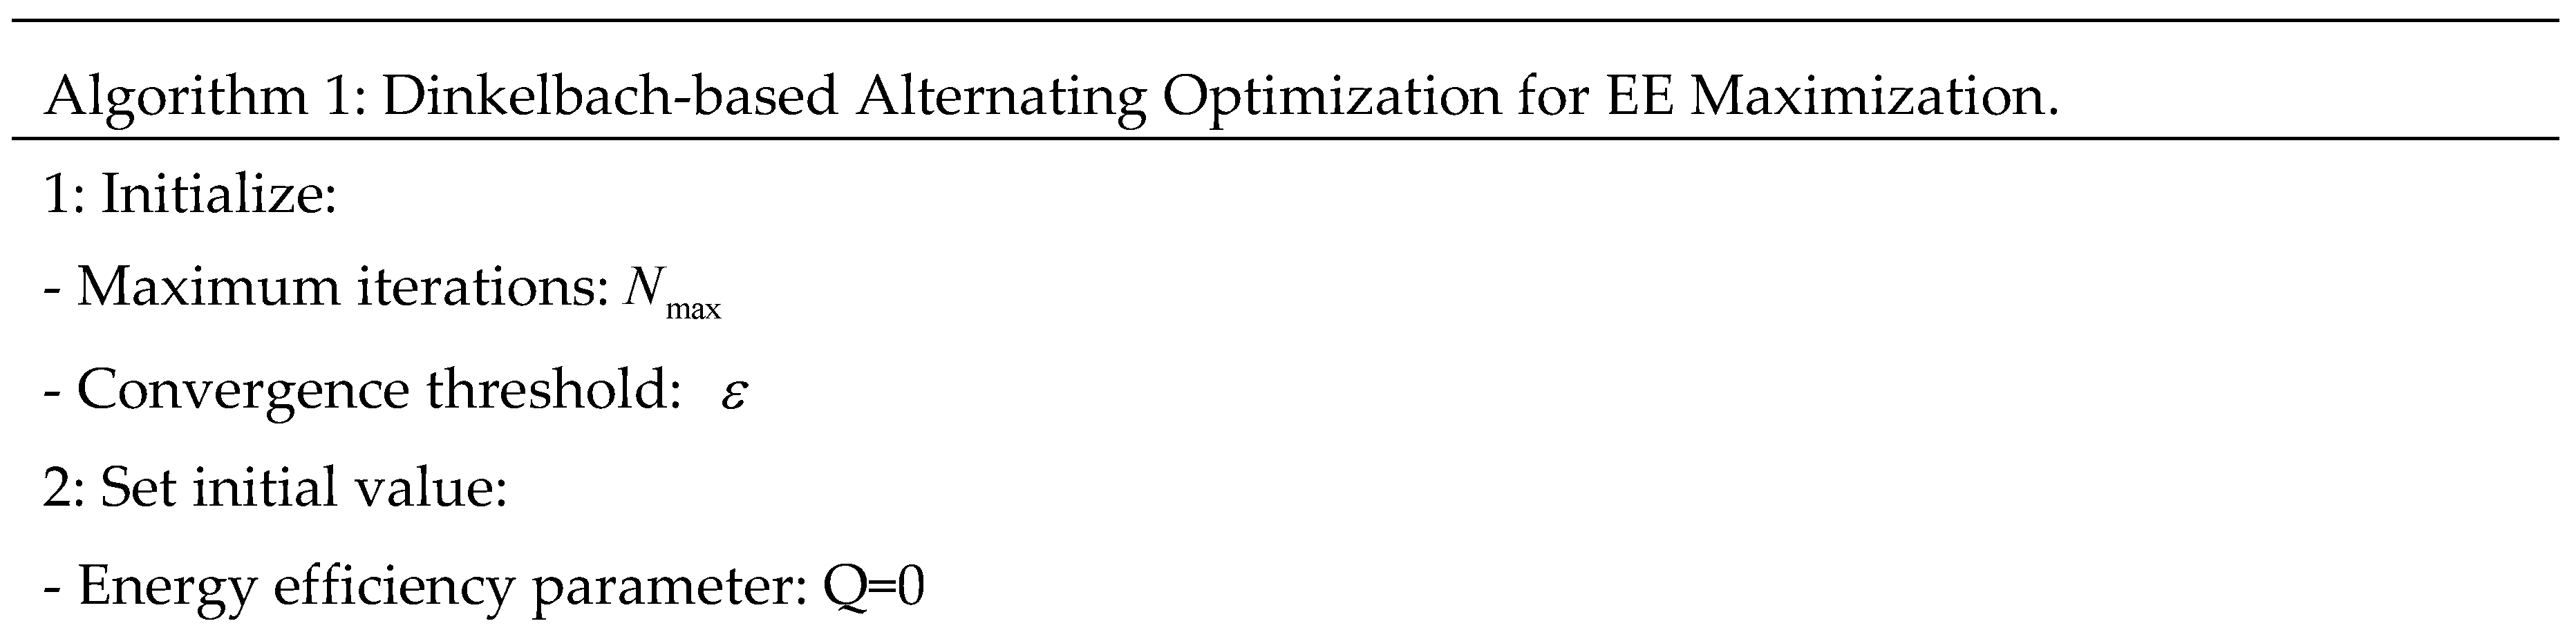
Within this optimization framework, the bivariate objective function exhibits non-convexity while the constraint factors demonstrate weak coupling. To address these computational challenges, we employ an Alternating Optimization (AO) approach to iteratively solve for the base station transmit power and the power splitting ratio This decomposition strategy separates the problem into two tractable subproblems: first, with fixed, we optimize the objective function with respect to subsequently, holding constant, we optimize for The procedure iterates between these two optimization stages until convergence is achieved, as formally detailed in Algorithm 1.

3.2. Transmit Power Optimization
Expanding P(1.1) and introducing coefficient variables , , and , the problem is reducible to:
Since the optimization variable resides within the logarithmic function, the objective is non-convex with respect to . By introducing auxiliary variables and , defined as:
with , P(1.1) transforms into:
Constraints and remain non-convex. Exploiting the first-order Taylor series expansion of the logarithmic function, their linear lower bounds at the mth iteration , expressed as:
Leveraging the core principle of the Successive Convex Approximation (SCA) technique, which facilitates transformation towards the maximum feasible region on the inequality's right-hand side, constraints and are convexified. Consequently, P(1.1) is reformulated as the following convex optimization problem:
Both the objective function and constraints now exhibit convexity. This permits direct utilization of the CVX convex optimization toolbox within Matlab to obtain the globally optimal solution for the transmit power .
3.3. Power Splitting Ratio Optimization
When the transmit power is fixed, optimizing the power splitting ratio reveals that the objective function is monotonically increasing with respect to Consequently, the optimal solution lies at the upper bound of the feasible region. The constraints involving are C2-C4. By rearrangement, constraints C3 and C4 can be transformed into:
Therefore, the lower and upper bounds of the feasible region for are respectively given by:
If , the optimal value of is .
3.4. Outage Performance Analysis
Given the system comprises both a direct link and a reflected link, the outage probabilities of these individual paths require separate analysis, while also accounting for the impact of joint decoding on overall outage performance. An outage event is defined as the received signal-to-noise ratio (SNR) falling below a predetermined outage threshold. Assume , and follow exponential distributions with a unit mean.
(1) During active R operation (Reflection Path Active)
The outage probability at the reflecting device R for the link from the base station to R is:
The outage probability at the destination C requires analysis under two distinct scenarios:
Scenario 1 (Outage at R): R is in outage; C relies solely on the direct link. The outage probability at C is:
Scenario 2 (No Outage at R): Both the reflected path and the direct link are active. The outage probability at C is:
According to equation (6), incorporates three channel gains. Given their mutual independence, let , and . The joint probability density function (PDF) is:
Consequently, equation (30) can be further derived as:
where and . The integral component necessitates numerical evaluation.
(2) During inactive R operation (Direct Link Only)
When R is inactive, only the direct link transmits information. The outage probability at C under this condition aligns with equation (29).
4. Analysis of Experimental Results
Reflecting practical scenarios, the channel simulation parameters were configured in Table 1.
Figure 3 depicts the variations in power consumption at node R, system delay, and system energy efficiency under different wake-up ratios (N1/N2). Where, N1 represents the number of consecutive cycles node R executes the DRX process after being woken up by a WUS, while N2 denotes the number of consecutive cycles node R remains in idle mode without WUS activation. To prevent the tag from being perpetually active and enhance its energy-saving performance, the constraint N2 was imposed. For each fixed N1 value, three progressively increasing N2 values were selected, forming three distinct ratio groups. The baseline scenario (N1=N2=1) represents the conventional wake-up mechanism where a WUS is transmitted whenever the source has data for node R.
From the power consumption curves, it is observed that without ratio-based optimization of the WUS transmission scheme, node R exhibits the highest power consumption and energy efficiency, coupled with the lowest delay. Within each experimental group defined by a fixed N1 value, the condition N1/N2=1 consistently corresponds to the highest power consumption, highest energy efficiency, and lowest delay for that group. Furthermore, fluctuations in power consumption, delay, and energy efficiency under this specific ratio (N1/N2=1) are minimal. This stability is attributable to the synchronous and equal-magnitude changes in N1 and N2, , which exert little net effect on the total number of wake-up cycles. When the value of N1 is held constant and N2 is increased, the power consumption at node R and the overall system energy efficiency decrease, while the system delay increases. This trend stems from the extended duration node R spends in the RRC_IDLE state resulting from a larger N2. This reduced state activity lowers the frequency of data processing, thereby decreasing power consumption. However, the consequent reduction in throughput also diminishes system energy efficiency and increases latency. Additionally, analysis reveals that as the value of N1 increases across the experimental groups, the fluctuations in power consumption and energy efficiency within the corresponding group decrease, whereas fluctuations in delay increase. This behavior results from the narrowing gap between N1 and N2 (i.e., the ratio N1/N2 progressively approaches 1) for higher N1 values. Consequently, for power-sensitive devices, employing a larger N2/N1 ratio is recommended to minimize energy consumption. Conversely, for latency-sensitive devices, ratios where N2 and N1 are closer in value are more suitable to prioritize lower delay.
Figure 4 illustrates the variation of energy efficiency with respect to the power splitting ratio ρ under distinct base station transmit power levels, denoted by markers of varying colors and shapes. Collectively, the three energy efficiency curves exhibit a monotonic decreasing trend as ρ increases progressively from 0.1 to 0.9. This behavior arises because, while a higher ρ enhances the energy harvested at R, consequently increasing the transmit power from R to C, it simultaneously reduces the throughput of information received at R. Critically, the higher path loss experienced at C relative to R means the resulting increase in throughput at C fails to compensate for the reduction incurred at R. Consequently, the numerator of the energy efficiency expression diminishes. Examining the vertical axis reveals that higher transmit power Pb corresponds to lower energy efficiency. This inverse relationship stems from the fact that an increase in Pb elevates the total system power consumption at a rate exceeding the accompanying growth in throughput.
Figure 5 depicts the corresponding variations in overall system throughput and its constituent components as the position of relay node R is dynamically altered. Within the defined scenario, the S and C nodes are fixed at coordinates (-10, 0) and (10, 0), respectively. The relay node R traverses a horizontal line segment from (-20, 5) to (20, 5), with the abscissa representing R's x-coordinate during this movement.
Examination of the figure data reveals that in the inactive state (R not awakened), the R-C link experiences a communication outage. Consequently, the signal received at node C originates exclusively from the transmit power of node S. Given the fixed positions of S and C, the S-C throughput remains constant irrespective of variations in R's position. Conversely, in the active state (R awakened), the throughput at node C comprises contributions from both the direct S-C link transmission and the data relayed via the reflected S-R-C link. However, the signal traversing the S-R-C path undergoes multiplicative path attenuation (experienced sequentially over the S-R and R-C hops), resulting in a negligible contribution to the overall throughput at C. Therefore, even in the active state, the improvement in throughput at C compared to the inactive state is marginal.
As relay node R progressively approaches source node S, corresponding to a reduction in the S-R line-of-sight distance, the throughput of the awakened system, the total system, and awakened node R itself all exhibit a significant upward trajectory. This trend culminates when R reaches the position (-10, 5), where the S-R distance is minimized. At this location, the throughput of each aforementioned component achieves its corresponding peak. This phenomenon is attributed to the shorter transmission distance, which mitigates signal attenuation and path loss during propagation, thereby enhancing data transmission rates and throughput. Furthermore, the substantially lower throughput contribution observed at destination C compared to relay R during the active state results in the throughput curve of the awakened system exhibiting approximate symmetry with respect to x = -10. Concurrently, the throughput curve for awakened node R displays perfect symmetry about x = -10. Conversely, as the S-R distance increases, signal attenuation intensifies. This leads to a progressive diminishment in the throughput contributed by node R, consequently causing the throughput of the awakened system to decline correspondingly.
Figure 6 depicts the relationship between system outage probability and S-R distance across varying wake-up ratios. For any fixed wake-up ratio, the outage probability exhibits a persistent upward trend as the S-R distance increases. When the distance is below 20 meters, the outage probability grows rapidly. Subsequently, the rate of increase gradually attenuates, stabilizing near 0.72 when the distance reaches 25 meters and beyond. This behavior is explained by the robustness of communication links at shorter distances, resulting in lower outage probability. As distance increases, signal transmission becomes more susceptible to impairments such as fading and interference, degrading communication quality and significantly elevating outage probability. Beyond a critical distance, the outage probability asymptotically approaches stability. Examining vertically (across ratios at fixed distances), at = 1, the outage probabilities for the specific ratios ( and ) are virtually identical. As the value of decreases, the outage probability increases correspondingly. These results demonstrate that both the S-R distance and the tag's wake-up ratio exert significant influences on the system outage probability within this communication scenario.
To investigate the convergence characteristics of the proposed scheme, Figure 7 presents the energy efficiency variation with alternating optimization iterations after 1000 Monte Carlo experiments. The initial energy efficiency at the first iteration is approximately 17.945. A significant improvement to 17.975 is observed between the first and second iterations. Subsequently, the energy efficiency stabilizes with negligible fluctuations, as evidenced by the near-horizontal trend line beyond the second iteration. This demonstrates the algorithm's rapid convergence and stability, ensuring reliable system operation without excessive iterative oscillations. The optimal energy efficiency is determined to be 17.975, achieved at a corresponding base station transmit power of 52.73 mW.
In the WUS transmission optimization scheme, the DRX mechanism's cycle length influences both WUS transmission frequency and the number of node R wake-up cycles. To examine DRX cycle's impact on energy efficiency optimization, Figure 8 illustrates energy efficiency variations with respect to base station transmit power and power splitting ratio under different DRX cycles (32 ms, 64 ms, and 96 ms). Figure 8(a) reveals that as the base station transmit power increases, the energy efficiency curves corresponding to the three DRX cycles all exhibit an initial rise followed by a subsequent decline. Each curve reaches its peak energy efficiency at approximately 50 mW transmit power, which aligns with prior optimization results. Comparative analysis of curves further demonstrates that for any given transmit power level, longer DRX cycles yield relatively higher energy efficiency. This suggests that in the studied scenario, appropriately extending the DRX cycle can enhance system energy efficiency, while the extent of efficiency degradation with increasing transmit power varies across different DRX cycle lengths.
Figure 8(b) presents the variation in energy efficiency with respect to the power splitting ratio under different DRX cycles. Overall, as the power splitting ratio increases from 0.2 to 0.9, all three energy efficiency curves display a monotonically decreasing trend, consistent with the theoretical derivation in Section 3.3. Comparing the curves, it is evident that for any fixed value of the power splitting ratio, longer DRX cycles correspond to higher energy efficiency. Therefore, for services with less stringent real-time data transmission requirements, extending the DRX cycle length can effectively maintain link energy efficiency.
5. Conclusions
In this paper we propose a novel SWIPT cooperative communication architecture that integrates ambient backscatter and WUR technologies. By jointly optimizing base station transmission power and power splitting ratios, we establish a communication model aimed at maximizing energy efficiency. Designed for energy-constrained IoT scenarios, this solution achieves triple optimization while ensuring communication reliability. First, the scheme introduces innovation in system architecture by incorporating WUS into SWIPT cooperative communication systems utilizing ambient backscatter technology. This breakthrough liberates sensor nodes from the constraint of maintaining continuous active states. Second, it enables flexible wake-up control and power management for tag nodes. The proposed proportional WUS scheduling strategy eliminates the need for constant signal monitoring, granting nodes autonomous idle/wake decision-making capability and significantly reducing redundant power consumption caused by frequent WUS transmissions from base stations. Third, the solution achieves substantial energy efficiency optimization. Leveraging alternating optimization and fractional programming theory, we develop an efficient solving algorithm for multi-variable coupling constraints that enhances the energy efficiency of conventional SWIPT systems. While this work demonstrates notable improvements in energy conservation for backscatter links, several promising directions remain for further exploration. Future research could investigate employing intelligent reflecting surfaces to enhance backscatter signal strength and coverage through beamforming and reflection matrix optimization, thereby improving both communication performance and energy efficiency, and investigate co-designing WUS with Paging Early Indication (PEI) signals to achieve breakthroughs in energy efficiency, latency, and reliability. These potential advancements may lead to more comprehensive optimization of next-generation energy-constrained communication systems.
Author Contributions
Conceptualization, W.M.; methodology, D.L. and W.M.; software, X.L.; validation, R.W.; formal analysis, F.Z.; investigation, W.M.; resources, D.L.; data curation, W.G.; writing—original draft preparation, W.M.; writing—review and editing, D.L. and W.M.; visualization, W.G.; supervision, D.L.; project administration, W.G.; funding acquisition, D.L. All authors have read and agreed to the published version of the manuscript.
Data Availability Statement
Not applicable.
Conflicts of Interest
We declare no conflicts of interest with any individual or organization.
References
- Chen W, Lin X, Lee J, et al. 5G-advanced toward 6G: Past, present, and future [J]. IEEE Journal on Selected Areas in Communications, 2023, 41(6): 1592-1619.
- Lin K H, Liu H H, Hu K H, et al. A survey on DRX mechanism: Device power saving from LTE and 5G new radio to 6G communication systems [J]. IEEE Communications Surveys & Tutorials, 2022, 25(1): 156-183.
- Bruhn P, Bassi G. Machine learning based C-DRX configuration optimization for 5G [C]//Mobile Communication-Technologies and Applications; 25th ITG-Symposium. VDE, 2021: 1-6.
- Li X, Xu X, Hu C. Research on 5G redcap standard and key technologies [C]//2023 4th Information Communication Technologies Conference (ICTC). IEEE, 2023: 6-9.
- Huang K K, Luna R, Wentzloff D D, et al. NB-IoT Power-Saving Analysis with Wake-Up Signal and Wake-Up Receiver Implementation [C]//2024 IEEE International Conference on Communications Workshops (ICC Workshops). IEEE, 2024: 1121-1126.
- Wang R Z. Distributed wake-up/sleep IMM filtering tracking for underwater wireless sensors [J]. Electronic Design Engineering,2019,27(23):92-98.
- Nafiseh Mazloum,Ove Edfors.Interference-Free OFDM Embedding of Wake-Up Signals for Low-Power Wake-Up Receivers [J].IEEE Transactions on Green Communications and Networking,2020.
- Padmageetha B G, Patil M. Survey on Cross-Layered Wake-up Receiver-Enabled WSN [C]//Computer Communication, Networking and IoT: Proceedings of ICICC 2020. Springer Singapore, 2021: 295-303.
- Pan X M, Qu X. 5G-Advanced low-power wake-up receiver and wake-up signal technology. Telecommunications Science [J].2022.
- Braun V, Schober K, Tiirola E. 5G NR physical downlink control channel: Design, performance and enhancements [C]//2019 IEEE Wireless Communications and Networking Conference (WCNC). IEEE, 2019: 1-6.
- Zhu Z, Xu J, Sun G, et al. Robust beamforming design for IRS-aided secure SWIPT terahertz systems with non-linear EH model [J]. IEEE Wireless Communications Letters, 2022, 11(4): 746-750. [CrossRef]
- Niu H, Chu Z, Zhou F, et al. Robust design for intelligent reflecting surface-assisted secrecy SWIPT network [J]. IEEE Transactions on Wireless Communications, 2021, 21(6): 4133-4149. [CrossRef]
- Zhu Z, Ma M, Sun G, et al. Secrecy rate optimization in nonlinear energy harvesting model-based mmWave IoT systems with SWIPT [J]. IEEE Systems Journal, 2022, 16(4): 5939-5949. [CrossRef]
Figure 1.
Channel Model.
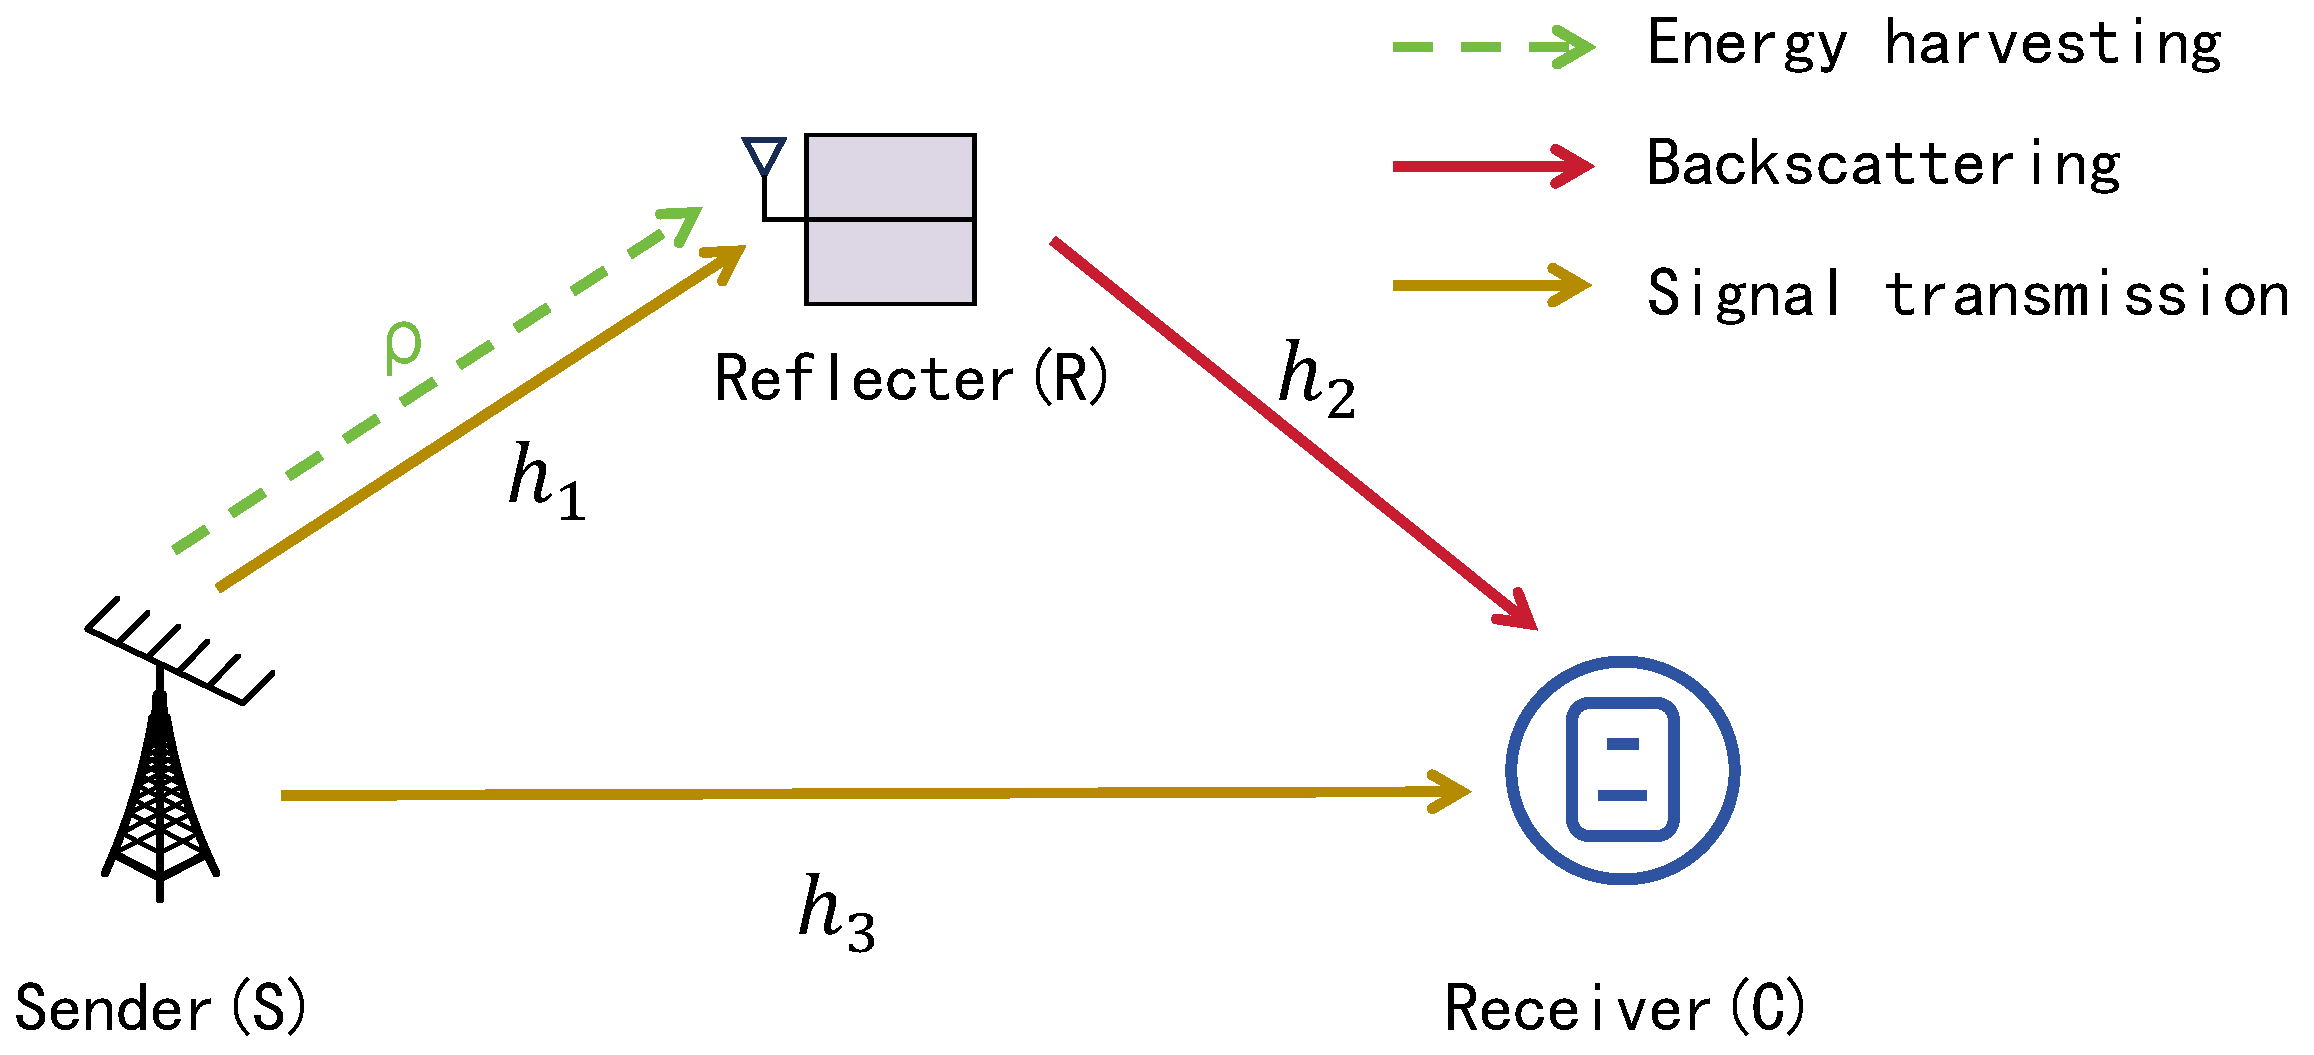
Figure 2.
The Proportional WUS Transmission Scheme (: = 2:2).
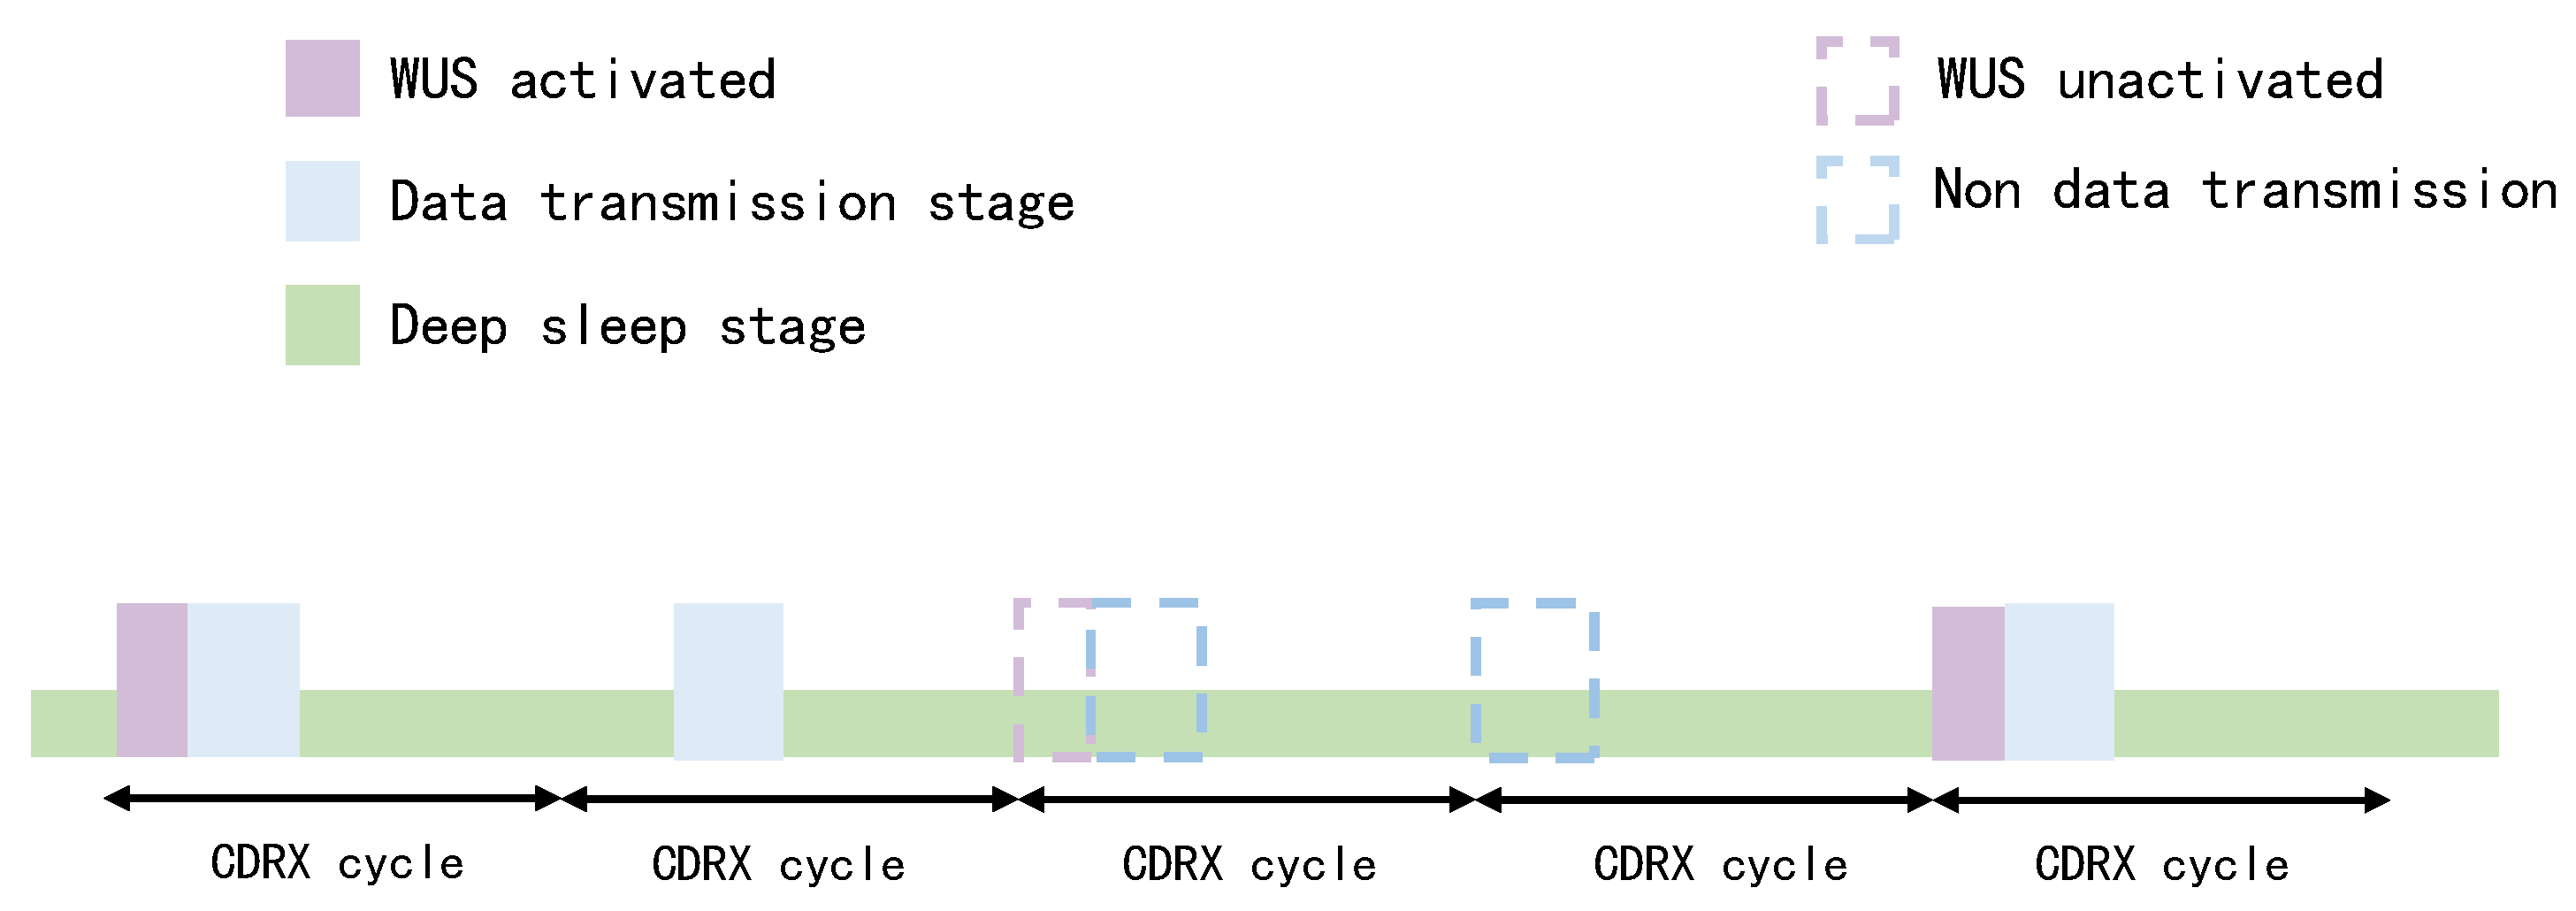
Figure 3.
Performance Comparison Between Baseline Wake-Up Scheme and Ratio-Based Wake-Up Scheme.
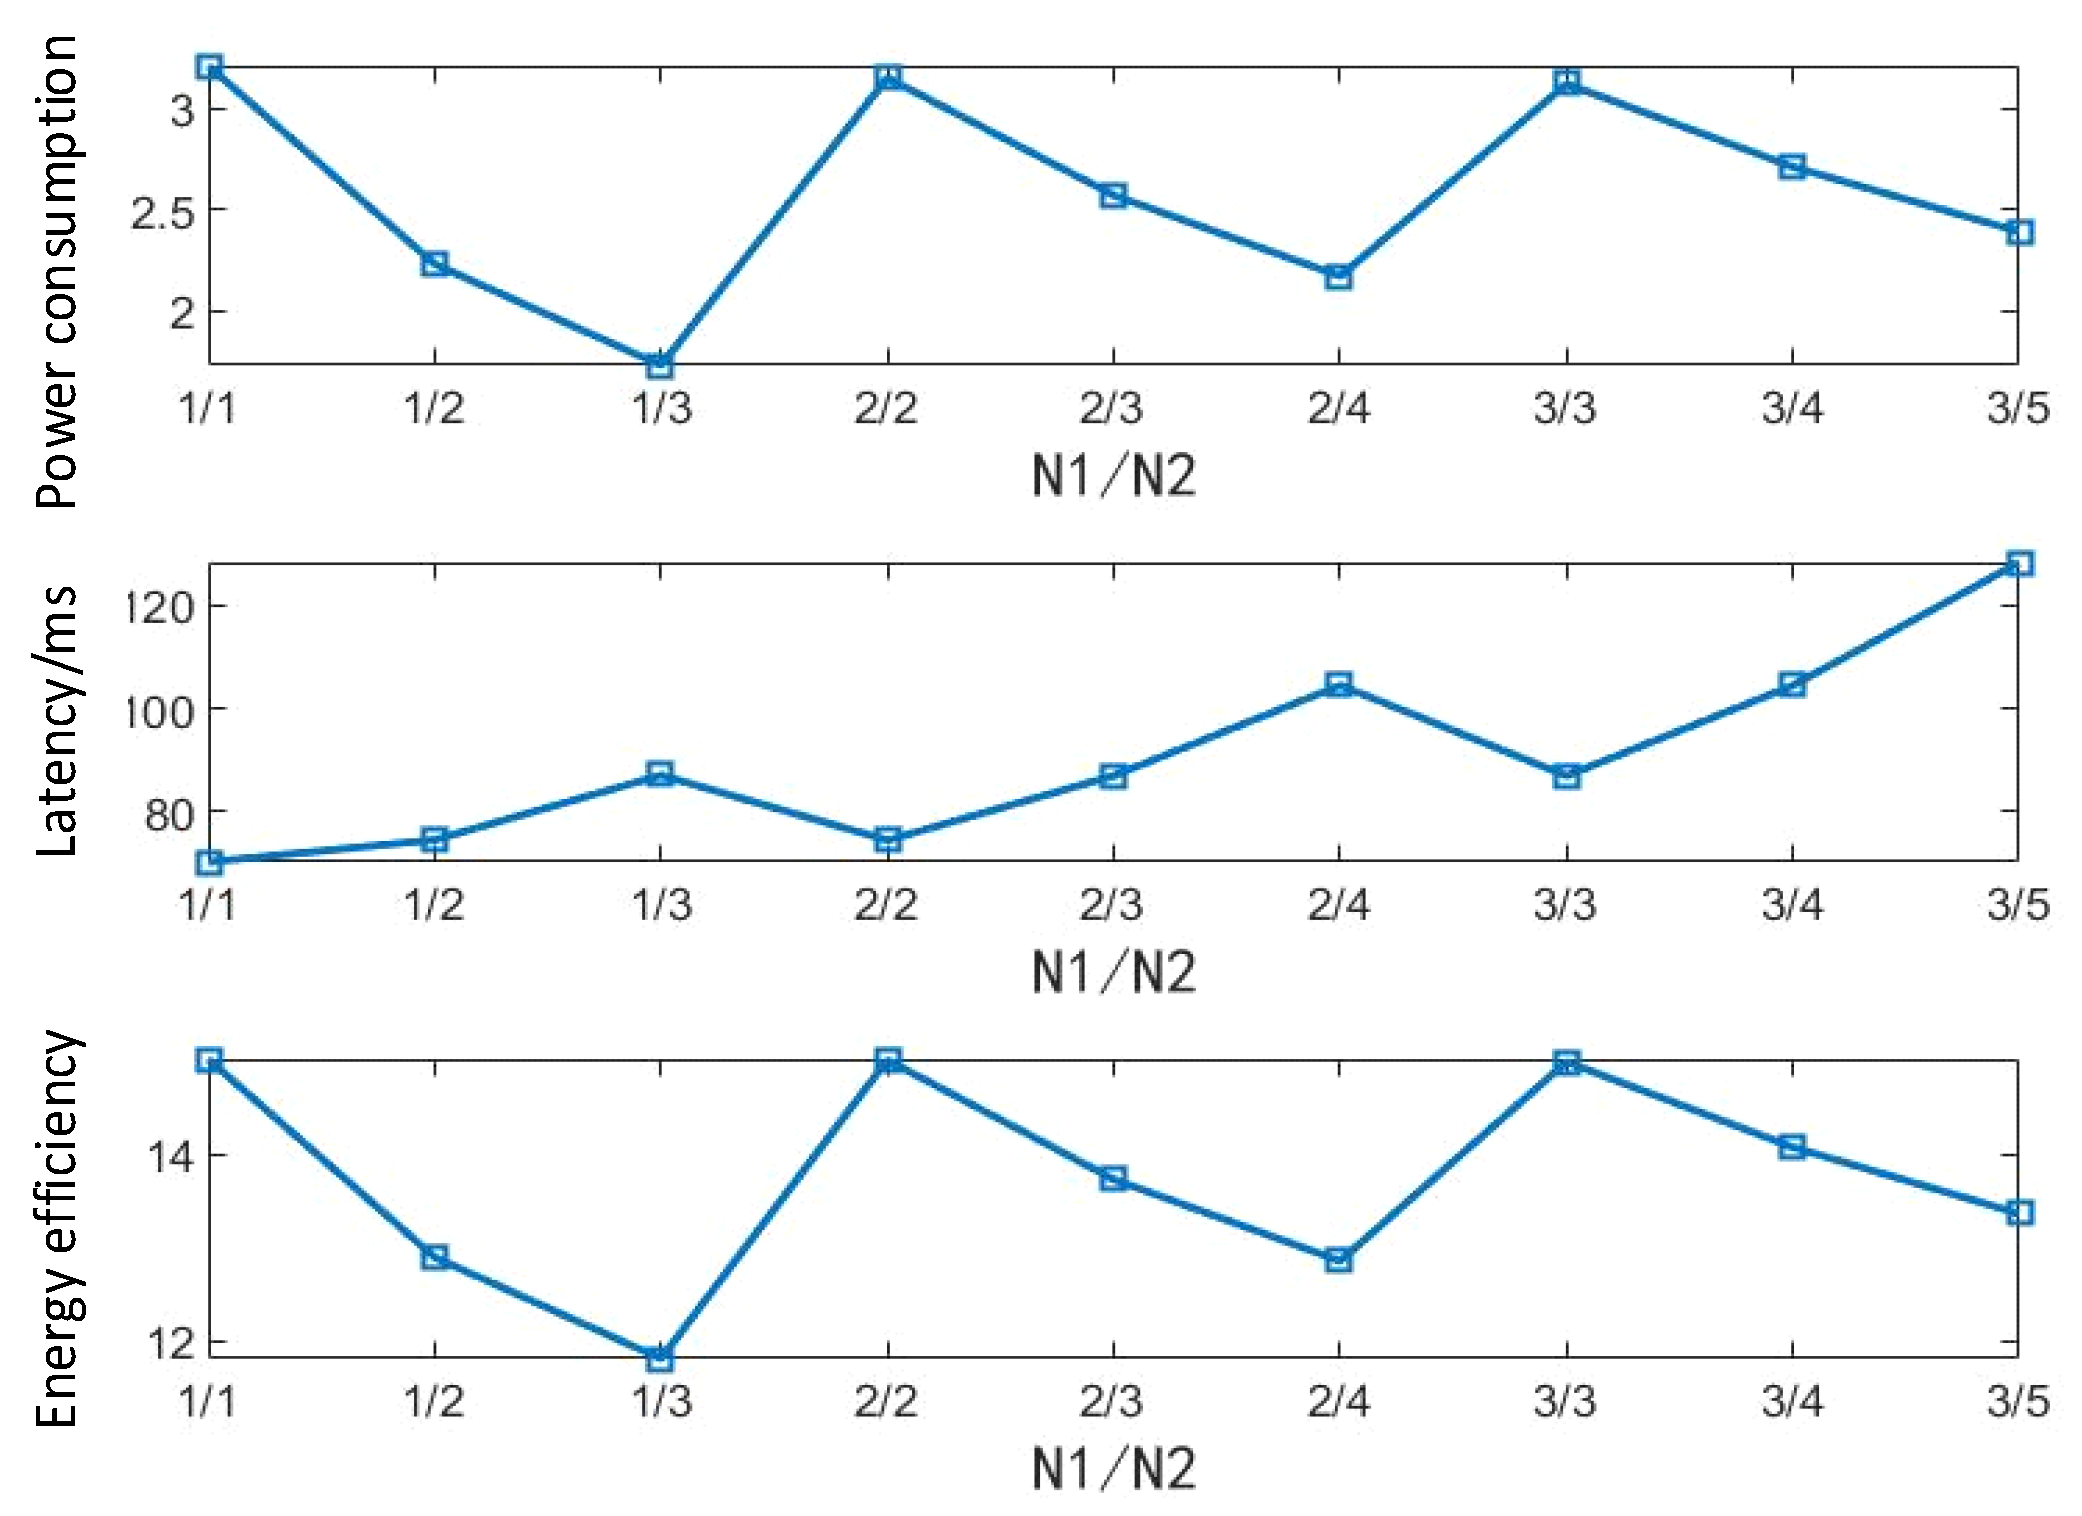
Figure 4.
Energy Efficiency versus Power Splitting Ratio and Base Station Transmit Power.
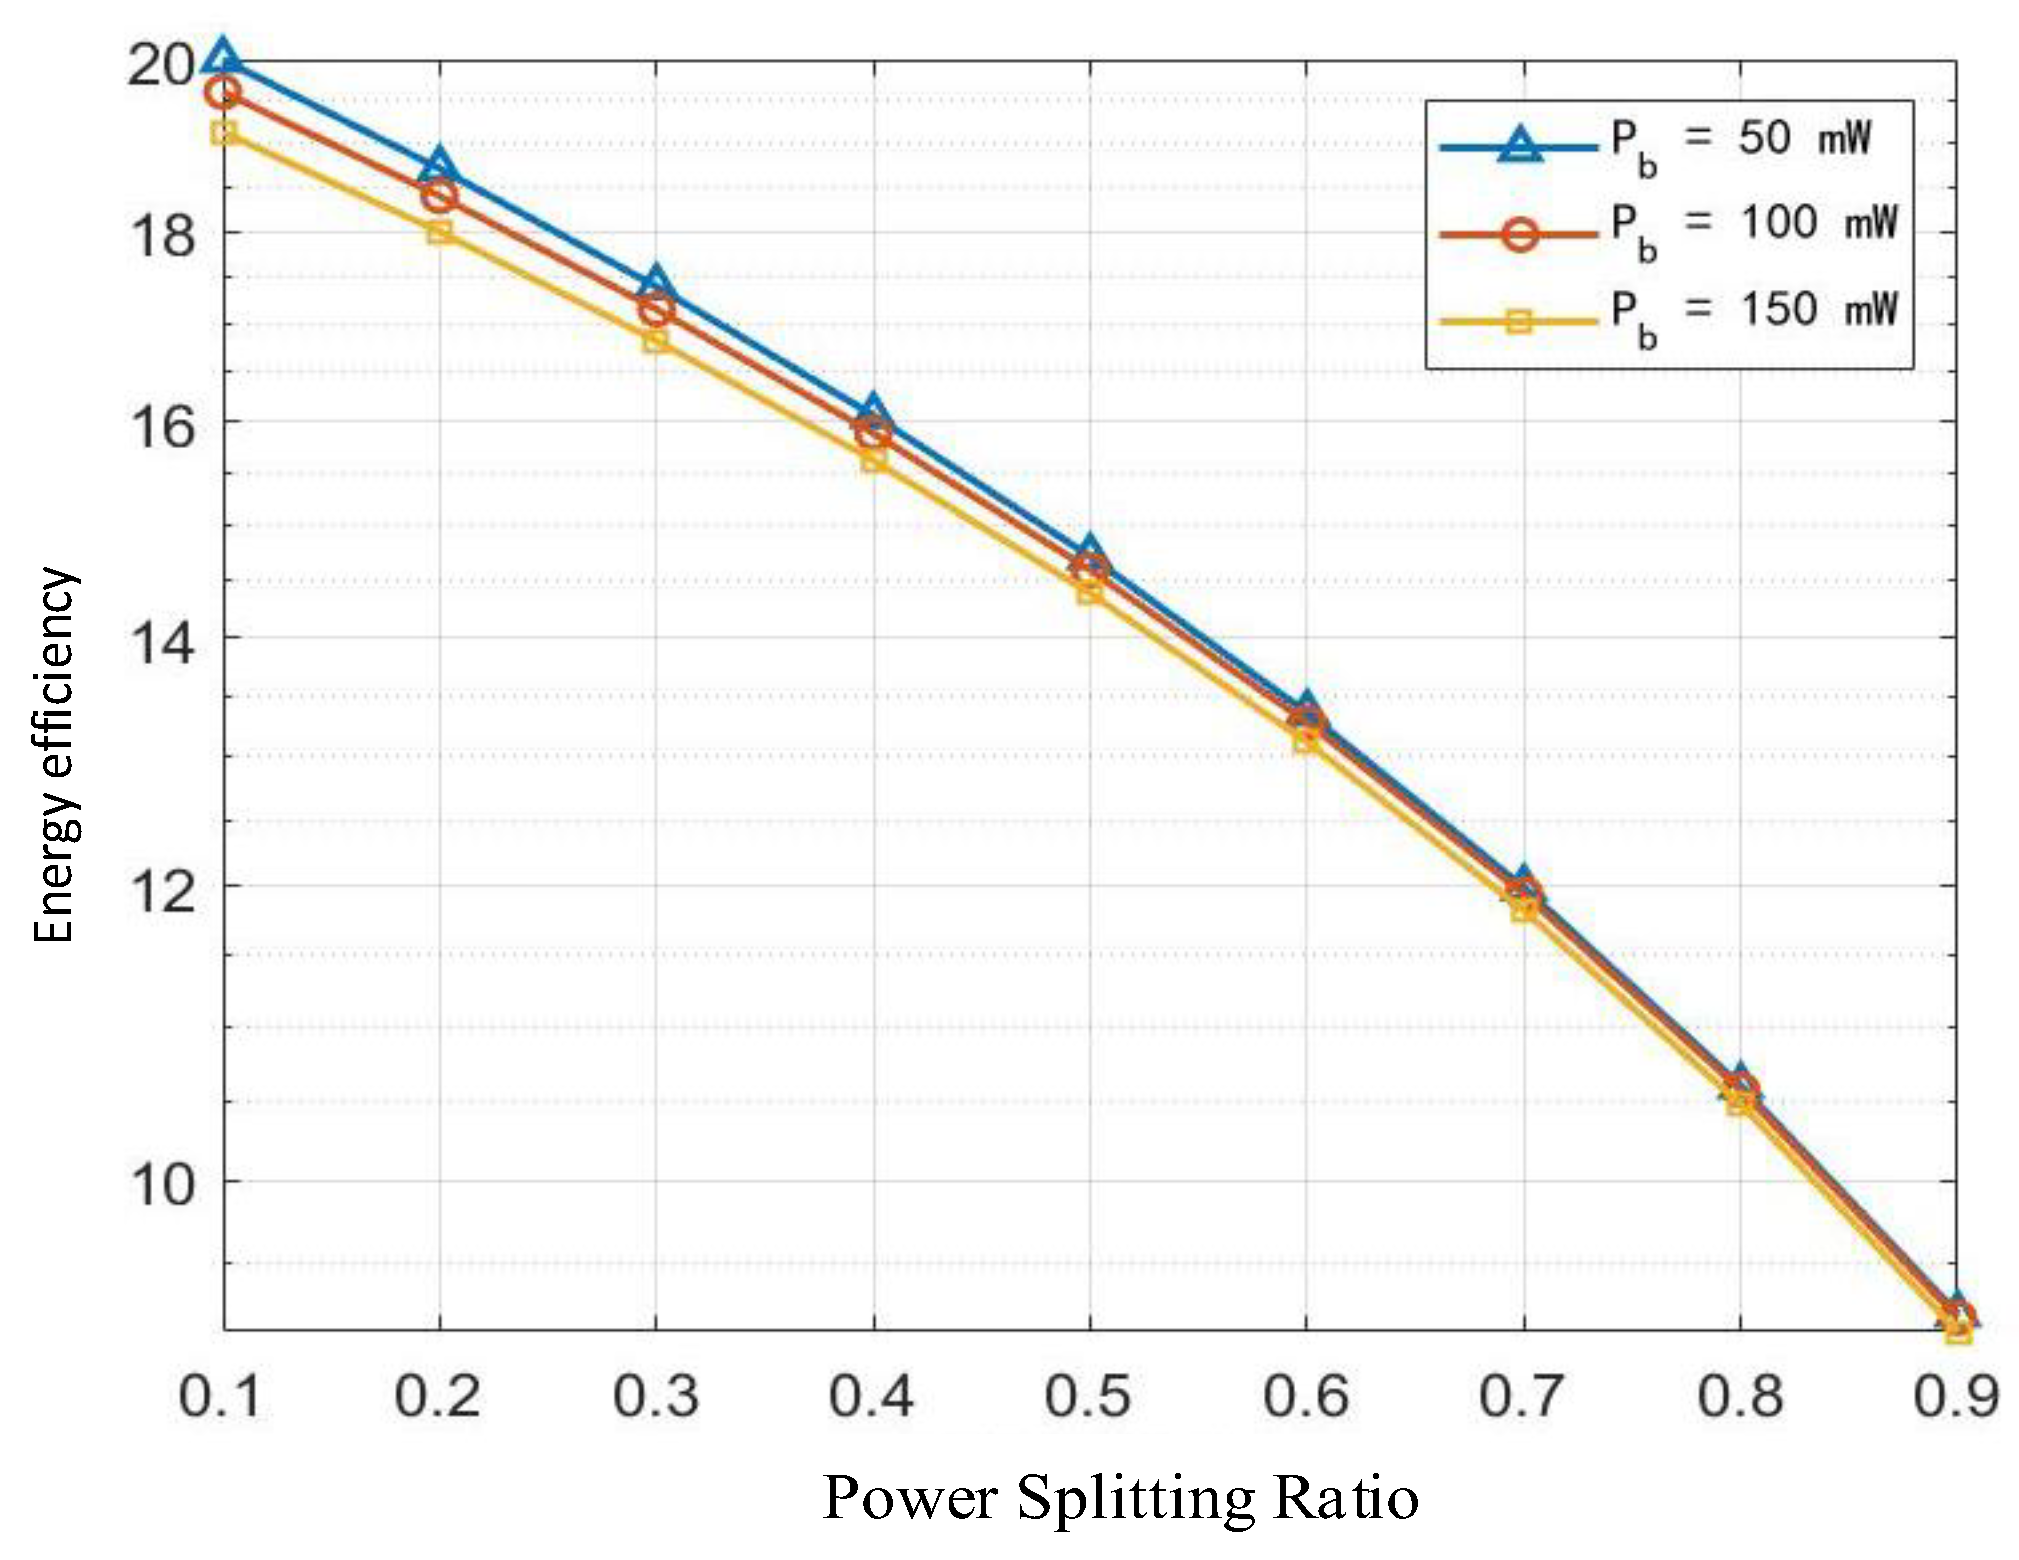
Figure 5.
System and Component Throughput versus Dynamic Relay Position.
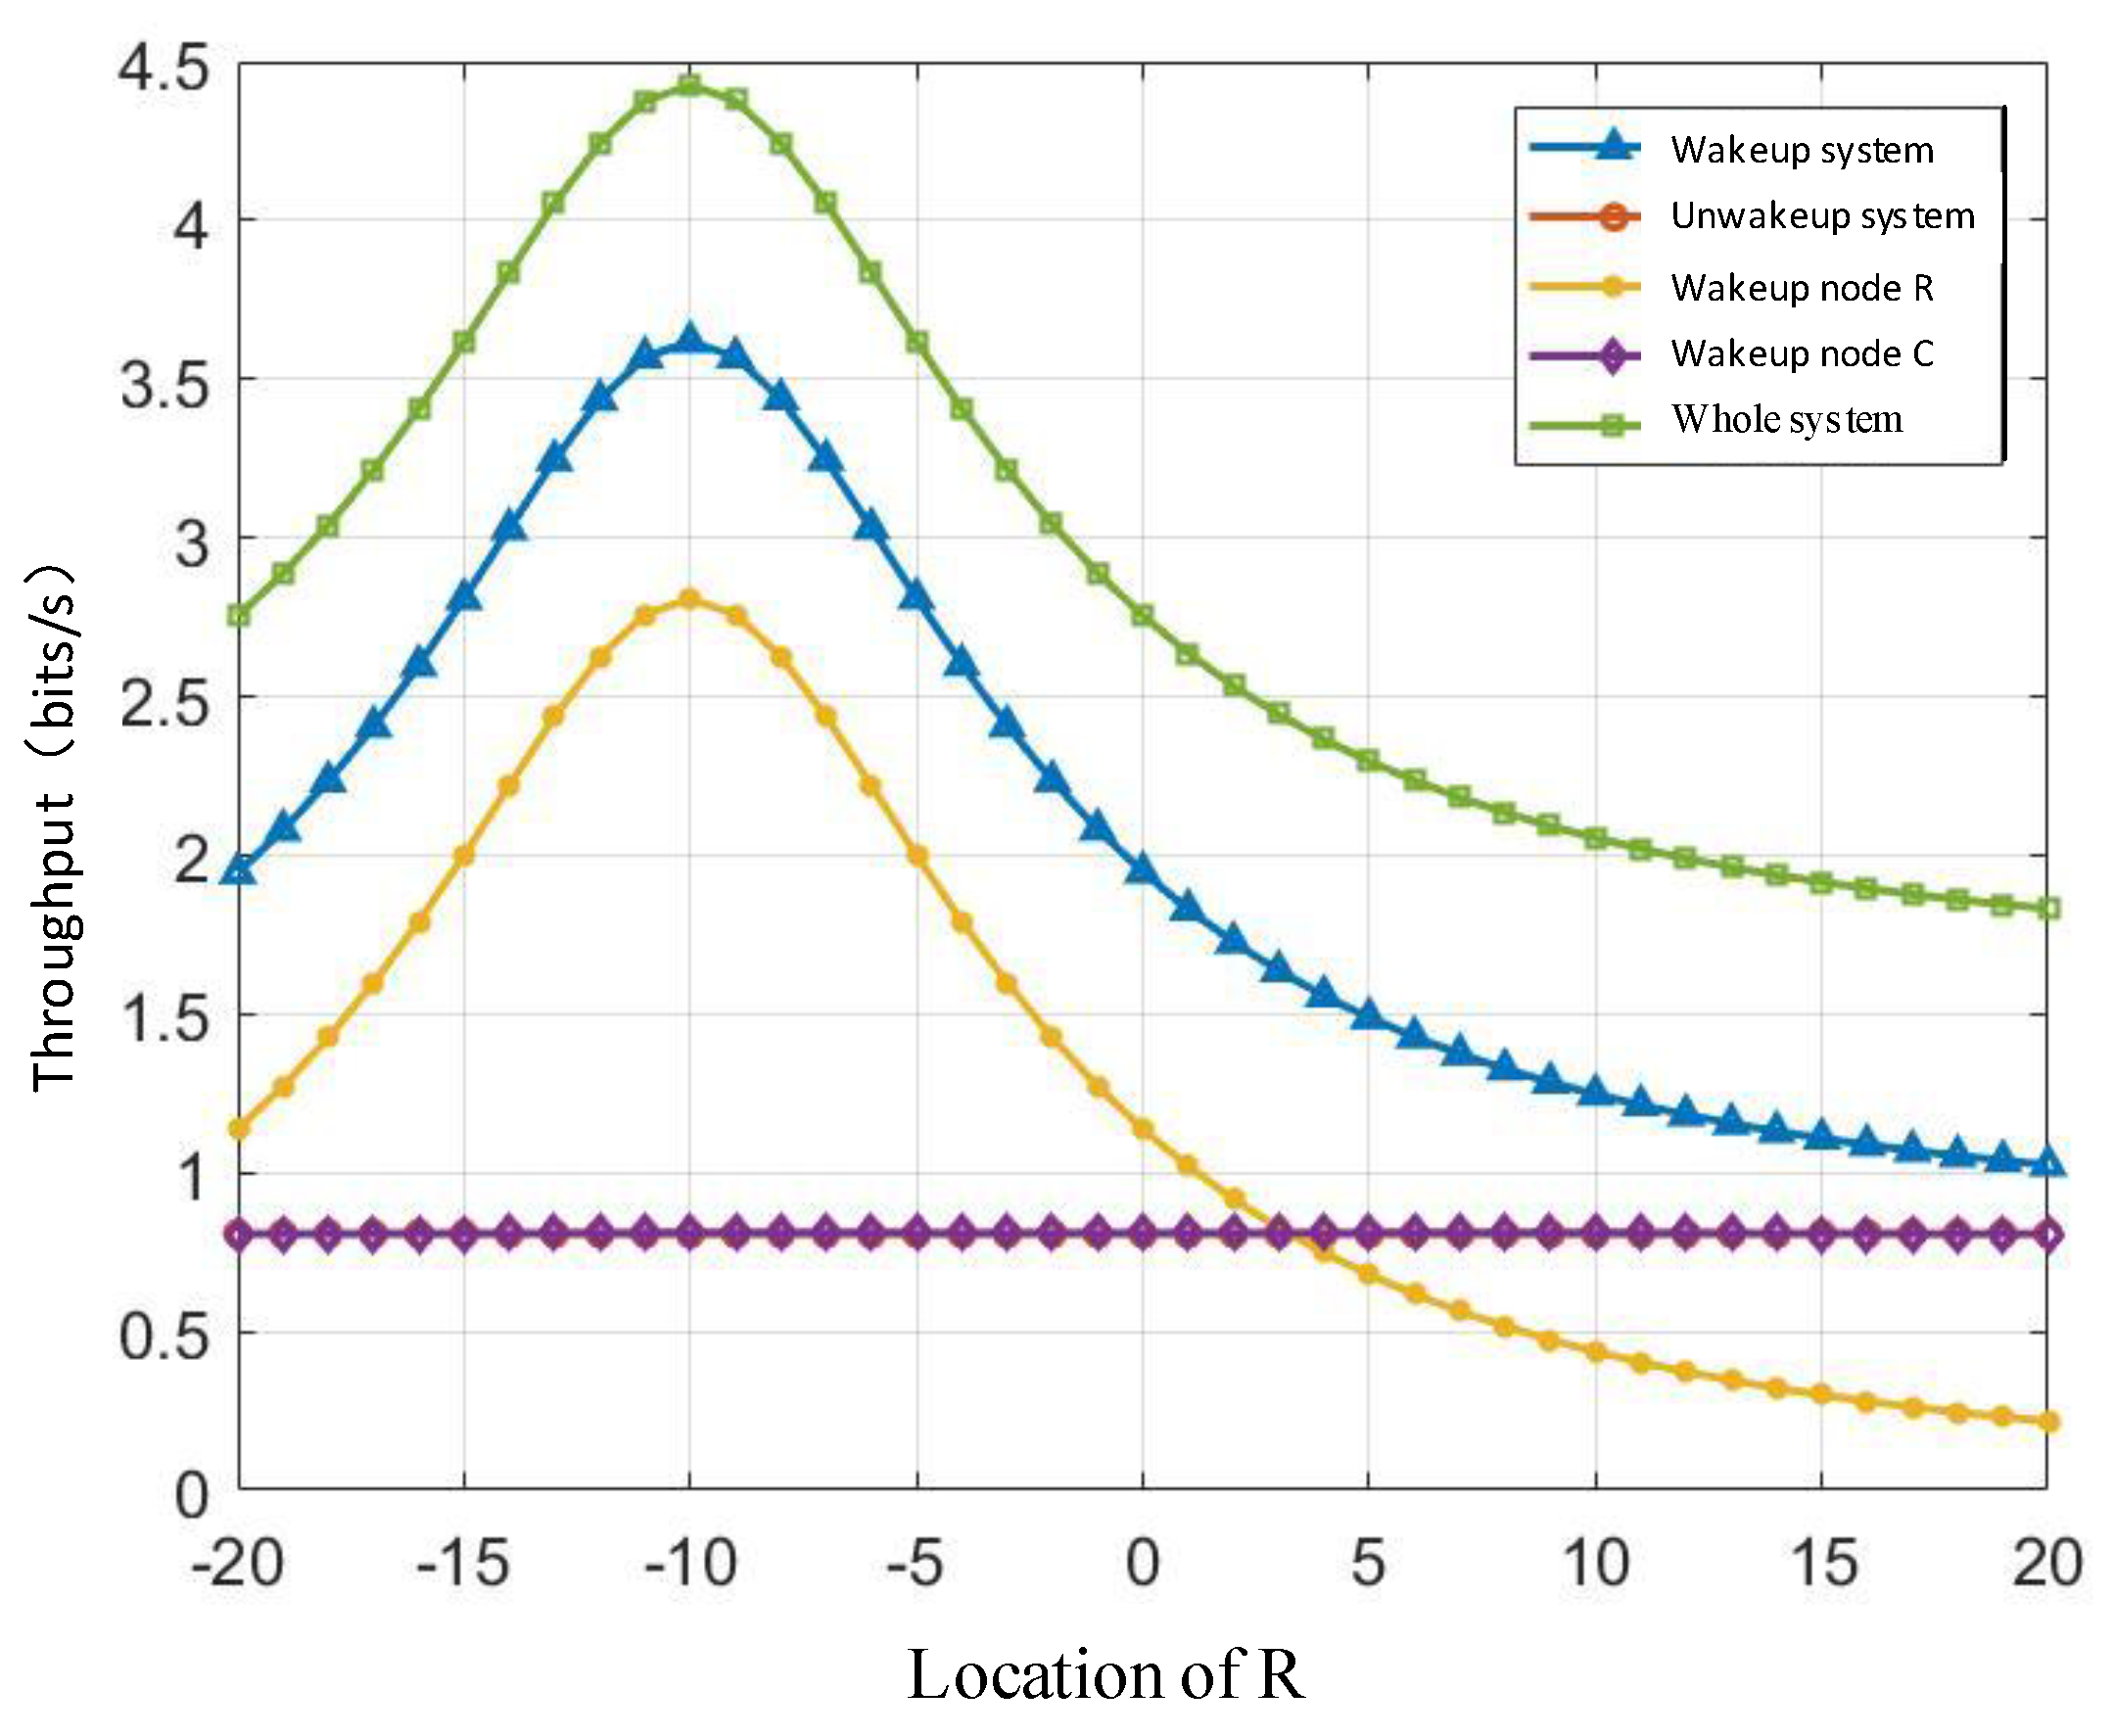
Figure 6.
Relationship Between S-R Distance and System Outage Probability.
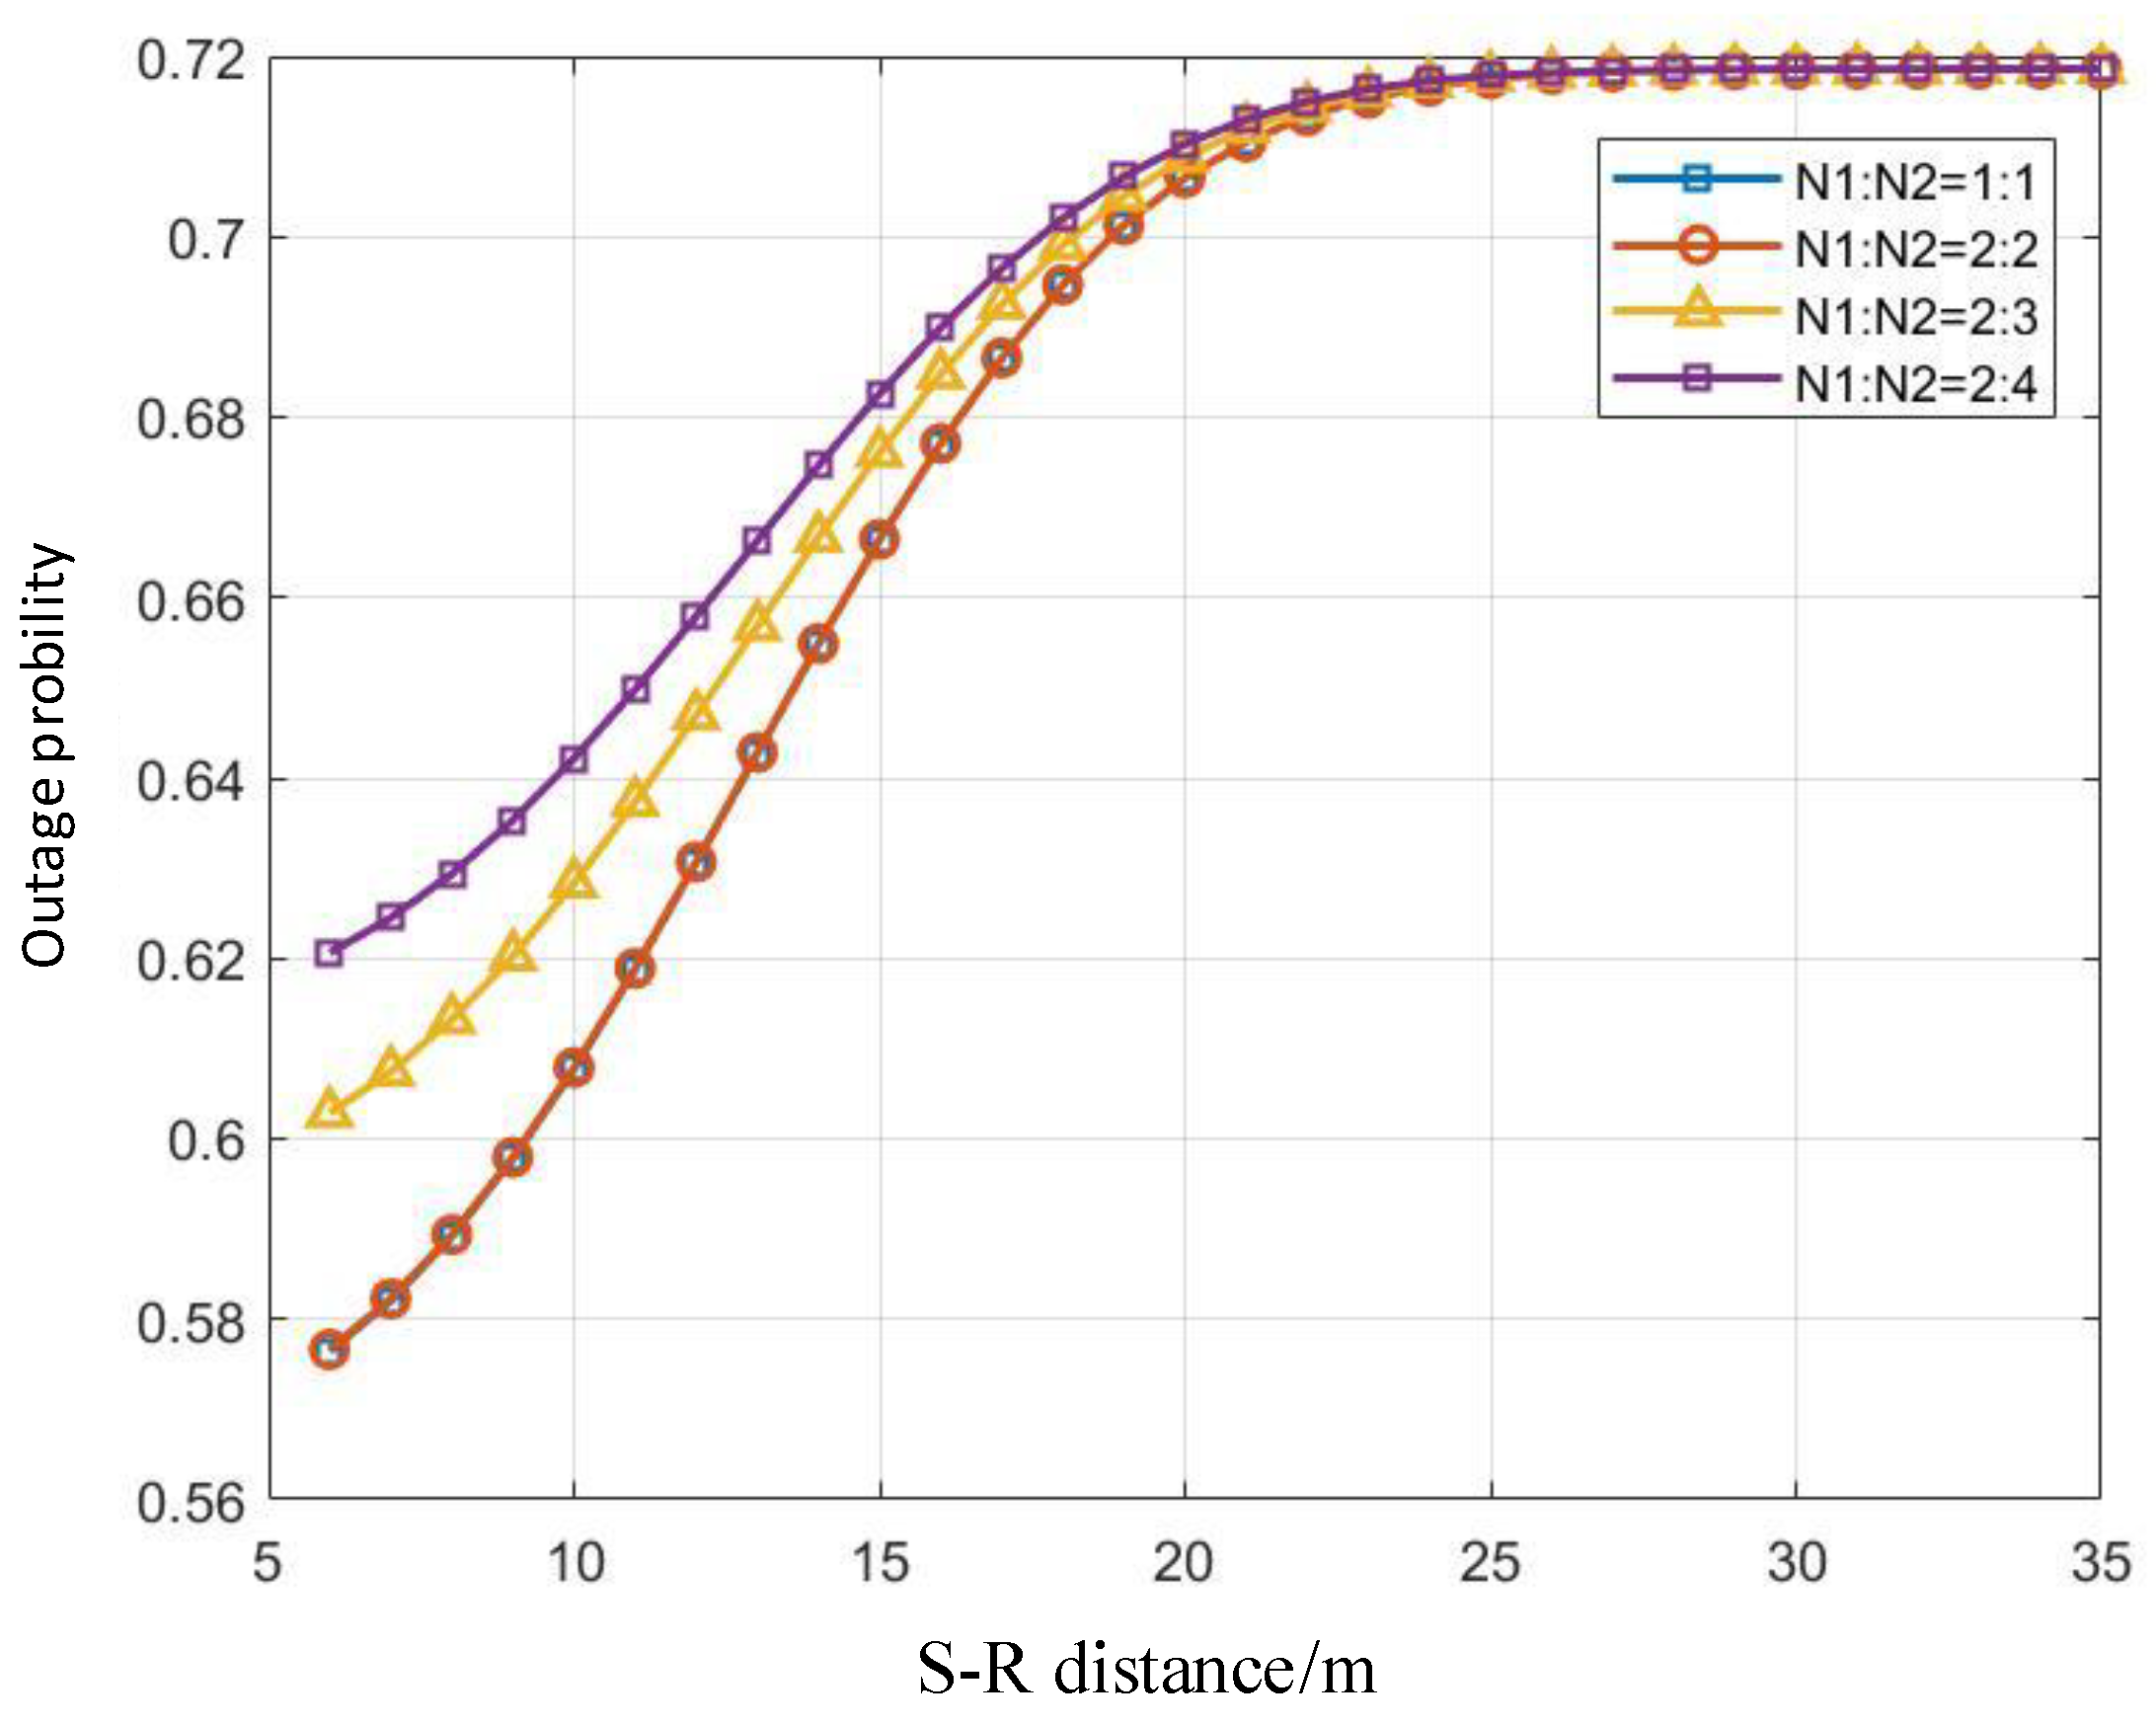
Figure 7.
Convergence Characteristics of Energy Efficiency.
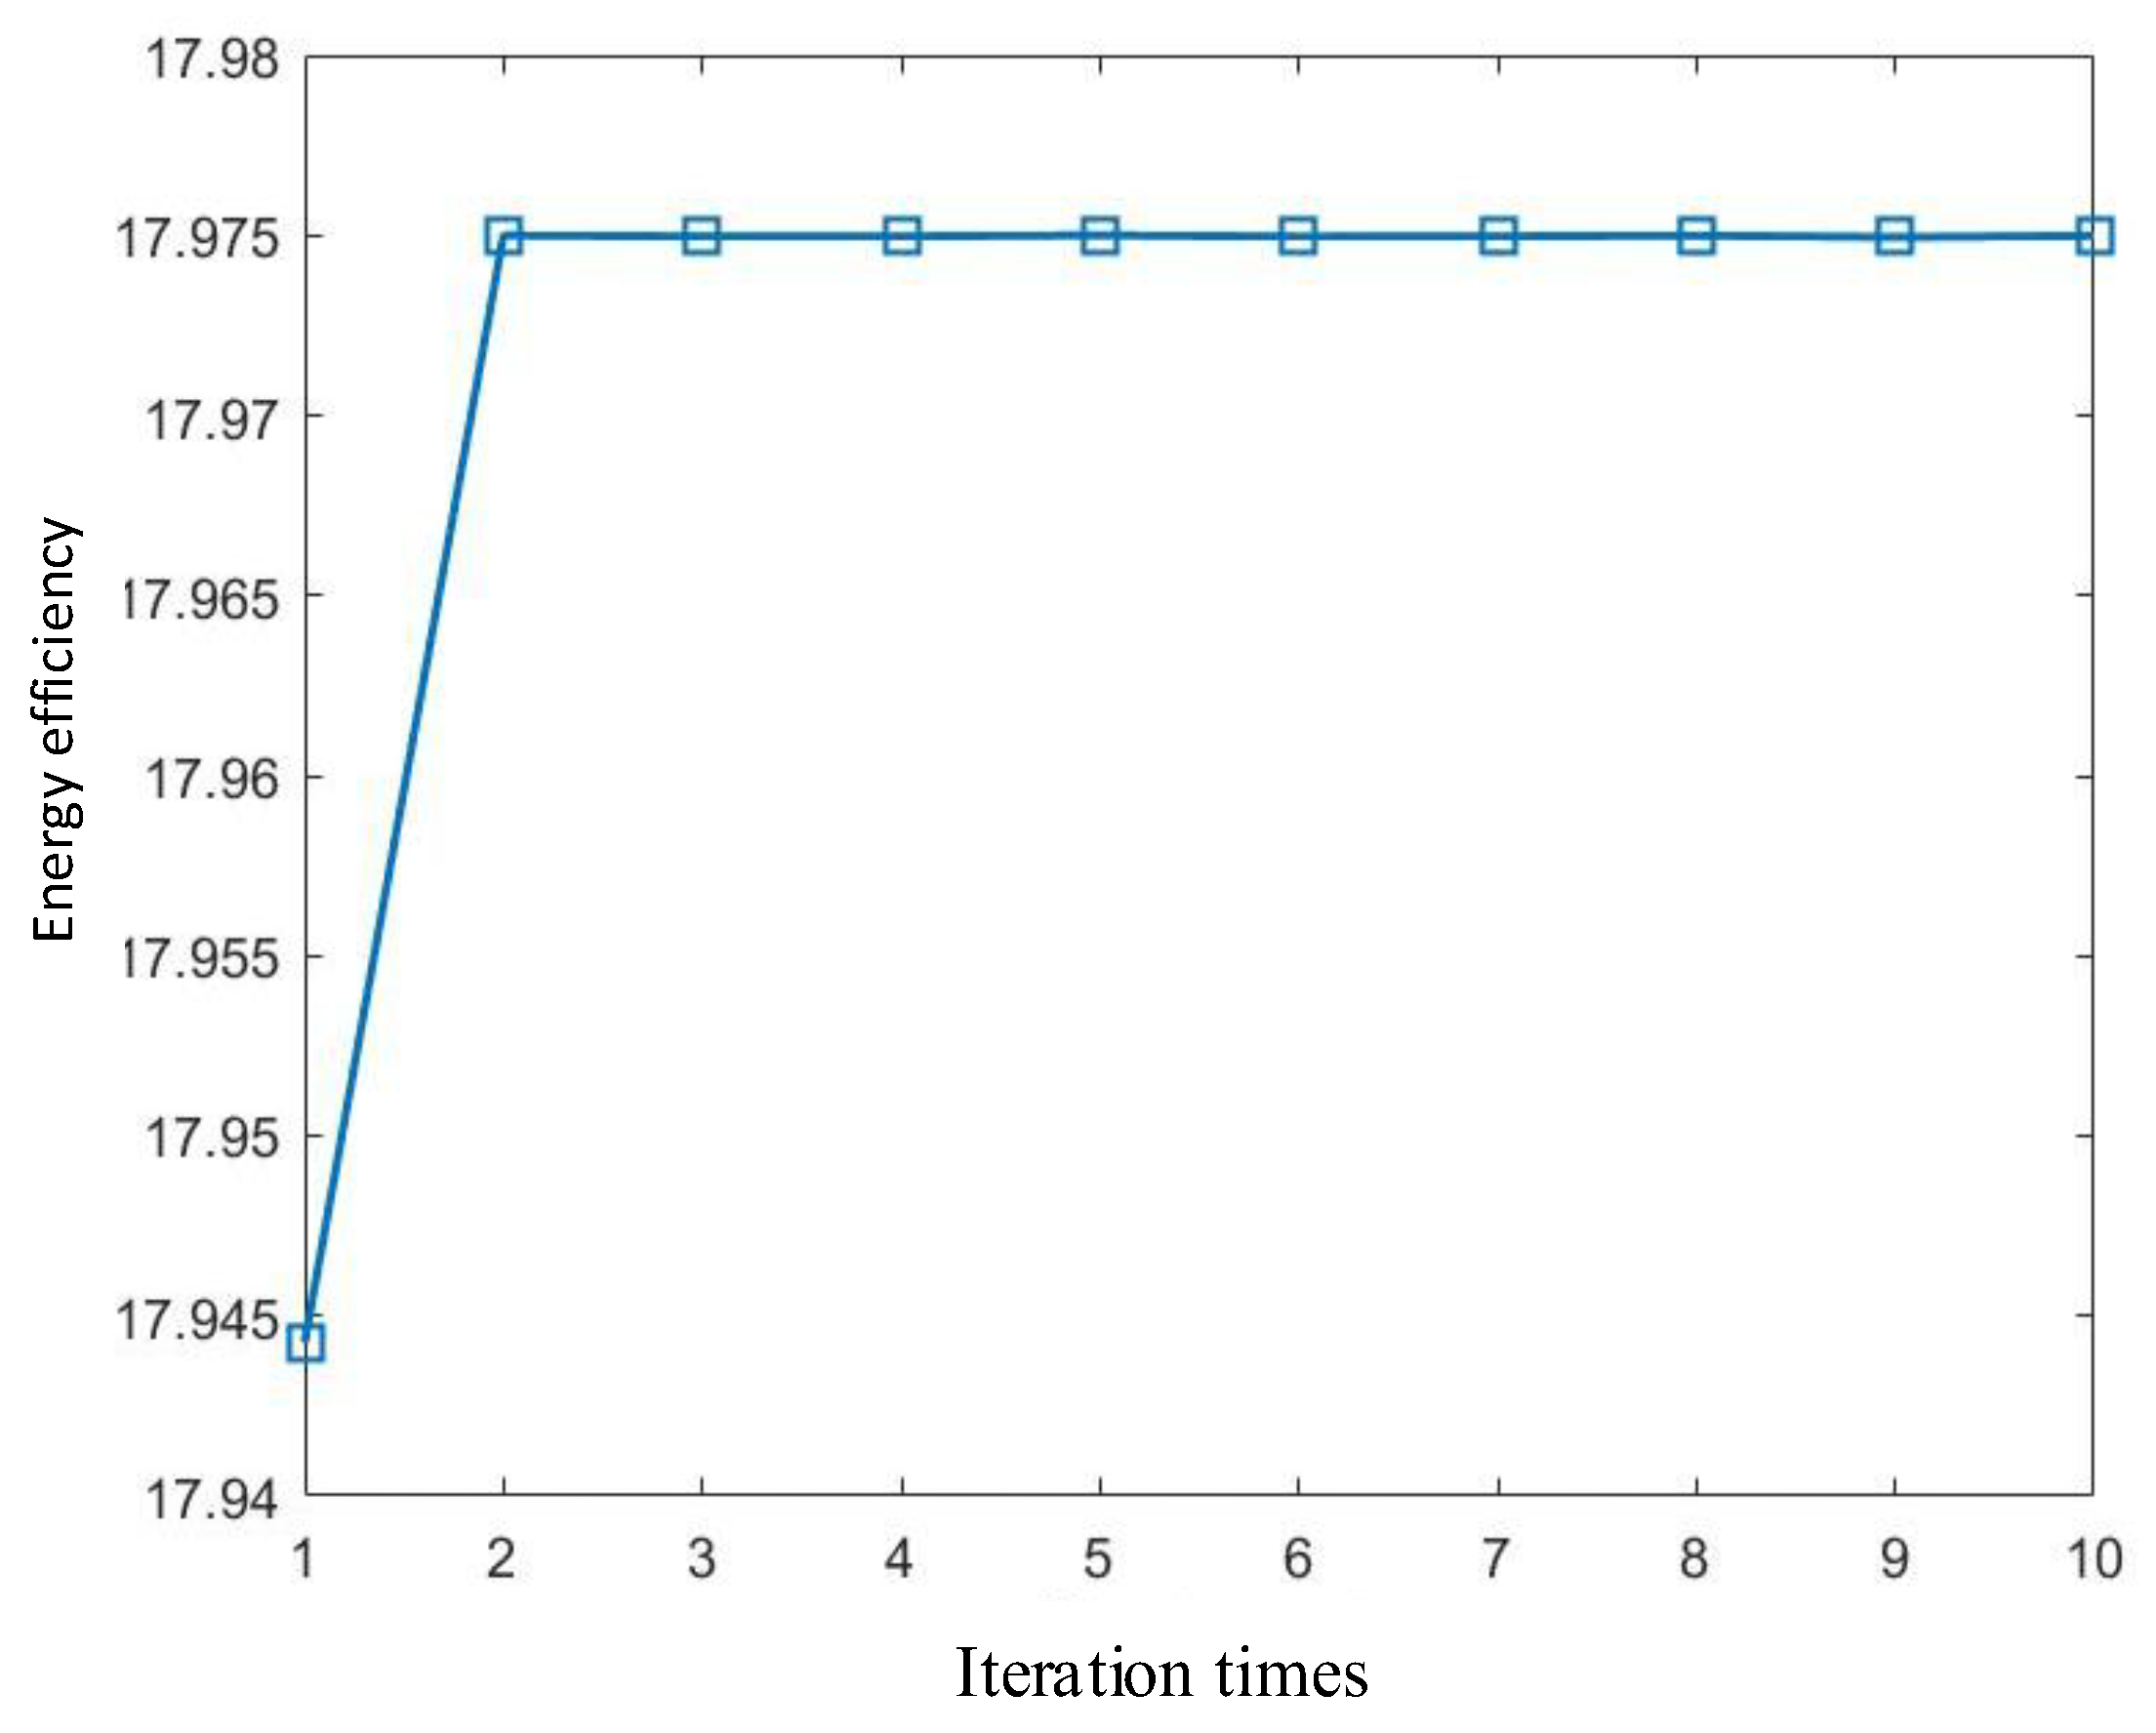
Figure 8.
Relationship Between Energy Efficiency and DRX Cycle Length.
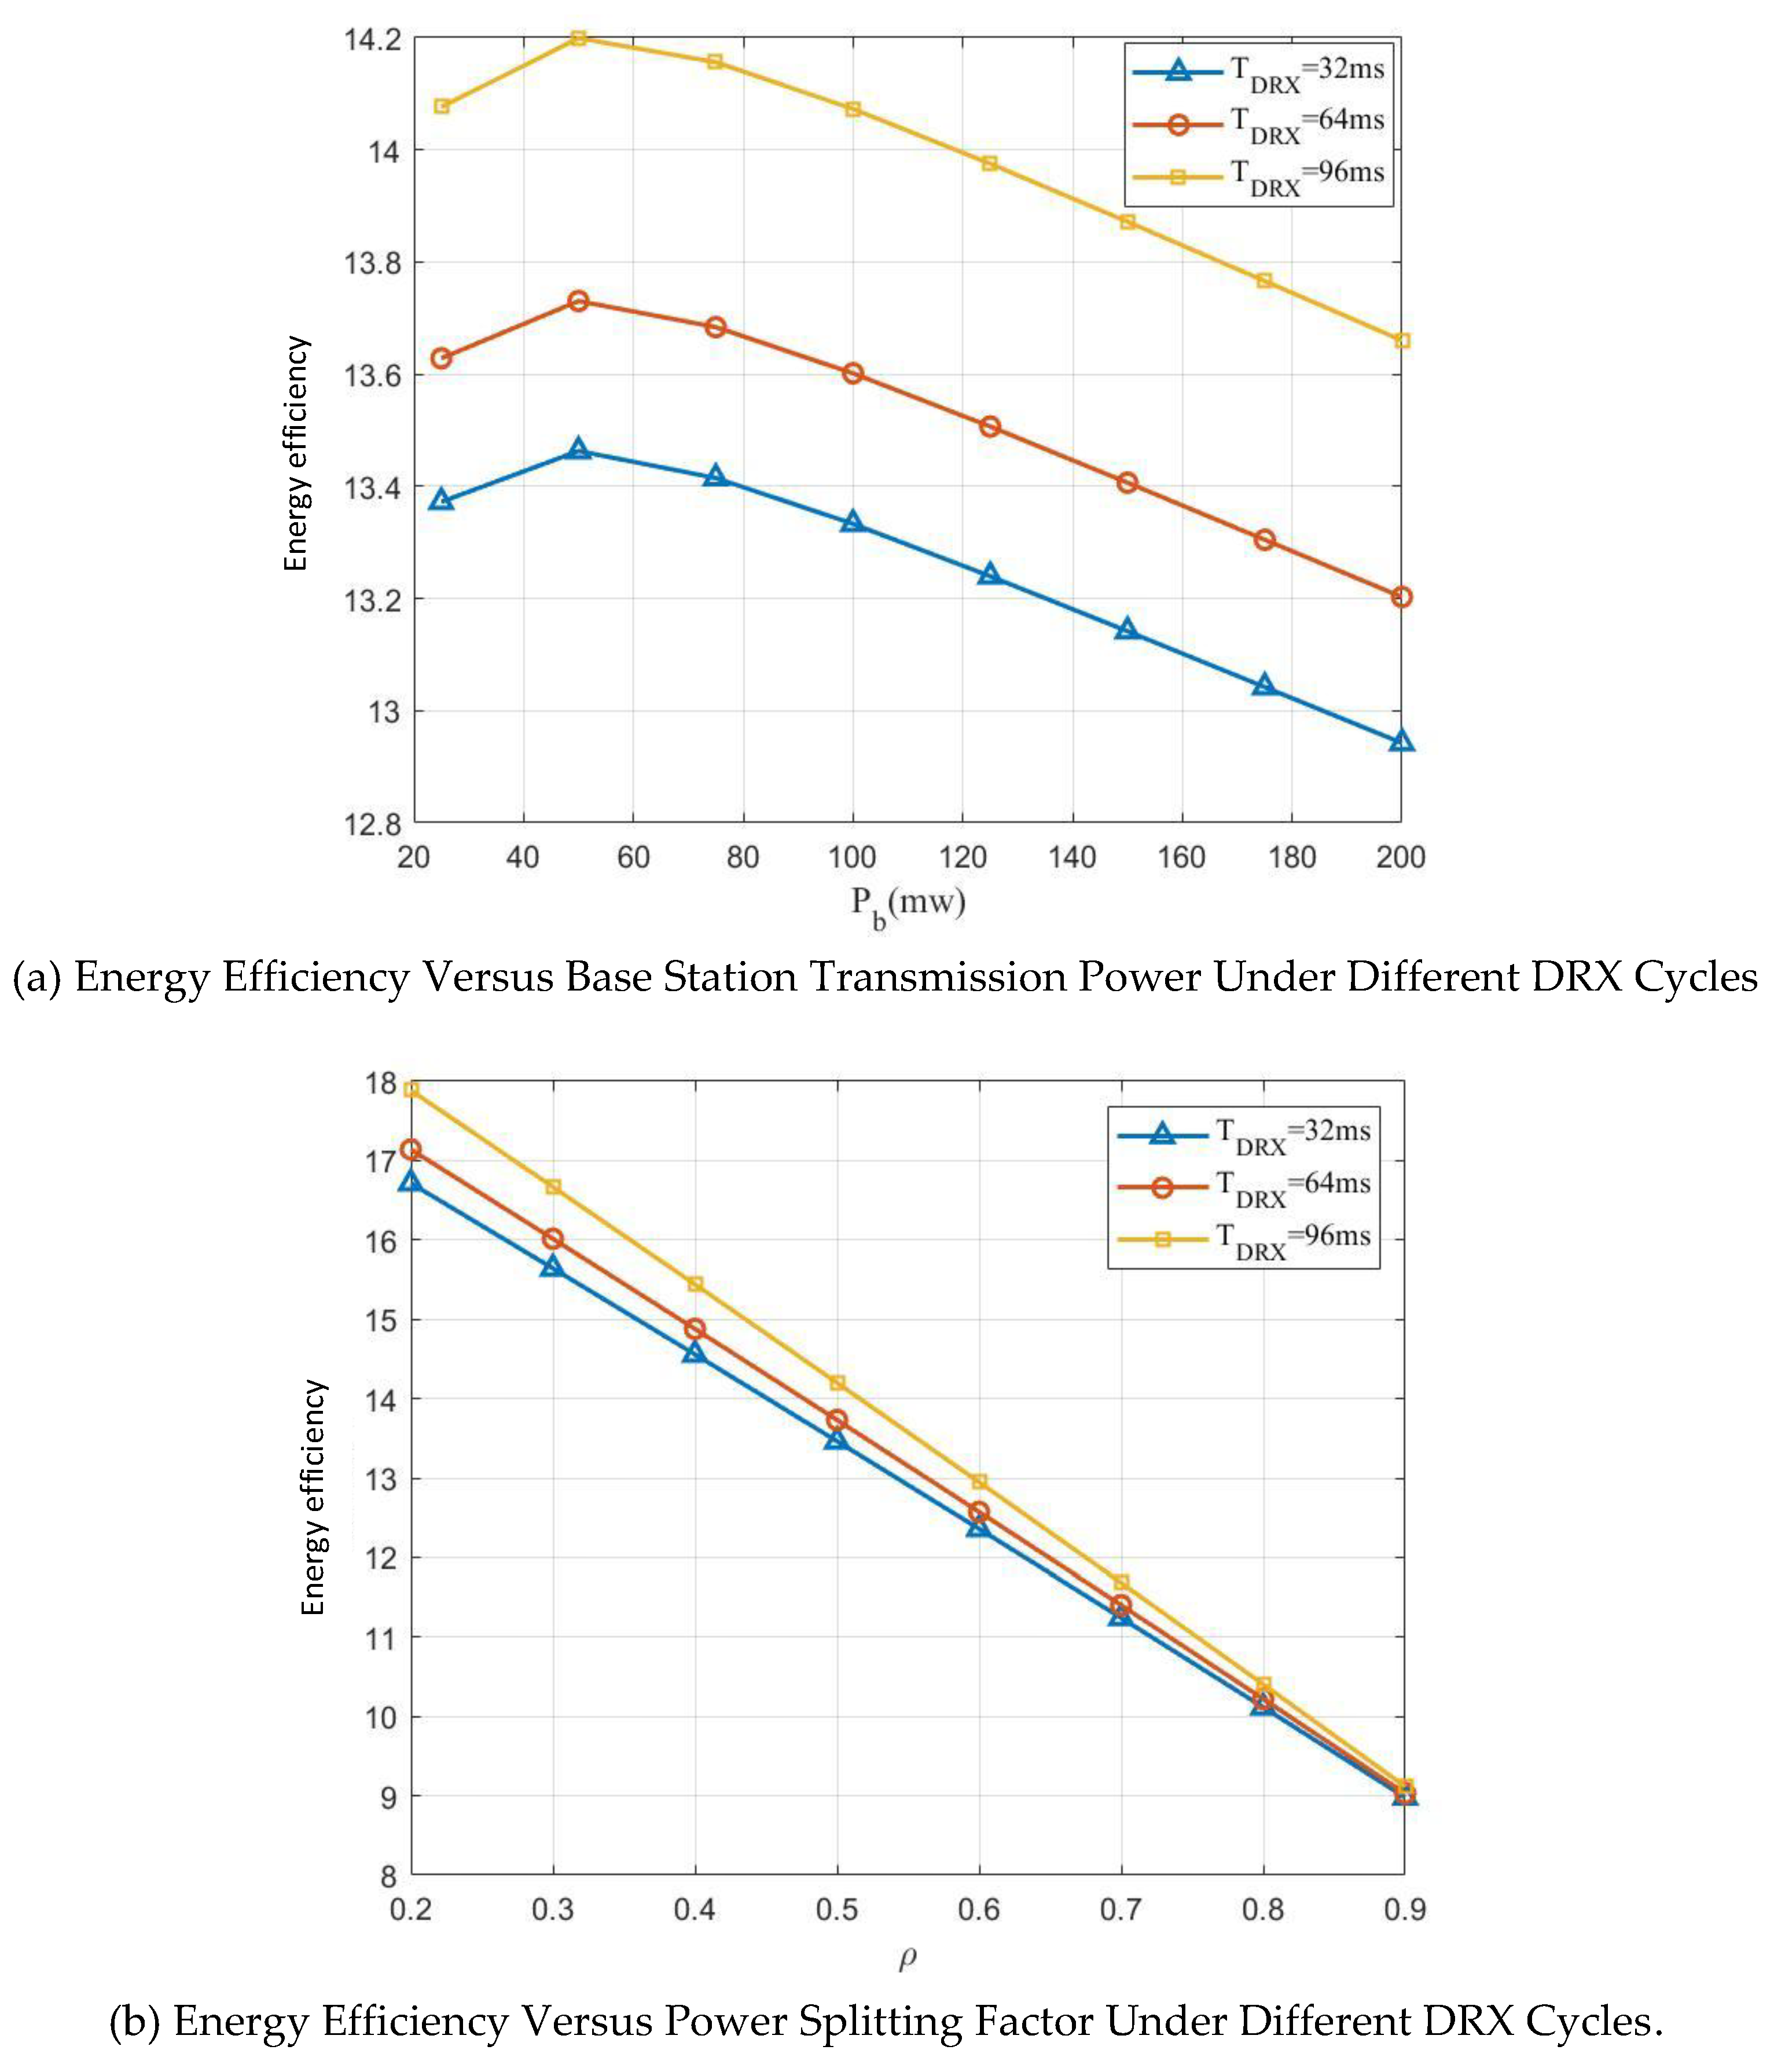

Table 1.
Simulation Parameters.
| Parameter | Symbol | Value |
|---|---|---|
| S-R , R-C, S-C Distance | , , | 12, 16, 20 (m) |
| Channel Coefficient Mean | , , | 1 |
| Noise Power Variance | 0 (dB) | |
| Energy Conversion Efficiency | 0.8 | |
| Backscatter Reflection Coefficient | 0.6 | |
| System Bandwidth | W | 10 (kHz) |
| Path Loss Exponent | 2 | |
| Relay Circuit Power Consumption | 200 () | |
| Source+Receiver Circuit Power | 2 (mw) | |
| Minimum Rate Threshold | 0.5 (bit/s) |
Disclaimer/Publisher’s Note: The statements, opinions and data contained in all publications are solely those of the individual author(s) and contributor(s) and not of MDPI and/or the editor(s). MDPI and/or the editor(s) disclaim responsibility for any injury to people or property resulting from any ideas, methods, instructions or products referred to in the content. |
© 2025 by the authors. Licensee MDPI, Basel, Switzerland. This article is an open access article distributed under the terms and conditions of the Creative Commons Attribution (CC BY) license (http://creativecommons.org/licenses/by/4.0/).
Copyright: This open access article is published under a Creative Commons CC BY 4.0 license, which permit the free download, distribution, and reuse, provided that the author and preprint are cited in any reuse.


