
Submitted:
20 August 2025
Posted:
20 August 2025
You are already at the latest version
Abstract
Trypanosomiasis significantly impacts camel health and productivity, posing a major challenge to food security in regions with large camel populations. This study investigat-ed the microscopic as well as molecular prevalence, phylogenetic analysis, and risk fac-tors associated with Trypanosoma evansi (T. evansi) infection in 400 randomly selected suspected camels (Camelus dromedarius) from 10 districts of Punjab, Pakistan. Blood samples were to microscopic examination of Giemsa / Field’s-stained smears, and a three PCR primer sets (ITS1CF/BR, pMUTec, RoTat 1.2) to detect the presence of T. evansi. PCR-based prevalence was higher (14.8%; CI 11.4-18.6) as compared to the microscopic examination (8.3%; CI 5.7-11.4) of samples. The targeted primers amplified DNA frag-ments of 210, 205, and 478 base pairs, respectively. Phylogenetic analysis showed 100% homology between local isolates and those from India, Sudan, Malaysia, Egypt, and Ken-ya. Risk analysis identified female gender (OR 2.1) and being in Southern Punjab (OR: 1.9) as significant factors associated with disease. Significantly (p < 0.05) reduced total protein (5.51 + 0.05), albumin (2.77 + 0.04), and globulin (2.57 + 0.06) levels were found in PCR positive camels. This study provides new molecular and phylogenetic data on T. evansi in Pakistan.
Keywords:
camel
; T. evansi
; phylogenetic analysis
; risk factors
; serum biochemistry
; Pakistan
1. Introduction
Among the numerous domesticated livestock species, the camel is an important multipurpose animal used for milk, meat, wool and carriage in arid and semi-arid zones of the world. Camels play a significant role for the endurance of the poor people [1]. Camels are well-adapted to desert regions, capable of surviving long periods without water and tolerating wide fluctuations in body temperature. Pakistan ranks 8th in the world, amongst camel rearing nations with 1.1 million heads [2]. Pakistani camel breeds are among the best milk producing breeds in the world [1]. Camel milk plays a significant role in the food chain and disease control strategies due to its exceptional nutritional and therapeutic properties [3].
Camels suffer from various parasitic diseases that affect their health and production. Trypanosomiasis, initially identified in India and referred to as Surra, has now become one of the most significant hemoprotozoan diseases affecting camels worldwide, including in Pakistan [4]. The genus trypanosoma has multiple pathogenic protozoan species like Trypanosoma (T) evansi, T. Brucei, T. vivax, T. equiperdum and T. congolense. All these species have the potential to infect a wide range of domesticated animals, including those of camelid, equine, caprine, ovine, and canine origin [5]. One of the most important haemo-parasite is Trypanosoma evansi affecting the domestic livestock in many countries including south and Central America, Africa and Asia. Biting flies of Tabanidae and Stomoxy species transmit T. evansi to animals and humans [4]. The disease is clinically manifested by anorexia, weight loss, poor body condition, subcutaneous edema, atrophied thigh muscle, pale mucous membrane of conjunctiva, lacrimation, icterus, swelling in testis and nervous signs [6]. The rainy season in Pakistan is considered as surra season as the number of biting flies increases [7].
The monetary effects of this protozoa are often underestimated and include morbidity rates of up to 30%, mortality rates of approximately 3%, and abortion [8]. The condition can manifest in either an acute or chronic form, potentially persisting for several months or even years [9]. Diagnosis of the disease through conventional parasitological diagnostic techniques is better in the acute stage of disease. The chronic stage of trypanosomiasis is distinguished by low levels of parasitemia, making a reliable parasitological diagnosis challenging [10]. Polymerase chain reaction (PCR) is performed for diagnosis and identification of the specific protozoan species. This technique is helpful in confirmation of diseased animals as well as identification of carrier stage. PCR is a highly specific and sensitive diagnostic tool, commonly employed for the confirmation of blood parasites [11].
Although various studies to investigate prevalence of T. evansi were conducted in different camel populated areas of Pakistan [12,13,14,15,16,17], precise and concise information about the infection over a wider geographical area is scarce. This study aimed to investigate the presence of the disease using a sensitive and efficient polymerase chain reaction (PCR) technique, and to examine the genetic relationships between local isolates and existing species available in GenBank, including their DNA sequences. Furthermore, the study assessed the sero-biochemical parameters of camels and examined the association of various hypothesized risk factors influencing the spread of camel trypanosomiasis in the targeted regions.
2. Materials and Methods
2.1. Study Area and Sample Collection
The study was conducted in the Punjab province of Pakistan. Ten districts included in this study were from Northern (Mianwali and Khushab), Central Punjab (Bhakkar, Faisalabad and Jhang) and Southern (Bahawalnagar, Bahawalpur, Layyah, Muzaffargarh and Rajanpur) provincial zones (Figure 1 & Table 3). The estimated camel population of the study area was 96966 camels [18].
The minimum required sample size (n = 385) was calculated for a disease with 50% expected prevalence, 95% confidence level and 5% desired absolute precision [19]. During this study, blood samples (n=400) were randomly collected from camels of various ages and sex across 10 districts of Punjab, Pakistan. The random sampling procedure was used to seek a representative inclusion of camels across all zones, with each zone contributing proportionally to the required sample size.
Samples were collected from camels suspected of haemoparasitic infection based on clinical history and signs (fever, wight loss, lethargy, emaciation etc.) regardless of breed, age or sex. Approximately 10 ml blood was drained from jugular vein by a sterile syringe. Camel blood was transferred into a sterile K3. EDTA (Ethylene di-amine tetra acetic acid) tube (Atlas Medo-O-Vac FranciscoR) for microscopy and PCR while 7 ml was transferred into a plain vacutainer (Bio-vacTm) for serum separation [20]. Two apparently healthy and PCR negative camels from each district were included as controls. Preserved blood samples were transported to Molecular Parasitology Laboratory (UVAS, Lahore) in ice boxes. Data on all relevant variables, including age, sex, locality, physical appearance, tick infestation, previous illness, deworming status, herd size and management, were collected using a pre-designed survey form during the sampling process for the investigation and assessment of risk factors associated with T. evansi infection in studied camels.
2.2. Microscopic Examination
Thin and thick blood smears were processed, after fixation stained by Giemsa/Field stain. Primary screening of blood smear was conceded by using light microscopy at 40X and 100X according to the method described by Hoare to identify trypanosomes [21]. Blood samples having trypanosomes were recorded as positive and preserved at -20 0C until further analysis.
2.3. DNA Extraction and PCR Amplification
All collected blood samples (n=400) were used for DNA extraction using WizPrep™ gDNA Mini kit (Catalog. No; 4C0818-09) following the manufacturer’s instructions. Purity and concentrations of DNA extracted from the samples were calculated using nano drop and gel electrophoresis techniques, as described previously [22]. For DNA amplification and molecular detection of trypanosomes, PCR was performed using three sets of primers targeting variable genes (Table 1).
The primers specified in the table were employed to amplify DNA fragments under the following PCR cycling conditions. For ITS1CF/BR primers [23], the reaction began with an initial denaturation step at 95°C for 3 minutes, followed by 35 cycles of denaturation at 95°C for 30 seconds, annealing at 58°C for 30 seconds, extension at 72°C for 30 seconds, and a final extension at 72°C for 7 minutes. For the pMUTec primers [24], the cycling protocol included an initial denaturation at 94°C for 3 minutes, followed by 35 cycles of denaturation at 94°C for 30 seconds, annealing at 60°C for 30 seconds, extension at 72°C for 30 seconds, and a final extension at 72°C for 5 minutes. Similarly, for RoTat 1.2 primers [25], the PCR conditions involved an initial denaturation step at 94°C for 3 minutes, 35 cycles of denaturation at 94°C for 30 seconds, annealing at 58°C for 30 seconds, extension at 72°C for 30 seconds, and a final extension at 72°C for 7 minutes.
The PCR reactions were carried out in a 25 µL total volume consisting of 12.5 µL of PCR Master Mix (including Taq DNA polymerase, dNTPs, MgCl₂, and buffer), 1 µL of each primer (10 µM), 2 µL of DNA template (50–100 ng/µL), and nuclease-free water to reach the final volume. Positive controls included DNA extracted from confirmed Trypanosoma-positive samples, while negative controls consisted of nuclease-free water in place of the DNA template. Both positive and negative controls were incorporated in every reaction to ensure accuracy and avoid contamination.
2.4. Gel Electrophoresis
Agarose gel (1.5%) was processed as well as stained with ethidium bromide to evaluate the amplicons generated by PCR. The electrophoresis was executed at 113 volts, 230mA for 35 minutes to foresee the amplified product in gel documentation system (Bio Rad Laboratories, USA). DNA ladder of 100 bp (Thermo Scientific TM) was run along with PCR amplicon as molecular weight marker [26].
2.5. Sequencing and Phylogenetic Analysis
The presence of T. evansi was confirmed by sequencing. Twelve randomly selected PCR positive products were purified by GeneJET Gel Extraction Kit (Catalog. No; 00520774) according to the manufacturer's instructions i.e., from Lab Genetix (Pakistan). Sequencing was performed unidirectionally using the Sanger method, where DNA was read from a single end. The sequence analysis of the respective target regions using ITS1CF/BR, pMUTec (F/R) and RoTat1.2 (F/R) primers was performed. The obtained oligonucleotide sequences were entered on NCBI (National Center for Biotechnology Information) in BLAST (Basic Local Alignment Search Tool) to match with existing sequences in the GenBank. All deposited sequences were assigned accession numbers. Allied sequences were recuperated from GenBank after carrying out a BLAST search, aligned via MUSCLE to create phylogenetic using maximum likelihood technique applying Neighbor-Join (Ibrahim et al., 2017).

Table 2.
GenBank Accession Nos. of Query Sequences.
| Accession No/ ID | Parasite spp. |
|---|---|
| ON868415 | Trypanosoma evansi |
| ON868416 | Trypanosoma evansi |
| ON868417 | Trypanosoma evansi |
| ON868418 | Trypanosoma evansi |
| MZ209177 | Trypanosoma evansi |
| MZ209178 | Trypanosoma evansi |
2.6. Serum Biochemistry
Serum was separated from the collected samples and stored at −20°C until further analysis. Biochemical analyses were performed using a clinical chemistry analyzer (Metrolab 1600 DR) following the manufacturer’s instructions. The parameters assessed included serum total protein, albumin, A/G ratio, and glucose. The serum total protein concentration was determined using the biuret method, and albumin was quantified using the bromocresol green dye-binding method. The A/G ratio was calculated by dividing the albumin concentration by the globulin concentration (globulin = total protein − albumin). Glucose levels were measured using the glucose oxidase-peroxidase (GOD-POD) method. The values obtained for infected camels were compared to those of PCR negative camels.
2.7. Statistical Analysis
Statistical analyses were conducted using the R programming language (version 4.5.1). Prevalence percentages, along with their corresponding 95% binomial exact confidence intervals (CI), were calculated. Univariable analysis was conducted to determine variables associated with prevalence. Categorical variables were analyzed using both the Chi-square test and Fisher's exact test, and odds ratios with confidence intervals were calculated. All variables yielding p-values less than equal to 0.25 were included in binary logistic regression analysis. A backward stepwise approach was subsequently employed to remove confounders (p > 0.05), thereby retaining only variables showing significant associations in the final model [27]. Model fit was assessed using the Hosmer-Lemeshow test and Nagelkerke R-square values. Agreement between the two diagnostic tests (microscopy and PCR) was evaluated using Cohen's Kappa statistic. Comparisons of serum biochemical parameters were made using t-tests. Map construction was carried out with ArcGIS software.
3. Results
3.1. Microscopic Findings
Microscopy of stained blood smears revealed Trypanosoma characterized by a long slender free flagellum at extracellular space (Figure 2). Microscopic examination identified 33 positive samples out of 400, resulting in an overall prevalence of 8.3% (CI 5.7-11.4). The prevalence varied across districts, with the highest rates observed in Bahawalpur (14.3%) and Rajanpur (14%), followed by other districts with progressively lower rates. Fisher’s exact test (FET) indicated the prevalence differences between districts was not significant, p = 0.293 (Table 3).
Table 3.
District wise infection rate of trypanosomiasis in Camels by microscopy (n=400).
| District | Camel Population (LSC 2018) |
Tested | Microscopy | PCR | ||
|---|---|---|---|---|---|---|
| Positive | Prev. % (95% CI) |
Positive | Prev. % (95% CI) |
|||
| Jhang | 1265 | 39 | 0 | 0 (0-9) | 1 | 2.6 (0.1-13.5) |
| Faisalabad | 687 | 15 | 1 | 6.7 (0.2-31.9) | 2 | 13.3 (1.7-40.5) |
| Bhakkar | 5310 | 90 | 7 | 7.8 (3.2-15.4) | 14 | 15.6 (8.8-24.7) |
| Mianwali | 1886 | 41 | 2 | 4.9 (0.6-16.5) | 4 | 9.8 (2.7-23.1) |
| Khushab | 3712 | 40 | 2 | 5 (0.6-16.9) | 4 | 10 (2.8-23.7) |
| Rajanpur | 7594 | 86 | 12 | 13.9 (7.4-23.1) | 19 | 22.1 (13.9-32.3) |
| Muzaffargarh | 1687 | 38 | 4 | 10.5 (2.9-24.8) | 5 | 13.2 (4.4-28.1) |
| Bahawalpur | 1078 | 14 | 2 | 14.3 (1.8-42.8) | 4 | 28.6 (8.4-58.1) |
| Bahawalnagar | 681 | 22 | 2 | 9.1 (1.1-29.2) | 5 | 22.7 (7.8-45.4) |
| Layyah | 3155 | 15 | 1 | 6.7 (0.2-31.9) | 1 | 6.7 (0.2-31.9) |
| Total | 27055 | 400 | 33 | 8.3 (5.7-11.4) | 59 | 14.8 (11.4-18.6) |
Microscopic prevalence was not significantly different among different sampled districts of Punjab, FET, p = 0.293. PCR based prevalence was not significantly different among different sampled districts of Punjab, FET, p = 0.097.
3.2. Molecular Detection Through PCR
PCR (Figure 3, Figure 4 and Figure 5) revealed 59 (14.8%, CI 11.4-18.6) positive samples (Table 3). The prevalence recorded in different districts was not significantly different (FET, p = 0.097). Consistent with the microscopic findings, Bahawalpur exhibited the highest value (28.6%, CI 8.4–58.1), while Jhang reported the lowest (2.6%, CI 0.1–13.5), where no positive samples were detected by microscopy.
3.3. Comparison of the Diagnostic Performance
Out of 400 samples, 33 were positive and 367 were negative on microscopy, whereas 59 positive and 341 negative were recorded by PCR. The comparison of Microscopy against PCR (assumed as the gold standard) revealed a low positive predictive value (24.2%), as many microscopy positives were PCR negative. The negative predictive value was better at 86.1%, making Microscopy more reliable for ruling out T. evansi than confirming it. The observed agreement was 81.0%, however, the Kappa statistic of 0.076 showed only slight agreement between the two tests, p = 0.108 (Table 4 and Table 5).
3.4. Phylogenetic Analysis
3.5. Risk Factors Associated with T. evansi Prevalence
To identify significant variables for performing a binary logistic regression, a univariable analysis was performed on 12 variables (Table 6). District data was further categorized in zones depending on the location. Age (3 groups) and herd size (4 groups) were also categorized in different groups. The analysis indicated that prevalence of T. evansi was associated with gender. Camels from southern Punjab (19.4%, CI 13.8-23.7) districts were found more likely (OR 1.9, CI 1.10-3.38) to test positive. Female camels had higher PCR based prevalence (18.3%, CI 13.7-23.7) and their odds for testing positive were significantly (p = 0.01) higher as compared to males (OR 2.4, CI 1.22-4.51). The prevalence was significantly (p < 0.01) high in tick infested camels (20.7%, CI 15.4-26.8) and they were 2.9 times more likely to test positive. Camels kept under desert housing conditions with sandy floors had significantly (p = 0.003) higher prevalence of T. evansi (19.6%, CI 14.5-25.6), and were found 2.4 times more likely to test positive. Although, numerical differences were observed but the analysis showed no significant (p > 0.05) association between T. evansi prevalence and age groups, physical appearance, presence of other livestock, fly control, feeding and watering practice, purpose and herd sizes (Table: 6). Prior to moving forward with multivariable analysis collinearity was checked. No evidence of multicollinearity was recorded among predictors.
All variables with p < 0.25 were included in the initial binary logistic regression model and a backward stepwise exclusion method was used to remove non-significant (p > 0.05) variables until only significant (p < 0.05) variables were retained. The final model indicated that camels from southern Punjab (OR 1.9, CI 1.05-3.35), female camels (OR 2.2, CI 1.11-4.24), those with tick infestation (OR 2.6, CI 1.37-4.79) and kept on the sand-based housing (OR 2.2, CI 1.16-3.99) were more likely to test positive for the T. evansi in the sampled population (Table 7). The model explained 12.8% of the variation (Nagelkerke R² = 0.128), and the Hosmer–Lemeshow test (χ² = 7.038, p = 0.533) showed a good fit between predicted and observed outcomes.
3.6. Serum Biochemical Findings
An Independent t-test revealed significant differences in serum biochemical parameters between T. evansi infected camels (n=59) and healthy controls (n=339). PCR positive camels had significantly (p < 0.01) lower levels of total protein, albumin and globulin values when compared with those who were found negative. These findings indicated that T. evansi infection significantly altered the serum protein profile in positive camels (Table 8).
4. Discussion
The camel contributes imperatively to socioeconomic elevation of a state both as draught animals and as a protein source. Protozoan diseases cause massive economic losses by influencing the value of milk, meat as well as other byproducts of animals [28,29,30]. Among protozoan diseases, trypanosomiasis or ‘Surra’ is principally important and serious pathogenic protozoan disease of camels. There are several trypanosome species affecting livestock, and amongst them, T. evansi is the most prevalent in camels [9,31,32]. In Pakistan, Surra causes substantial sickness and death in camels and is ranked as the top priority among camel diseases.
Diagnosis of trypanosomiasis in animals is challenging due to the parasitemic fluctuations, aparasitaemic intervals and difficulty in direct detection of parasite, especially in the sub-patent phase of infection [33]. The blood smear uses a small sample, requires an expert diagnostician, and offers a straightforward way to directly identify haemo-flagellates. It is a confirmatory method, and a procedure used to detect protozoans in field conditions, although it has lower sensitivity compared to other molecular diagnostic techniques. Comparison with microscopic blood smears, the PCR has demonstrated greater sensitivity, so it is widely endorsed for the diagnosis of trypanosomiasis [29].
Furthermore, PCR-based methods of detection have a greater accuracy than conventional microscopic methods and are deliberated as the ‘gold standard’ for the diagnosis of parasitic infections [34]. For molecular detection of T. evansi numerous sequences i.e., internal spacer transcribed region (ITS) [23], ribosomal DNA, kinetoplast DNA [35], and variable surface glycoprotein (VSG) [36], are considered reliable gene targets. In the present study PCR were performed using three sets of primers ITS1CF/BR, Rotat 1.2 F/R and pMUtec F/R targeting variable genes with DNA’s extracted from camel blood samples. PCR technique was found much more sensitive by all three sets of primers than the microscopic observation of blood smear. PCR results revealed an overall infection rate of camel trypanosomiasis 14.8% which was higher than microscopic findings (8.3%). These findings corroborate with [37] who determined overall infection of trypanosomiasis in Palestine 17% and 2.7% through PCR and microscopy, respectively. In another study, conducted in Somalia, the presence of trypanosoma was detected in samples that were negative by microscopic examination [38]. Similar findings were reported from the studies conducted in Nigeria [39] and Algeria [40]. The difference between the results of microscopy and molecular examination could be due to low levels of circulating parasites in early phase of infection or chronic infection [41]. Moreover, the parasite is mostly visible in the blood smears in febrile phase of disease. Therefore, due to being chronic in nature trypanosomiasis often remains undetected by microscopy (Elhaig et al., 2013; Salah et al., 2019). T. evansi was the single species documented as a major cause of camel trypanosomiasis in the investigation areas by ITS1CF/BR, Rotat 1.2 and pMUtec was in accordance with studies from Egypt [42] and Pakistan [15].
In current study, microscopic examination of thin blood smear and DNA based molecular assay such as PCR revealed the presence of T. evansi in camels (Camelus dromedarius). The overall rate of infection of T. evansi among 400 suspected camels from ten districts of Punjab was 8.3% by microscopic analysis of stained blood smears and 14.8% by PCR. Both microscopic (5.3%) and PCR-based (11.1%) prevalence were lower in the camels of districts belonging to Northen Punjab indicating that camels of Southern Punjab were more at risk. The Giemsa-stained blood smear (GSBS) based prevalence (8.3%) of T. evansi in the sampled camels was in accord with the studies conducted in Cholistan desert area [7,12,13]. These studies reported the microscopic prevalence ranged between 9.7 to 5.4%. However, a higher prevalence of T. evansi using GSBS was also reported as 19% in Faisalabad [43], 32.5% in Attock [44], 45.8% in Southern Punjab [17] and 11.3% in Sindh province [45]. Whereas a lower rate of 0.7% was also reported in Cholistan desert [15], and 3.6% in Khushab district [46]. The PCR based prevalence (14.8%) found in this study was lower than past studies with reports of 28.2% in Balochistan [47], 39.3% in Cholistan desert [13]. Moreover, district wise prevalence by RoTat 1.2 PCR from district Bahawalpur (28.6%) and Bahawalnagar (22.7%) in the current investigation was higher when compared with previous studies [15,17]. The differences observed in prevalence could be attributed to the differences in the study designs, tests employed, sampling seasons and the sampling strategies used in these studies. Furthermore, selection of camels suspected of T. evansi infection could have inflated prevalence estimates in this study. Moreover, the cross-sectional design did not allow us to investigate for the seasonal variations caused by the fluctuations in vector density.
Globally, higher rates of T. evansi prevalence were recorded in various countries over different periods; 15.5% in Iran [48], 18% in UAE [49], 12.2% in Egypt [50], 20.9% and 23.4% in Egypt [51,52], 25.8% in Iran [53], 26.4% in Somaliland [54], and 31.5% in Nigeria [55]. Conversely, the lower rates were reported from 5.3% in Nigeria [39], 2.7% in Palestine [37], 2.4% in Algeria [40] and 2.3% in Kenya [56]. Variations in infection rates may be attributed to several factors, such as climatic conditions, seasonal changes in sampling areas, animal population density, types of camel housing systems, differences in vector prevalence, availability of health care and diagnostic services, hygiene practices, or diversity in sample size [23].
The present research found that female camels were 2.1 times more likely to be positive indicating that gender is a significant (p = 0.03) risk factor. This result agreed with the findings reported by other studies from Egypt [31], KSA [57], Iran [53] and Pakistan [15], but did not coincide with others reported from Pakistan [47], Oman [58] and Ethiopia [59] that reported higher prevalence in male camels. Non-significant gender association with the T. evansi prevalence was also reported by the studies from Pakistan [7,35], Palestine [37] and Tunisia [32]. Variations in study design and diagnostic methodologies may account for the observed inconsistencies in research findings. The elevated prevalence in female camels identified in this study may be attributable to factors such as reproductive and lactational stress, hormonal influences, and differing management practices, all of which can affect exposure patterns, compromise immune function, and elevate disease risk [54].
Tick infestation (OR2.6: CI 1.37-4.79) was significantly associated with T. evansi prevalence (P = 0.003), but this may be confounded by other factors. There is no scientific evidence that ticks transmit T. evansi; rather, their presence may indicate environmental conditions favorable to biting flies, which also thrive in warm, humid areas [9]. Additionally, tick infestation can cause anaemia and immunosuppression in camels, making them more susceptible to T. evansi infection [60].
Camels managed under arid sand-based housing systems demonstrated a 2.2-fold increased likelihood of testing positive for T. evansi (p = 0.01). Several potential confounding factors may account for this association, including the prevalence of nomadic pastoralism with extensive grazing [61], limited access to management and healthcare facilities [15], the use of communal water sources [62], and a higher density of vector populations in these environments. Additionally, animals with outdoor browsing habits may face elevated risk compared to those primarily browsing indoors due to greater exposure to vectors [63].
The serum biochemical analysis of infected (PCR positive) camels showed a significant (P<0.01) decrease in total protein, albumin and globulin values, which is in accord with studies conducted in camels [7,64], cattle [65], dogs [66] and rabbits [67]. However, these results were in contrast with those reported in camels [68] and buffaloes [69] showing increased and no significant change in protein levels with T. evansi infection. The decrease in protein levels could be due to the severe hepatic degeneration and/or hypoxia in parasitic infection leading to hepatic necrosis and hypoalbuminemia [7,64]. With hyperglobulinemia in trypanosomiasis, hypoalbuminemia could be a compensatory practice to sustain osmolality [70].
5. Conclusions
T. evansi (Surra) can significantly affect the economic stability of camel rearing communities, who are dependent on these animals. Unlike earlier studies limited to one or a few districts in Punjab and other provinces of Pakistan, this is the first to combine multi-primer PCR detection, phylogenetic analysis, and risk factor evaluation of T. evansi across 10 major camel-rearing districts of Punjab, Pakistan. The results suggest that PCR diagnosis is a reliable tool for monitoring T. evansi infection in camels. However, the study’s cross-sectional design and sampling bias may reduce the generalizability of prevalence estimates. Improving housing and health management for female camels is important, as they are at higher risk. It also did not consider seasonal changes in vector activity. Since, T. evansi affects multiple species, future research should investigate mixed herds to clarify its epidemiology in Pakistan. Nationwide efforts to enhance diagnosis, treatment, and control are essential to reduce the disease's economic impact.
Author Contributions
Conceptualization, M.A.H. and F.A.; Methodology, M.S. and M.A.H.; Software, M.H.H.; Validation, M.H.H., A.A.B. and M.M.; Formal Analysis, M.A.H. and M.H.H.; Investigation, F.A, A.H. and A.S.; Resources, M.S. and A.A.B.; Data Curation, M.H.H.; Writing – Original Draft Preparation, M.A.H., M.S. and M.H.H.; Writing – Review & Editing, A.A.B, F.A. and M.S.; Visualization, A.S., F.A., M.M. and A.H.; Supervision, M.A.H.
Funding
This research received no external funding.
Institutional Review Board Statement
The animal study protocol was approved by the Ethical Review Committee of the University of Veterinary and Animal Sciences, Lahore, Pakistan (Permit No. ERC-3355).
Data Availability Statement
The corresponding author can provide the dataset used in this study upon request. The data presented in this study are available in NCBI Genbank at [https://www.ncbi.nlm.nih.gov/genbank/about/], reference number [MZ209177.1, MZ209178.1].
Acknowledgments
NA.
Conflicts of Interest
The authors declare no conflicts of interest.
Abbreviations
The following abbreviations are used in this manuscript:
| T. evansi | Trypanosoma evansi |
| FAT | Fisher’s Exact Test |
| PCR | Polymerase chain reaction |
| DNA | Deoxyribonucleic acid |
| BLAST | Basic Local Alignment Search Tool |
| CI | 95% binomial exact confidence interval |
| PC | Positive control |
| NC | Negative control |
| CP | Control positive |
| CN | Control negative |
| MS | Microscopy |
| OR | Odds Ratio |
| GSBS | Giemsa-stained blood smears |
References
- Ahmad, S.; Kour, G.; Singh, A.; Gulzar, M. Animal Genetic Resources of India - An Overview. International Journal of Livestock Research 2019, 9, 1. [Google Scholar] [CrossRef]
- Faraz, A.; Mustafa, M.I.; Lateef, M.; Yaqoob, M.; Younas, M. Production Potential of Camel and Its Prospects in Pakistan. Punjab Univ. J. Zool 2013, 28, 89–95. [Google Scholar]
- Alhassani, W.E. Camel Milk: Nutritional Composition, Therapeutic Properties, and Benefits for Human Health. Open Vet J 2024, 14, 3164. [Google Scholar] [CrossRef] [PubMed]
- Kula, J.; Nejash, A.; Golo, D.; Makida, E. Camel Trypanosomiasis: A Review on Past and Recent Research in Africa and Middle East. Am. J. Sci. Res 2017, 12, 13–20. [Google Scholar] [CrossRef]
- N’Djetchi, M.K.; Ilboudo, H.; Koffi, M.; Kaboré, J.; Kaboré, J.W.; Kaba, D.; Courtin, F.; Coulibaly, B.; Fauret, P.; Kouakou, L.; et al. The Study of Trypanosome Species Circulating in Domestic Animals in Two Human African Trypanosomiasis Foci of Côte d’Ivoire Identifies Pigs and Cattle as Potential Reservoirs of Trypanosoma Brucei Gambiense. PLoS Negl Trop Dis 2017, 11, e0005993. [Google Scholar] [CrossRef]
- Olani, A.; Habtamu, Y.; Wegayehu, T.; Anberber, M. Prevalence of Camel Trypanosomosis (Surra) and Associated Risk Factors in Borena Zone, Southern Ethiopia. Parasitol Res 2016, 115, 1141–1147. [Google Scholar] [CrossRef]
- Hussain, R.; Khan, A.; Abbas, R.Z.; Ghaffar, A.; Abbas, G.; Rahman, T.; Ali, F. Clinico-Hematological and Biochemical Studies on Naturally Infected Camels with Trypanosomiasis. Pak. J. Zool 2016, 48, 311–316. [Google Scholar]
- Abera, Z.; Box, P.O.; Usmane, A.; Ayana, Z. Review on Camel Trypanosomosis: Its Epidemiology and Economic Importance. Acta Parasitol. Glob 2015, 6, 117–128. [Google Scholar]
- Aregawi, W.G.; Agga, G.E.; Abdi, R.D.; Büscher, P. Systematic Review and Meta-Analysis on the Global Distribution, Host Range, and Prevalence of Trypanosoma Evansi. Parasit Vectors 2019, 12, 67. [Google Scholar] [CrossRef]
- Ramírez, J.D.; Herrera, G.; Hernández, C.; Cruz-Saavedra, L.; Muñoz, M.; Flórez, C.; Butcher, R. Evaluation of the Analytical and Diagnostic Performance of a Digital Droplet Polymerase Chain Reaction (DdPCR) Assay to Detect Trypanosoma Cruzi DNA in Blood Samples. PLoS Negl Trop Dis 2018, 12, e0007063. [Google Scholar] [CrossRef]
- Kidambasi, K.O.; Masiga, D.K.; Villinger, J.; Carrington, M.; Bargul, J.L. Detection of Blood Pathogens in Camels and Their Associated Ectoparasitic Camel Biting Keds, Hippobosca Camelina: The Potential Application of Keds in Xenodiagnosis of Camel Haemopathogens. AAS Open Res 2019, 2, 164. [Google Scholar] [CrossRef] [PubMed]
- Ashraf, S.; Chaudhry, H.R.; Chaudhry, M.; Iqbal, Z.; Ali, M.; Jamil, T.; Sial, N.; Shahzad, M.I.; Basheer, F.; Akhter, S.; et al. Prevalence of Common Diseases in Camels of Cholistan Desert, Pakistan. Journal of Infection and Molecular Biology 2014, 2, 49–52. [Google Scholar] [CrossRef]
- Sobia, M.; Mirza, I.S.; Sonia, T.; Abul, H.; Hafiz, M.A.; Muhammad, D.; Muhammad, F.Q. Prevalence and Characterization of Trypanosoma Species from Livestock of Cholistan Desert of Pakistan. Trop Biomed 2018, 35, 140–148. [Google Scholar] [PubMed]
- Hasan, M.U.; Muhammad, G.; Gutierrez, C.; Iqbal, Z.; Shakoor, A.; Jabbar, A. Prevalence of Trypanosoma Evansi Infection in Equines and Camels in the Punjab Region, Pakistan. Ann N Y Acad Sci 2006, 1081, 322–324. [Google Scholar] [CrossRef]
- Tehseen, S.; Jahan, N.; Qamar, M.F.; Desquesnes, M.; Shahzad, M.I.; Deborggraeve, S.; Büscher, P. Parasitological, Serological and Molecular Survey of Trypanosoma Evansi Infection in Dromedary Camels from Cholistan Desert, Pakistan. Parasit Vectors 2015, 8, 415. [Google Scholar] [CrossRef]
- Khan, S.; Aimen, U.; Rizwan, M.; Ali, A.; Khan, I.; Safiullah; Abidullah; Imdad, S.; Waseemullah; Khan, A. EPIDEMIOLOGICAL SURVEY OF TRYPANOSOMIASIS IN THE DROMEDARY CAMELS RAISED IN DERA ISMAIL KHAN, KHYBER PAKHTUNKHWA, PAKISTAN. Agrobiological Records 2021, 7. [CrossRef]
- Tariq, M.; Badshah, F.; Khan, M.S.; Ibáñez-Arancibia, E.; De los Ríos-Escalante, P.R.; Khan, N.U.; Naeem, S.; Manzoor, A.; Tahir, R.; Mubashir, M.; et al. Prevalence of Trypanosomiasis Caused by Trypanosoma Evansi (Kinetoplastea, Trypanosomatidae) in Domestic Ruminants from Southern Punjab, Pakistan. Vet World 2024, 17, 1955. [Google Scholar] [CrossRef]
- Pakistan Bureau of Statistics Pakistan Livestock Census 2006; 2006;
- Thrusfield, M.; Christley, R.; Brown, H.; Diggle, P.J.; French, N.; Howe, K.; Kelly, L.; O’Connor, A.; Sargeant, J.; Wood, H. Veterinary Epidemiology; John Wiley & Sons, Ltd: Chichester, UK, 2018; ISBN 9781118280249. [Google Scholar]
- Modrý, D.; Hofmannová, L.; Mihalca, A.D.; Juránková, J.; Neumayerová, H.; D’Amico, G. Field and Laboratory Diagnostics of Parasitic Diseases of Domestic Animals: From Sampling to Diagnosis 2017.
- Hoare, C.A. The Trypanosomes of Mammals: A Zoological Monograph. Medical Journal of Australia 1973, 1, 140–140. [Google Scholar] [CrossRef]
- Saleem, S.; Ijaz, M.; Farooqi, S.H.; Rashid, M.I.; Khan, A.; Masud, A.; Aqib, A.I.; Hussain, K.; Mehmood, K.; Zhang, H. First Molecular Evidence of Equine Granulocytic Anaplasmosis in Pakistan. Acta Trop 2018, 180, 18–25. [Google Scholar] [CrossRef]
- Metwally, D.M.; Al-Turaiki, I.M.; Altwaijry, N.; Alghamdi, S.Q.; Alanazi, A.D. Molecular Identification of Trypanosoma evansi Isolated from Arabian Camels (Camelus dromedarius) in Riyadh and Al-Qassim, Saudi Arabia. Animals 2021, 11, 1149. [Google Scholar] [CrossRef]
- Pruvot, M.; Kamyingkird, K.; Desquesnes, M.; Sarataphan, N.; Jittapalapong, S. A Comparison of Six Primer Sets for Detection of Trypanosoma Evansi by Polymerase Chain Reaction in Rodents and Thai Livestock. Vet Parasitol 2010, 171, 185–193. [Google Scholar] [CrossRef]
- Njiru, Z.K.; Constantine, C.C.; Guya, S.; Crowther, J.; Kiragu, J.M.; Thompson, R.C.A.; Davila, A.M.R. The Use of ITS1 RDNA PCR in Detecting Pathogenic African Trypanosomes. Parasitol Res 2005, 95, 186–192. [Google Scholar] [CrossRef]
- Sudan, V.; Jaiswal, A.K.; Shanker, D.; Verma, A.K. First Report of Molecular Characterization and Phylogenetic Analysis of RoTat 1. 2 VSG of Trypanosoma Evansi from Equine Isolate. Trop Anim Health Prod 2017, 49, 1793–1796. [Google Scholar] [CrossRef] [PubMed]
- Bursac, Z.; Gauss, C.H.; Williams, D.K.; Hosmer, D.W. Purposeful Selection of Variables in Logistic Regression. Source Code Biol Med 2008, 3, 17. [Google Scholar] [CrossRef] [PubMed]
- Lan, Y. Molecular Investigation of Important Protozoal Infections in Yaks. The Pakistan Veterinary Journal 2021, 41, 557–561. [Google Scholar] [CrossRef] [PubMed]
- Sazmand, A. Paleoparasitology and Archaeoparasitology in Iran: A Retrospective in Differential Diagnosis. Int J Paleopathol 2021, 32, 50–60. [Google Scholar] [CrossRef]
- Yawoz, M.; Jaafar, S.; Alahi, F.; Babur, C. Seroprevalence of Camels Listeriosis, Brucellosis and Toxoplasmosis from Kirkuk Province-Iraq. The Pakistan Veterinary Journal 2021, 41, 335–340. [Google Scholar] [CrossRef]
- Selim, A.; Alafari, H.A.; Attia, K.; AlKahtani, M.D.F.; Albohairy, F.M.; Elsohaby, I. Prevalence and Animal Level Risk Factors Associated with Trypanosoma Evansi Infection in Dromedary Camels. Sci Rep 2022, 12, 8933. [Google Scholar] [CrossRef]
- Sana, K.; Monia, L.; Ameni, B.S.; Haikel, H.; Imed, B.S.; Walid, C.; Bouabdella, H.; Bassem, B.H.M.; Hafedh, D.; Samed, B.; et al. Serological Survey and Associated Risk Factors’ Analysis of Trypanosomiasis in Camels from Southern Tunisia. Parasite Epidemiol Control 2022, 16, e00231. [Google Scholar] [CrossRef]
- Cadioli, F.A.; Barnabé, P. de A. ; Machado, R.Z.; Teixeira, M.C.A.; André, M.R.; Sampaio, P.H.; Fidélis Junior, O.L.; Teixeira, M.M.G.; Marques, L.C. First report of Trypanosoma vivax outbreak in dairy cattle in São Paulo state, Brazil. Revista Brasileira de Parasitologia Veterinária 2012, 21, 118–124. [Google Scholar] [CrossRef]
- Desquesnes, M.; Dávila, A. Applications of PCR-Based Tools for Detection and Identification of Animal Trypanosomes: A Review and Perspectives. Vet Parasitol 2002, 109, 213–231. [Google Scholar] [CrossRef]
- Hussain, M.; Saeed, Z.; Gulsher, M.; Shaikh, R.S.; Ali, M.; Ahmad, A.N.; Hussain, I.; Akhtar, M.; Iqbal, F. A Report on the Molecular Detection and Seasonal Prevalence of Trypanosoma Brucei in Dromedary Camels from Dera Ghazi Khan District in Southern Punjab (Pakistan. Trop. Biomed 2016, 33, 268–275. [Google Scholar]
- Birhanu, H.; Gebrehiwot, T.; Goddeeris, B.M.; Büscher, P.; Van Reet, N. New Trypanosoma Evansi Type B Isolates from Ethiopian Dromedary Camels. PLoS Negl Trop Dis 2016, 10, e0004556. [Google Scholar] [CrossRef]
- Ereqat, S.; Nasereddin, A.; Al-Jawabreh, A.; Al-Jawabreh, H.; Al-Laham, N.; Abdeen, Z. Prevalence of Trypanosoma evansi in livestock in Palestine. Parasit Vectors 2020, 13, 21. [Google Scholar] [CrossRef] [PubMed]
- Hassan-Kadle, A.A.; Ibrahim, A.M.; Nyingilili, H.S.; Yusuf, A.A.; Vieira, T.S.W.J.; Vieira, R.F.C. Parasitological, Serological and Molecular Survey of Camel Trypanosomiasis in Somalia. Parasit Vectors 2019, 12, 598. [Google Scholar] [CrossRef] [PubMed]
- Mamman, S.A.; Dakul, D.A.; Yohanna, J.A.; Dogo, G.A.; Reuben, R.C.; Ogunleye, O.O.; Tyem, D.A.; Peter, J.G.; Kamani, J. Parasitological, Serological, and Molecular Survey of Trypanosomosis (Surra) in Camels Slaughtered in Northwestern Nigeria. Trop Anim Health Prod 2021, 53, 1–9. [Google Scholar] [CrossRef] [PubMed]
- Boushaki, D.; Adel, A.; Dia, M.L.; Büscher, P.; Madani, H.; Brihoum, B.A.; Sadaoui, H.; Bouayed, N.; Kechemir Issad, N. Epidemiological Investigations on Trypanosoma Evansi Infection in Dromedary Camels in the South of Algeria. Heliyon 2019, 5, e02086. [Google Scholar] [CrossRef]
- Al-Afaleq, A.I.; Elamin, E.A.; Fatani, A.; Homeida, A.G.M. Epidemiological Aspects of Camel Trypanosomosis in Saudi Arabia. Journal of Camel Practice and Research 2015, 22, 231. [Google Scholar] [CrossRef]
- El-Naga, T.; Barghash, S. Blood Parasites in Camels (Camelus Dromedarius) in Northern West Coast of Egypt. J Bacteriol Parasitol 2016, 07. [Google Scholar] [CrossRef]
- Muhammad, G.; Jabbar, A.; Iqbal, Z.; Athar, M.; Saqib, M. A Preliminary Passive Surveillance of Clinical Diseases of Cart Pulling Camels in Faisalabad Metropolis (Pakistan). Prev Vet Med 2006, 76, 273–279. [Google Scholar] [CrossRef]
- Azeem, T.; Tipu, M.Y.; Aslam, A.; Ahmed, S.; Abid, S.A.; Iqbal, A.; Akhtar, N.; Saleem, M.; Mushtaq, A.; Umar, S. Hematobiochemical Disorder in Camels Suffering from Different Hemoparasites. Pak J Zool 2019, 51, 591–596. [Google Scholar] [CrossRef]
- Bhutto, B.; Gadahi, J.A.; Shah, G.; Dewani, P.; Arijo, A.G. Field Investigation on the Prevalence of Trypanosomiasis in Camels in Relation to Sex, Age, Breed and Herd Size. Pak. Vet. J 2010, 30, 175–177. [Google Scholar]
- Maqsood, N.; Tunio, M.; Dad, R. Effect of Season and Topography on the Prevalence of Trypanosoma Evansi in Camels of District Khushab of Punjab Province, Pakistan. Journal of Animal Health and Production 2023, 11, 139–143. [Google Scholar] [CrossRef]
- Khan, W.; Hafeez, M.A.; Lateef, M.; Awais, M.; Wajid, A.; Shah, B.A.; Ali, S.; Asif, Z.; Ahmed, M.; Kakar, N.; et al. Parasitological, Molecular, and Epidemiological Investigation of Trypanosoma Evansi Infection among Dromedary Camels in Balochistan Province. Parasitol Res 2023, 122, 1833–1839. [Google Scholar] [CrossRef]
- Sazmand, A.; Rasooli, A.; Nouri, M.; Hamidinejat, H.; Hekmatimoghaddam, S. Serobiochemical Alterations in Subclinically Affected Dromedary Camels with Trypanosoma Evansi in Iran. Pak. Vet. J 2011, 31, 223–226. [Google Scholar]
- Habeeba, S.; Khan, R.A.; Zackaria, H.; Yammahi, S.; Mohamed, Z.; Sobhi, W.; AbdelKader, A.; Alhosani, M.A.; Muhairi, S. Al Comparison of Microscopy, Card Agglutination Test for Trypanosoma Evansi, and Real-Time PCR in the Diagnosis of Trypanosomosis in Dromedary Camels of the Abu Dhabi Emirate, UAE. J Vet Res 2022, 66, 125–129. [Google Scholar] [CrossRef]
- Zaitoun, A.M.A. ; Safaa, ; Malek, S. ; Khaled, ; El-Khabaz, A.S.; Abd-El-Hameed, S.G. SOME STUDIES ON TRYPANOSOMIASIS IN IMPORTED CAMELS. Assiut Vet Med J 2016, 63, 39–51. [Google Scholar] [CrossRef]
- Abdel-Hakeem, S.S.; Megahed, G.; Al-Hakami, A.M.; Tolba, M.E.M.; Karar, Y.F.M. Impact of Trypanosomiasis on Male Camel Infertility. Front Vet Sci 2025, 11. [Google Scholar] [CrossRef]
- Barghash, S.M.; Abou El-Naga, T.R.; El-Sherbeny, E.A.; Darwish, A.M. Prevalence of Trypanosoma Evansi in Maghrabi Camels (Camelus Dromedarius) in Northern-West Coast, Egypt Using Molecular and Parasitological Methods. Acta Parasitol. Glob 2014, 5, 125–132. [Google Scholar] [CrossRef]
- Mirshekar, F.; Yakhchali, M.; Shariati-Sharifi, F. Trypanosoma Evansi Infection and Major Risk Factors for Iranian One-Humped Camels (Camelus Dromedarius). Journal of Parasitic Diseases 2017, 41, 854–858. [Google Scholar] [CrossRef]
- Salah, A.A.; Robertson, I.; Mohamed, A. Prevalence and Distribution of Trypanosoma Evansi in Camels in Somaliland. Trop Anim Health Prod 2019, 51, 2371–2377. [Google Scholar] [CrossRef]
- Argungu, S.; Bala, A.; Liman, B. Pattern of Trypanosoma Evansi Infection among Slaughtered Camels (Camelus Dromedarius) in Sokoto Central Abattoir. . J Zool BioSci Res 2015, 2, 1–7. [Google Scholar]
- Ngaira, J.; Bett, B.; Karanja, S.; Njagi, E. Evaluation of Antigen and Antibody Rapid Detection Tests for Trypanosoma Evansi Infection in Camels in Kenya. Vet Parasitol 2003, 114, 131–141. [Google Scholar] [CrossRef]
- Al Malki, J.S.; Hussien, N.A. Molecular Characterization of Trypanosoma Evansi, T. Vivax and T. Congolense in Camels (Camelus Dromedarius) of KSA. BMC Vet Res 2022, 18, 1–9. [Google Scholar] [CrossRef]
- Al-Kharusi, A.H.; Elshafie, E.I.; Ali, K.E.M.; AL-Sinadi, R. ; N. , B.; AL-Saifi, F. Seroprevalence of Trypanosoma Evansi Infections among Dromedary Camels (Camelus Dromedaries) in North Al-Sharqiya Governorate, Sultanate of Oman. Journal of Agricultural and Marine Sciences 2025, 26, 51–55. [Google Scholar] [CrossRef]
- Alemu, G.; Abebe, R. Prevalence and Risk Factors of Trypanosomosis in Dromedary Camels in the Pastoral Areas of the Guji Zone in Ethiopia. J Parasitol Res 2023, 2023. [Google Scholar] [CrossRef]
- Desquesnes, M.; Holzmuller, P.; Lai, D.H.; Dargantes, A.; Lun, Z.R.; Jittaplapong, S. Trypanosoma Evansi and Surra: A Review and Perspectives on Origin, History, Distribution, Taxonomy, Morphology, Hosts, and Pathogenic Effects. Biomed Res Int 2013.
- Ngaira, J.; Bett, B.K.; Karanja, S. Animal-Level Risk Factors for Trypanosoma Evansi Infection in Camels in Eastern and Central Parts of Kenya. Onderstepoort Journal of Veterinary Research 2002.
- Ismail-Hamdi, S.; Hamdi, N.; Chandoul, W.; Smida, B. Ben; Romdhane, S. Ben Microscopic and Serological Survey of Trypanosoma Evansi Infection in Tunisian Dromedary Camels (Camelus Dromedarius). Vet Parasitol Reg Stud Reports 2022, 32. [Google Scholar] [CrossRef]
- Pasalary, M.; Arbabi, M.; Pashei, S.; Abdigoudarzi, M. Fauna of ticks (Acari: Ixodidae) and their seasonal infestation rate on Camelus dromedarius (Mammalia: Camelidae) in Masileh region, Qom province, Iran. Persian J. Acarol 2017, 6, 31–37. [Google Scholar] [CrossRef]
- Chaudhary, Z.I.; Iqbal, J. Incidence, Biochemical and Haematological Alterations Induced by Natural Trypanosomosis in Racing Dromedary Camels. Acta Trop 2000, 77, 209–213. [Google Scholar] [CrossRef]
- Mishra, R.R.; Senapati, S.; Sahoo, S.C.; Das, M.; Sahoo, G.; Patra, R. Trypanosomiasis Induced Oxidative Stress and Hemato-Biochemical Alteration in Cattle. J. Entomol. Zool. Stud 2017, 5, 721–727. [Google Scholar]
- Reddy, B.S.; Kumari, K.N.; Sivajothi, S.; Rayulu, V.C. Haemato-Biochemical and Thyroxin Status in Trypanosoma Evansi Infected Dogs. Journal of Parasitic Diseases 2016, 40, 491–495. [Google Scholar] [CrossRef] [PubMed]
- Sivajothi, S.; Rayulu, V.C.; Sudhakara Reddy, B. Haematological and Biochemical Changes in Experimental Trypanosoma Evansi Infection in Rabbits. Journal of Parasitic Diseases 2015, 39, 216–220. [Google Scholar] [CrossRef] [PubMed]
- Ahmadi-hamedani, M.; Ghazvinian, K.; Darvishi, M.M. Hematological and Serum Biochemical Aspects Associated with a Camel (Camelus Dromedarius) Naturally Infected by Trypanosoma Evansi with Severe Parasitemia in Semnan, Iran. Asian Pac J Trop Biomed 2014, 4, 743–745. [Google Scholar] [CrossRef]
- Singh, S.K.; Singh, V.K.; Kumari, P.; Nakade, U.P.; Garg, S.K. Trypanosoma Evansi Induces Detrimental Immuno-Catabolic Alterations and Condition like Type-2 Diabetes in Buffaloes. Parasitol Int 2018, 67, 140–143. [Google Scholar] [CrossRef]
- Da Silva, A.S.; Wolkmer, P.; Costa, M.M.; Tonin, A.A.; Eilers, T.L.; Gressler, L.T.; Otto, M.A.; Zanette, R.A.; Santurio, J.M.; Lopes, S.T.A.; et al. Biochemical Changes in Cats Infected with Trypanosoma Evansi. Vet Parasitol 2010, 171, 48–52. [Google Scholar] [CrossRef]
Figure 1.
Map of Punjab displaying sampled districts and PCR based prevalence in 400 camels.
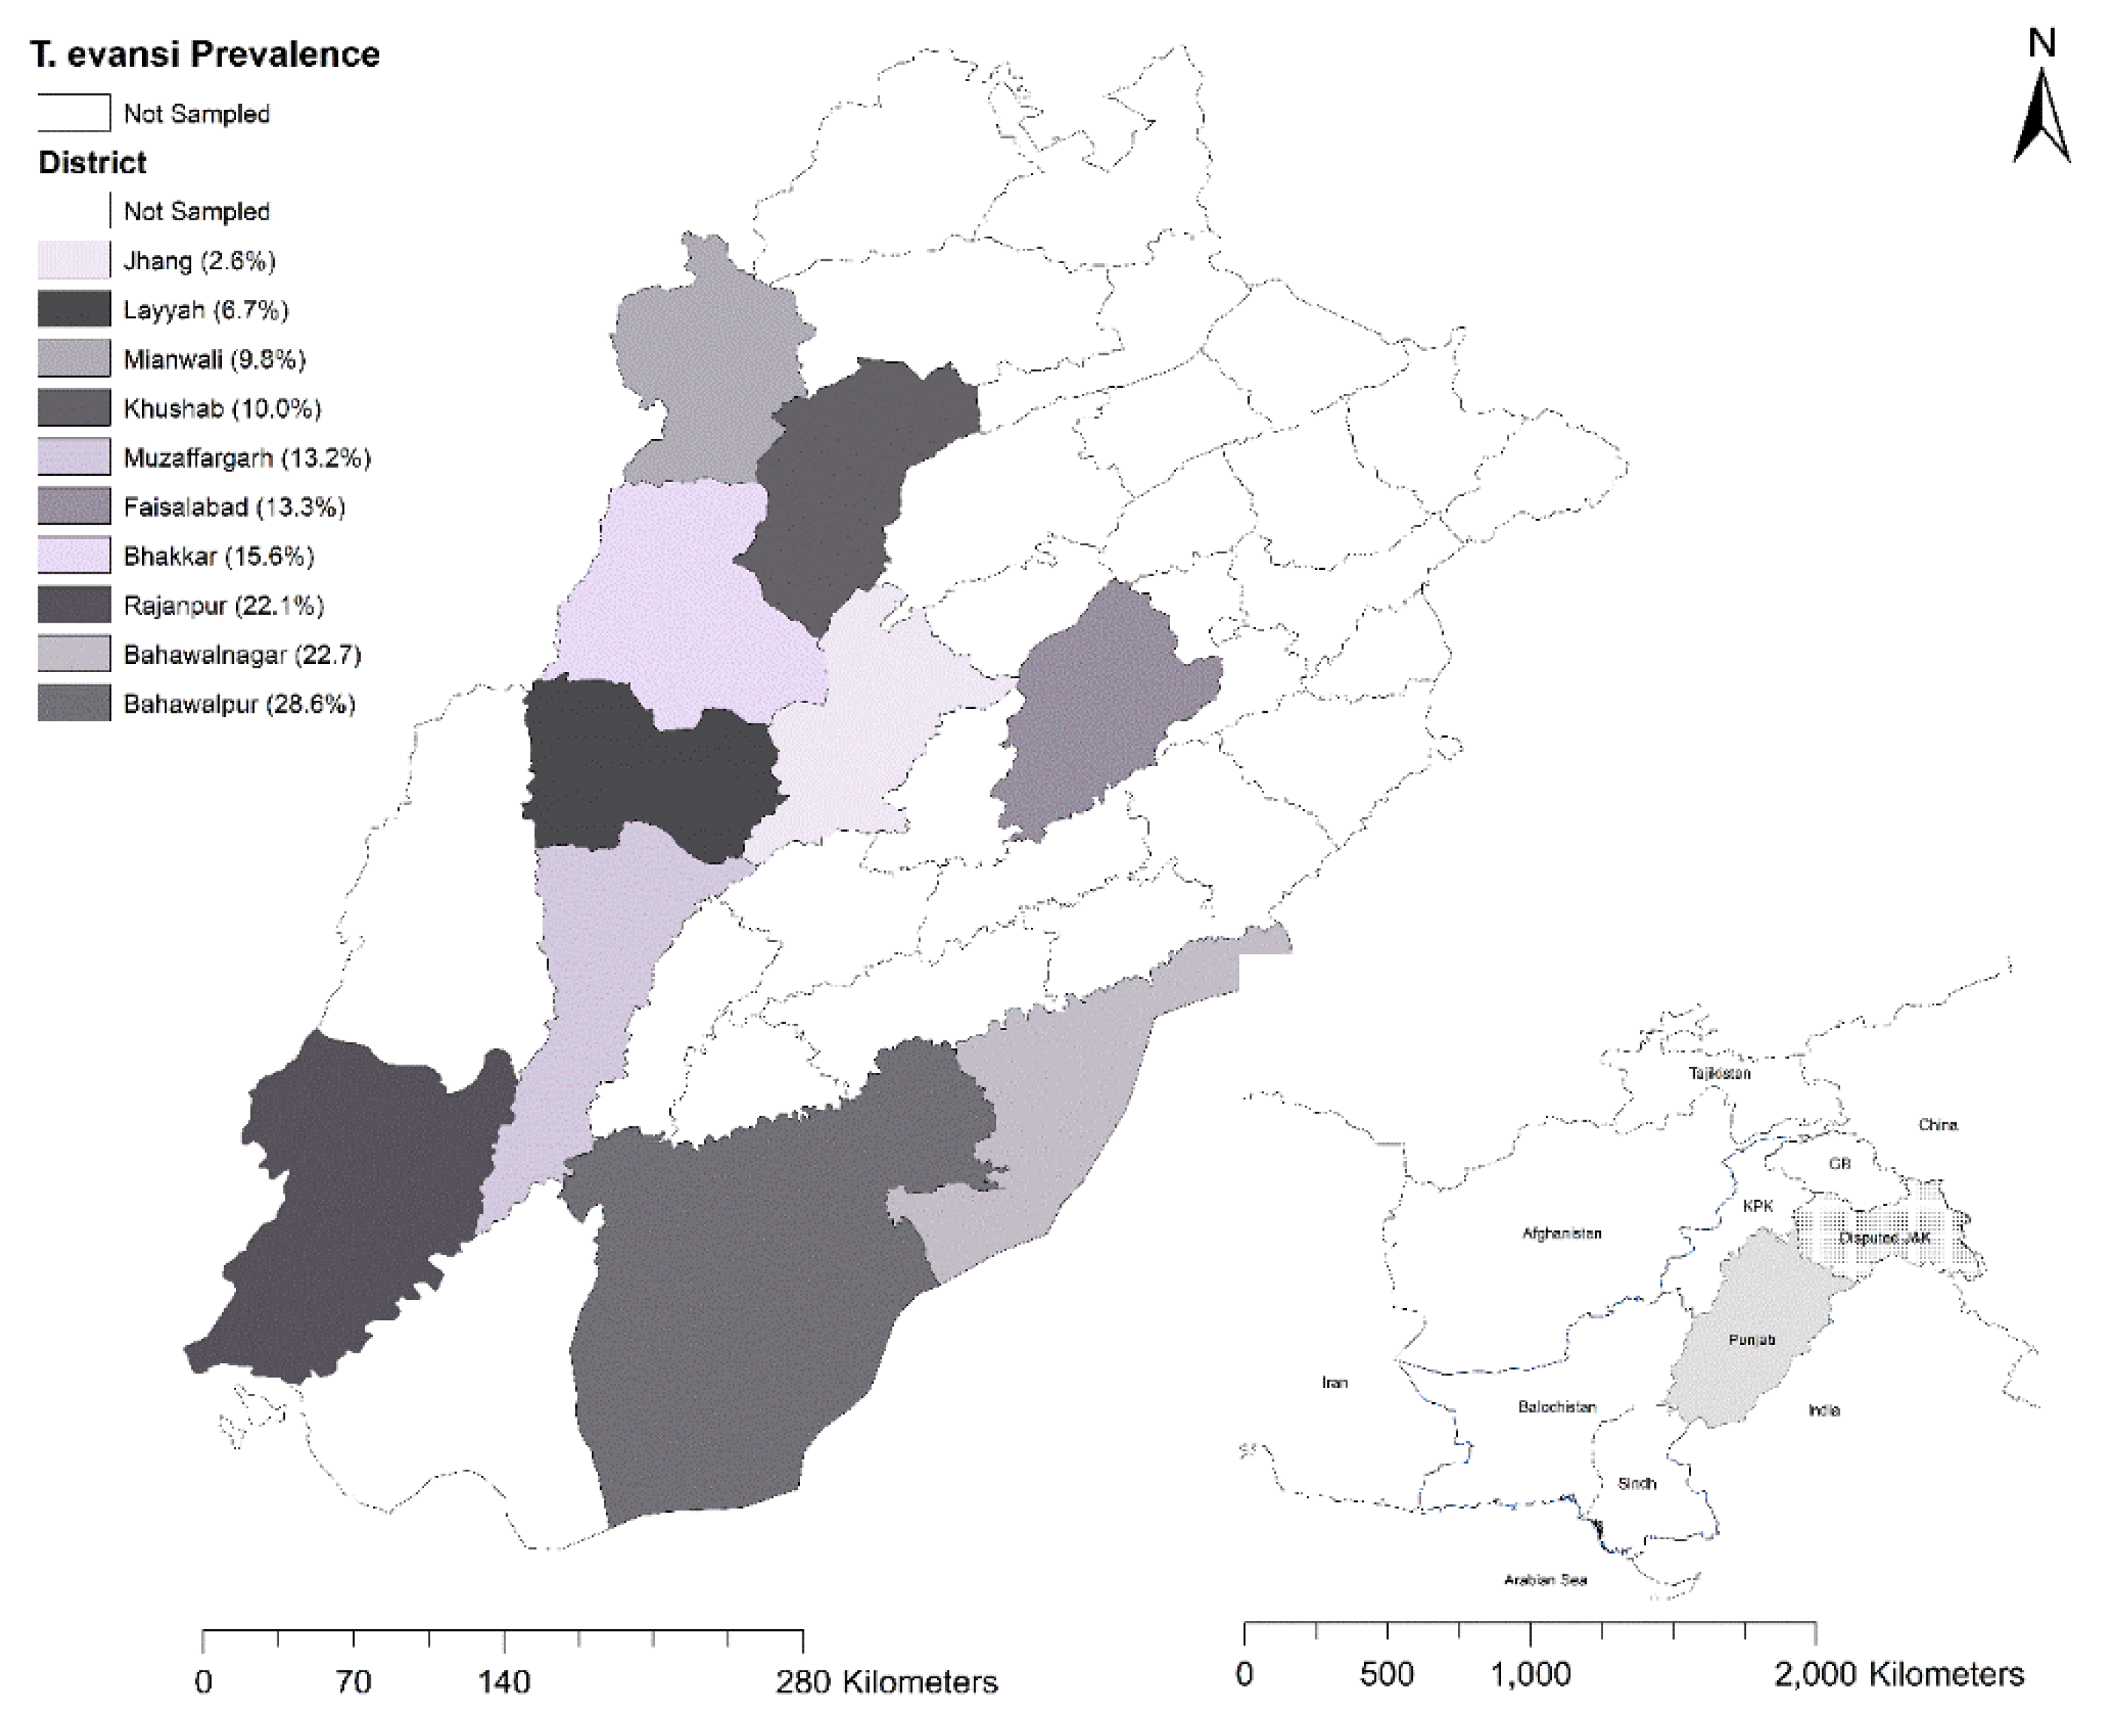
Figure 2.
Field / Giemsa staining revealed trypanosomes in the extracellular space of red blood cells of camel under oil emersion lens (100 X) of compound microscope (Black arrows).
Figure 2.
Field / Giemsa staining revealed trypanosomes in the extracellular space of red blood cells of camel under oil emersion lens (100 X) of compound microscope (Black arrows).
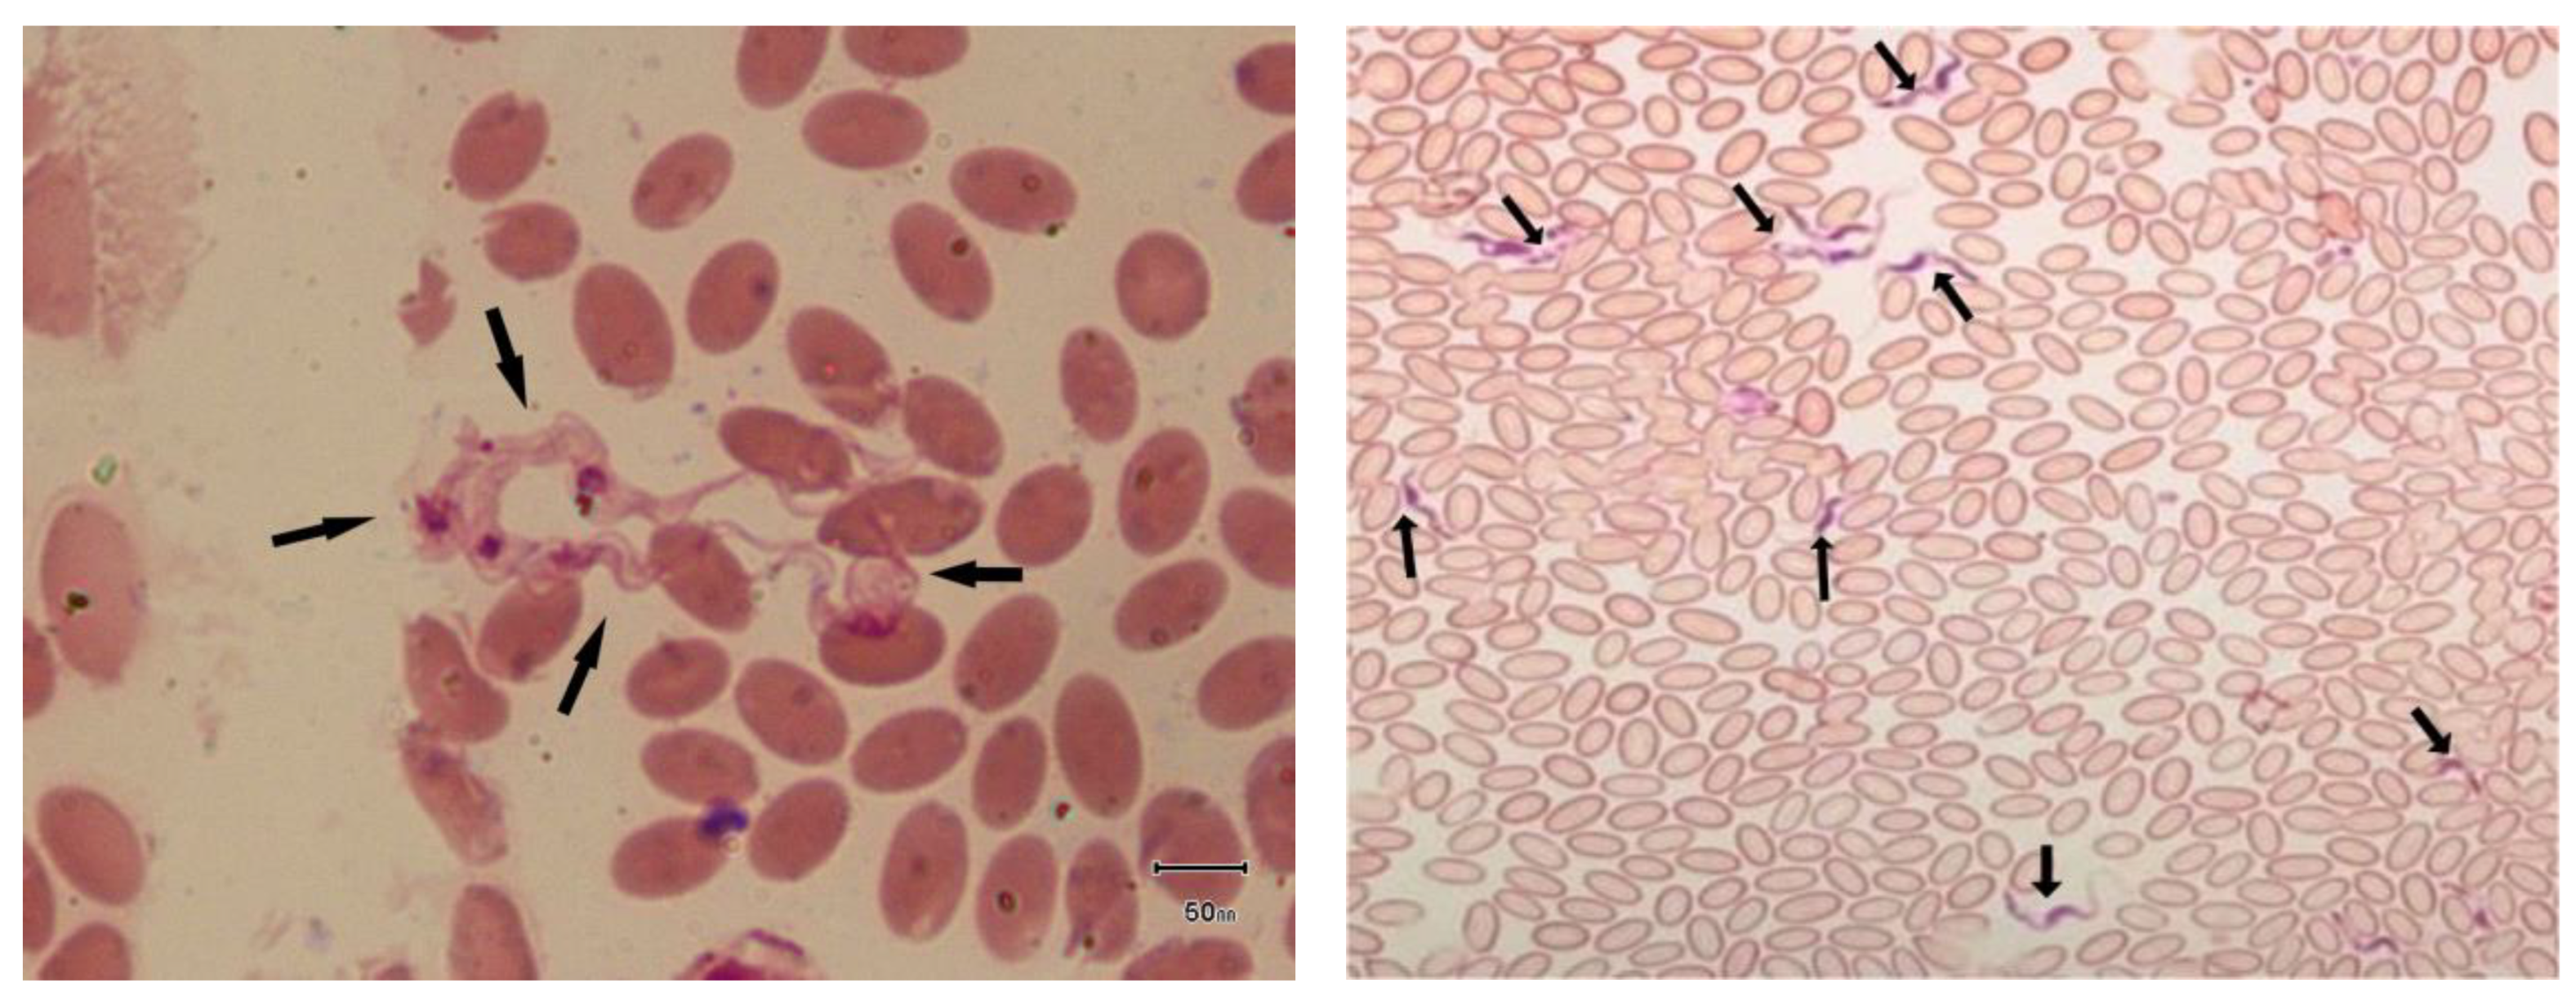
Figure 3.
Agarose gel with PCR amplification of RoTat 1.2 (205bp) of T. evansi from camels Lane L: 100 bp molecular weight marker (Ladder, Thermo Fisher), C + ve (Control Positive), C-ve (Control Negative) with current study positive isolates Lane: T1-T8.
Figure 3.
Agarose gel with PCR amplification of RoTat 1.2 (205bp) of T. evansi from camels Lane L: 100 bp molecular weight marker (Ladder, Thermo Fisher), C + ve (Control Positive), C-ve (Control Negative) with current study positive isolates Lane: T1-T8.
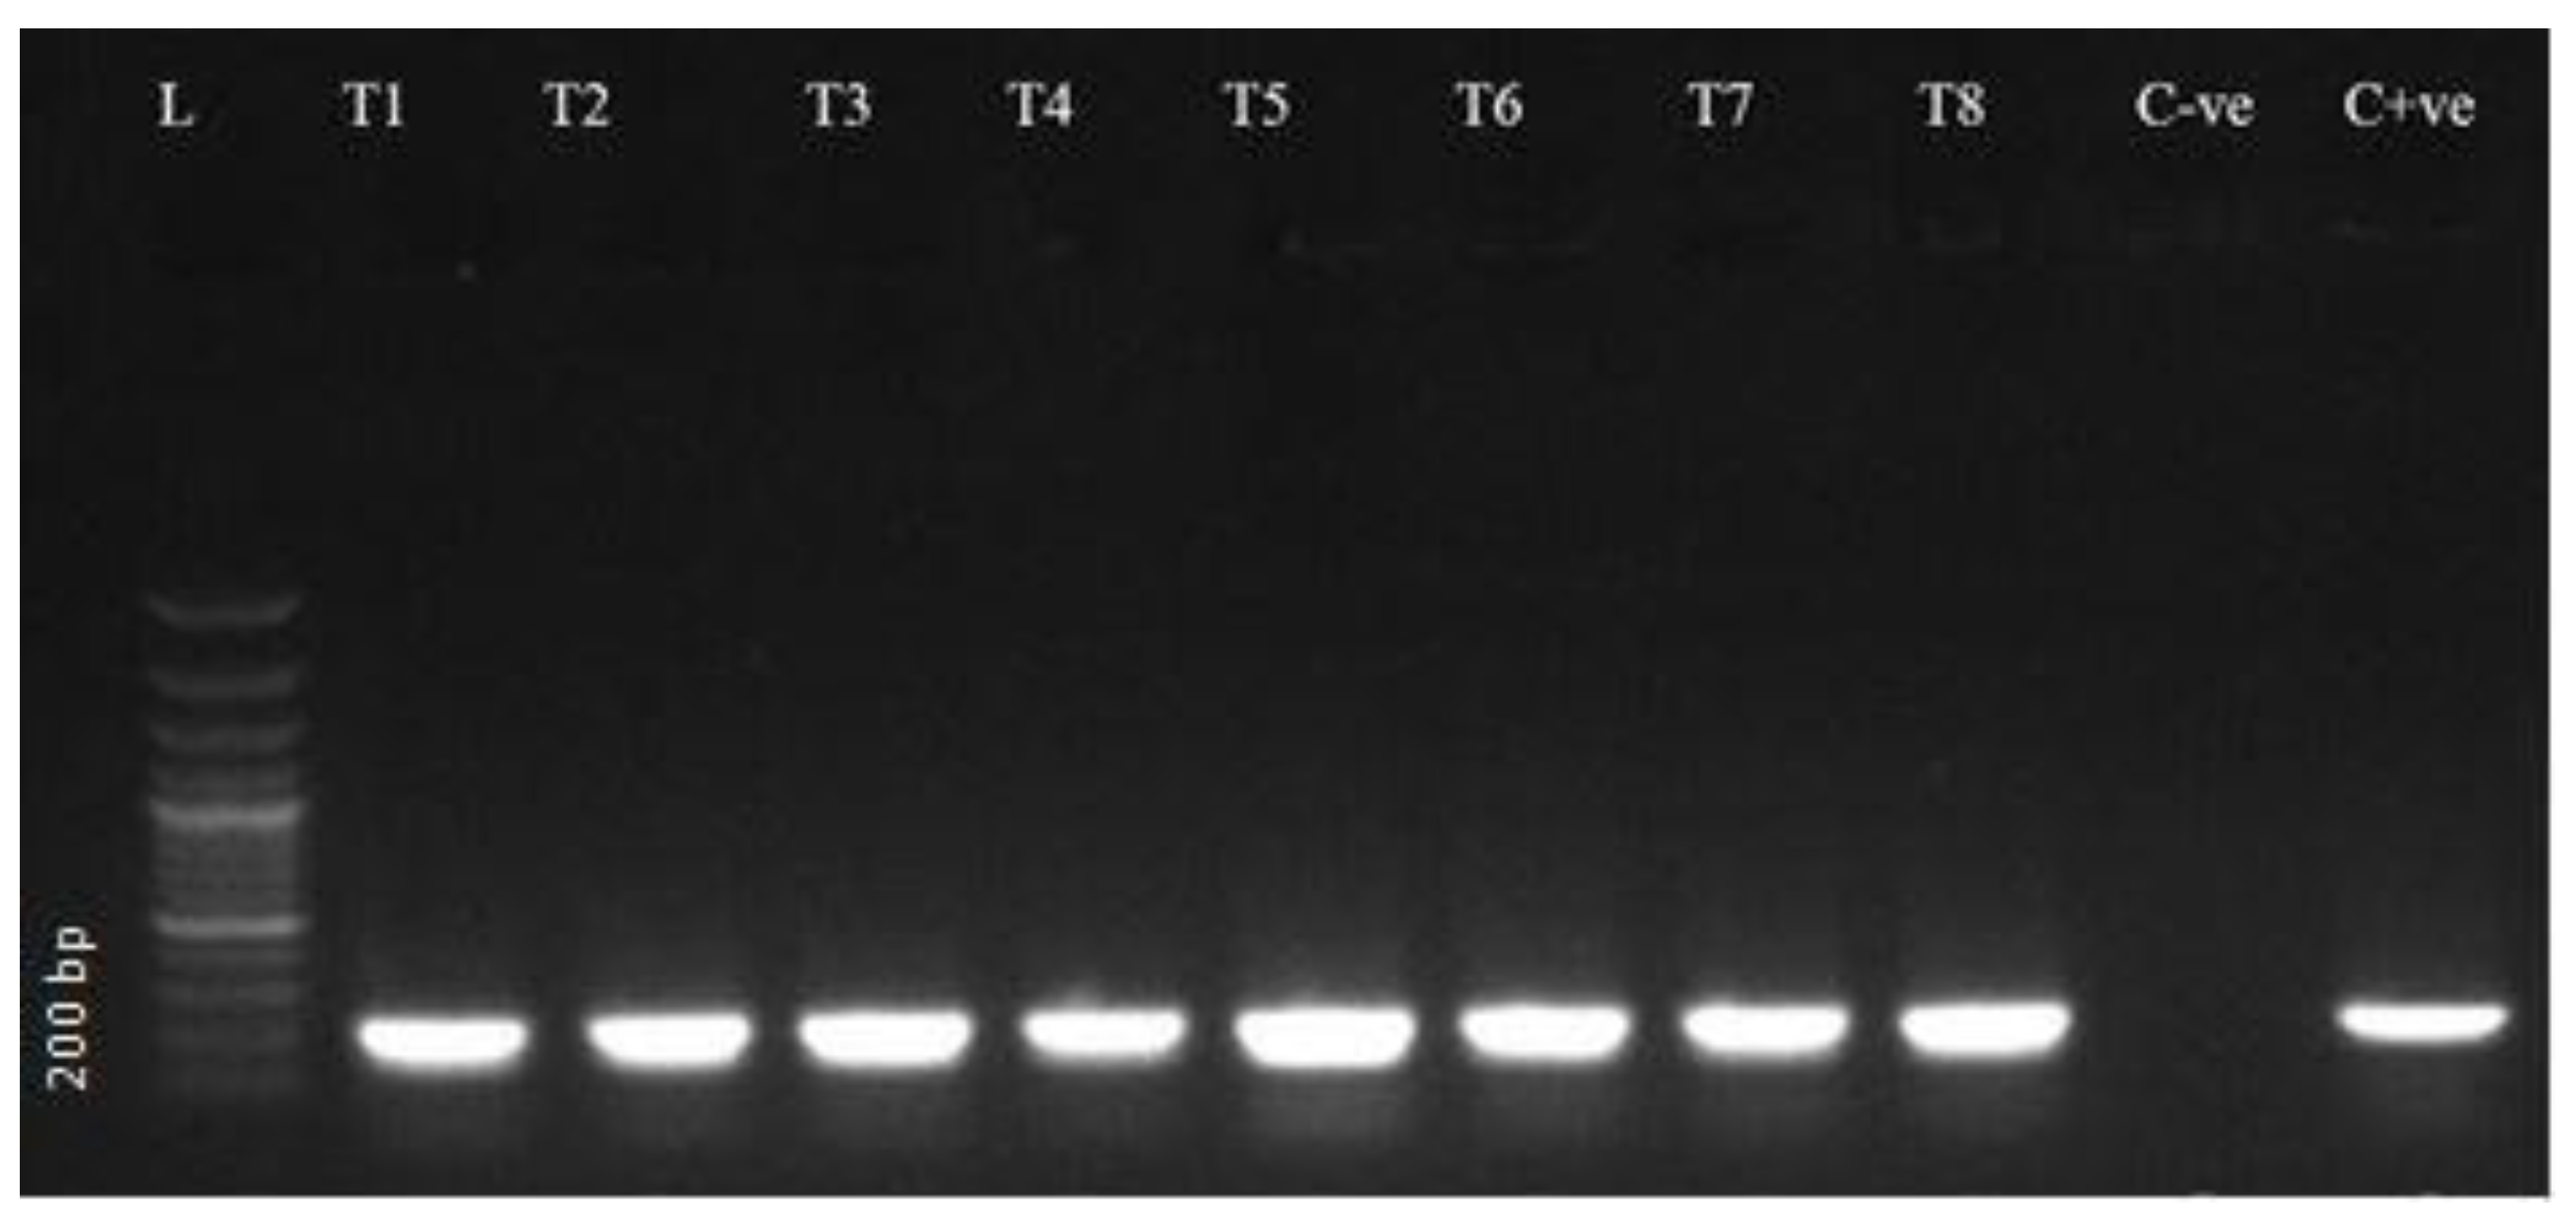
Figure 4.
Agarose gel (1.5%) electrophoretogram with ethidium bromide stained displaying pUMtec PCR product of 210bp from T. evansi isolates (different camel samples). L, 50 base pair ladder whereas CP (Control Positive) and CN (Control Negative).
Figure 4.
Agarose gel (1.5%) electrophoretogram with ethidium bromide stained displaying pUMtec PCR product of 210bp from T. evansi isolates (different camel samples). L, 50 base pair ladder whereas CP (Control Positive) and CN (Control Negative).
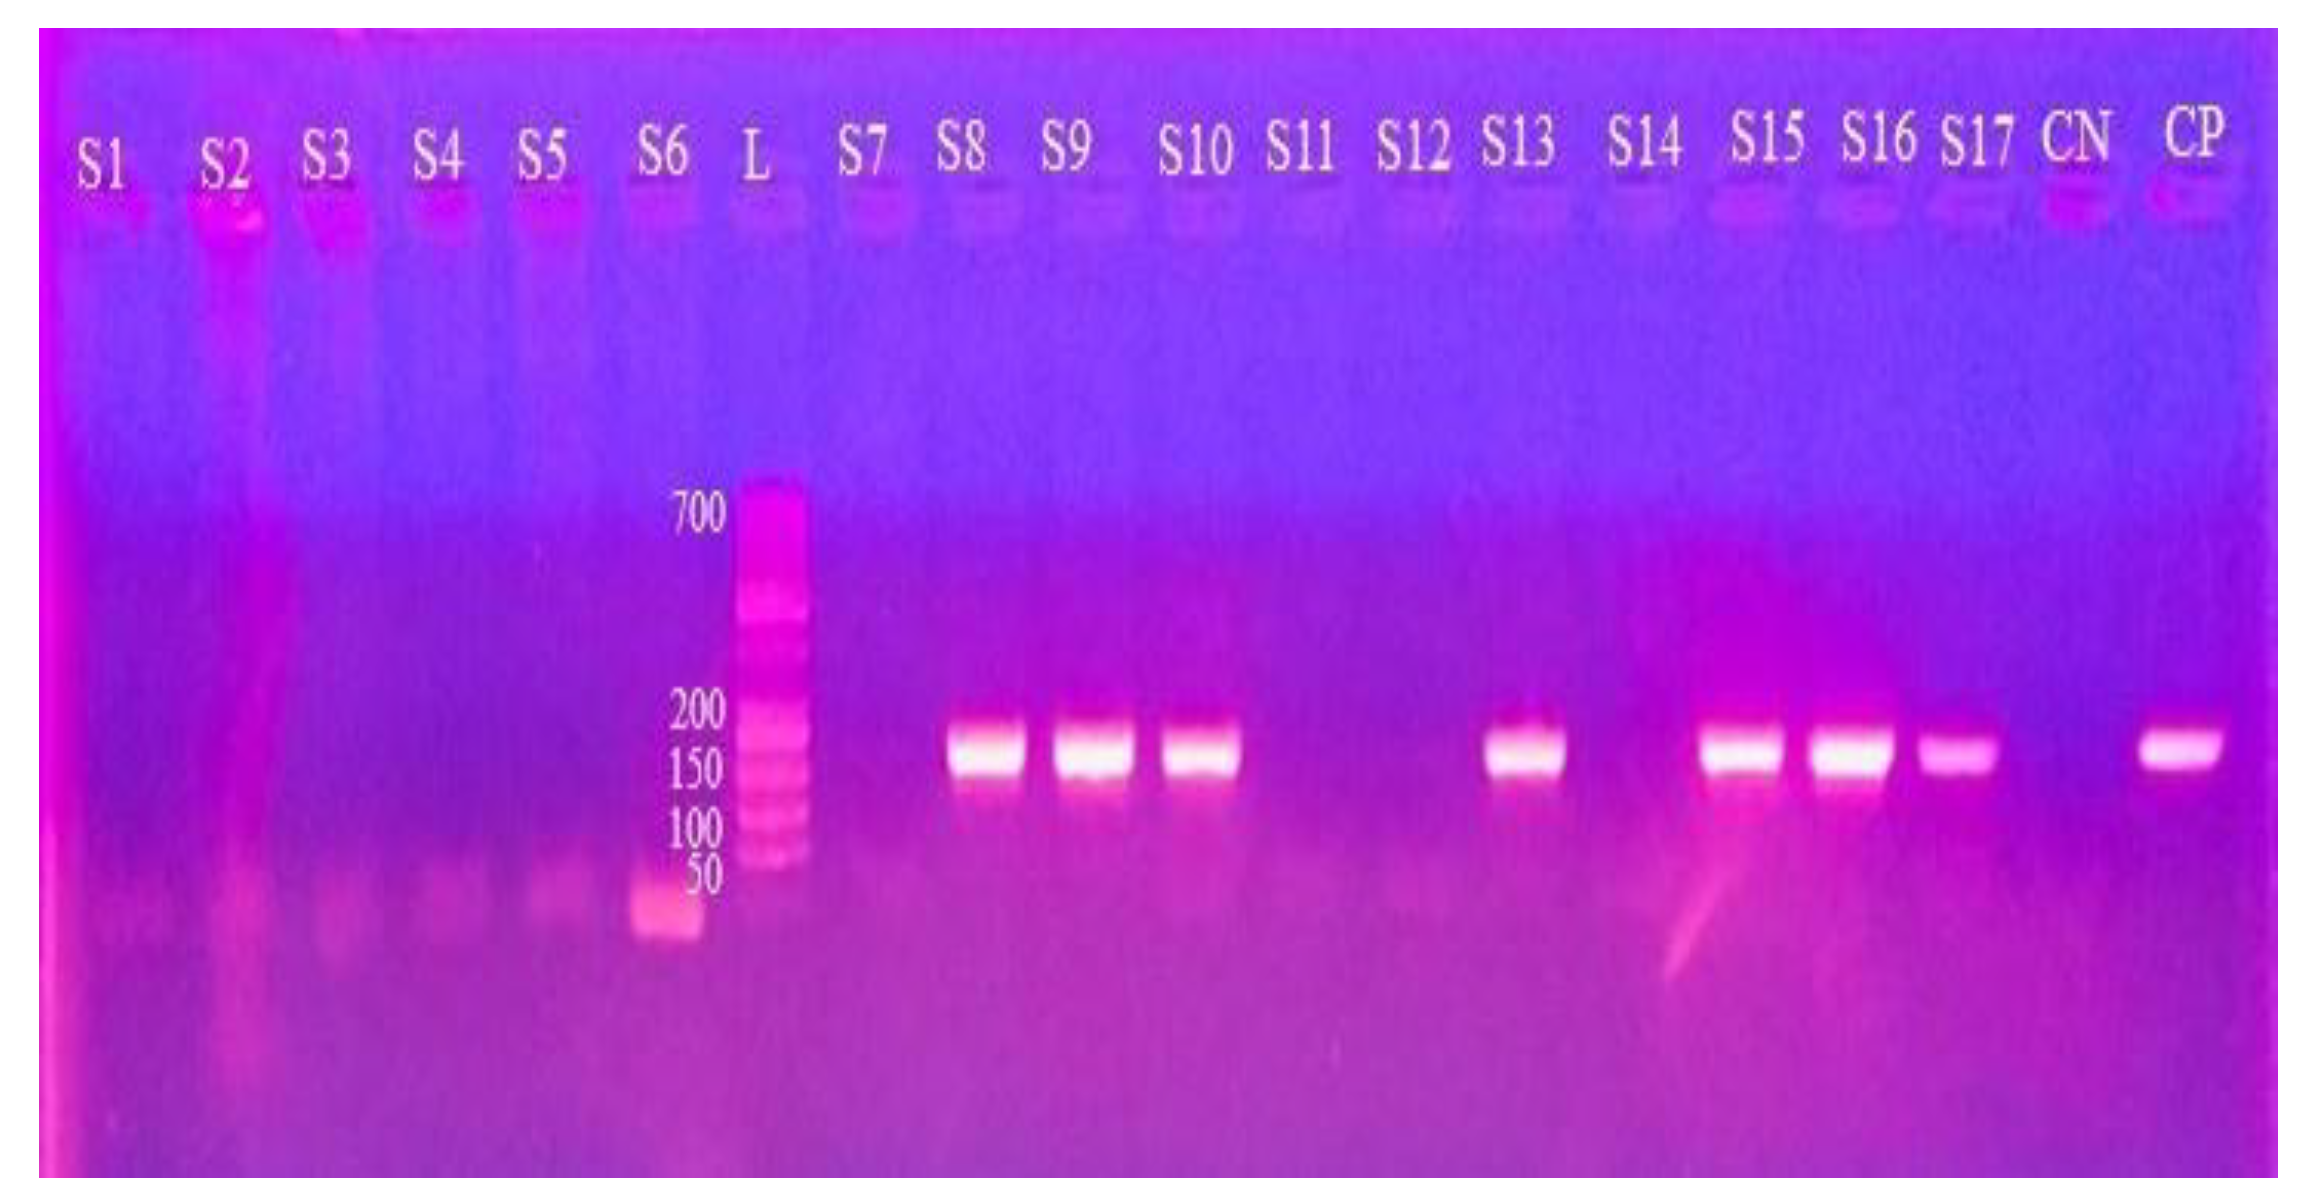
Figure 5.
Agarose gel (1.5%) electrophoretogram ethidium bromide stained showing ITS-I CF/BR PCR products of 478 bp derived from T. evansi isolates from camel blood samples. L, 100 base pair marker, PC (Positive Control) and NC (Negative Control).
Figure 5.
Agarose gel (1.5%) electrophoretogram ethidium bromide stained showing ITS-I CF/BR PCR products of 478 bp derived from T. evansi isolates from camel blood samples. L, 100 base pair marker, PC (Positive Control) and NC (Negative Control).
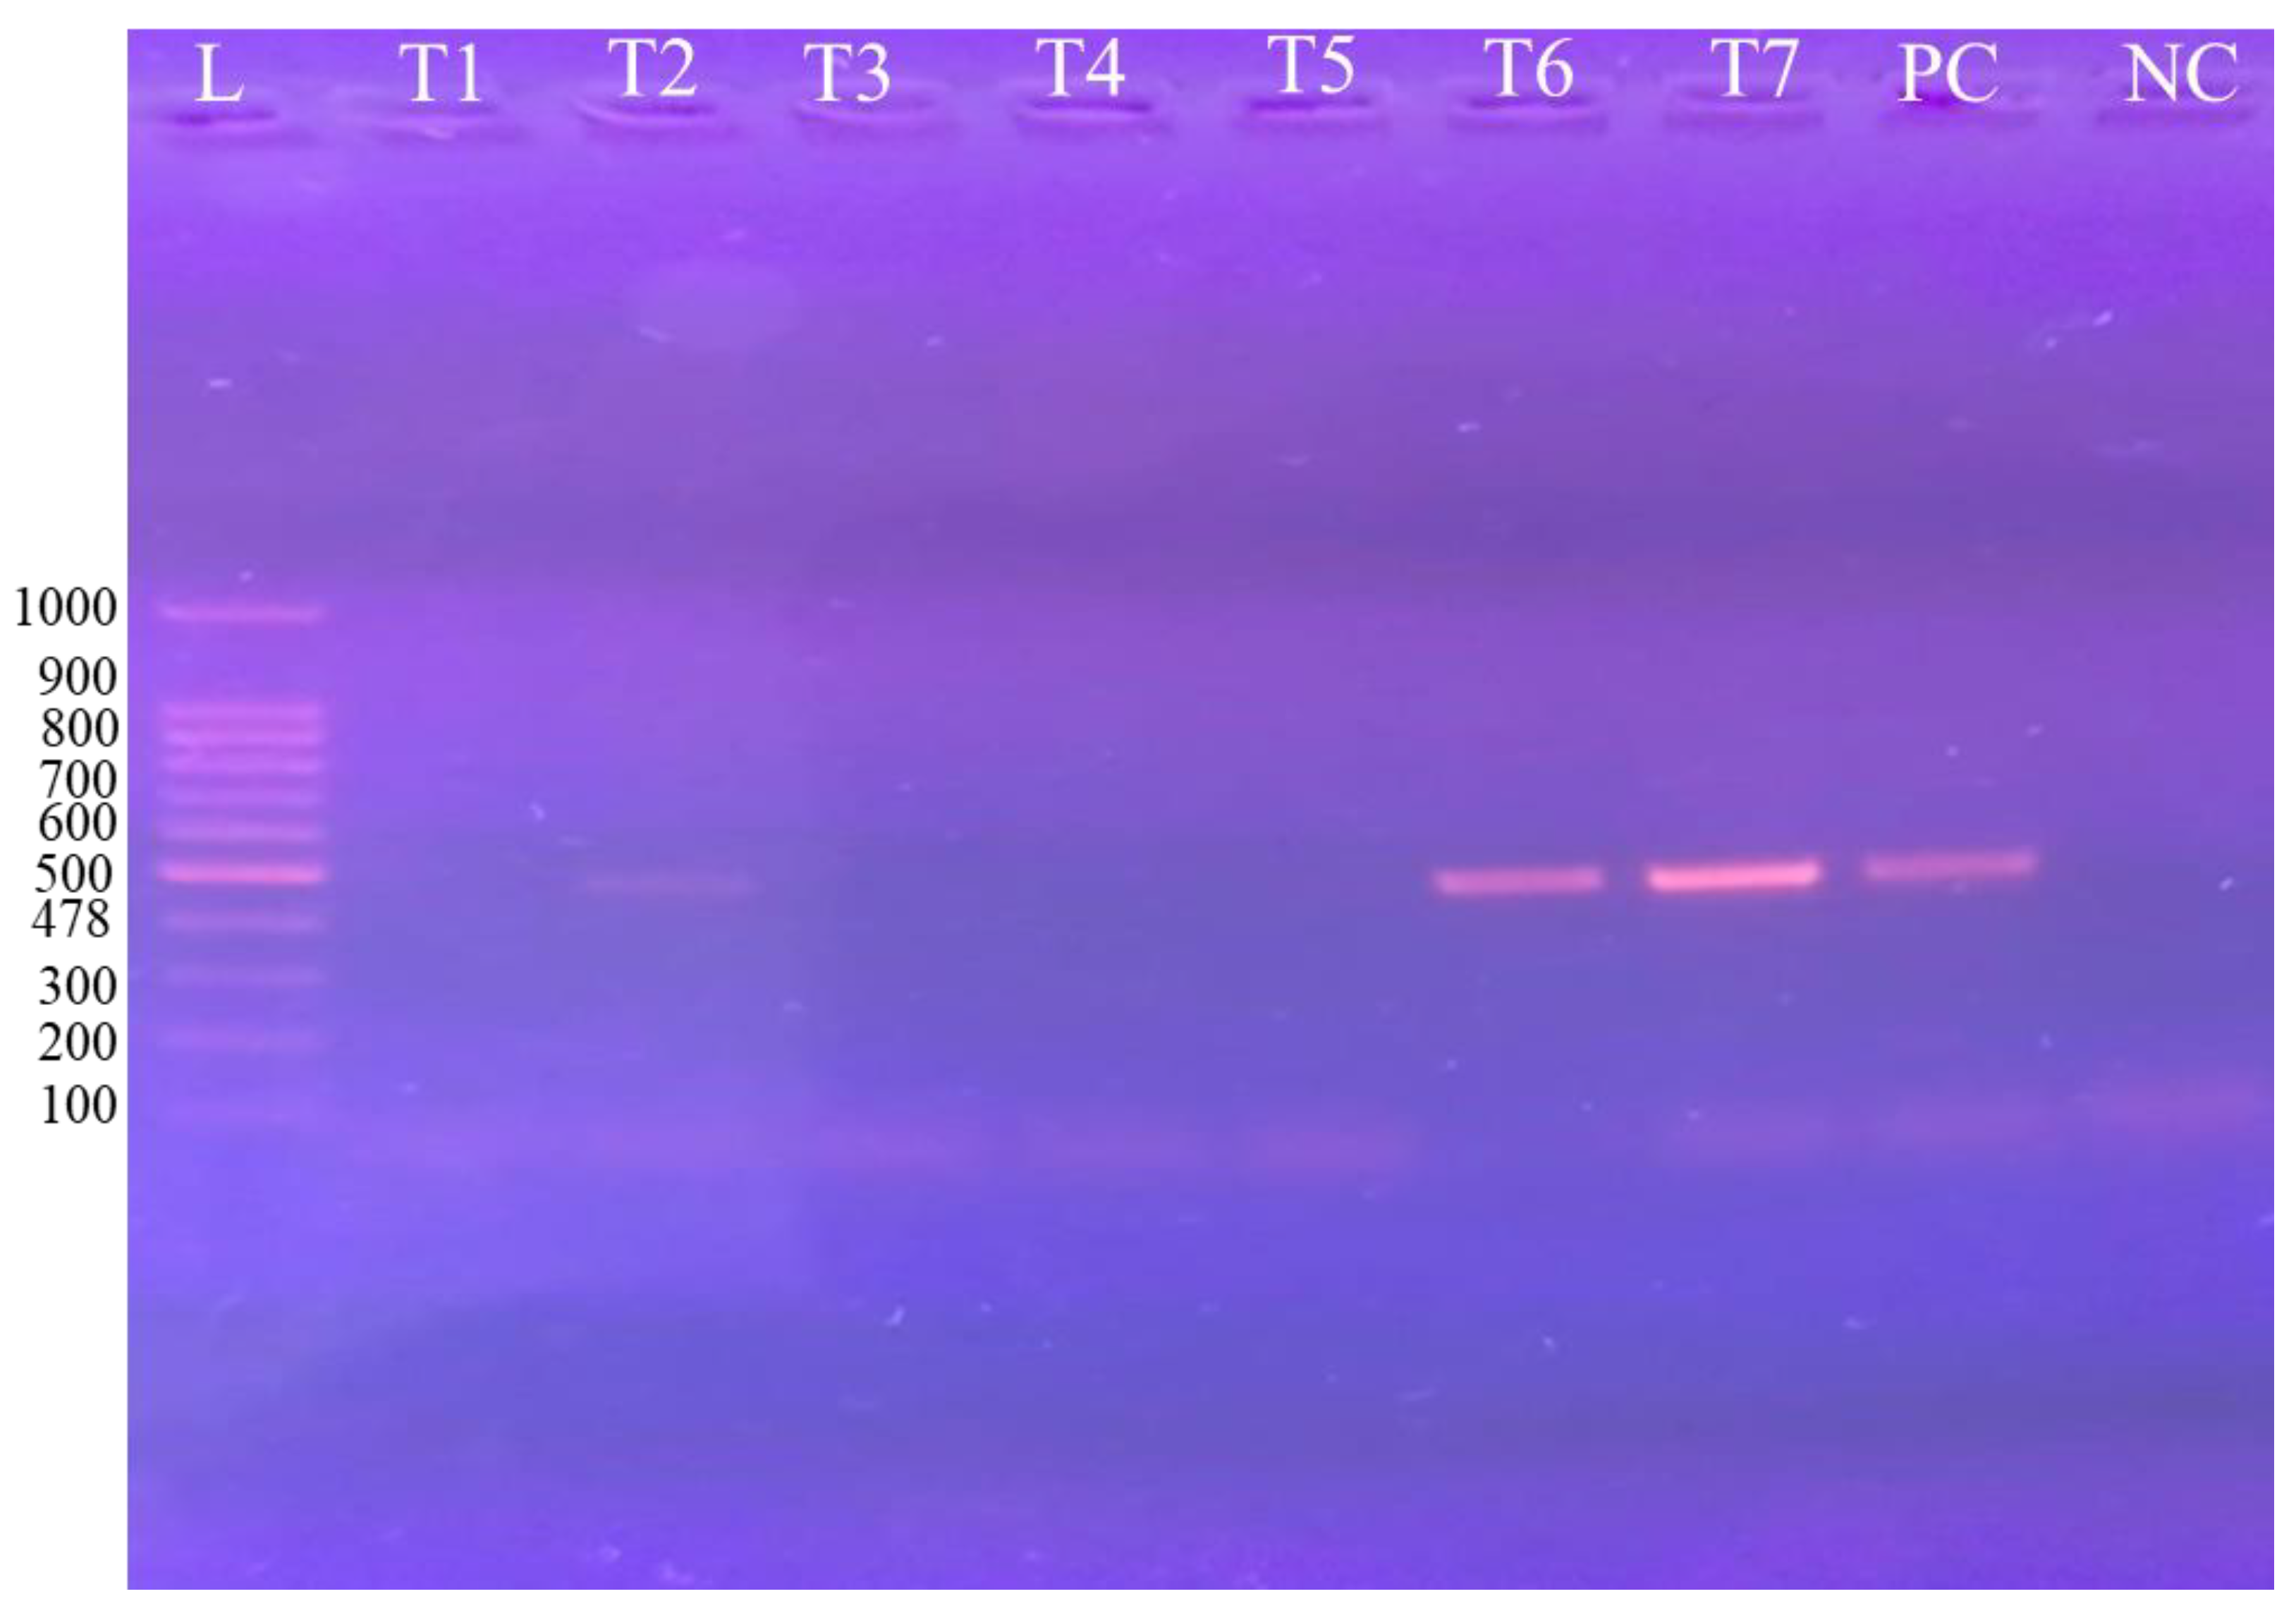
Figure 6.
Phylogenetic associations between the samples in the current study and previously published reference sequences were determined based on the RoTat 1.2 (Variable Surface Glycoprotein) gene. These sequences were retrieved from GenBank. The phylogenetic tree was constructed, with clades indicating the percentage similarity at a bootstrap value of 1000. The isolates from the current study are marked with red triangles. While codes are the accession number obtained from NCBI. The main horizontal line indicates the 71% similarity to their ancestor isolated from MN914098.1 Trypanosoma evansi, equine, India. The second branch indicates the 99% of similarity to their ancestor JX134605.1 Ttrypanosoma camel, India. The third branch indicates 51% similarity to their ancestor Trypanosoma evansi isolated from different countries i.e., Japan, Egypt, Malaysia, and India respectively. The fourth branch indicates the 53% similarity to the isolate with AB259839.1 Trypanosoma evansi, Horse India. All the branches linked with their common ancestor via main root and shows the 76 similarity to their common ancestor.
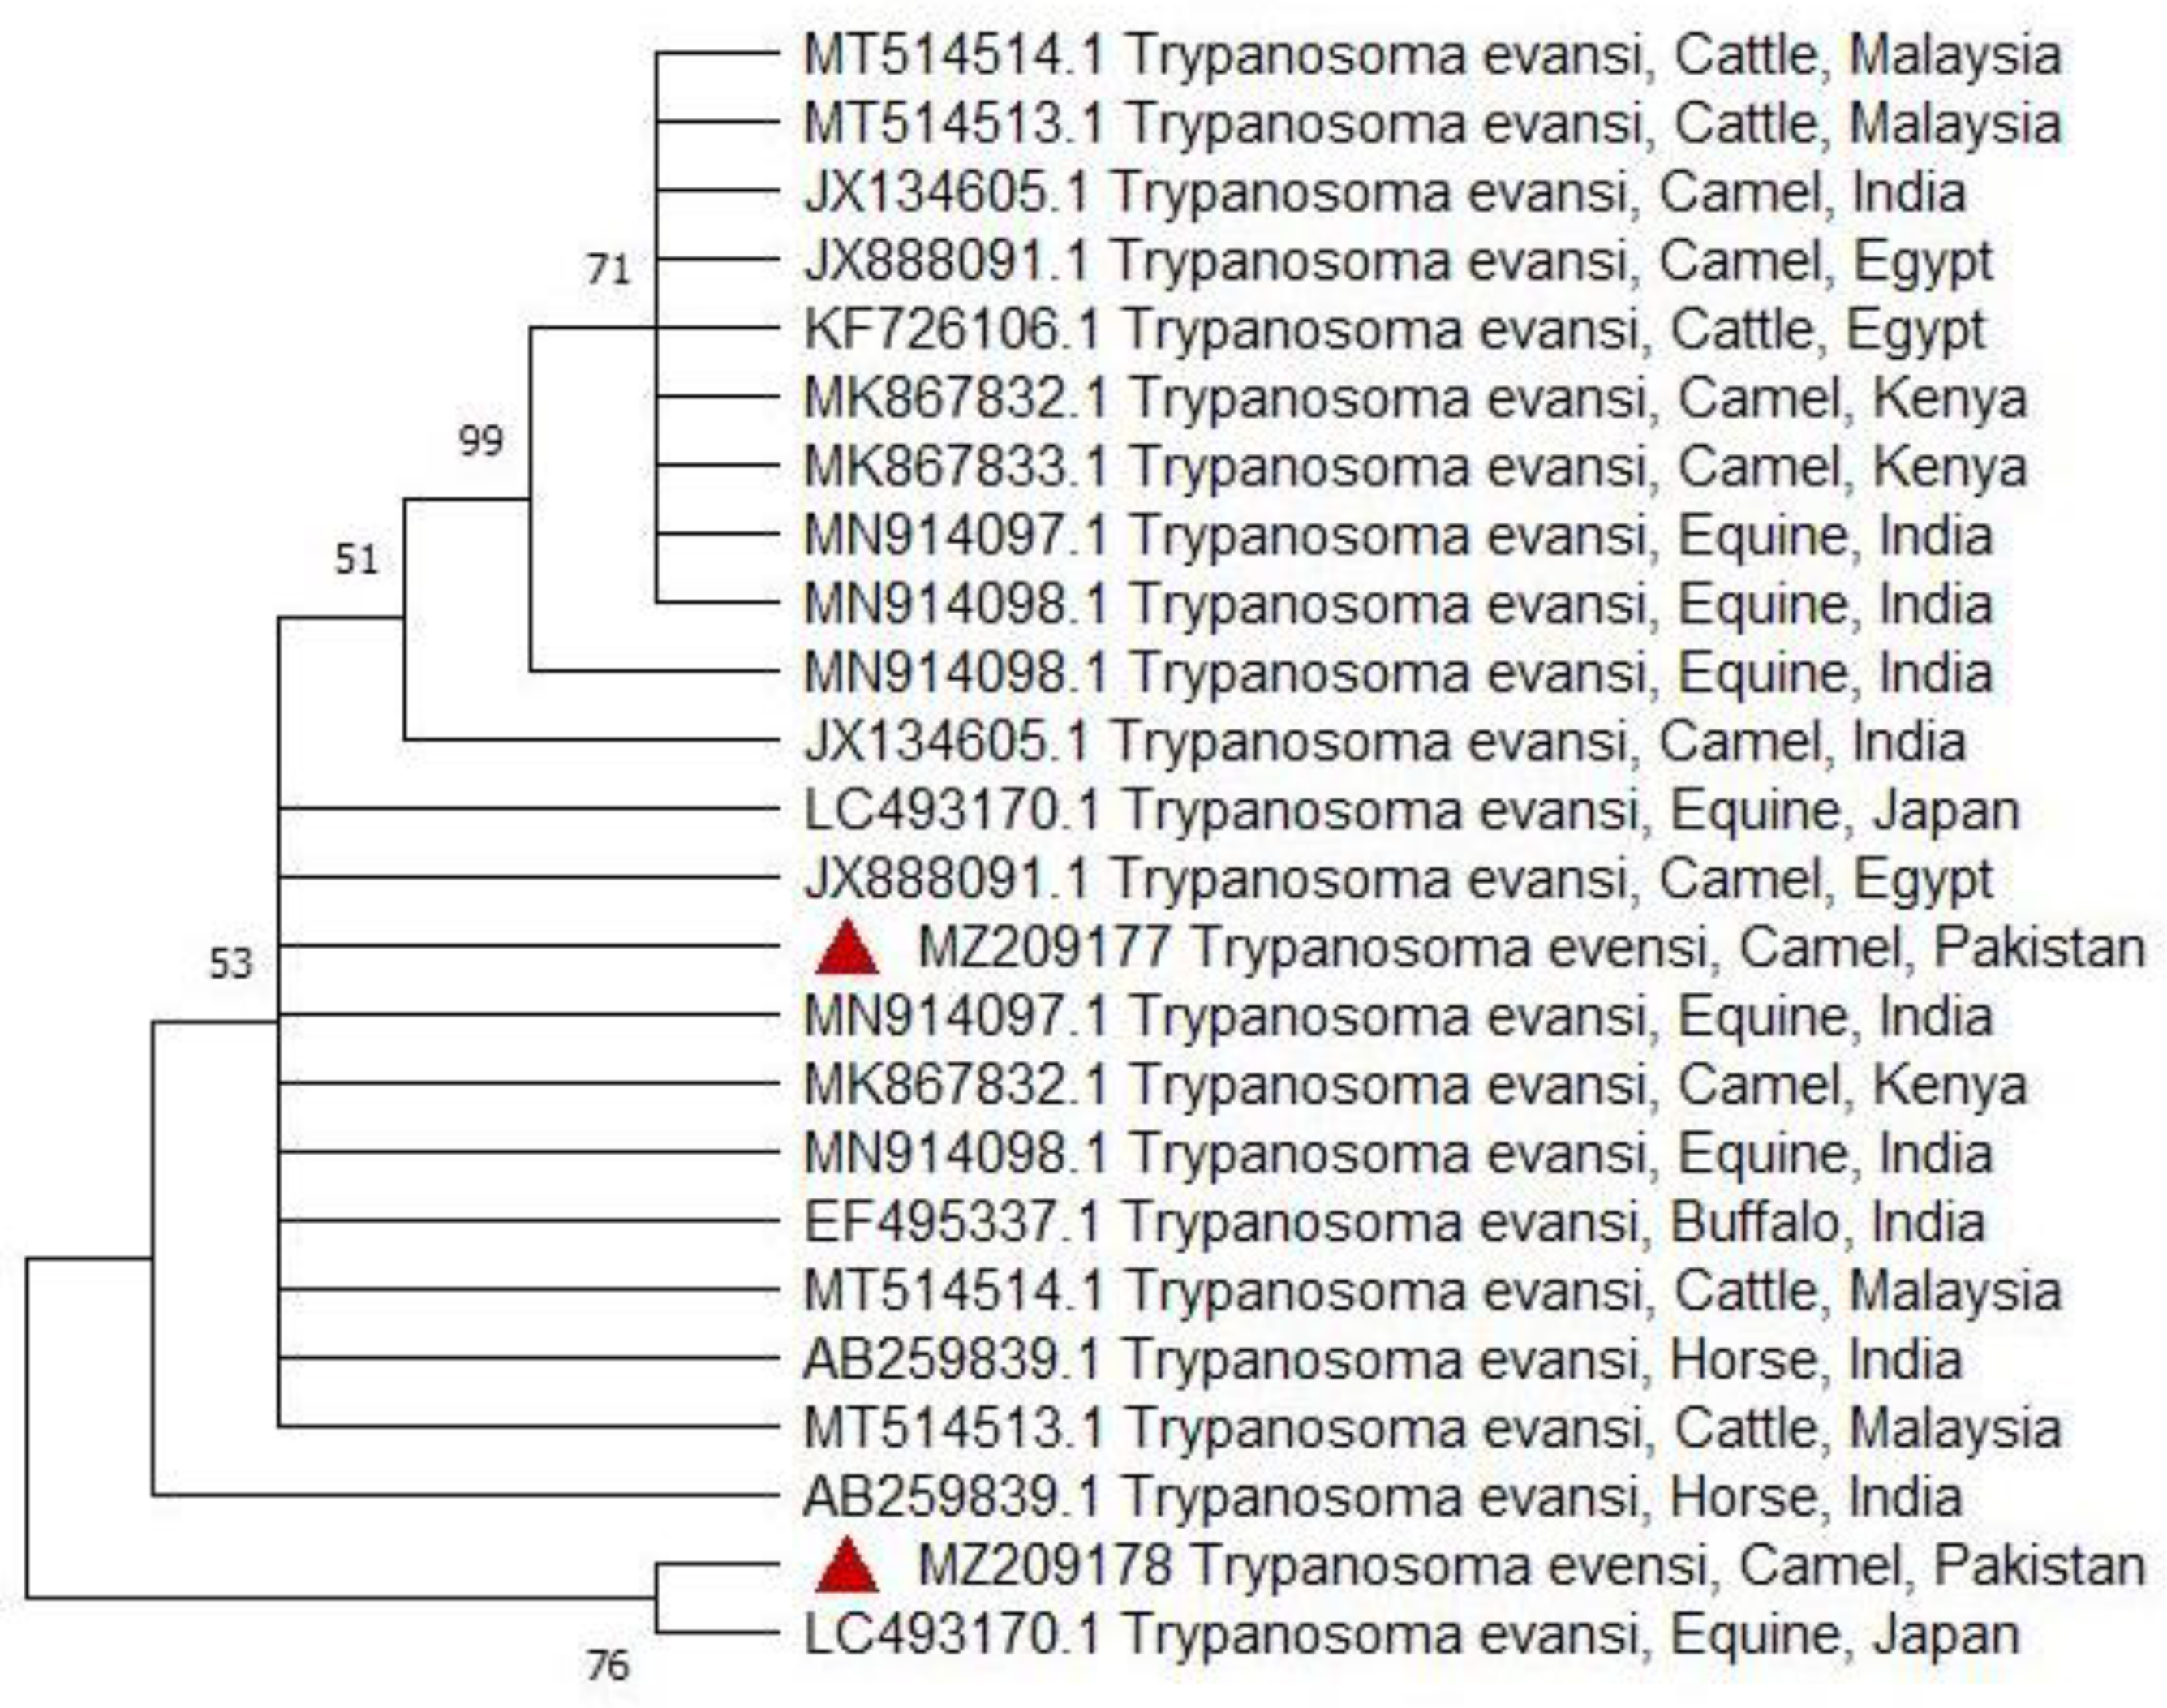
Figure 7.
pMUtec (Repetitive sequence of 237bp) based Phylogenetic relationships between samples in the present investigation and other reference sequences recovered from GenBank. Clade indicates percentage similarities at bootstrap value of 1000. The codes are the accession number obtained from NCBI. The current study isolate Trypanosoma evansi 1 and isolate 2 shows the 99 percent similarity to their common ancestor indicated with main branch root.
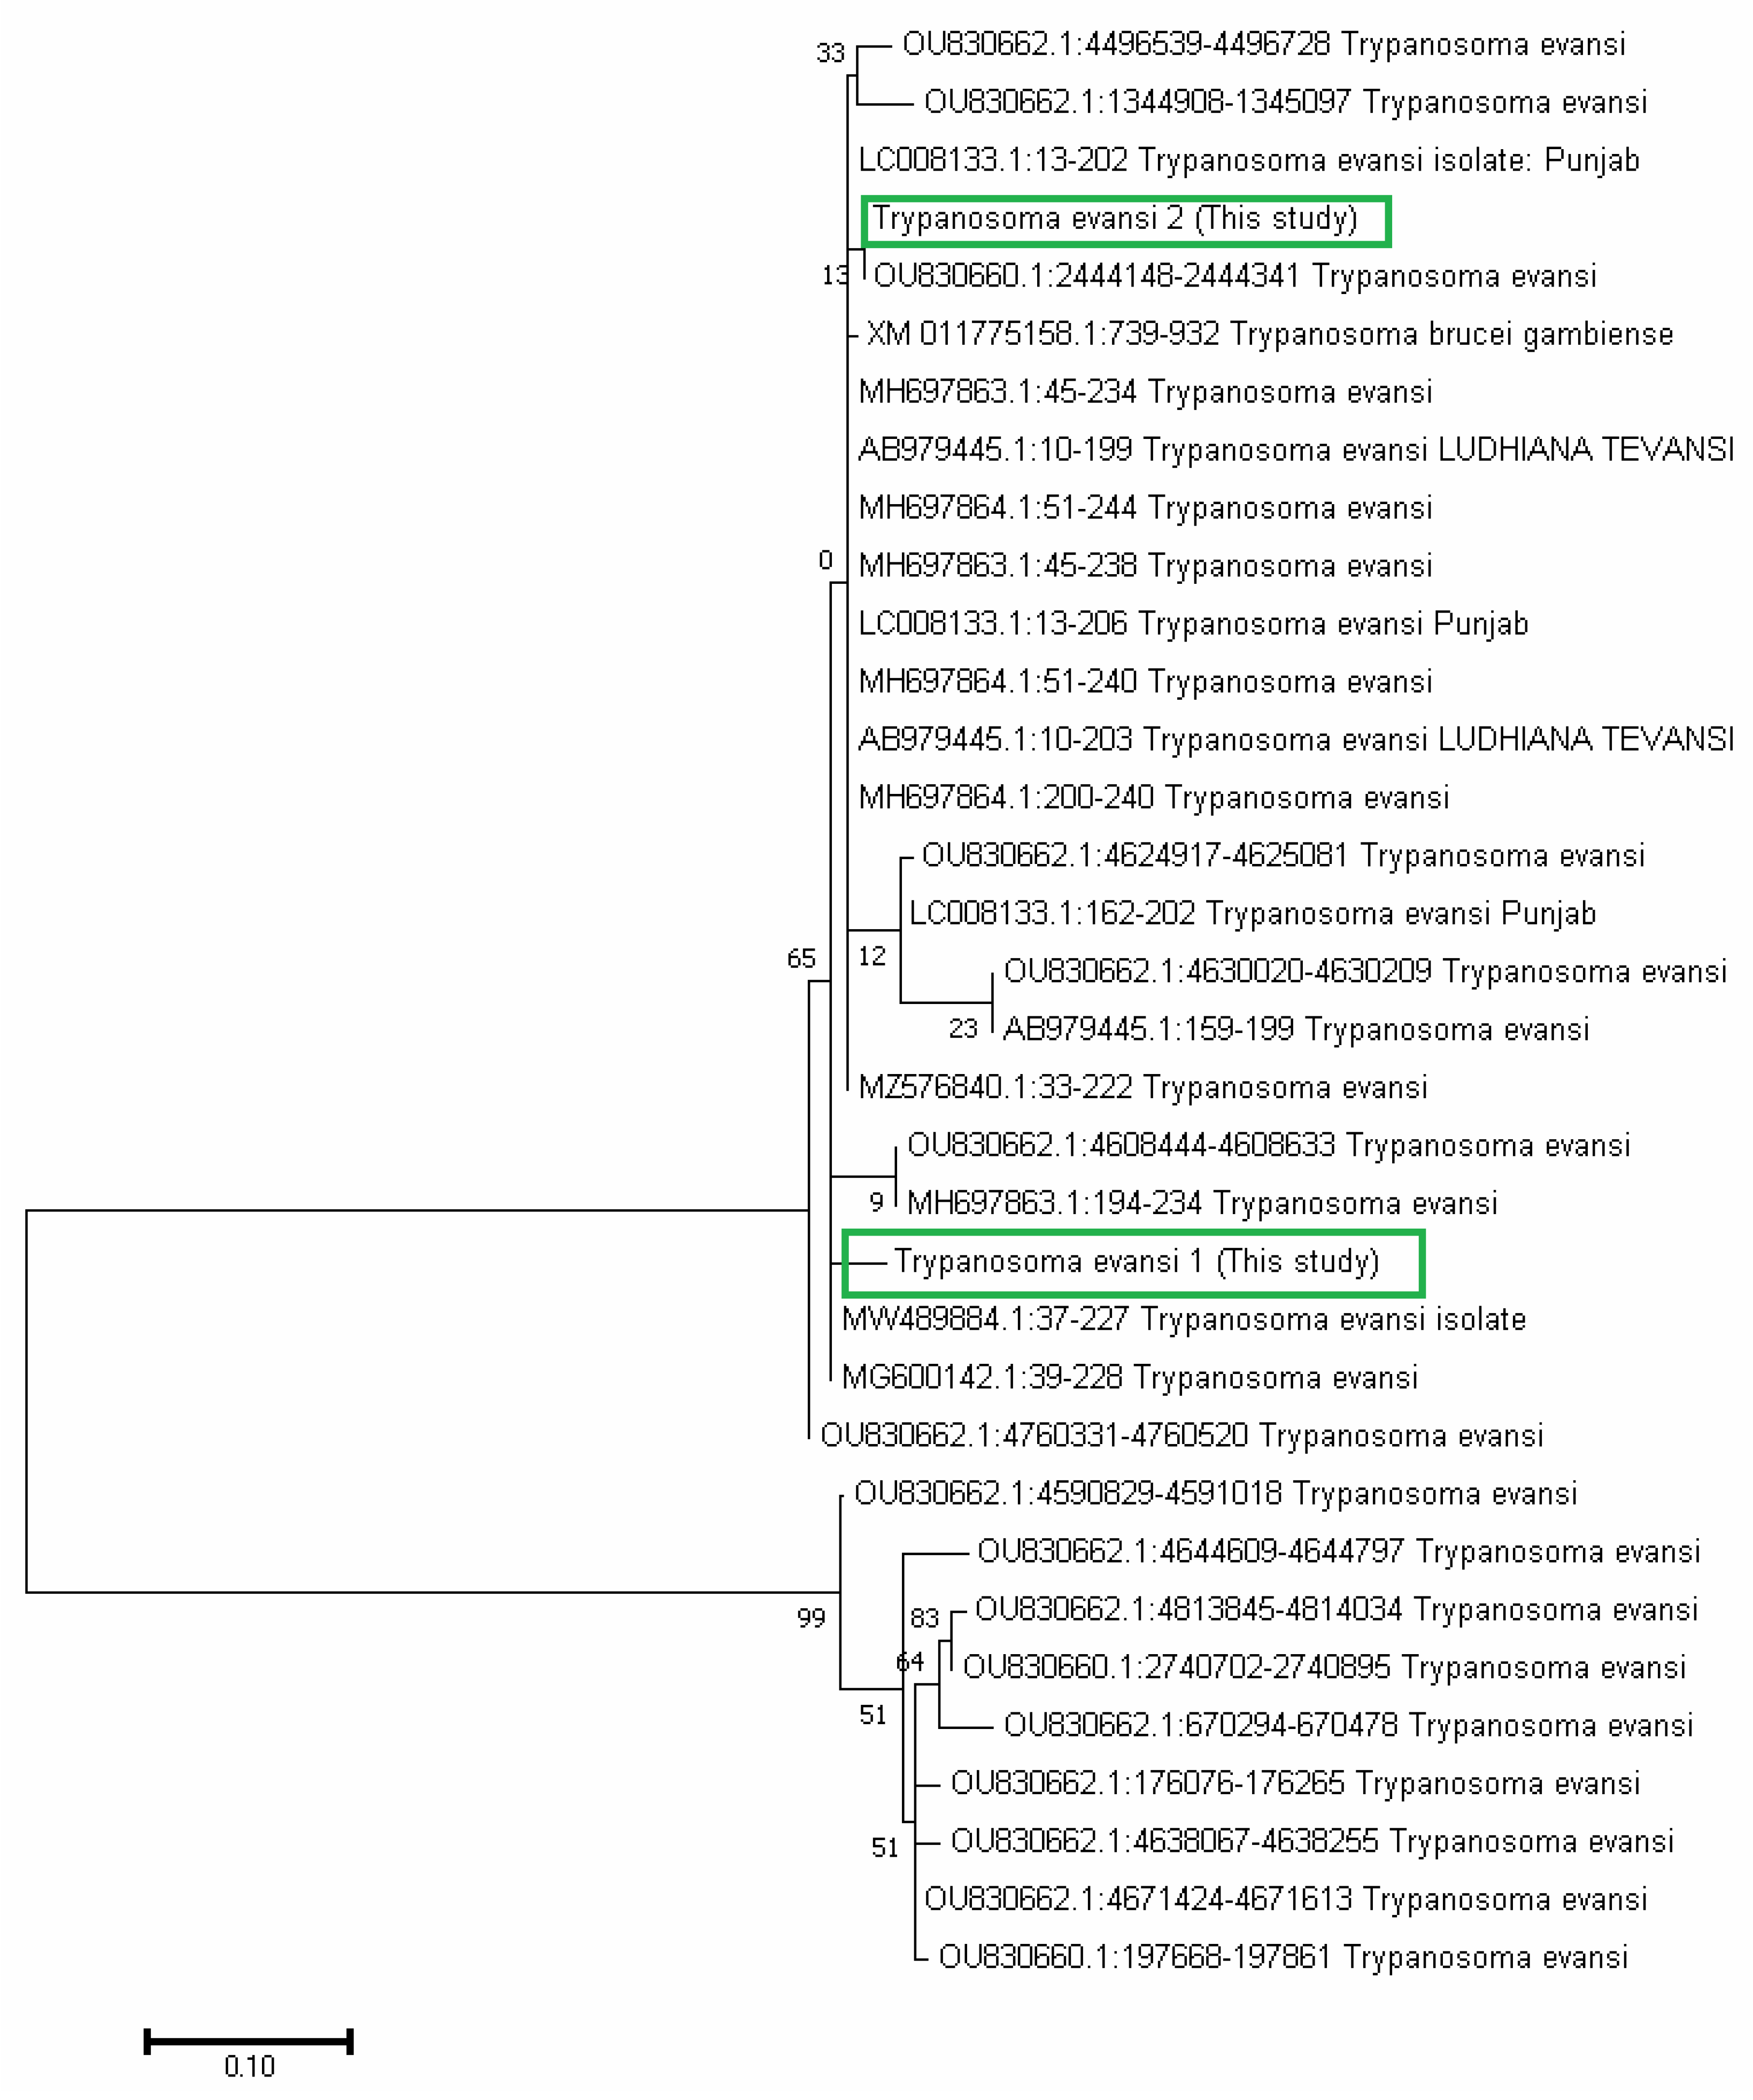
Figure 8.
Phylogenetic relationship of Pakistan isolates of Trypanosoma evansi with other trypanosomes parasites based on the (ITS-I) gene.
Figure 8.
Phylogenetic relationship of Pakistan isolates of Trypanosoma evansi with other trypanosomes parasites based on the (ITS-I) gene.
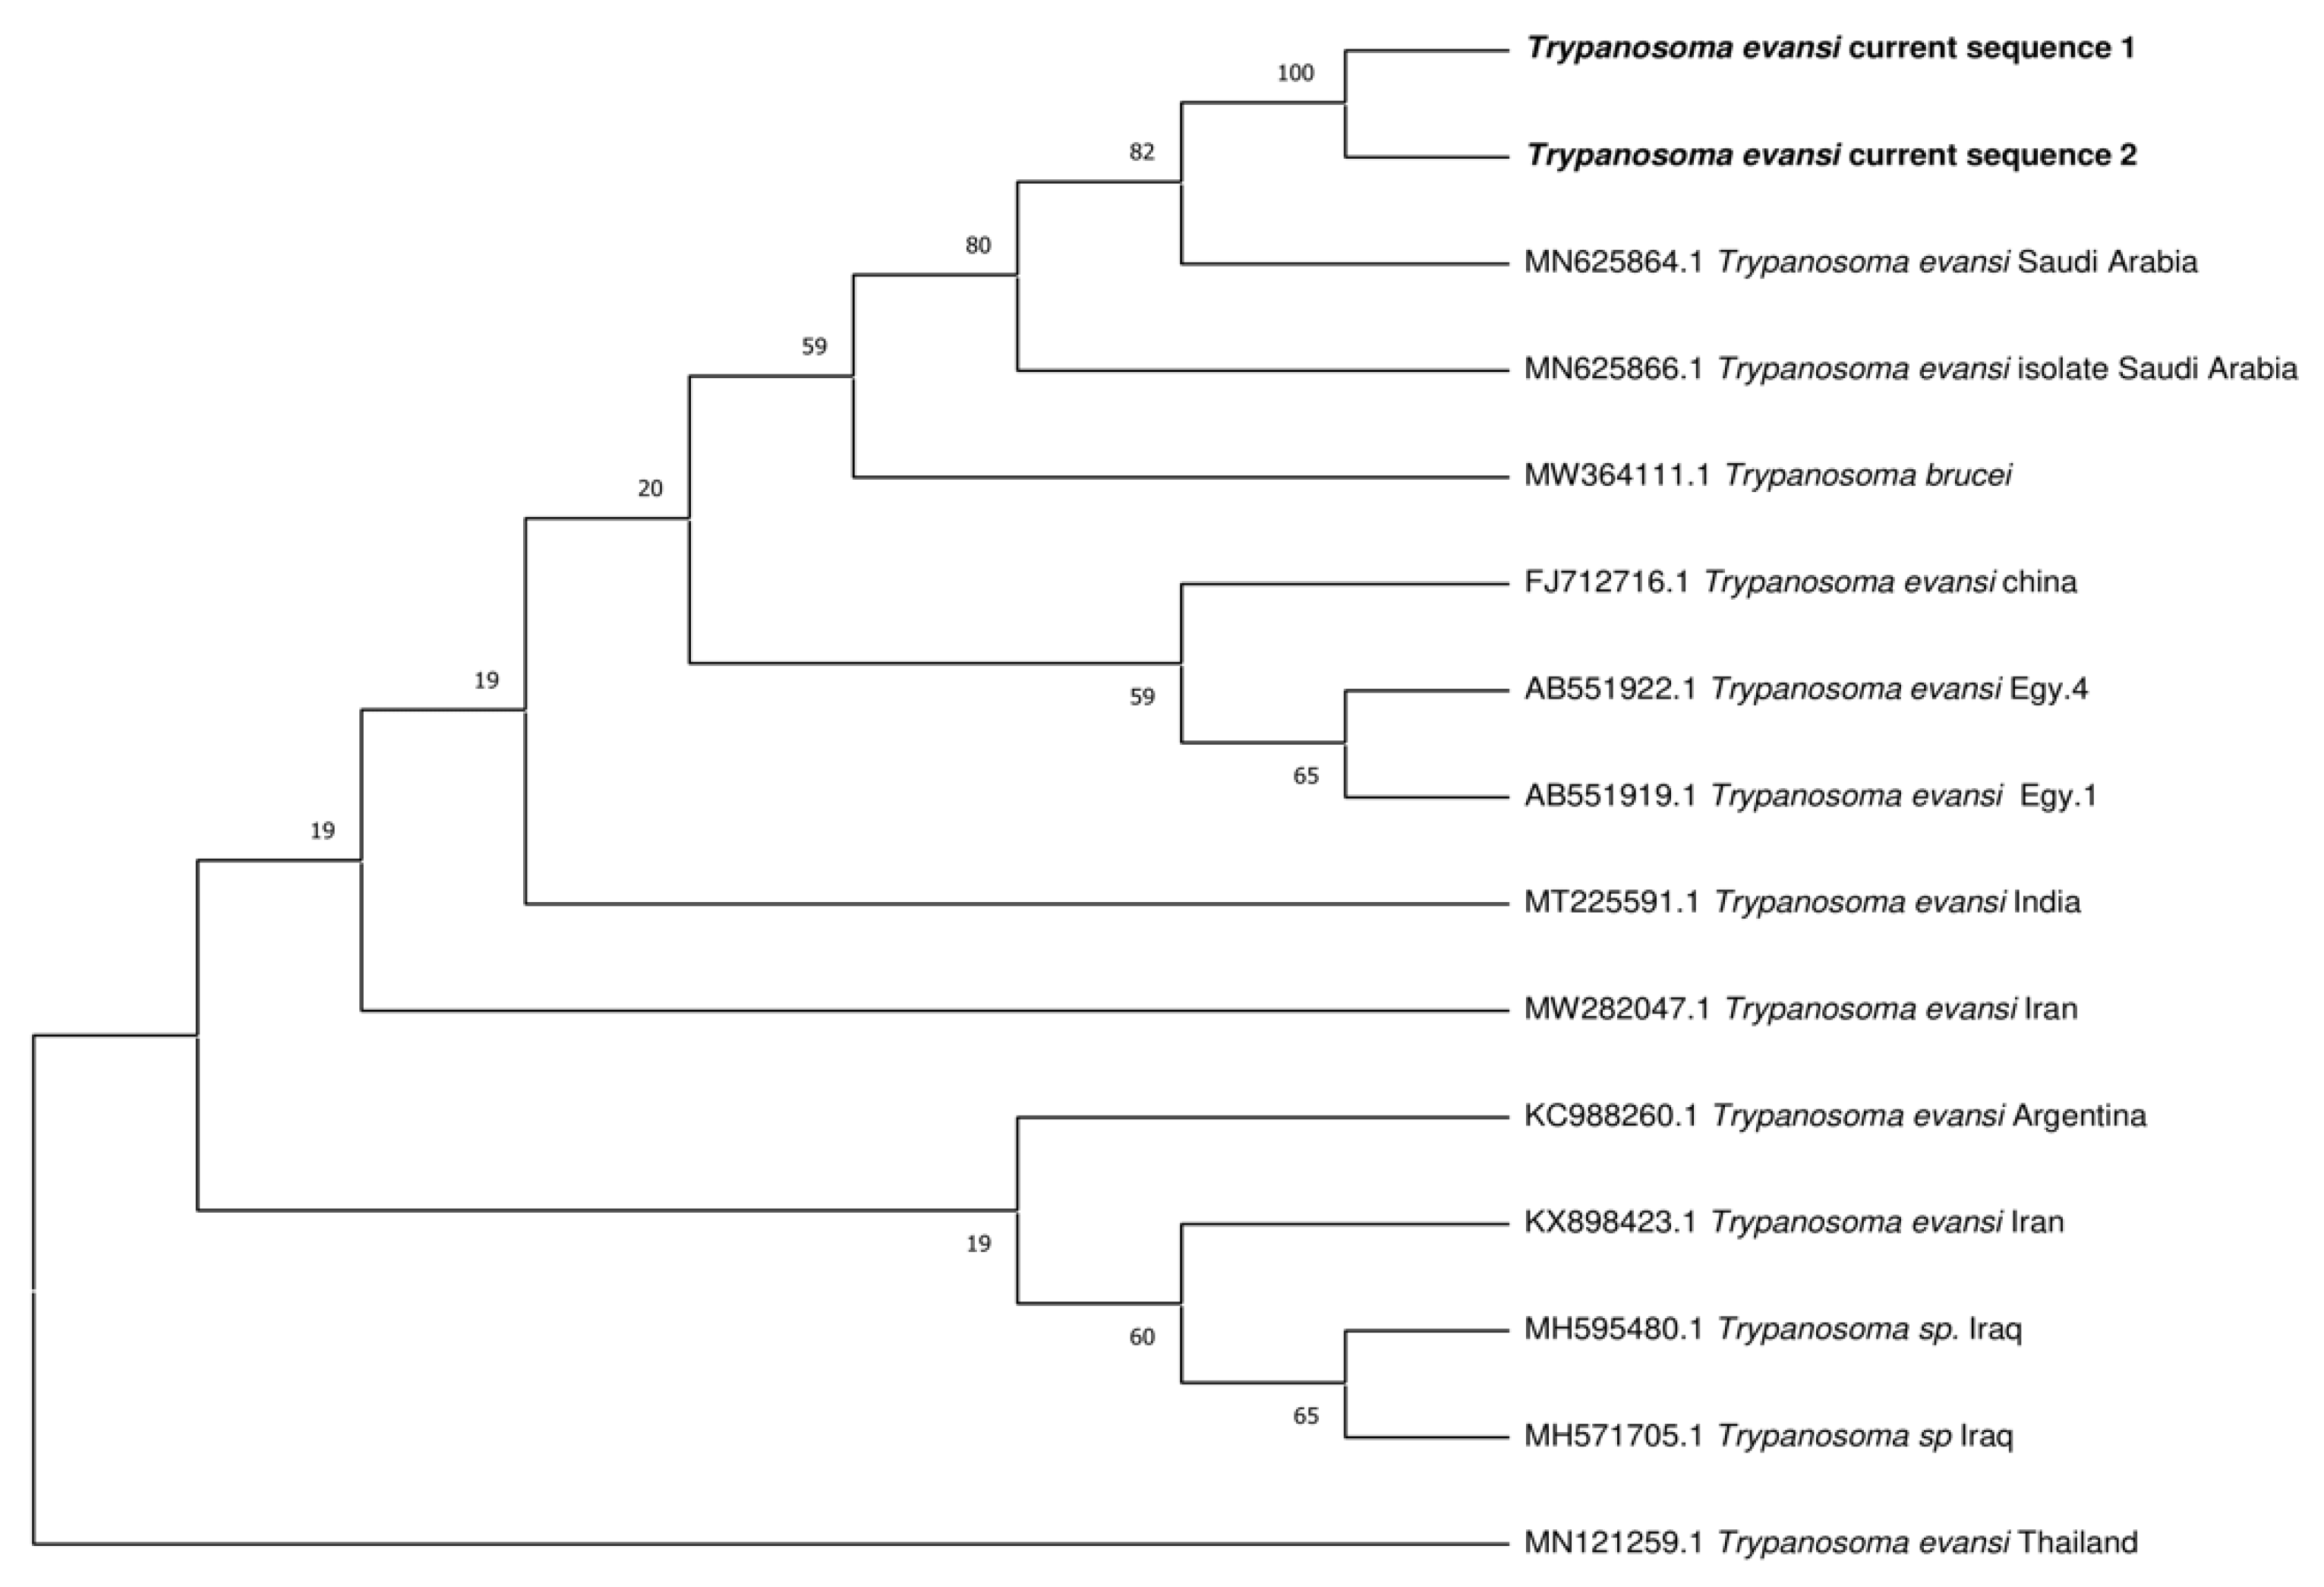
Table 1.
Set of Primers employed for molecular detection and sequencing.
| Primer | Primer Sequence (5’ To 3’) |
Expected Product (bp) | Reference |
|---|---|---|---|
| ITS1CF/BR | F:(CCGGAAGTTCACCGATATTG) R:(TTGCTGCGTTCTTCAACGAA) | 480 | Metwally et al., 2021 |
| pMUTec | F: (TGCAGACGACCTGACGTACT) R:(CTCCTAGAAGCTTCGGTGTCCT) |
227 | Pruvot et al., 2010 |
| RoTat 1.2 | F:(GCGGGGTGTTTAAAGCAATA) R: (ATTAGTGCTGCGTGTGTTCG) |
205 | Njiru et al., 2005 |
Table 4.
Comparison of PCR and microscopy used to detect T. evansi in camels (n = 400).
| PCR | Microscopy | Total | ||
|---|---|---|---|---|
| Negative | Positive | |||
| Negative | Count | 316 | 25 | 341 |
| Expected Count | 312.9 | 28.1 | 341.0 | |
| Positive | Count | 51 | 8 | 59 |
| Expected Count | 54.1 | 4.9 | 59.0 | |
| Total | Count | 367 | 33 | 400 |
| Expected Count | 367.0 | 33.0 | 400.0 | |
Table 5.
Agreement between PCR and Microscopy to detect T. evansi in camels (n = 400).
| Comparison | Observed Agreement | SE | Kappa Value | 95% CI of Kappa | Χ2 p-value | Strength |
|---|---|---|---|---|---|---|
| PCR Vs MS | 81.00% | 0.057 | 0.076 | -0.357, 0.188 | 0.108 | Slight |
Table 6.
Results of risk factors associated with the trypanosomiasis in sampled camels (n=400) from 10 districts of Punjab.
Table 6.
Results of risk factors associated with the trypanosomiasis in sampled camels (n=400) from 10 districts of Punjab.
| Variable | Category | Pos./Tested | Prev. % (95% CI) |
Odds Ratio (95% CI) |
p-Value |
|---|---|---|---|---|---|
| Provincial Zones | Northern & Central | 25/225 | 11.1 (7.3-16) | Ref. | χ2 = 5.416 p = 0.020 |
| Southern | 34/175 | 19.4 (13.8-26.1) | 1.93 (1.10-3.38) | ||
| Gender | Female | 46/251 | 18.3 (13.7-23.7) | 2.35 (1.22-4.51) | χ2 = 6.855 p = 0.009 |
| Male | 13/149 | 8.7 (4.7-14.5) | Ref. | ||
| Age Groups | < 2 Y | 10/87 | 11.5 (5.7-20.1) | Ref. | χ2 = 1.488 p = 0.475 |
| 2-5 Y | 21/149 | 14.1 (8.9-20.7) | 1.26 (0.57-2.82) | ||
| > 5 Y | 28/164 | 17.1 (11.7-23.7) | 1.59 (0.75-3.59) | ||
| Tick Infestation | No | 16/192 | 8.3 (4.8-13.2) | Ref. | χ2 = 12.090 p = 0.001 |
| Yes | 43/208 | 20.7 (15.4-26.8) | 2.87 (1.56-5.29) | ||
| Wall Cracks | No | 37/276 | 13.4 (9.6-18) | Ref. | χ2 = 1.279 p = 0.258 |
| Yes | 22/124 | 17.7 (11.5-25.6) | 1.39 (0.78-2.48) | ||
| Contact with other Livestock | No | 16/134 | 11.9 (7-18.7) | Ref. | χ2 = 1.265 p = 0.261 |
| Yes | 43/266 | 16.2 (12-21.2) | 1.42 (0.77-2.63) | ||
| Physical appearance | Emaciated | 51/307 | 16.6 (12.6-21.3) | 2.12 (0.97-4.64) | χ2 = 3.642 p = 0.056 |
| Normal | 8/93 | 8.6 (3.8-16.2) | Ref. | ||
| Housing Management | Sand based | 42/214 | 19.6 (14.5-25.6) | 2.43 (1.33-4.43) | χ2 = 8.702 p = 0.003 |
| Soil based | 17/186 | 9.1 (5.4-14.2) | Ref. | ||
| Fly Control | No | 42/296 | 14.2 (10.4-18.7) | Ref. | χ2 = 0.285 p = 0.594 |
| Yes | 17/104 | 16.4 (9.8-24.9) | 1.18 (0.64-2.18) | ||
| Location of Feed & Water | Indoor | 13/125 | 10.4 (5.7-17.1) | Ref. | χ2 = 2.736 p = 0.098 |
| Outdoor | 46/275 | 16.7 (12.5-21.7) | 1.73 (0.89-3.33) | ||
| Purpose | Draught | 33/190 | 17.4 (12.3-23.5) | 1.49 (0.85-2.60) | χ2 = 1.973 p = 0.160 |
| Production | 26/210 | 12.4 (8.2-17.6) | Ref. | ||
| Herd Size | <= 3 | 27/153 | 17.7 (12-24.6) | Ref. | χ2 = 2.127 p = 0.546 |
| 4 to 6 | 11/99 | 11.1 (5.7-19) | 0.58 (0.28-1.24) | ||
| 7 to 10 | 12/87 | 13.8 (7.3-22.9) | 0.75 (0.36-1.56) | ||
| > 10 | 9/61 | 14.8 (7-26.2) | 0.81 (0.36-1.84) |
Table 7.
Results of binary logistic regression analysis indicating variables associated with T. evansi prevalence in sampled camels (n = 400).
Table 7.
Results of binary logistic regression analysis indicating variables associated with T. evansi prevalence in sampled camels (n = 400).
| Variable Name | Exposure Variable | Comparison | OR | 95% CI | p-Value |
|---|---|---|---|---|---|
| Provincial Zones | Southern Punjab | Northern & Central Punjab | 1.9 | 1.05-3.35 | 0.034 |
| Gender | Female | Male | 2.2 | 1.11-4.24 | 0.023 |
| Tick Infestation | Yes | No | 2.6 | 1.37-4.79 | 0.003 |
| Housing Management | Sand Based | Soil Based | 2.2 | 1.16-3.99 | 0.01 |
Model Fit: Nagelkerke R2 = 0.128, Hosmer and Lemeshow Test (χ2 = 7.038, p = 0.533).
Table 8.
Comparison of serum biochemical parameters between T. evansi positive (n = 59) and negative (n = 341) camels.
Table 8.
Comparison of serum biochemical parameters between T. evansi positive (n = 59) and negative (n = 341) camels.
| Parameters | Positive (n=59) | Negative (n=341) | p-Value |
|---|---|---|---|
| Total Protein (g/dl) | 05.51 ± 0.05 | 06.77 ±0.08 | <0.01 |
| Albumin (g/dl) | 02.77 ± 0.04 | 03.65±0.04 | <0.01 |
| Globulin (g/dl) | 02.57 ± 0.06 | 03.12 ±0.08 | <0.01 |
| A\G Ratio | 01.13 ± 0.04 | 01.18 ±0.03 | 0.319 |
Disclaimer/Publisher’s Note: The statements, opinions and data contained in all publications are solely those of the individual author(s) and contributor(s) and not of MDPI and/or the editor(s). MDPI and/or the editor(s) disclaim responsibility for any injury to people or property resulting from any ideas, methods, instructions or products referred to in the content. |
© 2025 by the authors. Licensee MDPI, Basel, Switzerland. This article is an open access article distributed under the terms and conditions of the Creative Commons Attribution (CC BY) license (http://creativecommons.org/licenses/by/4.0/).
Copyright: This open access article is published under a Creative Commons CC BY 4.0 license, which permit the free download, distribution, and reuse, provided that the author and preprint are cited in any reuse.


