Preprint
Article

This version is not peer-reviewed.

Analysis of Nitric Oxide and Nitrogen Dioxide Variability at a Central Mediterranean WMO/GAW Station

A peer-reviewed article of this preprint also exists.

Submitted:

18 August 2025

Posted:

19 August 2025

You are already at the latest version

Abstract

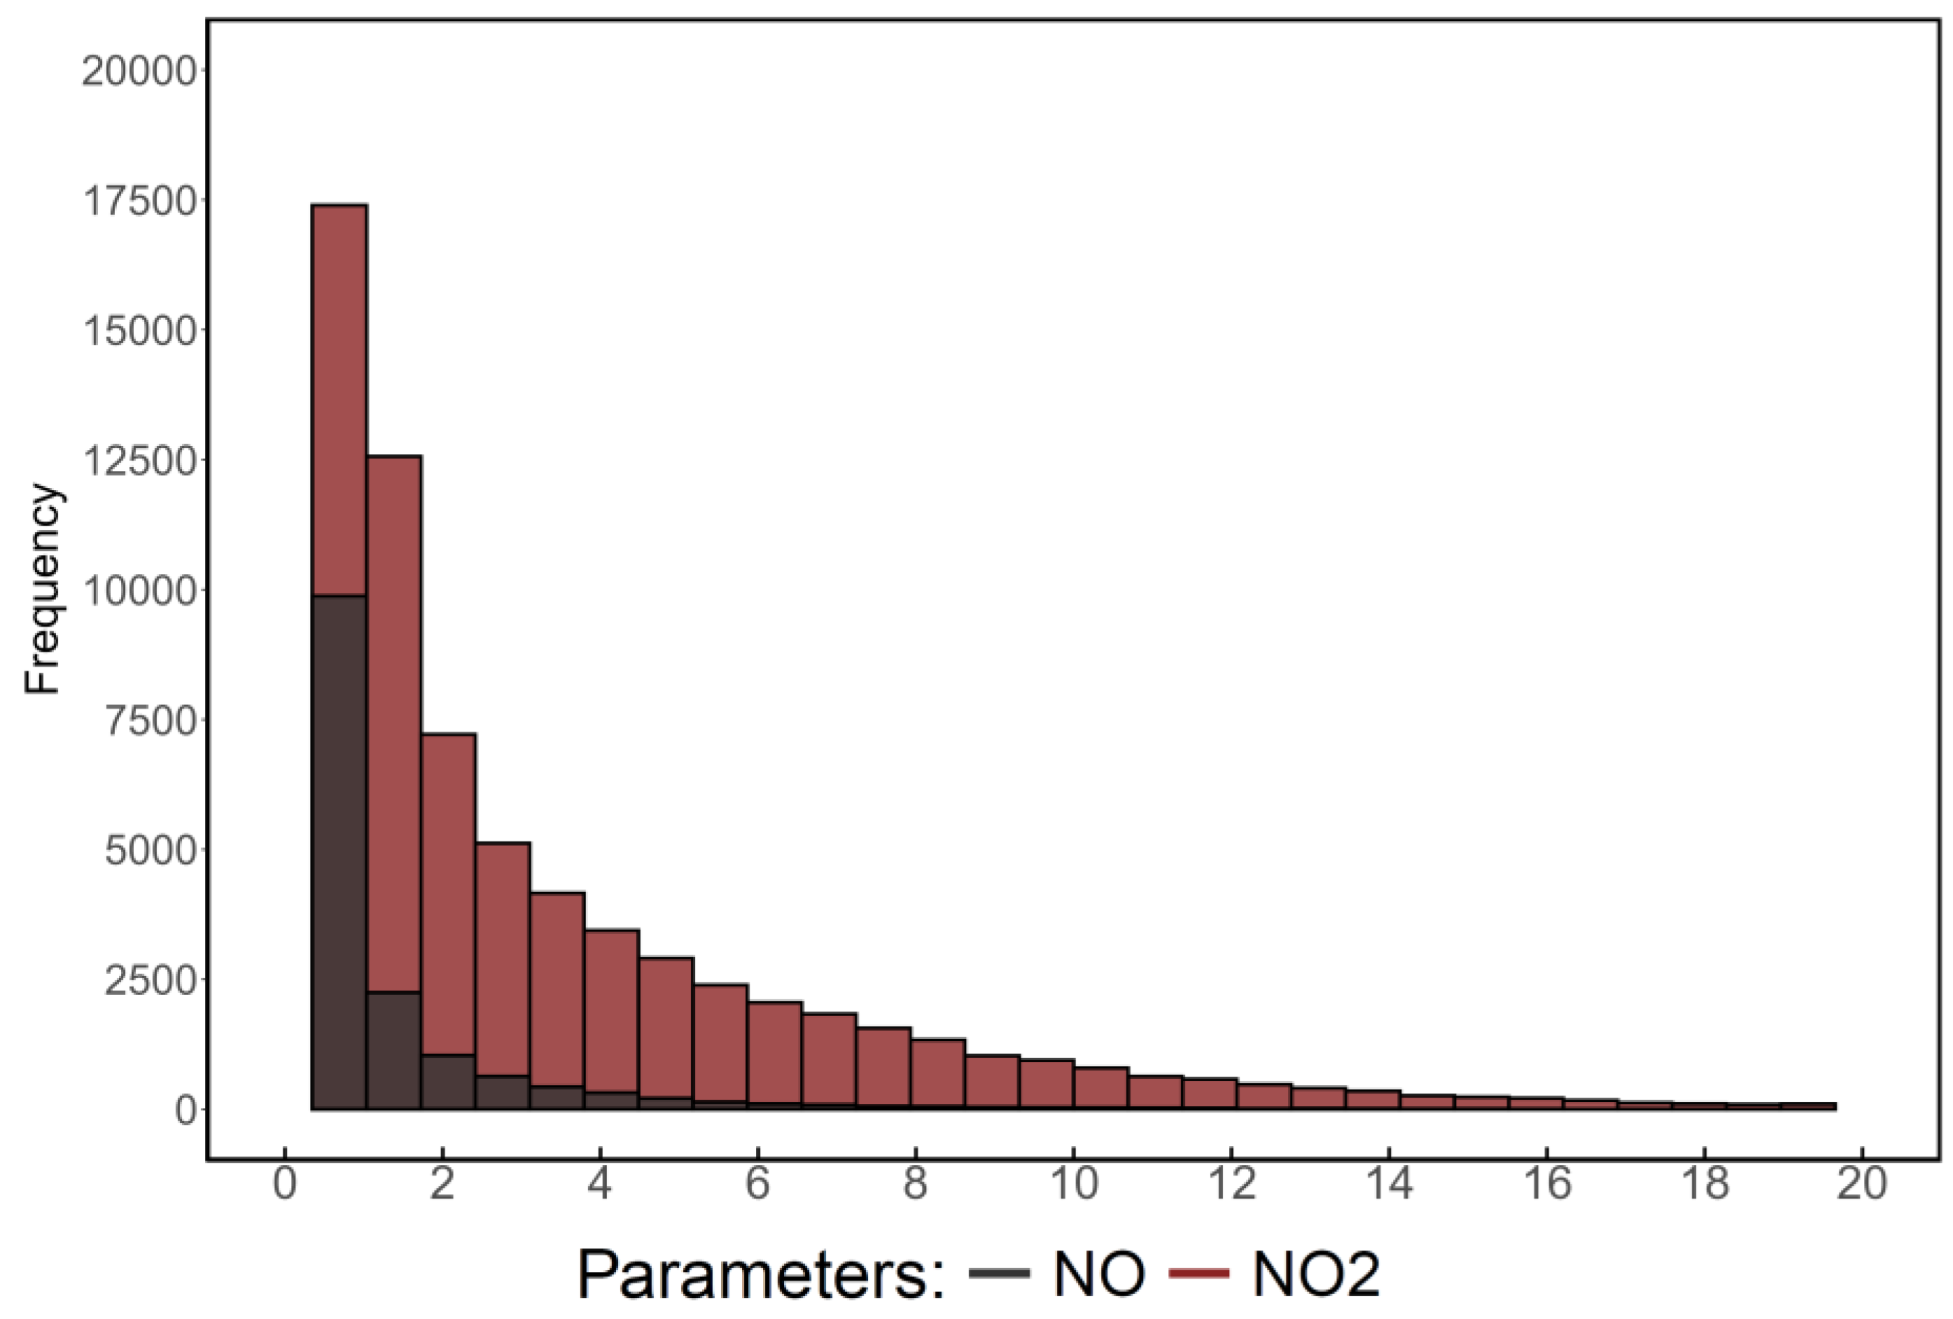
The World Meteorological Organization / Global Atmosphere Watch (WMO/GAW) observation site of Lamezia Terme (code: LMT) in Calabria, Italy has been measuring nitric oxide (NO) and nitrogen dioxide (NO2) (together referred to as NOx) for a decade, however only a limited number of studies have evaluated their variability at the site, accounting for short measurement periods. In this work, nine continuous years (2015-2023) of measurements are analyzed to assess daily, weekly, seasonal and multi-year tendencies, also accounting for local wind circulation, which is known to have a relevant impact on LMT’s measurements due to the station’s coastal characteristics in the context of the central Mediterranean Basin. For the first time, a multi-year evaluation on LMT data also considers the local vertical wind profile record to integrate conventional measurements with additional information on air mass transport at low altitudes. The analysis showed peaks in early morning NOx concentrations attributable to rush hour traffic, while in the evening NO2 peaks are present with minor NO counterparts. Weekly cycles have yielded the most statistically significant results of any other similar evaluation at the sites, with all combinations of parameters, seasons, and wind corridors indicating tangible differences between weekday (Monday to Friday) and weekend (Saturday and Sunday) concentrations. The analysis of multi-year variability has shown a slightly declining tendency, however sporadic bursts in concentrations limit the statistical significance of downward trends.

Keywords: 
;  ;  ;  ;  ;  ;  

1. Introduction

During Earth’s history, atmospheric composition has been subject to major changes reflecting geodynamical mechanisms and direct influence from the biosphere [1,2,3].
Oxygen and nitrogen are the most abundant elements in the atmosphere; despite their abundance, at low temperatures these elements do not tend to interact with each other, although exceptions can occur [4]. Natural phenomena such as lightnings can release ≈100 TgN yr-1 of LNOx (lightning-induced nitrogen oxides) every year on a global scale [5,6,7,8,9,10,11,12,13,14,15].
NOx are generally not classified as greenhouse gases (GHGs), however they play a major role in the atmospheric chemistry of compounds that do have a direct impact on Earth’s climate [16]. NOx have in fact a notable impact on atmospheric CH4 [17,18], reducing concentrations up to 1000 ppb, according to several studies [19]. Reactions with the hydroxyl radical (OH) affect the oxidation potential of Earth’s atmosphere, or AOC (Atmospheric Oxidation Capacity), thus playing a major role in the global budget of several compounds [20,21,22]. NOx are also known to react with tropospheric O3 (ozone) [23,24,25,26,27,28,29,30], leading to the introduction of a new methodology, the O3/NOx ratio [31,32], which can be used to differentiate local and remote sources of emission [33].
Biomass and fossil fuel burning, and extensive fertilizer use in the agricultural sector, are known to be the main sources of anthropogenic NOx [34,35,36,37,38,39]. Due to cooking and similar activities, indoor concentrations can match or even exceed outdoor concentrations under specific conditions [40,41,42]. The vertical profile of NOx in the troposphere also reflects the heterogeneous nature of its sources, with natural NOx (e.g., lightning-induced) being present at multiple altitude thresholds, while that resulting from anthropogenic emissions can be concentrated over near-surface altitudes [43,44,45,46,47,48,49], thus posing a direct hazard for human health and the environment.
NOx are also well known in literature in terms of negative impacts on human health and the environment [50,51,52,53,54]. At typical conditions and concentrations, NO does not pose a tangible hazard to human health, however increased concentrations can cause a number of ailments, affecting multiple organs of the human body [55,56,57,58,59,60]. High concentrations of NO2 are also associated with a number of diseases, mostly affecting the respiratory system [61,62,63,64,65,66,67,68,69]. The effects of NOx are partially mitigated by their short atmospheric lifetime, which ranges between a few hours to nearly one day, depending on several factors such as seasonality, reactions with O3 and other molecules, the presence of aerosols, and even NOx concentration itself [70,71,72,73,74,75,76,77]. The short lifetime, combined with notable anthropogenic inputs, make NOx effective tracers of anthropic activities, and several methodologies/instruments are actively employed to measure their concentrations [78,79].
At the Lamezia Terme (code: LMT) World Meteorological Organization / Global Atmosphere Watch (WMO/GAW) regional observation site in Calabria, Italy continuous measurements of NOx are in place since 2015. However, evaluations of these measurements were limited to preliminary data from the site [80] and the analysis of trends observed during the first COVID-19 lockdown in the country [81]. Due to the primary anthropogenic nature of NOx in the region, a more detailed understanding of its variability at the WMO site would allow to better assess anthropogenic emissions and discriminate them from natural sources. This work evaluates nine years of NOx continuous measurements (2015-2023) to provide unprecedented detail on its variability at the site. The paper is organized as follows: Section 2 describes the LMT station and its characteristics, as well as all employed methodologies; Section 3 shows the results of this work; Section 4 and 5 discuss the results and conclude the work, respectively.

2. The Observation Site and Employed Methodologies

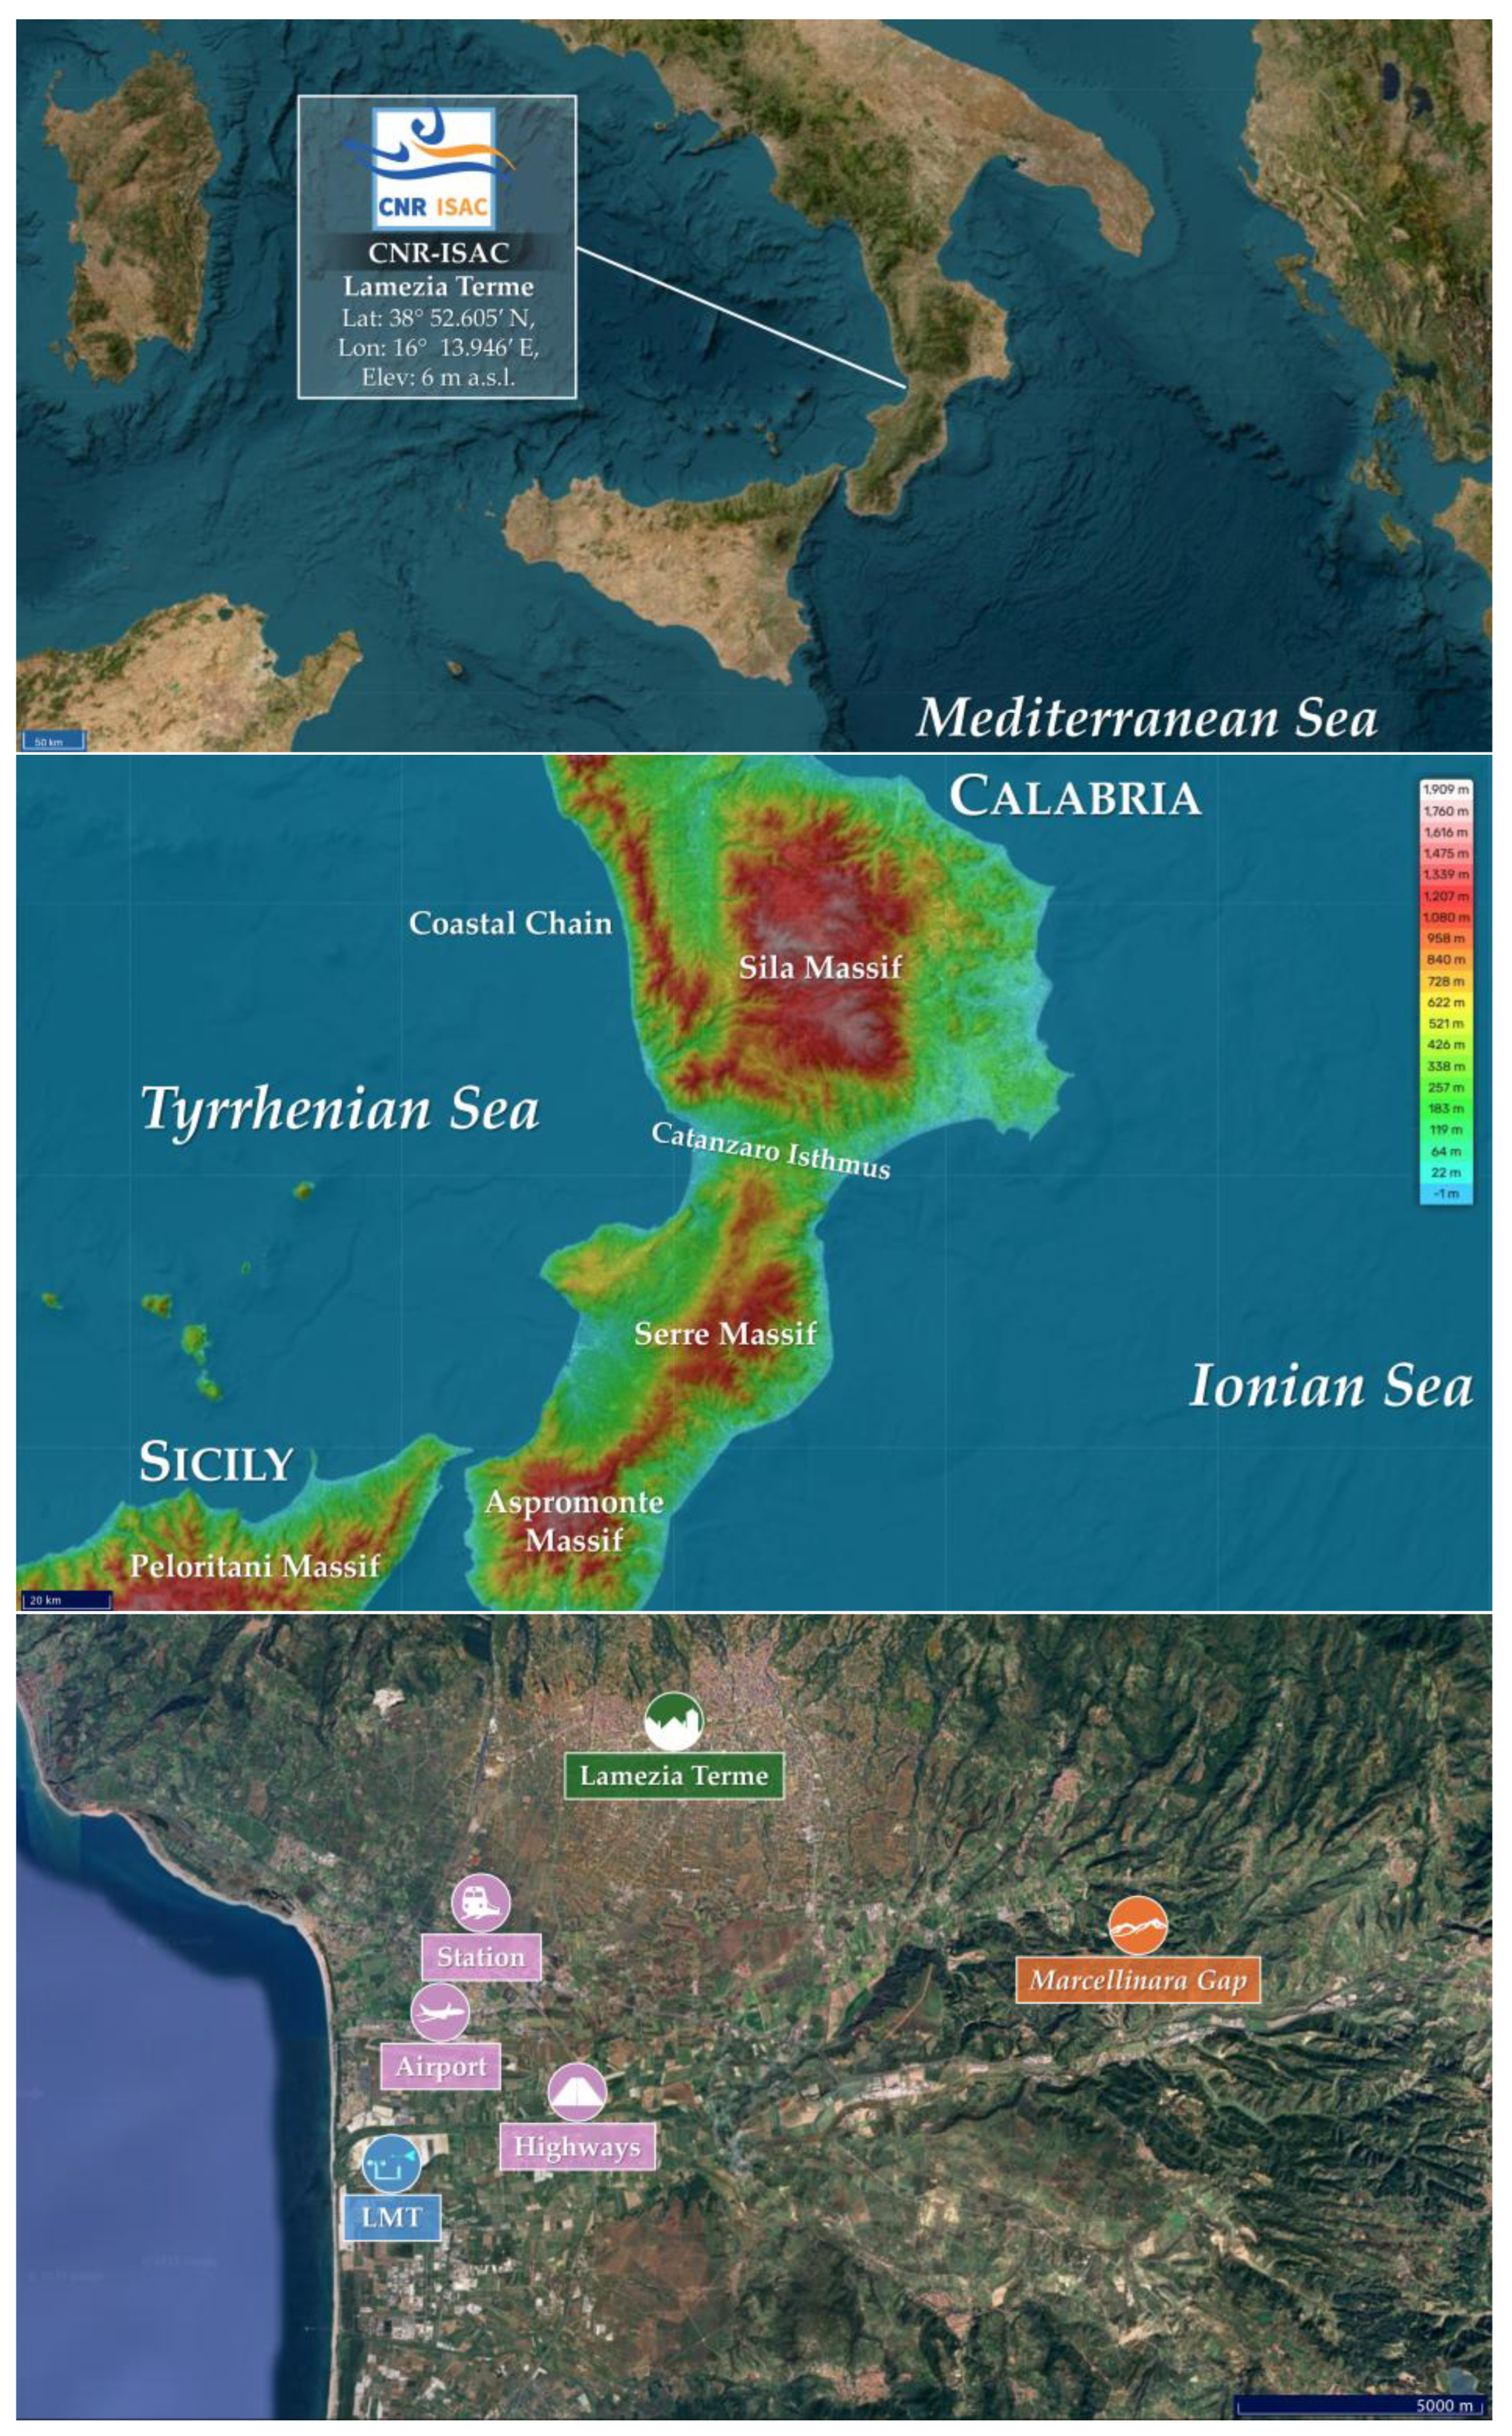
2.1. Characteristics of the LMT Regional Site in Calabria, Italy

Operated by the National Research Council of Italy – Institute of Atmospheric Sciences and Climate), the LMT regional observation site is located in Calabria, Italy, in the municipality of Lamezia Terme (Lat: 38° 52.605’ N; Lon: 16° 13.946’ E; Elev: 6 m a.s.l.) (Figure 1A). LMT is part of the World Meteorological Organization / Global Atmosphere Watch (WMO/GAW) network and has been performing continuous measurements of GHGs, aerosols, and meteorological parameters since 2015.
Specifically, the site is located 600 meters from the Tyrrhenian coast of Calabria, in the westernmost area of the Catanzaro Isthmus which is the narrowest point in the entire Italian peninsula, as the distance between the western and eastern (Ionian) coasts is ≈32 kilometers. The isthmus is bounded by several mountain ranges: the Sila Massif and Coastal Chain in the north, and the Serre Massif in the south (Figure 1B). Its present-day configuration is the result of multiple geologic processes: in the early Quaternary, the isthmus was a tidal strait effectively connecting the Tyrrhenian and Ionian seas, as evidenced by sedimentological outcrops of 2D and 3D dunes which highlight the evolution of the strait over time [82,83,84,85,86]. Various cycles of regression and transgression, linked to the Calabrian tectonic uplift [87,88,89,90,91], combined with major sea level oscillations, such as those caused by alternate glacial and interglacial periods [88,89,90,92,93], have ultimately resulted in sea currents being cut off between the two seas, thus leading to the present day configuration with only ≈32 km separating the Tyrrhenian and Ionian coasts of the region.
The closure of the strait is the last step of a series of large-scale processes affecting the CPA (Calabria-Peloritani Arc), which also includes northeastern Sicily [94,95,96,97]. The CPA was once part of present-day southern France, but became subject to intense tectonics which rifted it apart following the opening of the Alpine Tethys domain; this resulted in a continental drift in the southeastern direction, which ultimately caused the CPA to collide with the rest of the Italian peninsula and the Sicilian Maghrebides [98,99]. The process is still in place, as evidenced by seismic activity and fault lines compatible with an active southeastern drift [100,101,102]; the Tyrhenian Sea opening, which is believed to have occurred at rates among the fastest ever documented on Earth, is further evidence of this drift [103,104].
In addition to drifting and substantial changes in the CPA’s location in the context of the developing Mediterranean Basin, the CPA itself has been widely reshaped by fault systems [105,106,107,108], locally, these mechanisms result in the Catanzaro isthmus being bounded by three distinct mountain ranges via active fault systems [109,110,111], including a major fault system between Lamezia Terme and Catanzaro, oriented on an east-west axis, which bounds the northern part of the isthmus [112,113], while the southern part is bounded by the Curinga-Girifalco line, which shows a W-NW/E-SE orientation [112,114,115]. The active nature of the tectonic features of the area lead to period seismic activity, which can reach very notable peaks: according to a database of historical records on all major earthquakes occurred in Italy from the year 1000 AD onward, three out of ten earthquakes with an estimated magnitude of Mw 6.95 or greater have occurred in a ≈20 km radius from LMT’s current location, with major social, economic, and even geomorphological consequences [116,117].
The geomorphological framework of the area, shapes by tectonics, results in a peculiar near-surface wind circulation, with a well-defined NE/W axis measured by LMT over the course of several years [118,119,120]. While near-surface circulation is strongly affected by daily cycles alternating westerly and northeastern winds at LMT, at higher altitudes, when the 850 hPa level is considered, the preferential wind direction is northwestern, in accordance with large-scale forcing in the area [118]. Breeze regimes and their seasonal patterns are a key factor in the regulation of near-surface wind circulation at LMT [118]. Diurnal circulation between November and February is regulated by large-scale forcing; between March and October, diurnal breezes result from a combination of large-scale and local flows; nighttime flows have been evaluated and found to be related to nocturnal breeze regimes [119].
Local wind circulation has a notable impact on air traffic: the Lamezia Terme International Airport (IATA: SUF; ICAO: LICA), located 3 kilometers north from the WMO/GAW station and built between 1965 and 1976, has a runway orientation of 100/280 °N (RWY 10/28), and the direction of inbound and outbound traffic reflects alternating wind corridors.
Preliminary data on reactive gases and methane (CH4) at the site provided the first evidence of wind circulation’s impact on the concentration of gases at LMT [80]. These early evaluations also indicated the presence of NOx peaks compatible with early morning rush hour traffic. Over time, the analysis of cyclic and multi-year patterns of a number of parameters has allowed to better understand local variability and the influence of wind circulation: CH4 has northeastern-continental peaks primarily linked to low wind speeds, and low concentrations linked to high speed (HBP or “Hyperbola Branch Pattern”) [124]; ozone (O3) is characterized by an opposite behavior, with westerly peaks during warm seasons that result from photochemical activity, higher temperatures and exposure to solar radiation [125,126]; sulfur dioxide (SO2) showed westerly peaks that have been attributed to maritime traffic and volcanic activity in the nearby Aeolian Arc [127]. It was also demonstrated that, under exceptional conditions, clean air masses from the northeastern sector of LMT can be channeled through the Marcellinara Gap, yielding minimal influence from anthropogenic emissions in the region and representing conditions representative of the Ionian Sea [33]. The NOx therefore constitute the fourth parameter to be subjected to a detailed, multi-year and cyclic analysis at the site, as previous studies were limited to preliminary data [80] and specific time spans (i.e., the first COVID-19 lockdown) [81]. The study on the first COVID lockdown exploited a condition of exceptionally low anthropogenic emissions to demonstrate that the early morning peaks of NOx observed before were attributable to rush hour traffic, as these emissions were minimal during the lockdown itself due to the strict regulations introduced by the Italian government at the time [128,129].

2.2. Instruments, Data and Methodologies

NOx measurements at the LMT observation site have been performed by a Thermo Scientific 42i-TL (Trace Level) (Franklin, Massachusetts, USA) analyzer. The instrument operates by exploiting the reactions between O3 and NO, which result in a luminescence whose intensity is linearly proportional to measured NO concentrations, and generates NO2 [130]. Due to the abundance of NO2 in ambient air, it must first be transformed into NO to allow the instrument to measure both parameters adequately; the transformation occurs via a heated molybdenum converter at a temperature of ≈325 °C.
Sampled ambient air, via a sample bulkhead, is drawn into the 42i-TL analyzer. A mode solenoid valve is used to determine whether sampled air is flowing through the converted (NO2 to NO) or a bypass. Sampled air is then channeled through the converter output valve and a flow sensor to a prereactor solenoid valve, which channels sampled air either to the prereactor (where it can react with O3 before the reaction chamber, thus providing a dynamic zero reading), or the reaction chamber (where the mixing with O3 occurs to provide a NO concentration reading). The prereactor is optimized to ensure a ≈99% reaction rate of NO prior to reaching the reaction chamber.
Dry sampled air enters the 42i model through the dry air bulkhead, and is consequently channeled through a flow switch, later to be channeled through the ozonator, which generate sufficient O3 for chemiluminescence reactions. Inside the reaction chamber, the O3-NO reaction occurs to generate NO2 molecules in an excited state; a PMT (photomultiplier tube) located inside a thermoelectric cooler will detect the intensity of chemiluminescence reactions, and provide a concentration reading. Measured NO concentrations are subtracted by total NOx to quantify NO2; all three concentrations are provided by the instrument as outputs and stored for further data [140,141processing. At the LMT site, monthly checks have been performed against zero concentrations, also based on span checks via zero air generators (Thermo Scientific model 1160). Gas/GPT dilution systems have also been used (Thermo Scientific model 160i). Additional information is available in previous research on LMT NOx measurements [80,81].
Wind speed and direction at the site have been measured by a weather station, model Vaisala WXT520 (Vantaa, Finland). The instrument measures wind variability via the implementation of a horizontal plane with ultrasonic transducers placed on top; changes in the travel time of ultrasound pulses between transducers is exploited to calculate changes in wind direction and speed. Additional information on WXT520 specifics and measurements at LMT are available in a previous study [131].
This study introduces, for the first time at LMT, vertical wind profiles to integrate WXT520 measurements in the multi-year assessment of a gas. These measurements were performed by a ZephIR 300 wind lidar (ZX Lidars, Malvern, United Kingdom), which operates as a continuous-wave focusing lidar [132]. Wind speeds and directions are measured by the instrument at several altitude thresholds by assessing the Doppler shift in the infrared laser, which is sensitive to particulate scattering in the lowermost layers of the atmosphere [133]. For this study, the 20 meters AGL threshold was selected to integrate WXT520 measurements. Additional details information on ZephIR 300 data gathering at LMT are available in a previous study [120].
Table 1. Coverage rates of NOx (Thermo 42i), near-surface meteorological (Vaisala WXT520), and wind profile (ZephIR 300) measurements during the observation period. The NMTO dataset refers to valid NOx and near-surface mast data, while the NLID dataset refers to valid NOx and lidar wind profiles. Two leap years with 24 additional hours are present: 2016 and 2020.
Year Hours Thermo 42i Vaisala WXT520 ZephIR 300 NMTO NLID
2015 8760 92.73% 95.90% 66.32% 91.01% 61.96%
2016 8784 95.91% 96.34% 92.36% 93.23% 89.92%
2017 8760 96.39% 93.80% 97.67% 91.75% 95.95%
2018 8760 98.11% 77.05% 91.89% 75.67% 91.01%
2019 8760 96.78% 98.59% 29.48% 96.75% 28.07%
2020 8784 94.23% 99.98% - 94.22% -
2021 8760 87.14% 99.74% 40.70% 87.13% 38.50%
2022 8760 69% 90.11% 88.89% 67.59% 68.97%
2023 8760 81.86% 96.3% 96.43% 80.43% 79.08%
788881 90.24%2 94.20%2 67.08%2 86.42%2 61.49%2
1 Sum. 2 Average.
All data have been processed in R 4.5.1 to generate plots using the dplyr [134], ggplot [135], and tidyverse [136] packages/libraries. The normality of NOx data at LMT was tested using the Shapiro-Wilk [137] and Jarque-Bera [138] methods, with consequent analyses based on the Kruskal-Wallis [139] methodology aimed at assessing the statistical significance of differences between specific categories. Multi-year tendencies have been calculated using the Mann-Kendall [140,141] method and via the zyp [142] package in R. Pollution roses have been generated using the openair package [143]. Seasons have been categorized based on the conventional JFD (Winter: January, February, December), MAM (Spring: March, April, May), JJA (Summer: June, July, August), and SON (Fall: September, October, November) trimesters. The hourly dataset used in this study is set at Coordinated Universal Time (UTC).

3. Results

3.1. Variability and General Trends During the Observed Period

The general variability observed at the site between 2015 and 2023 is shown in Figure 1. From the graph, it is possible to infer that NO2 constitute the majority of NOx measured at the site.
Figure 2. Histogram showing the frequency (number of hours) falling in each 1 ppb interval of NO and NO2. Values higher than 20 ppb are omitted from the plot due to their very low frequency.
Preprints 172920 g002

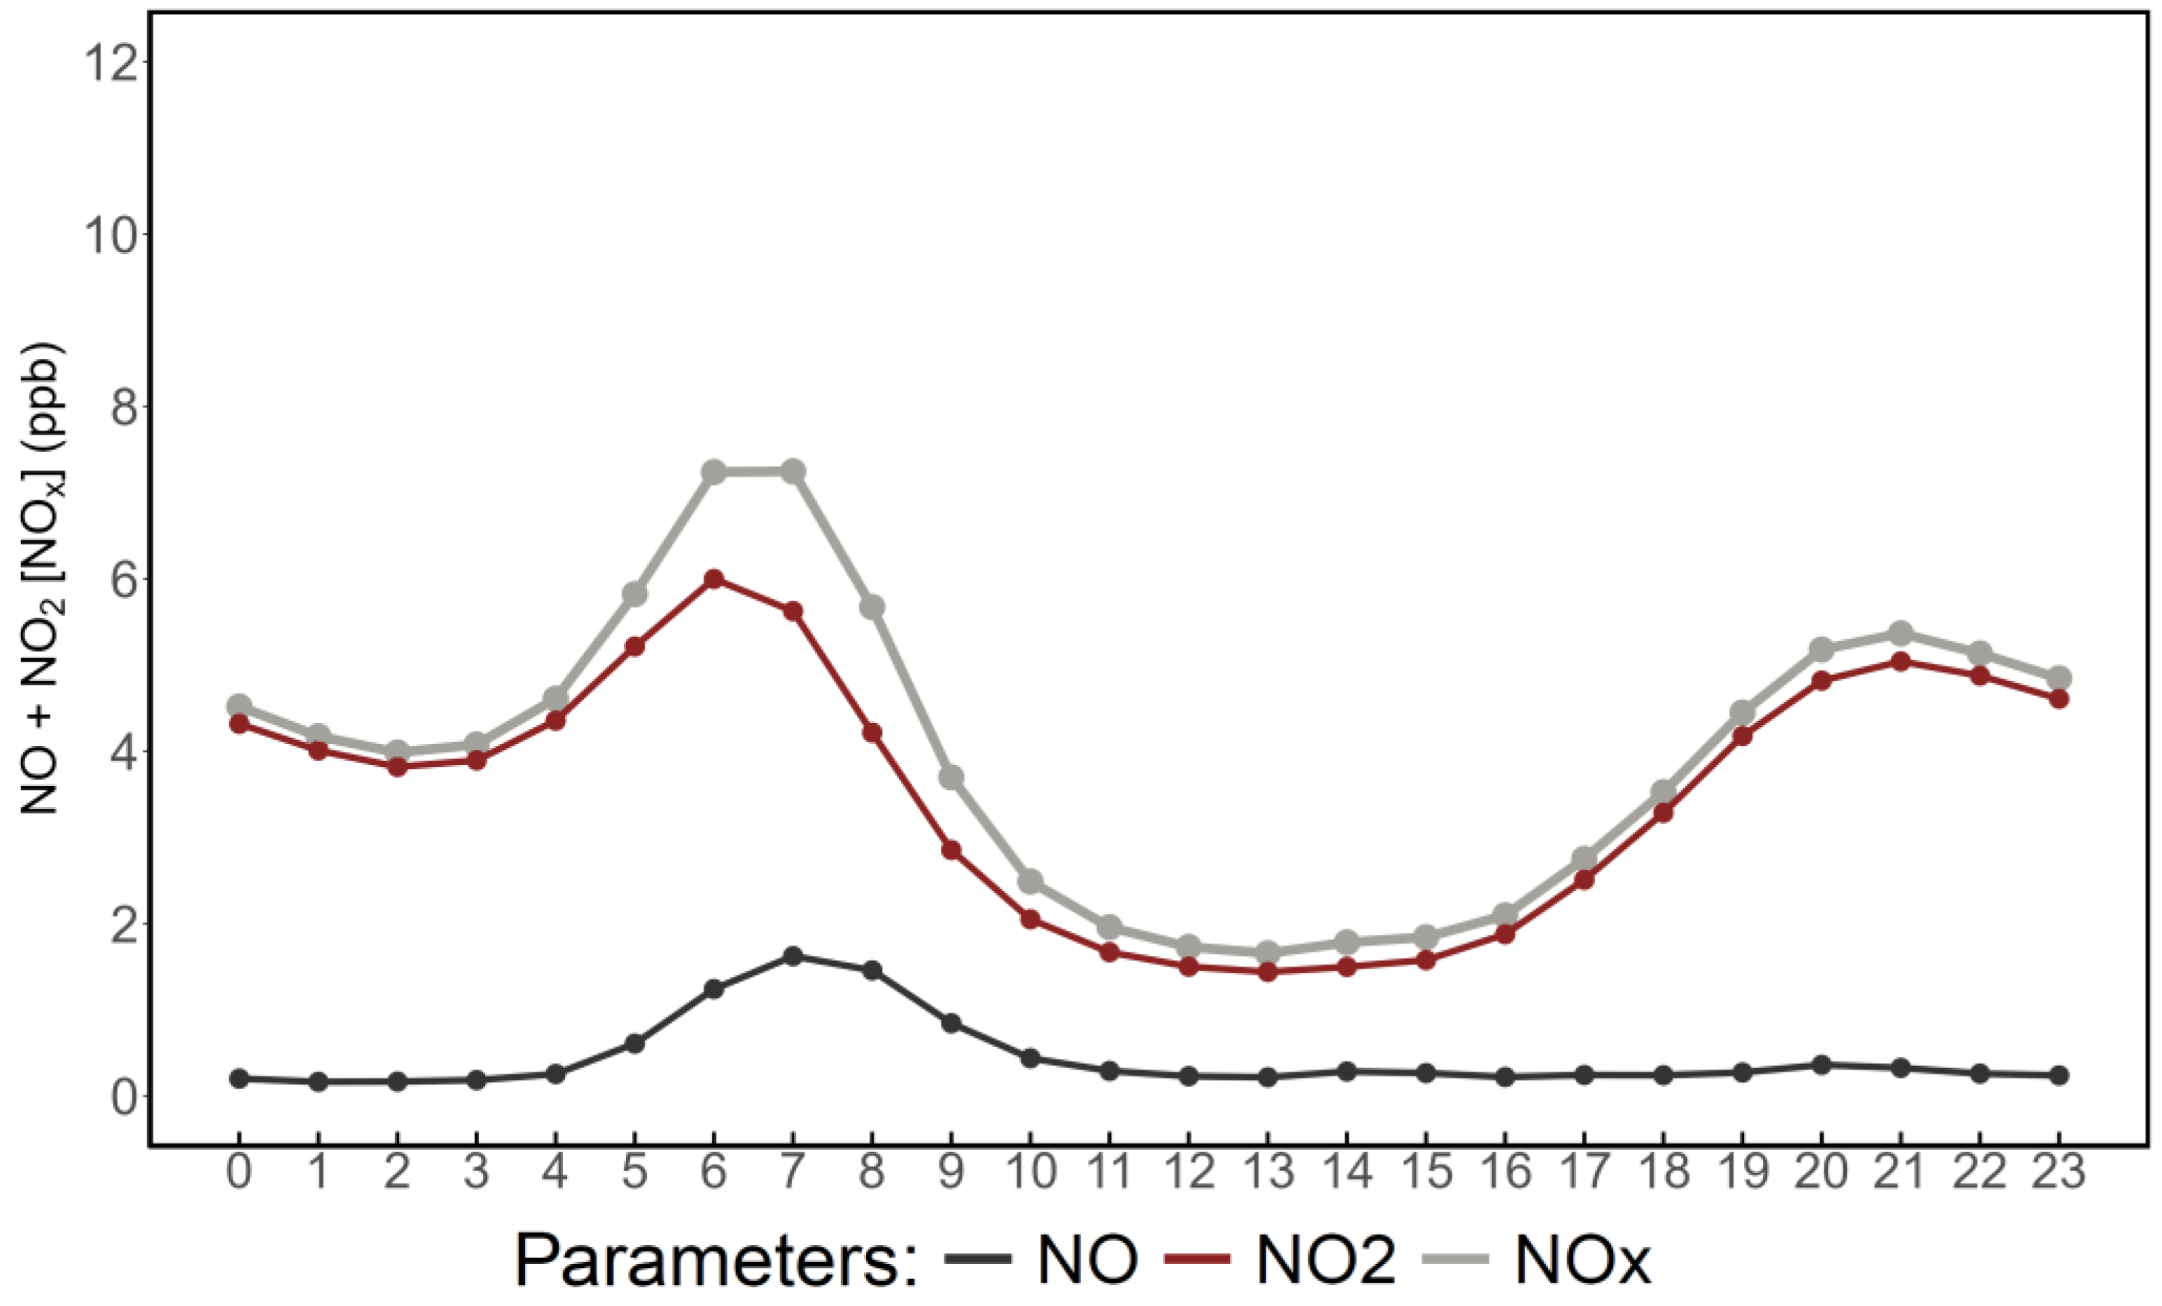
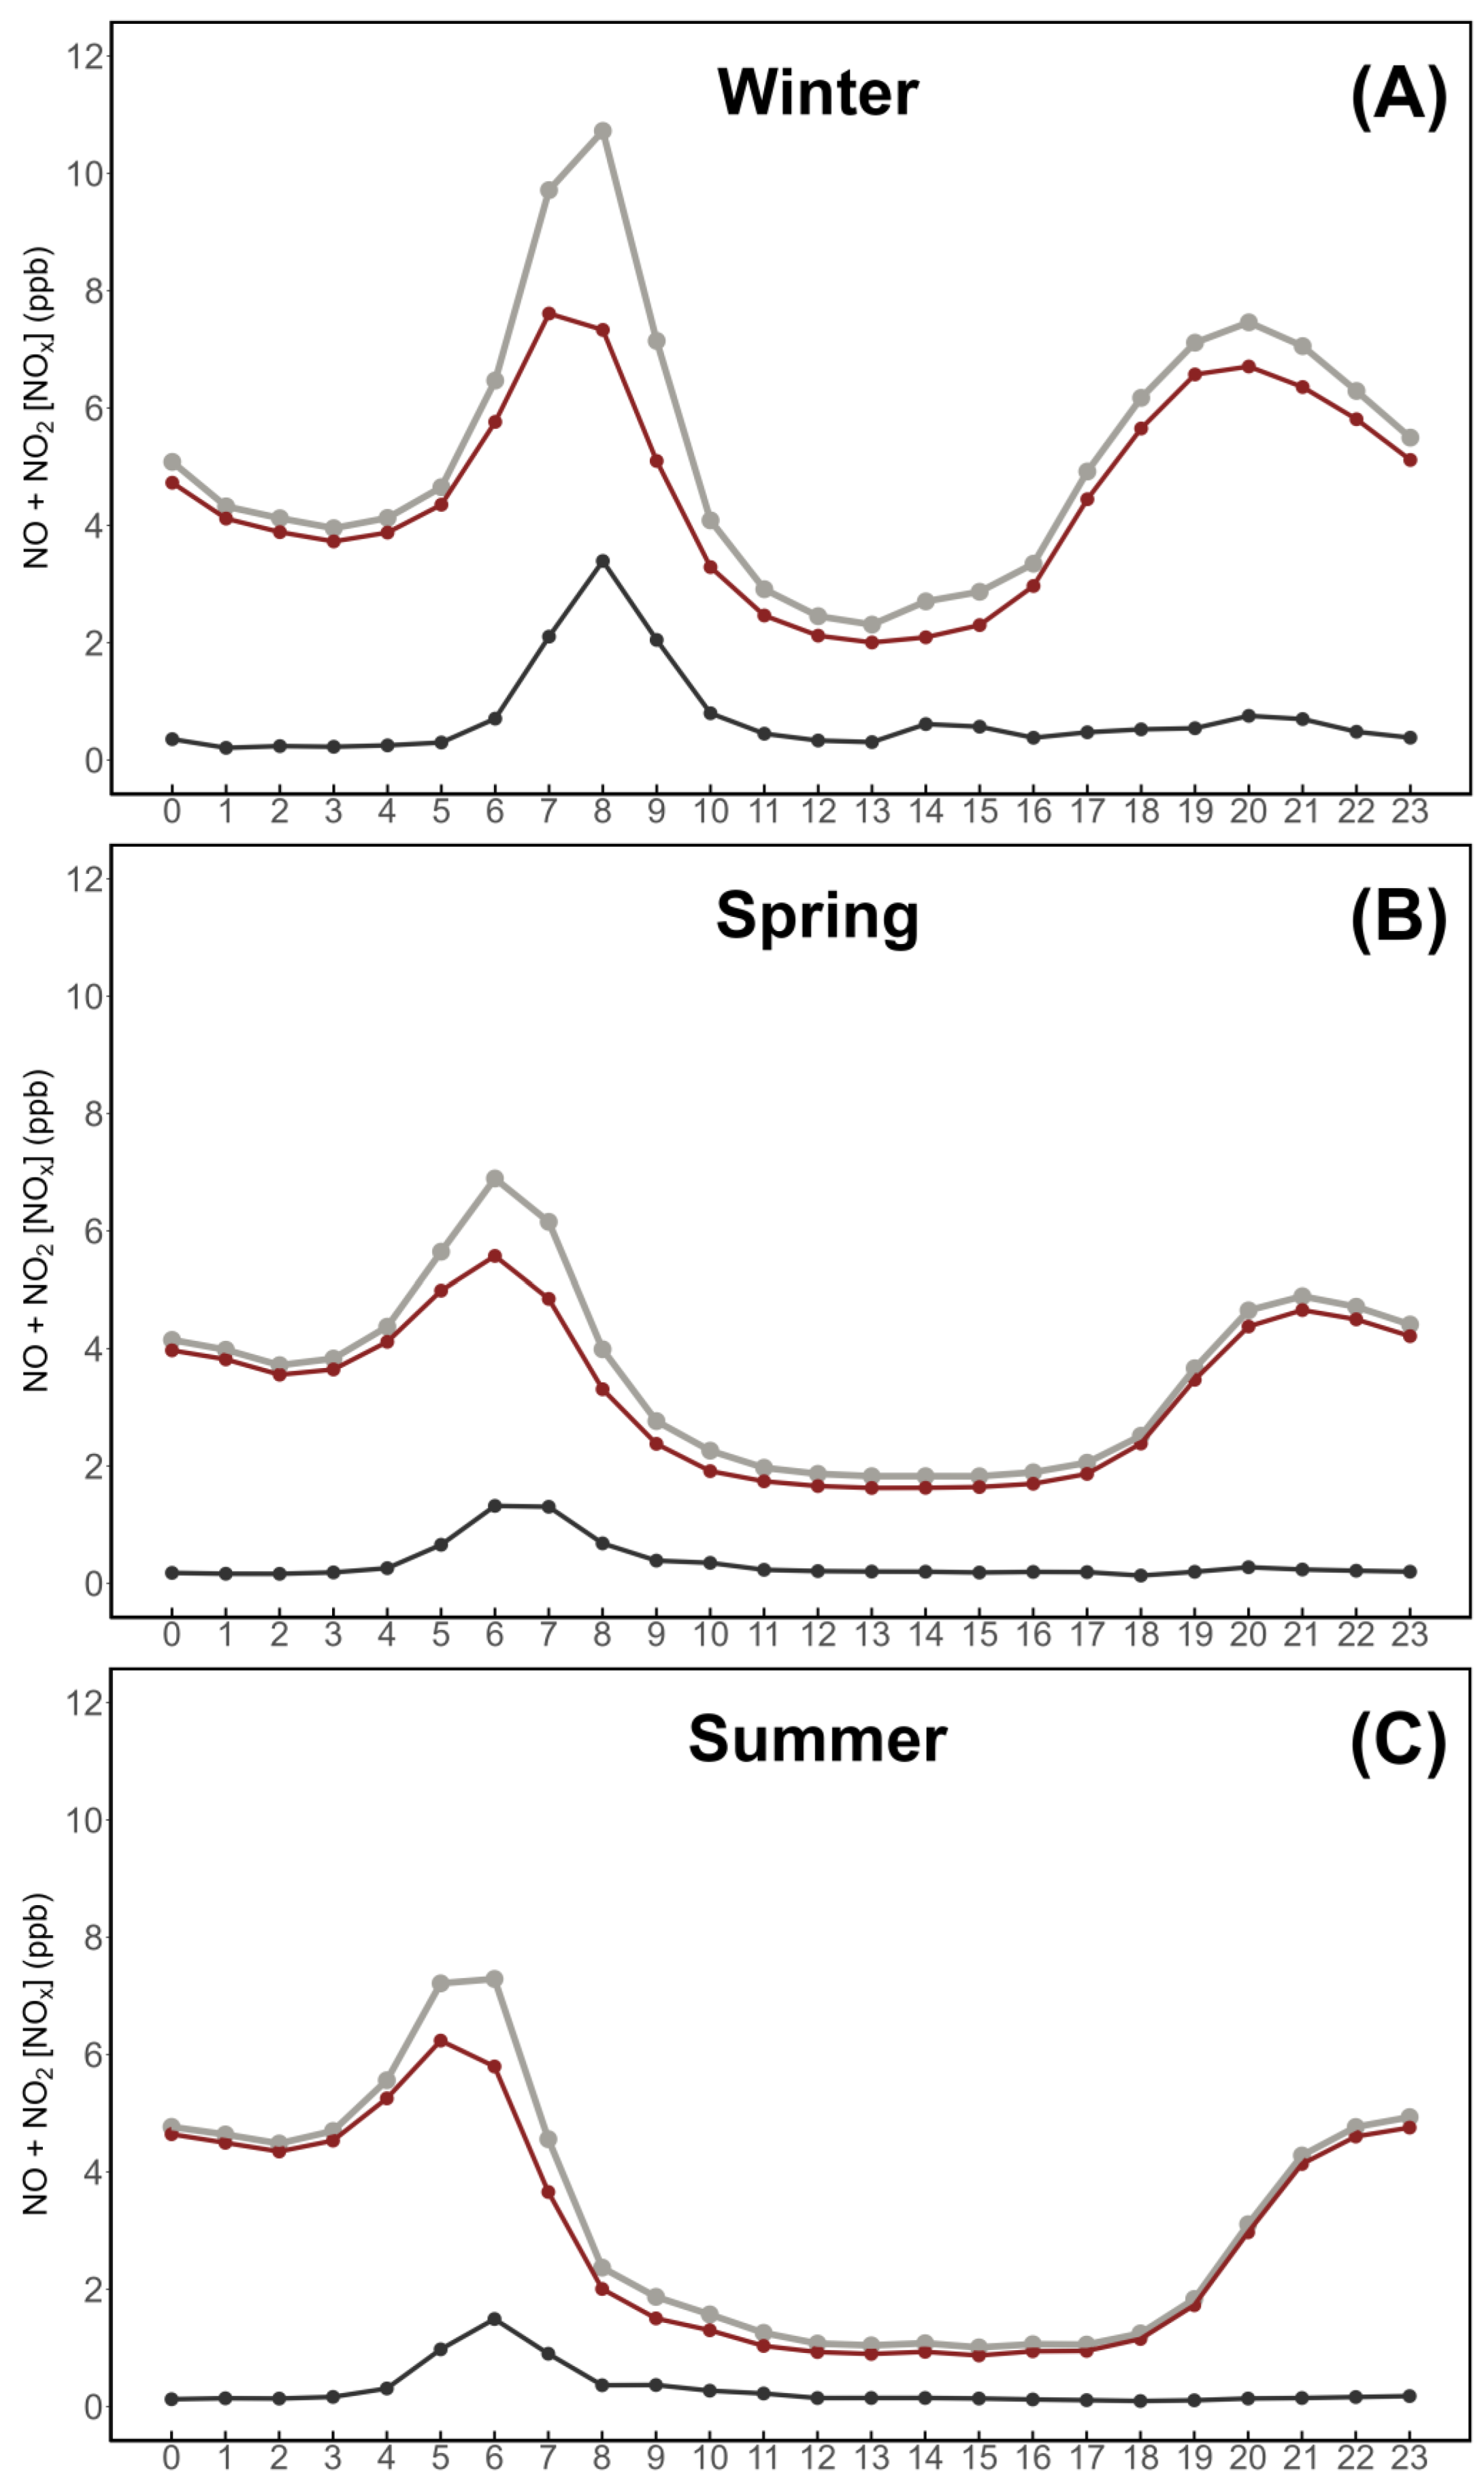
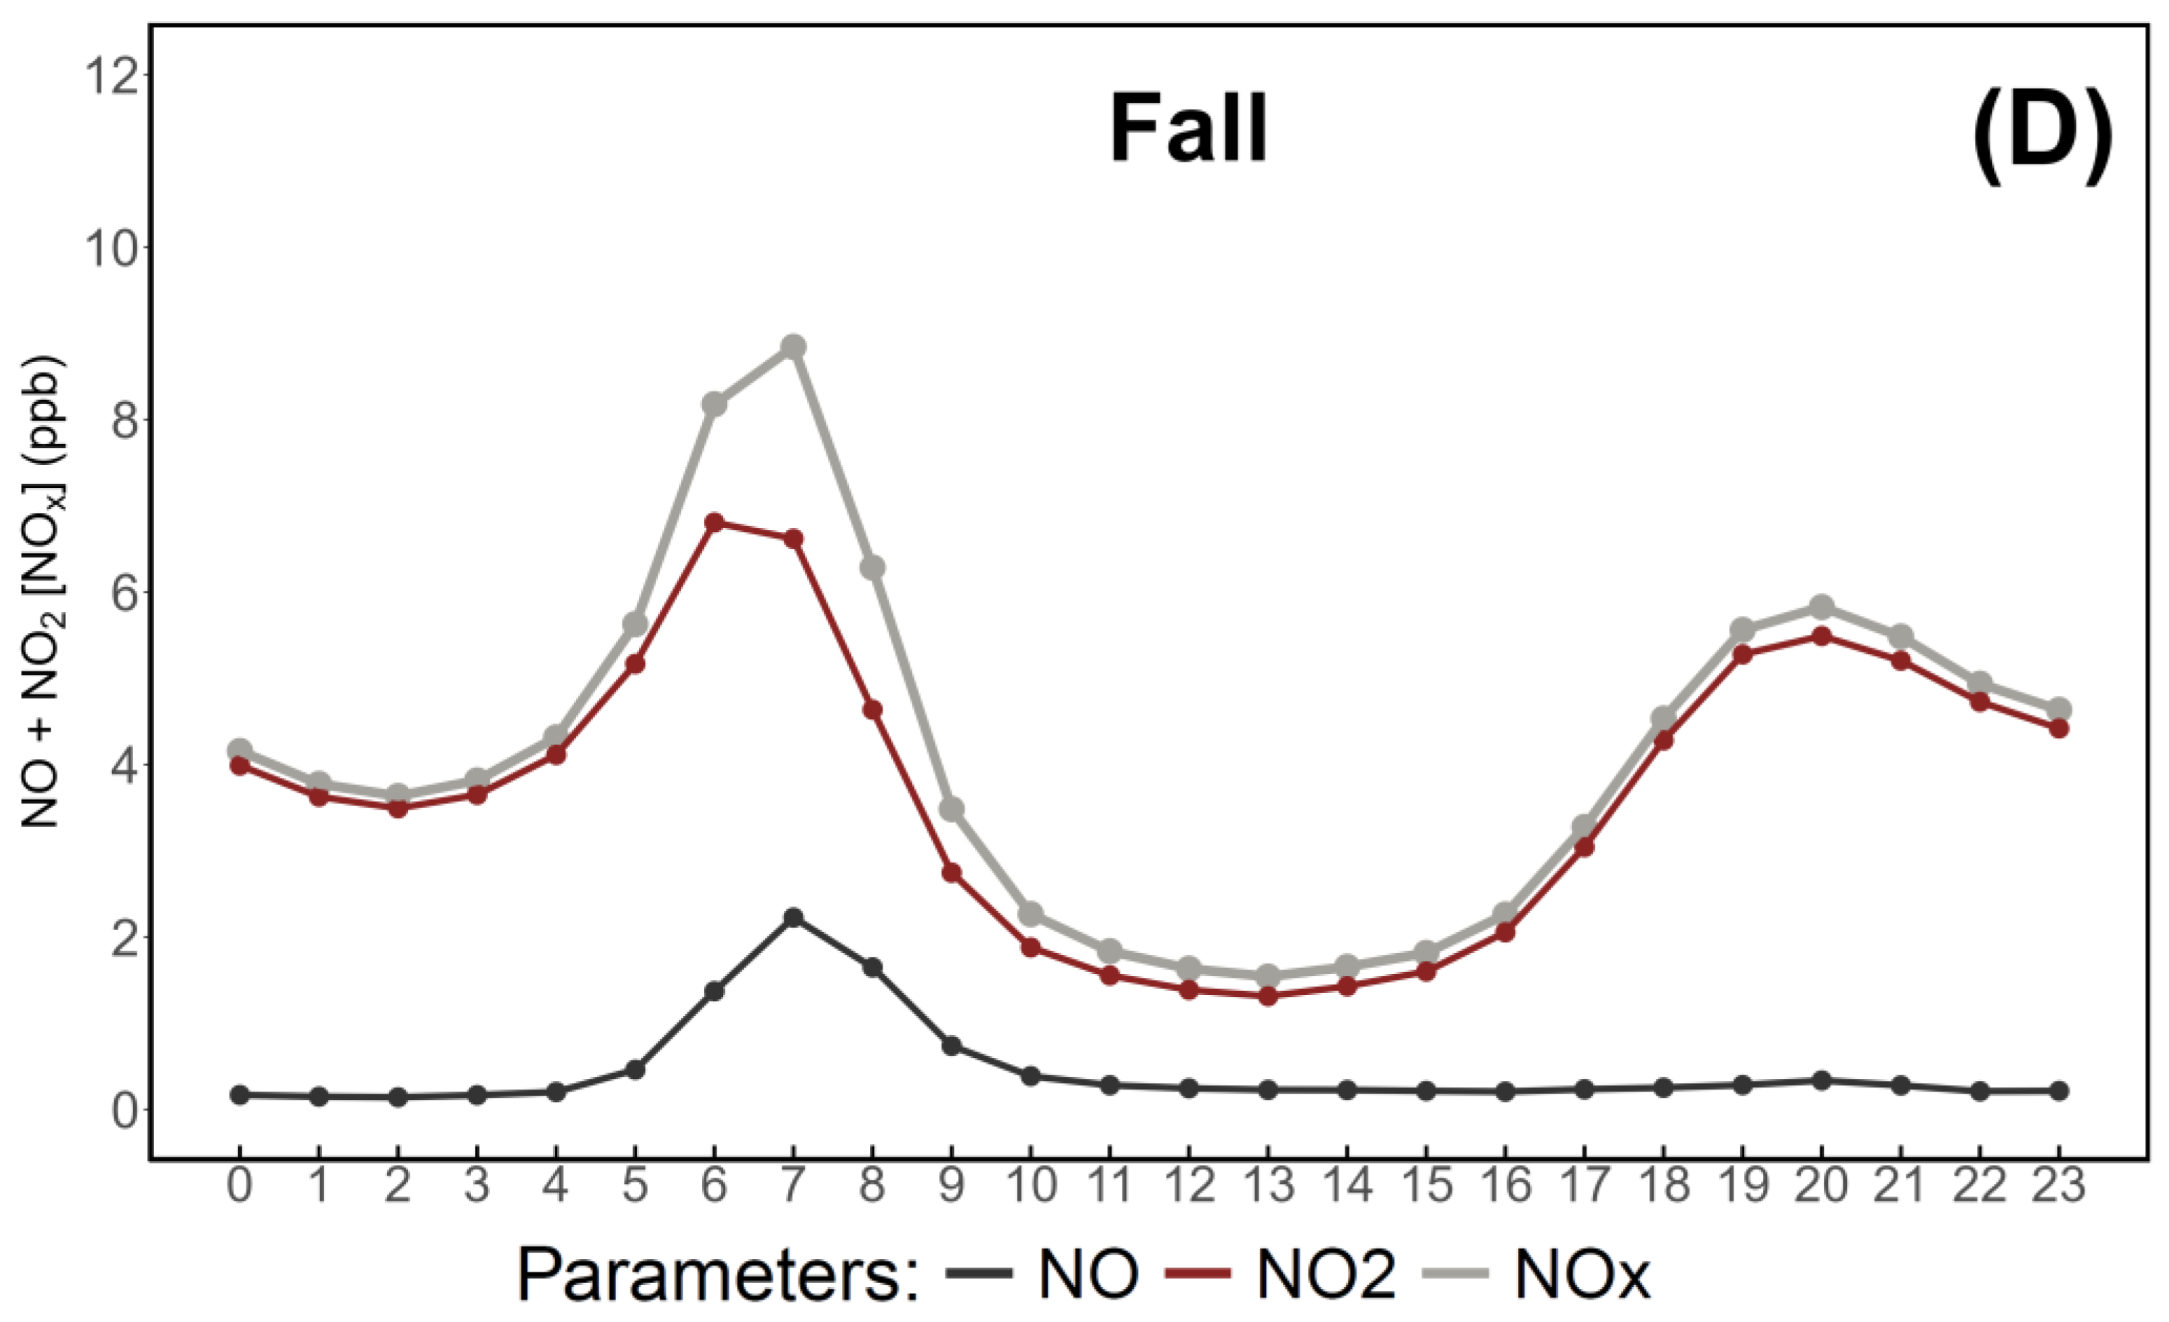
3.2. Analysis and Evaluation of NOx Daily Cycles

As described in Section 2.1, the LMT site is subject to a very strong daily cycle resulting from the influences of local near-surface wind circulation and geomorphology. The peaks observed during regular daily cycles are also dependent on the nature of parameters, with some of them showing nighttime peaks [124], while others are characterized by diurnal peaks [125]. A generic daily cycle of NOx is shown in Figure 3.
A previous study, based on LMT’s preliminary data, reported the susceptibility of the daily cycle to changes between CEST (Central European Summer Time), set at UTC+02:00, and CET (Central European Time), which is set at UTC+01:00. These changes occur in the last Sunday of March and October, thus affecting the Spring and Fall seasons. In Figure 4, seasonal daily cycles are shown, indicating shifts in early morning rush hours attributable to alternating CEST and CET times.

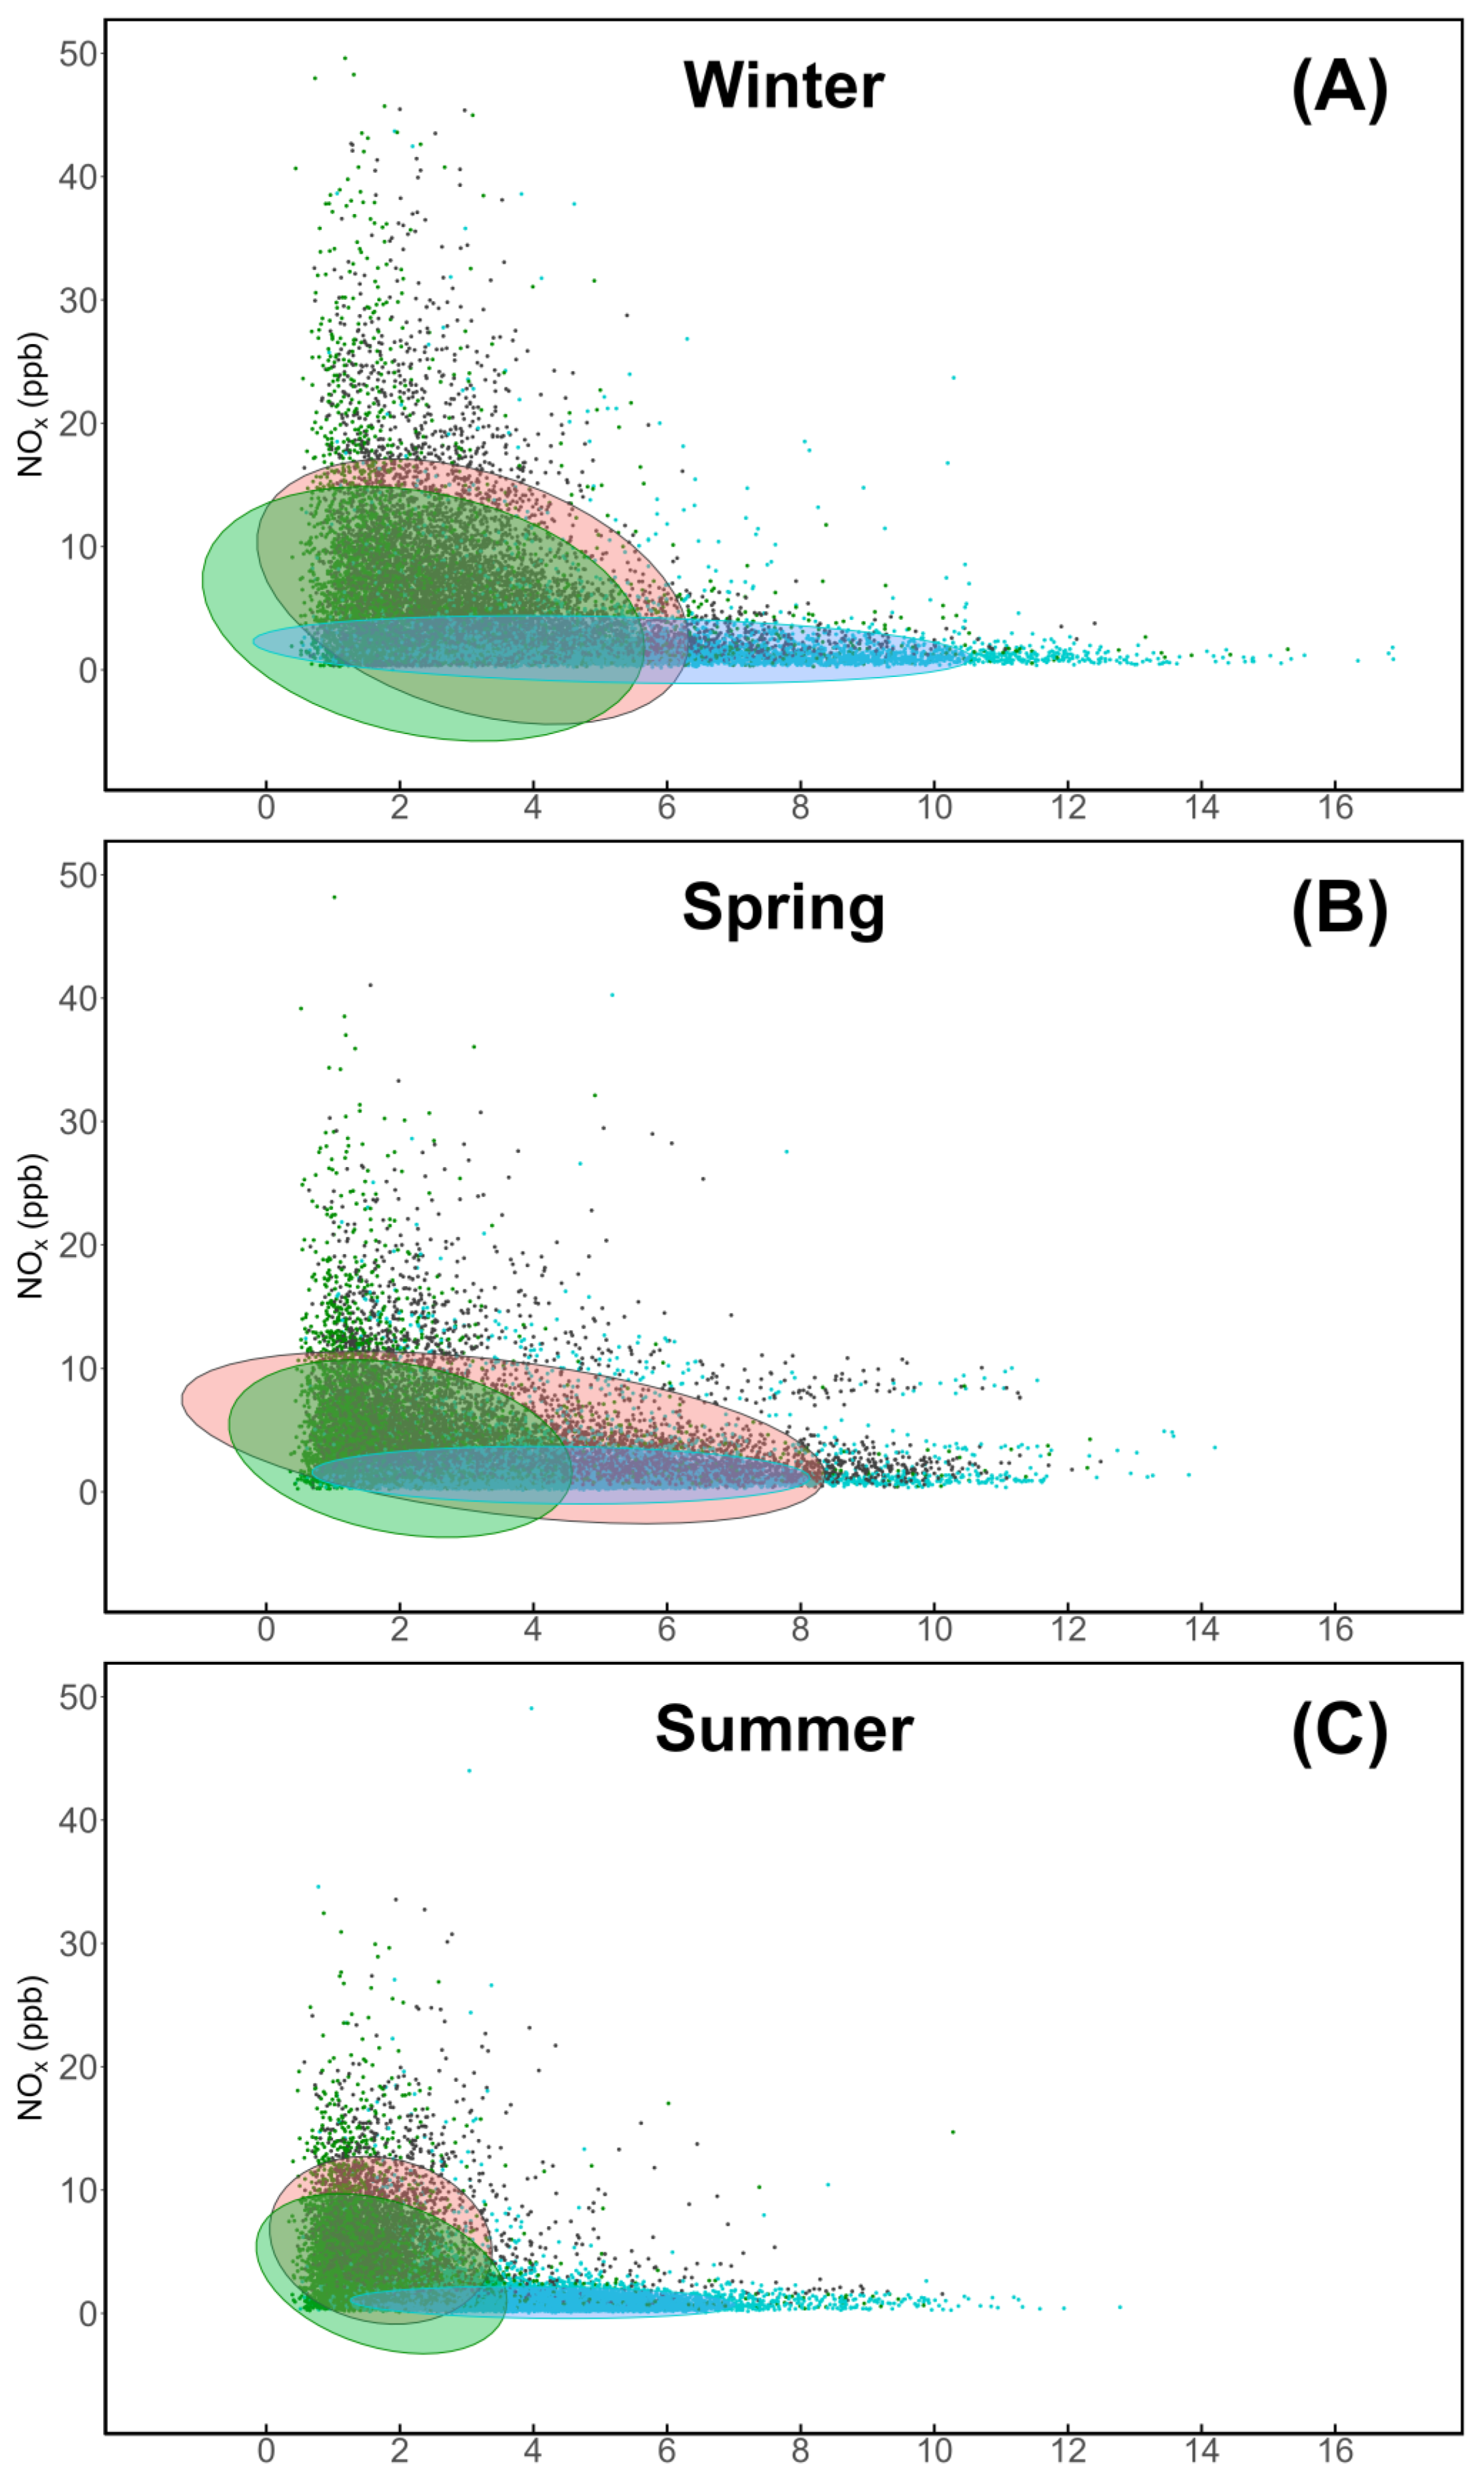
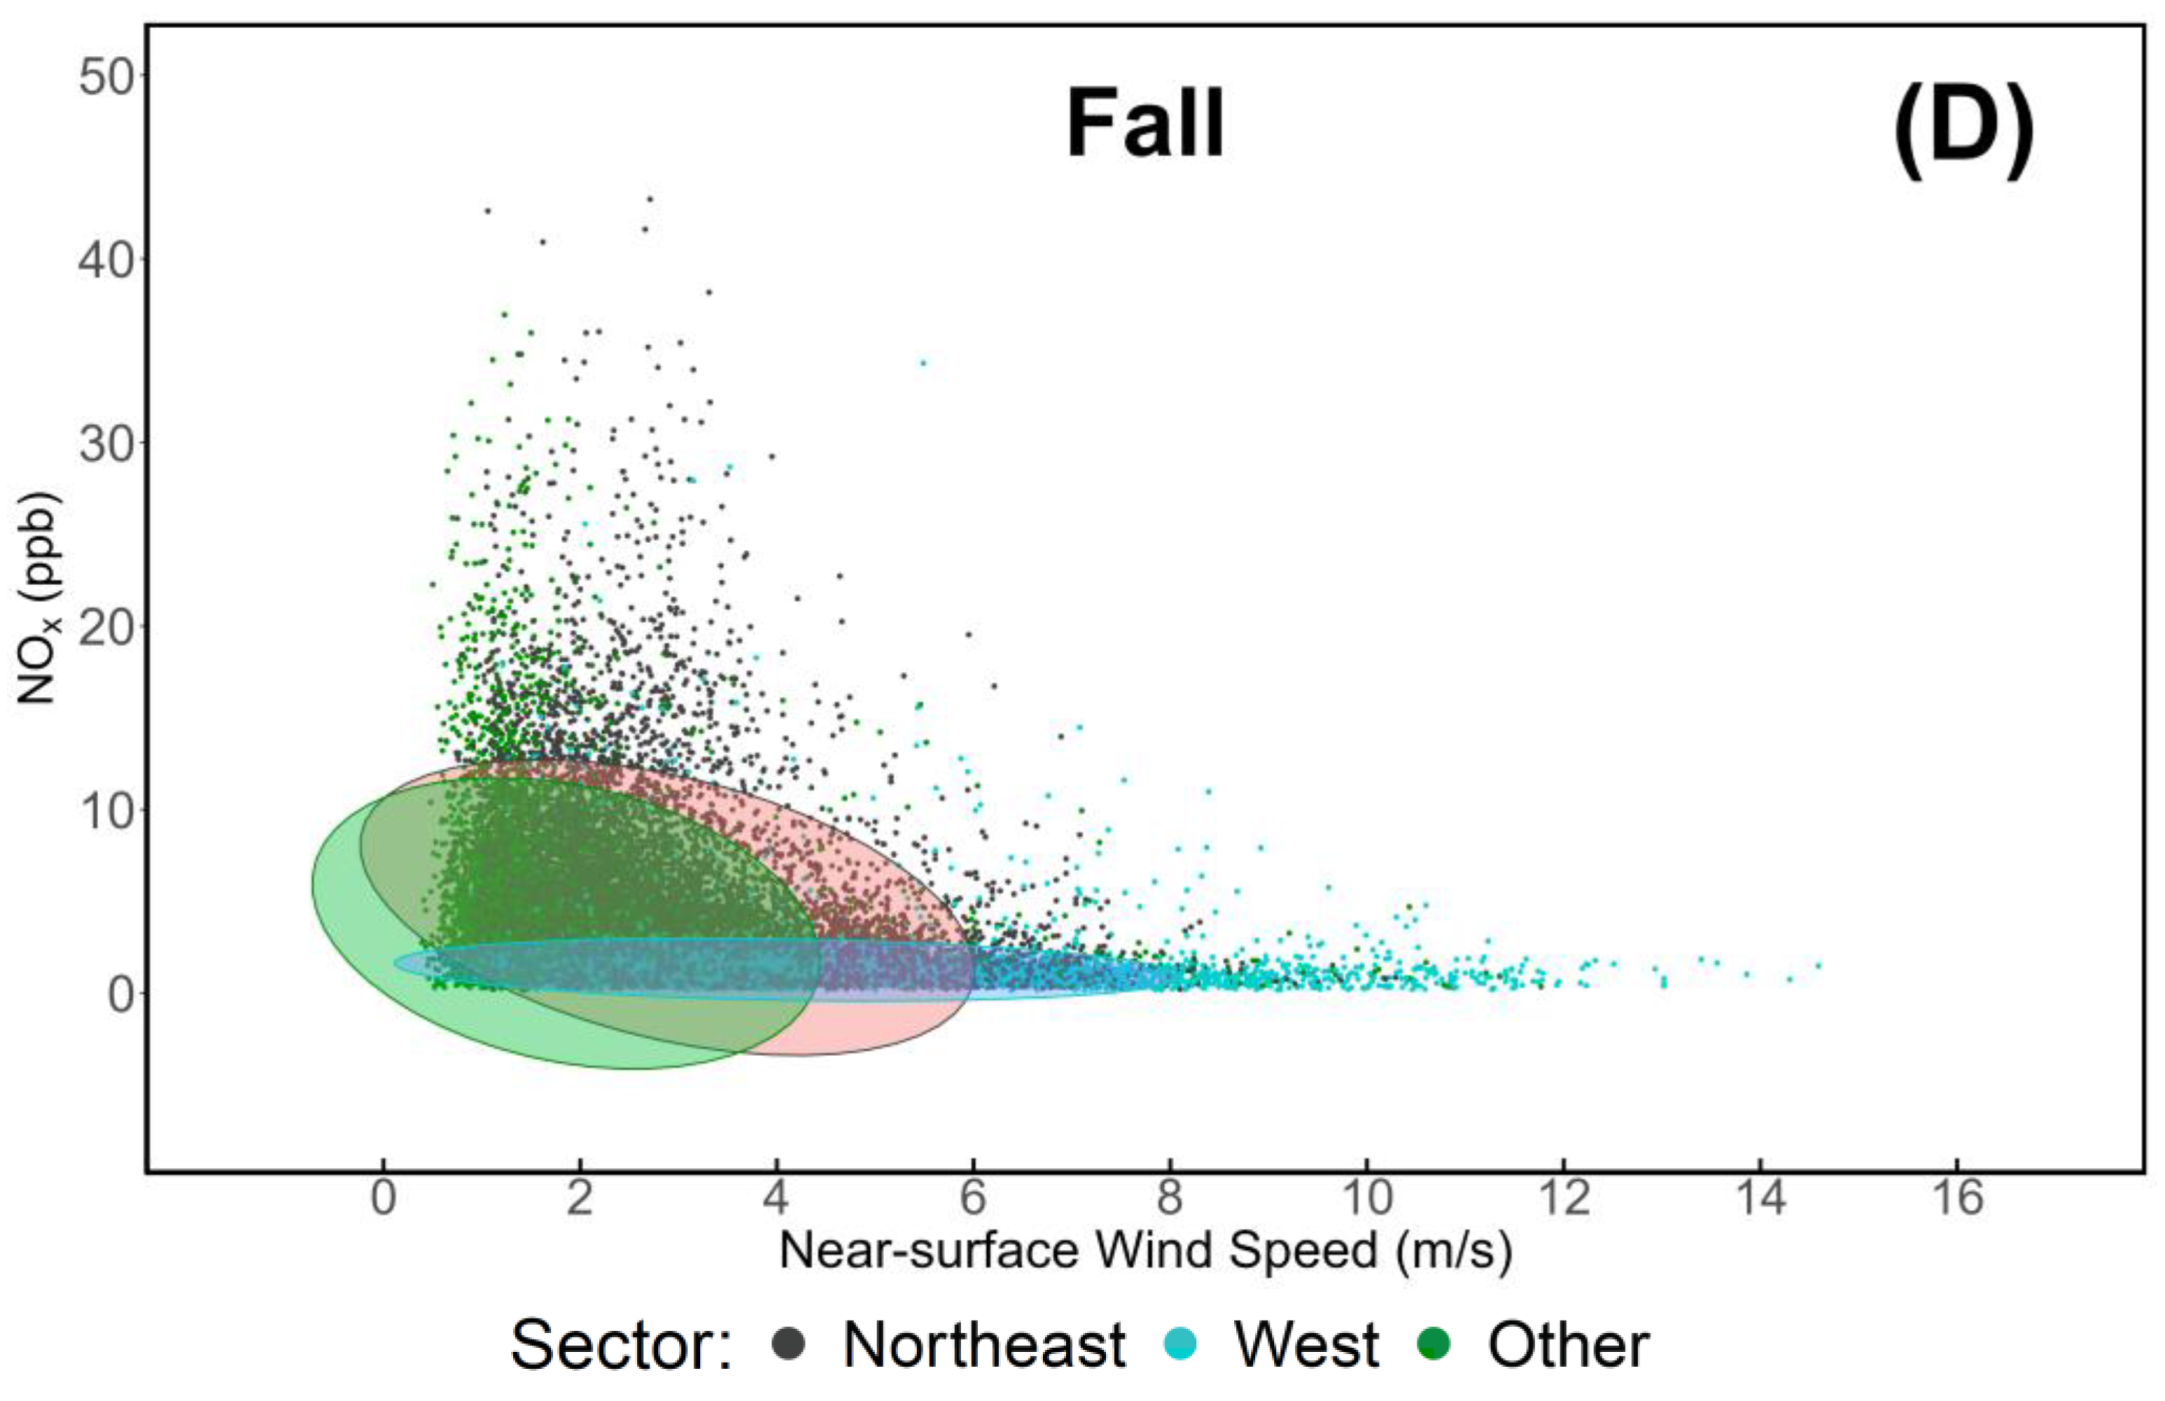
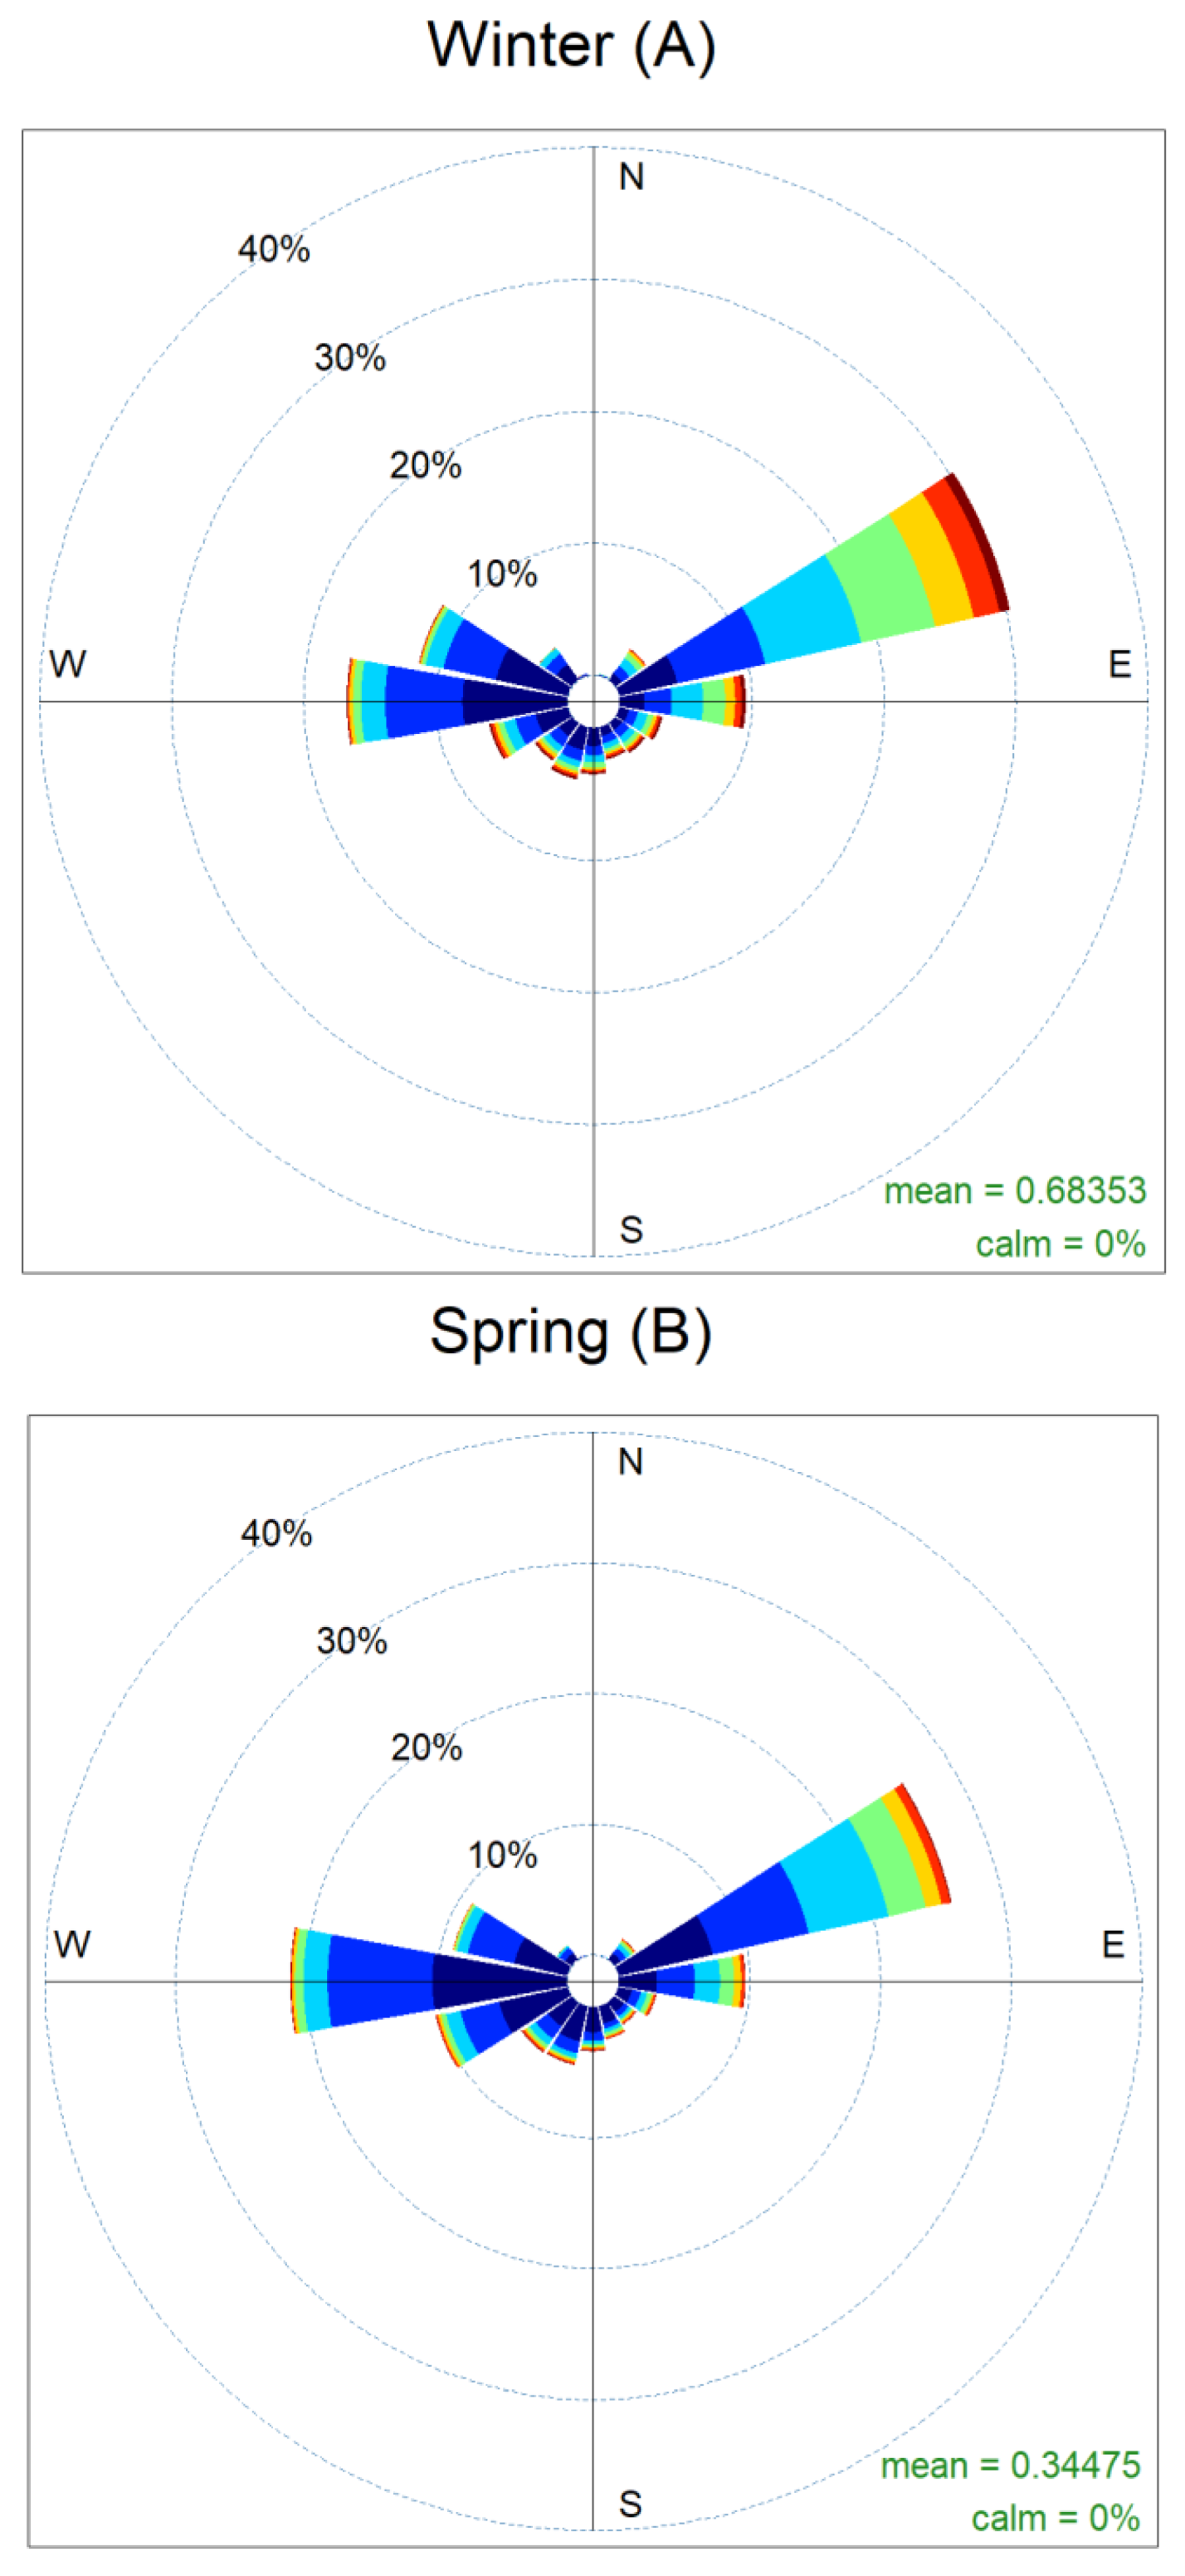
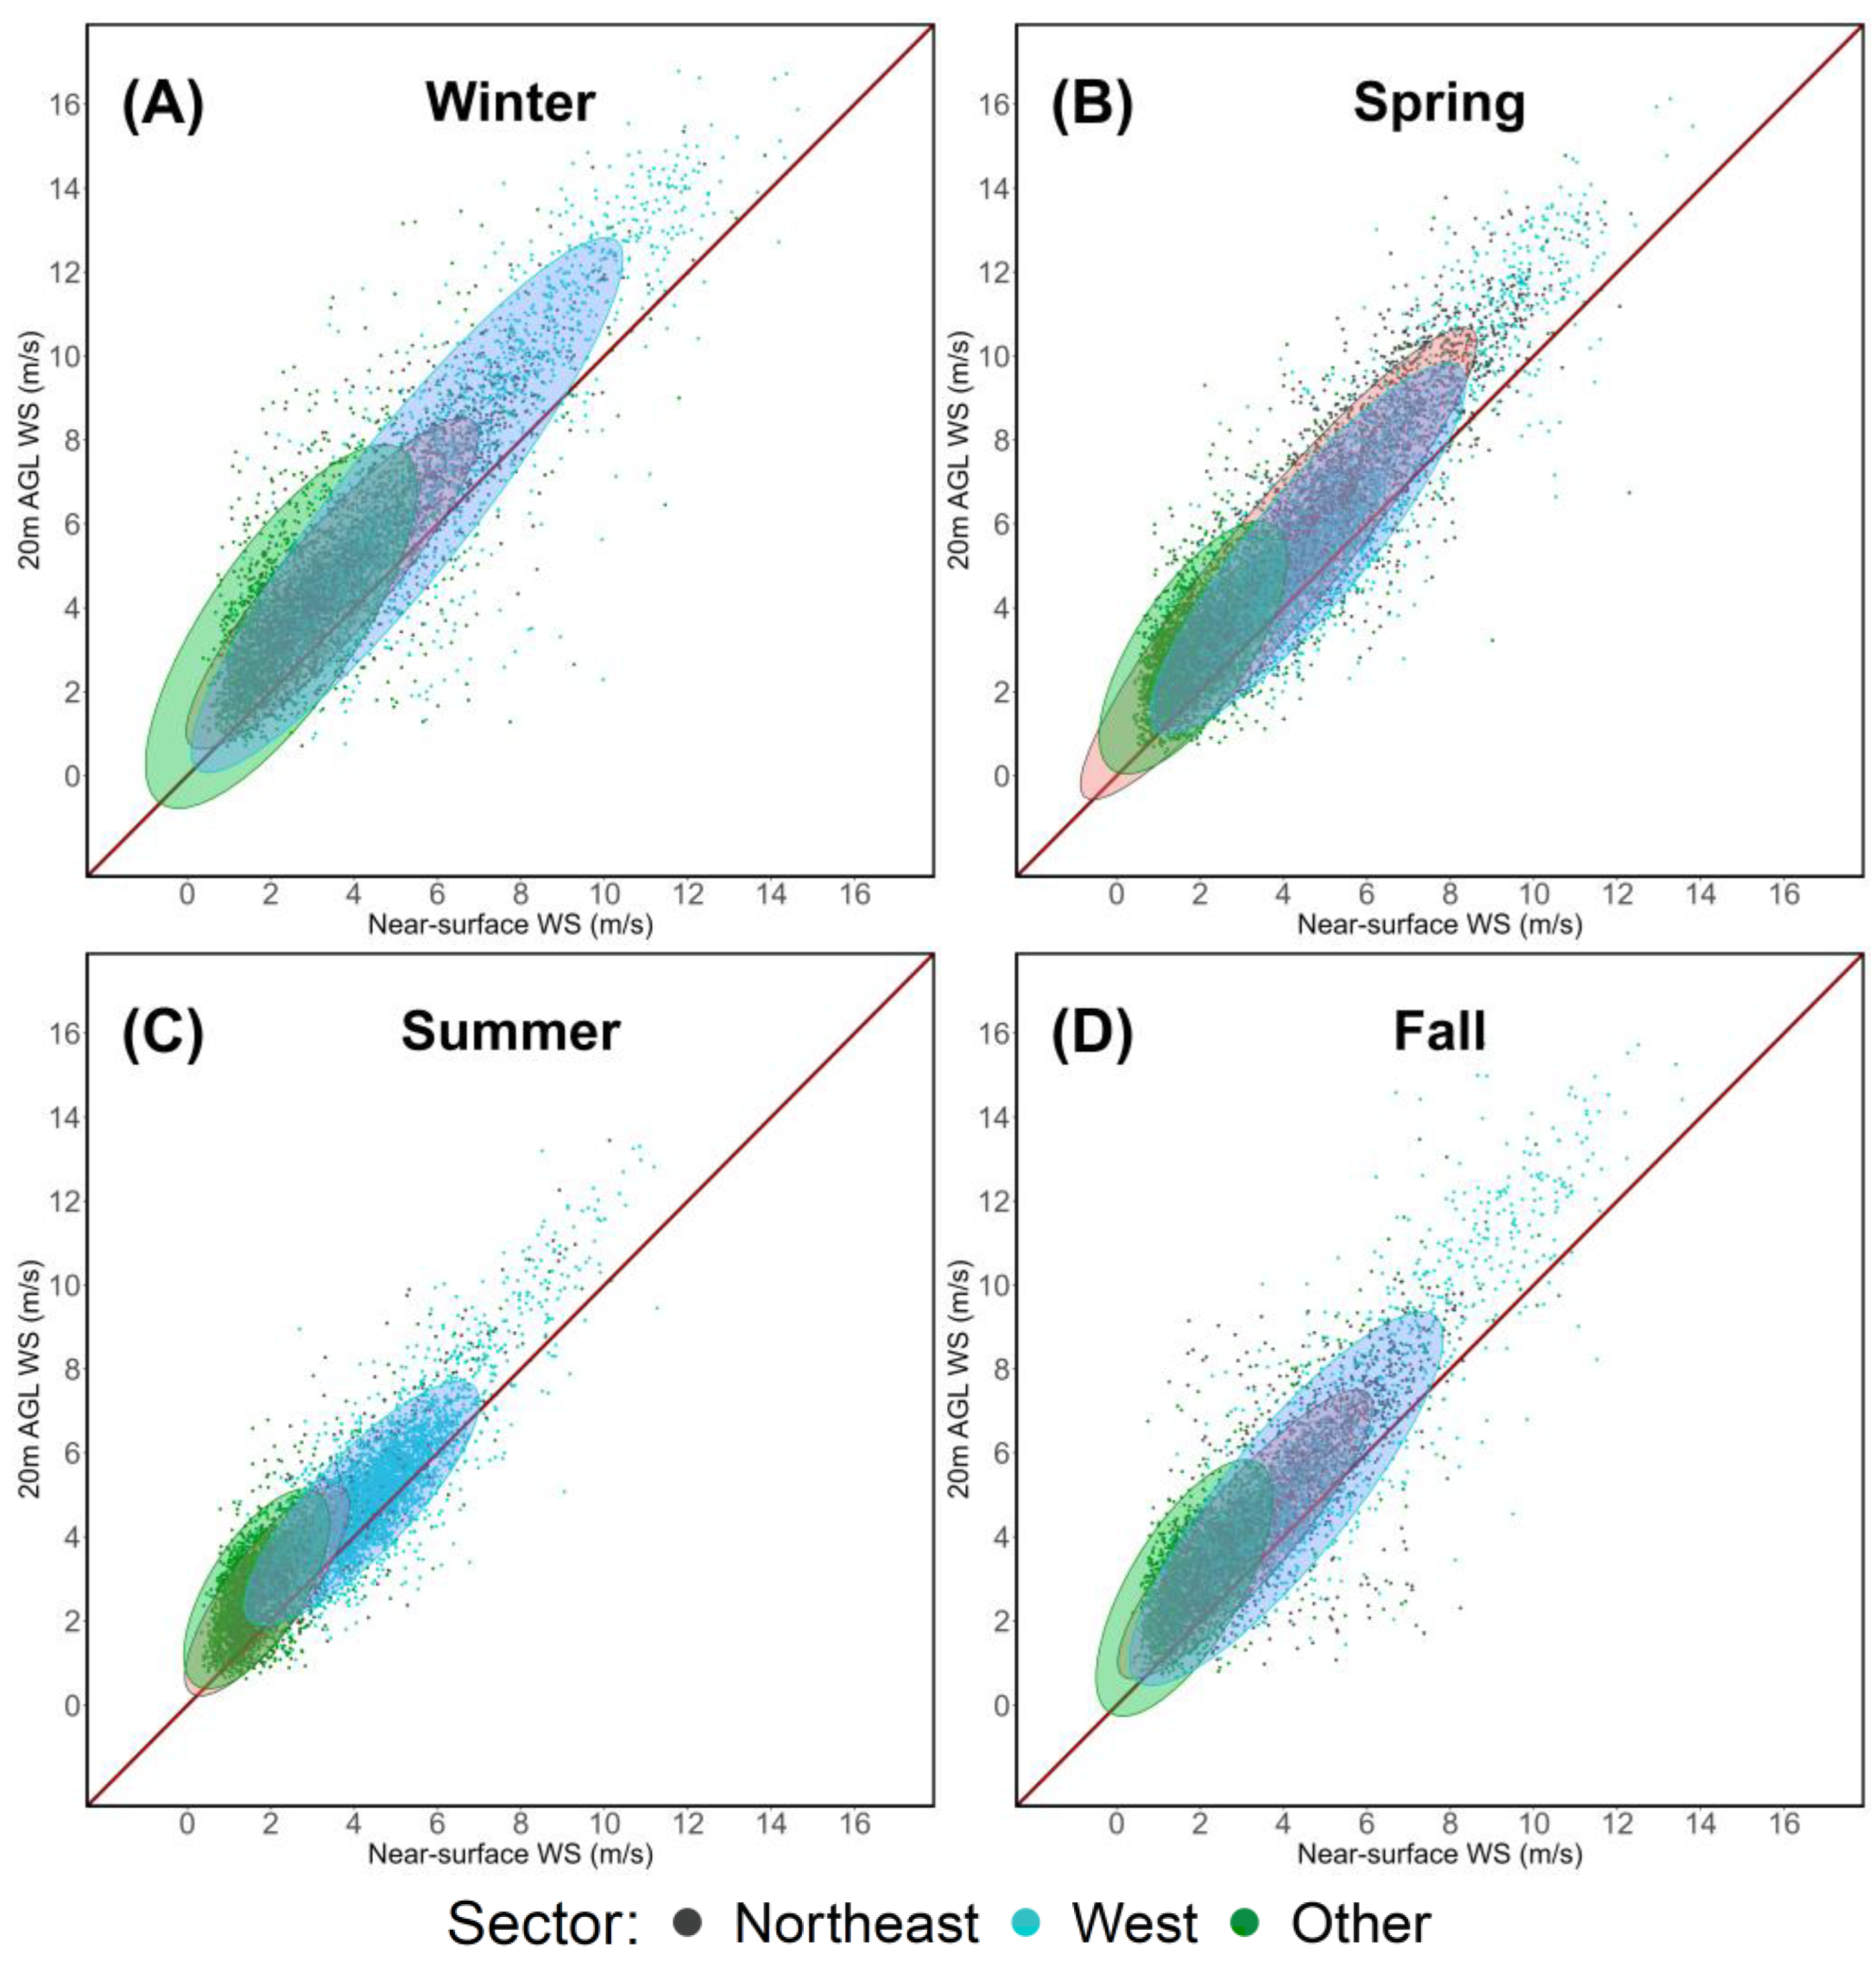
3.3. Variability with Near-Surface Wind Speed/Direction

As reported in Section 2.1, the peculiar location of LMT also results in specific dependences of pollutant concentrations with wind speed, in addition to wind direction. Data ellipses showing a bivariate t-distribution under a 95% confidence interval [144] have been used in Figure 5 to group data falling into the same category, thus allowing to highlight the differences between seasons and wind sectors at the site.
Seasonal pollution roses have also been computed to assess the variability of NOx concentrations based on wind directions. The roses are shown in Figure 6.

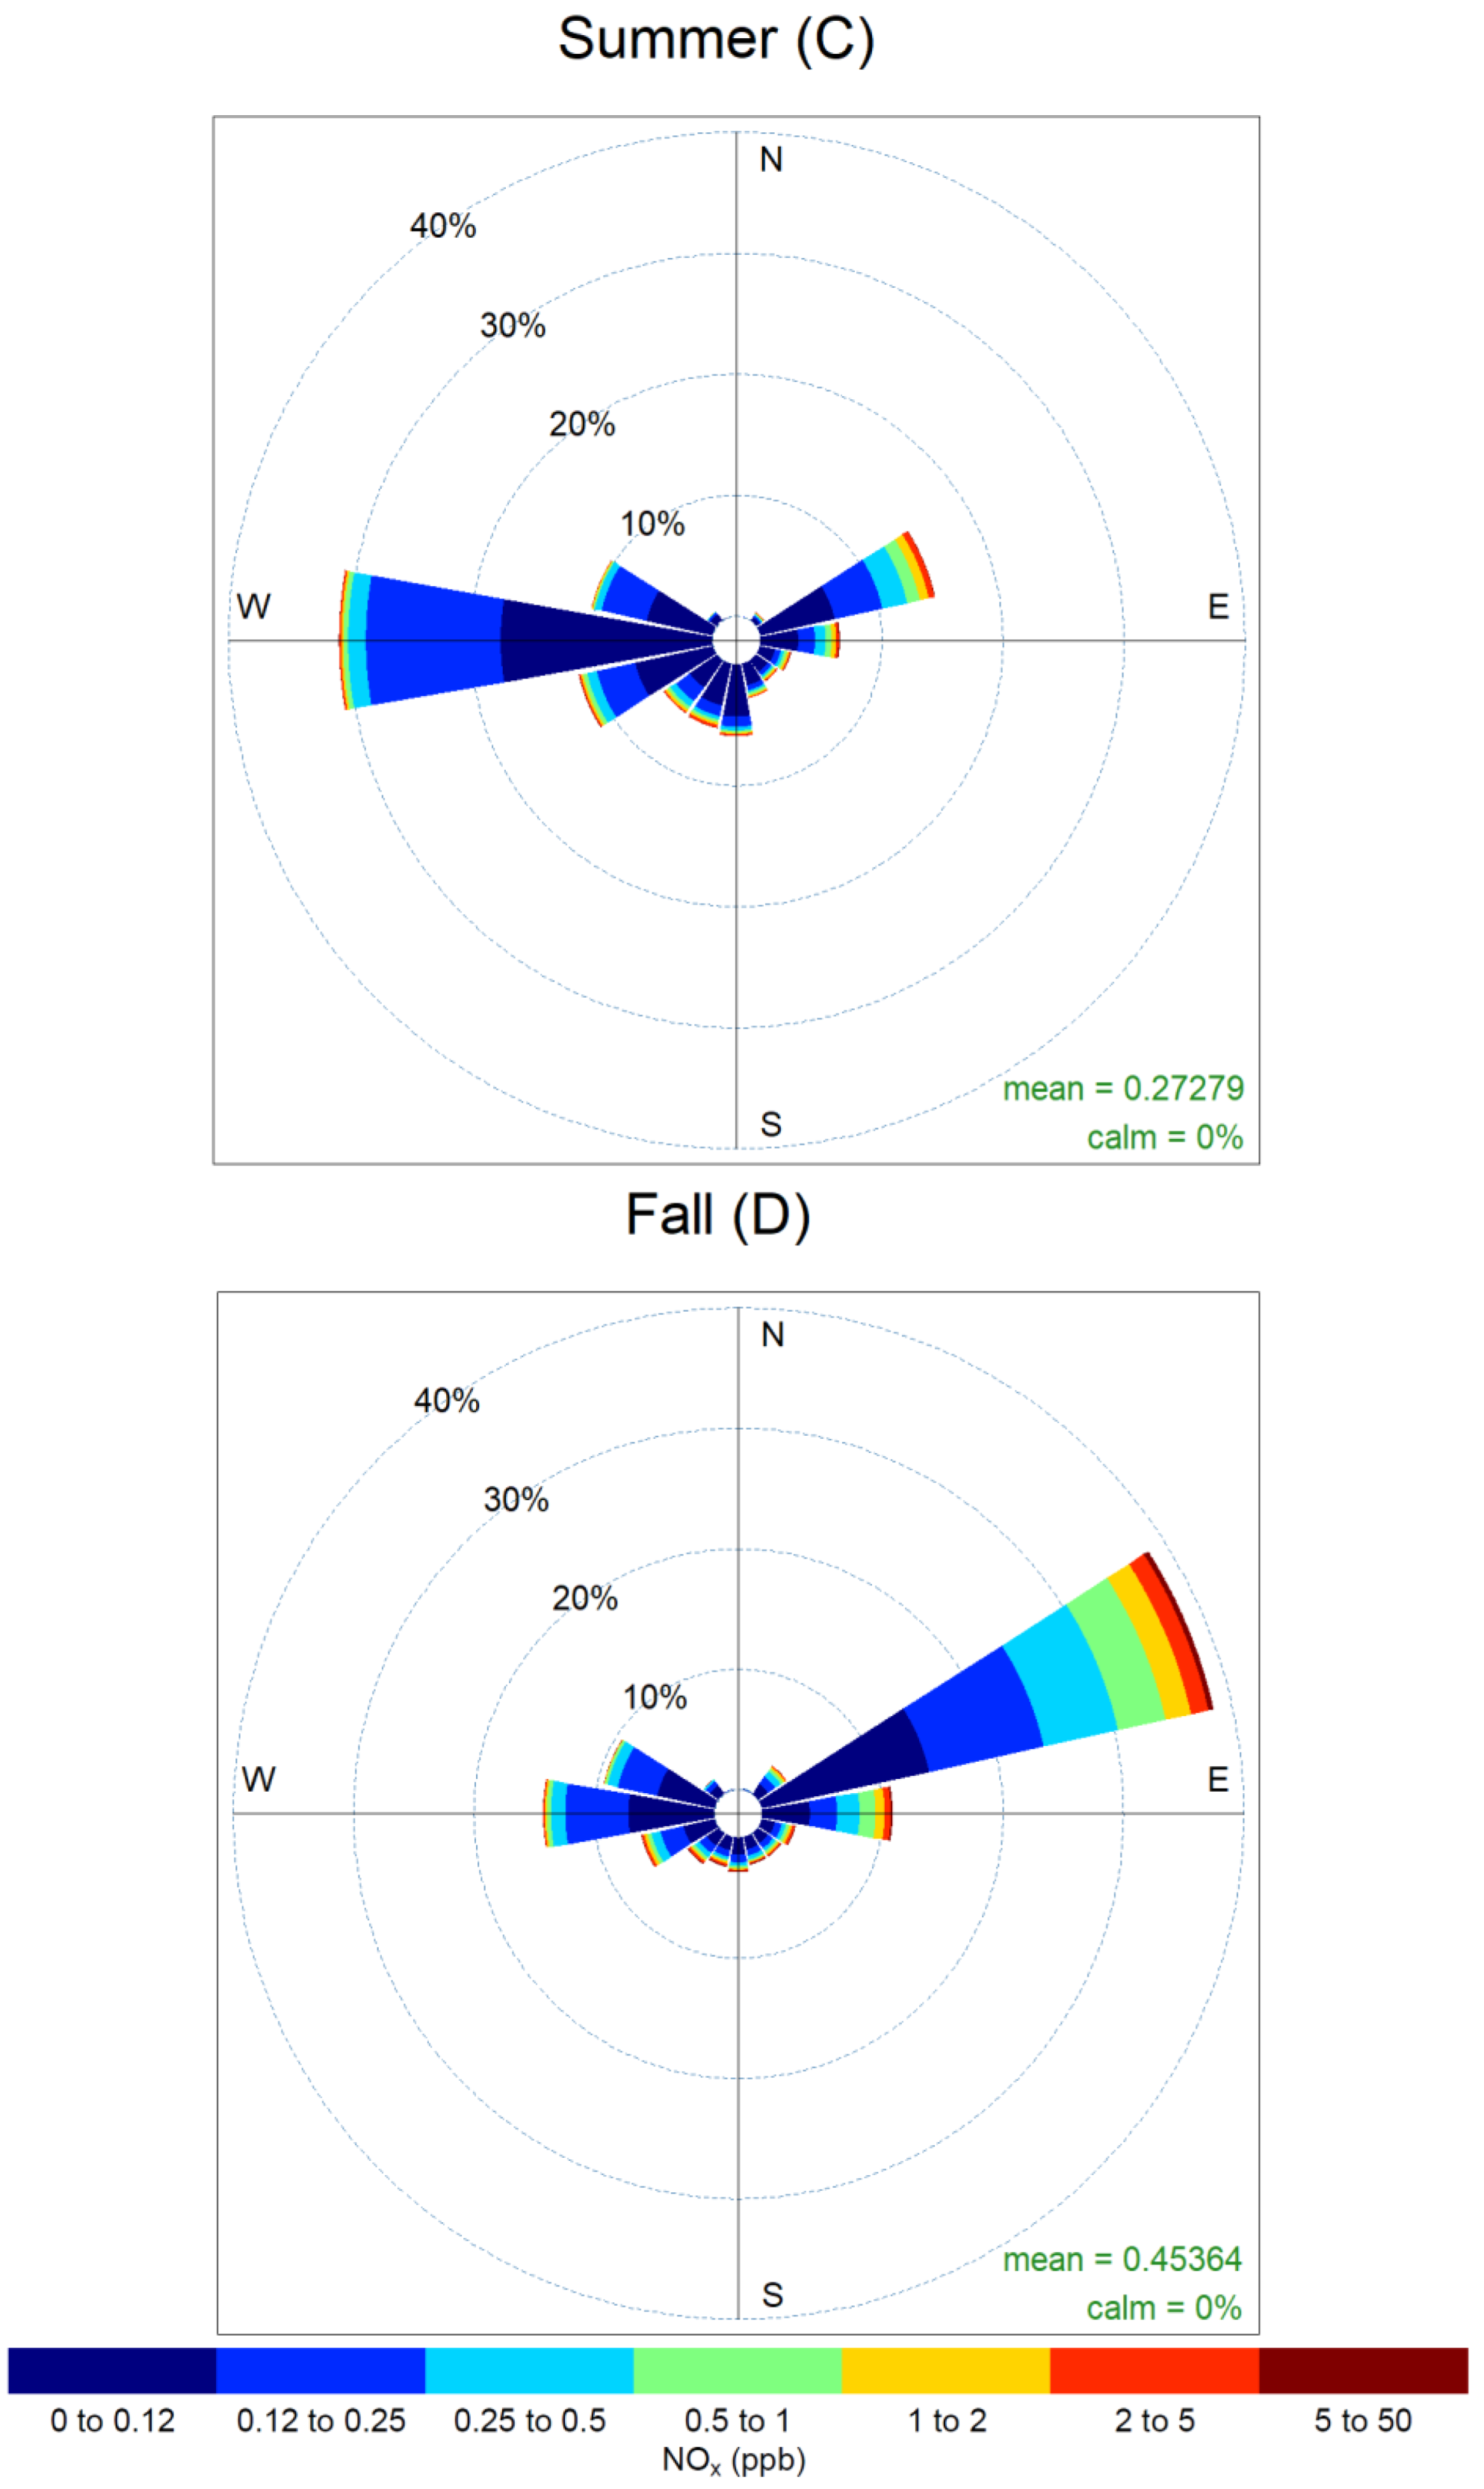
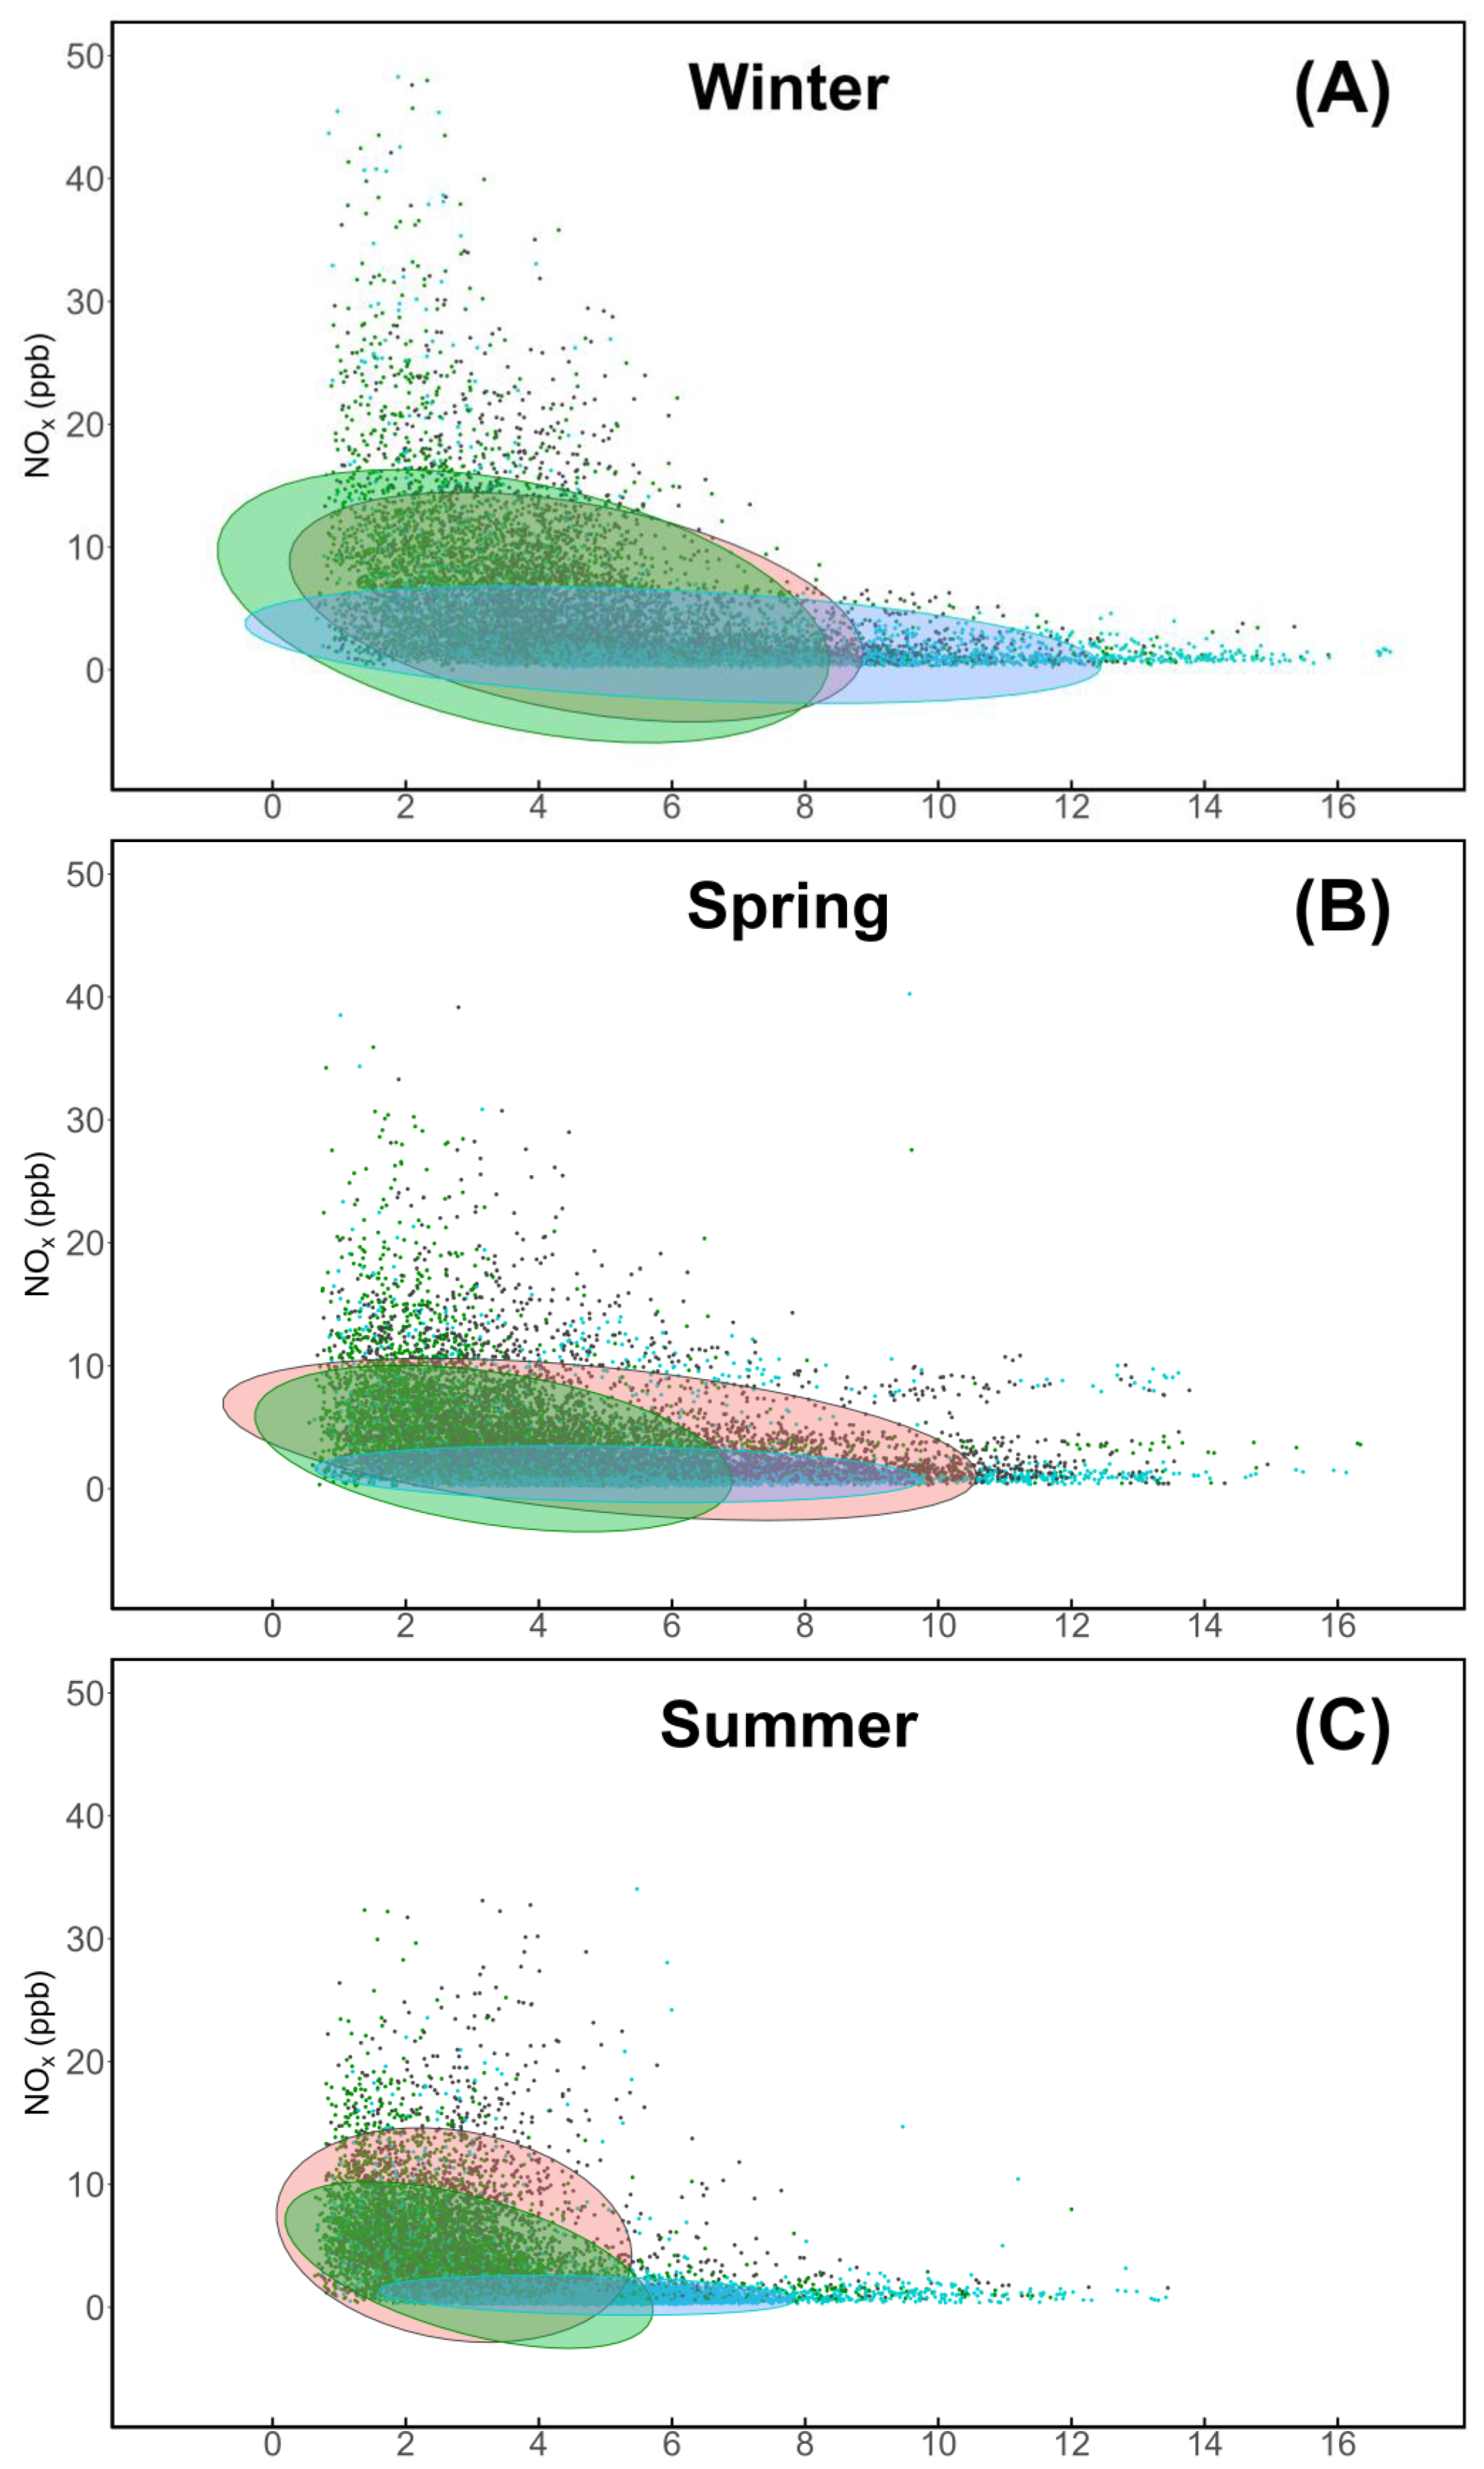
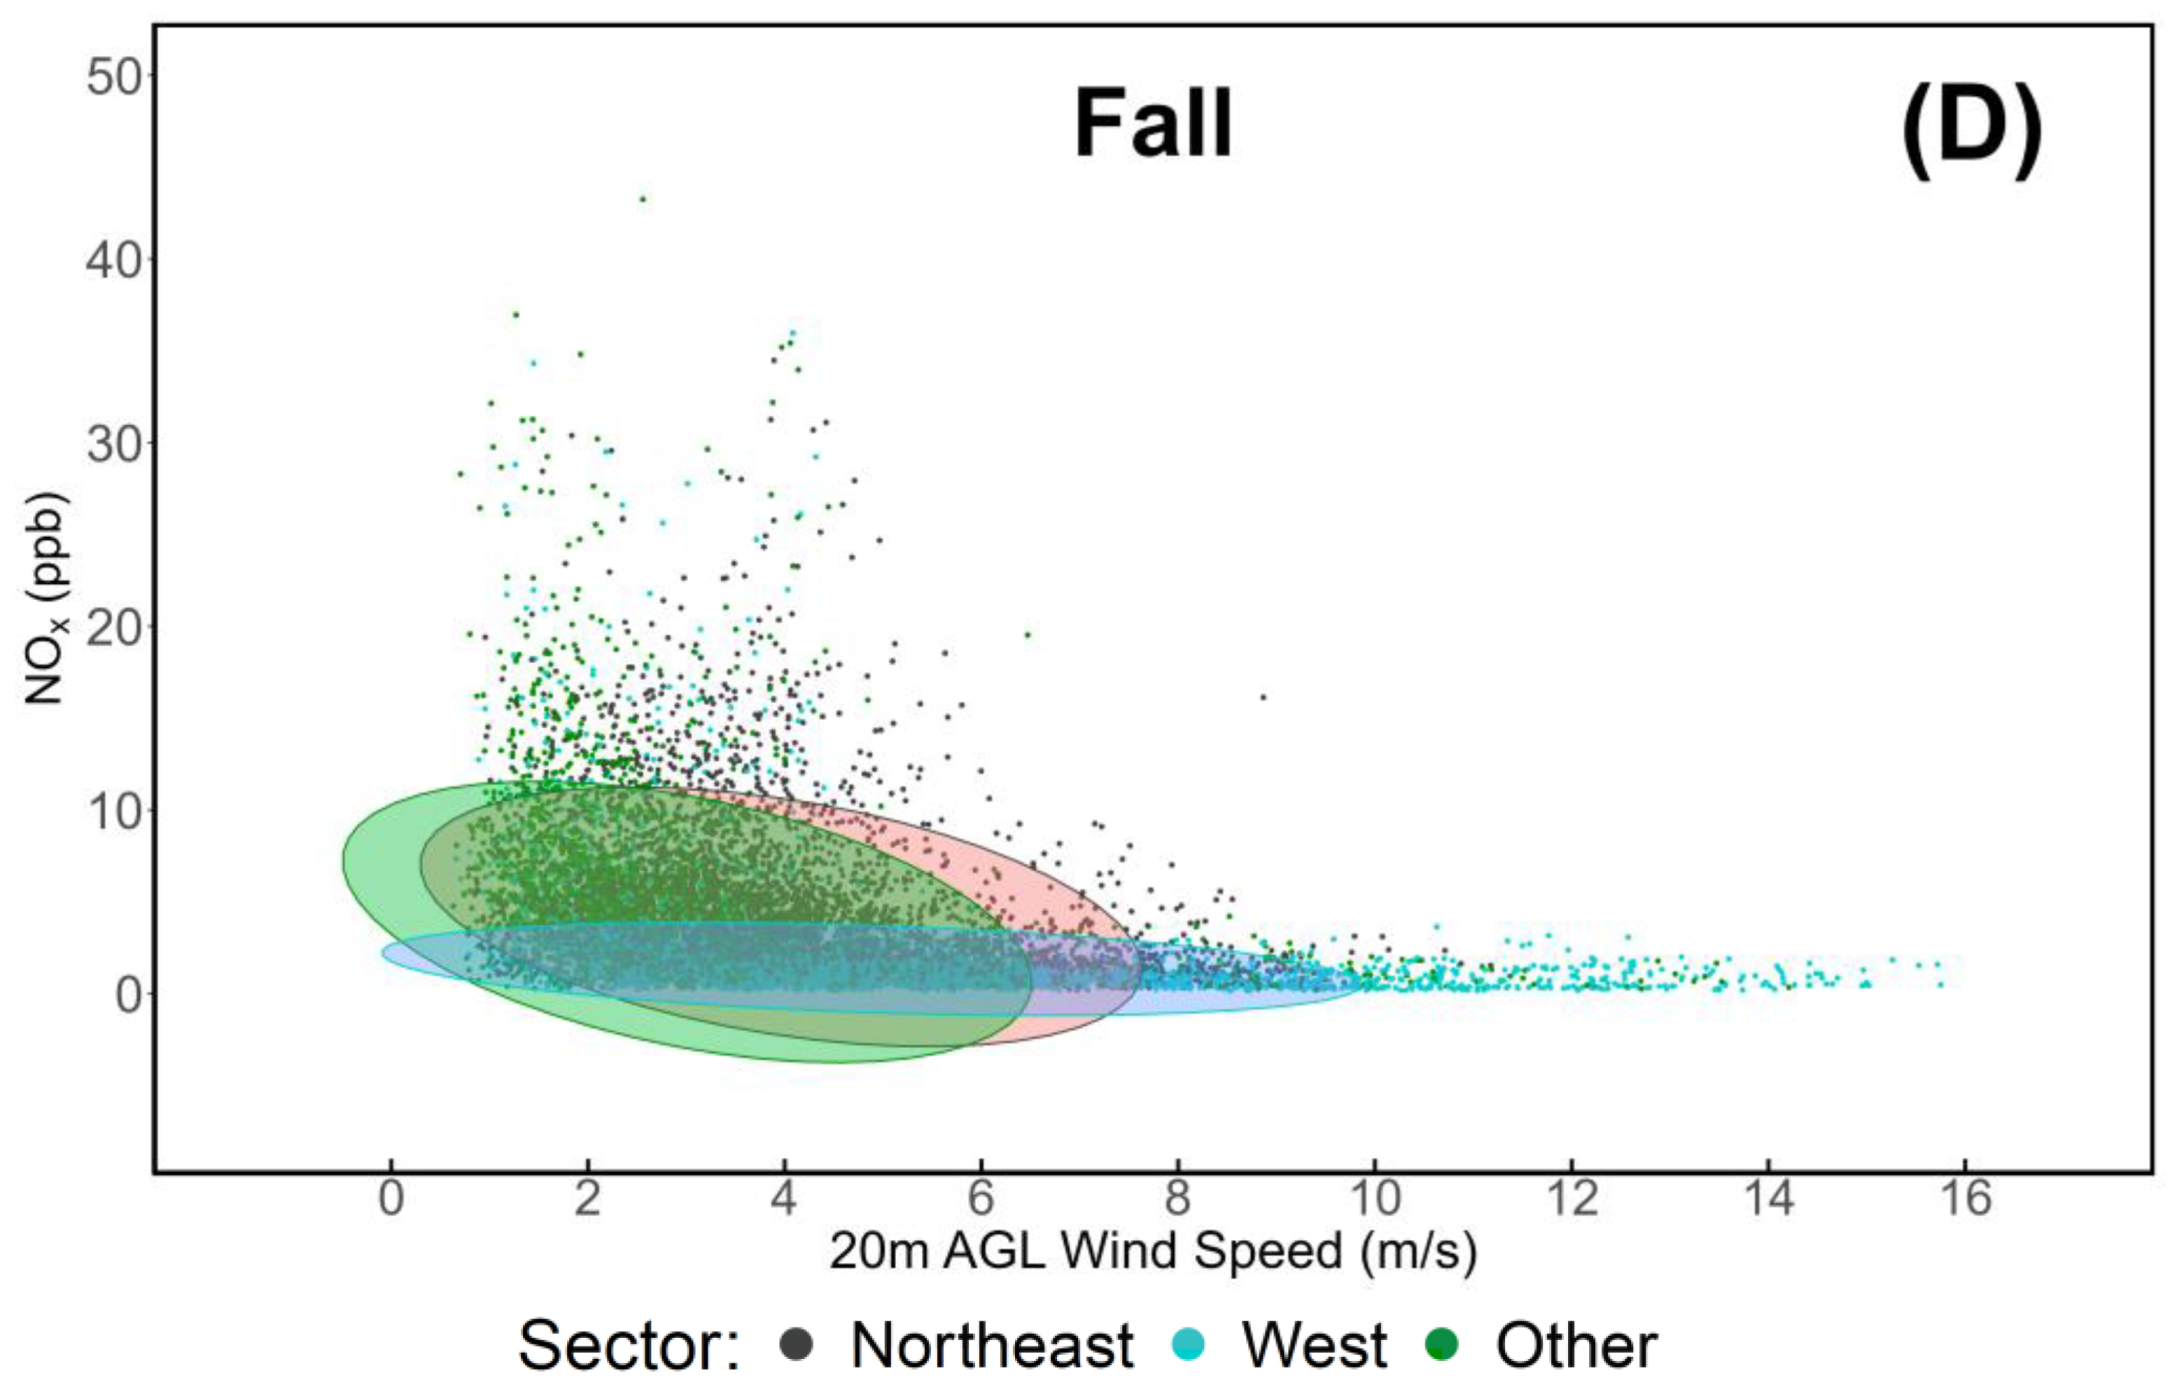
3.4. Variability with 20m AGL Wind Speed/Direction

This study introduces the 20 meters above ground level wind data to provide additional information on low altitude air mass transport of NOx in the area. Previous research on LMT data variability highlighted the influence of wind inversion patterns and air mass transport at higher altitudes as driving factors of a number of peaks in measured pollutants [145]. Figure 7 shows data ellipses based on wind sector categorization of ZephIR 300 data.
Table 2 reports the agreement between wind sectors attributed by each instrument.
The agreement between wind sector categorization assigned by joint weather station and wind lidar measurements is shown in Figure 8.

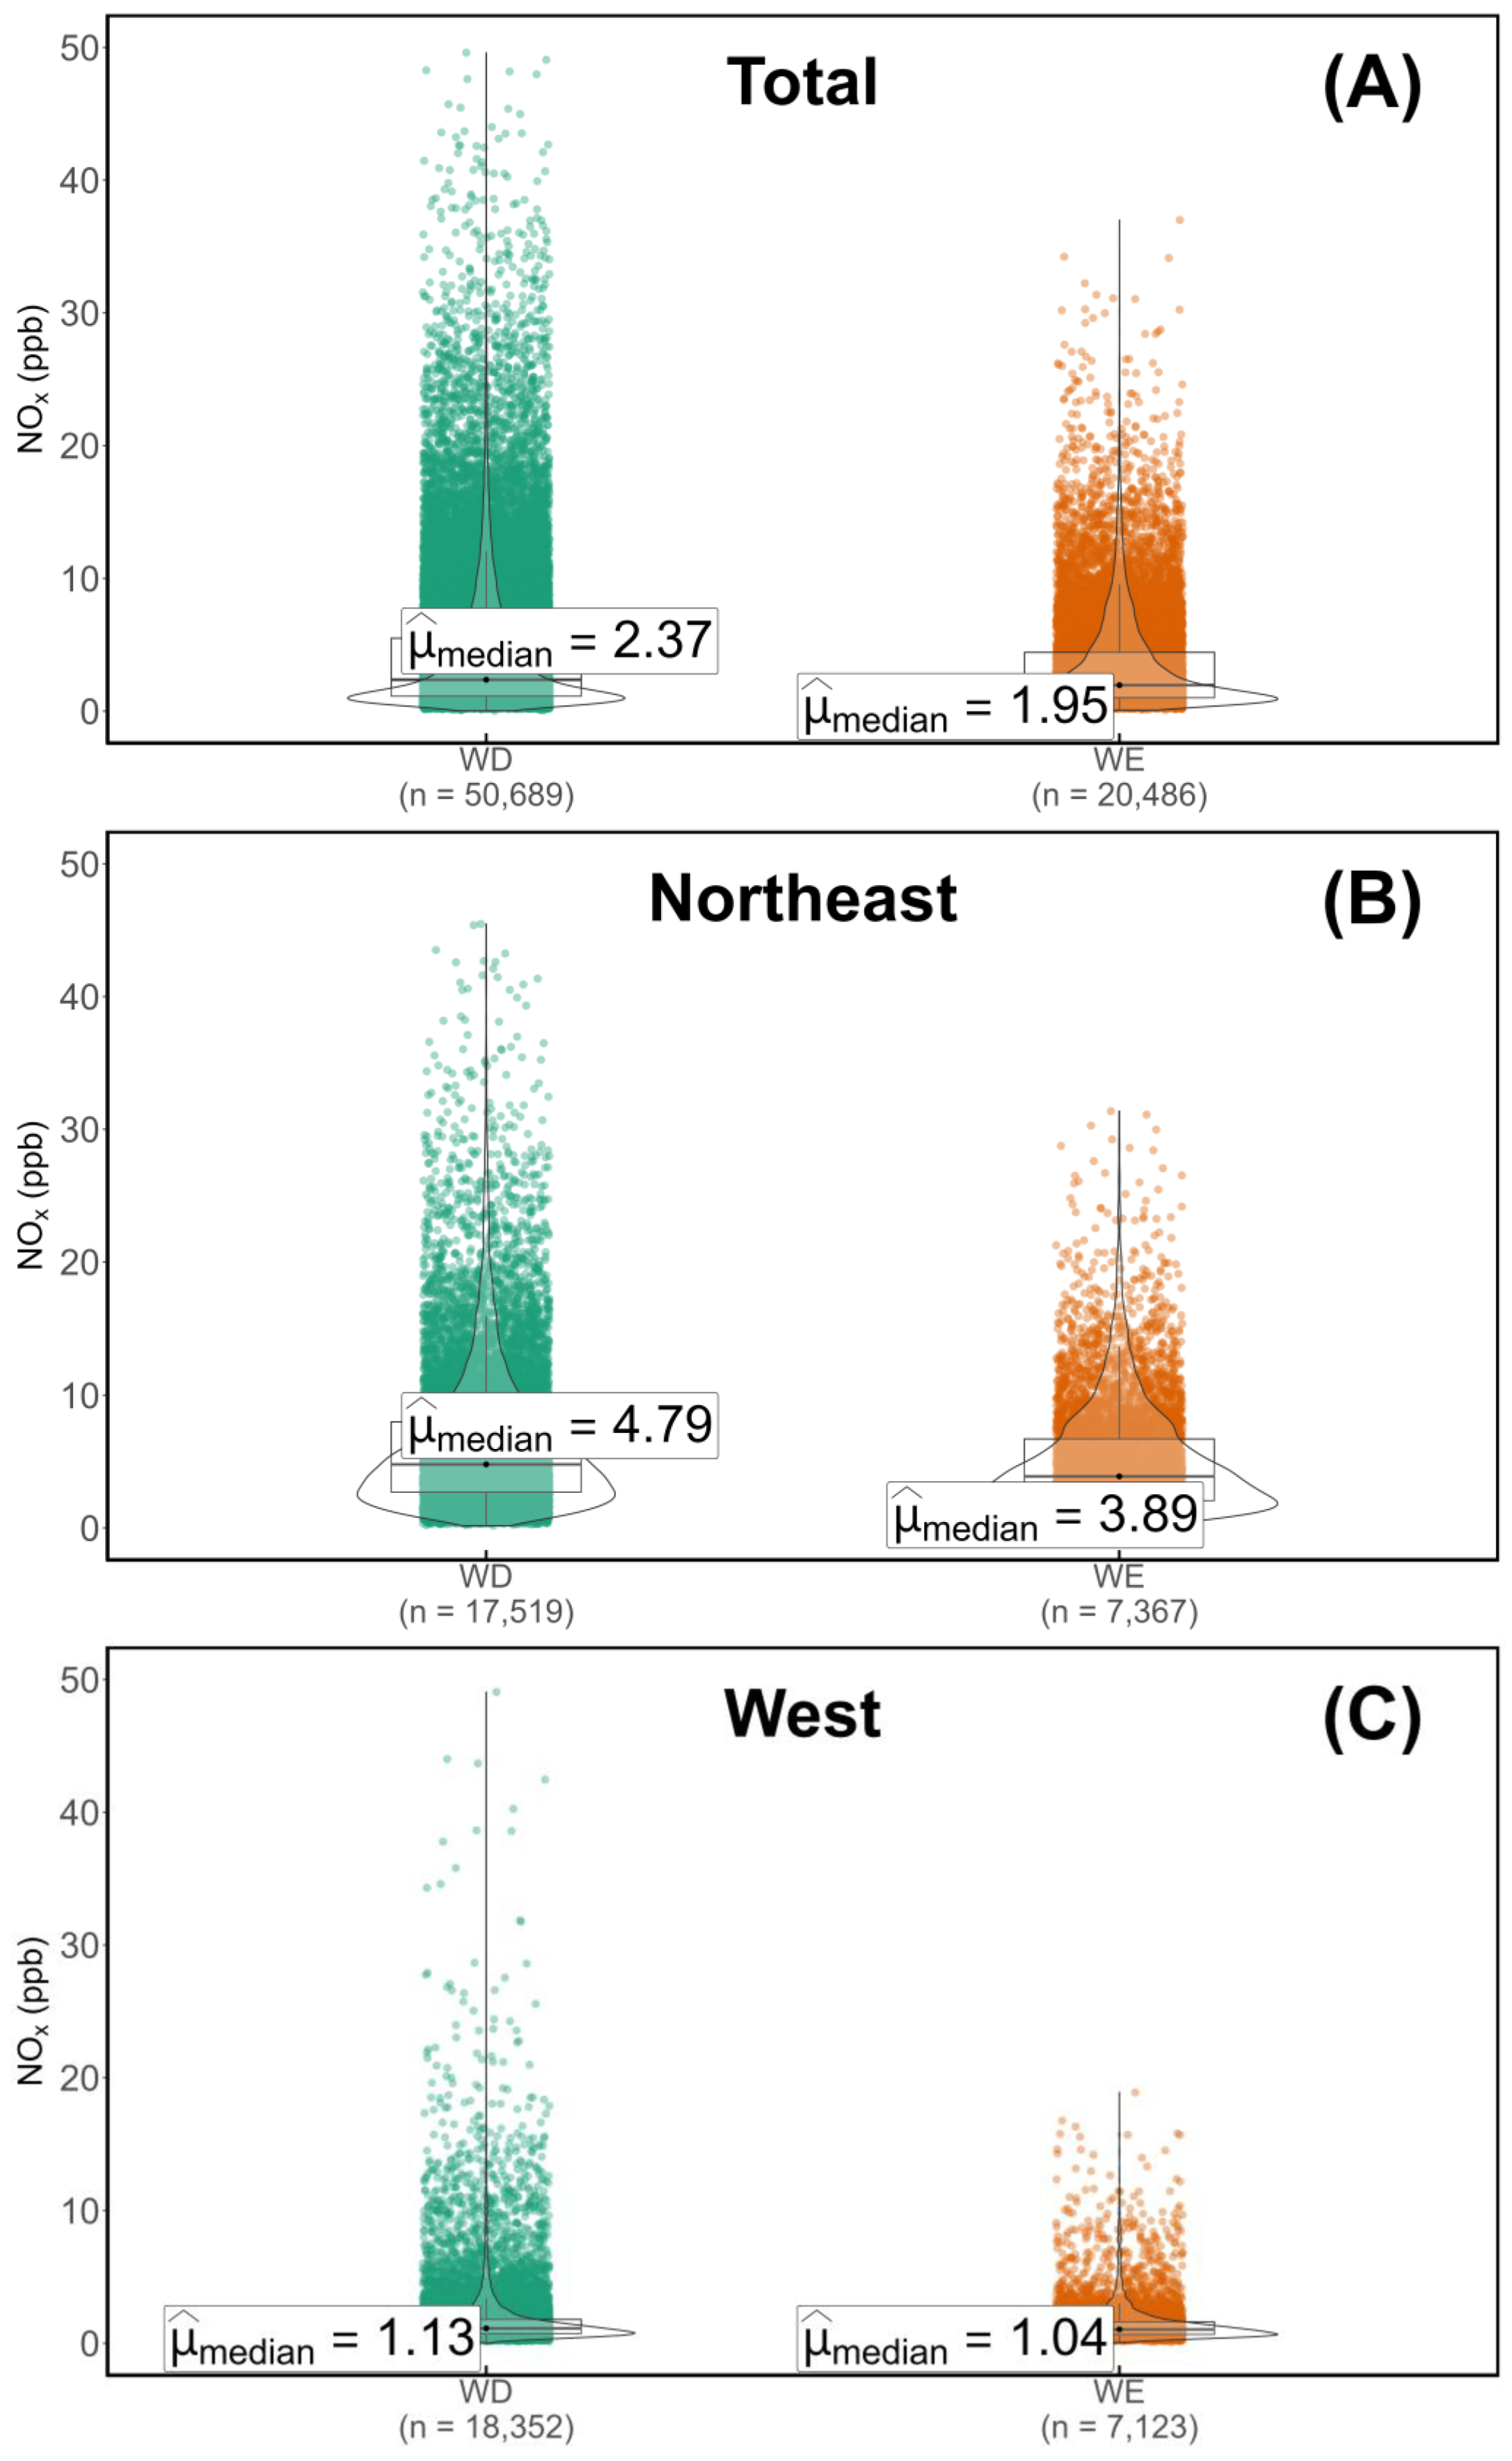
3.5. Weekly Analysis

Over time, several weekly analyses have been employed at the LMT observation site to determine the influence of anthropogenic influences [146], which – unlike natural sources – are characterized by weekly patterns. Figure 9 shows the distribution of NOx data at LMT under a WD-WE categorization (weekday, MON-FRI; weekend, SAT-SUN) [147].
WD averages are consistently greater than their WE counterparts under all wind corridors, however the significance of this difference requires a statistical evaluation. In order to apply the Kruskal-Wallis method [139], the normality of data distribution was evaluated using the Shapiro-Wilk [137] and Jarque-Bera [138] tests, performed independently for NO, NO2, and NOx mole fractions. All tests yielded statistically very significant results (p-value < 2.2×10⁻¹⁶), indicating that data are not normally distributed and a Kruskal-Wallis test can be used, with the results shown in Table 3. The test indicates the presence, under all circumstances, of a statistically significant weekly cycle between WD and WE.
Due to the influence of possible seasonal patterns on weekly cycles, the Kruskal-Wallis method was also applied on seasonality, and the results are shown in Table 4.

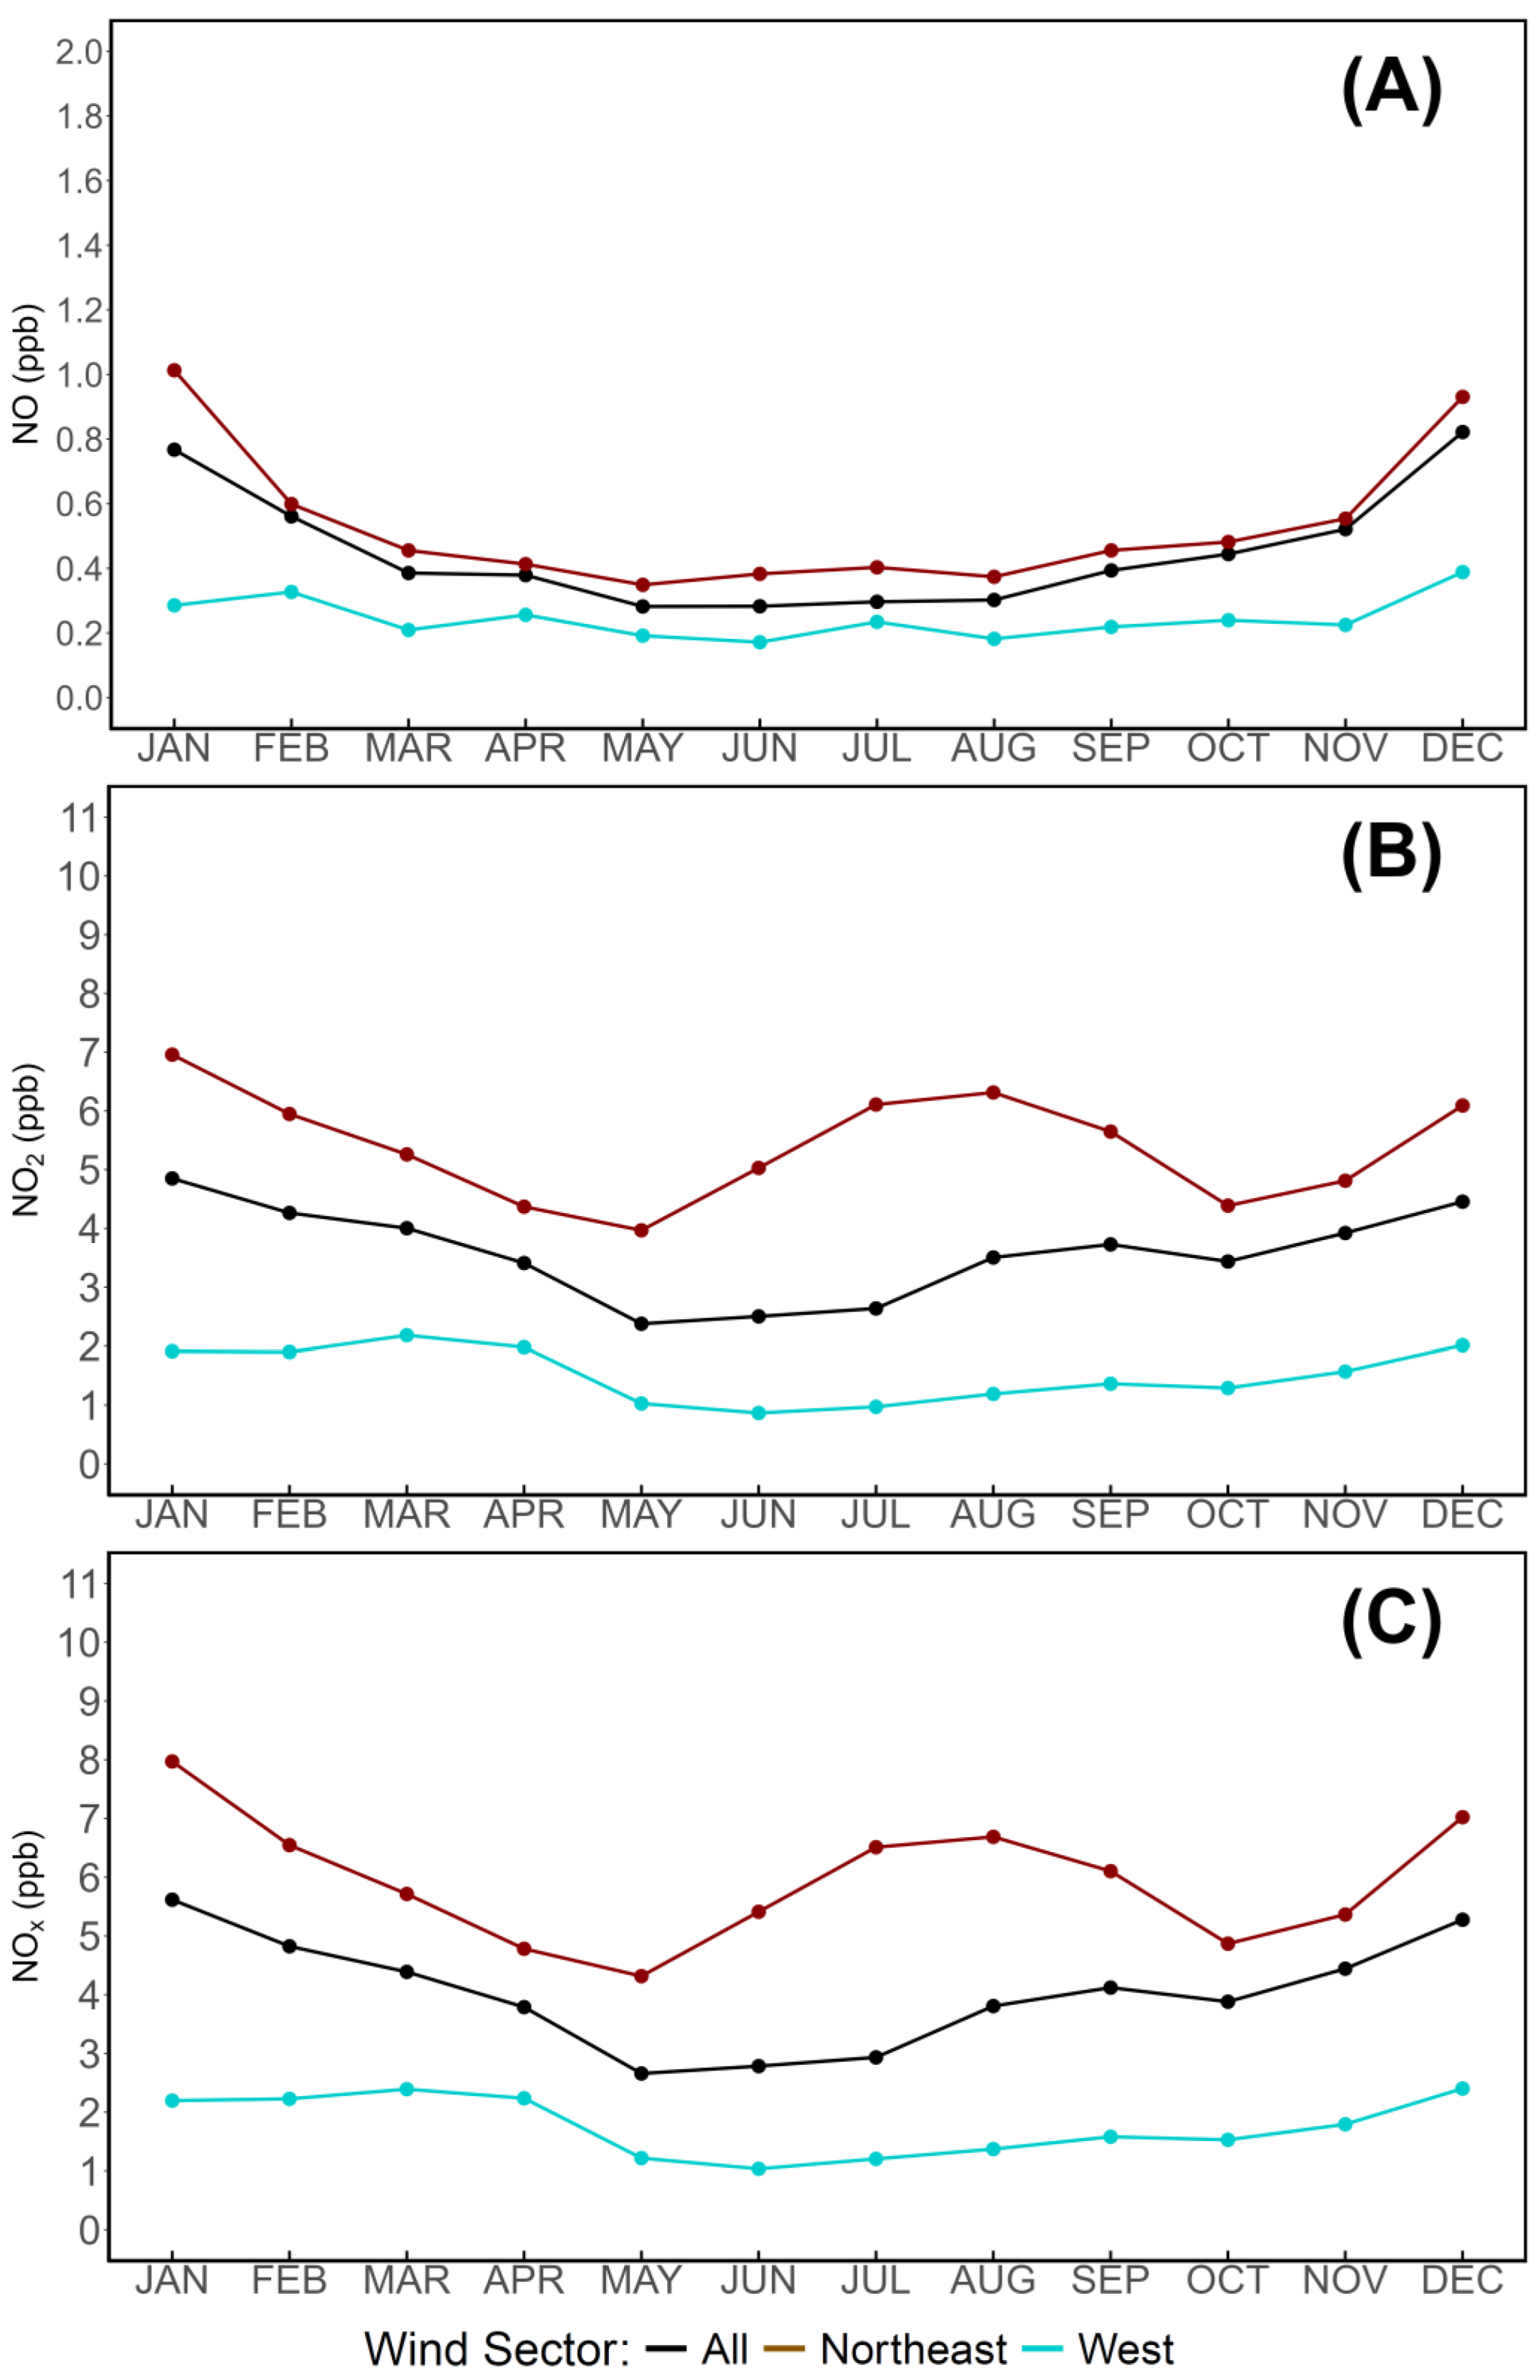
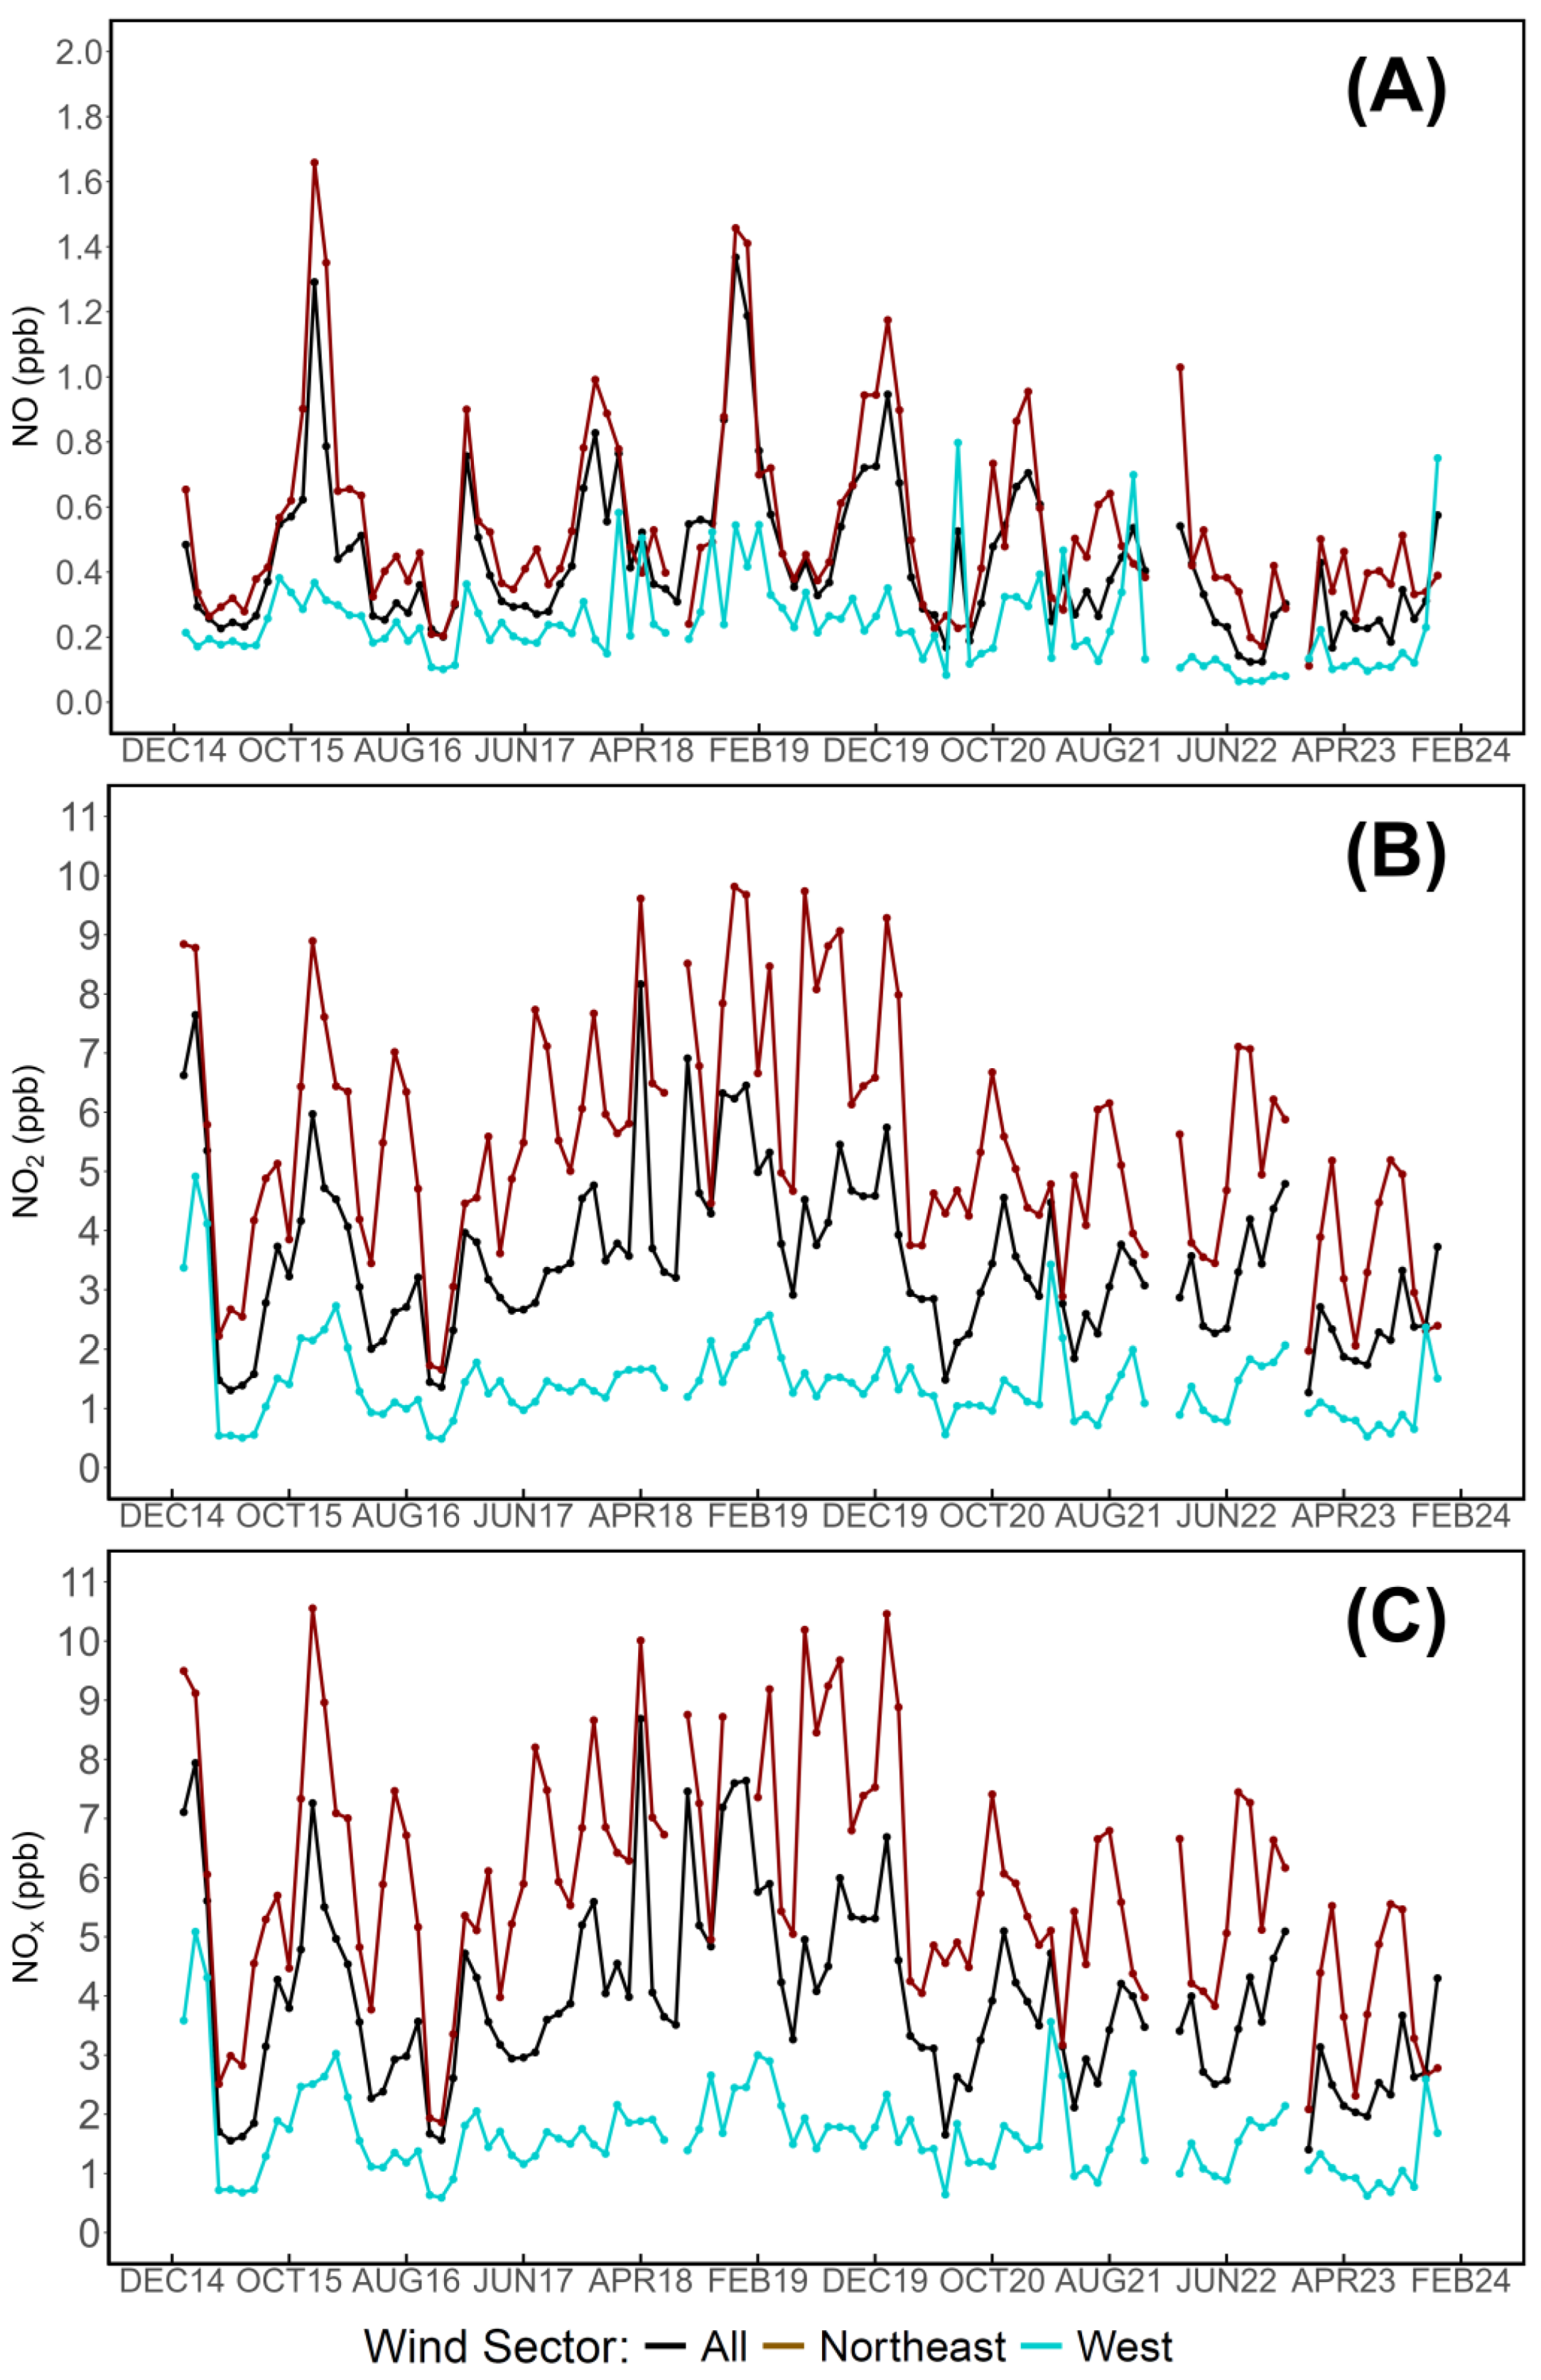
3.6. Annual Cycles and Multi-Year Tendencies

The last evaluation focuses on the standard annual cycle, shown in Figure 10 and categorized by wind sector.
Multi-year tendencies of all parameters have been evaluated via the Mann-Kendall [140,141] methodology, applied to monthly averages of NO, NO2, and NOx. The averaged monthly values measured during the entire study period (2015-2023) are shown in Figure 11, while Table 5 reports the results of trend analyses.

4. Discussion

At the WMO/GAW observation site of Lamezia Terme (LMT) in Calabria, Italy, multi-year analyses of GHGs and aerosols can provide detailed information on the balance between anthropogenic and natural sources in a region characterized by a peculiar location within the Mediterranean Basin (Figure 1) [124,125,127]. Using several years of data, it is possible to assess local variability with higher detail compared to research based on limited time spans and preliminary results [80]. A multi-year study relying on data gathered by several instruments is susceptible to the presence of gaps in the record, especially when two or more instruments need to be integrated to provide joint chemical and physical (e.g., wind) parameters. During the study period (2015-2023), the reported coverage rates of NOx and wind data are very high, thus allowing to differentiate measurements by wind sector (Table 1). This study also introduces wind lidar data in a multi-year evaluation at LMT, with the scope of assessing the transport of pollutants at higher altitude thresholds and compensate the lack of regular weather station measurements in case of maintenance issues (e.g., in the year 2018). Very low concentrations of NOx dominate the dataset (Figure 2), which is well representative of LMT’s nature as a coastal and hybrid urban/rural site, with multiple sources of emission coexisting. This is in accordance with the finding of previous studies, which highlighted the presence of sporadic peaks in pollutants linked to fossil fuel burning and similar anthropogenic sources [33,81,124,146], with non-negligible inputs from livestock farming and agricultural activities [33,80].
At LMT, the analysis of daily cycles is a standard methodology for the assessment of gases and aerosols [33,80,81,124,125,127]. The site is heavily influenced by alternating wind corridors, each with specific characteristics and degrees of anthropogenic influences, and depending on the evaluated atmospheric parameter, diurnal or nocturnal hours may show the highest peaks. During the observation period, the daily cycle of NOx (Figure 3) shows early morning peaks that have been attributed by previous research to rush hour traffic [80]. The same NO peaks observed in the early morning however lack a prominent late evening counterpart, which is attributable to NO’s reaction with tropospheric O3. Additionally, the early morning peaks are spread over multiple hours: in previous research on LMT’s preliminary data, this was attributed to changes between CEST and CET, which caused a shift on the peaks observed using UTC [80]. The finding was used to indicate the dominant anthropogenic nature of the peak. Further evidence in this direction was found in the analysis of trends in pollutants during the first COVID-19 lockdown in Italy, during which very strict regulations [128,129] severely limited anthropic activities: the study found that the rush hour peak was considerably lower during the first lockdown, further demonstrating its anthropogenic nature [81].
The same shifts are observed in the multi-year assessment of this work, and in greater detail considering that previous research, combined, did not consider a full calendar year [80,81] while this work evaluates nine years of continuous measurements. The seasonal daily cycles (Figure 4) indicate changes in the early morning rush hour traffic peak which are compatible with alternating CEST and CET. These plots also allow to assess the behavior of NOx between the late afternoon and the evening: during Winter and Fall, NO2 concentrations show an increase from 15:00UTC onward, while the same occurs at 18:00UTC during Spring and Summer. Warm seasons also show clear minima during diurnal hours, consistent with photolysis as evidenced by previous research [80]. This study also highlights a behavior that was not reported by previous research on NOx variability in the late evening, i.e. from 19:00UTC onward: during Winter and Fall, and to some degree in Spring, observed NOx concentrations reach a peak, followed by a clear declining pattern; during the Summer reason, despite the known increase of NOx sinks such as O3 [125], concentrations remain high and do not experience a considerable decline up until 07:00UTC. The pattern could be representative of increased emissions attributable to tourism, as Calabria is a popular destination within the country and, during the summer, the amount of anthropogenic emissions linked to transportation can increase considerably. A related phenomenon, which is recognized as “non trackable” by local institutions evaluating touristic flows during the season, is the temporary increase in population caused by the return of expats and other categories of individuals who study/work in other regions of the country or abroad.
The influence of agriculture on NOx concentrations at LMT can also be a driving factor. The use of fertilizers can result in NOx emissions [148], and farms are widely spread in the area where LMT is located. Previous research found substantial evidence of peaks in local emissions of CH4 [33,80], attributed to livestock farming and similar sources. The daily cycles of NOx at the site are more consistent with rush hour traffic, however high concentrations measured from the western sector could be attributed to agricultural emissions and wind inversion patterns, which cause diffused emissions to be measured at LMT from the western sector. The implementation of instruments assessing N2O (nitrous oxide) [149,150] and NH3 (ammonia) at the site would provide further evidence on the impact of agriculture on nitrogen oxide variability at LMT. NH3’s short atmospheric lifetime, in particular, could be exploited to assess the influence of fresh local emissions from the agricultural sector.
Previous works also raised the possibility of direct influences from other means of transportation, such as maritime shipping and air traffic [80,124,127]. Influences of maritime shipping on LMT’s sulfur dioxide (SO2) measurements have been reported in the western sector, however a prominent natural sources, i.e. volcanoes, can also contribute to these emissions, thus affecting the possibility of differentiating maritime shipping from other natural sources [127]. Aircraft movements at the nearby Lamezia Terme International Airport, located 3 km north of LMT, may also influence local measurements of NOx, and the possibility of these emissions on LMT measurement was reported in previous research [80,124]. These contributions are also difficult to assess in detail, as aircraft take off and land with headwind alternating between the two runways of SUF/LICA airport, thus indicating that emissions resulting from take off and landing procedures are largely incompatible with LMT’s wind sector. In this case, a campaign of air quality studies at the airport, in conjunction with LMT’s measurements, would allow to better assess these influence and provide a more accurate understanding of local NOx variability.
Previous studies on the behavior of other gases have shown that assessments of concentrations based on wind speed variability can provide substantial evidence in source apportionment efforts. The HBP (Hyperbola Branch Pattern), i.e. with low speeds linked to high concentrations and vice versa, is well documented at the site for CH4, specifically with respect to the northeastern-continental sector [33,124]. Using data ellipses (Figure 5) to group measurements based on wind sector, the same HBP is reported for NOx across all seasons; the western-seaside corridor is known to be linked to the highest wind speeds observed at LMT, due to combinations of local and large scale flows, the absence of obstacles in the western direction, and the broader balances of wind circulation in the area [118,119,120]. When wind lidar measurements at the 20 m AGL threshold are selected (Figure 7), the same pattern emerges, although wind speeds are shifted towards higher values due to the characteristics of vertical wind profiles (Figure 8), which can also show in shifts in wind direction [120], as evidenced by the comparison between the directions measured at both altitudes (Table 2).
Additional information concerning the variability of NOx peaks depending on wind direction is evaluated using seasonal pollution roses (Figure 6), which clearly show the NE/W orientation of the main wind corridors at the site, and the highest peaks in concentration from the northeastern sector, observed in Winter and Fall. The Summer season shows a higher frequency of measurements on the western sector; Spring shows an intermediate behavior. This pattern is compatible with wind inversion patterns influencing the daily cycle at the site [145], and specific conditions such as synoptic regimes [151] which can cause air masses enriched in pollutants to return towards LMT from the Tyrrhenian Sea, thus resulting in higher concentrations observed from the western sector.
At LMT, weekly cycles have been frequently assessed to verify the presence of anthropic influences via a number of methodologies [33,124,125,126,146]. The extent of these influences changes substantially depending on the nature of each parameter, and the presence of seasonal patterns. The same parameter may have a significant weekly cycle during cold seasons due to fuel burning, and change drastically during warm seasons due to a shift in emission sources (e.g., wildfires). Wind sectors can also influence these cycles, hence the requirement to adequately differentiate measurements based on wind sectors: average concentrations vary depending on the selected wind sector, however differences between WD (weekday, MON-FRI) and WE (weekend, SAT-SUN) concentrations are reported (Figure 9). Based on the statistical methods used in previous studies, i.e. the Kruskal-Wallis method [139], these differences have been statistically evaluated to verify their significance, and the results – which account, for the first time, dual WXT520 and ZephIR wind sectors – clearly indicate the presence of significant weekly cycles (Table 3). Further analysis, based on seasonality, shows extremely high levels of significance for all combinations of instruments, seasons, and wind sectors (Table 4), thus providing the most funded evidence ever observed at LMT on the presence of a weekly cycle and, consequently, a clear anthropogenic influence over emissions.
When monthly concentrations and their respective wind sectors are considered, the hypothesis by which summertime tourism could be considered a significant driver of NOx variability is further supported by the annual cycle (Figure 10), which allows a higher degree of detail compared to seasonal categorization. From the results, it is possible to infer that cold seasons are linked to higher emissions, however the June-September period, which is characterized by tourism, shows a shift in concentrations compatible with the trends observed in other evaluations. More importantly, the summertime increase is linked to the northeastern sector, compatible with major transportation infrastructures such as the Mediterranean Highway A2, while the western sector is practically unaffected as it reflects the broader annual cycle. These findings underline the importance of integrating multiple evaluations (wind directions and speeds, daily and weekly cycles, annual cycles) in source apportionment efforts, as each of these methods alone would not provide sufficient evidence to support hypotheses concerning emission sources.
With growing concern over environmental issues and the effects of air quality parameters on human health, it is also crucial to assess multi-year tendencies and verify whether specific pollutants are on the rise, declining, or experiencing shifts in global balances. Due to LMT’s nature and peculiarities, tendencies are dependent on wind sectors which in turn are affected by the balance between local and remote sources of emission (Figure 11). Using the Mann-Kendall [140,141] method, which has previously been used at LMT to assess the multi-year tendencies of CO, CO2, and CH4 [131], all evaluated parameters have yielded declining tendencies (Table 5), although not all results were statistically significant and varied between NO and NO2. The general NOx trend is however significant accounting for all wind sectors, thus indicating that effective policymaking, sustainable policies, and new technologies mitigating anthropogenic emissions can lead to gradual improvements in air quality. The decline is however in contrast to CO2 and CH4, whose levels are on the rise, and CO, which experienced years of declining trends, culminating with a shift towards higher concentrations in recent years [33,131].

5. Conclusions

At the Lamezia Terme (LMT) WMO/GAW site in Calabria, Southern Italy, a multi-year and cyclic assessment of NOx variability has allowed to verify a number of hypotheses raised by previous studies based on short observation periods. The study introduced, for the first time, wind lidar measurements at a select altitude threshold to complement wind direction and speed measurements performed by the local weather station. Following the methodologies applied to other gases, as well as aerosols, NOx have been evaluated in terms of daily/weekly cycle variability, dependence on specific wind speed/direction thresholds, and multi-year tendencies. The considerably longer (2015-2023) study period compared to previous research, which was based on several months of data, has allowed to confirm the effects of fresh anthropogenic emissions on the daily cycle, as rush hour traffic peaks in concentration shift by precisely one hour depending on clock times (CEST/CET), a pattern that is not compatible with natural sources of emission. The northeastern-continental sector of LMT, more exposed to anthropogenic emissions, has yielded higher concentrations of NOx especially at low wind speeds, thus confirming the influence of fresh emissions over the site’s measurements. Sporadic peaks from the western-seaside sector could be attributed with wind inversion patterns typical of the site’s geomorphology and near-surface wind circulation, which is well oriented on two main axes. The evaluation of weekly cycles has yielded the most significant results ever observed at LMT, with all combinations of wind sectors and seasons showing clear differences between weekdays (MON-FRI) and weekends (SAT-SUN), which in turn reflect different degrees of anthropic influence. In contrast to other parameters evaluated at the same site, multi-year tendencies – which are heavily affected by local wind circulation – show a decline in concentrations, punctuated by peaks which affect the overall statistical significance of the overall trends.

Author Contributions

Conceptualization, F.D.; methodology, F.D., T.L.F.; software, F.D., G.D.B., S.S., M.B. and D.P.; validation, F.D., I.A.; G.D.B.; M.B. and D.P.; formal analysis, F.D.; investigation, F.D.; data curation, F.D., I.A.; G.D.B., I.A.; M.B. and D.P.; writing—original draft preparation, F.D.; writing—review and editing, F.D., T.L.F.; I.A.; G.D.B.; S.S.; L.M.; M.B.; D.P. and C.R.C.; visualization, F.D.; supervision, C.R.C.; funding acquisition, C.R.C. All authors have read and agreed to the published version of the manuscript.

Funding

This research was funded by AIR0000032 – ITINERIS, the Italian Integrated Environmental Research Infrastructures System (D.D. n. 130/2022 - CUP B53C22002150006) under the EU - Next Generation EU PNRR - Mission 4 “Education and Research” - Component 2: “From research to business” - Investment 3.1: “Fund for the realization of an integrated system of research and innovation infrastructures”.

Data Availability Statement

Wind lidar measurements at LMT are available on the ITINERIS HUB: https://doi.org/10.71763/6ymh-h168.

Acknowledgments

To be filled in later.

Conflicts of Interest

The authors declare no conflicts of interest.

References

  1. Navarro-González, R.; McKay, C.P.; Mvondo, D.N. A possible nitrogen crisis for Archaean life due to reduced nitrogen fixation by lightning. Nature 2001, 412, 61–64. [Google Scholar] [CrossRef]
  2. Farquhar, J.; Zerkle, A.L.; Bekker, A. Geologic and geochemical constraints on Earth’s early atmosphere. Treat. Geochem. 2014, 6, 91–138. [Google Scholar] [CrossRef]
  3. Summerhayes, C.P. Paleoclimatology: from snowball Earth to the Anthropocene. Wiley, 2020.
  4. Ball, J.C.; Hurley, M.D.; Straccia, A.M.; Gierczak, C.A. Thermal release of nitric oxide from ambient air and diesel particles. Environ. Sci. Technol. 1999, 33, 1175–1178. [Google Scholar] [CrossRef]
  5. Franzblau, E.; Popp, C.J. Nitrogen oxides produced from lightning. J. Geophys. Res. Atmos. 1989, 94, 11089–11104. [Google Scholar] [CrossRef]
  6. Stark, M.S.; Harrison, J.T.H.; Anastasi, C. Formation of nitrogen oxides by electrical discharges and implications for atmospheric lightning. J. Geophys. Res. Atmos. 1996, 101, 6963–6969. [Google Scholar] [CrossRef]
  7. Stockwell, D.Z.; Giannakopoulos, C.; Plantevin, P.-H.; Carver, G.D.; Chipperfield, M.P.; Law, K.S.; Pyle, J.A.; Shallcross, D.E.; Wang, K.-Y. Modelling NOx from lightning and its impact on global chemical fields. Atmos. Environ. 1999, 33, 4477–4493. [Google Scholar] [CrossRef]
  8. Tie, X.; Zhang, R.; Brasseur, G.; Lei, W. Global NOx Production by Lightning. J. Atmos. Chem. 2002, 43, 61–74. [Google Scholar] [CrossRef]
  9. Zhou, Y.; Soula, S.; Pont, V.; Qie, X. NOx ground concentration at a station at high altitude in relation to cloud-to-ground lightning flashes. Atmos. Res. 2005, 75, 47–69. [Google Scholar] [CrossRef]
  10. Zhu, Q.; Laughner, J.L.; Cohen, R.C. Lightning NO2 simulation over the contiguous US and its effects on satellite NO2 retrievals. Atmos. Chem. Phys. 2019, 19, 13067–13078. [Google Scholar] [CrossRef]
  11. Hudman, R.C.; Jacob, D.J.; Turquety, S.; Leibensperger, E.M.; Murray, L.T.; Wu, S.; Gilliland, A.B.; Avery, M.; Bertram, T.H.; Brune, W.; et al. Surface and lightning sources of nitrogen oxides over the United States: Magnitudes, chemical evolution, and outflow. J. Geophys. Res. Atmos. 2007, 112, D12S05. [Google Scholar] [CrossRef]
  12. Schumann, U.; Huntrieser, H. The global lightning-induced nitrogen oxides source. Atmos. Chem. Phys. 2007, 7, 3823–3907. [Google Scholar] [CrossRef]
  13. Zhang, X.; Deng, T.; Wu, D.; Chen, L.; He, G.; Yang, H.; Zou, Y.; Pei, C.; Yue, D.; Tao, L.; Ouyang, S.; Wang, Q.; Zhang, Z. The influence of lightning activity on NOx and O3 in the Pearl River Delta region. Sci. Total Environ. 2023, 902, 166001. [Google Scholar] [CrossRef]
  14. Liu, Z.; Guo, F.; Zhang, Y.; Wu, Z.; Lu, X.; Deng, J.; Chen, K.; Wang, Q.; He, M. Impact of lightning-induced nitrogen oxides over and around the Tibetan Plateau ozone valley. J. Geophys. Res. Atmos. 2024, 129, e2023JD039575. [Google Scholar] [CrossRef]
  15. Gharaylou, M.; Pegahfar, N.; Alizadeh, O. The impact of lightning NOx production on ground-level ozone in Tehran. Earth Space Sci. 2024, 11, e2023EA003372. [Google Scholar] [CrossRef]
  16. Lasek, J.A.; Lajnert, R. On the Issues of NOx as Greenhouse Gases: An Ongoing Discussion…. Appl. Sci. 2022, 12, 10429. [Google Scholar] [CrossRef]
  17. Prather, M.J. Lifetimes and Eigenstates in Atmospheric Chemistry. Geophys. Res. Lett. 1994, 21, 801–804. [Google Scholar] [CrossRef]
  18. Derwent, R.G.; Collins, W.J.; Johnson, C.E.; Stevenson, D.S. Transient Behaviour of Tropospheric Ozone Precursors in a Global 3-D CTM and Their Indirect Greenhouse Effects. Clim. Change 2001, 49, 463–487. [Google Scholar] [CrossRef]
  19. Stevenson, D.S.; Young, P.J.; Naik, V.; Lamarque, J.-F.; Shindell, D.T.; Voulgarakis, A.; Skeie, R.B.; Dalsoren, S.B.; Myhre, G.; Berntsen, T.K.; et al. Tropospheric ozone changes, radiative forcing and attribution to emissions in the Atmospheric Chemistry and Climate Model Intercomparison Project (ACCMIP). Atmos. Chem. Phys. 2013, 13, 3063–3085. [Google Scholar] [CrossRef]
  20. Monks, P.S. Gas-phase radical chemistry in the troposphere. Chem. Soc. Rev. 2005, 34, 376–395. [Google Scholar] [CrossRef]
  21. Mollner, A.K.; Valluvadasan, S.; Feng, L.; Sprague, M.K.; Okumura, M.; Milligan, D.B.; Bloss, W.J.; Sander, S.P.; Martien, P.T.; Harley, R.A.; McCoy, A.B.; Carter, W.P.L. Rate of gas phase association of hydroxyl radical and nitrogen dioxide. Science 2010, 330, 646–649. [Google Scholar] [CrossRef] [PubMed]
  22. Zhou, X.; Gao, X.; Chang, Y.; Zhao, S.; Li, Y. Influence of atmospheric oxidation capacity on atmospheric particulate matters concentration in Lanzhou. Sci. Total Environ. 2024, 914, 169664. [Google Scholar] [CrossRef] [PubMed]
  23. Penner, J.E.; Atherton, C.S.; Dignon, J.; Ghan, S.J.; Walton, J.J.; Hameed, S. Tropospheric nitrogen—A 3-dimensional study of sources, distributions, and deposition. J. Geophys. Res. Atmos. 1991, 96, 959–990. [Google Scholar] [CrossRef]
  24. Trainer, M.; Parrish, D.D.; Buhr, M.P.; Norton, R.B.; Fehsenfeld, F.C.; Anlauf, K.G.; Bottenheim, J.W.; Tang, Y.Z.; Wiebe, H.A.; Roberts, J.M.; et al. Correlation of ozone with NOy in photochemically aged air. J. Geophys. Res.—Atmos. 1993, 98, 2917–2925. [Google Scholar] [CrossRef]
  25. Jacob, D.J.; Heikes, E.G.; Fan, S.-M.; Logan, J.A.; Mauzerall, D.L.; Bradshaw, J.D.; Singh, H.B.; Gregory, G.L.; Talbot, R.W.; Blake, D.R.; et al. Origin of ozone and NOx in the tropical troposphere: A photochemical analysis of aircraft observations over the South Atlantic basin. J. Geophys. Res.—Atmos. 1996, 101, 24235–24250. [Google Scholar] [CrossRef]
  26. Hauglustaine, D.A.; Emmons, L.K.; Newchurch, M.; Brasseur, G.P.; Takao, T.; Matsubara, K.; Johnson, J.; Ridley, B.; Stith, J.; Dye, J. On the role of lightning NOx in the formation of tropospheric ozone plumes: A global model perspective. J. Atmos. Chem. 2001, 38, 277–294. [Google Scholar] [CrossRef]
  27. Henne, S.; Dommen, J.; Neininger, B.; Reimann, S.; Staehelin, J.; Prévôt, A.S.H. Influence of mountain venting in the Alps on the ozone chemistry of the lower free troposphere and the European pollution export. J. Geophys. Res. 2005, 110, 307. [Google Scholar] [CrossRef]
  28. Stein, A.F.; Mantilla, E.; Millán, M.M. Using measured and modeled indicators to assess ozone-NOx-VOC sensitivity in a western Mediterranean coastal environment. Atmos. Environ. 2005, 39, 7167–7180. [Google Scholar] [CrossRef]
  29. Lee, J.D.; Moller, S.J.; Read, K.A.; Lewis, A.C.; Mendes, L.; Carpenter, L.J. Year-round measurements of nitrogen oxides and ozone in the tropical North Atlantic marine boundary layer. J. Geophys. Res. Atmos. 2009, 114, 302. [Google Scholar] [CrossRef]
  30. Mavroidis, I.; Chaloulakou, A. Long-term trends of primary and secondary NO2 production in the Athens area. Variation of the NO2/NOx ratio. Atmos. Environ. 2011, 45, 6872–6879. [Google Scholar] [CrossRef]
  31. Parrish, D.D.; Allen, D.T.; Bates, T.S.; Estes, M.; Fehsenfeld, F.C.; Feingold, G.; Ferrare, R.; Hardesty, R.M.; Meagher, J.F.; Nielsen-Gammon, J.W.; et al. Overview of the Second Texas Air Quality Study (TexAQS II) and the Gulf of Mexico Atmospheric Composition and Climate Study (GoMACCS). J. Geophys. Res. Atmos. 2009, 114, D00F13. [Google Scholar] [CrossRef]
  32. Morgan, W.T.; Allan, J.D.; Bower, K.N.; Highwood, E.J.; Liu, D.; McMeeking, G.R.; Northway, M.J.; Williams, P.I.; Krejci, R.; Coe, H. Airborne measurements of the spatial distribution of aerosol chemical composition across Europe and evolution of the organic fraction. Atmos. Chem. Phys. 2010, 10, 4065–4083. [Google Scholar] [CrossRef]
  33. D’Amico, F.; Lo Feudo, T.; Gullì, D.; Ammoscato, I.; De Pino, M.; Malacaria, L.; Sinopoli, S.; De Benedetto, G.; Calidonna, C.R. Investigation of Carbon Monoxide, Carbon Dioxide, and Methane Source Variability at the WMO/GAW Station of Lamezia Terme (Calabria, Southern Italy) Using the Ratio of Ozone to Nitrogen Oxides as a Proximity Indicator. Atmosphere 2025, 16, 251. [Google Scholar] [CrossRef]
  34. Fenger, J. Urban air quality. Atmos. Environ. 1999, 33, 4877–4900. [Google Scholar] [CrossRef]
  35. Jacob, D.J. Introduction to Atmospheric Chemistry; Princeton University Press: Princeton, NJ, USA, 1999.
  36. Colvile, R.N.; Hutchinson, E.J.; Mindell, J.S.; Warren, R.F. The transport sector as a source of air pollution. Atmos. Environ. 2001, 35, 1537–1565. [Google Scholar] [CrossRef]
  37. Seinfeld, J.H.; Pandis, S.N. Atmospheric Chemistry and Physics; A Wiley-Inter Science Publication, John Wiley & Sons Inc.: Hoboken, NJ, USA, 2006.
  38. Beevers, S.D.; Westmoreland, E.; de Jong, M.C.; Williams, M.L.; Carslaw, D.C. Trends in NOx and NO2 emissions from road traffic in Great Britain. Atmos. Environ. 2012, 54, 107–116. [Google Scholar] [CrossRef]
  39. Liu, F.; Beirle, S.; Zhang, Q.; Dörner, S.; He, K.; Wagner, T. NOx lifetimes and emissions of cities and power plants in polluted background estimated by satellite observations. Atmos. Chem. Phys. 2016, 16, 5283–5298. [Google Scholar] [CrossRef]
  40. Chao, C.Y.H.; Law, A. A study of personal exposure to nitrogen dioxide using passive samplers. Build. Environ. 2000, 35, 545–553. [Google Scholar] [CrossRef]
  41. Sarıca, S.N.; Özden Üzmez, Ö.; Malkoç, S. Household Indoor Concentration Levels of Nitrogen Dioxide (NO2) and Ozone (O3) in Eskisehir, Turkey. Environ. Sci. Proc. 2022, 19, 42. [Google Scholar] [CrossRef]
  42. Ricciardi, M.; Sofia, D.; Faggiano, A.; Bergomi, A.; Comite, V.; Guglielmi, V.; Fermo, P.; Proto, A.; Motta, O. Assessment of some air pollutants in the Sanctuary of the Beata Vergine dei Miracoli (Saronno, Italy) and first evaluation of a new axial passive sampler for nitrogen dioxide. Microchem. J. 2024, 201, 110593. [Google Scholar] [CrossRef]
  43. Dickerson, R.R. Measurements of reactive nitrogen compounds in the free troposphere. Atmos. Environ. 1984, 18, 2585–2593. [Google Scholar] [CrossRef]
  44. Ehhalt, D.H.; Rohrer, F.; Wahner, A. Sources and distribution of NOx in the upper troposphere at northern mid-latitudes. J. Geophys. Res. Atmos. 1992, 97, 3725–3738. [Google Scholar] [CrossRef]
  45. Jaeglé, L.; Jacob, D.J.; Wang, Y.; Weinheimer, A.J.; Ridley, B.A.; Campos, T.L.; Sachse, G.W.; Hagen, D.E. Sources and chemistry of NOx in the upper troposphere over the United States. Geophys. Res. Lett. 1998, 25, 1705–1708. [Google Scholar] [CrossRef]
  46. Levy, H.; Moxim, W.J.; Klonecki, A.A.; Kasibhatla, P.S. Simulated tropospheric NOx: Its evaluation, global distribution and individual source contributions. J. Geophys. Res. Atmos. 1999, 104, 26279–26306. [Google Scholar] [CrossRef]
  47. Benish, S.E.; He, H.; Ren, X.; Roberts, S.J.; Salawitch, R.J.; Li, Z.; Wang, F.; Wang, Y.; Zhang, F.; Shao, M.; Lu, S.; Dickerson, R.R. Measurement report: Aircraft observations of ozone, nitrogen oxides, and volatile organic compounds over Hebei Province, China. Atmos. Chem. Phys. 2020, 20, 14523–14545. [Google Scholar] [CrossRef]
  48. Shah, V.; Jacob, D.J.; Dang, R.; Lamsal, L.N.; Strode, S.A.; Steenrod, S.D.; Boersma, K.F.; Eastham, S.D.; Fritz, T.M.; Thompson, C.; et al. Nitrogen oxides in the free troposphere: implications for tropospheric oxidants and the interpretation of satellite NO2 measurements. Atmos. Chem. Phys. 2023, 23, 1227–1257. [Google Scholar] [CrossRef]
  49. Zhang, X.; Ye, C.; Kim, J.; Lee, H.; Park, J.; Jung, Y.; Hong, H.; Fu, W.; Li, X.; Chen, Y.; et al. Tropospheric NO2 Column over Tibet Plateau According to Geostationary Environment Monitoring Spectrometer: Spatial, Seasonal, and Diurnal Variations. Remote Sens. 2025, 17, 1690. [Google Scholar] [CrossRef]
  50. Bhattacharya, J.; Chaulya, S.K.; Oruganti, S.S. Probabilistic health risk assessment of industrial workers exposed to air pollution. J. Hazard. Toxic Radioact. Waste 2000, 4. [Google Scholar] [CrossRef]
  51. Peel, J. L, Haeuber, R.; Garcia, V.; Russell, A.G.; Neas, L. Impact of nitrogen and climate change interactions on ambient air pollution and human health. Biogeochemistry 2013, 114, 121–134. [Google Scholar] [CrossRef]
  52. Michiels, H.; Mayeres, I.M.; Panis, L.I.; De Nocker, L.; Deutsch, F.; Lefebvre, W. PM2.5 and NOx from traffic: Human health impacts, external costs and policy implications from the Belgian perspective. Transp. Res. D: Transp. Environ. 2012, 17, 569–577. [Google Scholar] [CrossRef]
  53. van Zelm, R.; Preiss, P.; van Goethem, T.; Van Dingenen, R.; Huijbregts, M. Regionalized life cycle impact assessment of air pollution on the global scale: Damage to human health and vegetation. Atmos. Environ. 2016, 134, 129–137. [Google Scholar] [CrossRef]
  54. Shi, C.; Wu, H.; Chiu, Y.-H. The Dynamic Analysis of the Pollutant Emissions Impact on Human Health in China Industries Based on the Meta-Frontier DEA. Healthcare 2020, 8, 5. [Google Scholar] [CrossRef]
  55. Knott, A.B.; Bossy-Wetzel, E. Impact of nitric oxide on metabolism in health and age-related disease. Diabetes Obes. Metab. 2010, 12, 126–133. [Google Scholar] [CrossRef]
  56. Meo, S.A.; Alrashed, A.H.; Almana, A.A.; Altheiban, Y.I.; Aldosari, M.S.; Almudarra, N.F.; Alwabel, S.A. Lung function and fractional exhaled nitric oxide among petroleum refinery workers. J. Occup. Med. Toxicol. 2015, 10, 37. [Google Scholar] [CrossRef]
  57. Guo, H.; Yang, W.; Jiang, L.; Lyu, Y.; Cheng, T.; Gao, B.; Li, X. Association of short-term exposure to ambient air pollutants with exhaled nitric oxide in hospitalized patients with respiratory-system diseases. Ecotoxicol. Environ. Saf. 2019, 168, 394–400. [Google Scholar] [CrossRef]
  58. Meo, S.A.; Aldeghaither, M.; Alnaeem, K.A.; Alabdullatif, F.S.; Alzamil, A.F.; Alshunaifi, A.I.; Alfayez, A.S.; Almahmoud, M.; Meo, A.S.; El-Mubarak, A.H. Effect of motor vehicle pollution on lung function, fractional exhaled nitric oxide and cognitive function among school adolescents. Eur. Rev. Med. Pharmacol. Sci. 2019, 23, 8678–8686. [Google Scholar] [CrossRef] [PubMed]
  59. Czubaj-Kowal, M.; Kurzawa, R.; Mazurek, H.; Sokołowski, M.; Friediger, T.; Polak, M.; Nowicki, G.J. Relationship Between Air Pollution and the Concentration of Nitric Oxide in the Exhaled Air (FeNO) in 8–9-Year-Old School Children in Krakow. Int. J. Environ. Res. Public Health 2021, 18, 6690. [Google Scholar] [CrossRef] [PubMed]
  60. Ruwali, S.; Talebi, S.; Fernando, A.; Wijeratne, L.O.H.; Waczak, J.; Dewage, P.M.H.; Lary, D.J.; Sadler, J.; Lary, T.; Lary, M.; et al. Quantifying Inhaled Concentrations of Particulate Matter, Carbon Dioxide, Nitrogen Dioxide, and Nitric Oxide Using Observed Biometric Responses with Machine Learning. BioMedInformatics 2024, 4, 1019–1046. [Google Scholar] [CrossRef]
  61. Hickey, R.J.; Clelland, R.C.; Boyce, D.E.; Bowers, E.J. Atmospheric sulfur dioxide, nitrogen dioxide and lead as mutagenic hazards to human health. Mutation Res. 1974, 26, 445. [Google Scholar]
  62. Pilotto, L.S.; Douglas, R.M.; Attewell, R.G.; Wilson, S.R. Respiratory effects associated with indoor nitrogen dioxide exposure in children. Int. J. Epidemiol. 1997, 26, 788–796. [Google Scholar] [CrossRef] [PubMed]
  63. Samoli, E. Short-term effects of nitrogen dioxide on mortality: An analysis within the APHEA project. Eur. Respir. J. 2006, 27, 1129–1138. [Google Scholar] [CrossRef]
  64. Breysse, P.N.; Diette, G.B.; Matsui, E.C.; Butz, A.M.; Hansel, N.N.; McCormack, M.C. Indoor air pollution and asthma in children. Proc. Am. Thorac. Soc. 2010, 7, 102–106. [Google Scholar] [CrossRef]
  65. Atkinson, R.W.; Butland, B.K.; Anderson, H.R.; Maynard, R.L. Long-term Concentrations of Nitrogen Dioxide and Mortality: A Meta-analysis of Cohort Studies. Epidemiology 2018, 29, 460–472. [Google Scholar] [CrossRef] [PubMed]
  66. Mu, J.; Zeng, D.; Zeng, H. Effects of nitrogen dioxide exposure on the risk of eye and adnexa diseases among children in Shenzhen, China: an assessment using the generalized additive modeling approach. Int. J. Environ. Health Res. 2020, 32, 840–849. [Google Scholar] [CrossRef]
  67. Huang, S.; Li, H.; Wang, M.; Qian, Y.; Steenland, K.; Caudle, W.M.; Liu, Y.; Sarnat, J.; Papatheodorou, S.; Shi, L. Long-term exposure to nitrogen dioxide and mortality: A systematic review and meta-analysis. Sci. Total Environ. 2021, 776, 145968. [Google Scholar] [CrossRef]
  68. Amadou, A.; Praud, D.; Coudon, T.; Deygas, F.; Grassot, L.; Dubuis, M.; Faure, E.; Couvidat, F.; Caudeville, J.; Bessagnet, B.; et al. Long-term exposure to nitrogen dioxide air pollution and breast cancer risk: A nested case-control within the French E3N cohort study. Environ. Poll. 2023, 317, 120719. [Google Scholar] [CrossRef]
  69. Rus, A.-A.; Pescariu, S.-A.; Zus, A.-S.; Gaiţă, D.; Mornoş, C. Impact of Short-Term Exposure to Nitrogen Dioxide (NO2) and Ozone (O3) on Hospital Admissions for Non-ST-Segment Elevation Acute Coronary Syndrome. Toxics 2024, 12, 123. [Google Scholar] [CrossRef]
  70. Valin, L.C.; Russell, A.R.; Hudman, R.C.; Cohen, R.C. 2011 Effects of model resolution on the interpretation of satellite NO2 observations. Atmos. Chem. Phys. 2011, 11, 11647–11655. [Google Scholar] [CrossRef]
  71. Lu, Z.; Streets, D.G. Increase in NOx Emissions from Indian Thermal Power Plants during 1996–2010: Unit-Based Inventories and Multisatellite Observations. Environ. Sci. Technol. 2012, 46, 7463–7470. [Google Scholar] [CrossRef]
  72. Duncan, B.N.; Yoshida, Y.; de Foy, B.; Lamsal, L.N.; Streets, D.G.; Lu, Z.; Pickering, K.E.; Krotkov, N. A. The observed response of Ozone Monitoring Instrument (OMI) NO2 columns to NOx emission controls on power plants in the United States: 2005–2011. Atmos. Environ. 2013, 81, 102–111. [Google Scholar] [CrossRef]
  73. Gu, D.; Wang, Y.; Yin, R.; Zhang, Y.; Smeltzer, C. Inverse modelling of NOx emissions over eastern China: uncertainties due to chemical non-linearity. Atmos. Meas. Tech. 2016, 9, 5193–5201. [Google Scholar] [CrossRef]
  74. Cooper, M.; Martin, R.V.; Padmanabhan, A.; Henze, D.K. Comparing mass balance and adjoint methods for inverse modeling of nitrogen dioxide columns for global nitrogen oxide emissions. J. Geophys. Res. Atmos. 2017, 122, 4718–4734. [Google Scholar] [CrossRef]
  75. Laughner, J.L.; Cohen, R.C. Direct observation of changing NOx lifetime in North American cities. Science 2019, 366, 723–727. [Google Scholar] [CrossRef]
  76. Shah, V.; Jacob, D.J.; Li, K.; Silvern, R.F.; Zhai, S.; Liu, M.; Lin, J.; Zhang, Q. Effect of changing NOx lifetime on the seasonality and long-term trends of satellite-observed tropospheric NO2 columns over China. Atmos. Chem. Phys. 2020, 20, 1483–1495. [Google Scholar] [CrossRef]
  77. Lange, K.; Richter, A.; Burrows, J.P. Variability of nitrogen oxide emission fluxes and lifetimes estimated from Sentinel-5P TROPOMI observations. Atmos. Chem. Phys. 2022, 22, 2745–2767. [Google Scholar] [CrossRef]
  78. Yousuf, M.F.; Mahmud, M.S. Review on Detection Methods of Nitrogen Species in Air, Soil and Water. Nitrogen 2022, 3, 101–117. [Google Scholar] [CrossRef]
  79. Morillas, C.; Álvarez, S.; Pires, J.C.M.; García, A.J.; Martínez, S. Linking Satellite and Ground Observations of NO2 in Spanish Cities: Influence of Meteorology and O3. Nitrogen 2025, 6, 32. [Google Scholar] [CrossRef]
  80. Cristofanelli, P.; Busetto, M.; Calzolari, F.; Ammoscato, I.; Gullì, D.; Dinoi, A.; Calidonna, C.R.; Contini, D.; Sferlazzo, D.; Di Iorio, T.; Piacentino, S.; Marinoni, A.; Maione, M.; Bonasoni, P. Investigation of reactive gases and methane variability in the coastal boundary layer of the central Mediterranean basin. Elem. Sci. Anth. 2017, 5, 12. [Google Scholar] [CrossRef]
  81. D’Amico, F.; Ammoscato, I.; Gullì, D.; Avolio, E.; Lo Feudo, T.; De Pino, M.; Cristofanelli, P.; Malacaria, L.; Parise, D.; Sinopoli, S.; et al. Trends in CO, CO2, CH4, BC, and NOx during the first 2020 COVID-19 lockdown: source insights from the WMO/GAW station of Lamezia Terme (Calabria, Southern Italy). Sustainability 2024, 16, 8229. [Google Scholar] [CrossRef]
  82. Longhitano, S.G. The record of tidal cycles in mixed silici–bioclastic deposits: Examples from small Plio–Pleistocene peripheral basins of the microtidal Central Mediterranean Sea. Sedimentology 2010, 58, 691–719. [Google Scholar] [CrossRef]
  83. Chiarella, D.; Longhitano, S.G.; Muto, F. Sedimentary features of the lower Pleistocene mixed siliciclastic-bioclastic tidal deposits of the Catanzaro Strait (Calabrian Arc, south Italy). Rend. Online Della Soc. Geol. Ital. 2012, 21, 919–920. [Google Scholar]
  84. Longhitano, S.G. A facies-based depositional model for ancient and modern, tectonically-confined tidal straits. Terra Nova 2013, 25, 446–452. [Google Scholar] [CrossRef]
  85. Longhitano, S.G.; Chiarella, D.; Muto, F. Three-dimensional to two-dimensional cross-strata transition in the lower Pleistocene Catanzaro tidal strait transgressive succession (southern Italy). Sedimentology 2014, 61, 2136–2171. [Google Scholar] [CrossRef]
  86. Chiarella, D.; Moretti, M.; Longhitano, S.G.; Muto, F. Deformed cross-stratified deposits in the Early Pleistocene tidally-dominated Catanzaro strait-fill succession, Calabrian Arc (Southern Italy): Triggering mechanisms and environmental significance. Sediment. Geol. 2016, 344, 277–289. [Google Scholar] [CrossRef]
  87. Brogan, G.E.; Cluff, L.S.; Taylor, C.L. Seismicity and uplift of southern Italy. Tectonophysics 1975, 29, 323–330. [Google Scholar] [CrossRef]
  88. Miyauchi, T.; Dai Pra, G.; Sylos Labini, S. Geochronology of Pleistocene marine terraces and regional tectonics in Tyrrhenian coast of South Calabria, Italy. Il Quaternario 1994, 7, 17–34. [Google Scholar]
  89. Monaco, C.; Bianca, M.; Catalano, S.; De Guidi, G.; Gresta, S.; Langher, H.; Tortorici, L. The geological map of the urban area of Catania (Sicily): Morphotectonic and seismotectonic implications. Mem. Soc. Geol. Ital. 2001, 5, 425–438. [Google Scholar]
  90. Lambeck, K.; Antonioli, F.; Purcell, A.; Silenzi, S. Sea-level change along the Italian coast for the past 10,000 yr. Quat. Sci. Rev. 2004, 23, 1567–1598. [Google Scholar] [CrossRef]
  91. Roda-Boluda, D.C.; Whittaker, A.C. Structural and geomorphological constraints on active normal faulting and landscape evolution in Calabria, Italy. J. Geol. Soc. 2017, 174, 701–720. [Google Scholar] [CrossRef]
  92. Pirazzoli, P.A.; Mastronuzzi, G.; Saliège, J.F.; Sansò, P. Late Holocene emergence in Calabria, Italy. Mar. Geol. 1997, 141, 61–70. [Google Scholar] [CrossRef]
  93. Ruello, M.R.; Cinque, A.; Di Donato, V.; Molisso, F.; Terrasi, F.; Russo Ermolli, E. Interplay between sea level rise and tectonics in the Holocene evolution of the St. Eufemia Plain (Calabria, Italy). J. Coast. Conserv. 2017, 21, 903–915. [Google Scholar] [CrossRef]
  94. Ogniben, L. Schema introduttivo alla geologia del confine Calabro-lucano (Introductory scheme to the geology of the Calabrian-Lucanian boundary. Mem. Soc. Geol. It. 1969, 8, 453–763. [Google Scholar]
  95. Amodio-Morelli, L.; Bonardi, G.; Colonna, V.; Dietrich, D.; Giunta, G.; Ippolito, F.; Liguori, V.; Lorenzoni, P.; Paglionico, A.; Perrone, V.; et al. L’Arco Calabro-Peloritano nell’orogene Appenninico-Maghrebide. Mem. Soc. Geol. Ital. 1976, 17, 1–60. [Google Scholar]
  96. Bonardi, G.; De Capoa, P.; Fioretti, B.; Perrone, V. Some remarks on the Calabria-Peloritani arc and its relationship with the southern Apennines. Boll. Geofis. Teor. Appl. 1994, 36, 483–490. [Google Scholar]
  97. Scandone, P. Structure and evolution of the Calabrian Arc. Earth Evol. Sci. 1982, 3, 172–180. [Google Scholar]
  98. Alvarez, W. A former continuation of the Alps. Geol. Soc. Am. Bull. 1976, 87, 891–896. [Google Scholar] [CrossRef]
  99. Royden, L.; Patacca, E.; Scandone, P. Segmentation and configuration of subducted lithosphere in Italy: An important control on thrust-belt and foredeep-basin evolution. Geology 1987, 15, 714–717. [Google Scholar] [CrossRef]
  100. Malinverno, A.; Ryan, W.B.F. Extension in the Tyrrhenian Sea and shortening in the Apennines as result of arc migration driven by sinking of the lithosphere. Tectonics 1986, 5, 227–245. [Google Scholar] [CrossRef]
  101. Critelli, S.; Muto, F.; Tripodi, V.; Perri, F. Relationships between Lithospheric Flexure, Thrust Tectonics and Stratigraphic Sequences in Foreland Setting: The Southern Apennines Foreland Basin System, Italy. In Tectonics 2; Schattner, U., Ed.; Intech Open Access Publisher: Rijeka, Croatia, 2011; pp. 121–170. [Google Scholar] [CrossRef]
  102. Cuffaro, M.; Petricca, P.; Conti, A.; Palano, M.; Billi, A.; Bigi, S. Fault kinematic modeling along a widely deformed plate boundary in Southern Italy. Geophys. Res. Lett. 2024, 51, e2023GL106854. [Google Scholar] [CrossRef]
  103. Nicolosi, I.; Speranza, F.; Chiappini, M. Ultrafast oceanic spreading of the Marsili Basin, southern Tyrrhenian Sea: Evidence from magnetic anomaly analysis. Geology 2006, 34, 717–720. [Google Scholar] [CrossRef]
  104. Cocchi, L.; Caratori Tontini, F.; Muccini, F.; Marani, M.P.; Bortoluzzi, G.; Carmisciano, C. Chronology of the transition from a spreading ridge to an accretional seamount in the Marsili backarc basin (Tyrrhenian Sea). Terra Nova 2009, 21, 369–374. [Google Scholar] [CrossRef]
  105. van Dijk, J.P.; Scheepers, P.J.J. Neotectonic rotations in the Calabrian Arc; implications for a Pliocene-Recent geodynamic scenario for the Central Mediterranean. Earth Sci. Rev. 1995, 39, 207–246. [Google Scholar] [CrossRef]
  106. Martini, I.P.; Sagri, M.; Colella, A. Neogene—Quaternary basins of the inner Apennines and Calabrian arc. In Anatomy of an Orogen. The Apennines and Adjacent Mediterranean Basins; Vai, G.B., Martini, I.P., Eds.; Kluwer Academic Publishers: Dordrecht, The Netherlands, 2001; pp. 375–400. [Google Scholar] [CrossRef]
  107. Cifelli, F.; Mattei, M.; Rossetti, F. Tectonic evolution of arcuate mountain belts on top of a retreating subduction slab: The example of the Calabrian Arc. J. Geophys. Res. Solid Earth 2007, 112, 101. [Google Scholar] [CrossRef]
  108. Tansi, C.; Muto, F.; Critelli, S.; Iovine, G. Neogene-Quaternary strike-slip tectonics in the central Calabrian Arc (southern Italy). J. Geodyn. 2007, 43, 393–414. [Google Scholar] [CrossRef]
  109. Galli, P.; Bosi, V. Paleoseismology along the Cittanova fault: Implications for seismotectonics and earthquake recurrence in Calabria (southern Italy). J. Geophys. Res. Solid Earth 2002, 107, 2044. [Google Scholar] [CrossRef]
  110. Tansi, C.; Folino Gallo, M.; Muto, F.; Perrotta, P.; Russo, L.; Critelli, S. Seismotectonics and landslides of the Crati Graben (Calabrian Arc, Southern Italy). J. Maps 2016, 12 (Suppl. S1), 363–372. [Google Scholar] [CrossRef]
  111. Pirrotta, C.; Barberi, G.; Barreca, G.; Brighenti, F.; Carnemolla, F.; De Guidi, G.; Monaco, C.; Pepe, F.; Scarfì, L. Recent Activity and Kinematics of the Bounding Faults of the Catanzaro Trough (Central Calabria, Italy): New Morphotectonic, Geodetic and Seismological Data. Geosciences 2021, 11, 405. [Google Scholar] [CrossRef]
  112. Monaco, C.; Tortorici, L. Active faulting in the Calabrian arc and eastern Sicily. J. Geodyn. 2000, 29, 407–424. [Google Scholar] [CrossRef]
  113. Pirrotta, C.; Parrino, N.; Pepe, F.; Tansi, C.; Monaco, C. Geomorphological and Morphometric Analyses of the Catanzaro Trough (Central Calabrian Arc, Southern Italy): Seismotectonic Implications. Geosciences 2022, 12, 324. [Google Scholar] [CrossRef]
  114. Ghisetti, F. Evoluzione neotettonica dei principali sistemi di faglie della Calabria centrale. Boll. Soc. Geol. Ital. 1979, 98, 387–430. [Google Scholar]
  115. Langone, A.; Gueguen, E.; Prosser, G.; Caggianelli, A.; Rottura, A. The Curinga-Girifalco fault zone (northern Serre, Calabria) and its significance within the Alpine tectonic evolution of the western Mediterranean. J. Geodyn. 2006, 42, 140–158. [Google Scholar] [CrossRef]
  116. Rovida, A.; Locati, M.; Camassi, R.; Lolli, B.; Gasperini, P. The Italian earthquake catalogue CPTI15. Bull. Earthq. Eng. 2020, 18, 2953–2984. [Google Scholar] [CrossRef]
  117. Rovida, A.; Locati, M.; Camassi, R.; Lolli, B.; Gasperini, P.; Antonucci, A. Catalogo Parametrico dei Terremoti Italiani (CPTI15), versione 4.0. Istituto Nazionale di Geofisica e Vulcanologia (INGV). Available online: Rovida, A.; Locati, M.; Camassi, R.; Lolli, B.; Gasperini, P.; Antonucci, A. Catalogo Parametrico dei Terremoti Italiani (CPTI15), versione 4.0. Istituto Nazionale di Geofisica e Vulcanologia (INGV). Available online: https://emidius.mi.ingv.it/CPTI15-DBMI15_v3.0 (accessed on 20 July 2025).
  118. Federico, S.; Pasqualoni, L.; De Leo, L.; Bellecci, C. A study of the breeze circulation during summer and fall 2008 in Calabria, Italy. Atmos. Res. 2010, 97, 1–13. [Google Scholar] [CrossRef]
  119. Federico, S.; Pasqualoni, L.; Sempreviva, A.M.; De Leo, L.; Avolio, E.; Calidonna, C.R.; Bellecci, C. The seasonal characteristics of the breeze circulation at a coastal Mediterranean site in South Italy. Adv. Sci. Res. 2010, 4, 47–56. [Google Scholar] [CrossRef]
  120. Calidonna, C.R.; Dutta, A.; D’Amico, F.; Malacaria, L.; Sinopoli, S.; De Benedetto, G.; Gullì, D.; Ammoscato, I.; De Pino, M.; Lo Feudo, T. Ten-Year Analysis of Mediterranean Coastal Wind Profiles Using Remote Sensing and In Situ Measurements. Wind 2025, 5, 9. [Google Scholar] [CrossRef]
  121. Topographic Map. https://en-us.topographic-map.com (accessed on 16 July 2025).
  122. TessaDEM - Near-global 30-meter Digital Elevation Model (DEM). https://tessadem.com (accessed on 16 July 2025).
  123. Yamazaki, D.; Ikeshima, D.; Tawatari, R.; Yamaguchi, T.; O’Loughlin, F.; Neal, J.C.; Sampson, C.C.; Kanae, S.; Bates, P.D. A high-accuracy map of global terrain elevations. Geophys. Res. Lett. 2017, 44, 5844–5853. [Google Scholar] [CrossRef]
  124. D’Amico, F.; Ammoscato, I.; Gullì, D.; Avolio, E.; Lo Feudo, T.; De Pino, M.; Cristofanelli, P.; Malacaria, L.; Parise, D.; Sinopoli, S.; et al. Integrated Analysis of Methane Cycles and Trends at the WMO/GAW Station of Lamezia Terme (Calabria, Southern Italy). Atmosphere 2024, 15, 946. [Google Scholar] [CrossRef]
  125. D’Amico, F.; Gullì, D.; Lo Feudo, T.; Ammoscato, I.; Avolio, E.; De Pino, M.; Cristofanelli, P.; Busetto, M.; Malacaria, L.; Parise, D.; et al. Cyclic and Multi-Year Characterization of Surface Ozone at the WMO/GAW Coastal Station of Lamezia Terme (Calabria, Southern Italy): Implications for Local Environment, Cultural Heritage, and Human Health. Environments 2024, 11, 227. [Google Scholar] [CrossRef]
  126. D’Amico, F.; De Benedetto, G.; Malacaria, L.; Sinopoli, S.; Dutta, A.; Lo Feudo, T.; Gullì, D.; Ammoscato, I.; De Pino, M.; Calidonna, C.R. Multimethodological Approach for the Evaluation of Tropospheric Ozone’s Regional Photochemical Pollution at the WMO/GAW Station of Lamezia Terme, Italy. AppliedChem 2025, 5, 10. [Google Scholar] [CrossRef]
  127. D’Amico, F.; Lo Feudo, T.; Gullì, D.; Ammoscato, I.; De Pino, M.; Malacaria, L.; Sinopoli, S.; De Benedetto, G.; Calidonna, C.R. Integrated Surface and Tropospheric Column Analysis of Sulfur Dioxide Variability at the Lamezia Terme WMO/GAW Regional Station in Calabria, Southern Italy. Environments 2025, 12, 27. [Google Scholar] [CrossRef]
  128. Italian Republic. Decree of the President of the Council of Ministers, 9 March 2020. GU Serie Generale n. 62. Available online: https://www.gazzettaufficiale.it/eli/id/2020/03/09/20A01558/sg (accessed on 13 July 2025).
  129. Italian Republic. Decree of the President of the Council of Ministers, 18 May 2020. GU Serie Generale n. 127. Available online: https://www.gazzettaufficiale.it/eli/id/2020/05/18/20A02727/sg (accessed on 13 July 2025).
  130. Sander, S.P.; Golden, D.M.; Kurylo, M.J.; Moortgat, G.K.; Wine, P.H.; Ravishankara, A.R.; Kolb, C.E.; Molina, M.J.; Finlayson-Pitts, B.J.; Orkin, V.L. Chemical Kinetics and Photochemical Data for Use in Atmospheric Studies Evaluation Number 15; Jet Propulsion Laboratory, National Aeronautics and Space Administration: Pasadena, CA, USA, 2006.
  131. Malacaria, L.; Sinopoli, S.; Lo Feudo, T.; De Benedetto, G.; D’Amico, F.; Ammoscato, I.; Cristofanelli, P.; De Pino, M.; Gullì, D.; Calidonna, C.R. Methodology for selecting near-surface CH4, CO, and CO2 observations reflecting atmospheric background conditions at the WMO/GAW station in Lamezia Terme, Italy. Atmos. Pollut. Res. 2025, 16, 102515. [Google Scholar] [CrossRef]
  132. Wouters, D.A.J.; Wagenaar, J.W. Verification of the ZephIR 300 LiDAR at the ECN LiDAR Calibration Facility for the Offshore Europlatform Measurement Campaign, ECN-M-16-029. Available online: https://resolver.tno.nl/uuid:0e900067-df59-4c76-8f4a-469754ab4d3d (accessed on 25 July 2025).
  133. Knoop, S.; Bosveld, F.C.; de Haij, M.J.; Apituley, A. A 2-year intercomparison of continuous-wave focusing wind lidar and tall mast wind measurements at Cabauw. Atmos. Meas. Tech. 2021, 14, 2219–2235. [Google Scholar] [CrossRef]
  134. Wickham, H.; François, R.; Henry, L.; Müller, K.; Vaughan, D. dplyr: A Grammar of Data Manipulation. R package version 1.1.4, 2025. https://dplyr.tidyverse.org (accessed on 10 July 2025).
  135. Wickham, H. ggplot2: Elegant graphics for data analysis. Springer-Verlag New York, 2016. ISBN: 978-3-319-24277-4.
  136. Wickham, H.; Averick, M.; Bryan, J.; Chang, W.; McGowan, L.D.; François, R.; Grolemund, G.; Hayes, A.; Henry, L.; Hester, J.; et al. Welcome to the tidyverse. J. Open Source Softw. 2019, 4, 1686. [Google Scholar] [CrossRef]
  137. Shapiro, S.S.; Wilk, M.B. An Analysis of Variance Test for Normality (Complete Samples). Biometrika 1965, 52, 591–611. [Google Scholar] [CrossRef]
  138. Jarque, C.M.; Bera, A.K. A Test for Normality of Observations and Regression Residuals. Int. Stat. Rev. 1987, 55, 163–172. [Google Scholar] [CrossRef]
  139. Kruskal, W.H.; Wallis, W.A. Use of ranks in one-criterion variance analysis. J. Am. Stat. Assoc. 1952, 47, 583–621. [Google Scholar] [CrossRef]
  140. Mann, H.B. Non-parametric tests against trend. Econometrica 1945, 13, 163–171. [Google Scholar] [CrossRef]
  141. Kendall, M.G. Rank Correlation Methods, 4th edition. Charles Griffin, 1975, London.
  142. Bronaugh, D.; Schoeneberg, A. zyp: Zhang + Yue-Pilon Trends Package, 2023. [CrossRef]
  143. Carslaw, D.C.; Ropkins, K. openair --- an R package for air quality data analysis. Environ. Model. Softw. 2012, 27-28, 52–61. [Google Scholar] [CrossRef]
  144. Friendly, M.; Monette, G.; Fox, J. Elliptical Insights: Understanding Statistical Methods through Elliptical Geometry. Statist. Sci. 2013, 28, 1–39. [Google Scholar] [CrossRef]
  145. D’Amico, F.; De Benedetto, G.; Malacaria, L.; Sinopoli, S.; Calidonna, C.R.; Gullì, D.; Ammoscato, I.; Lo Feudo, T. Tropospheric and Surface Measurements of Combustion Tracers During the 2021 Mediterranean Wildfire Crisis: Insights from the WMO/GAW Site of Lamezia Terme in Calabria, Southern Italy. Gases 2025, 5, 5. [Google Scholar] [CrossRef]
  146. D’Amico, F.; Ammoscato, I.; Gullì, D.; Avolio, E.; Lo Feudo, T.; De Pino, M.; Cristofanelli, P.; Malacaria, L.; Parise, D.; Sinopoli, S.; et al. Anthropic-Induced Variability of Greenhouse Gasses and Aerosols at the WMO/GAW Coastal Site of Lamezia Terme (Calabria, Southern Italy): Towards a New Method to Assess the Weekly Distribution of Gathered Data. Sustainability 2024, 16, 8175. [Google Scholar] [CrossRef]
  147. Patil, I. Visualizations with statistical details: The 'ggstatsplot' approach. J. Open Source Softw. 2021, 6, 3167. [Google Scholar] [CrossRef]
  148. Eom, T.; Kim, T.; Yoo, S. Effects of Nitrogen Fertilizer Application on Growth, Vegetation Indices, and Ammonia Volatilization in Korean Radish (Raphanus sativus L.). Nitrogen 2025, 6, 42. [Google Scholar] [CrossRef]
  149. Malyan, S.K.; Maithani, D.; Kumar, V. Nitrous Oxide Production and Mitigation Through Nitrification Inhibitors in Agricultural Soils: A Mechanistic Understanding and Comprehensive Evaluation of Influencing Factors. Nitrogen 2025, 6, 14. [Google Scholar] [CrossRef]
  150. Zheng, J.; Li, Z.; Sa, Q.; Wang, Y. Effects of Biochar, Biogas Slurry, and Dicyandiamide Application on N2O Emissions from Soil in Tomato Production Under Protected Cultivation. Nitrogen 2025, 6, 17. [Google Scholar] [CrossRef]
  151. D’Amico, F.; Calidonna, C.R.; Ammoscato, I.; Gullì, D.; Malacaria, L.; Sinopoli, S.; De Benedetto, G.; Lo Feudo, T. Peplospheric Influences on Local Greenhouse Gas and Aerosol Variability at the Lamezia Terme WMO/GAW Regional Station in Calabria, Southern Italy: A Multiparameter Investigation. Sustainability 2024, 16, 10175. [Google Scholar] [CrossRef]
Figure 1. (A): Map of the central Mediterranean area with a focus on LMT’s location in the region of Calabria, Italy. (B): Regional scale Digital Elevation Model (DEM) [121,122,123] showing the main mountain ranges of the Calabria-Peloritani Arc, and the Catanzaro Isthmus where LMT is located. (C): Local map of the western Catanzaro Isthmus, highlighting LMT’s location, the main sources of anthropogenic emissions in the area, and urban/topographic features. Farms are located over a wide area. The “Highways” label refers to a point where both the A2 Mediterranean Highway and the SS18 state highway intersect the northeastern wind corridor measured at LMT.
Preprints 172920 g001
Figure 3. Daily cycle of NO, NO2, and NOx combined at LMT. The hours are UTC.
Preprints 172920 g003
Figure 4. Daily cycle of NO, NO2, and NOx combined at LMT, aggregated on a seasonal basis. Winter (A), Spring (B), Summer (C), Fall (D). The hours are UTC.
Preprints 172920 g004aPreprints 172920 g004b
Figure 5. Data ellipses showing the seasonal variability of NOx combined at LMT, with near-surface wind speed measured by a Vaisala WXT520 weather station. Winter (A), Spring (B), Summer (C), Fall (D).
Preprints 172920 g005aPreprints 172920 g005b
Figure 6. Seasonal pollution roses showing NOx concentrations differentiated by wind direction (each bar is set on angles of 22.5°). Winter (A), Spring (B), Summer (C), Fall (D).
Preprints 172920 g006aPreprints 172920 g006b
Figure 7. Seasonal variability of NO, NO2, and NOx combined at LMT, with the 20 m AGL wind speed measured by a ZephIR 300 lidar. Winter (A), Spring (B), Summer (C), Fall (D).
Preprints 172920 g007aPreprints 172920 g007b
Figure 8. Data ellipses showing the distribution of joint WXT520 and ZephIR 300 (20 m AGL) measurements falling into specific wind corridors, with respect to wind speeds. The red line indicates the bisector. Winter (A), Spring (B), Summer (C), Fall (D).
Preprints 172920 g008
Figure 9. Analysis of the differences between weekday (WD) and weekend (WE) concentrations, based on wind sector. All wind directions (A), northeastern-continental corridor (B), western-seaside corridor (C).
Preprints 172920 g009
Figure 10. Monthly concentrations of NO (A), NO2 (B), and NOx (C) at LMT, differentiated by wind sector.
Preprints 172920 g010
Figure 11. Monthly concentrations of NO (A), NO2 (B), and NOx (C) at LMT for the entire observation period (2015-2023), differentiated by wind sector.
Preprints 172920 g011
Table 2. Comparison of wind corridors attributed to valid WXT520 and ZephIR 300 (20 m) measurements. MTO/LID refers to the percentage of WXT520 measurements, per sector, which fall under the corresponding category of wind lidar measurements. LID/MTO provides the opposite figure.
Sector MTO/LID LID/MTO
Northeast 78.44% 70.63%
West 76.01% 74.46%
Other 52.76% 61.25%
Table 3. Results of Kruskal-Wallis tests on the statistical significance of differences between WD and WE concentrations, divided by wind sector and instrument.
Parameter Sector (WXT520) Sector (ZephIR)
All Northeast West All Northeast West
NO < 0.05 < 0.05 < 0.05 < 0.05 < 0.05 < 0.05
NO2 < 0.05 < 0.05 < 0.05 < 0.05 < 0.05 < 0.05
NOx < 0.05 < 0.05 < 0.05 < 0.05 < 0.05 < 0.05
Table 4. Results of Kruskal-Wallis tests on the statistical significance of differences between WD and WE concentrations, divided by wind sector and instrument, and further categorized on a seasonal basis.
Season Parameter Sector (WXT520) Sector (ZephIR)
All Northeast West All Northeast West

Winter
NO < 0.05 < 0.05 < 0.05 < 0.05 < 0.05 < 0.05
NO2 < 0.05 < 0.05 < 0.05 < 0.05 < 0.05 < 0.05
NOx < 0.05 < 0.05 < 0.05 < 0.05 < 0.05 < 0.05

Spring
NO < 0.05 < 0.05 < 0.05 < 0.05 < 0.05 < 0.05
NO2 < 0.05 < 0.05 < 0.05 < 0.05 < 0.05 < 0.05
NOx < 0.05 < 0.05 < 0.05 < 0.05 < 0.05 < 0.05

Summer
NO < 0.05 < 0.05 < 0.05 < 0.05 < 0.05 < 0.05
NO2 < 0.05 < 0.05 < 0.05 < 0.05 < 0.05 < 0.05
NOx < 0.05 < 0.05 < 0.05 < 0.05 < 0.05 < 0.05

Fall
NO < 0.05 < 0.05 < 0.05 < 0.05 < 0.05 < 0.05
NO2 < 0.05 < 0.05 < 0.05 < 0.05 < 0.05 < 0.05
NOx < 0.05 < 0.05 < 0.05 < 0.05 < 0.05 < 0.05
Table 5. Results of the Mann-Kendall (MK) test and their respective p-values, based on monthly aggregated data at LMT from 2015 to 2023 and categorized by wind sectors.
Parameter Wind Sectors
All Northeast West
MK p MK p MK p
NO -0.126 0.05(7) -0.102 0.12 -0.202 < 0.05
NO2 -0.12 0.06 -0.148 < 0.05 -0.117 0.07
NOx -0.131 < 0.05 -0.161 < 0.05 -0.143 < 0.05
Disclaimer/Publisher’s Note: The statements, opinions and data contained in all publications are solely those of the individual author(s) and contributor(s) and not of MDPI and/or the editor(s). MDPI and/or the editor(s) disclaim responsibility for any injury to people or property resulting from any ideas, methods, instructions or products referred to in the content.
Copyright: This open access article is published under a Creative Commons CC BY 4.0 license, which permit the free download, distribution, and reuse, provided that the author and preprint are cited in any reuse.
Prerpints.org logo

Preprints.org is a free preprint server supported by MDPI in Basel, Switzerland.

Subscribe

Disclaimer

Terms of Use

Privacy Policy

Privacy Settings

© 2025 MDPI (Basel, Switzerland) unless otherwise stated