
Submitted:
18 August 2025
Posted:
19 August 2025
You are already at the latest version
Abstract
Second-life electric vehicle batteries (SLBs) represent a valuable asset for enhancing grid flexibility and advancing circular economy objectives in the power sector. This study presents a trigger-based PDCA (Plan–Do–Check–Act) framework for the sustainable grid integration of SLBs, enabling adaptive operational control across diverse applica-tion scenarios. The proposed methodology combines lifecycle KPI monitoring, degra-dation and performance tracking, and economic feasibility assessment with trig-ger-driven dispatch strategies that respond dynamically to fluctuations in demand and renewable generation. Scenario-based simulations assess the framework’s adaptability and scalability in systems with high renewable penetration and variable load profiles. Results indicate that the framework can reduce degradation rates, extend SLB service life, improve economic viability through optimized dispatch, and support grid stability via responsive control. By integrating KPI-based monitoring with trigger-based opera-tional logic, the approach enables structured, replicable, and sustainable management of second-life batteries, maximizing asset value while minimizing environmental impacts.
Keywords:
second-life batteries
; PDCA
; KPI monitoring
; trigger-based dispatch
; electric vehicles
; grid flexibility
; energy systems
; sustainability
1. Introduction
The global energy transition is gaining momentum, driven by the dual imperatives of mitigating climate change and achieving a sustainable, low-carbon future [1,2,3]. A core component of this transition is the growing reliance on renewable energy sources (RES), such as solar and wind [3,4,5]. These sources offer clear environmental advantages, but their inherent variability poses new challenges for balancing energy generation and consumption [6,7]. This increases the demand for flexible, efficient, and scalable energy storage systems capable of stabilizing the grid and ensuring energy security [8].
At the same time, the transportation sector is undergoing a major transformation towards electrification. Supported by climate policies, consumer incentives, and falling battery costs, electric vehicle (EV) adoption is accelerating worldwide [9]. Global sales of EVs surpassed 10 million in 2023, and projections indicate a tenfold increase in the next decade [10]. As the EV fleet grows, so does the number of retired lithium-ion batteries (LIBs). These batteries typically retain 60-80% of their initial capacity after their first life in vehicles and can be repurposed in stationary applications such as energy storage systems, backup power, and renewable energy integration [11].
The reuse of automotive batteries in second-life applications aligns with the principles of the circular economy. It reduces the need for new raw materials such as lithium, cobalt, and nickel, decreases waste, and extends the value chain of battery production. Numerous studies project that by 2030, approximately 3.4 million EV batteries globally will be retired from transportation use, representing nearly 950 GWh of technically accessible second-life capacity [10,11].
In Ukraine, the dominance of imported EVs—often retired at 60–80% of their initial capacity—creates both a challenge and an opportunity for developing a circular battery management system [12,13,14,15,16,17]. The National Transport Strategy outlines the rapid growth of the EV market while underscoring the absence of systematic end-of-life management pathways for used batteries [12]. Recent studies confirm that second-life battery deployment in Ukraine is technically viable and economically attractive for grid support, V2G services, and flexible backup applications, providing a pathway to enhance system resilience [13,14,15,16]. Moreover, the integration of SLBs within the energy system contributes to decarbonization and circularity objectives under the country's evolving energy landscape [17].
However, integrating second-life batteries (SLBs) into energy systems is not straightforward [18]. These assets exhibit diverse degradation histories, chemical compositions, battery management system configurations, and residual performance characteristics [18,19]. SLBs behave differently under varying load profiles, temperature conditions, and grid dynamics. Some can operate reliably in shallow-cycling modes for up to 10-15 years, while others may degrade rapidly under high-intensity use [17,18,19]. Moreover, the lack of standardization, regulatory clarity, and quality assurance mechanisms further complicates their deployment [18,19].
To ensure that SLBs fulfill their potential as flexible, cost-effective, and sustainable energy assets, a new management paradigm is needed—one that embraces uncertainty, adapts to real-time feedback, and enables informed decisions throughout the asset lifecycle. This paper proposes the Plan-Do-Check-Act (PDCA) cycle as a conceptual and operational framework for SLB integration. Originally developed for continuous process improvement, PDCA offers a robust model for dynamic performance monitoring, degradation tracking, and adaptive planning. When coupled with key performance indicators (KPIs), cost-effectiveness metrics (such as LCOS), and event-based trigger logic, PDCA can support both strategic oversight and day-to-day operational control of battery-based energy systems.
Building on this foundation, the specific objectives of this study are:
- to develop a PDCA-based operational management framework for SLB deployment;
- to integrate technical, economic, and environmental KPIs into a trigger-based control loop;
- to test the applicability of the framework through scenario-based simulation;
- to identify key limitations and implementation challenges.
To operationalize the integration of SLBs within circular and flexible energy systems, this study employs a structured research design that connects KPI monitoring with the PDCA cycle and scenario-based analysis. This structured methodology enables systematic evaluation and adaptive management of SLBs across technical, economic, and environmental dimensions while maintaining alignment with circular economy goals. The following flowchart (Figure 1) outlines the stages of the research approach applied in this study.
The framework integrates KPI monitoring, PDCA cycles, and scenario analysis to support adaptive and circular SLB deployment strategies.
This study focuses on stationary SLB applications in mid-voltage distribution networks, using simulation data for typical renewable variability and load curves. The proposed framework is tailored to lithium-ion EV batteries with partial degradation and targets mid-term planning horizons of approximately 5 to 10 years. While the methodology is generalizable, its assumptions and input parameters reflect the operational conditions of decentralized grid environments with variable generation.
2. Literature Review
To contextualize the scientific background of SLB integration, a targeted bibliometric analysis was conducted using Scopus-indexed publications from 2010 to 2024. The goal was to identify prevailing trends, research dynamics, and thematic clusters within the SLB knowledge domain. The analysis was performed using VOSviewer software (v 1.6.19), applying keyword co-occurrence mapping and temporal evolution tracking. The results are synthesized in Figure 2 and Figure 3, which captures complementary dimensions of this research landscape.
Figure 2a shows the growth trajectory of SLB-related publications over the past decade. The number of peer-reviewed articles has increased from fewer than 30 per year before 2015 to over 400 in 2023–2024, indicating a rapid rise in scientific and technological interest. This reflects not only the maturation of electric vehicle markets but also an intensified global focus on battery reuse, circular economy models, and sustainable storage strategies. Figure 2b tracks the temporal frequency of key research terms—specifically "EV batteries," "SOH degradation," and "modeling & forecasting." While early publications focused primarily on electrochemical design and basic reuse feasibility, recent years have seen a surge in degradation-oriented studies and the development of predictive models for SLB performance. This shift underscores the growing need for lifecycle-aware and data-driven integration approaches.
Figure 3, in turn, presents a co-occurrence network of keywords based on VOSviewer clustering. Several dense term clusters emerge, notably those centered around "secondary batteries," "electric vehicles," "grid integration," and "hybrid systems." The presence of terms such as "uncertainty," "state of health," and "optimization algorithm" suggests a clear shift toward dynamic, performance-sensitive control models.
And finally, Figure 4 visualizes the temporal evolution of keyword usage from 2019 to 2024. Early keywords such as "reuse" and "battery management" are now joined by emerging terms like "second life batteries," "degradation modeling," and "adaptive control." Notably, "KPI," "trigger mechanism," and "circular economy" appear with increasing frequency since 2021, indicating growing recognition of the importance of structured evaluation and operational responsiveness.
These findings confirm that SLB research is rapidly evolving from conceptual feasibility and engineering design toward complex, multidisciplinary strategies that encompass reliability, cost-effectiveness, policy alignment, and lifecycle optimization. However, the literature still lacks integrated frameworks that combine performance monitoring, feedback-based control, and economic justification within a unified management model. This gap forms the basis for the PDCA-based approach proposed in this study.
Research on SLBs has rapidly expanded over the past decade, covering a wide range of topics from degradation modeling and lifecycle extension to techno-economic assessment and integration into stationary energy systems [20,21,22]. Early studies focused on the technical feasibility of repurposing EV batteries for less demanding applications, demonstrating that such reuse can delay battery disposal while reducing storage costs [23,24,25]. Subsequent work has addressed performance characterization, with several authors proposing classification schemes based on state-of-health, electrochemical behavior, and thermal sensitivity, providing systematic criteria for assessing repurposing potential [26,27,28,29].
A parallel stream of research has developed cost metrics tailored to SLB deployments. While LCOS remains the most widely used economic indicator for assessing economic viability, recent work emphasizes the importance of incorporating broader evaluation parameters, including lifecycle emissions, reuse efficiency, and circular economy perspectives [30,31,32,33]. Within this context, new integrated metrics have been proposed, such as the Integral Degradation Index (IDI), aimed at capturing technical and contextual constraints that affect the economic rationality of reuse scenarios under uncertainty [34].
Another line of inquiry has focused on decision-making frameworks and control strategies for SLB deployment. While most existing work emphasizes predictive diagnostics, BMS optimization, and state estimation to extend SLB usability [35,36,37], there is growing recognition of the need for structured operational models capable of adapting to stochastic degradation and variable load profiles in real-world applications [38,39,40,41]. In this context, the use of quality management principles—particularly the PDCA cycle—has been proposed as a framework for lifecycle-oriented SLB integration into energy systems, aligning reuse pathways with sustainability and resilience goals [42,43,44].
While recent studies have emphasized the role of KPIs in assessing the readiness and effectiveness of circular business models for SLB deployment [45,46,47], two key gaps remain in the literature. First, there is a lack of systematic approaches that combine performance indicators, cost metrics, and adaptive logic into a unified operational management framework for grid integration of SLB systems [48,49]. Second, there is limited guidance on how to practically implement PDCA-based management in systems characterized by high variability and incomplete information. In particular, the integration of KPI monitoring into adaptive PDCA cycles and trigger-based dispatch strategies for real-time grid support and lifecycle management of SLB systems has not yet been sufficiently explored [33]. Recent contributions have examined the use of trigger-based control and KPI thresholds to structure decision-making loops for SLB applications, but these approaches remain underdeveloped and context-dependent, requiring further scenario-based validation and demonstration [50,51,52,53]. In the context of Ukraine, regulatory frameworks for second-life battery reuse remain underdeveloped, with no standardized pathways for testing, certification, or integration into national grid strategies [13,14,15,16,17,18,19].
High renewable energy penetration, especially from intermittent sources such as solar and wind, has introduced new challenges to grid operation, including congestion and localized imbalances. Recent studies emphasize the importance of deploying flexible energy storage systems to mitigate grid congestion, improve load balancing, and increase hosting capacity for renewables [21,22], at the same time, some of them [54,55,56] demonstrates how spatially distributed battery storage can reduce congestion in transmission networks, supporting more stable and efficient system operation.
While large-scale optimization models such as DIgSILENT PowerFactory [57], TIMES [58], or ENERTILE [59] offer valuable insights for long-term system planning, they typically lack the granularity required for real-time operational control. These tools primarily serve scenario-based infrastructure modeling, but do not account for degradation-aware dispatch or KPI-triggered lifecycle decisions. This creates a methodological gap that the proposed PDCA-based approach addresses through its integration of operational indicators, adaptive control logic, and scenario-linked decision-making.
The present study proposes a structured PDCA-based framework that incorporates KPI monitoring, cost-efficiency thresholds (LCOS, IDI), and event-based triggers to enhance the practical deployment and sustainability of SLB in modern grid applications.
3. PDCA Cycle as a Planning Tool
The Plan-Do-Check-Act (PDCA) cycle, originally developed by Walter A. Shewhart and later promoted by W. Edwards Deming, has evolved into a universal framework for continuous process improvement across engineering, quality management, and adaptive systems [60,61,62,63]. In the context of SLB integration, the PDCA cycle offers a valuable approach for managing uncertainty, degradation variability, and operational dynamics across the entire battery lifecycle [64,65,66,67].
- (a)
- PDCA Logic for SLB Deployment
Second-life EV batteries are characterized by non-uniform performance, unpredictable degradation rates, and heterogeneous usage histories, requiring a flexible yet structured decision-making process that can respond dynamically to changes in technical condition, economic context, and system demands [66,67]. The PDCA methodology, with its iterative feedback mechanism, is uniquely suited for this task, enabling a shift from static planning toward an adaptive, data-driven operational philosophy [68,69].
To formalize this approach, a conceptual model of SLB deployment based on PDCA logic is proposed (Figure 5). Each PDCA cycle represents a full loop of planning, operation, monitoring, and adjustment under specific use conditions [60,68]. When performance indicators (such as KPI thresholds or degradation metrics) indicate deviation or risk, reconfiguration is triggered, leading to updated operational baselines and the initiation of a new management cycle [69,70]. This logic enables continuous system-level adaptation and progressive optimization of SLB integration strategies [71].
The diagram shows how each SLB deployment cycle leads to system-level adaptation through performance-triggered reconfiguration and updated operational baselines. This interpretation was developed by the author as an adaptation of PDCA for the context of SLB lifecycle control.
- (b)
- Operationalization of the PDCA Cycle for SLB Integration
Translating the PDCA concept into a practical management tool for second-life batteries requires aligning each phase with concrete decision-making tasks and observable system variables, capturing system uncertainty, enabling real-time feedback, and supporting long-term optimization [72]. Unlike traditional applications of PDCA in manufacturing, where conditions are often stable, SLB integration is dynamic and influenced by degradation variability and evolving grid requirements [73].
The Plan phase serves as the strategic anchor, involving use-case selection, degradation forecasting, KPI target setting, and defining the control environment [74]. The Do phase functions as an experimental implementation stage under monitored conditions, generating empirical data on degradation, thermal behavior, and operational dynamics [33,60]. The Check phase systematically compares observed performance against forecasted values and KPIs, identifying deviations in key indicators such as RTE and LCOS as triggers for recalibration [73]. The Act phase represents adaptive learning, involving operational adjustments, KPI updates, and SLB reassignment while initiating new planning cycles with refined insights [61,71]. Table 1 summarizes this phase-wise breakdown, linking each quadrant of the PDCA cycle to SLB management actions such as device selection, control tuning, diagnostics, and redeployment logic [69,70,71,72,73]. The outputs of one phase serve as structured inputs to the next, reinforcing the iterative logic of the framework [33,70].
By structuring SLB deployment in this way, the PDCA framework enables more than operational control; it supports an evolving integration strategy responsive to real-world conditions. The result is not a static system, but a living one—capable of optimizing itself over time in alignment with both technical and economic performance targets.
- (c)
- PDCA as a Lifecycle Management Strategy for SLB Deployment
While originally designed for quality assurance, the PDCA cycle evolves in the SLB context into a comprehensive lifecycle-oriented governance strategy, enabling ongoing adaptation to performance deviations, degradation signals, and external constraints [60,61,62,63]. When implemented within EMS, BMS, or SCADA systems, the PDCA approach supports proactive control and continuous recalibration, essential for SLBs exposed to price volatility, load fluctuations, and variable renewables [64,65,66,67,68]. Table 2 illustrates how the four PDCA phases map to management actions, monitoring priorities, and decision triggers within an SLB context. Each phase aligns with a performance feedback stream that signals when and how the system should evolve, enabling an evidence-based pathway for SLB optimization.
In this sense, the PDCA methodology becomes not only a planning or diagnostic tool but a lifecycle management philosophy: a system-level discipline that continuously redefines what optimal performance means under uncertainty and system evolution [69,70,71,72].
To complement the process-level description, Figure 6 summarizes the functional logic of each PDCA phase for SLB integration, aligning operational activities with key technical and economic indicators such as RTE, LCOS, DoD, and degradation metrics [74,75,76,77,78,79,80,81,82]. This enables a modular yet dynamic approach to SLB lifecycle management, transforming SLB integration from static planning into a continuous loop of adaptation to maximize technical performance and ROI across the battery's second life.
Each quadrant in Figure 4 corresponds to a distinct operational focus—strategic framing (Plan), controlled implementation (Do), performance evaluation (Check), and adaptive optimization (Act)—while aligning typical activities and monitoring tasks with key technical and economic indicators such as round-trip efficiency, LCOS, depth of discharge, and degradation trends. This structure enables a modular yet dynamic approach to SLB lifecycle management, where learning from each phase directly feeds into the next iteration. In this way, the PDCA cycle allows SLB integration to move beyond static project planning and into a continuous loop of adaptation, maximizing both technical performance and return on investment across the battery's second life.
A key challenge during framework formalization was the limited availability of standardized empirical degradation profiles for second-life batteries. Further studies should integrate data from operational pilot projects to enhance model validation and representativeness.
4. Key Performance Indicators for SLB Management Within the PDCA Framework
The effective integration of SLBs into grid applications requires a structured approach to monitoring and evaluation throughout their lifecycle. KPIs act as measurable metrics that translate complex technical, economic, and environmental aspects into actionable insights, supporting adaptive management under the PDCA framework [75,76].
While several studies have proposed KPIs for first-life batteries, there is a research gap in systematically applying KPIs to second-life batteries within operational management frameworks, particularly under circular economy and resilience objectives. This section aims to address this gap by presenting a comprehensive KPI catalog aligned with the PDCA cycle, allowing operators to track, analyze, and optimize SLB deployments dynamically. The KPIs were selected and structured based on analytical review and adapted by the author to reflect second-life battery characteristics.
- (a)
- Scenario Definitions and Assumptions
To illustrate the implementation of the proposed PDCA-based framework, three representative deployment scenarios for second-life batteries (SLBs) are defined. These scenarios reflect distinct operational roles within power systems and require tailored KPI configurations and trigger conditions to support adaptive lifecycle management:
Scenario 1: HV Backup. SLBs are deployed as reserve power sources at medium-voltage substations, providing support during outages and unplanned events. Performance is characterized by infrequent deep discharges with long idle periods. The primary KPIs include State of Health (SoH) and Round-Trip Efficiency (RTE). Planning targets are SoH > 70% and RTE > 85%. Real-time monitoring ensures that, when SoH falls below 65% (trigger threshold), the SLB is reallocated to a less demanding application to extend residual value and defer disposal.
Scenario 2: RES Smoothing. In this case, SLBs are integrated to mitigate fluctuations in photovoltaic (PV) and wind power output, absorbing surplus generation and smoothing short-term variability. Operational patterns involve moderate cycling with medium depth-of-discharge (DoD). Key KPIs include DoD range (target 60–70%) and the Integral Degradation Index (IDI). When the IDI exceeds 0.85 (trigger threshold), the battery is reassigned to low-cycling roles such as frequency regulation or strategic reserve to preserve functionality and mitigate further degradation.
Scenario 3: Frequency Regulation. Here, SLBs provide rapid-response ancillary services, balancing short-term frequency deviations through intensive cycling. This scenario places greater stress on battery lifespan, requiring close tracking of cost-effectiveness. Economic KPIs, such as Levelized Cost of Storage (LCOS) and Return on Investment (ROI), guide performance evaluation. A dynamic LCOS threshold (180–200 USD/MWh) serves as a trigger for re-evaluation. If exceeded, the SLB is shifted to services with lower cycling intensity or retired if no viable use remains.
All scenarios are designed for mid-voltage grid applications and assume partial battery degradation at the time of integration. The planning horizon for each use case spans 5–10 years. Load profiles are derived from historical public data and synthetic reconstructions based on Ukrainian modeling studies [77,78,79,80,81,82,83,84,85], while renewable generation variability is modeled using international benchmarks, including IEA-PVPS. The trigger-based mechanism in each scenario supports responsive control aligned with PDCA phases, maximizing the operational utility and sustainability of second-life battery systems.
- (b)
- Technical KPIs for SLB Integration
Selection of technical performance indicators is critical for ensuring the operational readiness and longevity of second-life batteries (SLBs) within energy systems [86,87,88,89,90]. Metrics such as RTE, DoD, SoH, and IDI provide quantifiable insights into the core functional capabilities of SLBs under dynamic operational conditions [91,92,93,94]. These KPIs help in evaluating conversion efficiency, usable capacity, degradation progression, and charge/discharge behavior, aligning operational control with grid support requirements and degradation mitigation strategies [95,96,97,98].
SOH is a key indicator that characterizes the current performance of a battery relative to its initial condition [28,29,30]. It is commonly evaluated from two main perspectives: the remaining capacity and the internal resistance of the battery.
When calculated based on remaining capacity, SOH is expressed as [28]:
When evaluated based on internal resistance, SOH is defined as [27]:
In these formulas, Ccurrent and Cinitial represent the battery’s current and nominal capacity as specified by the manufacturer. Rmax, Rcurrent, and Rinitial correspond to the internal resistance at the beginning of life, current state, and end-of-life threshold, respectively.
To capture the complex degradation dynamics of second-life batteries (SLBs), including both deterministic and stochastic aging effects, this study employs the Integral Degradation Index (IDI) developed by the author in previous work [34]. This composite indicator accounts for capacity loss from calendar aging, cyclic aging, and random operational variability such as temperature fluctuations, variable DoD, SOC swings, and inconsistent C-rate conditions. The IDI formula integrates the deterministic degradation models with a stochastic uncertainty term:
where ) – loss of capacity due to calendar aging; – reaction rate constant; – activation energy; R – universal gas constant; T is the temperature; t is the time; f(SOC) is a function that describes the dependence on the SOC; – loss of capacity due to cyclic aging; – reaction rate constant for cyclic aging; DOD – depth of discharge; Crate – charging/discharging speed; α and β – model parameters; – the number of charge/discharge cycle; – total loss of battery capacity, taking into account the factors of calendar and cyclic aging; (t) – taking into account the uncertainty of the state/behaviour of secondary batteries under operating conditions; T, are random variables, respectively, temperature, state of charge, depth of discharge, charge/discharge rate with a certain distribution (e.g., normal), derivatives represent the sensitivity of the battery capacity to changes in each of these parameters.
The Remaining Useful Life (RUL) of a battery denotes the projected operational duration remaining before the battery's state of health (SOH) declines to a predefined critical threshold. Provided the initial SOH at the beginning of second-life application and a critical SOH limit for acceptable performance, the RUL can be estimated as:
where – the initial state of health of the battery when it starts its secondary use; – the critical state of health at which the battery is considered no longer effective for the intended application, – the integral degradation index, which represents the rate of degradation per unit time.
This index enables more realistic modeling of SLB behavior in operational environments and improves accuracy in SOH and RUL predictions, making it particularly suitable for adaptive control and trigger-based decision-making within the PDCA framework. Cross-validation was performed using synthetic datasets reflecting three representative SLB aging scenarios. The results were compared to degradation patterns reported in [34].
In addition, it is essential to account for the reliability indicator R(t), which reflects the actual ability of the battery to operate without interruptions during its second-life application. This indicator is defined as the ratio of uninterrupted operating time to the total operating time:
Its value decreases in the presence of frequent faults, shutdowns, or failure events, and it is critically important for assessing the long-term effectiveness of second-life battery applications in power systems.
Integrating these technical KPIs within the PDCA cycle enables systematic monitoring and adaptive management, providing the data foundation for trigger-based decision-making, scenario planning, and lifecycle extension strategies under the principles of the circular economy [99,100]. Table 3 summarizes the selected technical KPIs relevant for SLB deployment and their connection to PDCA phases.
In practice, these technical KPIs guide operational decisions across different SLB deployment scenarios [90,91]. For instance, in frequency regulation services, maintaining an RTE above 85% and SoH above 70% ensures rapid and reliable system response while preserving SLB health [101]. In renewable energy smoothing applications, DoD levels are strategically managed to balance energy flexibility and degradation rates, while the IDI can be monitored to assess the combined effects of cyclic and calendar aging [102,103].
By integrating the selected technical KPIs into the PDCA cycle, operators can implement a structured and adaptive approach to SLB management. This enables ongoing monitoring, threshold-based trigger control, and scenario-specific planning, aligning operational strategies with circular economy goals and performance sustainability [104,105,106,107]. The diagram in Figure 7a illustrates how key technical indicators (such as RTE, SoH, DoD, and IDI) are embedded within each PDCA phase to support continuous performance improvement and degradation mitigation. To visualize how these indicators manifest in different system roles, Figure 7b presents a comparative radar chart of three SLB deployment scenarios — HV Backup, RES Smoothing, and Frequency Regulation — highlighting scenario-specific KPI profiles and trade-offs.
- (c)
- Economic KPIs for SLB Deployment
Economic feasibility is a critical dimension of SLB deployment, influencing investment decisions, operational strategies, and long-term project viability [107,108]. Economic KPIs such as LCOS, Payback Period (PBP), Return on Investment (ROI), and Revenue Stacking Potential provide structured tools for evaluating the cost-effectiveness of SLB systems while aligning them with market and policy frameworks [108,109,110]. These indicators allow for quantifying economic benefits, managing operational expenditures, and assessing profitability under various market conditions, including in residential, backup, and grid-support contexts [109,110,111].
To quantify the financial viability of SLB deployment across scenarios, two key economic indicators are applied: ROI and LCOS.
ROI is calculated as:
LCOS reflects the total cost per unit of stored and delivered energy across the project lifetime:
where: – capital expenditures in year ; – operational and maintenance costs; – delivered energy; – discount rate; – project lifetime.
These formulas allow for comparative financial assessment across applications such as backup power, microgrids, and renewable integration. As noted in prior work [32,33,34], SLB deployment in RES smoothing shows ROI of 15–22%, while LCOS values vary strongly with utilization and degradation rate.
Incorporating economic KPIs within the PDCA cycle ensures that financial considerations are systematically monitored and integrated into adaptive decision-making, enabling project stakeholders to align operational control with profitability and circularity goals [107,112]. Table 4 summarizes the key economic KPIs relevant to SLB integration and their linkage to PDCA phases.
In application, these economic KPIs support scenario-specific financial optimization of SLB systems [108,109]. For example, in HV Backup scenarios, LCOS calculations can be used to compare SLB integration with alternative backup solutions, while PBP and ROI provide critical benchmarks for project viability under cost-constrained conditions [107,111]. In RES smoothing and frequency regulation scenarios, revenue stacking potential allows operators to leverage multiple income streams, improving economic performance and reducing reliance on a single service revenue [109,112].
Integrating economic KPIs into the PDCA cycle enables continuous assessment of project viability and profitability across SLB deployment scenarios [107,110,111]. By embedding indicators such as LCOS, ROI, PBP, and Utilization Rate into financial planning and monitoring workflows, stakeholders can identify cost deviations, anticipate revenue fluctuations, and adjust strategies in response to market conditions. Figure 8a presents the economic dimension of the PDCA logic, illustrating how each phase contributes to financial control and optimization. To contextualize these indicators within specific system roles, Figure 8b visualizes the economic KPI profiles of the three representative SLB scenarios — HV Backup, RES Smoothing, and Frequency Regulation. The radar chart highlights scenario-specific performance trade-offs, enabling comparative evaluation and scenario-driven financial strategy design.
- (d)
- Environmental KPIs for Evaluation of SLB Sustainability
Environmental sustainability indicators are essential for evaluating the circularity potential and climate impact of SLB deployment in energy systems [113,114]. Metrics such as Lifecycle GHG Emissions Reduction, Resource Savings, and End-of-Life Recyclability Readiness quantify the environmental benefits of reusing batteries compared to first-life systems and conventional fossil-based alternatives [115,116,117].
Environmental KPIs provide critical insight into the circular value of SLBs. For instance, carbon footprint reduction is expressed as:
where and represent lifecycle emissions for new and second-life battery production, respectively.
A 40 kWh SLB pack can save over 2,200 kg CO₂ compared to a new battery.
Material efficiency (ME), indicating energy return on material input, is given by:
where represents useful output energy in second life, and reflects embodied energy in raw materials.
Another indicator, Energy Payback Time (EPBT), reflects the time to recover the energy invested in SLB repurposing:
For typical SLB deployments, ≈ 0.1 years (≈1.2 months), significantly outperforming new LIBs.
Finally, the Circularity Score (CS) is used for comparative circularity evaluation:
where – the mass of components reused in the second-life battery application; – the mass of components recyclable after the end of the second life; – the total mass of materials in the battery.
This indicator reflects the proportion of materials that are either reused or returned into the production cycle, thus serving as a key metric for assessing circular economy performance, and for SLBs achieving scores up to 0.9 versus 0.6 for new batteries.
These KPIs align SLB operations with decarbonization pathways, material circularity, and regulatory sustainability targets [118,119]. Integrating environmental KPIs within the PDCA cycle enables real-time tracking of sustainability outcomes, allowing operational strategies to be adapted to enhance SLB contributions to circular economy goals while maintaining alignment with system performance and economic feasibility [120,121]. Table 5 summarizes key environmental KPIs applicable to SLB management and their placement within PDCA phases.
In practical deployment, these environmental KPIs guide sustainability-aligned operational management of SLBs [113,114]. For instance, in RES smoothing scenarios, monitoring lifecycle GHG reductions enables quantifying emissions savings achieved by displacing fossil-based peak plants, while resource savings metrics provide insights into the materials preserved through reuse instead of new battery production [115,116,117,118]. End-of-life recyclability readiness supports planning for circular re-entry of materials, closing the loop in battery resource cycles [119,120,121]. Utilizing these KPIs within PDCA-based operations enables evidence-based scenario prioritization, allowing SLB operators to select and adjust use cases that maximize environmental benefits while sustaining system reliability and cost-effectiveness.
To enable environmentally sound integration of SLBs into energy systems, environmental KPIs must be operationalized within a structured management framework. The PDCA cycle provides such a structure, supporting scenario-specific sustainability goals, tracking real-time emissions and resource use, and informing end-of-life strategies. Figure 9a outlines how environmental considerations are embedded into each PDCA phase — from planning circularity targets to acting on emissions trends and recyclability readiness. To assess how various SLB deployment scenarios contribute to sustainability goals, Figure 9b presents a comparative radar chart of environmental KPIs across three application types: HV Backup, RES Smoothing, and Frequency Regulation. The chart highlights the environmental strengths and trade-offs of each use case, facilitating evidence-based decision-making aligned with decarbonization and circular economy objectives.
While technical, economic, and environmental KPIs each offer valuable insights into second-life battery (SLB) performance, none of them alone is sufficient for making informed deployment decisions. Technical indicators such as SoH, RTE, or IDI characterize the physical capability and health of the battery, but they do not reflect whether continued use is financially viable or environmentally justified. Conversely, a deployment scenario with favorable ROI or LCOS may involve rapid degradation or poor reliability, ultimately compromising system performance. Similarly, scenarios with strong environmental impact — such as carbon footprint reduction or circularity gains — may underperform economically or technically, limiting their practical relevance.
Each KPI dimension becomes more or less critical at different stages of the SLB lifecycle. In the initial screening and repurposing phase, technical KPIs dominate decision-making to ensure safe and viable operation. During scenario matching and early deployment, economic KPIs such as LCOS and ROI take precedence to confirm financial feasibility. As the battery progresses through its operational phase, degradation trends and usage profiles shift the emphasis toward trigger-based technical monitoring. Toward the end of life, environmental and circularity KPIs become crucial in guiding reallocation, recycling, or disposal planning.
This evolving relevance of KPIs necessitates a composite, dynamic evaluation framework that allows weighting, tracking, and balancing of competing priorities. Integrating these KPIs within the PDCA management cycle enables scenario-specific optimization, supports lifecycle governance, and ensures alignment with circular economy principles.
- (e)
- Composite Scenario-Based KPIs Visualization
To support balanced and adaptive deployment of SLBs, a composite radar-based visualization approach is employed. Unlike separate assessments of technical, economic, and environmental indicators, this integrated view enables holistic comparison of SLB performance across representative operational scenarios — high-voltage backup, RES smoothing, and frequency regulation.
Figure 10 presents a composite radar chart that consolidates normalized KPI values across all three dimensions, offering a multidimensional overview of scenario-specific strengths, weaknesses, and trade-offs. This includes metrics such as round-trip efficiency, SOH, degradation rate, LCOS, payback period, lifecycle carbon footprint, material resource efficiency, and more — each normalized to a 0–100 scale to allow joint visualization.
The chart reveals that Frequency regulation delivers strong technical responsiveness but faces challenges from accelerated degradation and increased LCOS, reflecting intensive cycling stress. HV backup excels in safety, availability, and reserve capacity, with moderate financial returns and limited cycling intensity — making it suitable for longevity-oriented roles. RES smoothing offers the most balanced profile, with stable performance across environmental and economic KPIs, positioning it as a versatile option in grid-interactive applications.
This visual comparison directly supports PDCA-based SLB management by making trade-offs explicit and scenario selection more transparent. It enables stakeholders to align deployment strategies with system priorities — whether optimizing for resilience, economic return, or circularity gains.
In addition to comparing SLB scenarios, Figure 11 presents a reference radar chart contrasting SLBs and new LIBs across selected KPIs. While SLBs demonstrate clear advantages in lower LCOS and circularity benefits, they underperform in capacity retention, depth of discharge, and degradation rate, emphasizing the need for context-specific planning and lifecycle-aware operation.
Together, Figure 10 and Figure 11 anchor the KPI framework in practical insights, enabling adaptive, evidence-based SLB deployment aligned with performance targets and sustainability goals.
This scenario-based KPI analysis supports system planners, operators, and researchers in evaluating SLB deployment strategies, enabling informed decision-making on scenario prioritization while managing trade-offs between operational performance, financial considerations, and sustainability objectives within adaptive PDCA-based management frameworks.
Beyond scenario-based comparisons, KPI roles evolve dynamically across the SLB lifecycle — from early-stage screening to portfolio-level optimization. Table 6 summarizes this evolution by mapping KPI functions to distinct integration phases and strategic decisions. This complements radar-based evaluations with a temporal logic, clarifying not only what to monitor but also when and why it matters for SLB integration.
Integrating KPIs within the PDCA framework enables systematic continuous improvement in SLB operation: Plan (define KPI targets), Do (deploy with monitoring), Check (track deviations), Act (adjust operational strategies). This structured feedback loop aligns SLB performance with grid requirements, economic objectives, and sustainability goals.
- (f)
- Trigger-Based Control Logic
To operationalize the PDCA-based integration of second-life batteries (SLBs), a trigger-based control mechanism is introduced, linking key performance indicators (KPIs) to adaptive decision rules. This approach transforms KPI monitoring into actionable logic, enabling timely interventions in response to technical degradation, economic inefficiencies, or environmental deviations. By defining threshold values and corresponding actions, SLB deployment strategies can dynamically evolve while maintaining alignment with system-level objectives, circular economy principles, and reliability standards.
Within this logic, each KPI serves as a sentinel for a specific type of risk or opportunity. When thresholds are breached, corrective or preventive actions are triggered in the Do or Act phases of the PDCA cycle, ensuring that performance deterioration does not become irreversible.
Representative examples of such KPI-driven triggers include:
SoH Trigger: If the state of health (SoH) drops below 65%, the SLB is reassigned from high-intensity applications (e.g., frequency regulation) to low-stress roles (e.g., backup), thereby extending usable life and deferring replacement.
IDI Trigger: When the Integral Degradation Index (IDI) exceeds 0.85, indicating cumulative calendar, cyclic, and stochastic wear, the battery’s operational load is reduced or it is prepared for secondary reassignment or recycling.
RTE Trigger: A decline in round-trip efficiency (RTE) below 75% prompts adjustments in depth-of-discharge (DoD) or cycling frequency to reduce further degradation.
LCOS Trigger: An increase in the LCOS beyond predefined viability thresholds initiates strategic reassessment, including possible changes to use-case scenarios or business models.
Environmental Triggers: If lifecycle GHG reduction falls below 25% or resource savings become negligible, environmental performance is flagged for review, triggering redesign or exit strategies.
Table 7 provides a consolidated matrix of threshold-based triggers and the corresponding operational responses, structured in alignment with PDCA phases. It serves as a practical reference for scenario-specific SLB management.
This trigger-based logic empowers SLB operators to implement data-driven, scenario-aware interventions, ensuring performance stability, economic feasibility, and sustainability. By embedding KPI thresholds directly into the PDCA cycle, this approach facilitates predictive governance, reduces degradation risks, and supports lifecycle extension — reinforcing the broader goals of circular energy systems. The trigger-based control structure reflects a custom event-driven logic devised specifically for adaptive SLB dispatch under scenario variability.
- (g)
- KPI-Triggered Operational Model
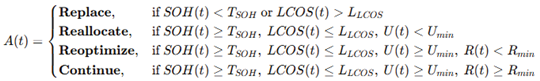
To operationalize trigger-based SLB management within the PDCA cycle, we propose a formalized control model in which real-time values of selected KPIs determine appropriate system-level actions. These actions aim to maximize performance while minimizing degradation, economic loss, or sustainability compromise. The model builds upon the KPI-action matrix and embeds decision logic into an adaptive control rule applicable to SLB deployment.
Let the following KPIs be monitored at time t: SOH(t) – state of health, LCOS(t) – levelized cost of storage, U(t) – utilization rate, R(t) – reliability indicator.
We also define key thresholds and acceptable minimum values: TSOH – SOH threshold, LLCOS – LCOS threshold, Umin, Rmin – minimum acceptable values for utilization and reliability respectively.
Then the control action A(t) is selected according to the rule:
 .
.
.
This logic yields four distinct operational strategies:
Replace: If technical or economic thresholds are violated, the SLB is retired or moved to end-of-life processing.
Reallocate: If utilization is too low despite acceptable SOH and LCOS, the SLB is reassigned to a more suitable use-case.
Reoptimize: If reliability drops, operational parameters are adjusted (e.g., dispatch frequency, DoD) to mitigate further risk.
Continue: If all KPIs remain within target bounds, the current scenario is maintained.
Each action is mapped to PDCA phases:
- Plan: Define KPI targets and thresholds based on scenario evaluation.
- Do: Deploy batteries and begin monitoring.
- Check: Evaluate deviations using real-time KPI inputs.
- Act: Apply A(t) based on logic rule to modify or continue the operational strategy.
This model ensures that SLB deployment remains data-driven, dynamically adaptive, and aligned with both technical feasibility and circular economy objectives. Moreover, it enables the formalization of transition logic between deployment roles, bridging operational monitoring with actionable system-level responses.
This study relies on simulated data rather than operational logs. The degradation model assumes uniform calendar and cyclic decay, which may not capture real-world thermal or charging variability. The KPI weights are expert-based and may vary across systems. Scalability and interoperability with existing dispatch platforms require further verification.
- (h)
- Future Research: Multi-model Framework for SLB Deployment
Building on the presented KPI-based control approach, future research will focus on the development of an integrated multi-model framework for second-life battery (SLB) deployment. This framework will support comprehensive decision-making throughout the battery lifecycle by combining technical performance monitoring, economic feasibility analysis, spatial allocation, operational optimization, and replacement planning — all aligned with the PDCA cycle. Such an approach aims to enhance the efficiency and reliability of SLB integration into energy systems under diverse grid and microgrid scenarios.
In the PLAN phase, target KPIs are defined across technical (SoH, SoE, DoD, IDI), economic (LCOS, ROI, PBP), and environmental (lifecycle carbon footprint, material resource efficiency) dimensions. Degradation and RUL models are employed to assess the technical suitability of SLBs for intended applications. Economic feasibility is evaluated using LCOS and financial performance indicators, while scenario-based planning identifies optimal use cases considering system flexibility and resilience requirements.
In the DO phase, SLBs are deployed within selected applications such as renewable energy integration, backup power, or frequency regulation. Operational parameters are configured using cluster-based deployment and optimization models, ensuring efficient system integration while monitoring degradation trends through the IDI and SoH metrics.
In the CHECK phase, real-time monitoring of KPIs allows comparison of actual performance with planned targets. Trigger conditions, based on thresholds for degradation, utilization rates, and economic parameters, initiate system checks for operational adjustments, maintenance scheduling, or reconfiguration of deployment scenarios.
In the ACT phase, corrective actions are implemented to optimize SLB operation, including adjusting charging/discharging strategies, transitioning to alternative operational scenarios, or planning replacements. Feedback from operational performance informs iterative improvements in future SLB deployment strategies.
To operationalize the KPI-PDCA framework, a set of interconnected models supports scenario-based deployment and adaptive management of SLBs within energy systems. Table 8 summarizes these models, detailing their inputs, outputs, applied methods, and integration within the PDCA cycle to align SLB deployment with circular economy goals and system flexibility requirements.
The models presented in Table 8 function as an integrated system supporting the systematic deployment and adaptive management of SLBs within the KPI-PDCA framework. By combining degradation analysis, lifetime forecasting, economic feasibility, spatial and operational optimization, and replacement planning, these models enable informed decision-making across planning, operation, monitoring, and corrective phases. Trigger-based control logic is embedded within this structure, using KPI thresholds to initiate adjustments in dispatch strategies, scenario allocations, or replacement timing as SLBs progress through different stages of use. This multi-model approach ensures that SLB deployment aligns with circular economy principles by extending asset lifecycles, improving resource efficiency, and reducing waste while maintaining operational flexibility and economic viability within energy systems. Figure 12 visually summarizes this integrated multi-model framework, illustrating how the individual models interact within the PDCA cycle to support scenario-based SLB deployment and adaptive management.
Together, these models enable comprehensive scenario-based evaluation and operational management of SLBs within energy systems, supporting decision-making aligned with circular economy principles, system flexibility needs, and sustainability objectives.
In Ukraine, active research is underway to develop advanced models supporting SLB deployment within energy systems, covering frequency regulation applications, distributed generation integration, and scenario-based optimization under technological and environmental constraints [122,123,124,125,126,127,128,129,130,131,132,133]. These models address both the technical dynamics of SLB operation and the economic-environmental dimensions of system-level deployment planning, aligning with the broader goals of grid flexibility and low-carbon transition pathways [124,125,126,127]. Notably, author has contributed to this field through the development of integrated degradation modeling, cluster-based SLB allocation frameworks, and circular economy-oriented operational scenarios for the Ukrainian power system [17,18,19], [34], [117]. Future work will focus on calibrating these models using real-world operational and degradation datasets to refine scenario-based analyses and trigger thresholds. Additionally, the integrated use of these models offers the potential for developing digital twin systems for SLB management, enabling predictive diagnostics, adaptive dispatch strategies, and continuous optimization within energy systems.
5. Discussion
An integrated methodological framework has been developed in this study to guide the deployment of second-life batteries (SLBs) within energy systems. By combining degradation and lifetime forecasting, economic feasibility assessment, spatial and operational optimization, and replacement planning within a KPI-driven PDCA management cycle, the framework enables adaptive, evidence-based decision-making aligned with operational flexibility, sustainability, and circular economy objectives. By embedding technical, economic, and environmental KPIs within operational monitoring, the framework enables systematic, trigger-based adaptation of SLB deployment strategies, ensuring alignment with circular economy principles and system flexibility requirements. Сompared to the LCA-based approach, the PDCA model demonstrates greater adaptability in short-term dispatch adjustment
Compared to previous studies that focus on isolated aspects of SLB management, such as technical degradation monitoring or economic feasibility, this framework advances the integration of multi-domain KPIs into dynamic operational decision-making under uncertainty. The structured linkage of KPI thresholds with PDCA phases enables real-time trigger-based actions, such as reassigning SLBs when SoH or IDI thresholds are reached, shifting operational modes when LCOS benchmarks are exceeded, or planning recycling based on environmental performance indicators. This adaptive management approach extends the useful life of SLBs, reduces material waste, and maximizes their technical and economic utility within energy systems, reinforcing the practical implementation of circular economy goals.
The scenario-based applications illustrated in this study, including HV backup, RES smoothing, and frequency regulation, demonstrate how the framework can guide SLB deployment in diverse contexts while maintaining a clear structure for operational monitoring and adjustment. For instance, SLBs can be prioritized for high-value services while their performance remains within KPI targets, then systematically reallocated to less demanding roles as degradation progresses, ensuring continued value extraction before end-of-life recycling. Despite technical feasibility, regulatory fragmentation, data uncertainty, and limited field pilots remain key obstacles. Additionally, utility hesitance toward repurposed assets may slow adoption
Limitations of this study include the absence of detailed numerical case studies and algorithmic simulations within this publication, as the primary focus is on establishing the conceptual and methodological foundation for the framework. Future research will implement and validate each model computationally using real-world datasets, pilot projects, and scenario-specific simulations to refine trigger thresholds, optimize dispatch strategies, and quantify system-wide impacts on emissions reduction, economic performance, and system flexibility.
The approach and models presented in this study were developed by the authors. The simulation workflow, KPI integration, and trigger logic are based on authors-designed structures implemented in a modular, scenario-driven architecture. No external modeling software was used; all elements are based on custom logic, structured analytically according to SLB-specific requirements. A methodological limitation was the absence of hardware-in-the-loop testing, which could reveal practical dispatch delays and hardware constraints. It is recommended to validate the framework in real-time control environments to assess implementation feasibility.
Overall, the proposed framework offers a structured, adaptable pathway for integrating second-life batteries into energy systems in alignment with sustainability goals, providing a robust foundation for advanced SLB management under operational uncertainty.
6. Conclusions
This study proposes a comprehensive PDCA-based management framework for the deployment of second-life batteries (SLBs) in energy systems, integrating performance monitoring, degradation analysis, and adaptive control strategies. By combining technical, economic, and environmental key performance indicators (KPIs) with scenario-based modeling, the framework supports informed decision-making aligned with circular economy and sustainability objectives.
The results show that although SLBs demonstrate slightly lower round-trip efficiency and more pronounced degradation compared to new batteries, they offer significantly lower levelized cost of storage (LCOS), favorable payback periods in selected scenarios, and added value through extended battery lifetimes and resource reuse. Among the evaluated use cases, energy arbitrage proved to be the most economically attractive, while backup power improves system resilience. Frequency regulation was identified as technically promising but challenging in terms of degradation risks and operational control.
To support long-term planning, the study also introduces a multi-model architecture that integrates degradation forecasting, economic feasibility analysis, spatial and operational optimization, and replacement planning within the PDCA framework. The use of trigger-based operational logic enables dynamic adjustment of SLB deployment in response to monitored KPIs, allowing more flexible and context-sensitive management.
By embedding reuse-based battery strategies into adaptive control frameworks, SLBs can play a strategic role in advancing the flexibility, resilience, and resource efficiency of modern energy systems.
Future research should focus on the calibration of models using empirical operational data, the refinement of control algorithms under uncertainty, and the validation of the framework through real-world pilot projects. Special attention should be given to hybrid SLB–new battery configurations and policy incentives required for broad adoption across diverse regulatory environments.
Author Contributions
Conceptualization, G.K. and A.Z.; methodology, G.K.; formal analysis, G.K.; investigation, G.K. and A.Z.; resources, A.Z.; data curation, G.K.; writing—original draft preparation, G.K.; writing—review and editing, G.K. and A.Z.; visualization, G.K. and A.Z.; supervision, A.Z.; project administration, A.Z.; funding, A.Z. All authors have read and agreed to the published version of the manuscript.
Data Availability Statement
The authors declare that the data supporting the findings of this study are available within EV Battery Current and Forecast Market Analysis (https://www.fortunebusinessinsights.com/industry-reports/electric-vehicle-battery-market-101700, accessed on 1 May 2025), Global Electric Vehicle Outlook 2025: EV Batteries (https://www.iea.org/reports/global-ev-outlook-2025/electric-vehicle-batteries, accessed on 19 April 2025) and Projected global second life battery capacity from 2023 to 2030 (https://www.statista.com/statistics/876624/global-second-life-battery-capacity/, accessed on 7 April 2025).
Acknowledgments
This work was supported by projects “Integrated modeling for robust management of food-energy-water-social-environmental (FEWSE) nexus security and sustainable development” (IIASA-NASU, 22-501 (R-45-T)), “Comprehensive analysis of robust preventive and adaptive measures of food, energy, water and social management in the context of systemic risks and consequences of COVID-19” (0122U000552, 2022–2026), “Development of the structure and ensuring the functioning of self-sufficient distributed generation” (0125U001572, 2025–2026), "Improvement of the hierarchical system of mathematical and software and information tools for researching the development directions of integrated energy systems in the context of the transition to a low-carbon economy" (0122U000236, 2022-2026), which are financed by National Academy of Science of Ukraine.
Conflicts of Interest
The author declare no conflicts of interest.
Abbreviations
The following abbreviations are used in this manuscript:
| BESS | Battery Energy Storage System |
| BMS | Battery Management System |
| DoD | Depth of Discharge |
| EMS | Energy Management System |
| EV | Electric Vehicle |
| GHG | Greenhouse Gas |
| HV | High Voltage |
| IDI | Integral Degradation Index |
| IRR | Internal Rate of Return |
| KPI | Key Performance Indicator |
| LCOS | Levelized Cost of Storage |
| LIB | Lithium-Ion Battery |
| NPV | Net Present Value |
| O&M | Operation and Maintenance |
| PBP | Payback Period |
| PDCA | Plan-Do-Check-Act |
| RES | Renewable Energy Sources |
| ROI | Return on Investment |
| RTE | Round-Trip Efficiency |
| RUL | Remaining Useful Life |
| SLB | Second-Life Battery |
| SOH | State of Health |
References
- Reaching Climate Objectives: the role of carbon dioxide removals. Energy Transition Comission, October 2021. (accessed on 7 April 2025).
- . (2022, July 15). The 4Ds of Energy Transition: Decarbonization, Decentralization, Decreasing Use and Digitalization (1st ed.). Wiley-VCH GmbH. Asif, M. (Ed.). [CrossRef]
- EEA. Trends and projections in Europe 2023; European Environment Agency: Copenhagen, Denmark, 2023; 83p, Available online: https://www.eea.europa.eu/publications/trends-and-projections-in-europe-2023 (accessed on 15 April 2025). [Google Scholar] [CrossRef]
- EEA. EEA greenhouse gas—data viewer. Available online: https://www.eea.europa.eu/data-and-maps/data/data-viewers/greenhouse-gases-viewer (accessed on 24 April 2025).
- United Nations Department of Economic and Social Affairs. Frontier technology issues: Lithium-ion batteries—A pillar for a fossil-fuel-free economy. Available online: https://www.un.org/development/desa/dpad/publication/frontier-technology-issues-lithium-ion-batteries-a-pillar-for-a-fossil-fuel-free-economy/ (accessed on 14 April 2025).
- Yang, H.; Hu, X.; Zhang, G.; Dou, B.; Cui, G.; Yang, Q.; Yan, X. Life cycle assessment of secondary use and physical recycling of lithium-ion batteries retired from electric vehicles in China. Waste Manag. 2024, 178, 168–175. [Google Scholar] [CrossRef]
- Saudi Gazette. Global battery demand to surge by 2030, supply headaches on the horizon. Saudi Gazette, 16 August 2021. Available online: https://saudigazette.com.sa/article/617999/BUSINESS/Powering-up-Global-battery-demand-to-surge-by-2030-supply-headaches-on-the-horizon (accessed on 14 April 2025).
- A new circular economy action plan for a cleaner and more competitive Europe. (2020). Communication from the Commission to the European Parliament, the Council, the European Economic and Social Committee and the Committee of the Regions. An official website of the European Union. URL: https://eur-lex.europa.eu/legal-content/EN/TXT/?uri=COM%3A2020%3A98%3AFIN. Available online: https://eur-lex.europa.eu/legal-content/EN/TXT/?uri=COM%3A2020%3A98%3AFIN (accessed on 15 April 2025).
- Global Electric Vehicle Outlook 2025: EV Batteries. https://www.iea.org/reports/global-ev-outlook-2025/electric-vehicle-batteries. 2025; (accessed on 19 April 2025).
- EV Battery Current and Forecast Market Analysis. https://www.fortunebusinessinsights.com/industry-reports/electric-vehicle-battery-market-101700. (accessed on 1 May 2025).
- Second Life Battery Capacity – Globally 2030. (2019). Statista. URL: https://www.statista.com/statistics/876624/global-second-life-battery-capacity/. (accessed on 7 April 2025).
- Ministry of Infrastructure of Ukraine. National transport strategy of Ukraine up to 2030. Available online: http://publications.chamber.ua/2017/Infrastructure/UDD/National_Transport_Strategy_2030.pdf (accessed on 10 January 2025).
- Kostenko, G.P. Situation analysis of electric transport development prospects and its integration into Ukrainian power system. Power Eng. Econ. Tech. Ecol. 2023, 1, 71. [Google Scholar] [CrossRef]
- Kostenko, G. Overview of European trends in electric vehicle implementation and the influence on the power system. Syst. Res. Energy 2022, 1, 62–71. [Google Scholar] [CrossRef]
- Ivanenko, N. The impact of the implementation of electric transportation on the Ukraine’s integrated power system functioning. Syst. Res. Energy 2023, 1, 4–11. [Google Scholar] [CrossRef]
- Kostenko, G.P.; Zgurovets, O.V.; Tovstenko, M.M. SWOT-analysis of electric transport and V2G implementation for power system sustainable development in Ukraine. IOP Conf. Ser. Earth Environ. Sci. 2023, 1254, 012030. [Google Scholar] [CrossRef]
- Kostenko, G.; Zaporozhets, A.; Babak, V.; Uruskyi, O.; Titko, V.; Denisov, V. Second-life EV batteries application in energy storage systems for sustainable and resilient power sector. In Systems, Decision and Control in Energy VII; Babak, V., Zaporozhets, A., Studies in Systems, Decision and Control, Eds.; Springer: Cham, Switzerland, 2025; Volume 595. [Google Scholar] [CrossRef]
- Kostenko, G.; Zaporozhets, A. World experience of legislative regulation for lithium-ion electric vehicle batteries considering their second-life application in power sector. Syst. Res. Energy 2024, 2, 97–114. [Google Scholar] [CrossRef]
- Kostenko, G.; Zaporozhets, A. Transition from electric vehicles to energy storage: Review on targeted lithium-ion battery diagnostics. Energies 2024, 17, 5132. [Google Scholar] [CrossRef]
- YAO, L. , YANG, B., CUI, H. et al. Challenges and progresses of energy storage technology and its application in power systems. J. Mod. Power Syst. Clean Energy 2016, 4, 519–528. [Google Scholar] [CrossRef]
- Amir, M.; Deshmukh, R.G.; Khalid, H.M.; Said, Z.; Raza, A.; Muyeen, S.; Nizami, A.S.; Elavarasan, R.M.; Saidur, R.; Sopian, K. Energy storage technologies: An integrated survey of developments, global economical/environmental effects, optimal scheduling model, and sustainable adaption policies. J. Energy Storage 2023, 72, 108694. [Google Scholar] [CrossRef]
- Zaporozhets, A.; Kostenko, G.; Zgurovets, O.; Deriy, V. Analysis of global trends in the development of energy storage systems and prospects for their implementation in Ukraine. In Power Systems Research and Operation; Kyrylenko, O., Denysiuk, S., Strzelecki, R., Blinov, I., Zaitsev, I., Zaporozhets, A., Studies in Systems, Decision and Control, Eds.; Springer: Cham, Switzerland, 2024; Volume 512. [Google Scholar] [CrossRef]
- Zhao, Y.; Pohl, O.; Bhatt, A.I.; Collis, G.E.; Mahon, P.J.; Rüther, T.; Hollenkamp, A.F. A Review on Battery Market Trends, Second-Life Reuse, and Recycling. Sustain. Chem. 2021, 2, 167–205. [Google Scholar] [CrossRef]
- Miao, Y.; Hynan, P.; von Jouanne, A.; Yokochi, A. Current Li-ion battery technologies in electric vehicles and opportunities for advancements. Energies 2019, 12, 1074. [Google Scholar] [CrossRef]
- Pagliaro, M.; Meneguzzo, F. Lithium battery reusing and recycling: A circular economy insight. Heliyon 2019, 5, e01866. [Google Scholar] [CrossRef]
- Kurland, S.D. Energy use for GWh-scale lithium-ion battery production. Environ. Res. Commun. 2020, 2, 012001. [Google Scholar] [CrossRef]
- Tao, Y.; Rahn, C.D.; Archer, L.A.; You, F. Second life and recycling: Energy and environmental sustainability perspectives for high-performance lithium-ion batteries. Sci. Adv. 2021, 7, eabi7633. [Google Scholar] [CrossRef]
- Dong, Q.; Liang, S.; Li, J.; Kim, H.C.; Shen, W.; Wallington, T.J. Cost, energy, and carbon footprint benefits of second-life electric vehicle battery use. iScience 2023, 26, 107195. [Google Scholar] [CrossRef] [PubMed]
- Illa Font, C.H.; Siqueira, H.V.; Machado Neto, J.E.; Santos, J.L.F.d.; Stevan, S.L., Jr.; Converti, A.; Corrêa, F.C. Second Life of Lithium-Ion Batteries of Electric Vehicles: A Short Review and Perspectives. Energies 2023, 16, 953. [Google Scholar] [CrossRef]
- Reinhardt, R.; Christodoulou, I.; Gassó-Domingo, S.; Amante García, B. Towards sustainable business models for electric vehicle battery second use: A critical review. J. Environ. Manag. 2019, 245, 432–446. [Google Scholar] [CrossRef]
- Haram, M.H.S.M.; Sarker, M.T.; Ramasamy, G.; Ngu, E.E. Second life EV batteries: Technical evaluation, design framework, and case analysis. IEEE Access 2023, 11, 138799–138812. [Google Scholar] [CrossRef]
- Martinez-Laserna, E.; Gandiaga, I.; Sarasketa-Zabala, E.; Badeda, J.; Stroe, D.-I.; Swierczynski, M.; et al. Battery second life: Hype, hope or reality? A critical review of the state of the art. Renew. Sustain. Energy Rev. 2018, 93, 701–718. [Google Scholar] [CrossRef]
- Prenner, S.; Part, F.; Jandric, A.; Bordes, A.; Leonhardt, R.; Jung-Waclik, S.; Huber-Humer, M. Enabling circular business models: Preconditions and key performance indicators for the market launch of repurposed second-life lithium-ion batteries from electric vehicles. Int. J. Energy Res. 2024. [CrossRef]
- Kostenko, G. Accounting calendar and cyclic ageing factors in diagnostic and prognostic models of second-life EV batteries application in energy storage systems. Syst. Res. Energy 2024, 3, 21–34. [Google Scholar] [CrossRef]
- Neubauer, J.; Smith, K.; Wood, E.; Pesaran, A. Identifying and overcoming critical barriers to widespread second use of PEV batteries. National Renewable Energy Laboratory, 2015. Available online: https://www.nrel.gov/docs/fy15osti/63332.pdf (accessed on 10 March 2025).
- Sandberg, E. Second life applications for degraded EV batteries: Evaluating benefits based on remaining useful life and battery configurations. Master’s Thesis, Linköping University, Linköping, Sweden, 2023. Available online: https://urn.kb.se/resolve?urn=urn:nbn:se:liu:diva-196013. Available online: https://urn.kb.se/resolve?urn=urn:nbn:se:liu:diva-196013 (accessed on 10 May 2025).
- Fichtner, M. Recent research and progress in batteries for electric vehicles. Batteries Supercaps 2022. [Google Scholar] [CrossRef]
- Hasselwander, S.; Meyer, M.; Österle, I. Techno-economic analysis of different battery cell chemistries for the passenger vehicle market. Batteries 2023, 9, 379. [Google Scholar] [CrossRef]
- Zaporozhets, A.; Babak, V.; Kostenko, G.; Zgurovets, O.; Denisov, V.; Nechaieva, T. Power system resilience: An overview of current metrics and assessment criteria. In Systems, Decision and Control in Energy VI; Babak, V., Zaporozhets, A., Studies in Systems, Decision and Control, Eds.; Springer: Cham, Switzerland, 2024; Volume 561. [Google Scholar] [CrossRef]
- Ma, J.; et al. The 2021 battery technology roadmap. J. Phys. D: Appl. Phys. 2021, 54, 183001. [Google Scholar] [CrossRef]
- Tsiropoulos, I.; Tarvydas, D.; Lebedeva, N. Li-ion batteries for mobility and stationary storage applications—Scenarios for costs and market growth; EUR 29440 EN; Publications Office of the European Union: Luxembourg, 2018. [Google Scholar] [CrossRef]
- Chirumalla, K.; Kulkov, I.; Parida, V.; Dahlquist, E.; Johansson, G.; Stefan, I. Enabling battery circularity: Unlocking circular business model archetypes and collaboration forms in the electric vehicle battery ecosystem. Technol. Forecast. Soc. Chang. 2024, 199, 123044. [Google Scholar] [CrossRef]
- Vu, F.; Rahic, M.; Chirumalla, K. Exploring second life applications for electric vehicle batteries. In SPS2020: Advances in Transdisciplinary Engineering; Säfsten, K., Elgh, F., Eds.; IOS Press: Amsterdam, The Netherlands, 2020; Volume 13, pp. 273–284. [Google Scholar] [CrossRef]
- BNEF. Battery pack prices fall to an average of $132/kWh, but rising commodity prices start to bite. November 2021. Available online: https://about.bnef.com/blog/battery-pack-prices-fall-to-an-average-of-132-kwh-but-rising-commodity-prices-start-to-bite/ (accessed on 16 June 2025).
- Tadayon, L.; Frey, G. Multi-Level Simulation Framework for Degradation-Aware Operation of a Large-Scale Battery Energy Storage Systems. Energies 2025, 18, 2708. [Google Scholar] [CrossRef]
- Zhong, S.; Yuan, B.; Guang, Z.; Chen, D.; Li, Q.; Dong, L.; Ji, Y.; Dong, Y.; Han, J.; He, W. Recent progress in thin separators for upgraded lithium-ion batteries. Energy Storage Mater. 2021, 41, 805–841. [Google Scholar] [CrossRef]
- Jiao, N.; Evans, S. Business models for sustainability: The case of second-life electric vehicle batteries. Procedia CIRP 2016, 40, 250–255. [Google Scholar] [CrossRef]
- Martinez-Laserna, E.; Sarasketa-Zabala, E.; Villarreal Sarria, I.; Stroe, D.-I.; Swierczynski, M.; Warnecke, A.; et al. Technical viability of battery second life: A study from the ageing perspective. IEEE Trans. Ind. Appl. 2018, 54, 2703–2713. [Google Scholar] [CrossRef]
- Kotak, Y.; Marchante Fernandez, C.; Canals Casals, L.; Kotak, B.S.; Koch, D.; Geisbauer, C.; Trilla, L.; Gomez-Nunez, A.; Schweiger, H.-G. End of electric vehicle batteries: Reuse vs. recycle. Energies 2021, 14, 2217. [Google Scholar] [CrossRef]
- Bobba, S.; Mathieux, F.; Ardente, F.; Blengini, G.A.; Cusenza, M.A.; Podias, A.; Pfrang, A. Life cycle assessment of repurposed electric vehicle batteries: An adapted method based on modelling energy flows. J. Energy Storage 2018, 19, 213–225. [Google Scholar] [CrossRef]
- Nissan Motor Corporation. Electric vehicle lithium-ion battery. Available online: https://www.nissan-global.com/EN/INNOVATION/TECHNOLOGY/ARCHIVE/LI_ION_EV/ (accessed on 30 March 2025).
- InsideEVs, ET. Battery capacity loss warranty chart for 30 kWh Nissan LEAF. Available online: https://insideevs.com/news/326563/battery-capacity-loss-warranty-chart-for-2016-30-kwh-nissan-leaf/ (accessed on 30 April 2025).
- Koroma, M.S.; Costa, D.; Philippot, M.; Cardellini, G.; Hosen, M.S.; Coosemans, T.; Messagie, M. Life cycle assessment of battery electric vehicles: Implications of future electricity mix and different battery end-of-life management. Sci. Total Environ. 2022, 831, 154859. [Google Scholar] [CrossRef] [PubMed]
- Shafiekhani, M. , Oadrdan M., Addressing electricity transmission network congestions using battery energy storage systems – a case study of Great Britain. Applied Energy 2025, 384. [Google Scholar] [CrossRef]
- Horesh, N.; et al. Driving to the future of energy storage: Techno-economic analysis of a novel method to recondition second life electric vehicle batteries. Applied Energy 2021, 295. [Google Scholar] [CrossRef]
- Fang, Y. , Fan, R., Liu, Z.: A study on the energy storage scenarios design and the business model analysis for a zero-carbon big data industrial park from the perspective of source-grid-load-storage collaboration. Energy Rep. 2023, 9 (Suppl. 7), 2054–2068. [Google Scholar] [CrossRef]
- DIgSILENT Power Generation. Power System Solutions DIgSILENT. https://www.digsilent.de/en/power-generation.html.
- TIMES Ukraine. https://www.timesukraine.tokni.com/about.
- The Enertile optimisation model. Enertile® website. https://enertile.eu/enertile-en/methodology/optimisation.php.
- Moen, R. Foundation and History of the PDSA Cyclhttps://deming.org/wp-content/uploads/2020/06/PDSA_History_Ron_Moen.pdf. (accessed on 30 April 2025).
- Moen, R. , & Norman, C. Evolution of the PDCA Cycle https://www.studocu.vn/vn/document/truong-dai-hoc-kinh-te-va-quan-tri-kinh-doanh-dai-hoc-thai-nguyen/quan-tri-kinh-doanh/pdca-evolution-of-the-pdca-cycle/58037091. (accessed on 30 April 2025).
- Deming’s 14 Points for Management. https://deming.org/explore/fourteen-points/. (accessed on 30 April 2025).
- ASQ. The Deming Cycle (PDCA) Explained: A Comprehensive Guide to Continuous Improvement. Brightly Softw. 2025, [Online]. https://www.brightlysoftware.com/learning-center/deming-cycle-pdca-explained-comprehensive-guide-continuous-improvement. (accessed on 30 April 2025).
- Arveson, P. The Deming Cycle. https://balancedscorecard.org/bsc-basics/articles-videos/the-deming-cycle. (accessed on 30 April 2025).
- Investopedia. What Does PDCA Stand For in Business? Plan–Do–Check–Act Cycle. Investopedia 2010, [Online]. https://www.investopedia.com/terms/p/pdca-cycle.asp. (accessed on 30 April 2025).
- Dziadkowiec, J.M.; Balon, U.; Niewczas-Dobrowolska, M. Key Performance Indicators (KPIs) in the Quality Management System. Int. J. Qual. Res. 2024, 18, 473–486. [Google Scholar] [CrossRef]
- Isniah, S.; Purba, H.H.; Debora, F. Plan do check action (PDCA) method: literature review and research issues. J. Syst. Manag. Ind. 2020, 4, 72–81. [Google Scholar] [CrossRef]
- Patel, P. M. , & Deshpande, V. A. Application Of Plan-Do-Check-Act Cycle For Quality And Productivity Improvement A Review. International Journal for Research in Applied Science & Engineering Technology (IJRASET) 2017, 5, 197–201. [Google Scholar]
- Peças, P.; Encarnação, J.; Gambôa, M.; Sampayo, M.; Jorge, D. PDCA 4.0: A New Conceptual Approach for Continuous Improvement in the Industry 4.0 Paradigm. Applied Sciences 2021, 11, 7671. [Google Scholar] [CrossRef]
- Taylor MJ, McNicholas C, Nicolay C, Darzi A, Bell D, Reed JE. Systematic review of the application of the plan-do-study-act method to improve quality in healthcare. BMJ Qual Saf. 2014, 23, 290–298. [Google Scholar] [CrossRef]
- Candiello, A. , Cortesi, A. KPI-Supported PDCA Model for Innovation Policy Management in Local Government. In: Janssen, M., Scholl, H.J., Wimmer, M.A., Tan, Yh. (eds) Electronic Government. EGOV 2011, 6846. [Google Scholar] [CrossRef]
- Hasan, Z. , & Hossain, M. S. (2018). Improvement of Effectiveness by Applying PDCA Cycle or Kaizen: An Experimental Study on Engineering Students. Journal of Scientific Research 2011, 10, 159–173. [Google Scholar] [CrossRef]
- Taufik, D.A. PDCA Cycle Method implementation in industries: a systematic literature review. Ind. Eng. Manage. 2020, 1, 157–166. [Google Scholar] [CrossRef]
- Kushariyadi, K.; et al. Performance Management Based on Key Performance Indicators (KPI) to improve Organizational Effectiveness. Maneggio 2025, 2, 90–102. [Google Scholar] [CrossRef]
- Asih, I, Purba, H. P. and Sitorus, T. M. Key Performance Indicators: A Systematic Literature Review. Journal of Strategy and Performance Management 2020, 8, 142–155. [Google Scholar]
- Zhang, K. , Shardt, Y. A. W., Chen, Z., Yang, X., Ding, S. X., & Peng, K. A KPI-based process monitoring and fault detection framework for large-scale processes. ISA Transactions 2017, 68, 276–286. [Google Scholar] [CrossRef]
- Denysov, V.; Kulyk, M.; Babak, V.; Zaporozhets, A.; Kostenko, G. Modeling nuclear-centric scenarios for Ukraine’s low-carbon energy transition using diffusion and regression techniques. Energies 2024, 17, 5229. [Google Scholar] [CrossRef]
- Kostenko, G.P.; Zaporozhets, A.O.; Zaporozhets, N.V.; Verpeta, V.O. Aspects of integrating renewable distributed generation into the energy supply system of Ukraine. Probl. Econ. 2024, 2, 83–93. [Google Scholar] [CrossRef]
- Denysov, V.; Babak, V.; Zaporozhets, A.; Nechaieva, T.; Kostenko, G. Energy system optimization potential with consideration of technological limitations. In Nexus of Sustainability; Zagorodny, A., Bogdanov, V., Zaporozhets, A., Studies in Systems, Decision and Control, Eds.; Springer: Cham, Switzerland, 2024; Volume 559. [Google Scholar] [CrossRef]
- Denysov, V.; Babak, V.; Zaporozhets, A.; Nechaieva, T.; Kostenko, G. Quasi-dynamic energy complexes optimal use on the forecasting horizon. In Systems, Decision and Control in Energy VI; Babak, V., Zaporozhets, A., Studies in Systems, Decision and Control, Eds.; Springer: Cham, Switzerland, 2024; Volume 561. [Google Scholar] [CrossRef]
- Maistrenko, N. Taking into account environmental constraints on emissions in economic models long-term forecasting of energy consumption (review of publications). Syst. Res. Energy 2023, 3, 85–94. [Google Scholar] [CrossRef]
- Babak, V. , Kulyk, M. (2023). Development of the New Electro-thermal Energy System Structure for Providing of Ukraine’s Energy Market Profitability. In: Systems, Decision and Control in Energy V. Studies in Systems, Decision and Control, vol 481. Springer, Cham. [CrossRef]
- Hotra, O.; Kulyk, M.; Babak, V.; Kovtun, S.; Zgurovets, O.; Mroczka, J.; Kisała, P. Organisation of the structure and functioning of self-sufficient distributed power generation. Energies 2024, 17, 27. [Google Scholar] [CrossRef]
- Zgurovets, O.; Kulyk, M.M. Possibilities to form a modern reserve of supporting frequency in integrated power systems based on storage batteries for automatic adjustment of frequency and power. Syst. Res. Energy 2022, 1–2, 20–29. [Google Scholar] [CrossRef]
- Babak, V.P.; Kulyk, M.M. Possibilities and perspectives of the consumers-regulators application in systems of frequency and power automatic regulation. Tech. Electrodyn. 2023, 4, 72–80. [Google Scholar] [CrossRef]
- Elhuni, R. M. , & Ahmad, M. M. Key Performance Indicators for Sustainable Production Evaluation in Oil and Gas Sector. Procedia Manufacturing 2017, 11, 718–724. [Google Scholar] [CrossRef]
- Feiz, R. , Johansson, M., Lindkvist, E., Moestedt, J., Påledal, S. N., & Svensson, N. Key performance indicators for biogas production—methodological insights on the life-cycle analysis of biogas production from source-separated food waste. Energy 2020, 200. [Google Scholar] [CrossRef]
- Brint, A. , Genovese, A., Piccolo, C., & Taboada-Perez, G. J. Reducing data requirements when selecting key performance indicators for supply chain management: The case of a multinational automotive component manufacturer. International Journal of Production Economics. [CrossRef]
- Cherni, J. , Martinho, R., & Ghannouchi, S. A. Towards Improving Business Processes based on preconfigured KPI target values, Process Mining and Redesign Patterns. Procedia Computer Science 2019, 164, 279–284. [Google Scholar] [CrossRef]
- Andersson, E. , & Thollander, P. Key performance indicators for energy management in the Swedish pulp and paper industry. Energy Strategy Reviews 2019, 24, 229–235. [Google Scholar] [CrossRef]
- Assad, F. , Alkan, B., Chinnathai, M. K., Ahmad, M. H., Rushforth, E. J., & Harrison, R. A framework to predict energy related key performance indicators of manufacturing systems at early design phase. Procedia CIRP 2019, 81, 145–150. [Google Scholar] [CrossRef]
- Wang, D.; Coignard, J.; Zeng, T.; Zhang, C.; Saxena, S. Quantifying electric vehicle battery degradation from driving vs. vehicle-to-grid services. J. Power Sources 2016, 332, 193–203. [Google Scholar] [CrossRef]
- Dubarry, M.; et al. Durability and reliability of EV batteries under electric utility grid operations: Path dependence of battery degradation. J. Electrochem. Soc. 2018, 165, A773. [Google Scholar] [CrossRef]
- Eddahech, A.; Briat, O.; Woirgard, E.; Vinassa, J.M. Remaining useful life prediction of lithium batteries in calendar ageing for automotive applications. Microelectron. Reliab. 2012, 52, 2438–2442. [Google Scholar] [CrossRef]
- Canals Casals, L.; Amante García, B.; Canal, C.C. Second life batteries lifespan: Rest of useful life and environmental analysis. J. Environ. Manag. 2019, 232, 354–363. [Google Scholar] [CrossRef]
- Gharebaghi, M.; Rezaei, O.; Li, C.; Wang, Z.; Tang, Y. A Survey on Using Second-Life Batteries in Stationary Energy Storage Applications. Energies 2025, 18, 42. [Google Scholar] [CrossRef]
- Neubauer, J.; Wood, E.; Pesaran, A. A second life for electric vehicle batteries: Answering questions on battery degradation and value. SAE Int. J. Mater. Manf. 2015, 8, 530–537. [Google Scholar] [CrossRef]
- Haram, M.H.S.M.; Lee, J.W.; Ramasamy, G.; Ngu, E.E.; Thiagarajah, S.P.; Lee, Y.H. Feasibility of utilising second life EV batteries: Applications, lifespan, economics, environmental impact assessment, and challenges. Alex. Eng. J. 2021, 60, 4517–4536. [Google Scholar] [CrossRef]
- Assunção, A.; Moura, P.S.; de Almeida, A.T. Technical and economic assessment of the secondary use of repurposed electric vehicle batteries in the residential sector to support solar energy. Appl. Energy 2016, 181, 120–131. [Google Scholar] [CrossRef]
- Hossain, E.; Murtaugh, D.; Mody, J.; Faruque, H.M.R.; Sunny, M.S.; Sami, N.M. A comprehensive review on second-life batteries: Current state, manufacturing considerations, applications, impacts, barriers & potential solutions, business strategies, and policies. IEEE Access 2019, 7, 73215–73252. [Google Scholar] [CrossRef]
- Zubi, G.; Dufo-López, R.; Carvalho, M.; Pasaoglu, G. The lithium-ion battery: State of the art and future perspectives. Renew. Sustain. Energy Rev. 2018, 89, 292–308. [Google Scholar] [CrossRef]
- Illa Font, C.H.; Siqueira, H.V.; Machado Neto, J.E.; Santos, J.L.F.d.; Stevan, S.L., Jr.; Converti, A.; Corrêa, F.C. Second life of lithium-ion batteries of electric vehicles: A short review and perspectives. Energies 2023, 16, 953. [Google Scholar] [CrossRef]
- Tong, S.; Fung, T.; Klein, M.P.; Weisbach, D.A.; Park, J.W. Demonstration of reusing electric vehicle battery for solar energy storage and demand side management. J. Energy Storage 2017, 11, 200–210. [Google Scholar] [CrossRef]
- Li, J.; Wang, Y.; Tan, X. Research on the classification method for the secondary uses of retired lithium-ion traction batteries. Energy Procedia 2017, 105, 2843–2849. [Google Scholar] [CrossRef]
- Wang, L.; Pan, C.; Liu, L.; Cheng, Y.; Zhao, X. On-board state of health estimation of LiFePO4 battery pack through differential voltage analysis. Appl. Energy 2016, 168, 465–472. [Google Scholar] [CrossRef]
- Neigum, K.; Wang, Z. Technology, economic, and environmental analysis of second-life batteries as stationary energy storage: A review. J. Energy Storage 2024, 103, 114393. [Google Scholar] [CrossRef]
- Baghadadi, I.; Briat, O.; Hyan, P.; Vinassa, J.M. State of health assessment for lithium batteries based on voltage-time relaxation measure. Electrochim. Acta 2016, 194, 461–472. [Google Scholar] [CrossRef]
- Hu, X.; Feng, F.; Liu, K.; Zhang, L. State estimation for advanced battery management: Key challenges and future trends. Renew. Sustain. Energy Rev. 2019, 114, 109334. [Google Scholar] [CrossRef]
- Waag, W.; Kabitz, S.; Sauer, D. Experimental investigation of the lithium-ion battery impedance characteristic at various conditions and aging states and its influence on the application. Appl. Energy 2013, 102, 885–897. [Google Scholar] [CrossRef]
- Li, X.; Wang, Z.; Yan, J. Prognostic health condition for lithium battery using the partial incremental capacity and Gaussian process regression. J. Power Sources 2019, 421, 56–67. [Google Scholar] [CrossRef]
- Kostenko, G.; Zaporozhets, A. Enhancing the power system resilience through the application of micro power systems (microgrid) with renewable distributed generation. Syst. Res. Energy 2023, 3, 25–38. [Google Scholar] [CrossRef]
- Kostenko, G. Cluster-based deployment of second-life EV batteries for reliable and sustainable backup power solution in power systems. Syst. Res. Energy 2025, 1, 40–60. [Google Scholar] [CrossRef]
- Denysov, V.; Kostenko, G.; Babak, V.; Shulzhenko, S.; Zaporozhets, A. Accounting the forecasting stochasticity at the power system modes optimization. In Systems, Decision and Control in Energy V; Zaporozhets, A., Ed.; Studies in Systems, Decision and Control; Springer: Cham, Switzerland, 2023; Volume 481. [Google Scholar] [CrossRef]
- Han, X.; Liang, Y.; Ai, Y.; Li, J. Economic evaluation of a PV combined energy storage charging station based on cost estimation of second-use batteries. Energy 2018, 165, 326–339. [Google Scholar] [CrossRef]
- Bai, B.; Xiong, S.; Song, B.; Xiaoming, M. Economic analysis of distributed solar photovoltaics with reused electric vehicle batteries as energy storage systems in China. Renew. Sustain. Energy Rev. 2019, 109, 213–229. [Google Scholar] [CrossRef]
- Madlener, R.; Kirmas, A. Economic viability of second use electric vehicle batteries for energy storage in residential applications. Energy Procedia 2017, 105, 3806–3815. [Google Scholar] [CrossRef]
- Sun, S.I.; Chipperfield, A.J.; Kiaee, M.; Wills, R.G.A. Effects of market dynamics on the time-evolving price of second-life electric vehicle batteries. J. Energy Storage 2018, 19, 41–51. [Google Scholar] [CrossRef]
- Song, Z.; Feng, S.; Zhang, L.; Hu, Z.; Hu, X.; Yao, R. Economy analysis of second-life battery in wind power systems considering battery degradation in dynamic processes: Real case scenarios. Appl. Energy 2019, 251, 113411. [Google Scholar] [CrossRef]
- Katwala, A.; The spiralling environmental cost of our lithium battery addiction. WIRED U.K., December 2018. Available online: https://www.wired.co.uk/article/lithium-batteries-environment-impact (accessed on 15 April 2025).
- Kuki, Á.; Lakatos, C.; Nagy, L.; Nagy, T.; Kéki, S. Energy use and environmental impact of three lithium-ion battery factories with a total annual capacity of 100 GWh. Environments 2025, 12, 24. [Google Scholar] [CrossRef]
- Kim, H.C.; Wallington, T.J.; Arsenault, R.; Bae, C.; Ahn, S.; Lee, J. Cradle-to-Gate Emissions from a Commercial Electric Vehicle Li-Ion Battery: A Comparative Analysis. Environmental Science & Technology 2016, 50, 7715–7722. [Google Scholar] [CrossRef]
- Lyu, W.; Hu, Y.; Liu, J.; Chen, K.; Liu, P.; Deng, J.; Zhang, S. Impact of battery electric vehicle usage on air quality in three Chinese first-tier cities. Sci. Rep. 2024, 14, 1. [Google Scholar] [CrossRef]
- Rossi, F.; Tosti, L.; Basosi, R.; Cusenza, M.A.; Parisi, M.L.; Sinicropi, A. Environmental optimization model for the European batteries industry based on prospective life cycle assessment and material flow analysis. Renew. Sustain. Energy Rev. 2023, 183, 113485. [Google Scholar] [CrossRef]
- Cox, B.; Mutel, C.L.; Bauer, C.; Mendoza Beltran, A.; van Vuuren, D.P. Uncertain environmental footprint of current and future battery electric vehicles. Environ. Sci. Technol. 2018, 52, 4989–4995. [Google Scholar] [CrossRef] [PubMed]
- Dunn, J.B.; Gaines, L.; Kelly, J.C.; James, C.; Gallagher, K.G. The significance of Li-ion batteries in electric vehicle life-cycle energy and emissions and recycling's role in its reduction. Energy Environ. Sci. 2015, 8, 158–168. [Google Scholar] [CrossRef]
- Picatoste, A.; Justel, D.; Mendoza, J.M.F. Analysing repurposing solutions for electric vehicle batteries: Circularity indicators, LCA and methodological guidelines. 2023. https://www.researchgate.net/profile/Aitor-Picatoste/publication/373993858_Analysing_repurposing_solutions_for_electric_vehicle_batteries_circularity_indicators_LCA_and_methodological_guidelines/links/650828759fdf0c69dfd9193d/Analysing-repurposing-solutions-for-electric-vehicle-batteries-circularity-indicators-LCA-and-methodological-guidelines.pdf. (accessed on 10 May 2025).
- Bekaert, E.; Second life batteries for a sustainable energy transition. CIC energiGUNE, 5 October 2021. Available online: https://cicenergigune.com/en/blog/second-life-batteries-sustainable-energy-transition (accessed on 10 May 2025).
- Zaporozhets, A.; Kostenko, G.; Zgurovets, O. Preconditions and main features of electric vehicles application for frequency regulation in the power system. In Proceedings of the 3rd International Workshop on Information Technologies: Theoretical and Applied Problems (ITTAP 2023), Kryvyi Rih, Ukraine; CEUR Workshop Proceedings, 3628, 43–54. Available online: https: //ceur-ws.org/Vol-/paper4.pdf (accessed on 10 May 2025), 2023. Available online: https://ceur-ws.org/Vol-3628/paper4.pdf (accessed on 10 May 2025).
- Shpak, N. , Muzychenko-Kozlovska, O., Gvozd, M., Sorochak, O. (2025). Assessment of the Investment and Innovation Environmental Attractiveness of the Country: On the Example of Ukraine. In: Babak, V., Zaporozhets, A. (eds) Systems, Decision and Control in Energy VII. Studies in Systems, Decision and Control, vol 595. Springer, Cham. [CrossRef]
- Babak, V.; Nikitin, Y.; Teslenko, O. Holistic approach to the systemic transformation of the electric power industry, district heating and municipal infrastructure. Syst. Res. Energy 2024, 4, 6–25. [Google Scholar] [CrossRef]
- Kostenko, G.; Zgurovets, O. Current state and prospects for development of renewable distributed generation in Ukraine. Syst. Res. Energy 2023, 2, 4–17. [Google Scholar] [CrossRef]
- Zaichenko, S. , Trachuk, A. (2025). Methodology for Modeling Selected Structural Components of Renewable Energy Sources in Ukraine and Assessment of Their Resources and Energy Conversion Technologies. In: Babak, V., Zaporozhets, A. (eds) Systems, Decision and Control in Energy VII. Studies in Systems, Decision and Control, vol 595. Springer, Cham. [CrossRef]
- Zaporozhets, A.; Babak, V.; Kulyk, M.; Denysov, V. Novel Methodology for Determining Necessary and Sufficient Power in Integrated Power Systems Based on the Forecasted Volumes of Electricity Production. Electricity 2025, 6, 41. [Google Scholar] [CrossRef]
Figure 1.
Research framework for SLB evaluation using KPI-PDCA.
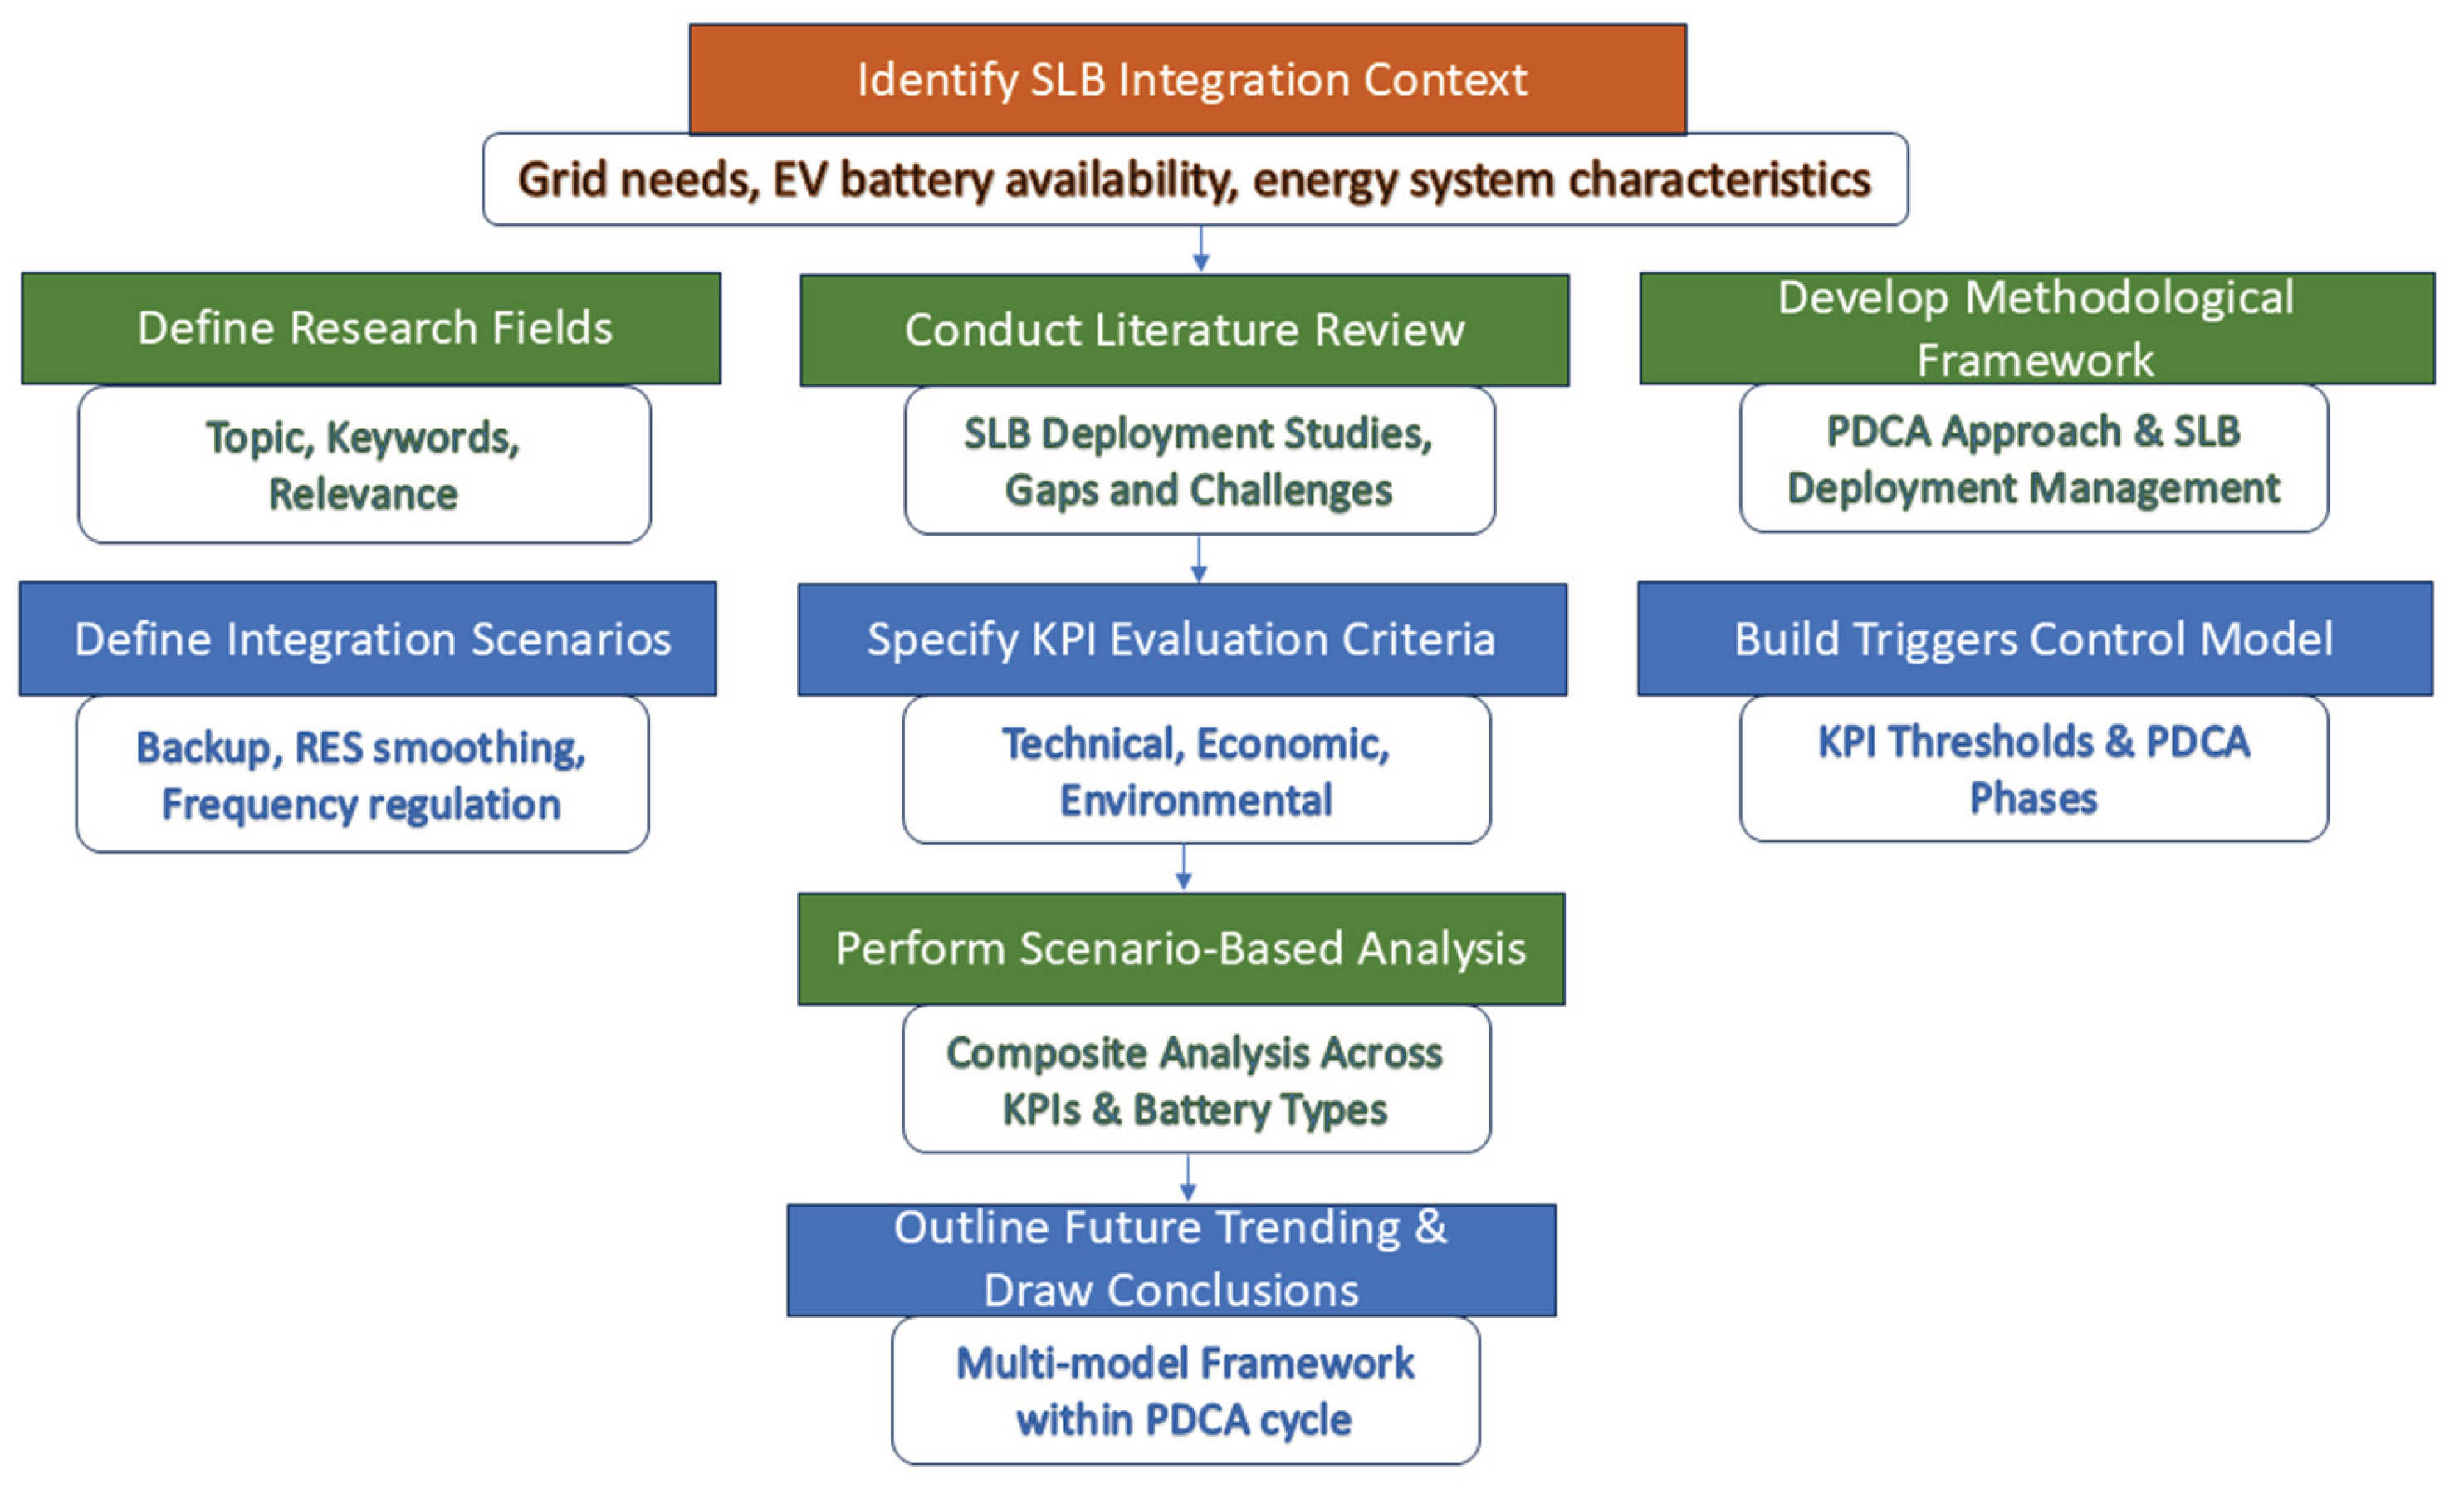
Figure 2.
Overview of bibliometric trends and keyword analysis in SLB-related research (2010-2024), based on Scopus-indexed publications and VOSviewer mapping: (a) Dynamics of the number of scientific publications for 2010-2024; (b) Keywords evolution over time for selected concepts.
Figure 2.
Overview of bibliometric trends and keyword analysis in SLB-related research (2010-2024), based on Scopus-indexed publications and VOSviewer mapping: (a) Dynamics of the number of scientific publications for 2010-2024; (b) Keywords evolution over time for selected concepts.
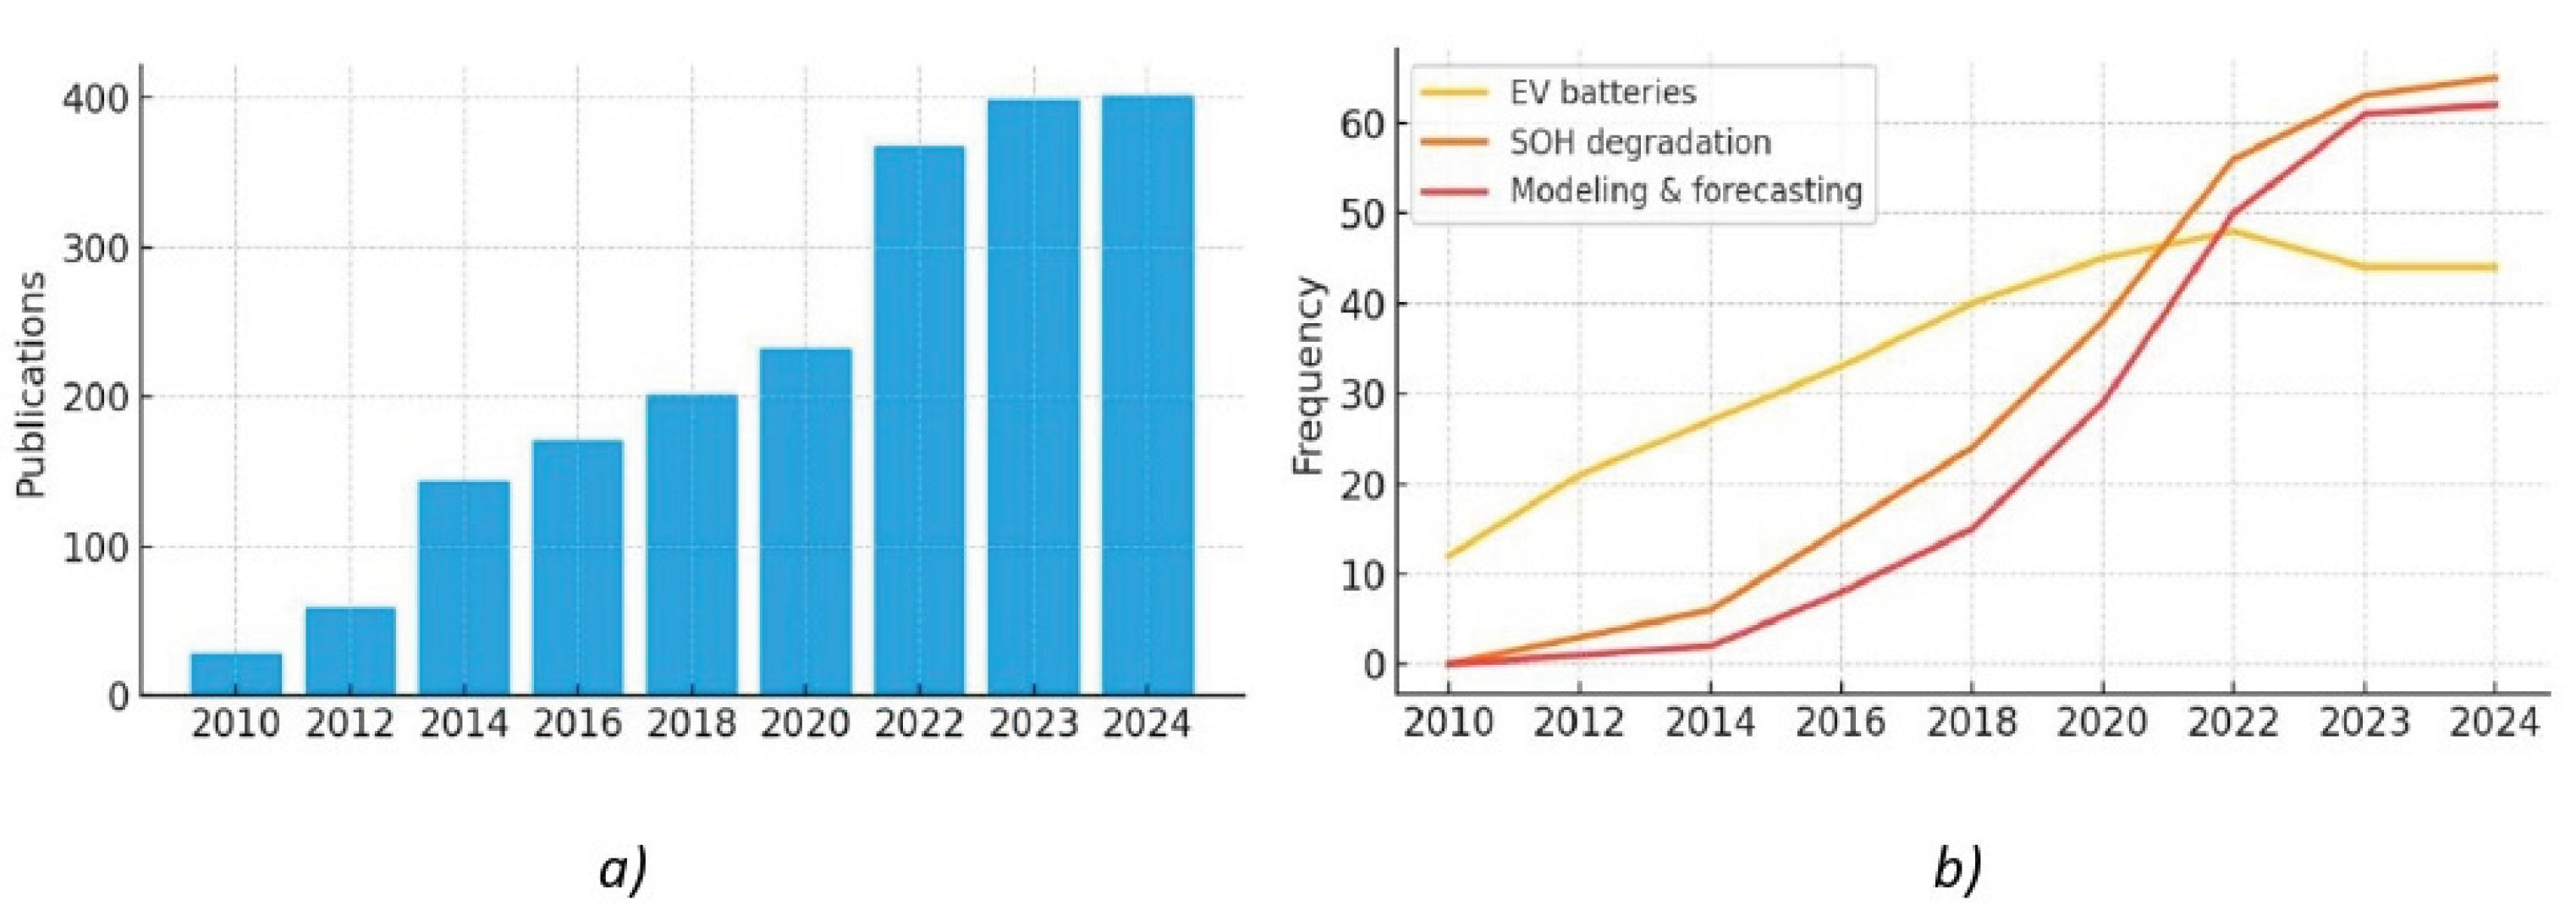
Figure 3.
Co-occurrence network of key terms in the SLB domain (VOSviewer).
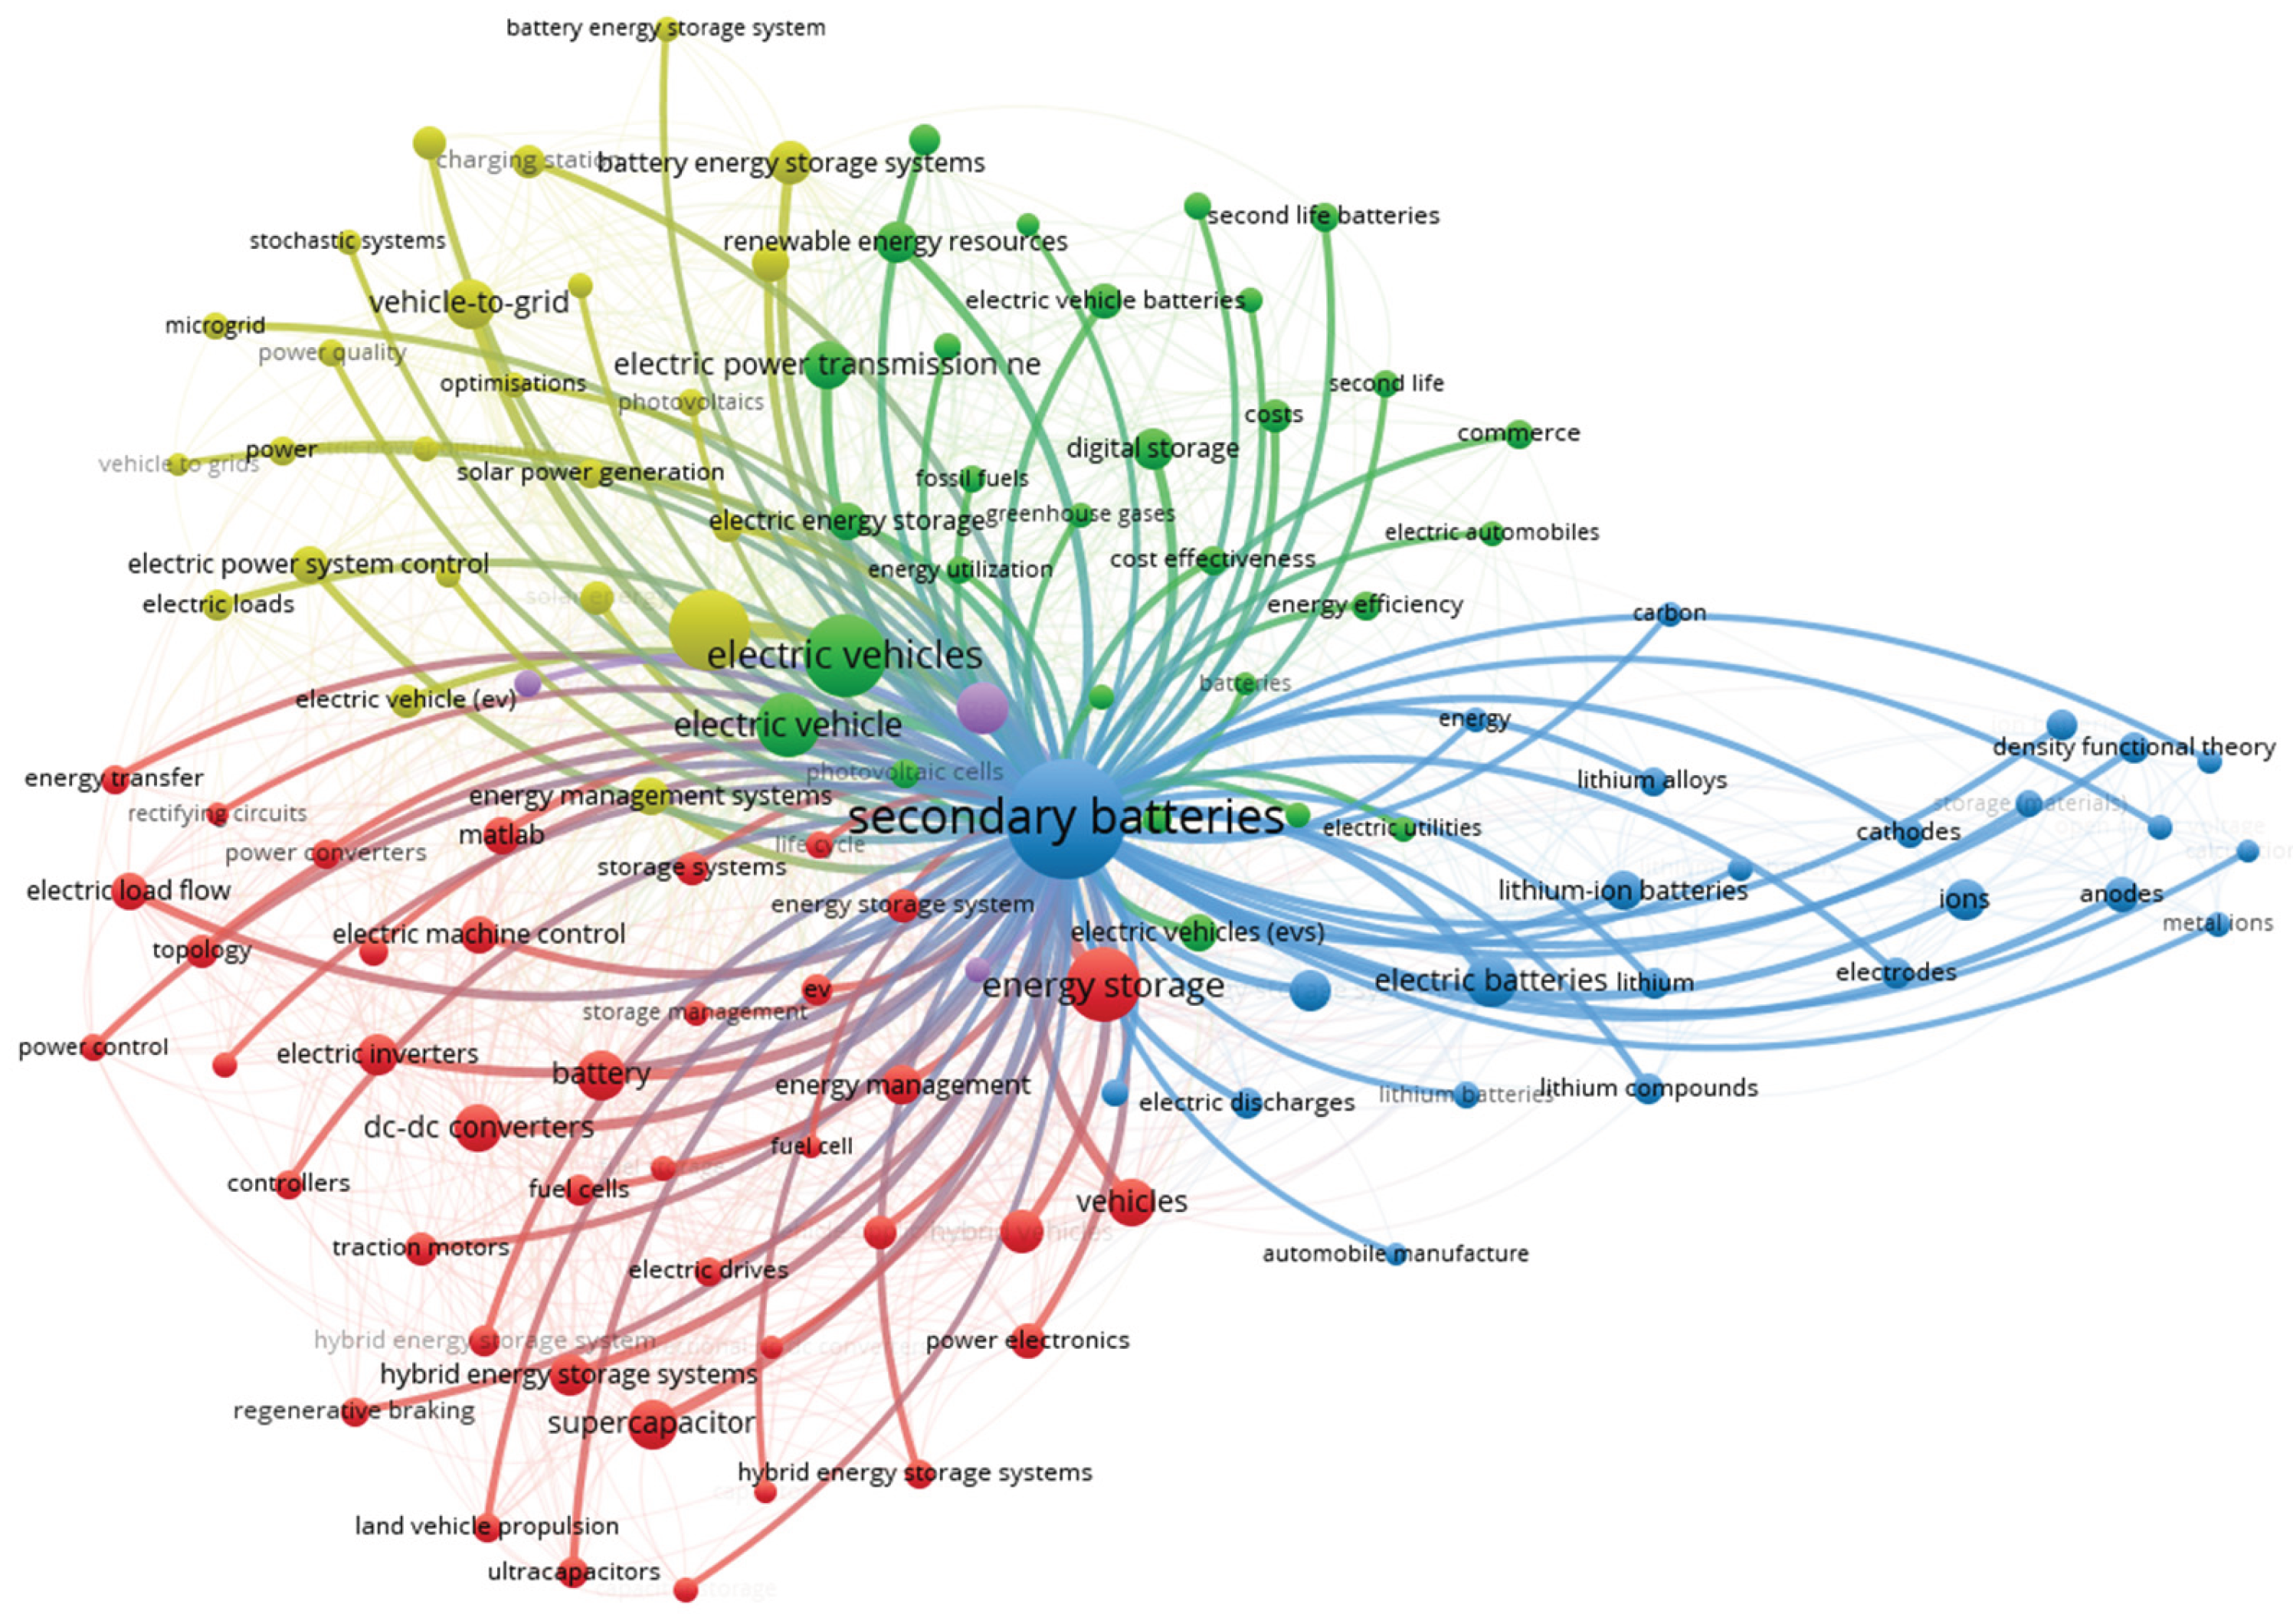
Figure 4.
Temporal trends in key term usage in SLB research of 2019-2024. (VOSviewer).
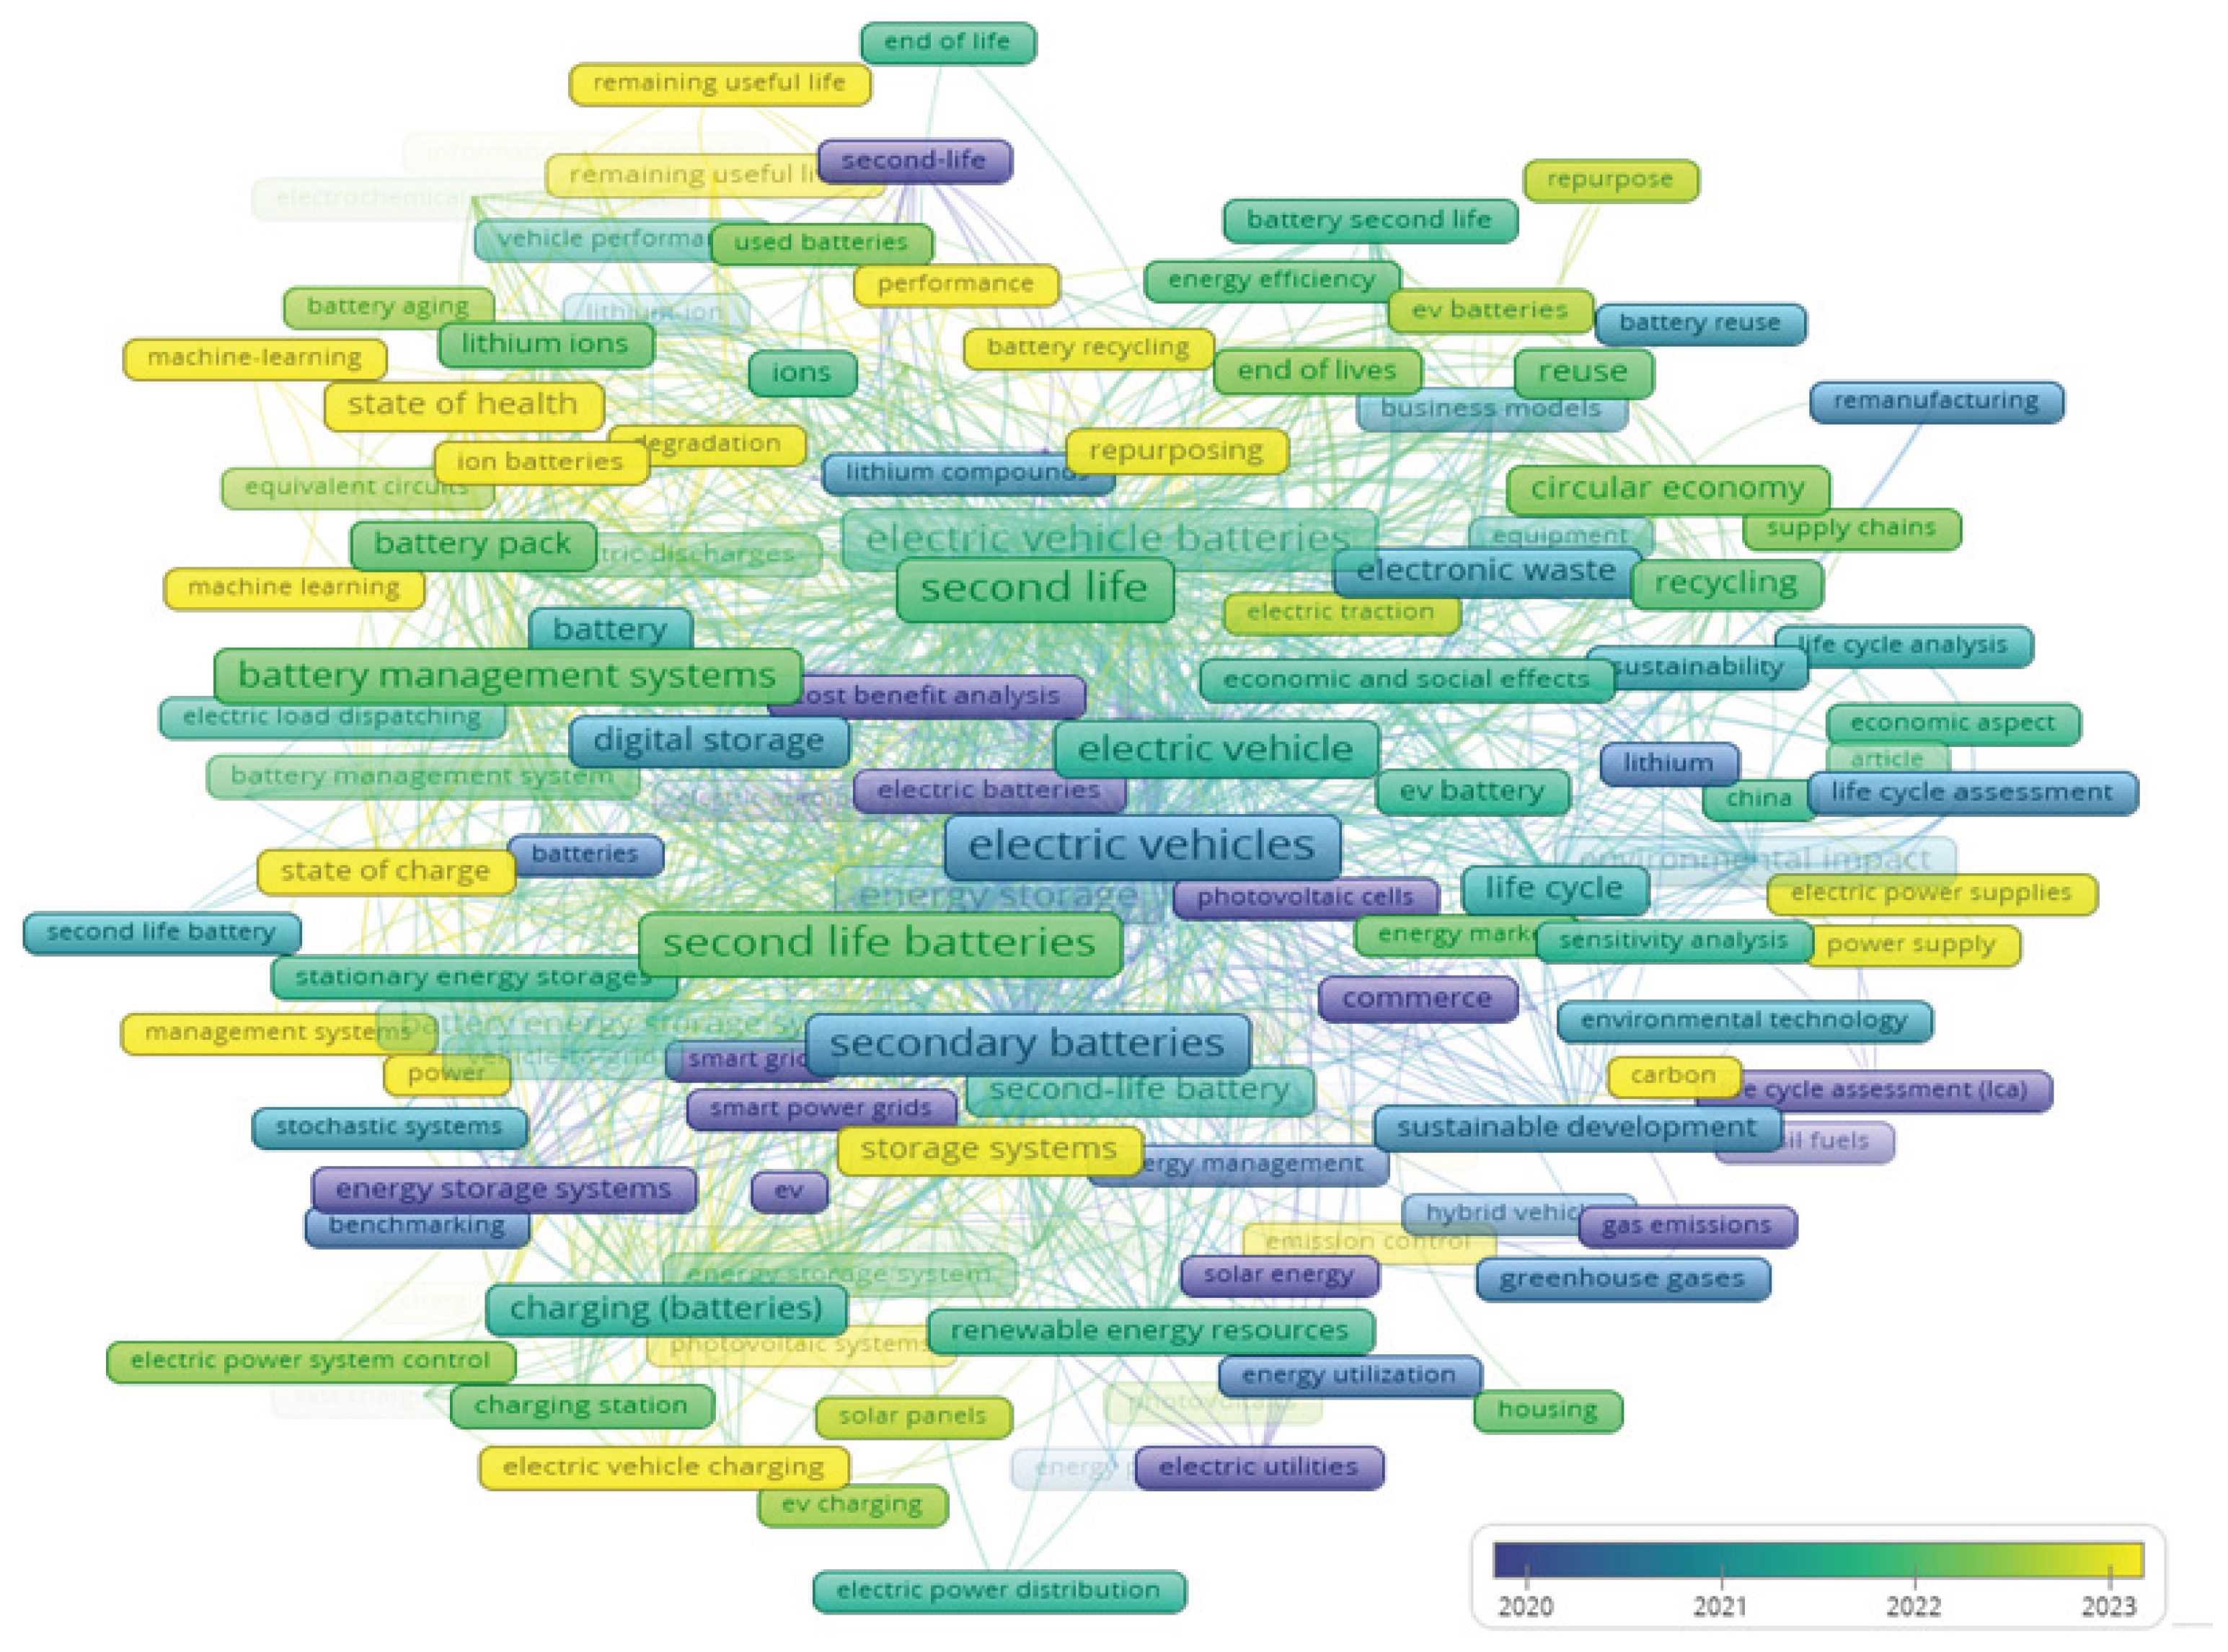
Figure 5.
Conceptual visualization of the PDCA-based management approach for second-life battery (SLB) integration.
Figure 5.
Conceptual visualization of the PDCA-based management approach for second-life battery (SLB) integration.
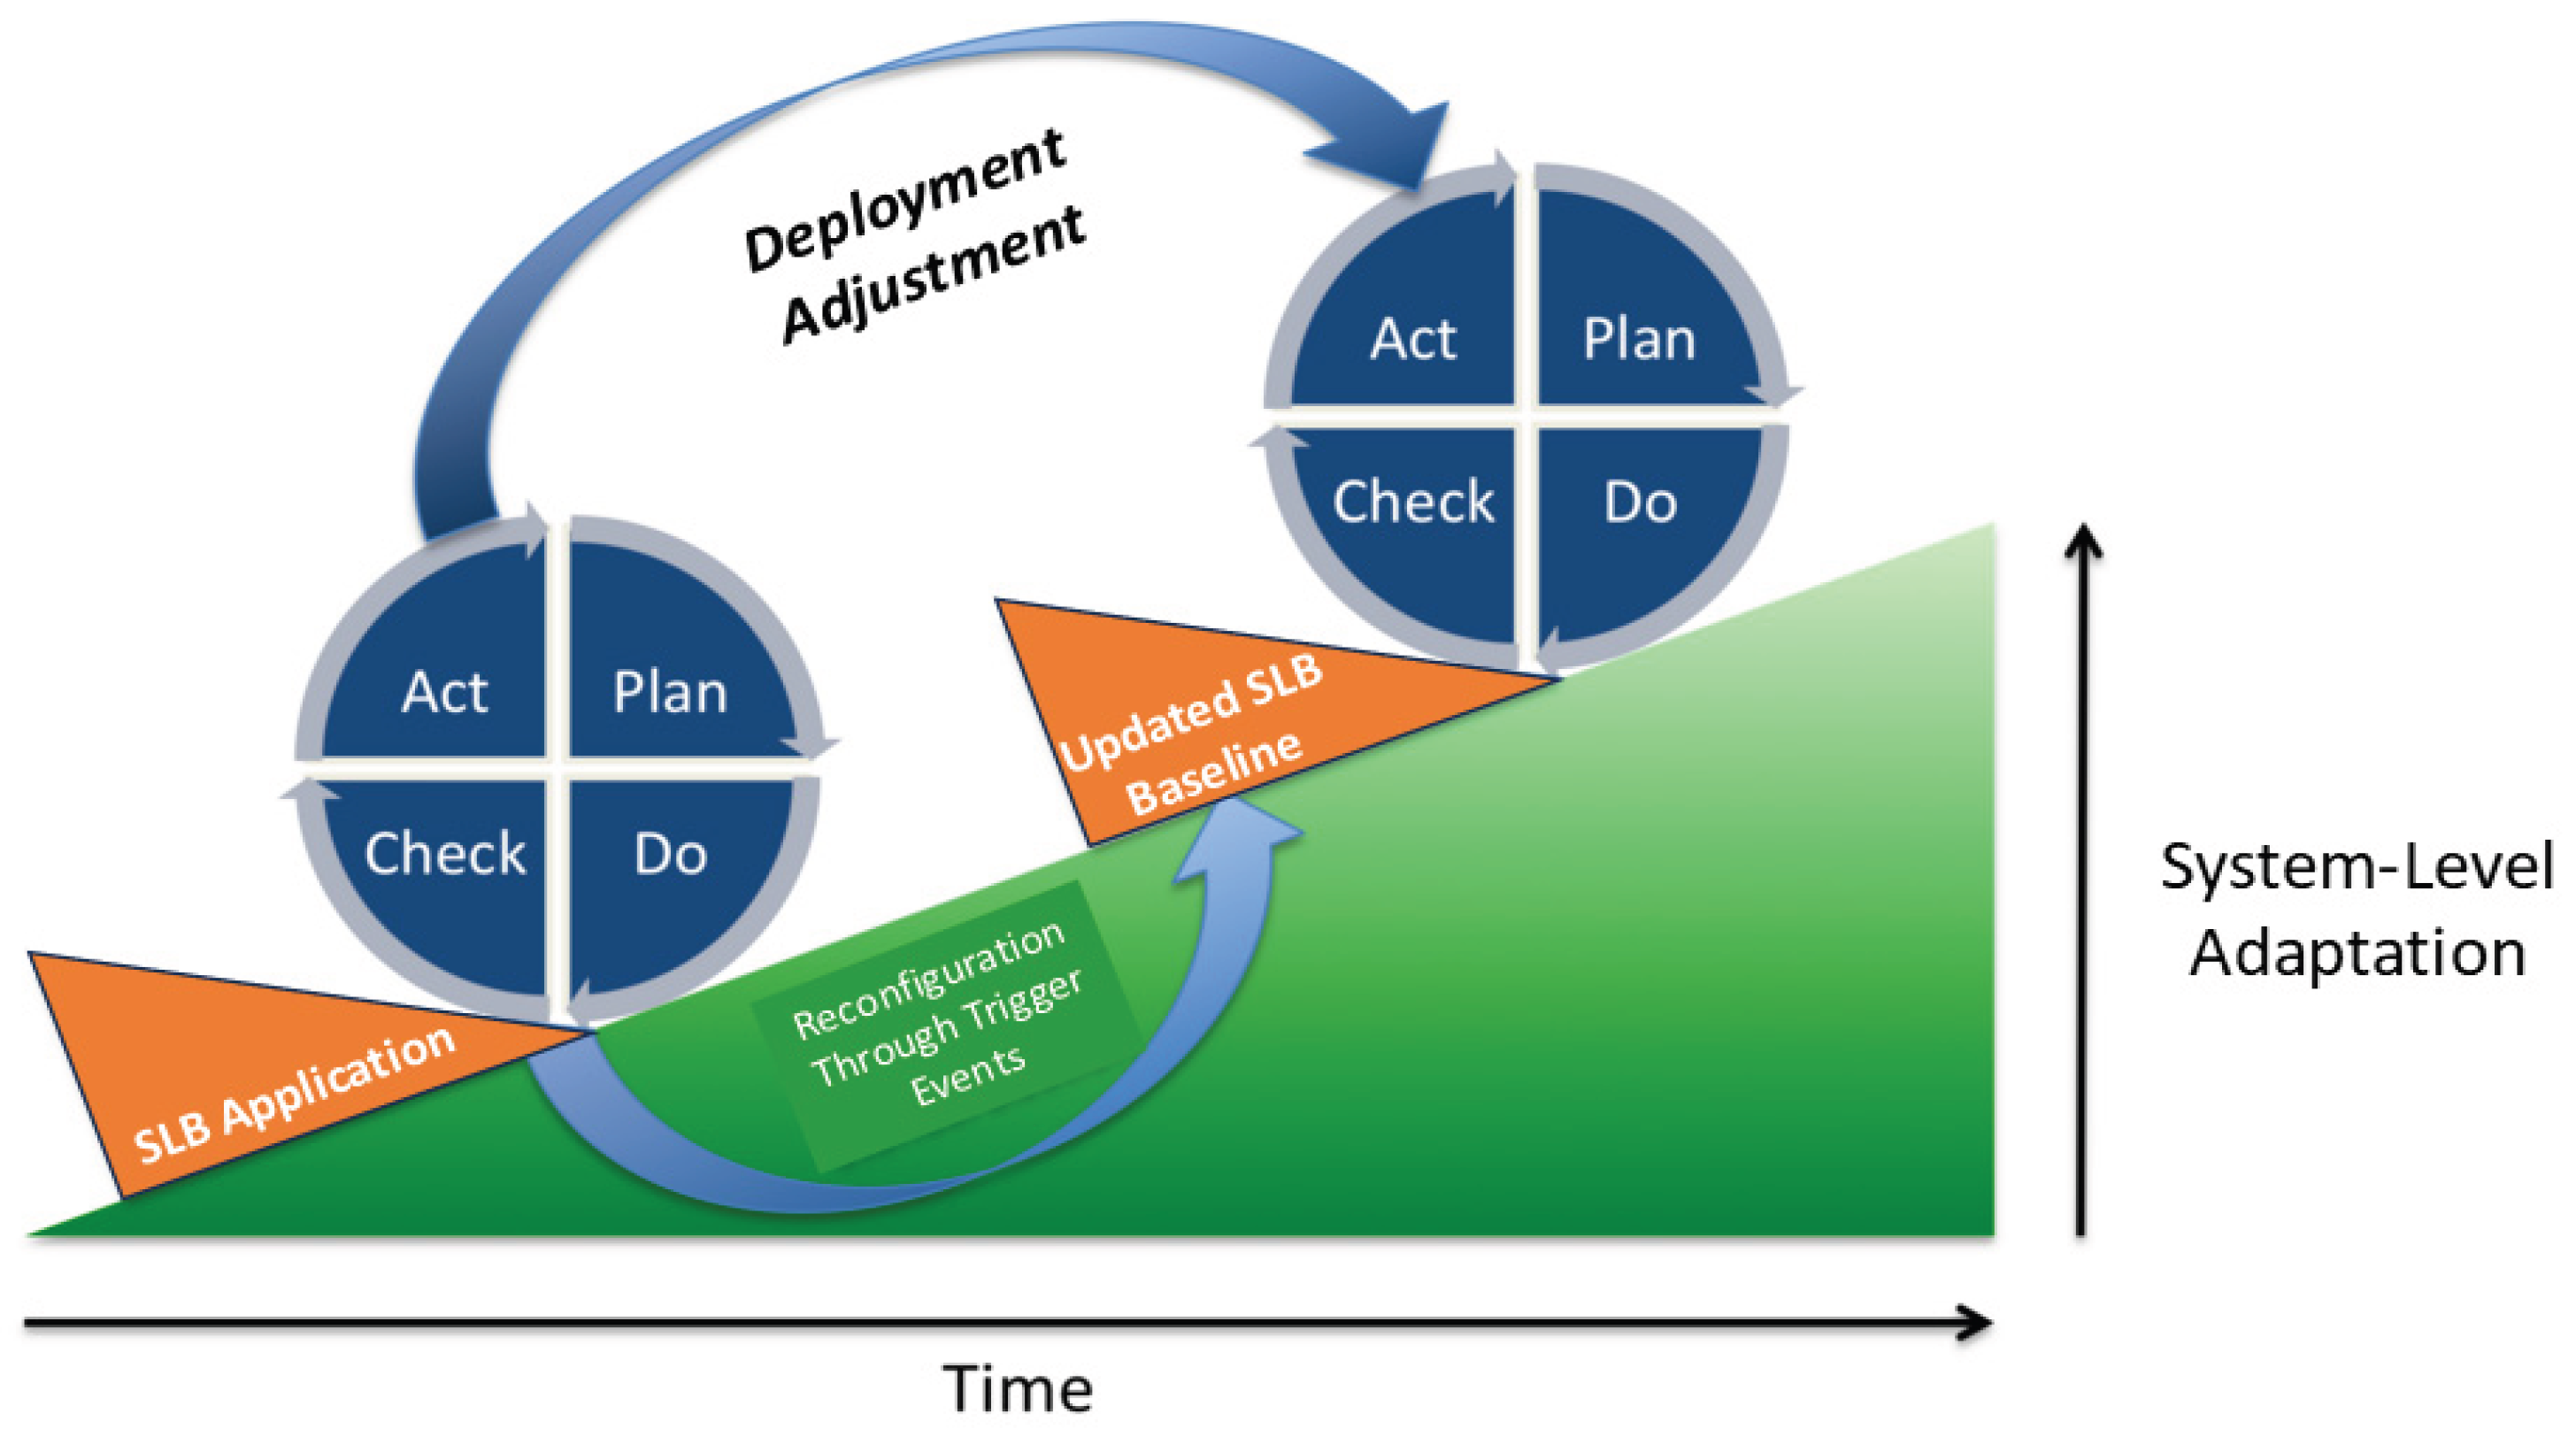
Figure 6.
PDCA cycle adapted for second-life battery (SLB) integration in energy systems.
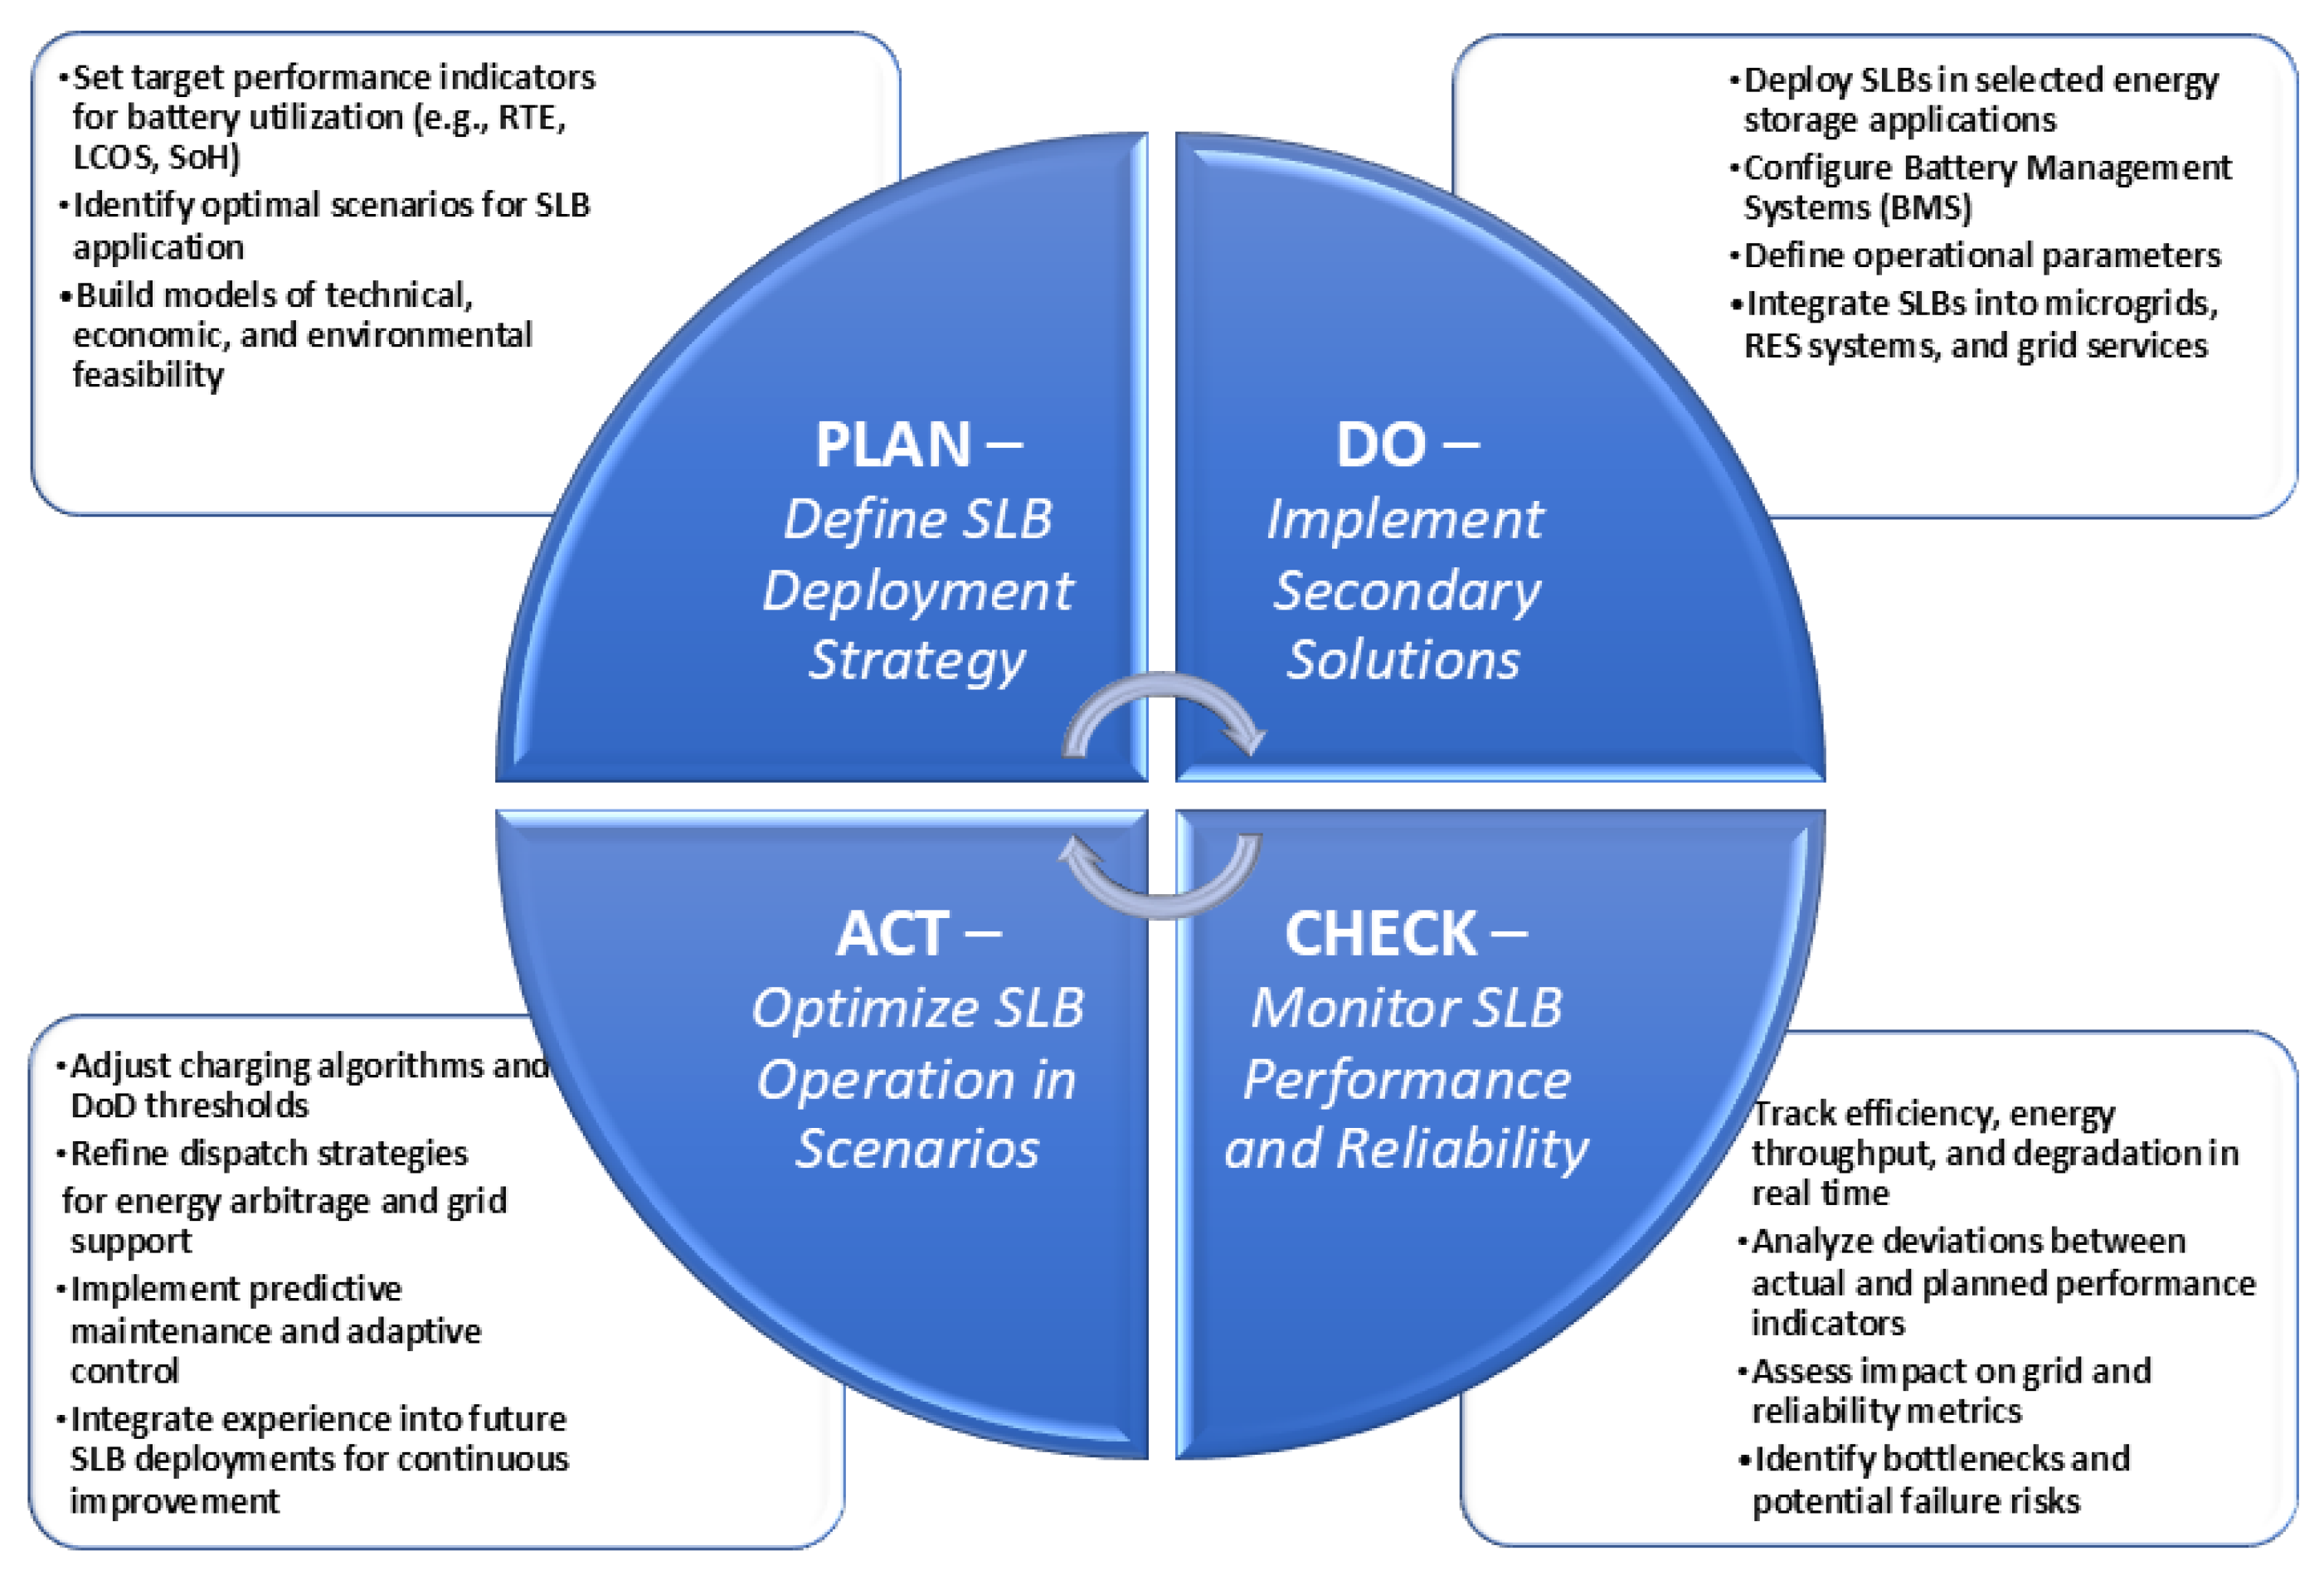
Figure 7.
Technical KPIs for SLB integration within the PDCA framework: (a) Integration of key performance indicators into the Plan–Do–Check–Act (PDCA) cycle for managing second-life batteries; (b) Comparative radar chart of three SLB deployment scenarios based on normalized technical KPI scores.
Figure 7.
Technical KPIs for SLB integration within the PDCA framework: (a) Integration of key performance indicators into the Plan–Do–Check–Act (PDCA) cycle for managing second-life batteries; (b) Comparative radar chart of three SLB deployment scenarios based on normalized technical KPI scores.
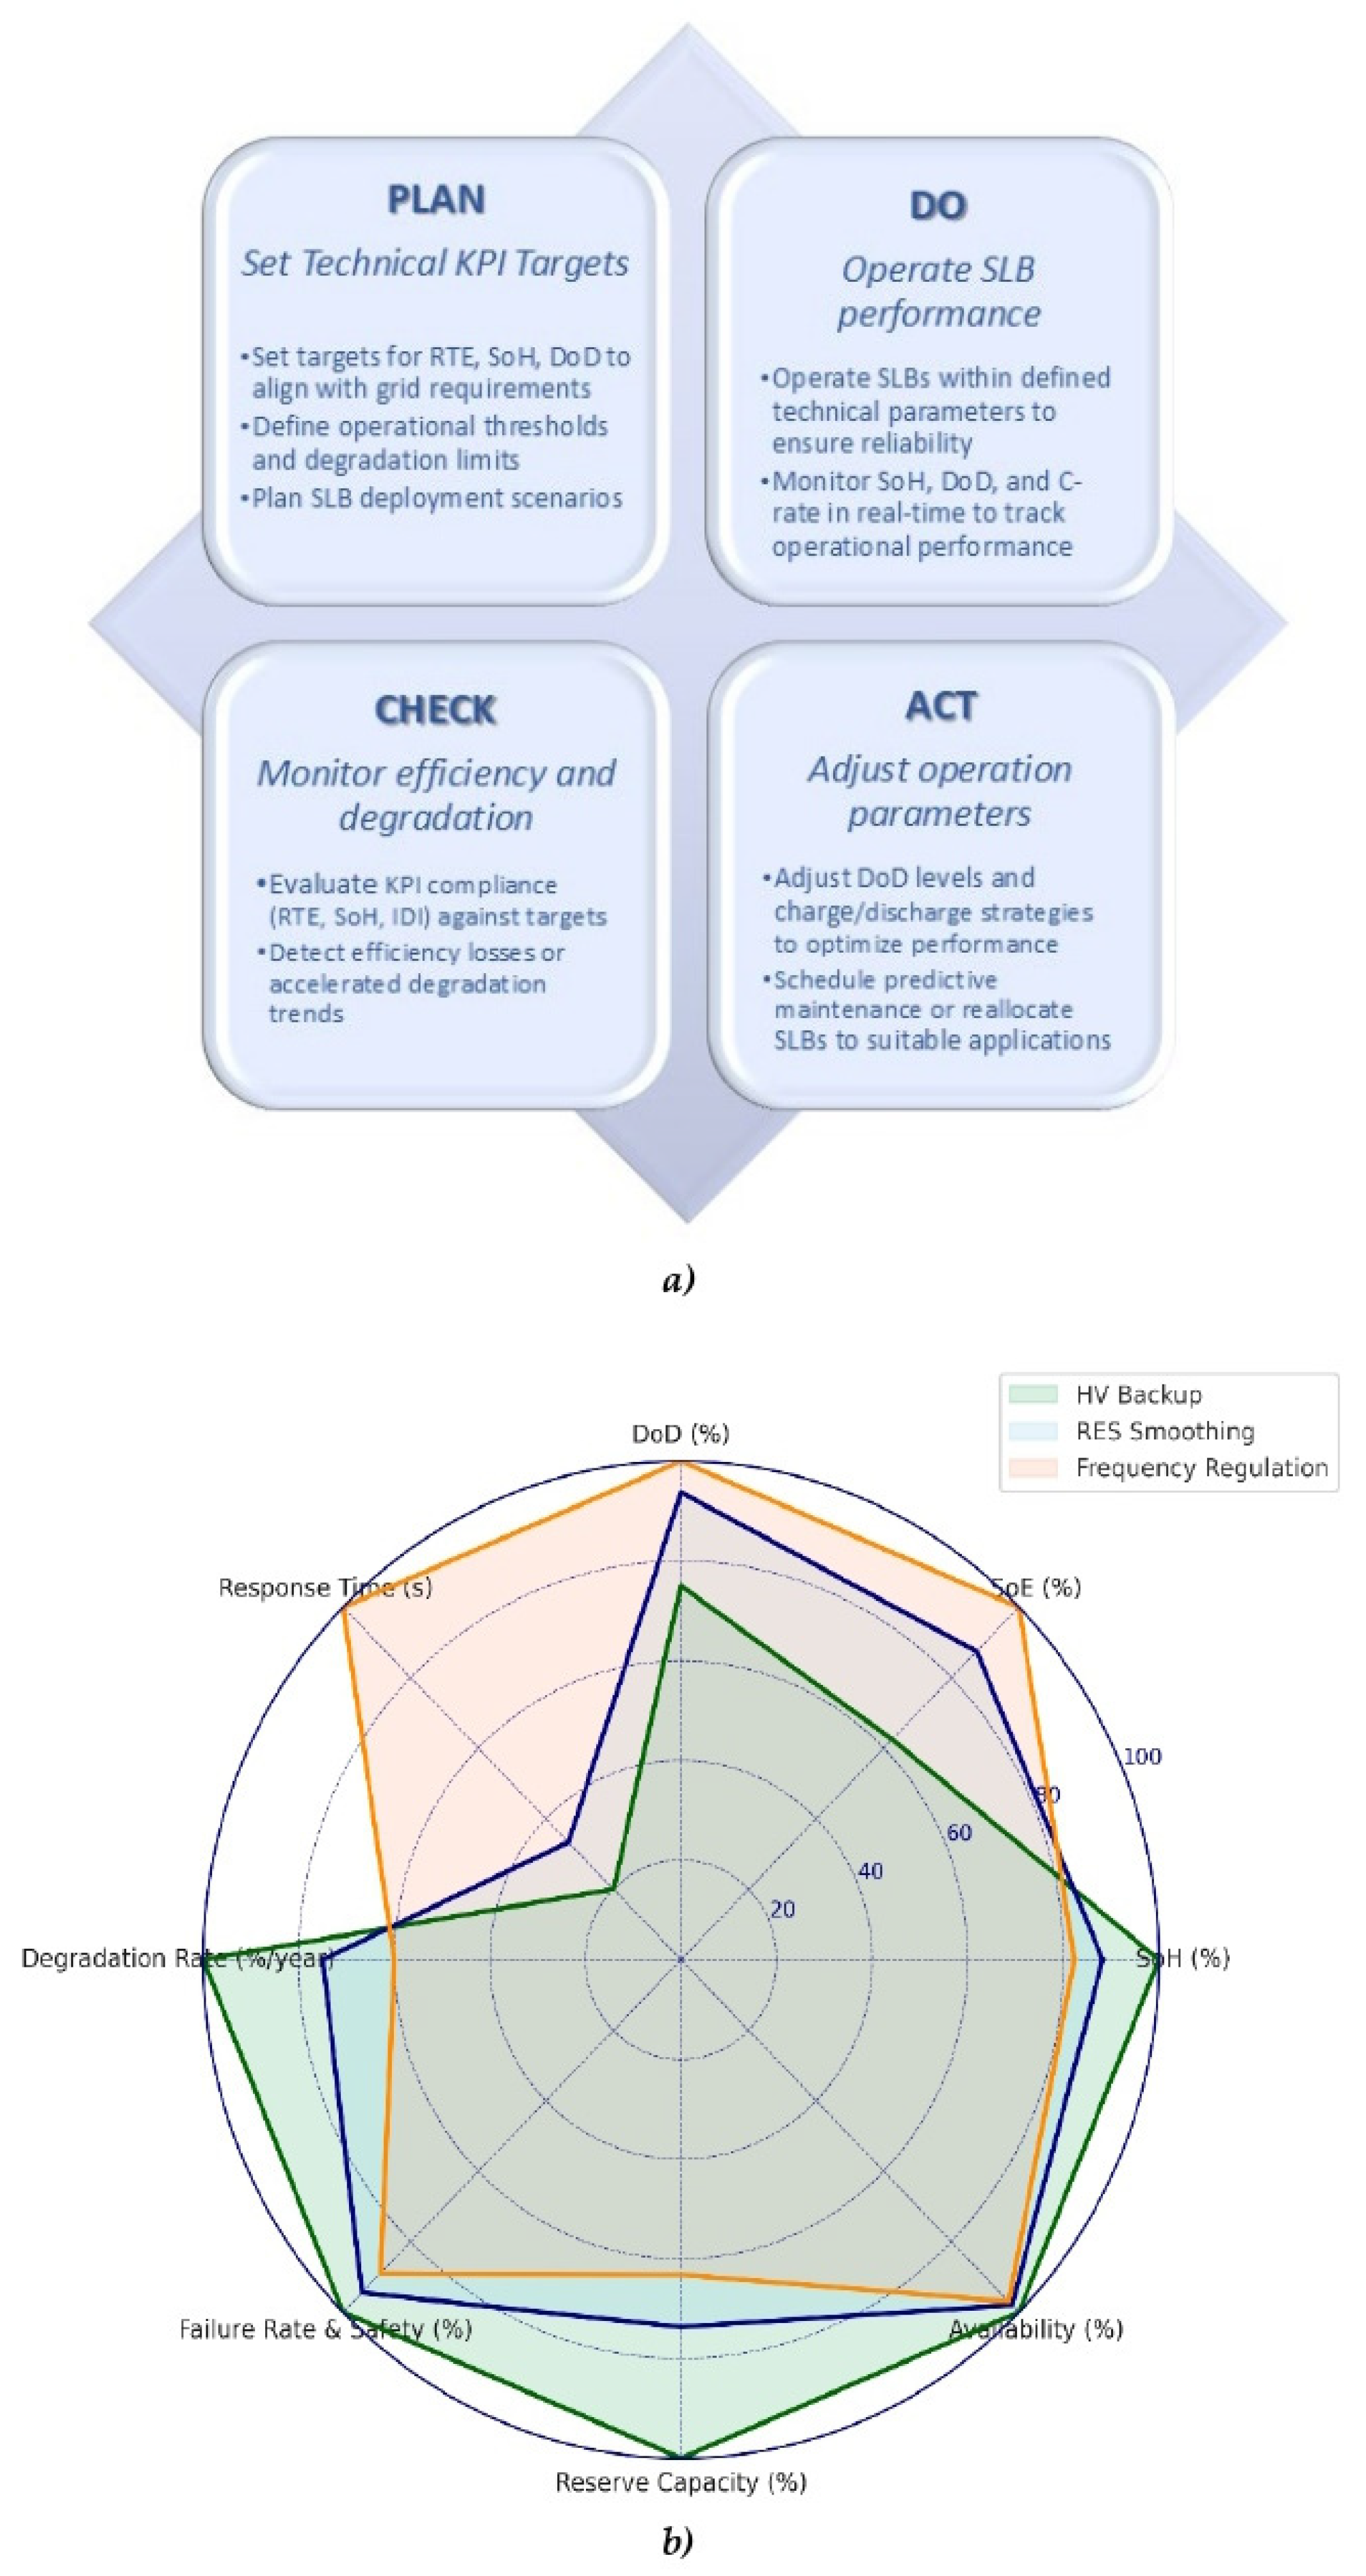
Figure 8.
Economic KPI-driven SLB management within the PDCA framework: (a) Integration of economic performance indicators into the PDCA cycle to support adaptive financial planning and control; (b) Radar chart comparing economic KPIs across three SLB deployment scenarios.
Figure 8.
Economic KPI-driven SLB management within the PDCA framework: (a) Integration of economic performance indicators into the PDCA cycle to support adaptive financial planning and control; (b) Radar chart comparing economic KPIs across three SLB deployment scenarios.
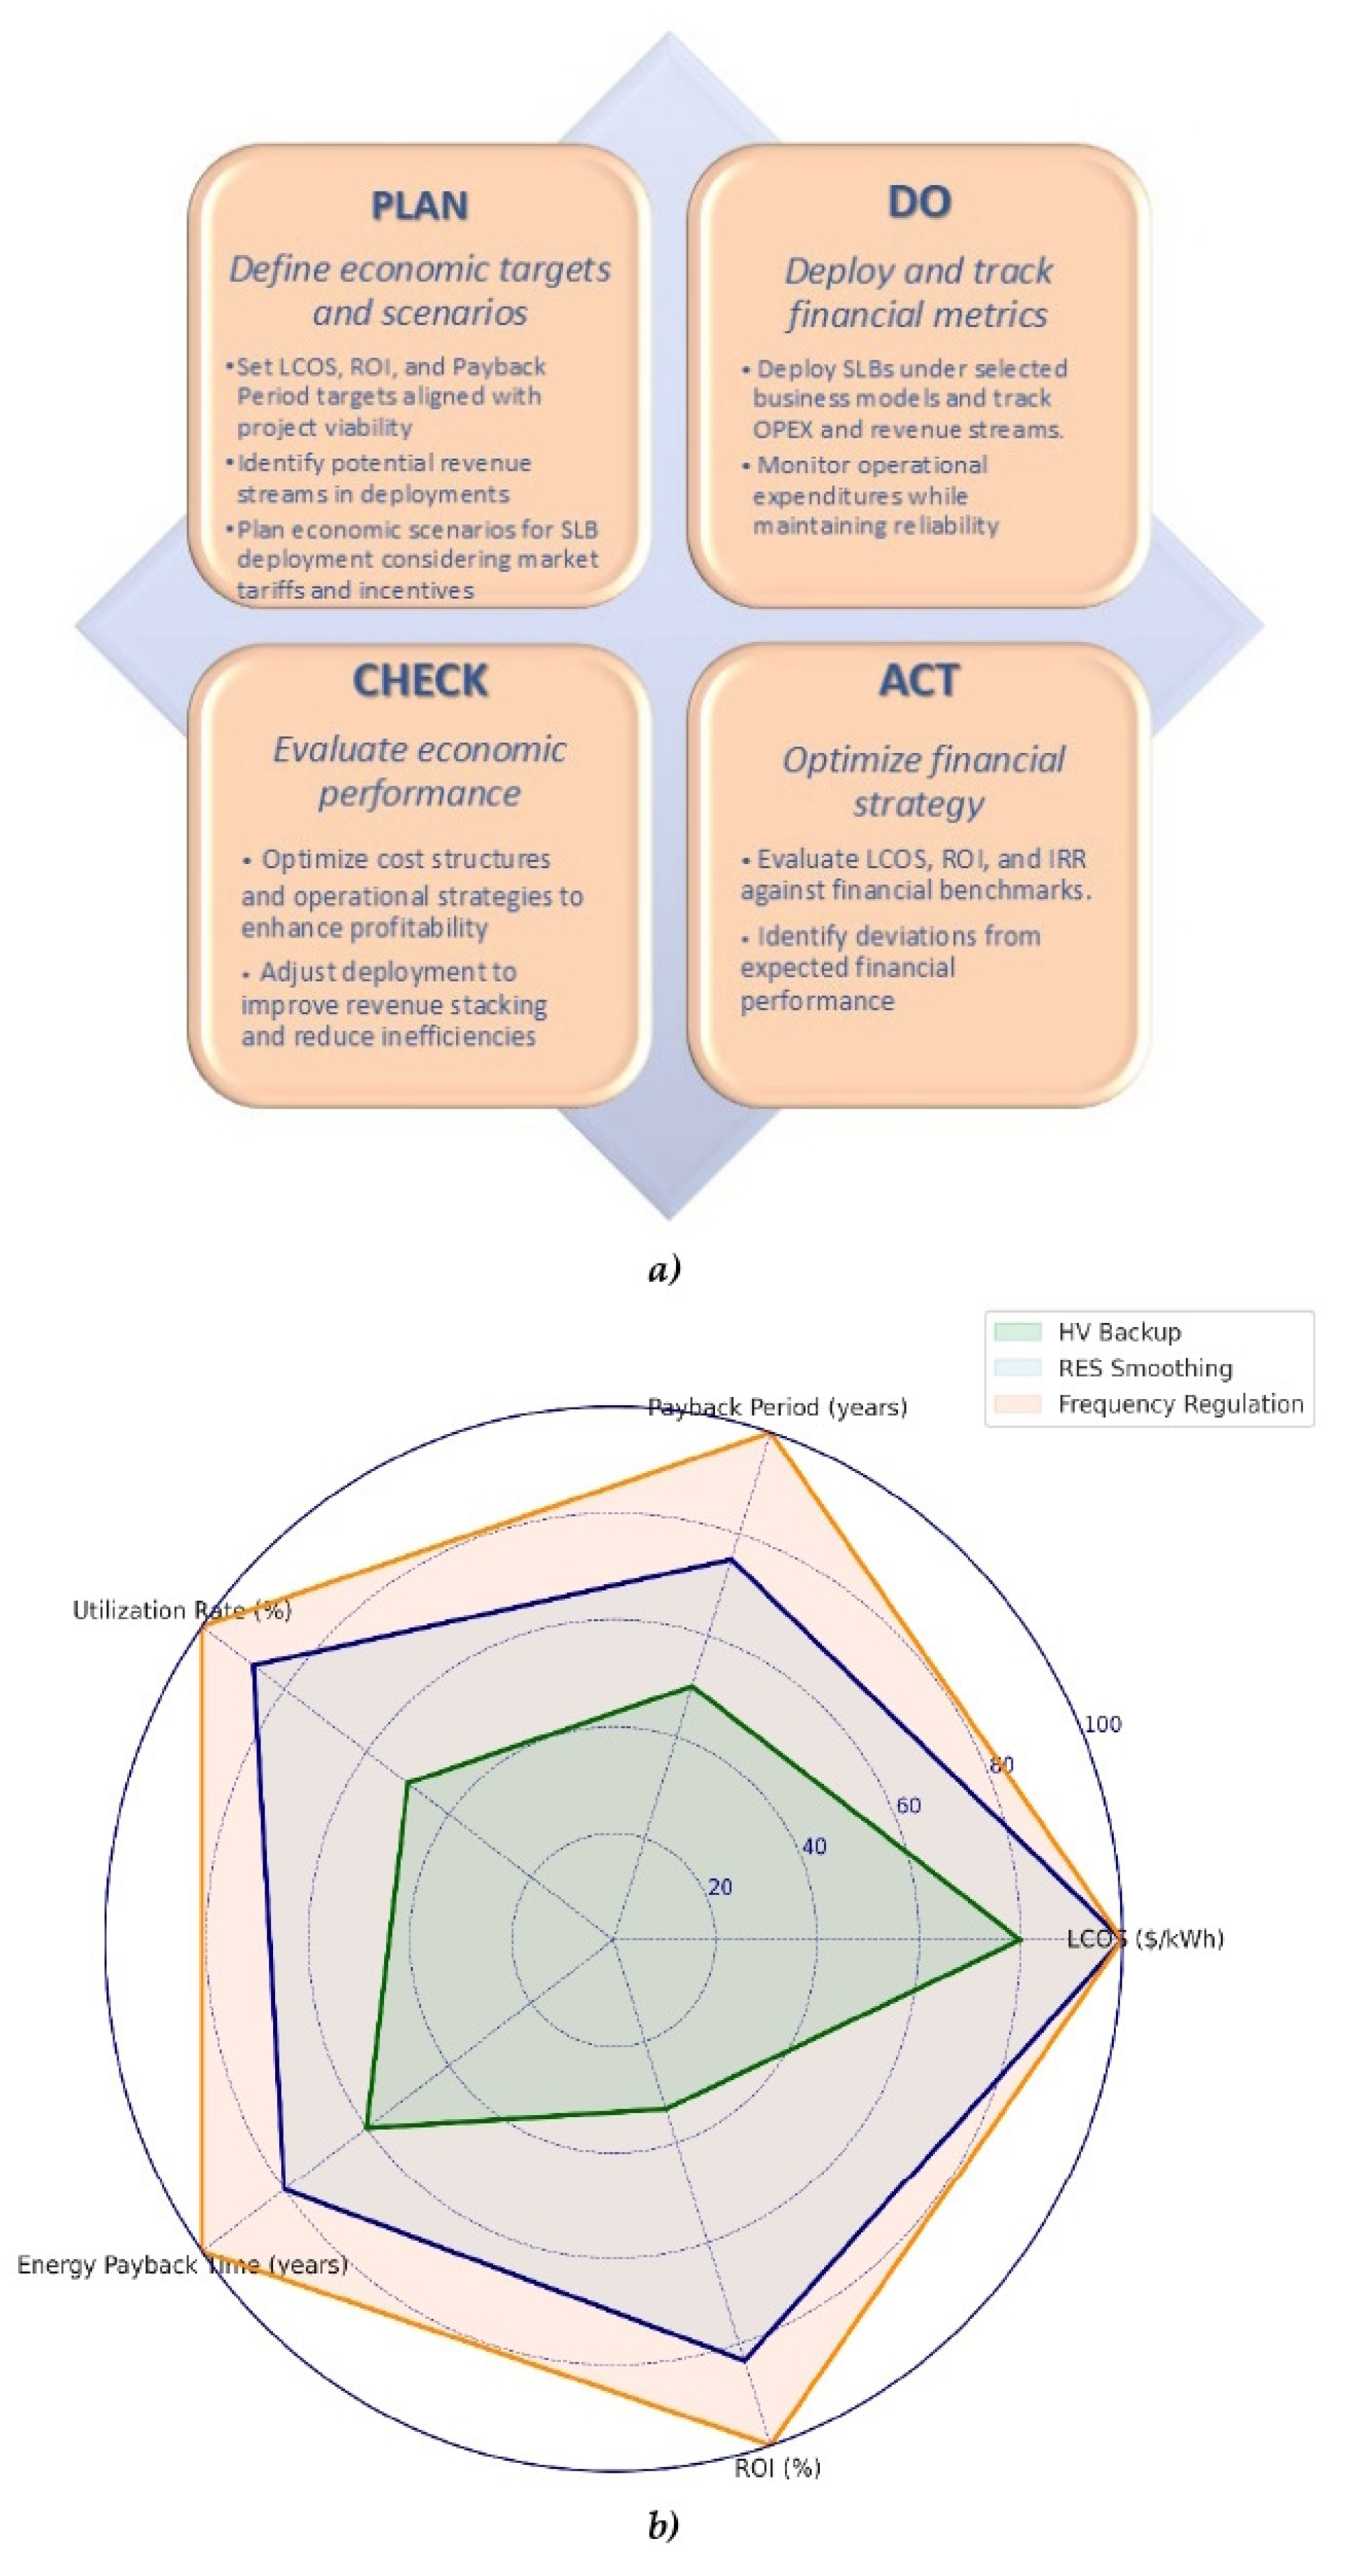
Figure 9.
Environmental KPI integration into the PDCA cycle for SLB sustainability management: (a) PDCA cycle stages applied to environmental goals, emissions tracking, and recyclability planning in SLB operations; (b) Radar comparison of environmental KPIs across SLB deployment scenarios (HV Backup, RES Smoothing, Frequency Regulation), illustrating sustainability performance profiles.
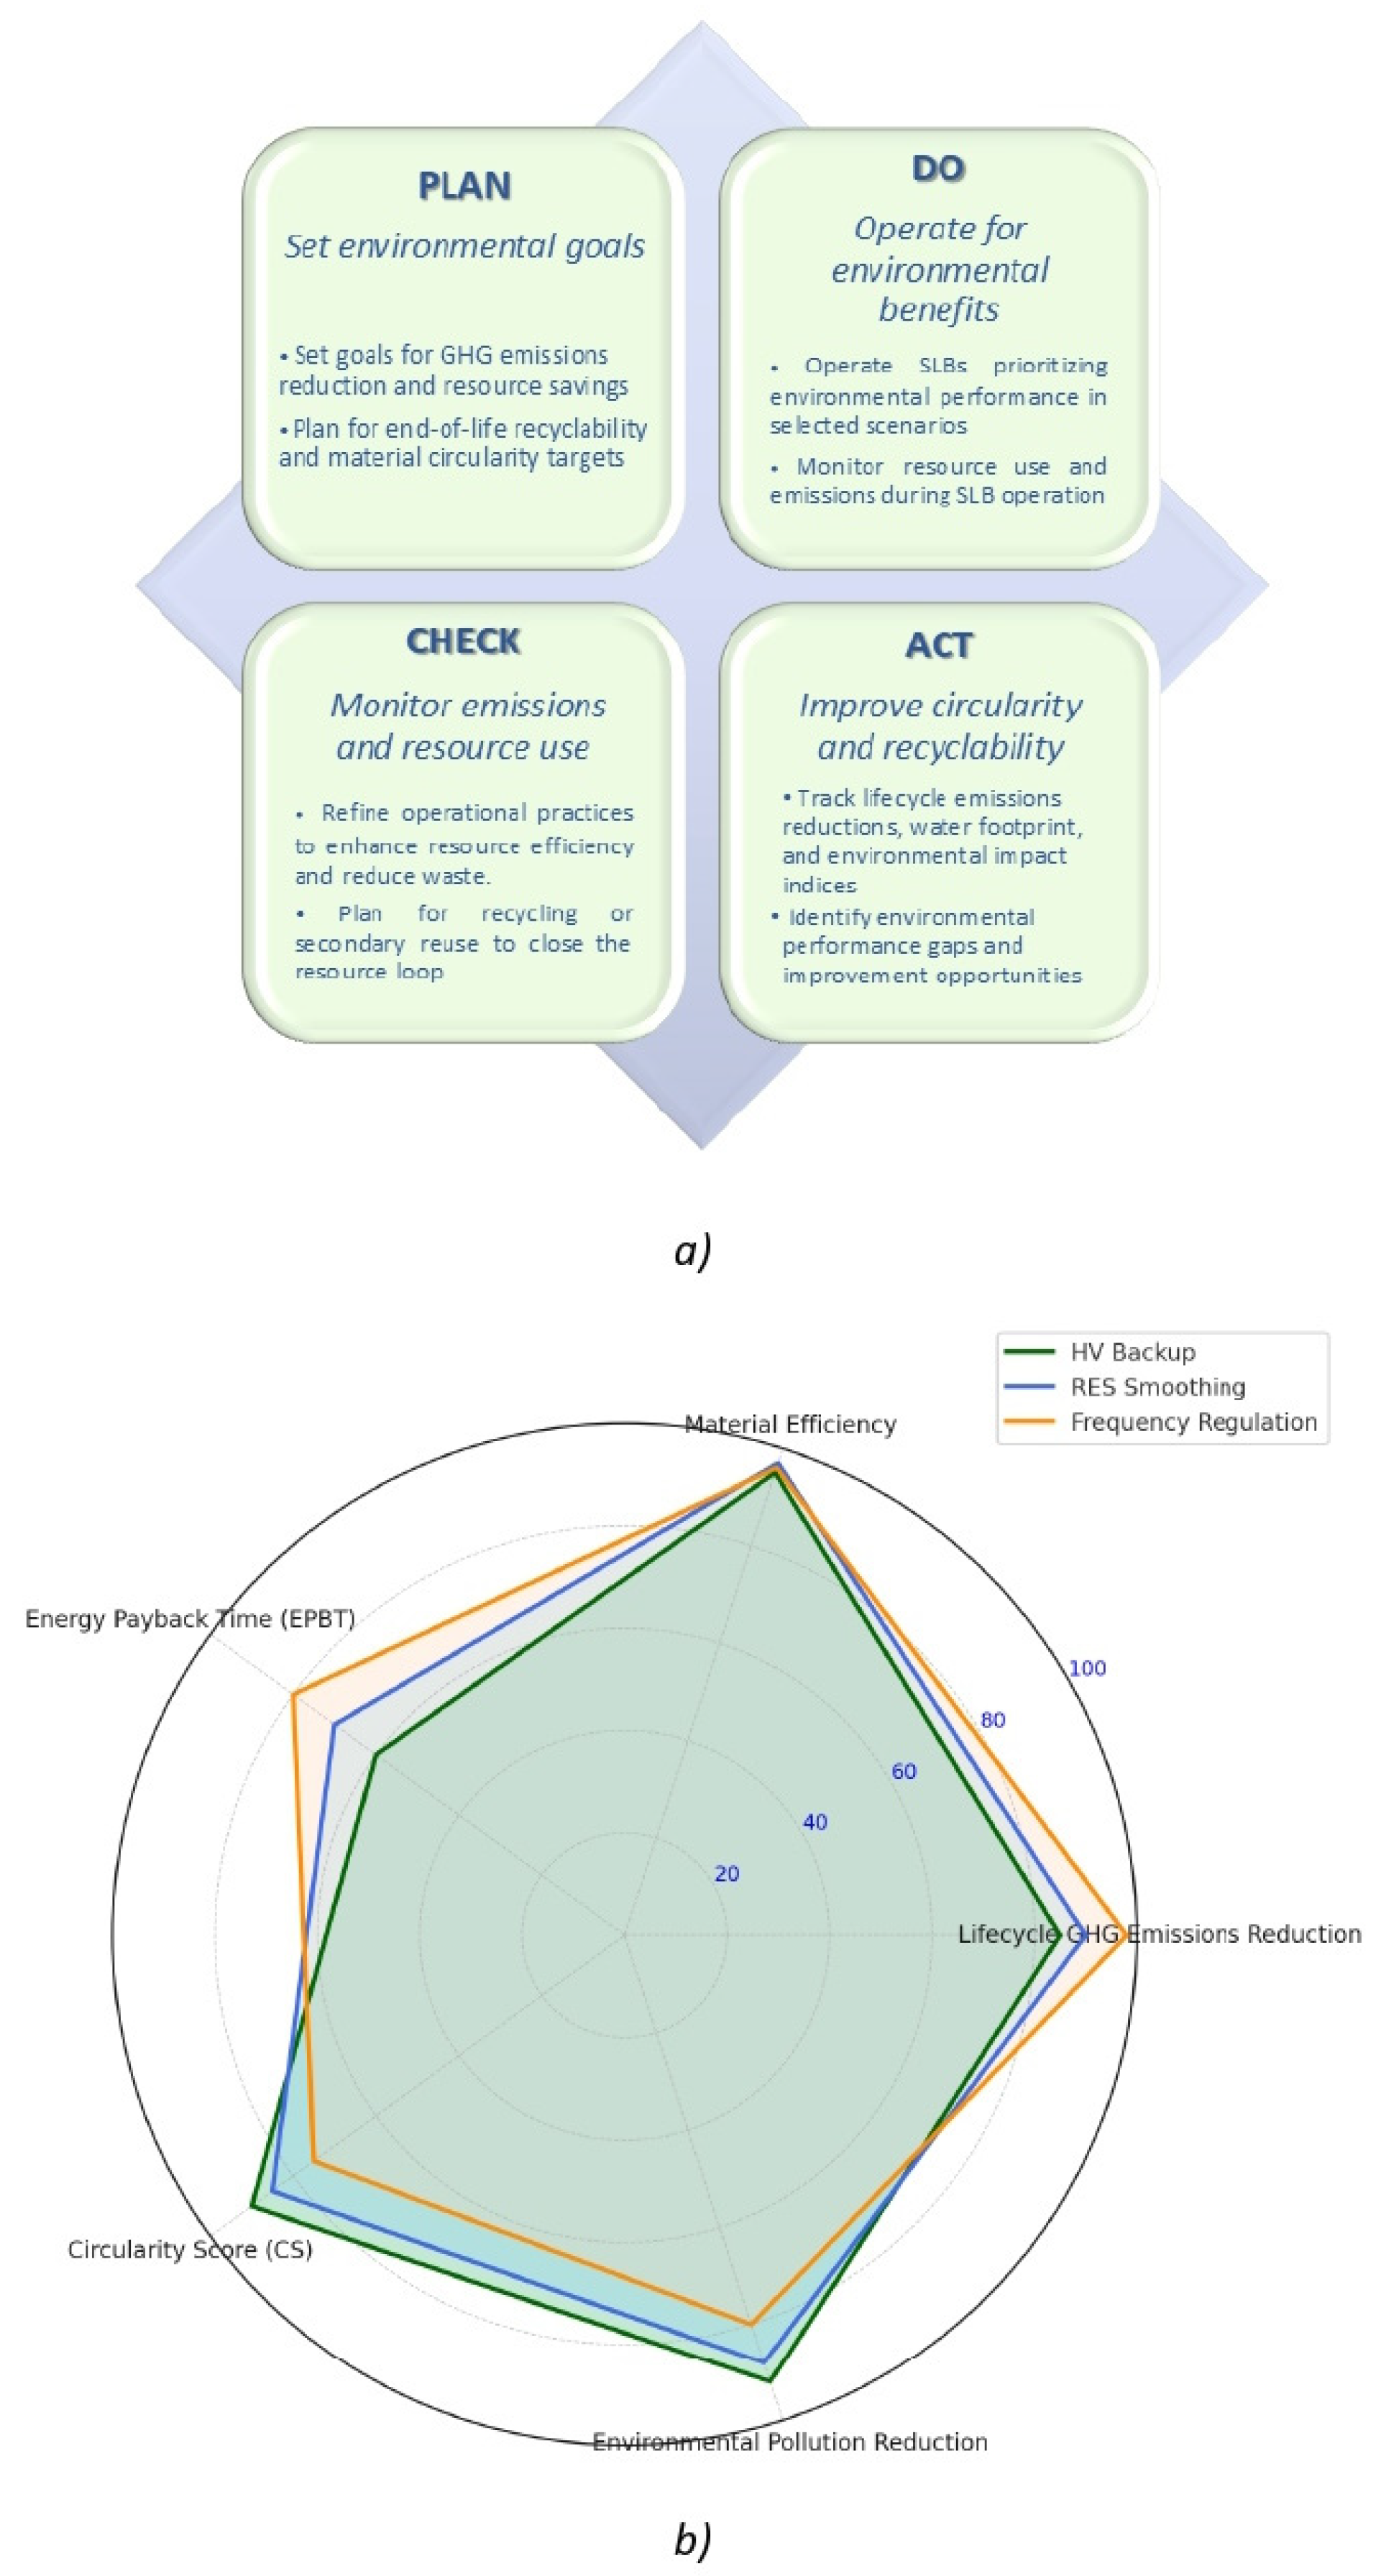
Figure 10.
Scenario-based KPI Radar Analysis of Second-Life Batteries (SLBs): Composite KPI overview.
Figure 10.
Scenario-based KPI Radar Analysis of Second-Life Batteries (SLBs): Composite KPI overview.
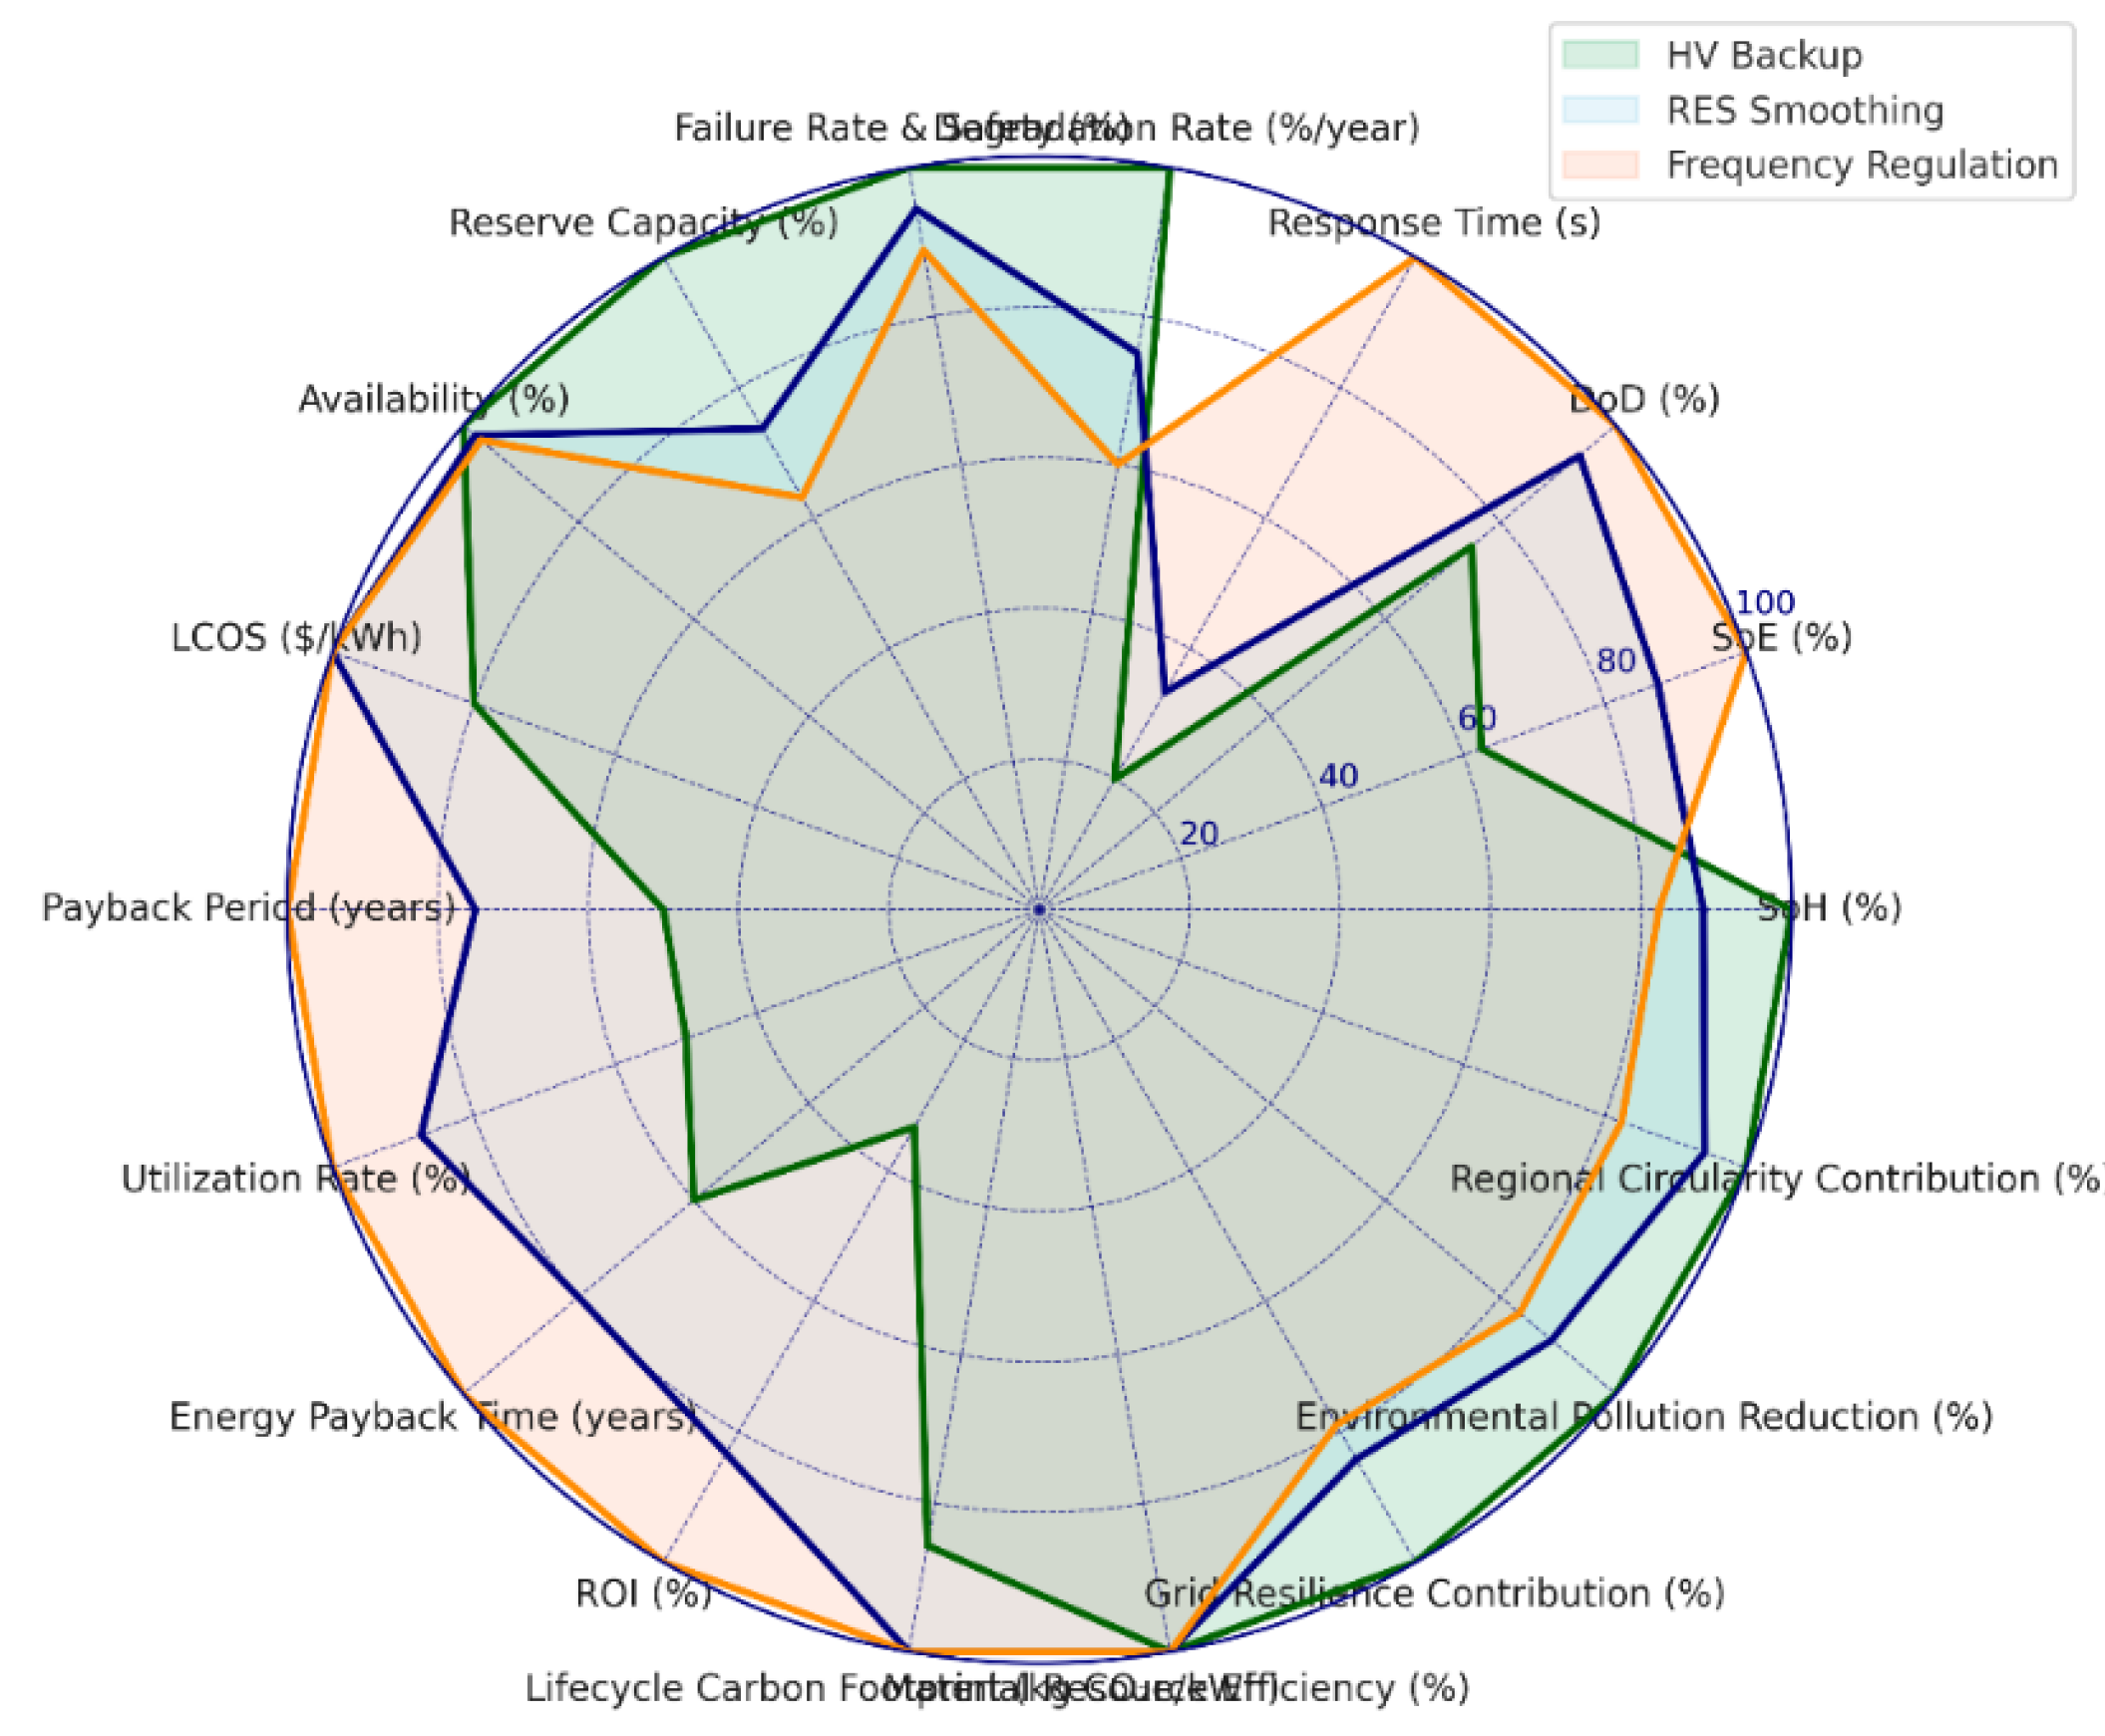
Figure 11.
Comparative radar chart of SLBs and new LIBs across KPIs.
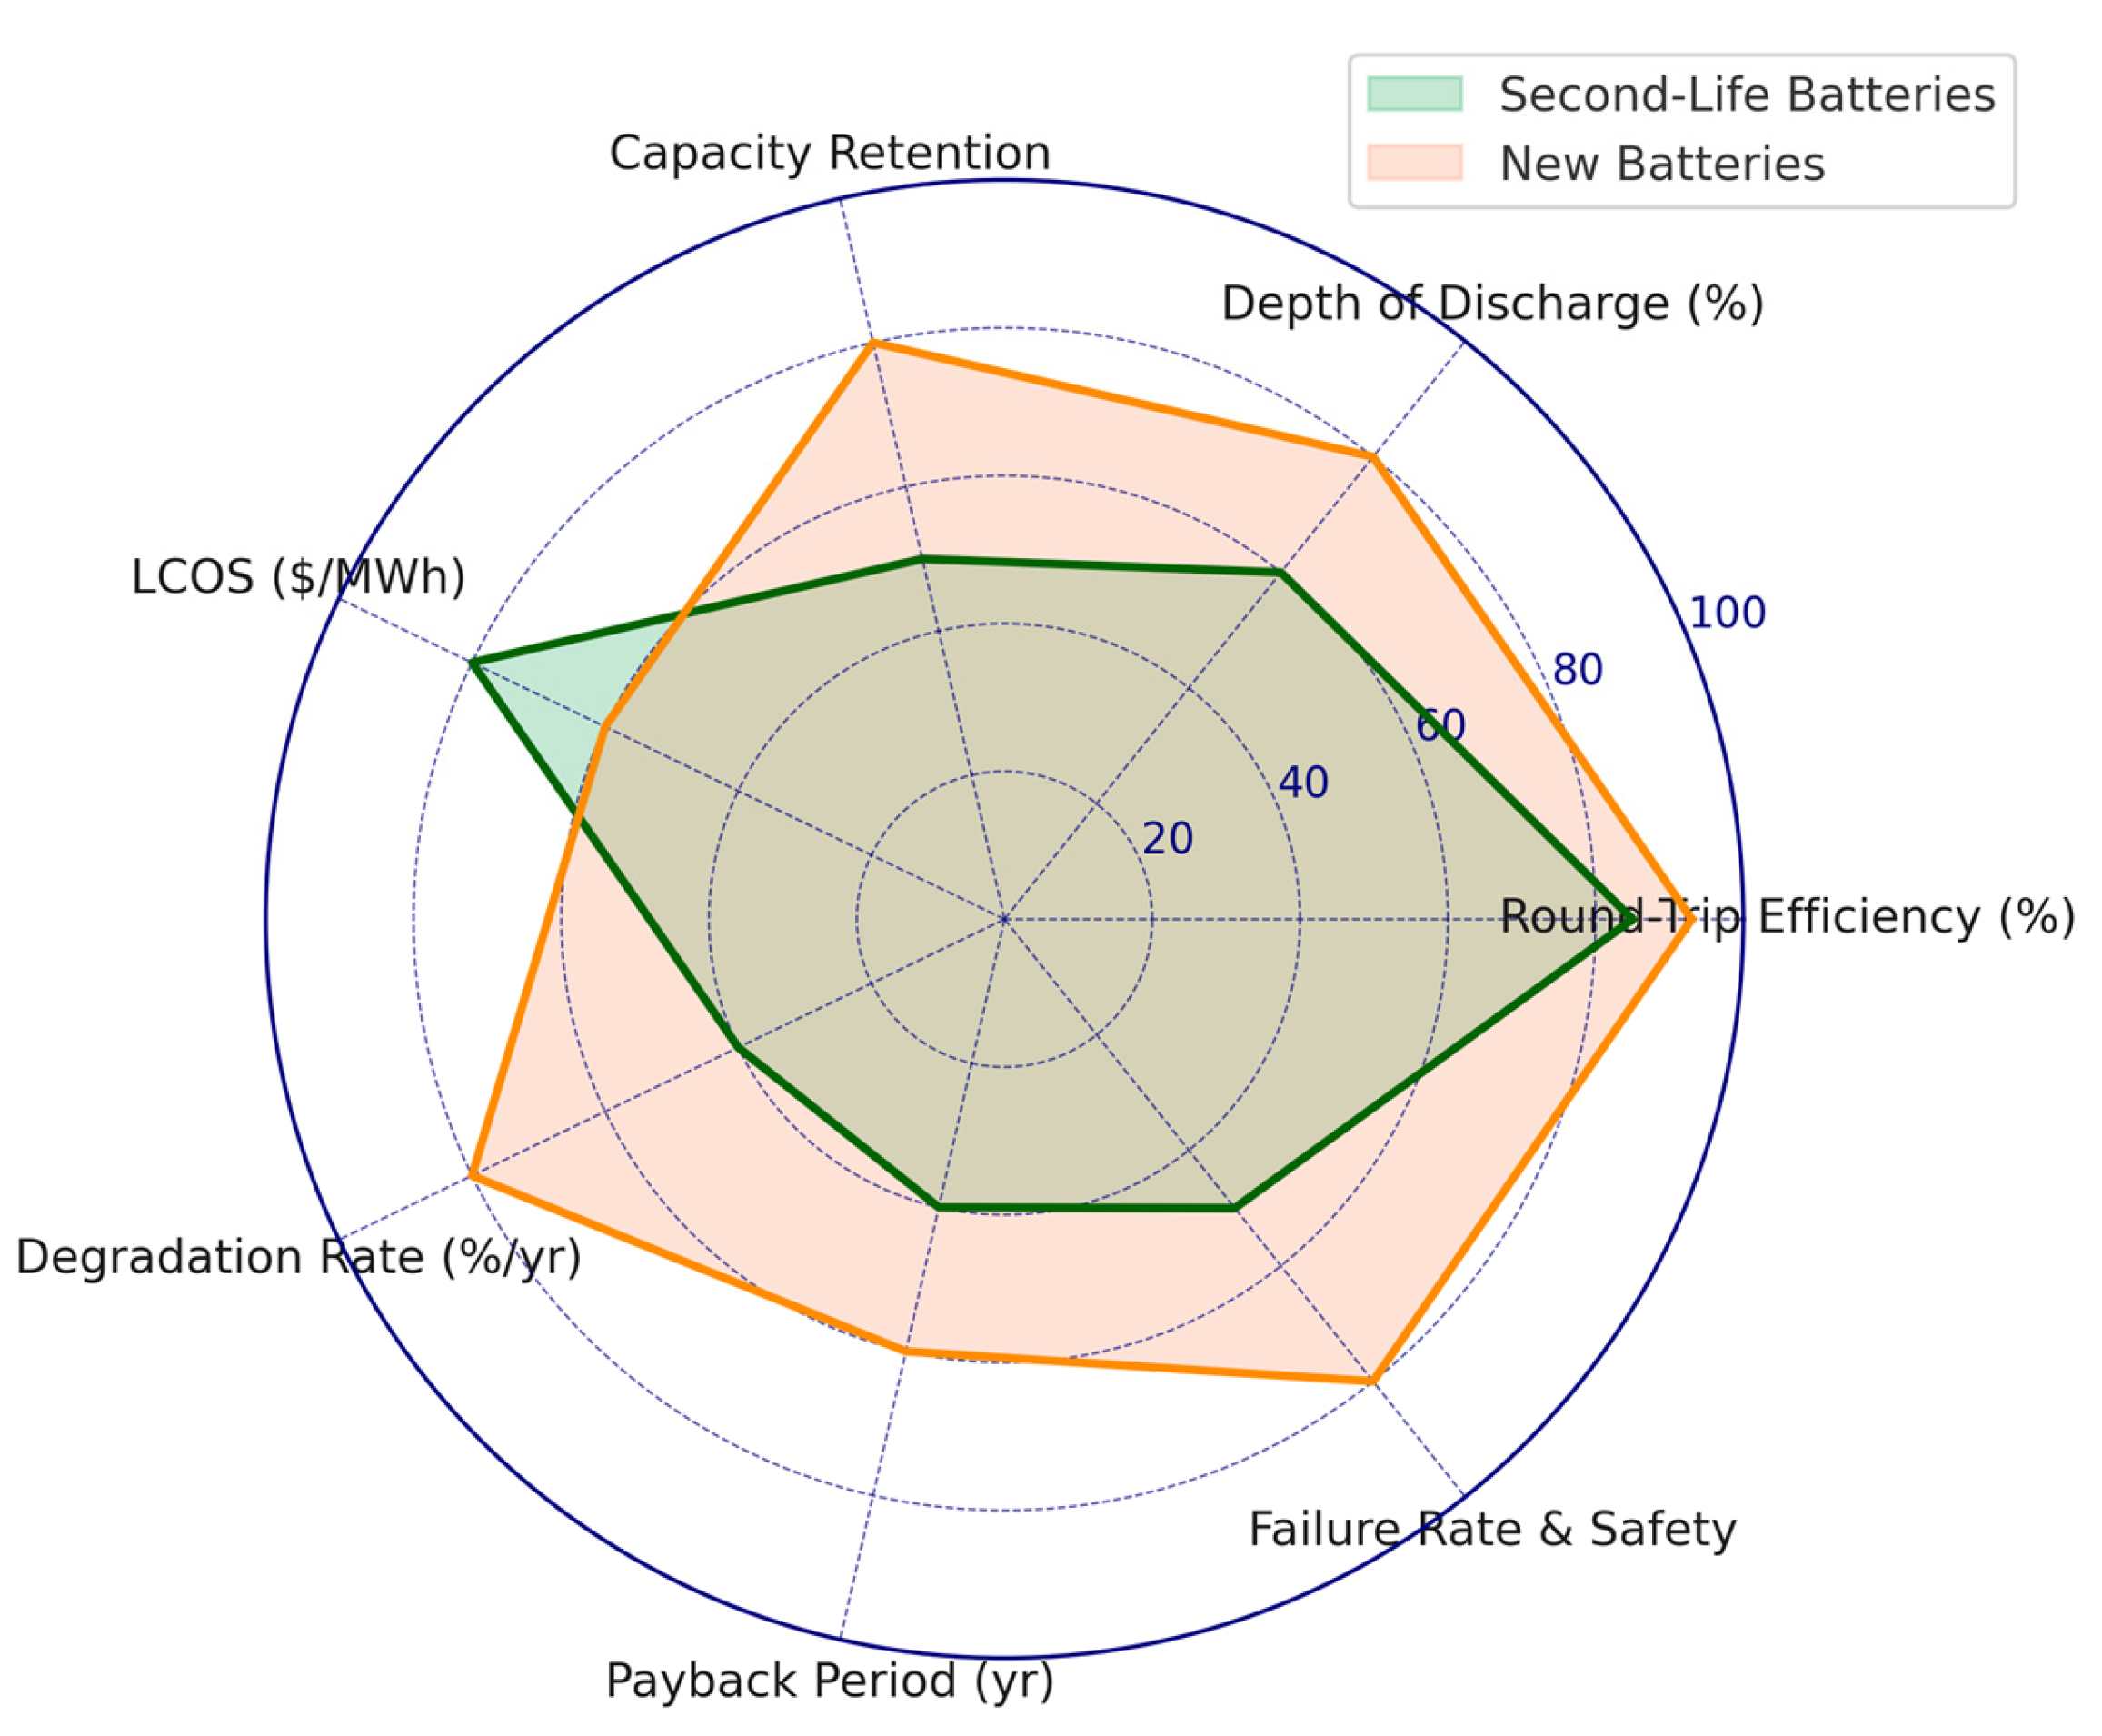
Figure 12.
Integrated multi-model framework for second-life battery deployment within the PDCA cycle.
Figure 12.
Integrated multi-model framework for second-life battery deployment within the PDCA cycle.
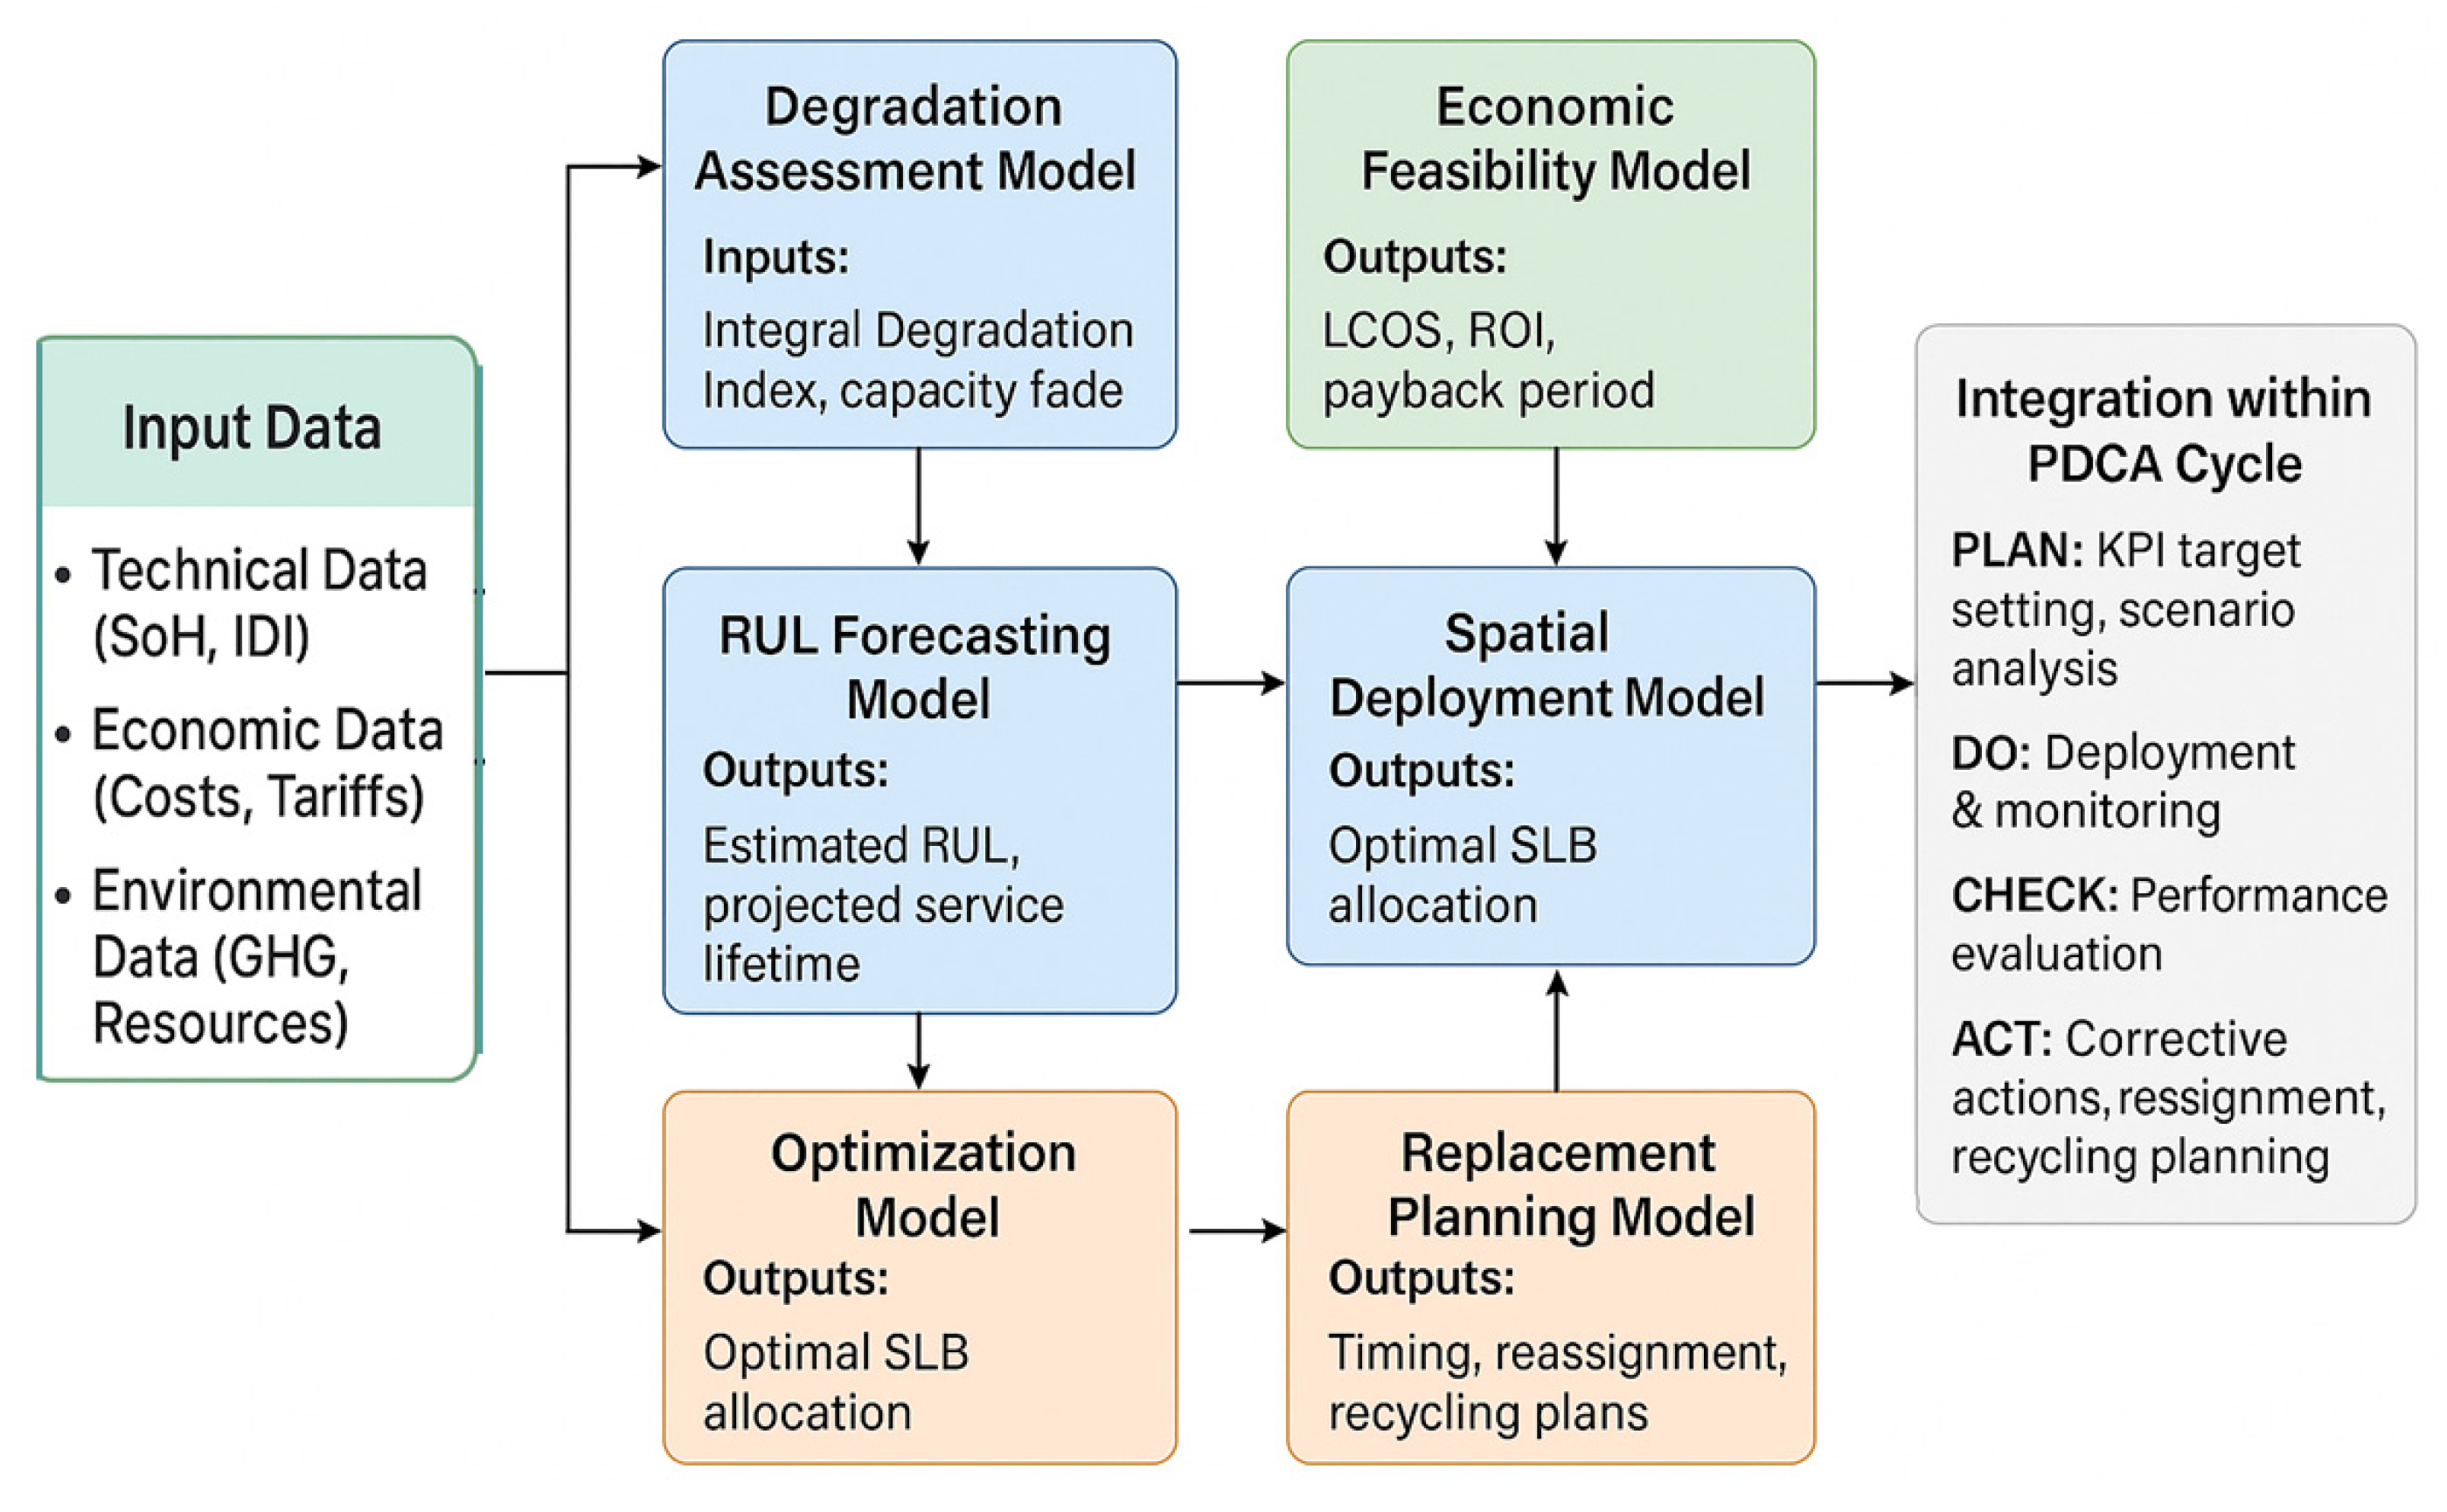

Table 1.
Operational logic and activities across PDCA phases in SLB management.
| PDCA Phase | Key Activities | Outputs/Input for Next Phase |
| PLAN | KPI selection (technical, economic, environmental), scenario analysis, degradation and feasibility modeling, regulatory consideration | Defined targets, triggers, and initial deployment plan |
| DO | SLB deployment in selected scenarios, operational control, real-time monitoring of SoH, SoE, utilization | Performance data and degradation profiles |
| CHECK | KPI evaluation, trigger assessment, degradation and environmental impact monitoring | Identification of deviations, improvement needs |
| ACT | Adjustment of operational modes, reallocation or redeployment of SLBs, planning for reuse or recycling | Updated plans and control parameters for the next cycle |
Table 2.
Mapping PDCA phases to SLB management logic.
| PDCA Phase | Core Management Actions | Monitoring Priorities | Decision Triggers |
| PLAN | Define KPI targets, scenario selection, lifecycle and economic modeling | Feasibility, resource efficiency, emission impacts | Regulatory requirements, resource constraints |
| DO | Deploy and operate SLBs, implement control strategies, real-time data collection | SoH, SoE, utilization rate, operational anomalies | Performance deviation, technical constraints |
| CHECK | Evaluate KPI compliance, degradation assessment, environmental monitoring | KPI tracking vs. targets, degradation rates | Threshold crossings (SoH drop, LCOS increase) |
| ACT | Adjust operational parameters, reallocate SLBs, initiate refurbishment or recycling plans | Improvement needs, strategy effectiveness | Economic underperformance, safety margins reached |
Table 3.
Technical KPIs for SLB Integration.
| KPI | Description | Measurement Method | Reference Values | Data Source | PDCA Phase |
| Round-Trip Efficiency (RTE) |
Ratio of energy discharged to energy charged, indicating conversion efficiency of SLB system | % calculated from charge/discharge energy over time | >85% for optimal operation | BMS, EMS logs | Check, Act |
| Depth of Discharge (DoD) |
Proportion of battery capacity used during a cycle, affecting degradation rate | % of nominal capacity | 60–80% for balanced degradation and usability | BMS | Do, Check |
| State of Health (SoH) | Remaining capacity and performance relative to initial state | % of initial capacity; impedance analysis | >70% for active grid applications | BMS diagnostics | Check |
| Integral Degradation Index (IDI) | Composite metric combining calendar, cyclic, and stochastic aging | Dimensionless index (0–1 scale) | <0.85 for continued use in active roles | Calculated from operational data | Check, Act |
| C-rate | Charge/discharge current relative to capacity, impacts aging | 0.2–0.5 C for typical SLB use | ≤0.5 C in grid support | BMS | Do, Check |
| Internal Resistance (IR) | Resistance within the battery, indicating degradation level | measured under load | Threshold increases with degradation; monitor trend | BMS | Check |
| Remaining Useful Life (RUL) | Projected operational lifespan under current usage | Cycles or years forecast | 3–7 years in grid | Prognostic algorithms | Plan, Check |
| Reliability indicator R(t) | Ratio of uninterrupted operation time to total operating time during SLB use | calculated | ≥0.95 for critical applications | SLB system logs, monitoring systems | Check, Act |
Table 4.
Economic KPIs for SLB Integration.
| KPI | Description | Measurement Method | Reference Values | Data Source | PDCA Phase |
| Levelized Cost of Storage (LCOS) | Average cost per kWh stored/discharged over SLB lifetime | USD/MWh calculated from total costs and energy throughput | <150–200 USD/MWh for economic viability | Financial analysis, EMS data | Plan, Check |
| Payback Period (PBP) | Time to recover initial investment from operational savings | Years calculated from cash flow | 4–6 years typical | Financial tracking | Plan, Check |
| Return on Investment (ROI) | Profitability measure over project lifetime | % calculated from net profit / investment | >10–15% desirable | Financial reports | Check |
| Revenue Stacking Potential | Ability to generate multiple revenue streams (e.g., FR, arbitrage) | Qualitative + USD tracking | Scenario-dependent | EMS, market data | Plan, Do |
| Operational Expenditure (OPEX) | Ongoing costs for maintenance and operation | USD/year | Minimized within system reliability constraints | O&M logs, financial | Do, Check |
| Amortization Period | Period over which investment cost is spread | Years | Typically 5–10 years | Financial planning | Plan |
| Internal Rate of Return (IRR) | Discount rate making NPV zero | % | >8–12% acceptable | Financial calculation | Check |
Table 5.
Environmental KPIs for SLB Integration.
| KPI | Description | Measurement Method | Reference Values | Data Source | PDCA Phase |
| Lifecycle GHG Emissions Reduction | Reduction in CO₂-eq emissions vs. new batteries or fossil alternatives | kg CO₂-eq saved per kWh | >30% reduction target | LCA studies, EMS data | Plan, Check |
| Material Efficiency | Ratio of energy delivered to embodied material energy | Dimensionless ratio | >1.5 | LCA, material input data | Check, Act |
| Energy Payback Time (EPBT) | Time needed to repay energy used for SLB repurposing | Years | <0.2 years | Repurposing data, use profile | Do, Check |
| Circularity Score (CS) | Combined indicator of reuse and recyclability | Normalized score (0–1) | >0.8 | Material flow analysis | Act, Check |
| Environmental Pollution Reduction | Reduction in harmful emissions and waste during SLB usage | % reduction compared to baseline | >50% | Emissions inventory, LCA | Do, Check |
Table 6.
Application of KPIs in SLB Lifecycle Management.
| Stage of SLB Integration | Dominant KPI Role | Example Metrics | Typical Trade-Offs | Strategic Purpose |
| Initial Screening | Filtering Indicator | SoH, RUL Estimate | Risk of underutilization vs. safety | Select technically viable units |
| Scenario Matching | Suitability Scoring | DoD, LCOS, Payback | High revenue vs. fast degradation | Match batteries to optimal use-case |
| Pilot Operation | Performance Benchmark | RTE, Thermal Profile | Efficiency vs. complexity of monitoring | Identify systemic weaknesses |
| Mid-Term Assessment | Threshold Evaluation | IDI, SoH Drift | Conservative operation vs. underuse | Adjust cycle depth or duty profile |
| Portfolio Optimization | Decision Trigger | Degradation Rate, LCOS | Short-term gains vs. asset longevity | Reallocate or retire based on ROI decline |
Table 7.
KPI-Based Trigger and Action Matrix Integrated with PDCA Cycles.
| KPI | Threshold Value | Trigger Condition | Action (Do/Act) | Data Source | PDCA Phase |
| RTE | >85% | Drop below 80% | Adjust DoD, review charge rates | EMS, BMS | Check, Act |
| DoD | 60–80% | Deviates >10% from plan | Limit cycles, adjust dispatch | BMS | Do, Check |
| SoH | >70% | Drop to 65–70% | Reassign to low-stress application | BMS diagnostics | Check, Act |
| IDI | <0.85 | Exceeds 0.85 | Trigger reassessment, reallocation | Calculated | Check, Act |
| LCOS | <200 USD/MWh | Exceeds threshold | Evaluate cost drivers, optimize ops | Financial analysis | Plan, Check |
| PBP | 4–6 years | Extends beyond 7 years | Recalculate financial plan | Financial tracking | Plan |
| ROI | >10–15% | Falls below 8% | Adjust business model | Financial reports | Check |
| GHG Reduction | >30% | Drops below 25% | Investigate inefficiencies | LCA data | Check |
| Resource Savings | 20–40% | Drops significantly | Review reuse logistics | LCA analysis | Check |
Table 8.
Models within the SLB Deployment Framework and their PDCA Phases.
| Model Name | Input Parameters | Outputs | Methods Used | PDCA Phase |
| Degradation Assessment Model | Calendar age, cycle count, temperature, load history | Integral Degradation Index (IDI), capacity fade rates | Empirical modeling, regression, machine learning | PLAN, DO |
| Remaining Useful Life Forecasting Model | SoH(t), IDI, operational history | Estimated RUL, projected service lifetime | Time series forecasting, exponential smoothing, threshold-based rules | PLAN, CHECK |
| Economic Feasibility Model | Costs, service life, efficiency, tariffs/profits | LCOS, NPV, IRR, payback period | Financial modeling, scenario analysis, LCOS calculation | PLAN |
| Optimization Model for SLB Allocation | Costs, reliability, location, environmental impacts | Optimal SLB deployment across scenarios | Multi-criteria optimization, mathematical programming | PLAN, DO |
| Spatial Deployment Model | Load profiles, infrastructure, RES share, regional risks | Feasibility maps, object ranking for deployment | GIS analysis, spatial multi-criteria assessment | PLAN |
| Replacement Planning Model | SoH, IDI, degradation thresholds | Replacement timing, reuse or disposal recommendations | Threshold rules, dynamic replacement planning | CHECK, ACT |
Disclaimer/Publisher’s Note: The statements, opinions and data contained in all publications are solely those of the individual author(s) and contributor(s) and not of MDPI and/or the editor(s). MDPI and/or the editor(s) disclaim responsibility for any injury to people or property resulting from any ideas, methods, instructions or products referred to in the content. |
© 2025 by the authors. Licensee MDPI, Basel, Switzerland. This article is an open access article distributed under the terms and conditions of the Creative Commons Attribution (CC BY) license (http://creativecommons.org/licenses/by/4.0/).
Copyright: This open access article is published under a Creative Commons CC BY 4.0 license, which permit the free download, distribution, and reuse, provided that the author and preprint are cited in any reuse.


