Submitted:
16 August 2025
Posted:
18 August 2025
You are already at the latest version
Abstract
This study evaluates the performance of freely accessible large language model (LLM) chatbots—ChatGPT, Copilot, Gemini, DeepSeek, and Perplexity—in a range of chemistry-related tasks, including molecular structure generation, Lewis structure construction, and chemical image interpretation. The results reveal a con-sistent limitation across all models: none were able to accurately generate chemical or Lewis structures, even after multiple attempts. Structural outputs often contained sig-nificant errors, rendering them unsuitable for educational use. However, despite these shortcomings in visual representation, the chatbots demonstrated strong conceptual understanding. All models correctly interpreted chemical structures presented in im-ages, identified functional groups, and accurately explained reaction mechanisms and molecular properties such as polarity and hybridization. Notably, they successfully recognized the reduction of allicin to a disulfide and identified conjugated systems as the source of color in natural dyes. These findings underscore the current strengths of LLMs in chemical reasoning and interpretation, while highlighting the need for further development in their structural visualization capabilities.
Keywords:
chatbot
; Large Language Model
; Artificial Intelligence
; ChatGPT
; DeepSeek
; Copilot
; Gemini
; Perplexity
1. Introduction
The advent of Large Language Models (LLMs) has marked a transformative era in artificial intelligence, particularly in their capacity to reshape digital interactions across healthcare, education, and economic sectors.[1]. Within educational contexts specifically, these AI systems have introduced paradigm-shifting capabilities in personalized instruction, adaptive tutoring, and dynamic content creation. Contemporary LLM implementations - including ChatGPT (OpenAI), Gemini (Google), Copilot (Microsoft), DeepSeek, and Perplexity - have achieved remarkable linguistic fluency, enabling natural language interactions accessible through common digital platforms. Their integration into learning ecosystems offers significant pedagogical advantages: facilitating immediate formative feedback, enhancing learner motivation, and providing intuitive access to complex problem-solving across STEM and humanities disciplines - all through conversational interfaces requiring no technical specialization.[2]
In the healthcare domain, large language models (LLMs) such as ChatGPT, Gemini, and Copilot have contributed to improving prostate cancer literacy [3]. Several tools—including Bard, Bing, ChatGPT, Claude, and Gemini—have been employed in ophthalmology-related studies, particularly for multiple-choice examinations. These tools have been applied to answer patient inquiries, provide medical advice, support patient education, assist in triage, facilitate diagnosis and differential diagnosis, and contribute to surgical planning [4]. In eye care, ChatGPT has enhanced access to critical information, improved patient engagement, and streamlined triage processes [5]. Additionally, Copilot, Gemini, and ChatGPT-4 have been utilized for the interpretation of Western blot results [6]. Claude, Copilot, Gemini, ChatGPT, and Perplexity have also been employed to support postgraduate students in successfully passing the Specialty Certificate Examination in Dermatology [7].
In chemistry education, LLMs offer a compelling yet underexplored opportunity. Chemistry is inherently multimodal: learning often depends on interpreting symbolic, visual, and spatial information. Students are expected to construct and decode molecular structures, Lewis diagrams, orbital representations, and reaction mechanisms—skills that require both conceptual understanding and visual literacy.[8,9,10,11,12] While LLMs excel in linguistic tasks and factual recall, their ability to process or generate chemical imagery accurately remains a significant limitation.[13,14]
Recent studies suggest that although LLMs can describe chemical principles correctly, they frequently struggle with visual conventions and structural accuracy. For example, when prompted to generate Lewis structures or stereoisomeric diagrams, models often produce distorted or chemically invalid results.[15,16] This discrepancy raises concerns about the pedagogical reliability of these tools, particularly in introductory courses where students rely heavily on accurate visual aids to develop foundational understanding.[17]
Chatbots such as ChatGPT have been widely used in chemical education for tasks including scientific writing assignments,[18] enhancing critical thinking skills [19], answering chemistry questions [20,21,22], and writing lab reports. While chatbots can now upload datasets and generate images, their ability to create visualizations—such as box plots, histograms, principal component analysis plots, and supervised classification models—has not yet been described in the literature. This is a recent development, as only recently have chatbots gained the capability to handle data and produce graphical outputs. [23].
At the same time, the integration of image input and interpretation capabilities in modern LLMs introduces promising pathways for chemistry education. Multimodal models—capable of processing both text and images—can now identify functional groups in chemical diagrams, recognize reaction types from schemes, and classify molecular properties from image prompts .[24,25] These features may be particularly useful in visual tasks such as distinguishing between polar and nonpolar molecules, understanding the significance of conjugated systems in natural dyes, or interpreting organic transformations like reduction and hydrolysis. Such affordances point to a future where AI could serve as a conceptual scaffold, enabling students to explore chemical ideas interactively, even if the model lacks perfect visual precision.[26,27]
This study aims to evaluate the capabilities and limitations of five widely available LLM-based chatbots—ChatGPT, Gemini, Copilot, DeepSeek, and Perplexity—in supporting chemistry education across a range of representational formats. Specifically, we assess their ability to: (1) generate molecular and Lewis structures; (2) create illustrative images; (3) generate plots such as PCA score plots, dendrograms , box plots , and histograms (4) does classificatory models such as random forest (5) accurately interpret reaction schemes and chemical images; and (5) interpret and generate images within classroom learning contexts. Our approach involves iterative prompting and performance benchmarking using chemistry tasks commonly encountered at the high school and undergraduate levels.
Findings indicate that while the chatbots show strong conceptual understanding—consistently identifying functional groups, stereochemistry, hybridization, and polarity—they struggle significantly with structure generation. No tool was able to reliably construct valid Lewis structures, and only a few could attempt molecular visualizations at all. Despite this, all models were capable of interpreting image-based prompts with reasonable accuracy, recognizing compounds like methanol in transesterification reactions or the reduction of allicin to a disulfide.
Taken together, these results provide a nuanced perspective on the current role of LLMs in chemistry education. While their linguistic and reasoning capacities are impressive, their visual representation skills are still in early stages of development. These findings support the cautious integration of LLMs as supplementary tools—useful for conceptual reinforcement and chemical reasoning, but not yet reliable as primary sources for visual content. Future improvements in multimodal training and domain-specific fine-tuning will be essential to unlock the full educational potential of these AI systems.
2. Materials and Methods
The chatbots s used in this study were described in Table 1. The study was conducted in May to August 2025. ChatGPT, Gemini, Perplexity interactions were performed using the free versions of each tool, accessed directly through the Microsoft Edge browser. The Copilot 365 version was used in this study. It is free for Microsoft Windows users.
The Wisconsin Breast Cancer Dataset used in sections 4-6 was provided in the supporting information.

Table 1.
Versions of Freely Accessible Large Language Models Employed in This Study (June 2025).
| Tool | Free Version (June 2025) |
| ChatGPT | GPT-4o |
| Gemini | Gemini 2.5 Flash |
| Perplexity | GPT-4o |
| DeepSeek | DeepSeek-R3-V2 |
| Copilot | Copilot M365 (GPT-4o) |
4.2. Supervised Methods
Classification Metrics for Cancer Recognition
When evaluating a model for a cancer recognition contest, a variety of metrics are used to measure its performance from different angles. Here’s a breakdown of the key metrics you’ve listed:
Precision vs. Recall
In cancer recognition, a positive prediction means the model says the patient has cancer, and a negative prediction means the model says the patient does not have cancer.
Precision: Answers the question, "Of all the patients the model predicted have cancer, how many actually have it?" High precision is crucial when a false positive (telling a healthy person they have cancer) is highly undesirable, as it can lead to unnecessary treatments or stress.
Recall (Sensitivity): Answers the question, "Of all the patients who actually have cancer, how many did the model correctly identify?" High recall is critical in cancer detection because a false negative (failing to detect cancer in a sick person) can have severe consequences, delaying vital treatment.
F1-Score
The F1-Score is the harmonic mean of precision and recall, providing a single score that balances both metrics. It is particularly useful when you need a model that performs well on both fronts, especially if there is an uneven distribution of cancer and non-cancer cases in your dataset.
Confusion Matrix
The Confusion Matrix provides a complete breakdown of your model’s predictions versus the actual outcomes. It’s a table that shows:
True Positives (TP): The number of actual cancer cases that the model correctly identified.
True Negatives (TN): The number of actual non-cancer cases that the model correctly identified.
False Positives (FP): The number of non-cancer cases that the model incorrectly identified as cancer.
False Negatives (FN): The number of actual cancer cases that the model failed to detect.
ROC-AUC Score
The ROC-AUC Score (Receiver Operating Characteristic-Area Under Curve) measures the model’s ability to distinguish between classes. A score of 1.0 means the model can perfectly differentiate between cancer and non-cancer cases, while a score of 0.5 indicates a model that is no better than random guessing.
Cross-Validation Scores
Cross-Validation Scores assess the stability and generalizability of your model. Instead of just splitting the data once, cross-validation divides the dataset into multiple parts (e.g., 5-fold). The model is trained and tested five times, with a different part of the data held out each time. The scores from each "fold" are then averaged, providing a more reliable estimate of how the model will perform on new, unseen data. In this study it was used 5 fold-cross validation
3. Building Images
3.1. Generating the Structure of Thalidomide
This section aimed to evaluate whether chatbots are capable of generating chemical structures. As a model compound, thalidomide was selected due to its well-known role in stereochemistry education [28]. Thalidomide exists as two enantiomers: the (R)-thalidomide, which exhibits sedative properties, and the (S)-thalidomide, which is teratogenic and responsible for severe birth defects. Its historical and pharmacological significance makes it a common example for illustrating the importance of chirality in drug development.
DeepSeek provided a description of thalidomide but stated that it could not generate images, instead supplying links to the compound’s structures on PubChem and ChemSpider.
ChatGPT initially returned an incorrect structure (Figure 1a). However, when prompted with “you provided me with a wrong structure”, it produced the correct structures (Figure 1b).
Gemini, in its first attempt, also returned an incorrect structure (Figure 1c). When prompted with “you provided me with a wrong structure”, it generated Figure 1d. After a second prompt—“you provided a wrong structure again”—it produced Figure 1e. Subsequently, it stated “I cannot generate the image” and provided a ResearchGate article containing the thalidomide structure.
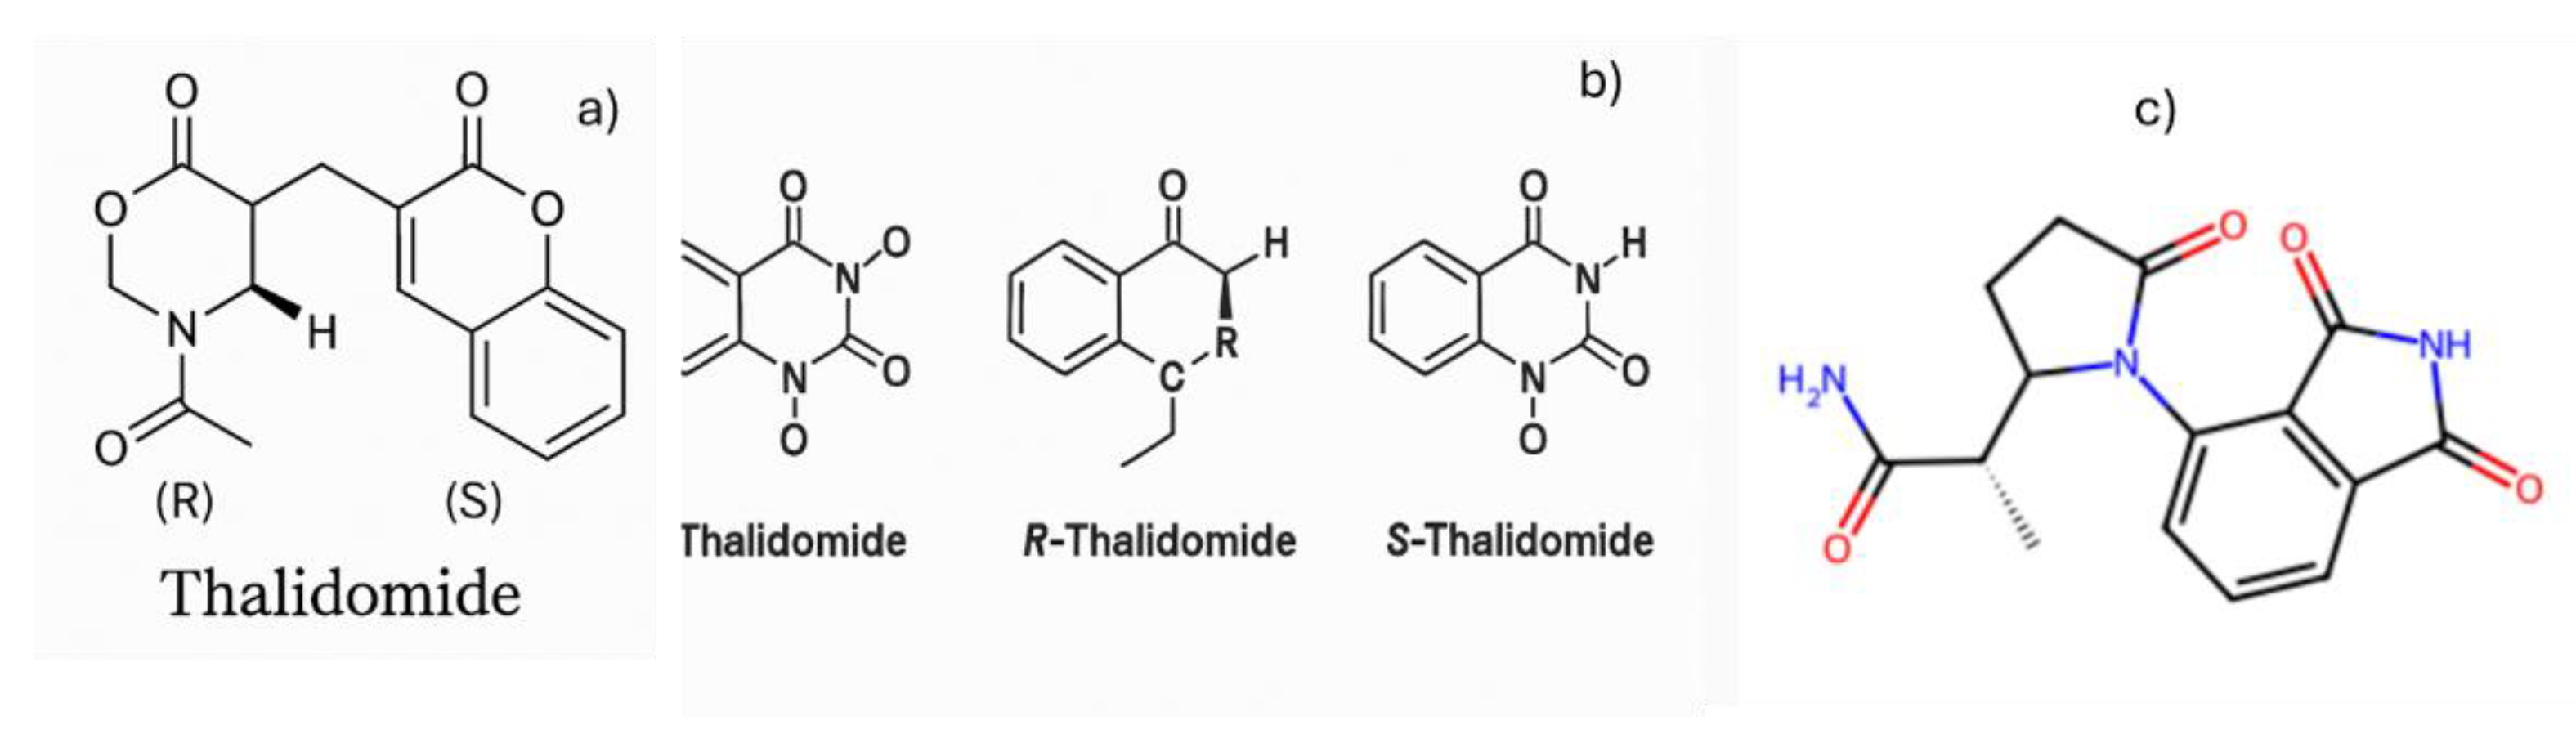
Perplexity initially returned an incorrect structure (Figure 2a). When prompted with “you provided me with a wrong structure”, it again produced an incorrect result (Figure 2b). After a second prompt—“you provided a wrong structure again”—it stated that the image generation limit had been reached and suggested upgrading to the paid version.
Copilot also generated incorrect structures. On its seventh attempt, it returned another incorrect structure (Figure 2c) and redirected the user to the ACS.org website, where the correct structure could be found.
Figure 1.
Thalidomide structures generated by ChatGPT in its first (a) and second (b) attempts, and by Gemini in its first (c), second (d), and third (e) attempts.
Figure 1.
Thalidomide structures generated by ChatGPT in its first (a) and second (b) attempts, and by Gemini in its first (c), second (d), and third (e) attempts.
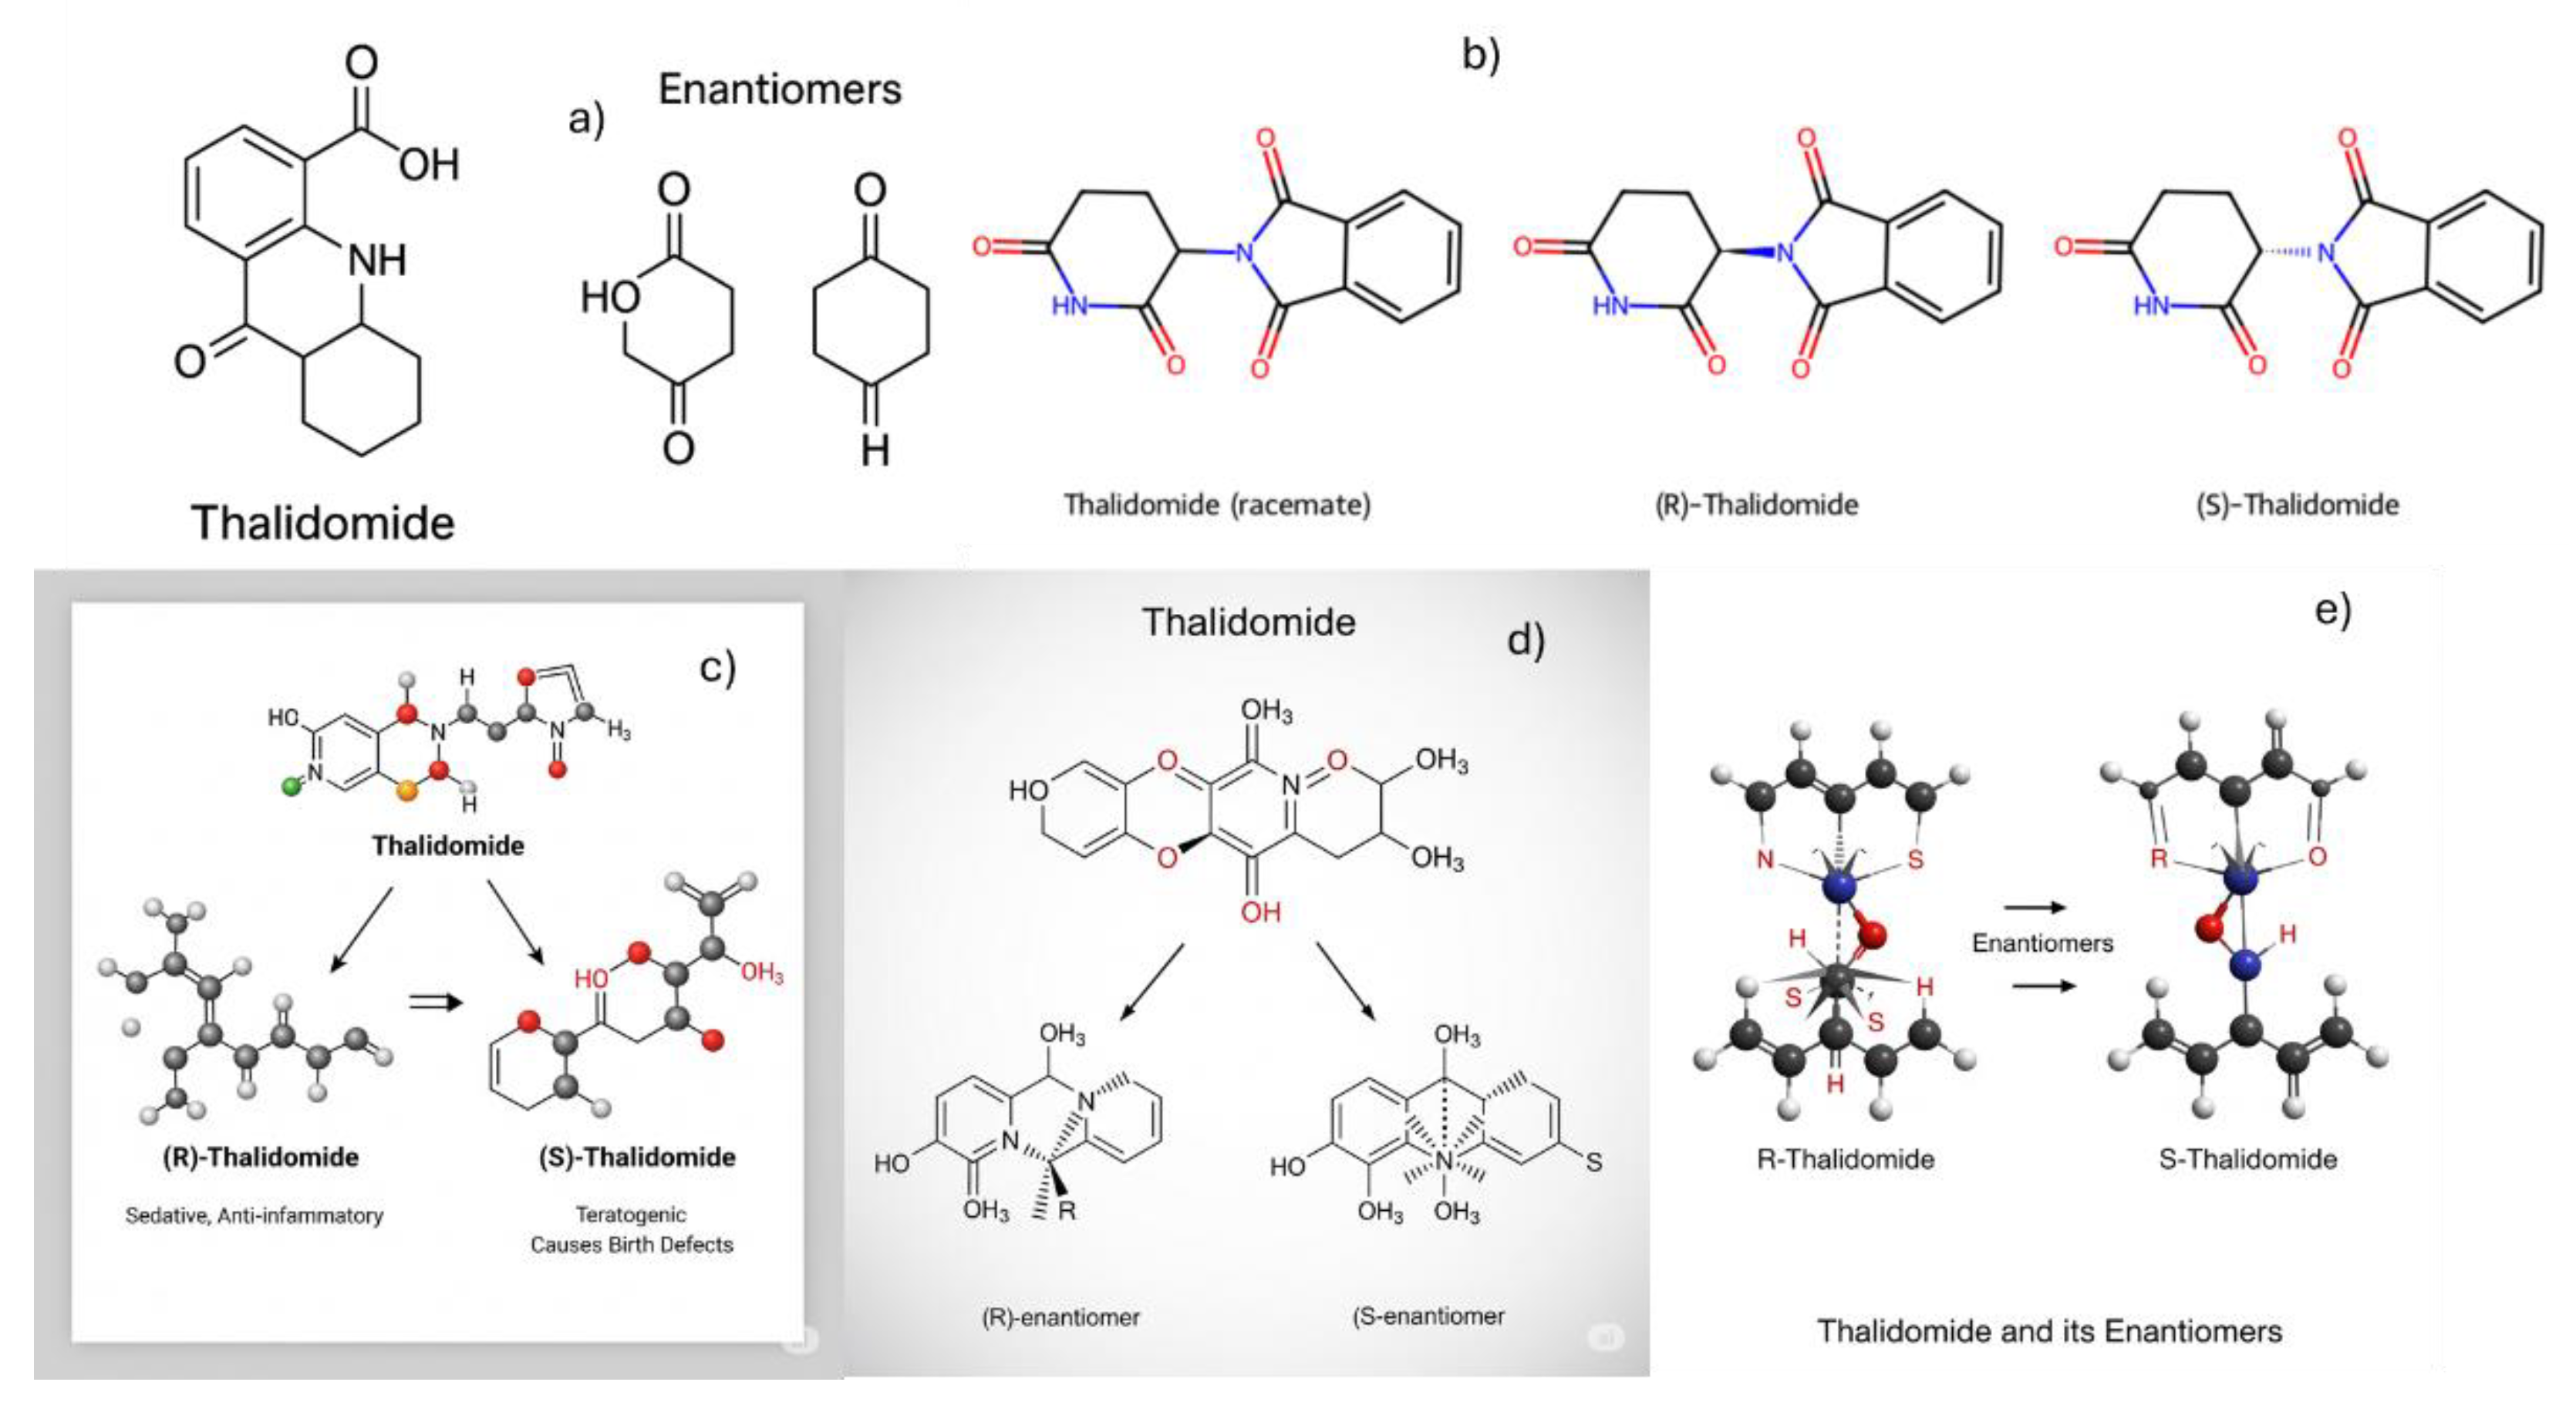
Figure 2.
Thalidomide structures generated by Perplexity in its first (a) and second (b) attempts, and by Copilot in its seventh (c) attempt.
Figure 2.
Thalidomide structures generated by Perplexity in its first (a) and second (b) attempts, and by Copilot in its seventh (c) attempt.
3.2. Building the Simple Molecules Lewis Structure
Constructing Lewis structures and analyzing molecular geometry and hybridization are fundamental topics in general chemistry. In this section, we evaluated the ability of chatbots to generate Lewis structures for a selection of molecules commonly taught at the introductory level, it was prompt, generate the Lewis structure of BF₃, CH₄, NH₃, PCl₃, PCl₅, SF₄, SF₆, XeF₂, and XeF₄. In this example, the prompt was tested multiple times form May to August 2025.
All chatbots were able to provide accurate and consistent descriptions of central atom hybridization, molecular geometry, and polarity, as summarized in Table 1 by DeepSeek.
Table 2.
Molecules, hybridizations, geometry and polarity of molecules. It was built by DeepSeek.
| Molecule | Hybridization | Geometry | Polarity |
| BF₃ | sp² | Trigonal planar | Nonpolar |
| CH₄ | sp³ | Tetrahedral | Nonpolar |
| NH₃ | sp³ | Trigonal pyramidal | Polar |
| PCl₃ | sp³ | Trigonal pyramidal | Polar |
| PCl₅ | sp³d | Trigonal bipyram. | Nonpolar |
| SF₄ | sp³d | See-saw | Polar |
| SF₆ | sp³d² | Octahedral | Nonpolar |
| XeF₂ | sp³d | Linear | Nonpolar |
| XeF₄ | sp³d² | Square planar | Nonpolar |
When the prompt was entered into ChatGPT between May and August 2025, incorrect chemical structures were produced. For example, Figure 3a, Figure 3b, and Figure 3c were generated in May, July, and August 2025, respectively.
Both Gemini and Perplexity demonstrated an ability to describe the geometry of molecules rather than providing a visual representation. For example, Perplexity described XeF₄ as a central xenon atom bonded to four fluorine atoms with two lone pairs, resulting in a square planar shape.
Similarly, Gemini described SF₆ by detailing its octahedral shape: a central sulfur atom forms six single bonds with six fluorine atoms, holding 12 valence electrons with no lone pairs.
However, a key difference emerged in August 2025. When prompted to generate these images, Gemini explicitly stated, "I apologize, but I cannot create images of the Lewis structures you requested. My image generation tool is not equipped to produce the precise scientific diagrams needed for chemical structures." This response highlights a limitation in Gemini’s ability to create accurate visual representations, even as it could provide a detailed textual description of the molecular geometry.
Copilot, when used as ChatGPT, provided inaccurate molecular structures even after multiple tests conducted from May to August. The Lewis structures could not be reliably generated. Figure 4 illustrates the inaccuracies in the constructed Lewis structures.
3.3. Comparing NH3 and NF3 Polarities
Comparing the polarities of NH₃ and NF₃ is a classic example in general chemistry used to illustrate how molecular geometry influences molecular polarity. When prompted with the question: "Between NH₃ and NF₃, which molecule is more polar, and why? Illustrate both Lewis structures and describe the direction and magnitude of their dipole moments," all chatbots correctly identified NH₃ as the more polar molecule. This was typically justified by referencing the greater electronegativity of fluorine compared to hydrogen and the resulting net dipole orientation.
The reported dipole moments were generally consistent, with values of approximately 1.47 D for NH₃ and 0.23 D for NF₃, aligning with standard literature. However, despite the conceptual accuracy in their explanations, none of the chatbots were able to generate correct Lewis structures, even for these relatively simple molecules.
NF₃ and NH₃ are simple molecules, yet none of the chatbots were able to generate accurate images of them, even after the prompt was tested multiple times between May and August 2025. Figure 5 illustrates some of the Lewis structures produced by ChatGPT (Figure 5a) and Copilot (Figure 5b) in August 2025.
3.4. Building Illustrations
The April 2025 front cover of the Journal of Chemical Education was created using ChatGPT,[29] highlighting how chatbots were also used to enhance scientific manuscripts through tasks such as text improvement.[30,31,32] Motivated by this, it was tested how different chatbots perform in generating an illustration. It was prompt “Illustrated a battle between ChatGPT, DeepSeek, Copilot, Perplexity and Gemini”
In April 2025, Copilot produced an illustration featuring six robots; however, it did not specify which robot represented which chatbot (Figure 6a). ChatGPT, by contrast, successfully created a battle scene between five characters, each clearly labeled with the name of its corresponding chatbot (Figure 6b). Gemini generated a colorful illustration, but it included six characters and failed to name or distinguish them (Figure 6d). Perplexity generated an image featuring four distinct humanoid robots positioned together. The robots exhibit unique visual designs (e.g., differing in shape, color, or mechanical features) it include identifying logos distinguish them as specific models or characters, but the Perplexity Robot was not shown in the ilustration (Figure 6c).
When the prompt was retested in August 2023, each AI model provided a unique interpretation. ChatGPT generated a battle between five cavaliers, each clearly identified with a chatbot’s name and logo (Figure 7a). Gemini’s illustration featured a battle of six magical characters; while five were labeled with a chatbot’s name, the sixth character was simply marked with a question mark (Figure 7b). Copilot built a scene with six characters; however, one of the characters remained unidentified (Figure 7c). Perplexity’s result included five characters, but only four were named, and all four names were misspelled (Figure 7d).
3.5. Building Illustrations in Studio Ghibli Animations
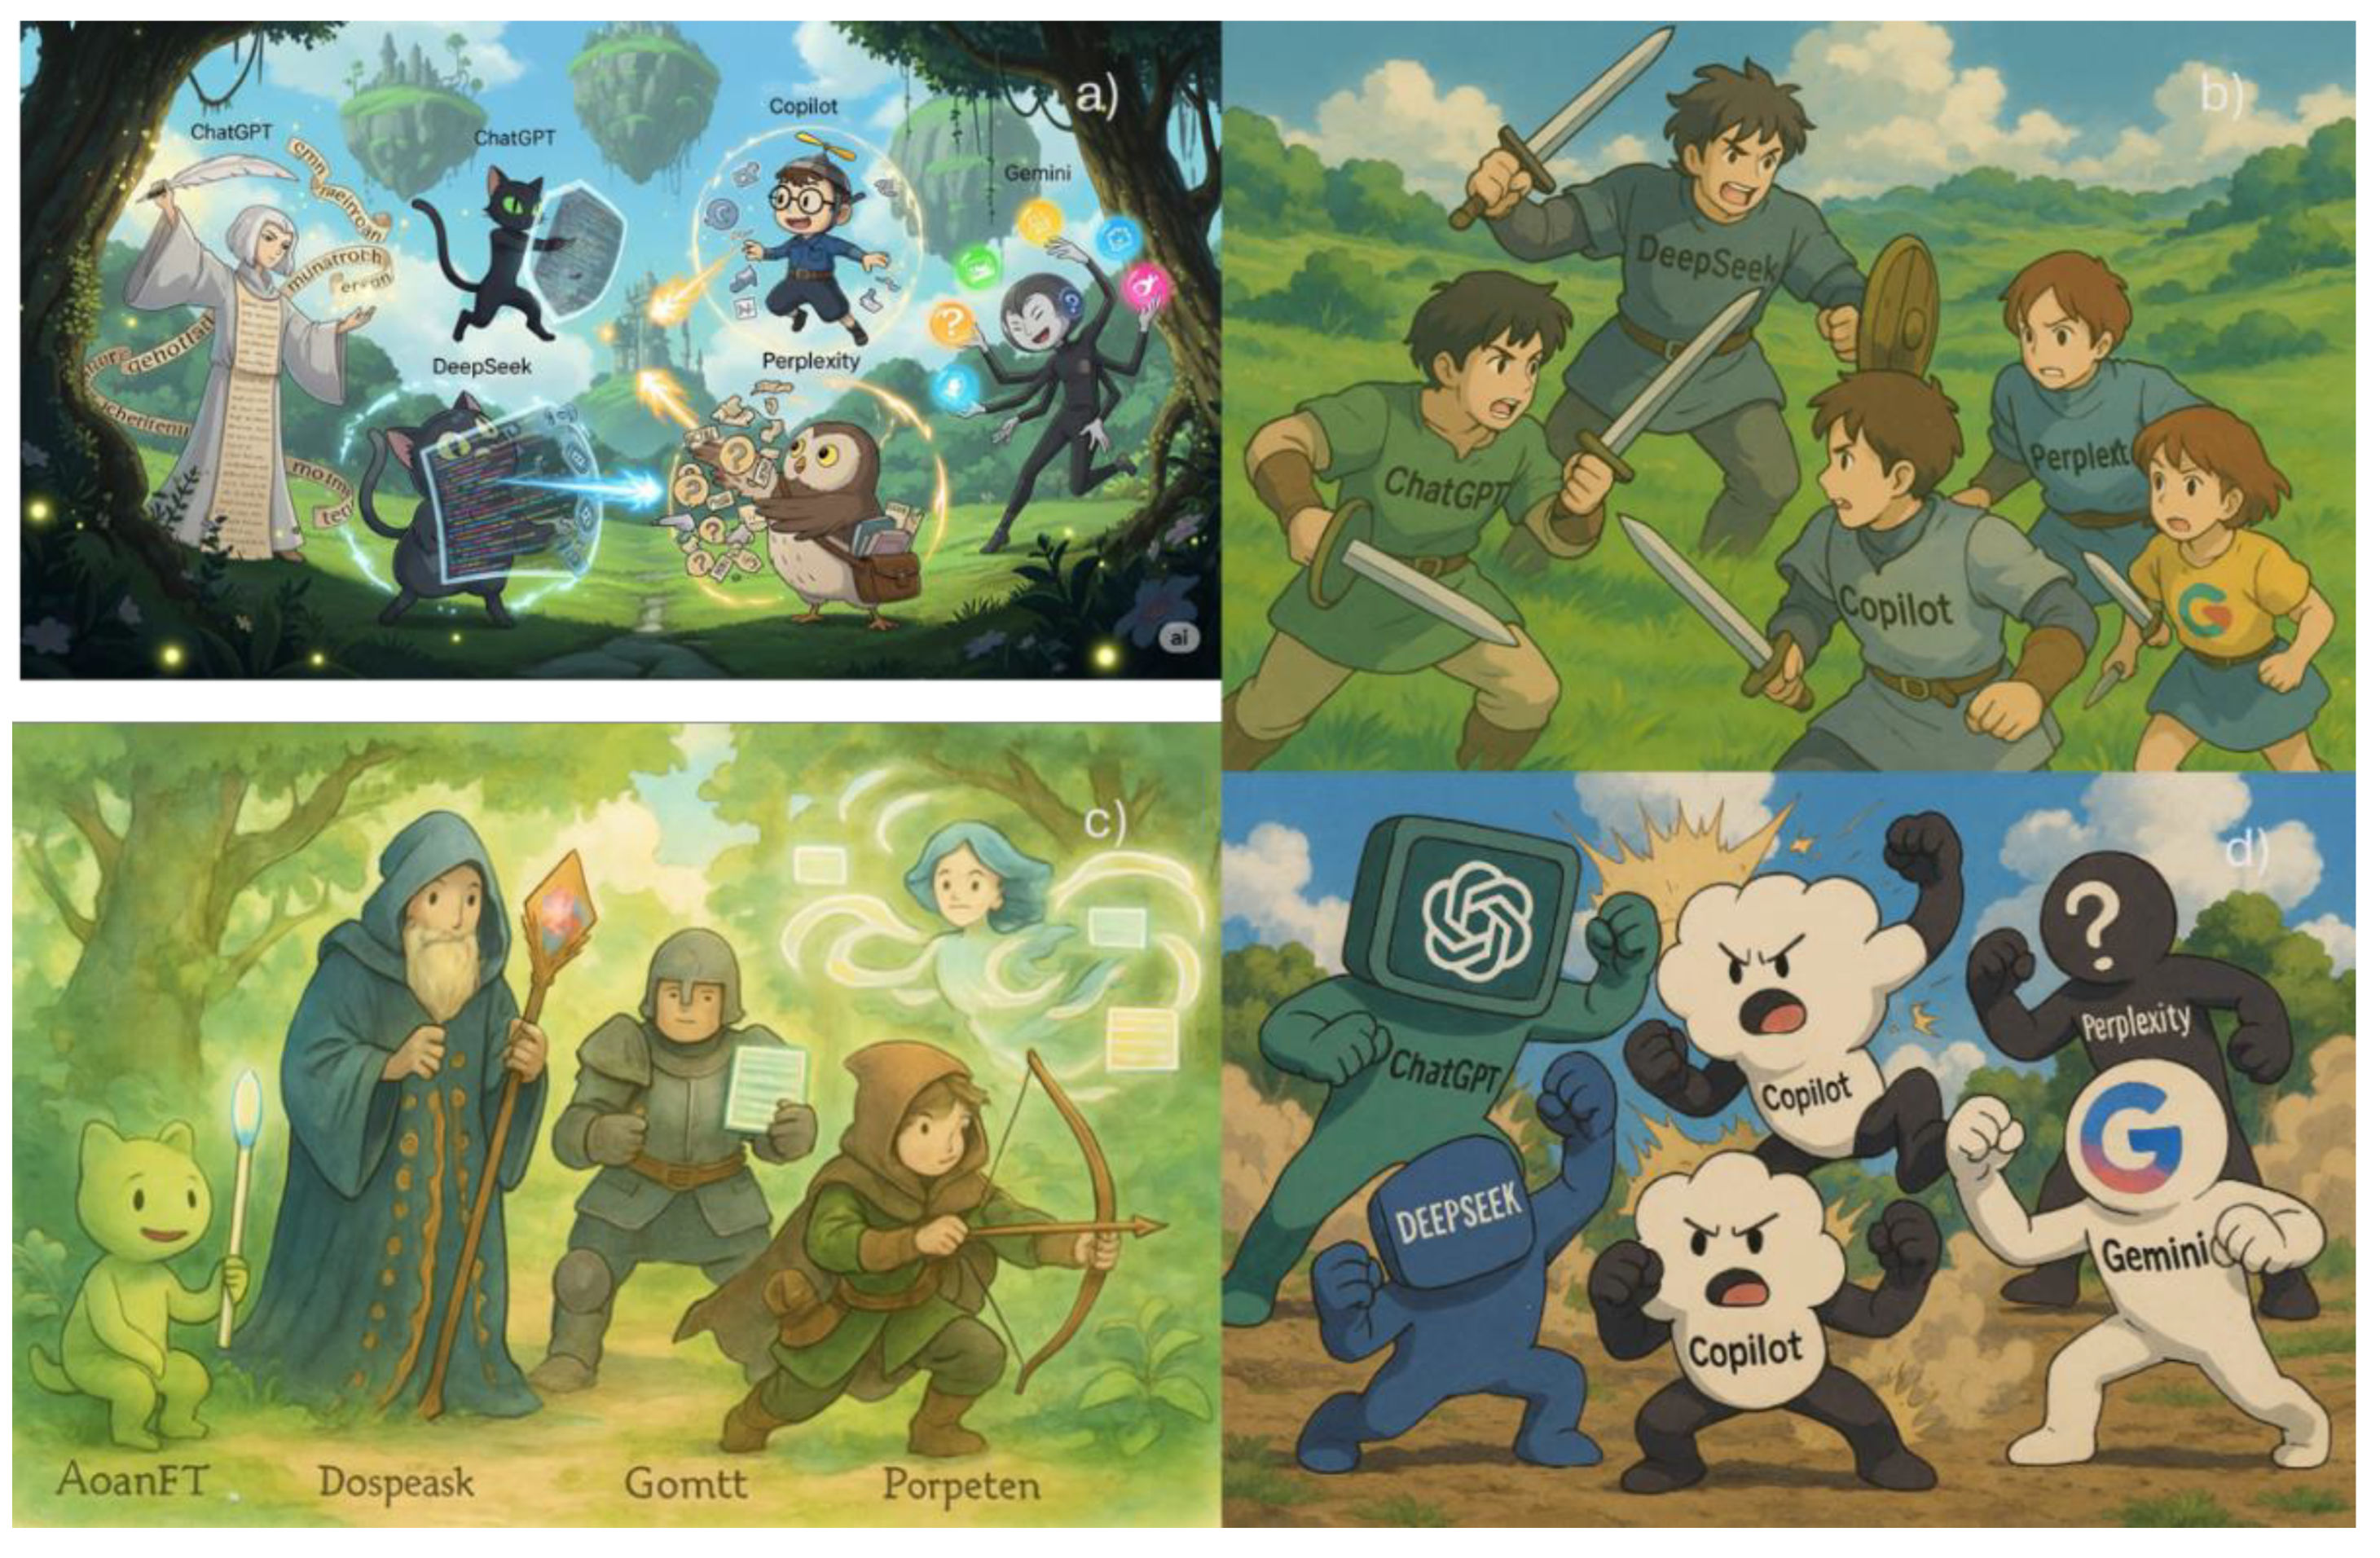
In March 2025, a trend emerged on social media in which users shared stylized images inspired by Studio Ghibli animations—often using the prompt, “illustrate in the style of Studio Ghibli a battle between ChatGPT, DeepSeek, Copilot, Perplexity, and Gemini.” Motivated by this trend, each of these chatbots was asked to generate illustrations in the Studio Ghibli style.
In April, Copilot and Gemini returned images featuring more than five characters, but without labels or clear associations between the figures and the individual chatbots. In contrast, ChatGPT produced a charming Ghibli-style illustration in which each character was distinctly and unambiguously linked to a specific chatbot (Figure 8).
In May, the same labeling issue persisted: both Copilot and Gemini again produced images with more than five characters, but without assigning chatbot names to the individual figures. Copilot’s image had a Star Wars theme (Figure 9a), while Gemini depicted magical fantasy characters (Figure 9b). Perplexity provided an illustration featuring humanoid robots in combat; however, only four were shown, and while the robots were labeled, the Perplexity robot itself was missing (Figure 9c). Once again, ChatGPT delivered a clear battle scene with five distinct, properly labeled characters—each representing a specific chatbot (Figure 9d).
In August 2025, the illustrations were regenerated to ensure consistency and clarity (Figure 10). Gemini returned an image with six magical characters, two of which were labeled as ChatGPT (Figure 10a). ChatGPT again illustrated a battle with five unique figures, each accurately named after a different chatbot (Figure 10b). Perplexity provided a scene featuring five fantasy adventurers; however, only four names were given, and they bore no clear connection to the actual chatbot names (Figure 10c). Finally, Copilot produced a combat scene with six figures, each bearing a chatbot’s name—though notably, two of the characters were labeled as Copilot (Figure 10d).
A notable outcome of this exercise is that each chatbot consistently produced visually and stylistically distinct interpretations of the same prompt—highlighting their differing design philosophies and creative capacities.
Figure 9.
Illustration of a battle between chatbots builds in style studio Ghibli using a) Copilot, b) Gemini, c) Perplexity, and d) ChatGPT, in May 2025.
Figure 9.
Illustration of a battle between chatbots builds in style studio Ghibli using a) Copilot, b) Gemini, c) Perplexity, and d) ChatGPT, in May 2025.
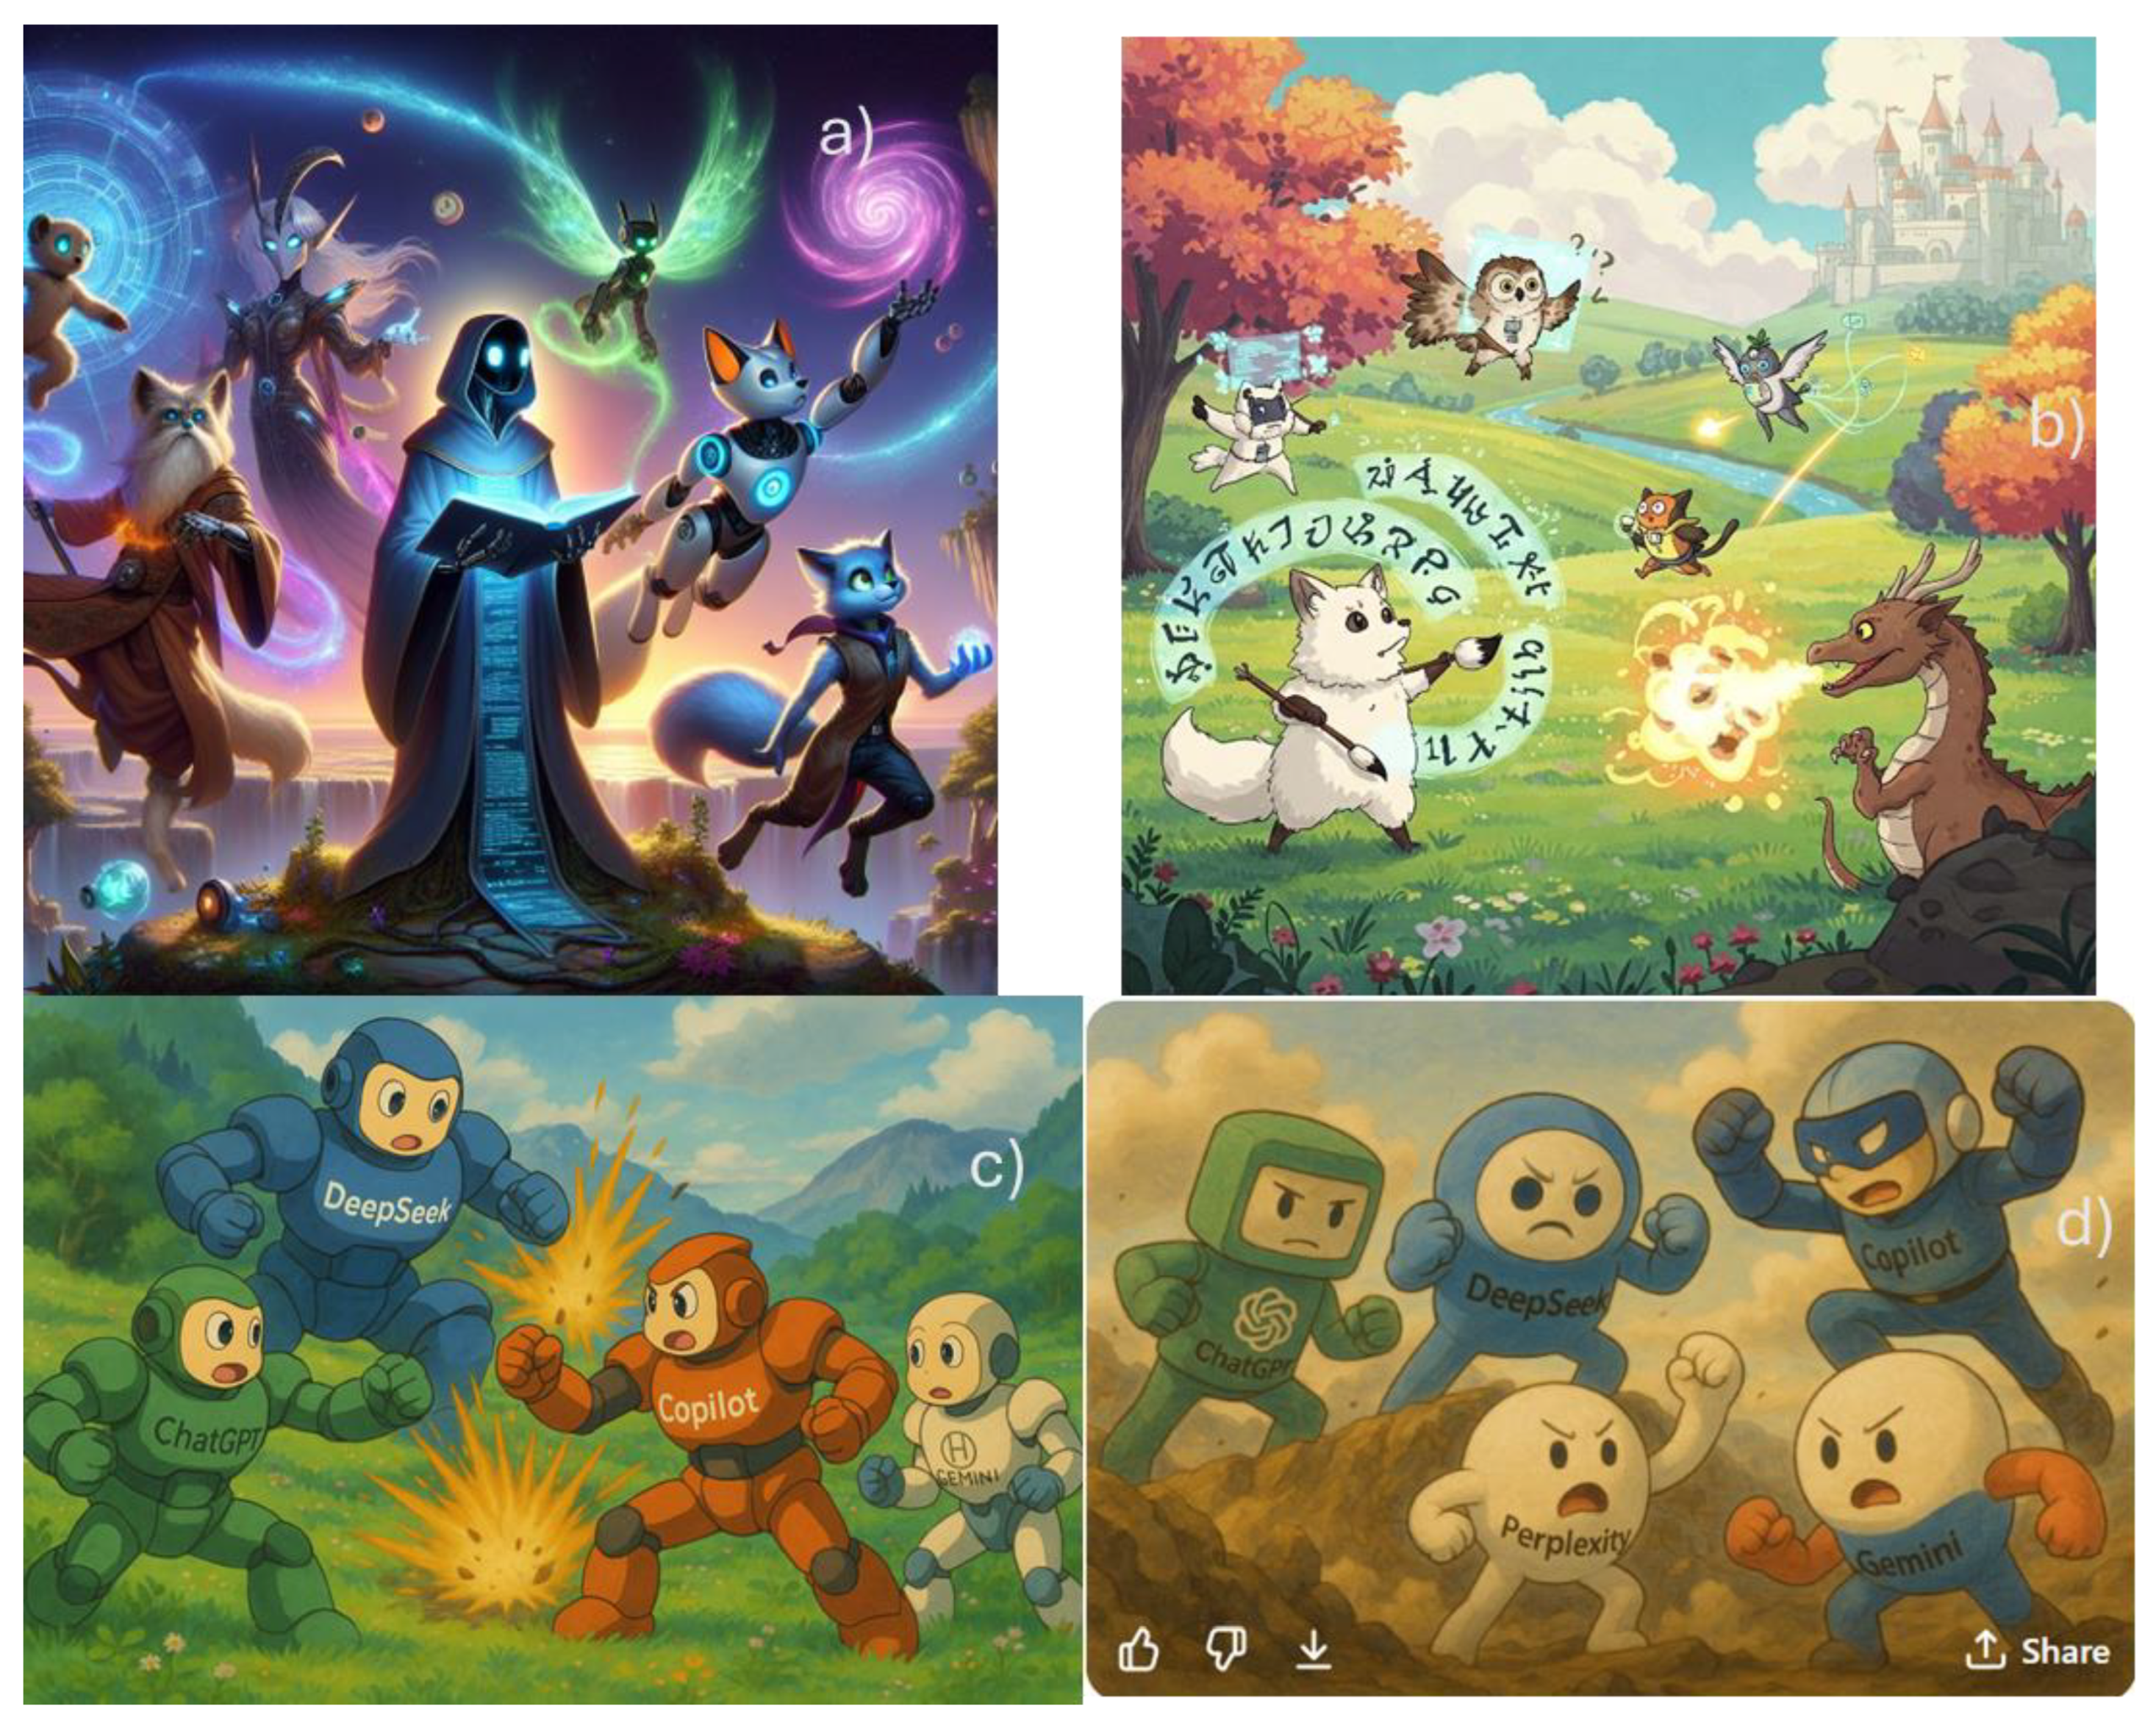
Figure 10.
lustrations build in style studio Ghibli using a) Gemini, b) ChatGPT, c) Perplexity, and d) Copilot, in August 2025.
Figure 10.
lustrations build in style studio Ghibli using a) Gemini, b) ChatGPT, c) Perplexity, and d) Copilot, in August 2025.
4. Plotting Your Dataset
This section was devoted to shown how dataset can be analyzed and plotted using chatbots. This section was build in August 2025 since chatbots can upload spreadsheets,[2,23] it used the publicly available Wisconsin Diagnostic Breast Cancer (WDBC.csv; supporting information) dataset, obtained from the UCI Machine Learning Repository, was used for this study [33,34,35,36]. It consists of 569 observations, each corresponding to a digitized image of a fine needle aspirate (FNA) of a breast mass. The dataset contains 30 numerical features extracted from these images (each one explained in detail in WDBC.docx; supporting information), which describe various morphological characteristics of the cell nuclei present in the sample. These features are computed from ten original measurements—namely, radius, texture, perimeter, area, smoothness, compactness, concavity, concave points, symmetry, and fractal dimension—each reported as a mean, standard error, and worst-case (i.e., largest value). All features are continuous and have been scaled for analysis.
In addition to these descriptors, each sample is labeled as either malignant or benign, based on clinical diagnosis. There are 357 benign and 212 malignant cases in the dataset.
4.1. Building Box Plots
Box plots are statistical visualizations that summarize the distribution of a dataset by displaying its median, quartiles, and potential outliers [37,38,39]. They are particularly useful for comparing groups, such as malignant and benign tumor classifications, by highlighting differences in central tendency and variability across features like mean radius, texture, and perimeter.
It was prompt - Generate a grouped box plot comparing the distributions of mean radius, mean texture, and mean perimeter features, stratified by diagnosis (Malignant vs. Benign). Chatbots build box plots comparing those parameters as shown in Figure 11.
Copilot visualized each feature in separate plots (Figure 11), an approach that facilitates scale-sensitive comparisons across features. In contrast, Gemini (Figure 12a) and ChatGPT (Figure 12b) consolidated all features into single composite plots. The plots clearly demonstrate that the malignant group exhibits larger mean radius, mean texture, and mean perimeter values compared to the benign group.
4.2. Building Histograms
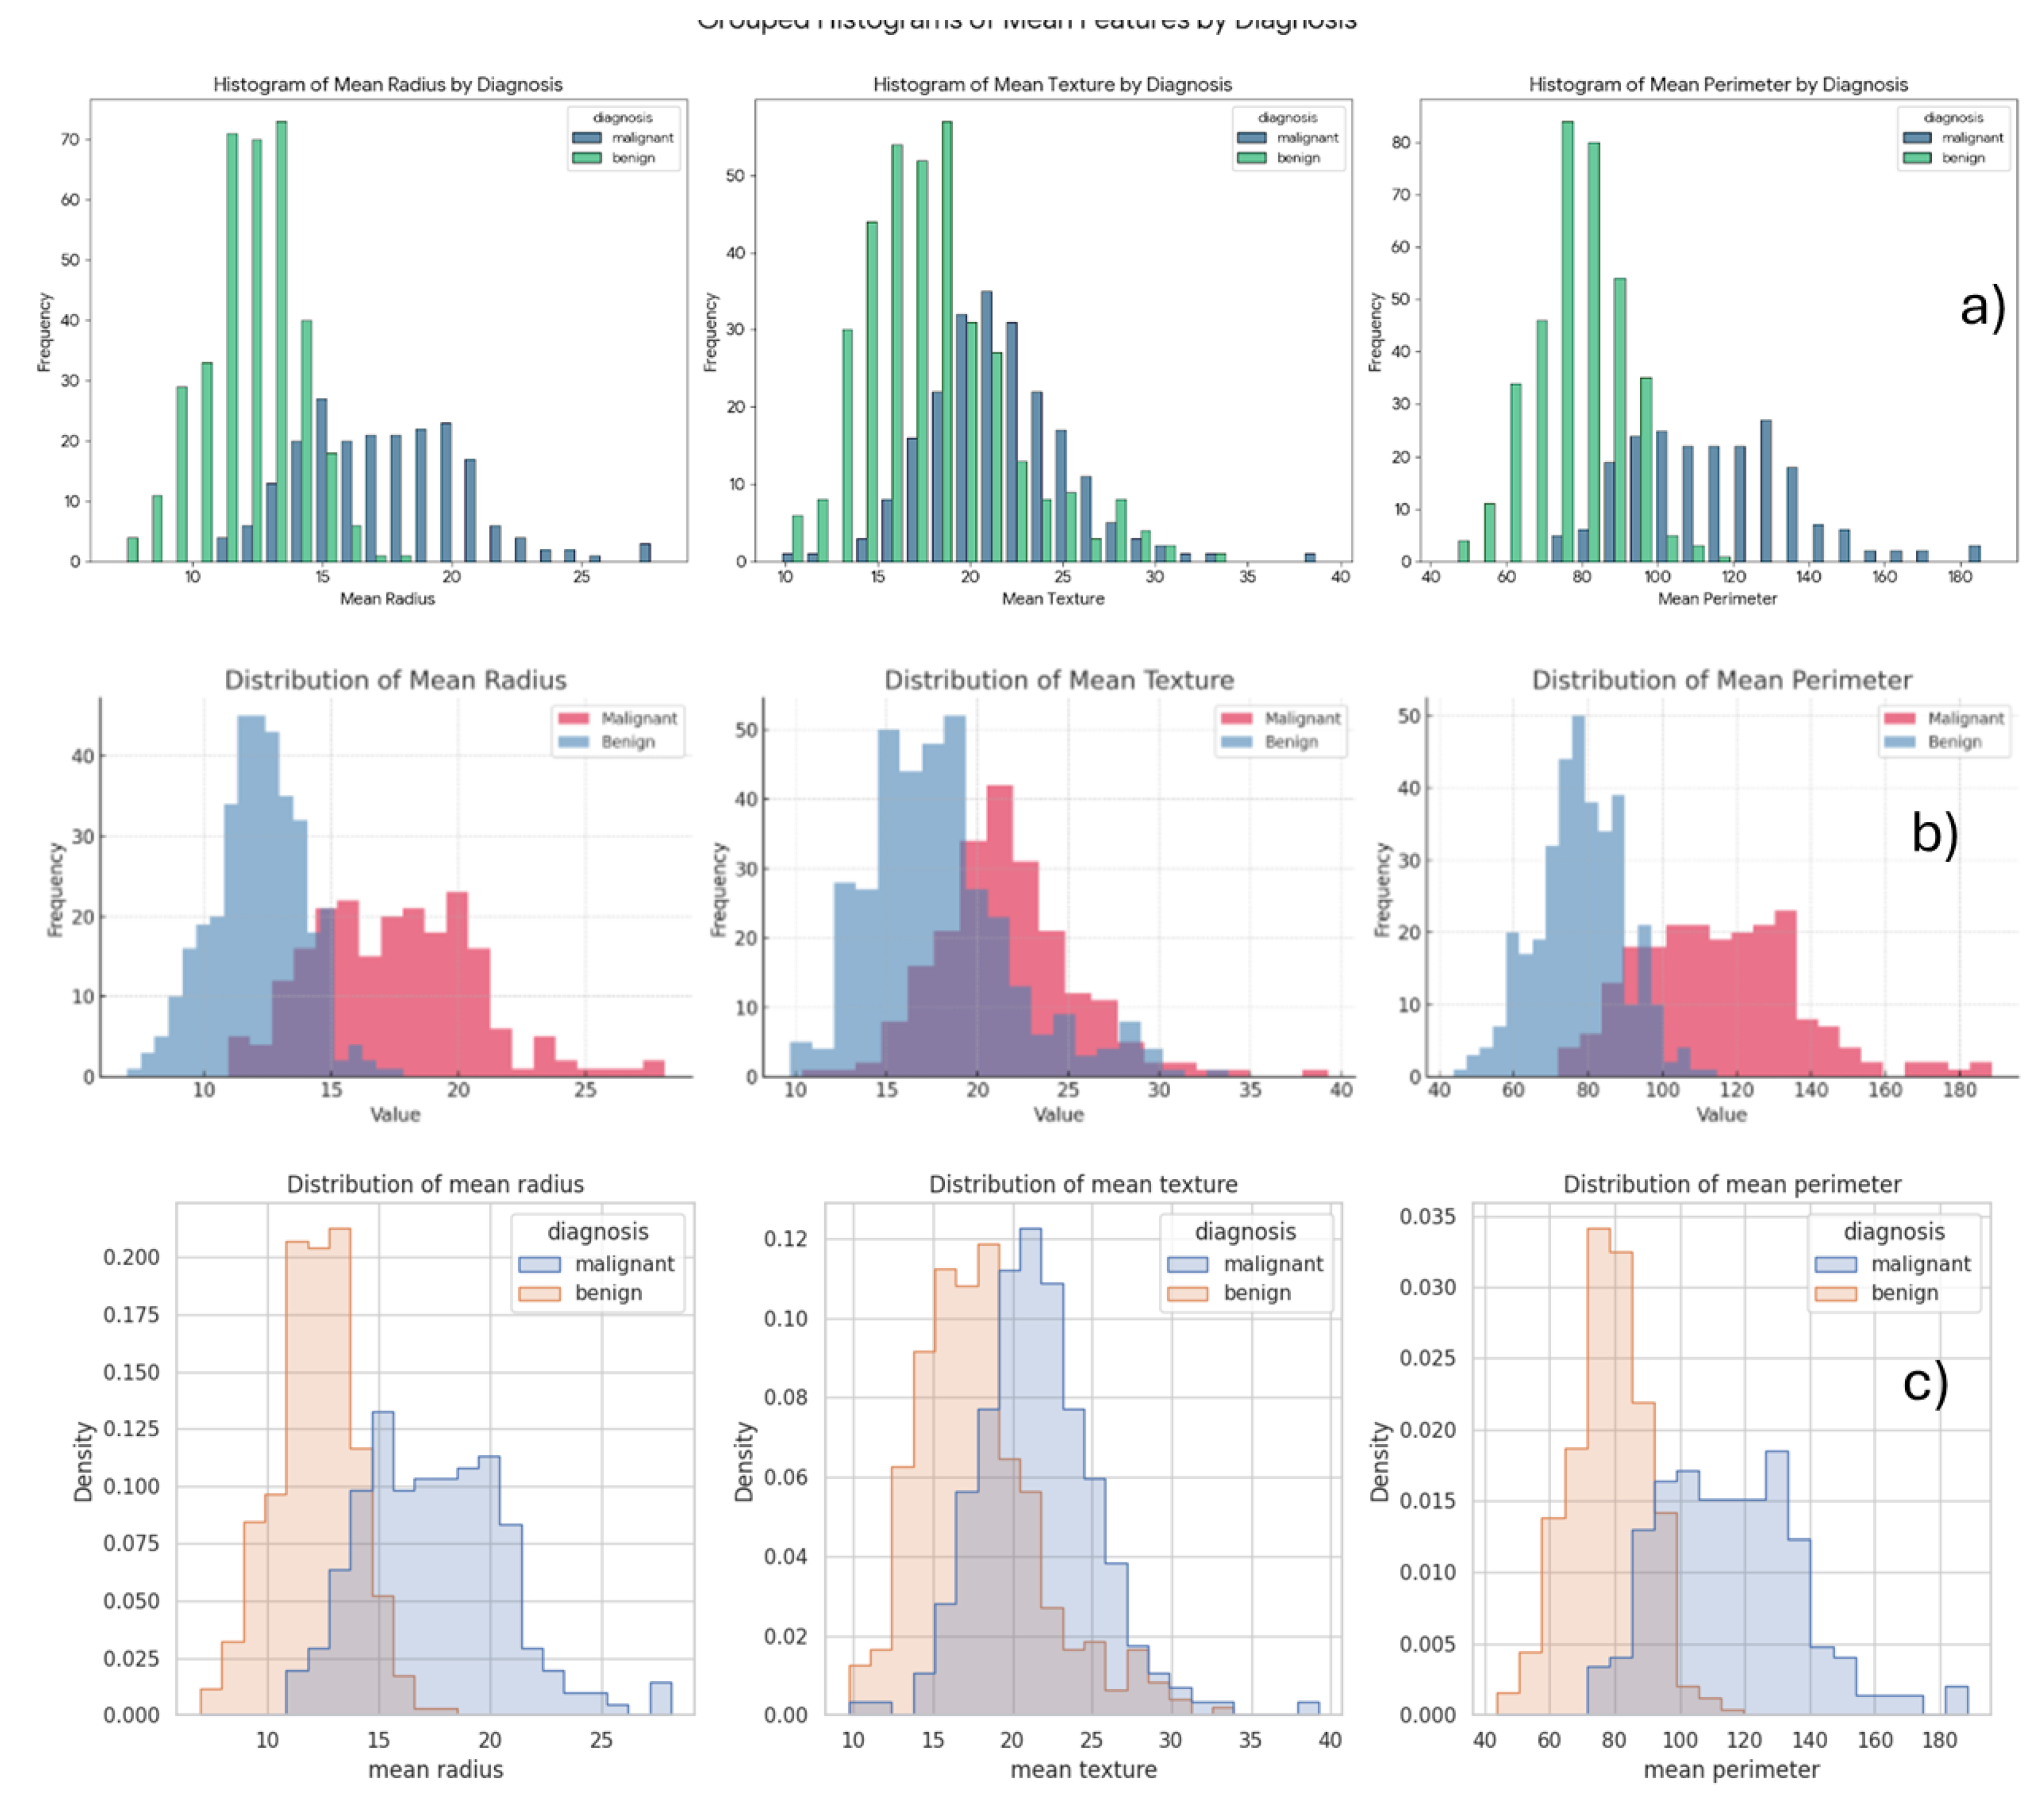
Histograms, on the other hand, illustrate the frequency distribution of a single variable by grouping data into bins [40,41]. They provide insight into the shape of the data—whether it’s skewed, uniform, or normally distributed—and are effective for identifying patterns such as clustering or gaps within malignant and benign tumor measurements.
Chatbots were prompted to generate grouped histograms comparing the distributions of mean radius, mean texture, and mean perimeter features, stratified by diagnosis (Malignant vs. Benign). The resulting histograms are shown in Figure 13. Gemini presented the data using bar plots with distinct colors for benign and malignant cases (Figure 13a). ChatGPT (Figure 13b) and Copilot (Figure 13c) produced similar visualizations, where each group is represented by a different color and the area between the two distributions is shaded to highlight the overlap.
These plots clearly demonstrate that the malignant group exhibits higher values for mean radius, mean texture, and mean perimeter when compared to the benign group.
Figure 13.
the grouped histograms comparing the distributions of mean radius, mean texture, and mean perimeter features, stratified by Malignant and Benign diagnoses a) Gemini, b) ChatGPT, c) Copilot.
Figure 13.
the grouped histograms comparing the distributions of mean radius, mean texture, and mean perimeter features, stratified by Malignant and Benign diagnoses a) Gemini, b) ChatGPT, c) Copilot.
4.2. Building Heatmaps and Correlations
A heatmap is a data visualization technique that uses color gradients to represent the magnitude of values in a matrix. In the Wisconsin Breast Cancer dataset, the heatmap was employed to display the correlation coefficients between pairs of numerical features. When prompted with ’Build the heatmap of this dataset,’ Gemini, Copilot, and ChatGPT each generated heatmaps. Figure 14 presents an example of a heatmap produced using Copilot." Perplexity and DeepSeek do not generate the plot, those chatbots just provided scripts in pythons
Chatbots can be employed to identify both the strongest and weakest correlations within a dataset. For example, when prompted with ’Which features exhibited the strongest correlations in this dataset?’, the chatbots were able to interpret the heatmap and return precise results. Table 3, generated by Copilot, highlights the most highly correlated pairs of numerical features—primarily among tumor size metrics such as radius, perimeter, and area. These strong relationships indicate redundancy and potential multicollinearity, which are important considerations for feature selection and model optimization. Similarly, when prompted with ’Which features exhibited the weakest correlations in this dataset?’, the chatbots were also able to identify the least related feature pairs. Table 4, created by Copilot, presents these weakest correlations in the dataset. Perplexity and ChatGPT produced similar outputs, confirming the consistency of chatbot-based analysis in detecting correlation patterns
"The chatbots are capable of generating correlation plots when prompted with requests such as: ’Construct correlation plots for the following feature pairs: (i) mean perimeter vs. mean radius, and (ii) mean fractal dimension vs. radius error.’ In their initial attempts, Copilot, Gemini, and ChatGPT successfully produced meaningful plots (Figure 15). An example of the correlation plots generated by Gemini is shown in Figure 15. In contrast, DeepSeek and Perplexity were unable to generate these plots.
5. Unsupervised Methods: PCA and HCA
Unsupervised methods in machine learning are a class of algorithms that work with unlabeled data to identify hidden patterns and intrinsic structures. Unlike supervised methods, which require a labeled training dataset, unsupervised algorithms aim to discover relationships and organize data independently[42].
The ability of chatbots to perform unsupervised methods is particularly interesting in the classroom, as undergraduate and graduate chemometrics courses often struggle to provide graphical user interface (GUI) software for such applications.[43] While there are good free options available through coding platforms such as Python and R [44,45,46], many students are unfamiliar with programming, which can limit their accessibility.
5.1. Principal Component Analysis (PCA)
Principal Component Analysis (PCA) is an unsupervised technique primarily used for dimensionality reduction. Its goal is to transform high-dimensional data into a smaller set of variables, called principal components, that capture the most significant variance in the original data [40,43,47,48,49,50,51]. By identifying the new axes along which the data varies the most, PCA allows for the visualization and simplification of complex datasets without losing crucial information [52].
The prompt "Build the score plot" was submitted to the chatbots, and the resulting score plots were generated (Figure 16). ChatGPT (Figure 16a), Copilot (Figure 16b), and Gemini (Figure 16c) produced identical plots, with benign and malignant samples represented in distinct colors. In the PCA score plot (Figure 16), a clear separation is observed between malignant (purple) and benign (yellow) cases. Malignant samples are primarily distributed on the right side of the plot, while benign cases are predominantly clustered on the left. This separation indicates that the first two principal components effectively discriminate between the two diagnostic groups.
Principal Component 1 (PC1) accounts for 44.27% of the total variance, and Principal Component 2 (PC2) captures 18.97%, providing a combined explanation of approximately 63% of the overall variability in the dataset. These results highlight the effectiveness of Principal Component Analysis (PCA) in visualizing and summarizing the diagnostic structure of the data.
Figure 16.
The PCA score plot has been rebuilt to show the percentage of variance explained by each principal component build using a) ChatGPT, b) Gemini, and c) Copilot.
Figure 16.
The PCA score plot has been rebuilt to show the percentage of variance explained by each principal component build using a) ChatGPT, b) Gemini, and c) Copilot.
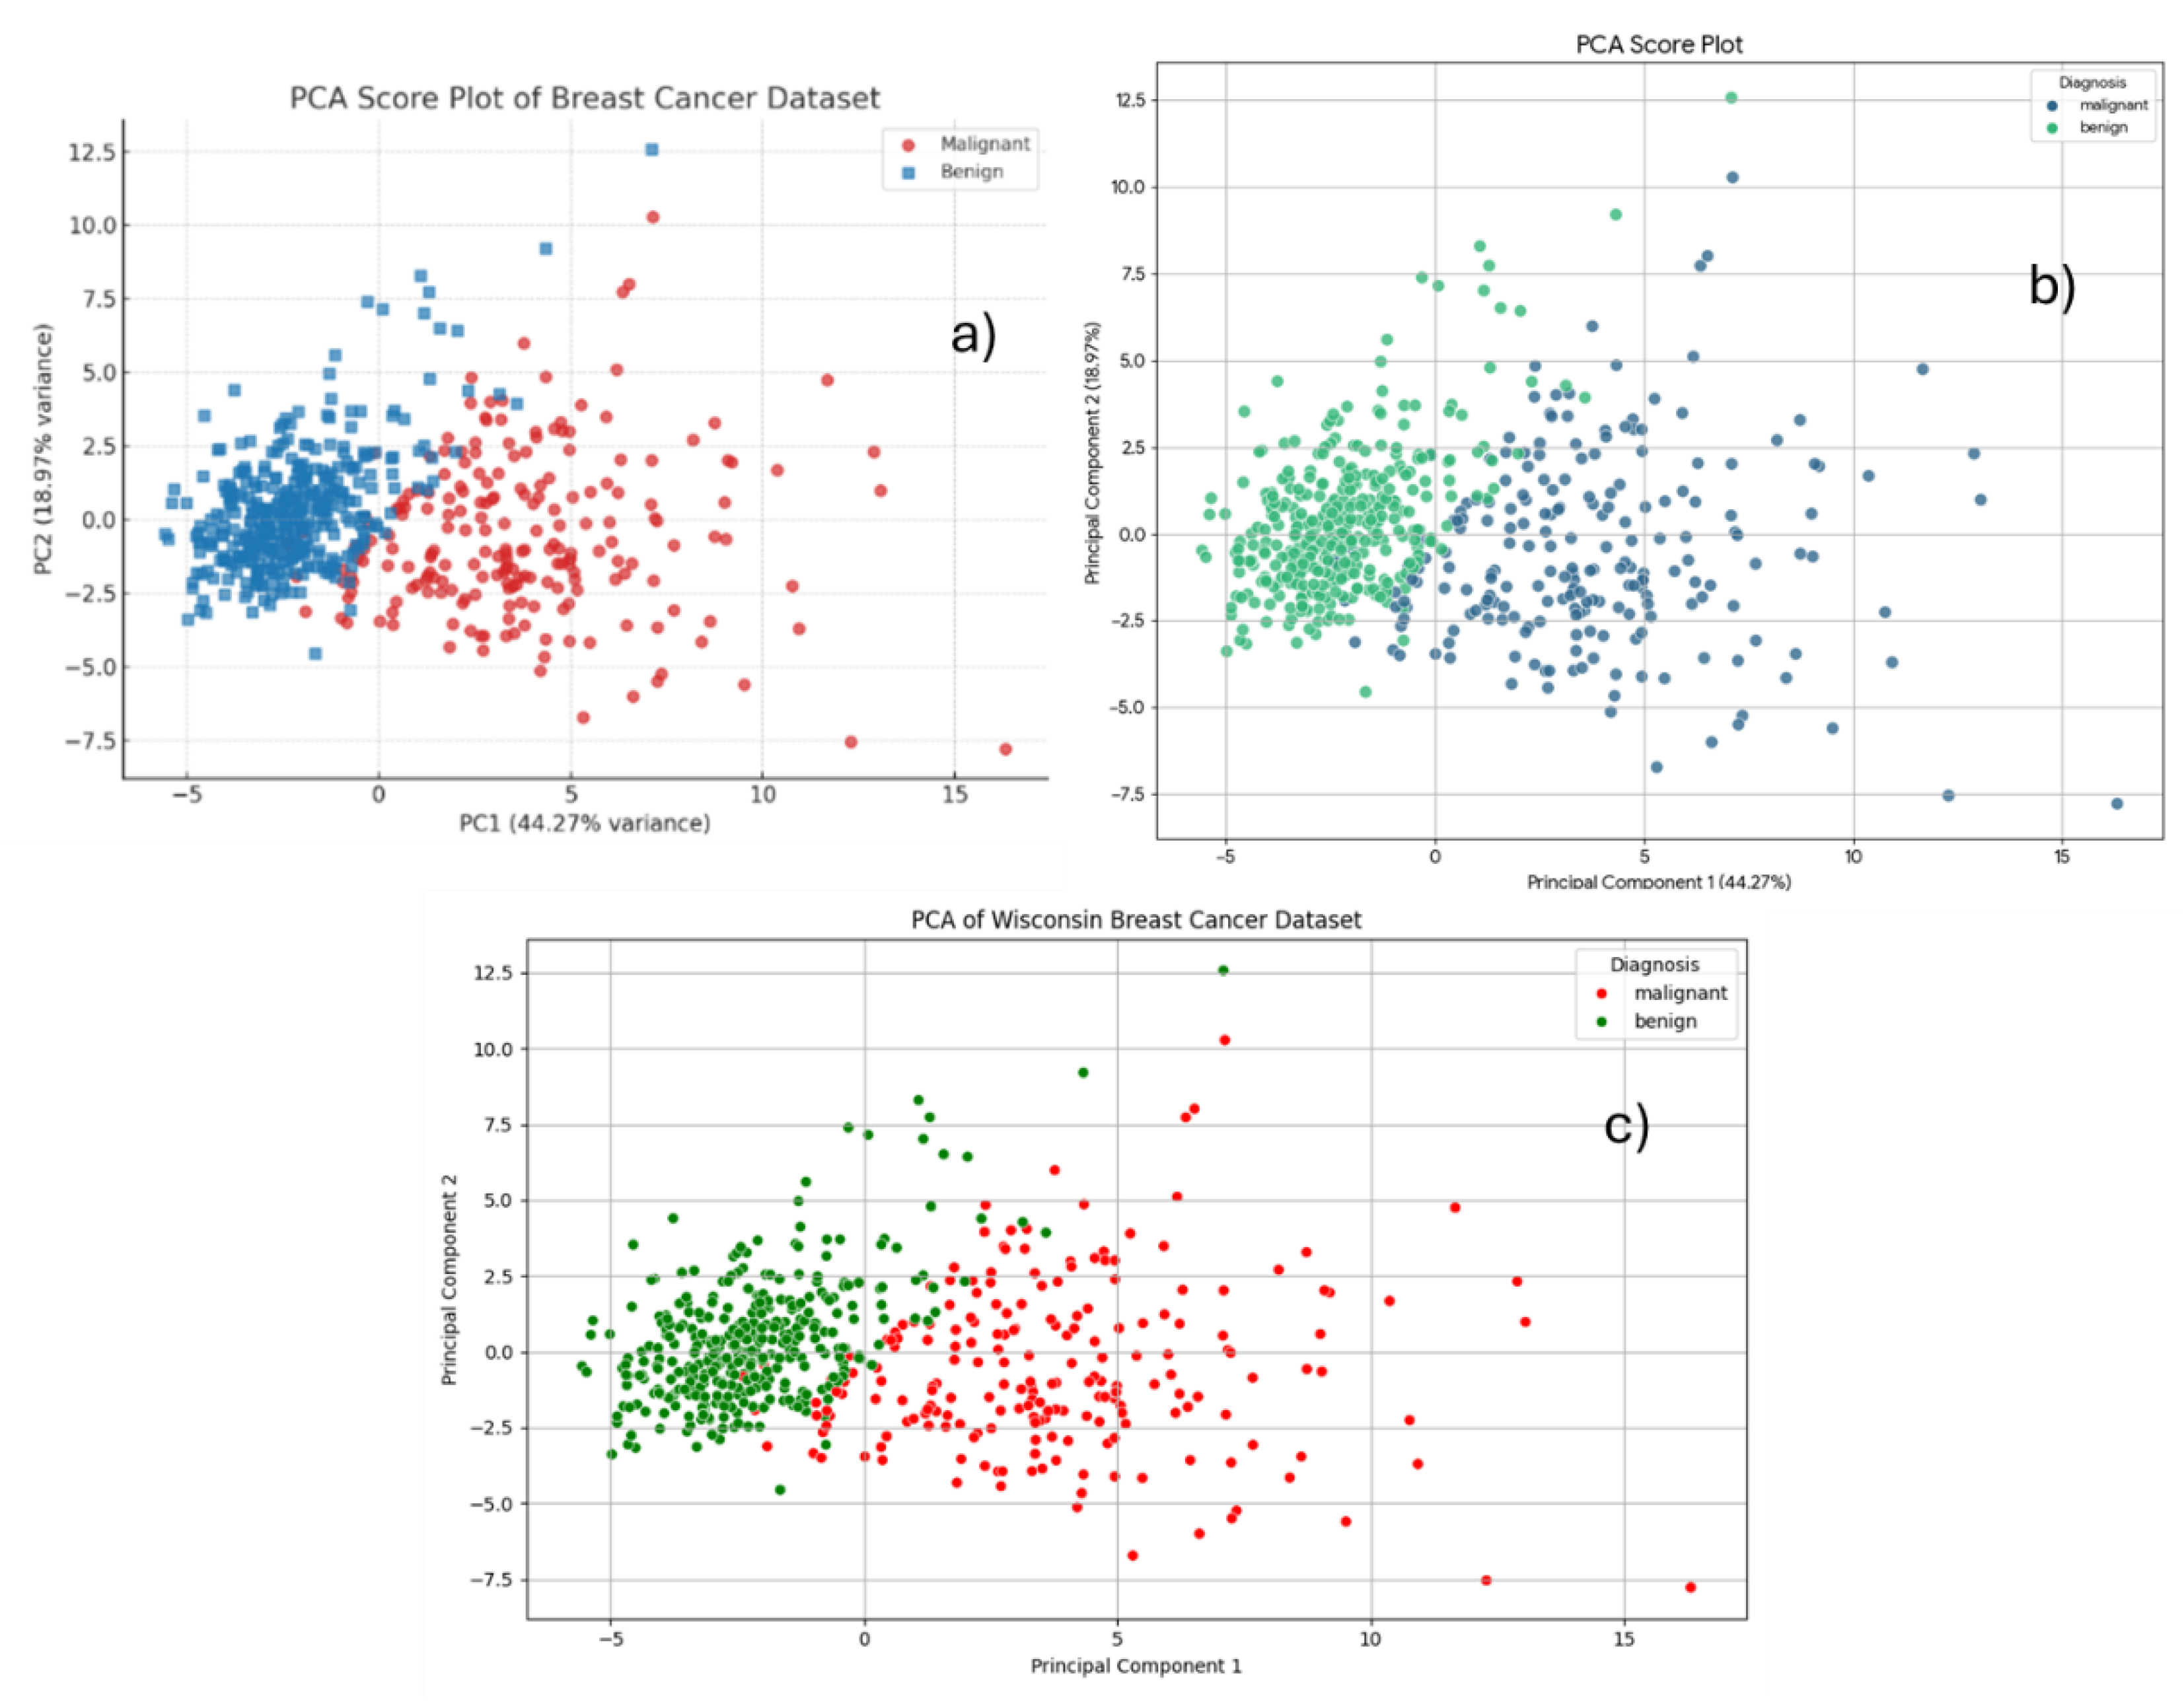
PCA works by identifying the directions of maximum variance in the data. If the data is not normalized, features with a larger range of values (and thus, higher variance) will have a disproportionately strong influence on the principal components. This can lead to misleading results where the principal components are simply reflecting the scale of the original features rather than the underlying structure of the data. Standardization, a common form of normalization, ensures that all features are on the same scale, so that each feature’s contribution is based on its actual importance and not its magnitude [52,53,54,55,56]. All chatbots correctly identified that the data required standardization prior to PCA analysis and automatically standardized the dataset before generating the score plots.
5.2. Hierarchical Cluster Analysis (HCA)
Hierarchical Cluster Analysis (HCA) is an unsupervised method used for clustering or grouping similar data points [57]. It builds a hierarchy of clusters, represented visually by a tree-like diagram called a dendrogram. HCA can be performed in one of two ways: agglomerative, which starts with each data point as its own cluster and then merges the closest clusters, or divisive, which begins with all data points in a single cluster and then splits it iteratively [58,59,60].
The prompt "Build an HCA for this dataset" was submitted to the chatbots. In response, the chatbot generated a dendrogram (Figure 17), which illustrates the hierarchical organization of the data based on similarity. In the dendrogram, shorter vertical lines represent higher intra-cluster similarity. A clear separation between benign (yellow) and malignant (purple) cases is evident, with each group forming distinct clusters at relatively high linkage distances. These results demonstrate that hierarchical cluster analysis (HCA) effectively distinguishes samples based on their diagnostic classification.
6. Supervised Methods
Big data-driven workflow combining LLM were frequently used.[61,62] This section explains how chatbots can be sued tighter with supervised methods. Random Forest is a machine learning algorithm applicable to both classification and regression tasks. Fundamentally, it is an ensemble method, meaning that it combines multiple decision trees to produce more accurate and robust predictions. In this study, chatbots were prompted to perform statistical analyses by uploading data and applying a Random Forest classification model [63,64,65]. For instance, when asked to “Determine the Precision, Recall, F1-Score, and ROC-AUC Score for the Random Forest classification with 5-fold cross-validation,” Copilot, ChatGPT, and Gemini each, in their first attempt, provided valid models, as summarized in Table 5. While the specific parameters varied slightly among the chatbots, all produced reliable classifications.
In addition to performance metrics, the chatbots were capable of generating graphical outputs. For example, when prompted with “Create a feature importance visualization for the Random Forest classification of the Wisconsin Breast Cancer dataset,” the chatbots returned feature importance plots. Figure 18 shows the plot generated by Copilot showing the variables with larger importance in the random forest classificatory model. The confusion matrix could also be constructed by the chatbots; when prompted with “Build the Confusion Matrix for 5-fold cross-validation using Random Forest,” ChatGPT, Copilot, and Gemini successfully produced confusion matrices. Figure 19 shows the confusion matrix generated by Copilot, which indicates that the classifier correctly identified 345 benign and 198 malignant cases. It misclassified 12 malignant cases as benign (false negatives), which is particularly critical in medical diagnostics, as it may result in missed or delayed treatment. Additionally, 14 benign cases were misclassified as malignant (false positives), potentially causing unnecessary anxiety or treatment.
Table 5.
presents a consolidated comparison of the performance metrics obtained from Random Forest classification models generated by the three chatbots.
Table 5.
presents a consolidated comparison of the performance metrics obtained from Random Forest classification models generated by the three chatbots.
| Metric | Copilot | ChatGPT | Gemini | Key Observations |
| Precision | 95.27% | 94.2% | 95.29% | All models show similar precision (94.2-95.3%) |
| Recall | 92.49% | 92.5% | 92.97% | Recall consistently ~92.5-93% across models |
| F1-Score | 93.80% | 93.3% | 94.04% | Balanced performance in all versions |
| ROC-AUC | 94.84% | 0.945 (94.5%) | 99.15% | Second Copilot shows exceptional AUC (99.15%) |
Table 6.
Comparative table summarizing the performance of the three Random Forest configurations implemented by each chatbot.
Table 6.
Comparative table summarizing the performance of the three Random Forest configurations implemented by each chatbot.
| Parameter | ChatGPT | Gemini | Copilot | Impact Analysis |
| n_estimators (Trees) | 200 | 100 | 100 | More trees → better stability but slower |
| max_depth (Tree Depth) | 10 | 10 | None (unlimited) | Unlimited depth risks overfitting |
| criterion (Split Rule) | Gini | Gini | Gini | Standard for classification |
| min_samples_leaf | 2 | 1 | 1 | Higher values prevent overfitting |
| random_state | 42 | 42 | 42 | Ensures reproducibility |
7. Image Interpretation
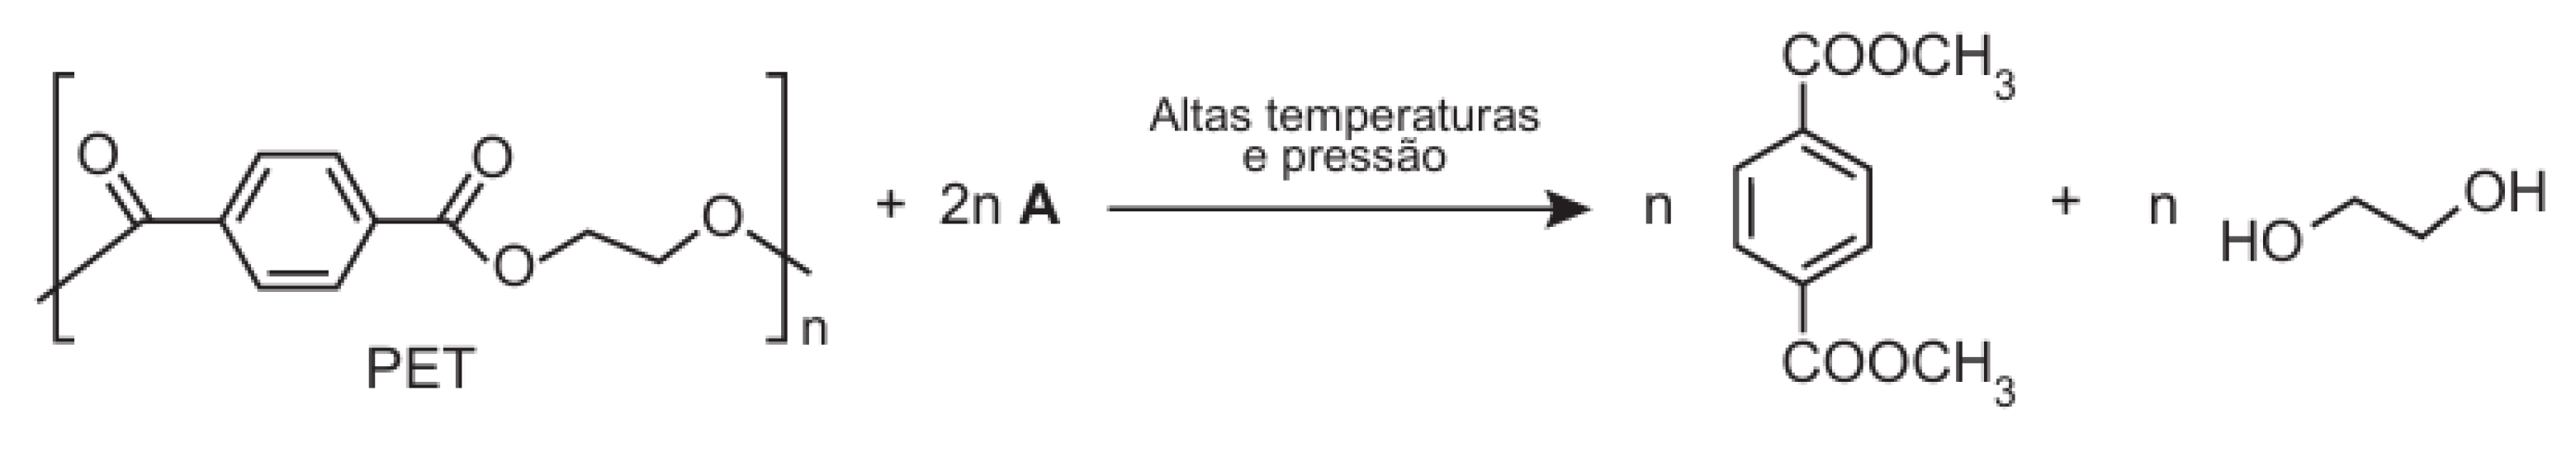
Recently, chatbots can also upload and analyze images.[13,14]. To evaluate the ability of chatbots to interpret chemical reaction schemes, we selected a question involving a transesterification reaction. The chatbots were presented with the following prompt:
"One of the chemical recycling techniques for the polymer PET [poly(ethylene terephthalate)] produces methyl terephthalate and ethanediol, as shown in the reaction scheme (Figure 20), and occurs through a transesterification reaction. Compound A, represented in the reaction scheme, is:"
This question required chatbots to recognize the structural components in the image and apply their understanding of the transesterification mechanism to correctly identify Compound A. All chatbots successfully identified Compound A as methanol, demonstrating a satisfactory level of chemical reasoning in this case.
For example, DeepSeek responded:
"The correct Compound A is methanol, as it provides the CH₃O– group needed to form methyl terephthalate."
This result indicates that chatbots can correctly associate reaction mechanisms with visual representations, at least for relatively straightforward organic transformations.
Figure 20.
Transesterification of PET: Under high temperature and pressure.
Subsequently to evaluate the ability of chatbots to integrates multiple layers of chemical understanding that go beyond simple recall. The chatbots were presented with the following prompt:
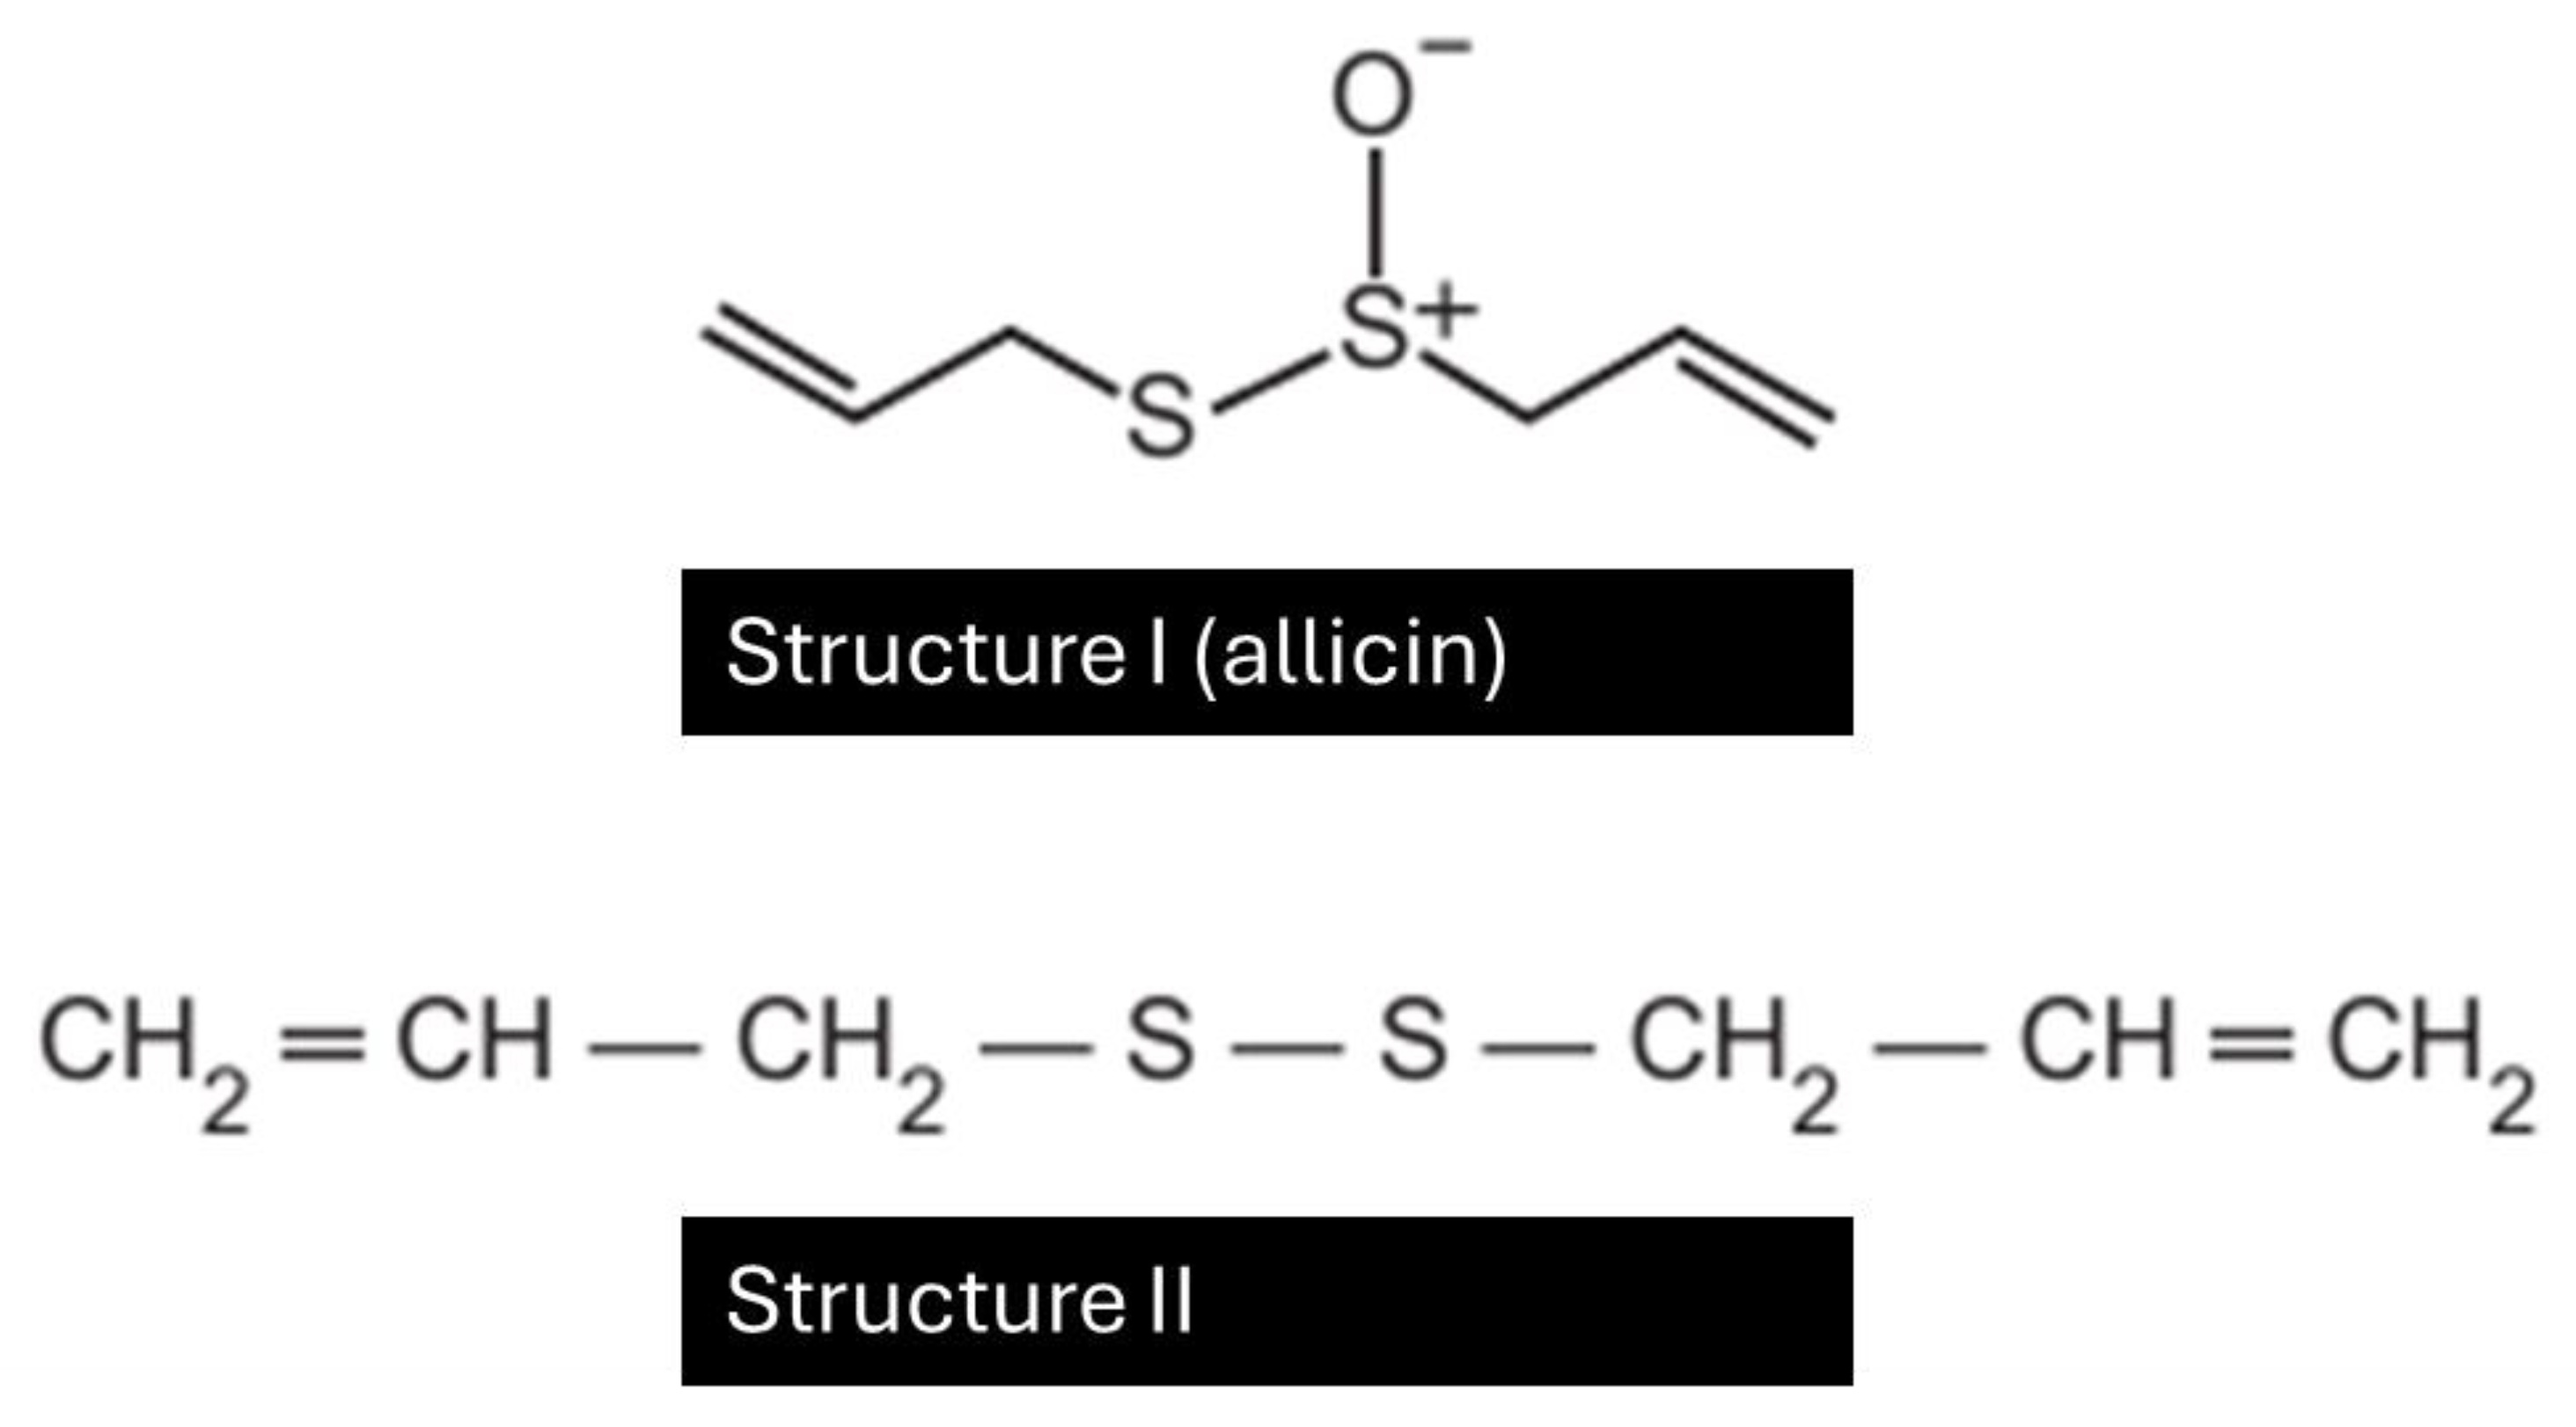
The odor that remains on the hands after contact with garlic can be eliminated by using a "stainless steel soap", composed of stainless steel (74%), chromium, and nickel. The main advantage of this “soap” is that it does not wear out with use. Consider that the main substance responsible for garlic’s odor is allicin (structure I), and that to eliminate the odor, it must be transformed into structure II. In the conversion from I to II (Figure 21), the “soap” acts as a(n) ___.
All chatbots successfully identified that it was a reduction, since an oxygen atom was lost.
For example, ChatGPT responded:
"The correct Compound A is methanol, as it provides the CH₃O– group needed to form methyl terephthalate."
Structure I (allicin) is a sulfoxide (with an S=O bond).
Structure II is a disulfide (R–S–S–R), with no oxygen.
This means the transformation involves the reduction of a sulfoxide to a disulfide.
Figure 21.
Chemical transformation of allicin (Structure I), the compound responsible for garlic’s odor, into a disulfide (Structure II).
Figure 21.
Chemical transformation of allicin (Structure I), the compound responsible for garlic’s odor, into a disulfide (Structure II).
Subsequently to evaluate the ability of chatbots to integrates multiple layers of chemical understanding that go beyond simple recall. The chatbots were presented with the following prompt:
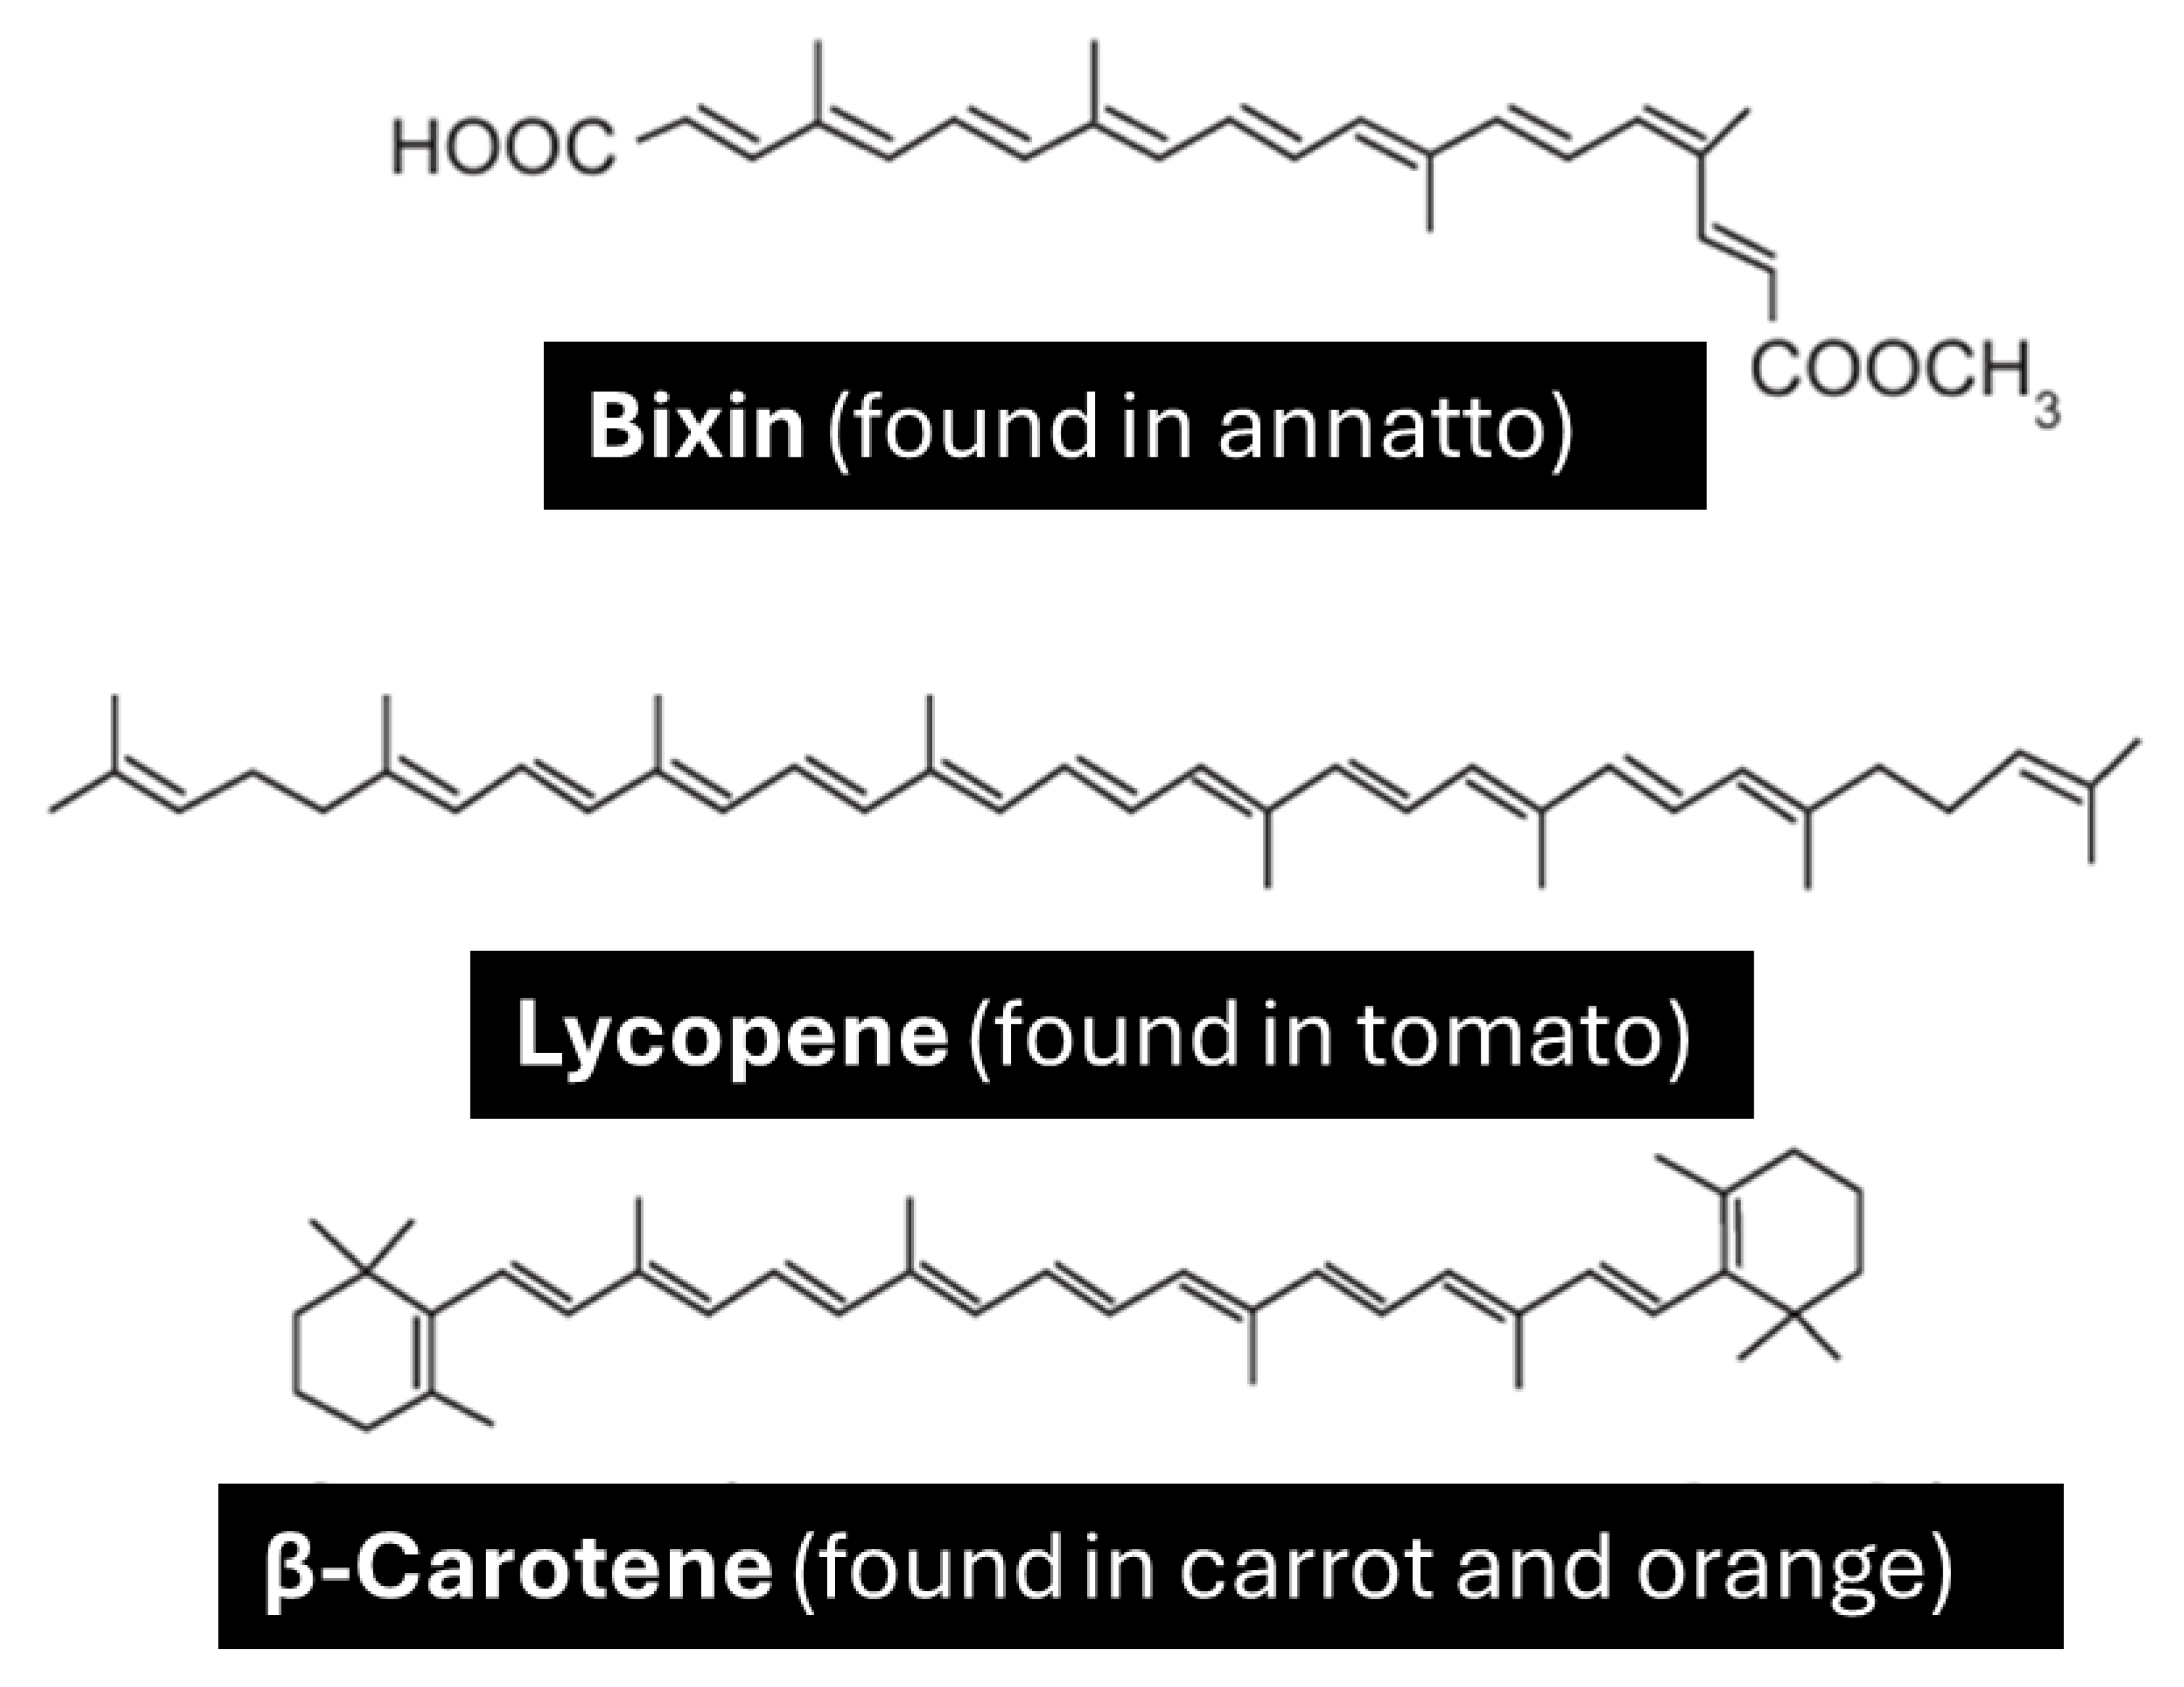
The use of dyes in the food industry is widespread, and the preference for natural dyes has been increasingly explored for various reasons. Below are shown three structures of natural dyes Figure 22. The common property among these structures that gives color to these compounds is the presence of:
All chatbots successfully identified that natural dyes had conjugated bonds.
For example, Copilot responded:
Conjugated systems consist of alternating single and double bonds, which allow electrons to delocalize across the molecule. Conjugation allows for electron delocalization, which lowers the energy required to excite electrons. This is the main reason many organic compounds appear colored.
Figure 22.
Structures of natural pigments: Bixin (from annatto), Lycopene (from tomato), and β-Carotene (from carrot and orange), all of which are carotenoids with antioxidant properties.
Figure 22.
Structures of natural pigments: Bixin (from annatto), Lycopene (from tomato), and β-Carotene (from carrot and orange), all of which are carotenoids with antioxidant properties.
8. Image Interpretation and Generation in Classroom
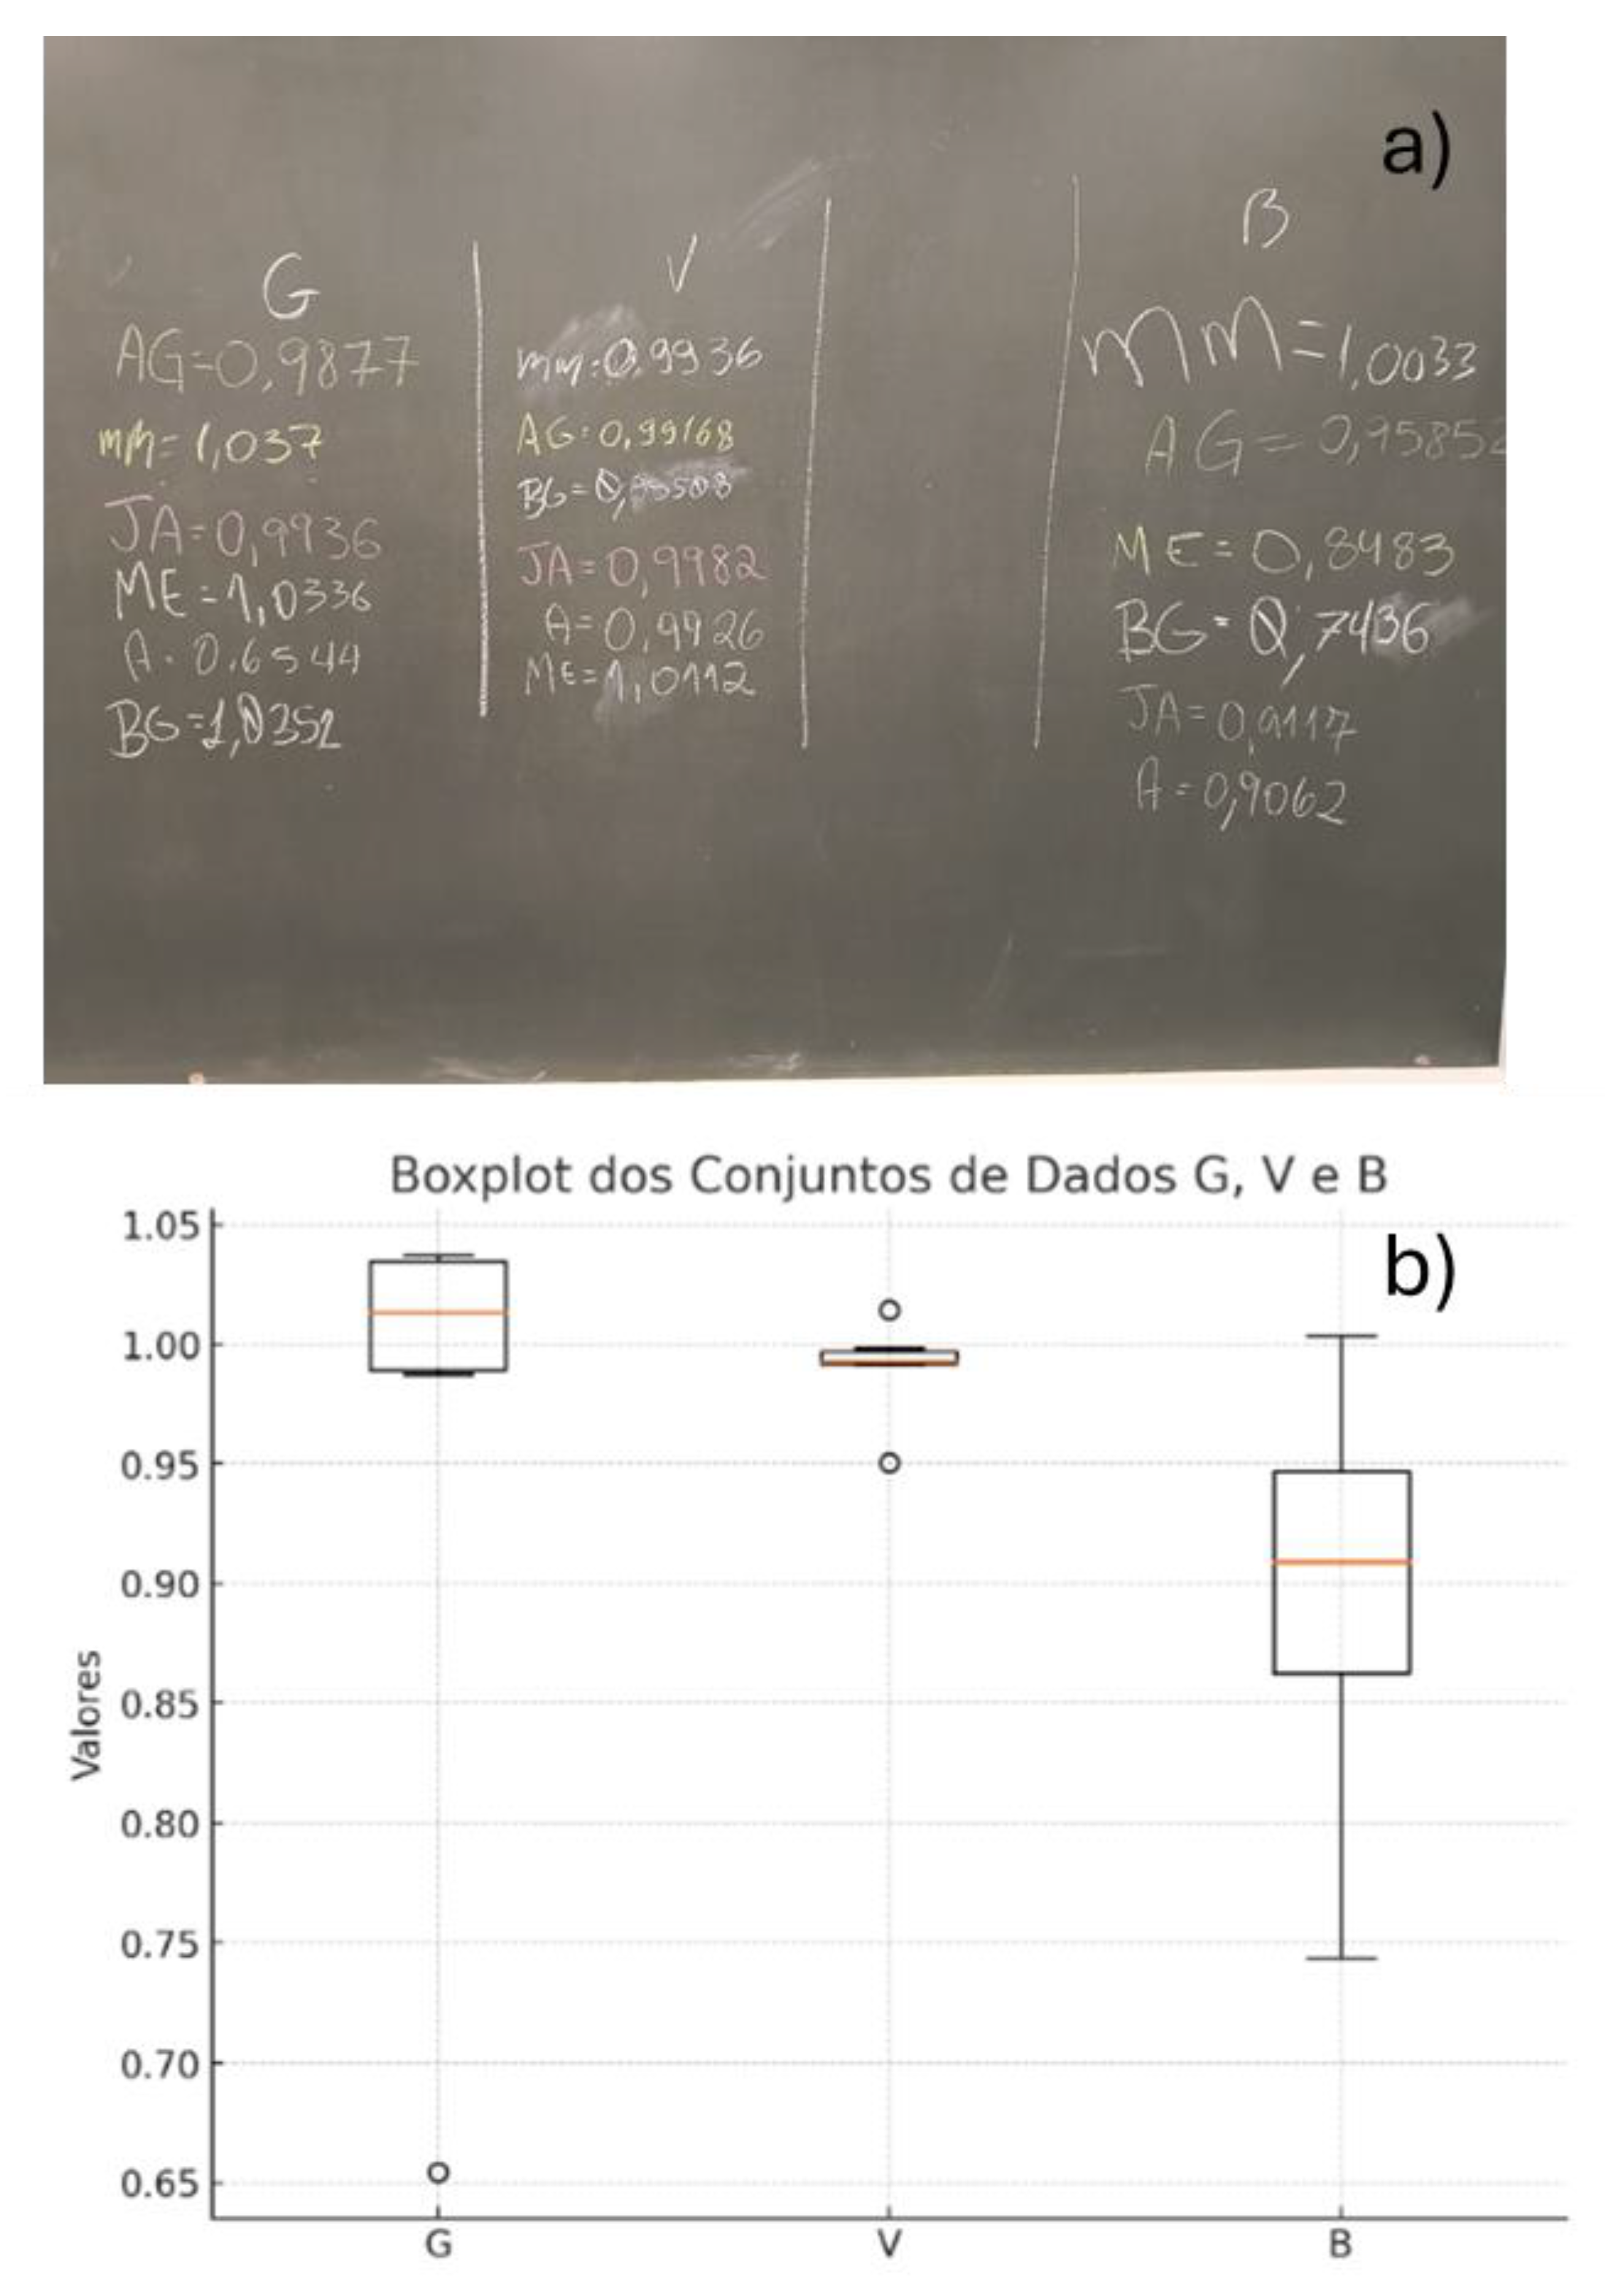
The ability of chatbots to analyze data and generate visual representations can be effectively integrated into laboratory teaching. For instance, in a lab session, students measured the density of water using three types of glassware: a beaker (B), a volumetric pipette (V), and a graduated pipette (G). The learning objective was to demonstrate that the beaker is not suitable for accurate volume measurements, whereas pipettes are more appropriate tools for this purpose[66].
This objective was successfully achieved, as the results clearly showed that the pipettes provided more accurate and precise measurements than the beaker. Accuracy was assessed by how close the measured values were to the reference value (1.00 mg/mL), and precision was evaluated based on the interquartile range (IQR), with smaller IQR values indicating higher precision. The chatbot also identified an outlier in the graduated pipette group (0.6544 mg/mL), further enriching the analysis and discussion.
At the end of the class, students wrote their results on the chalkboard, and an image of the data was captured and uploaded to the ChatGPT application using a student’s smartphone (Figure 23a). The prompt used was: "Build box plot for each group and discuss the results." In response, ChatGPT generated the boxplots (Figure 23b) and provided a data-driven discussion. The boxplots clearly showed that the beaker yielded less precise results (larger IQR) compared to the pipettes, and that the pipettes were more accurate, as their median values were closer to the reference density (1.00 mg/mL).
The integration of ChatGPT into the laboratory session enabled real-time data interpretation and visualization, enhancing the learning process. Each student was able to generate and analyze boxplots directly on their own smartphone, promoting engagement and deeper understanding of the concepts discussed.
Figure 23.
a) Water density determined by students during a general chemistry laboratory class, b) box plot generated of the obtained data using ChatGPT.
Figure 23.
a) Water density determined by students during a general chemistry laboratory class, b) box plot generated of the obtained data using ChatGPT.
All chatbots used in this study were accessible via the Play Store. They could be installed on smartphones and employed to generate images and interpret data in the context of laboratory classes.
Conclusions
This study provides a comprehensive and multimodal assessment of five freely accessible large language model (LLM) chatbots—ChatGPT, Gemini, Copilot, DeepSeek, and Perplexity—within the context of chemistry education. While all models demonstrated strong conceptual reasoning, verbal fluency, and the ability to interpret chemical images and datasets, they consistently failed to generate chemically accurate molecular and Lewis structures. This limitation underscores a critical gap in their current multimodal capabilities, particularly in tasks requiring precise visual representation.
Despite these shortcomings, the chatbots excelled in data-driven tasks, including statistical visualization (box plots, histograms), unsupervised learning (PCA, HCA), and supervised classification (Random Forest), often producing results comparable to traditional software. Their integration into classroom settings—especially for real-time data analysis and visualization—demonstrated their potential to enhance student engagement and support inquiry-based learning.
Overall, LLM-based chatbots represent a promising supplementary tool for chemistry instruction, particularly in reinforcing theoretical concepts and facilitating exploratory data analysis. However, their current limitations in structural accuracy and scientific illustration suggest that they should not yet replace domain-specific software for visual tasks. Future improvements in multimodal training, chemical structure rendering, and domain-specific fine-tuning will be essential to fully unlock their educational and research potential in the chemical sciences.
Funding
The authors acknowledge financial support and fellowships from the Brazilian agencies FAPESC (Fundação de Amparo a Pesquisa do Estado de Santa Catarina), CNPq (Conselho Nacional de Desenvolvimento Científico e Tecnológico), and CAPES (Coordenação de Aperfeiçoamento de Pessoal de Nível Superior).
Conflicts of Interest
The author declared no conflicts of interest
References
- Madsen, D.Ø.; Toston, D.M. ChatGPT and Digital Transformation: A Narrative Review of Its Role in Health, Education, and the Economy. Digital 2025, 5, 24. [CrossRef]
- Lear, B.J. Using ChatGPT-4 to Teach the Design of Data Visualizations. J Chem Educ 2024, 101, 2749–2756. [CrossRef]
- Geantă, M.; Bădescu, D.; Chirca, N.; Nechita, O.C.; Radu, C.G.; Rascu, Ștefan; Rădăvoi, D.; Sima, C.; Toma, C.; Jinga, V. The Emerging Role of Large Language Models in Improving Prostate Cancer Literacy. Bioengineering 2024, 11, 654. [CrossRef]
- Sabaner, M.C.; Anguita, R.; Antaki, F.; Balas, M.; Boberg-Ans, L.C.; Ferro Desideri, L.; Grauslund, J.; Hansen, M.S.; Klefter, O.N.; Potapenko, I.; et al. Opportunities and Challenges of Chatbots in Ophthalmology: A Narrative Review. J Pers Med 2024, 14, 1165. [CrossRef]
- Ittarat, M.; Cheungpasitporn, W.; Chansangpetch, S. Personalized Care in Eye Health: Exploring Opportunities, Challenges, and the Road Ahead for Chatbots. J Pers Med 2023, 13, 1679. [CrossRef]
- Fabijan, A.; Chojnacki, M.; Zawadzka-Fabijan, A.; Fabijan, R.; Piątek, M.; Zakrzewski, K.; Nowosławska, E.; Polis, B. AI-Powered Western Blot Interpretation: A Novel Approach to Studying the Frameshift Mutant of Ubiquitin B (UBB+1) in Schizophrenia. Applied Sciences 2024, 14, 4149. [CrossRef]
- Fan, K.S.; Fan, K.H. Dermatological Knowledge and Image Analysis Performance of Large Language Models Based on Specialty Certificate Examination in Dermatology. Dermato 2024, 4, 124–135. [CrossRef]
- Schuessler, K.; Rodemer, M.; Giese, M.; Walpuski, M. Organic Chemistry and the Challenge of Representations: Student Difficulties with Different Representation Forms When Switching from Paper–Pencil to Digital Format. J Chem Educ 2024, 101, 4566–4579. [CrossRef]
- Murillo, D.; Enderle, B.; Pham, J. Teaching Formal Charges of Lewis Electron Dot Structures by Counting Attachments. J Chem Educ 2025, 102, 112–118. [CrossRef]
- Buzzolani, S.P.; Mistretta, M.J.; Bugajczyk, A.E.; Sam, A.J.; Elezi, S.R.; Silverio, D.L. Effective Visualization of Implicit Hydrogens with Prime Formulae. J Chem Educ 2025, 102, 508–515. [CrossRef]
- Nayyar, P.; Young, J.D.; Dawood, L.; Lewis, S.E. Evaluating an Intervention to Improve General Chemistry Students’ Perceptions of the Utility of Chemistry. J Chem Educ 2025, 102, 1389–1397. [CrossRef]
- Cooper, M.M.; Grove, N.; Underwood, S.M.; Klymkowsky, M.W. Lost in Lewis Structures: An Investigation of Student Difficulties in Developing Representational Competence. J Chem Educ 2010, 87, 869–874. [CrossRef]
- Alasadi, E.A.; Baiz, C.R. Multimodal Generative Artificial Intelligence Tackles Visual Problems in Chemistry. J Chem Educ 2024, 101, 2716–2729. [CrossRef]
- Nascimento Júnior, W.J.D.; Morais, C.; Girotto Júnior, G. Enhancing AI Responses in Chemistry: Integrating Text Generation, Image Creation, and Image Interpretation through Different Levels of Prompts. J Chem Educ 2024, 101, 3767–3779. [CrossRef]
- Yik, B.J.; Dood, A.J. ChatGPT Convincingly Explains Organic Chemistry Reaction Mechanisms Slightly Inaccurately with High Levels of Explanation Sophistication. J Chem Educ 2024, 101, 1836–1846. [CrossRef]
- West, J.K.; Franz, J.L.; Hein, S.M.; Leverentz-Culp, H.R.; Mauser, J.F.; Ruff, E.F.; Zemke, J.M. An Analysis of AI-Generated Laboratory Reports across the Chemistry Curriculum and Student Perceptions of ChatGPT. J Chem Educ 2023, 100, 4351–4359. [CrossRef]
- Pradhan, T.; Gupta, O.; Chawla, G. The Future of ChatGPT in Medicinal Chemistry: Harnessing AI for Accelerated Drug Discovery. ChemistrySelect 2024, 9. [CrossRef]
- Rojas, A.J. An Investigation into ChatGPT’s Application for a Scientific Writing Assignment. J Chem Educ 2024, 101, 1959–1965. [CrossRef]
- Guo, Y.; Lee, D. Leveraging ChatGPT for Enhancing Critical Thinking Skills. J Chem Educ 2023, 100, 4876–4883. [CrossRef]
- Fergus, S.; Botha, M.; Ostovar, M. Evaluating Academic Answers Generated Using ChatGPT. J Chem Educ 2023, 100, 1672–1675. [CrossRef]
- Leon, A.J.; Vidhani, D. ChatGPT Needs a Chemistry Tutor Too. J Chem Educ 2023. [CrossRef]
- Fernández, A.A.; López-Torres, M.; Fernández, J.J.; Vázquez-García, D. ChatGPT as an Instructor’s Assistant for Generating and Scoring Exams. J Chem Educ 2024, 101, 3780–3788. [CrossRef]
- Subasinghe, S.M.S.; Gersib, S.G.; Mankad, N.P. Large Language Models (LLMs) as Graphing Tools for Advanced Chemistry Education and Research. J Chem Educ 2025, 102, 1563–1571. [CrossRef]
- Berber, S.; Brückner, M.; Maurer, N.; Huwer, J. Artificial Intelligence in Chemistry Research─Implications for Teaching and Learning. J Chem Educ 2025, 102, 1445–1456. [CrossRef]
- Nayyar, P.; Teran, O.A.; Lewis, S.E. Artificial Intelligence as a Catalyst for Promoting Utility Value Perceptions of Chemistry. J Chem Educ 2025. [CrossRef]
- Hrubeš, J.; Jaroš, A.; Nemirovich, T.; Teplá, M.; Petrželová, S. Integrating Computational Chemistry into Secondary School Lessons. J Chem Educ 2024, 101, 2343–2353. [CrossRef]
- Clark, T.M.; Tafini, N. Exploring the AI–Human Interface for Personalized Learning in a Chemical Context. J Chem Educ 2024, 101, 4916–4923. [CrossRef]
- Tokunaga, E.; Yamamoto, T.; Ito, E.; Shibata, N. Understanding the Thalidomide Chirality in Biological Processes by the Self-Disproportionation of Enantiomers. Sci Rep 2018, 8, 17131. [CrossRef]
- Hurst, G.A.; Quiroz-Martínez, D.; Wissinger, J.E. Chemistry Education for Climate Empowerment and Action. J Chem Educ 2025, 102, 1349–1351. [CrossRef]
- Raliya, R.; Fraceto, L.F.; Li, Q.X.; Xu, Y.; Osorio, C.; McConnell, L.L.; Hofmann, T. Advancing Nanotechnology in Agriculture and Food: A Guide to Writing a Successful Manuscript. ACS Agricultural Science & Technology 2024, 4, 961–964. [CrossRef]
- Buriak, J.M.; Akinwande, D.; Artzi, N.; Brinker, C.J.; Burrows, C.; Chan, W.C.W.; Chen, C.; Chen, X.; Chhowalla, M.; Chi, L.; et al. Best Practices for Using AI When Writing Scientific Manuscripts. ACS Nano 2023, 17, 4091–4093. [CrossRef]
- Vassallo, P. Using AI to Improve Writing Creativity, Productivity, and Quality. ACS Chemical Health & Safety 2024, 31, 352–361. [CrossRef]
- Hameed Alsaedi, N.R.; Akay, M.F. Effective Breast Cancer Classification Using Deep MLP, Feature-Fused Autoencoder and Weight-Tuned Decision Tree. Applied Sciences 2025, 15, 7213. [CrossRef]
- Dubey, A.K.; Gupta, U.; Jain, S. Analysis of K-Means Clustering Approach on the Breast Cancer Wisconsin Dataset. Int J Comput Assist Radiol Surg 2016, 11, 2033–2047. [CrossRef]
- Gurcan, F.; Soylu, A. Learning from Imbalanced Data: Integration of Advanced Resampling Techniques and Machine Learning Models for Enhanced Cancer Diagnosis and Prognosis. Cancers (Basel) 2024, 16, 3417. [CrossRef]
- Hameed Alsaedi, N.R.; Akay, M.F. Effective Breast Cancer Classification Using Deep MLP, Feature-Fused Autoencoder and Weight-Tuned Decision Tree. Applied Sciences 2025, 15, 7213. [CrossRef]
- Marcel Borges, E. Data Visualization Using Boxplots: Comparison of Metalloid, Metal, and Nonmetal Chemical and Physical Properties. J Chem Educ 2023, 100, 2809–2817. [CrossRef]
- Chiarelli, J.; St. Hilaire, M.A.; Baldock, B.L.; Franco, J.; Theberge, S.; Fernandez, A.L. Calculating the Precision of Student-Generated Datasets Using RStudio. J Chem Educ 2025, 102, 909–916. [CrossRef]
- Ferreira, J.E. V.; Miranda, R.M.; Figueiredo, A.F.; Barbosa, J.P.; Brasil, E.M. Box-and-Whisker Plots Applied to Food Chemistry. J Chem Educ 2016, 93, 2026–2032. [CrossRef]
- Borges, E.M. Hypothesis Tests and Exploratory Analysis Using R Commander and Factoshiny. J Chem Educ 2023, 100, 267–278. [CrossRef]
- de Souza, R.S.; Sequeira, C.A.; Borges, E.M. Enhancing Statistical Education in Chemistry and STEAM Using JAMOVI. Part 1: Descriptive Statistics and Comparing Independent Groups. J Chem Educ 2024. [CrossRef]
- Hupp, A.M.; Kovarik, M.L.; McCurry, D.A. Emerging Areas in Undergraduate Analytical Chemistry Education: Microfluidics, Microcontrollers, and Chemometrics. Annual Review of Analytical Chemistry 2024, 17, 197–219. [CrossRef]
- Sidou, L.F.; Borges, E.M. Teaching Principal Component Analysis Using a Free and Open Source Software Program and Exercises Applying PCA to Real-World Examples. J Chem Educ 2020, 97, 1666–1676. [CrossRef]
- Menke, E.J. Series of Jupyter Notebooks Using Python for an Analytical Chemistry Course. J Chem Educ 2020, 97, 3899–3903. [CrossRef]
- Lafuente, D.; Cohen, B.; Fiorini, G.; García, A.A.; Bringas, M.; Morzan, E.; Onna, D. A Gentle Introduction to Machine Learning for Chemists: An Undergraduate Workshop Using Python Notebooks for Visualization, Data Processing, Analysis, and Modeling. J Chem Educ 2021, 98, 2892–2898. [CrossRef]
- Kim, S.-Y.; Jeon, I.; Kang, S.-J. Integrating Data Science and Machine Learning to Chemistry Education: Predicting Classification and Boiling Point of Compounds. J Chem Educ 2024, 101, 1771–1776. [CrossRef]
- Bro, R.; Smilde, A.K. Principal Component Analysis. Anal. Methods 2014, 6, 2812–2831. [CrossRef]
- Sequeira, C.A.; Borges, E.M. Enhancing Statistical Education in Chemistry and STEAM Using JAMOVI. Part 2. Comparing Dependent Groups and Principal Component Analysis (PCA). J Chem Educ 2024, 101, 5040–5049. [CrossRef]
- Yeh, T.-S. Open-Source Visual Programming Software for Introducing Principal Component Analysis to the Analytical Curriculum. J Chem Educ 2025, 102, 1428–1435. [CrossRef]
- Pereira de Quental, A.G.; Firmino do Nascimento, A.L.; de Lelis Medeiros de Morais, C.; de Oliveira Neves, A.C.; Seixas das Neves, L.; Gomes de Lima, K.M. Periodic Table’s Properties Using Unsupervised Chemometric Methods: Undergraduate Analytical Chemistry Laboratory Exercise. J Chem Educ 2025, 102, 1237–1244. [CrossRef]
- Shao, L. Teaching Principal Component Analysis in the Course of Analytical Chemistry: A Q&A Based Heuristic Approach. J Chem Educ 2025, 102, 155–163. [CrossRef]
- Granato, D.; Santos, J.S.; Escher, G.B.; Ferreira, B.L.; Maggio, R.M. Use of Principal Component Analysis (PCA) and Hierarchical Cluster Analysis (HCA) for Multivariate Association between Bioactive Compounds and Functional Properties in Foods: A Critical Perspective. Trends Food Sci Technol 2018, 72, 83–90. [CrossRef]
- Nunes, C.A.; Alvarenga, V.O.; de Souza Sant’Ana, A.; Santos, J.S.; Granato, D. The Use of Statistical Software in Food Science and Technology: Advantages, Limitations and Misuses. Food Research International 2015, 75, 270–280. [CrossRef]
- Zielinski, A.A.F.; Haminiuk, C.W.I.; Nunes, C.A.; Schnitzler, E.; van Ruth, S.M.; Granato, D. Chemical Composition, Sensory Properties, Provenance, and Bioactivity of Fruit Juices as Assessed by Chemometrics: A Critical Review and Guideline. Compr Rev Food Sci Food Saf 2014, 13, 300–316. [CrossRef]
- Grant St James, A.; Hand, L.; Mills, T.; Song, L.; S. J. Brunt, A.; E. Bergstrom Mann, P.; F. Worrall, A.; I. Stewart, M.; Vallance, C. Exploring Machine Learning in Chemistry through the Classification of Spectra: An Undergraduate Project. J Chem Educ 2023, 100, 1343–1350. [CrossRef]
- Lackey, H.E.; Sell, R.L.; Nelson, G.L.; Bryan, T.A.; Lines, A.M.; Bryan, S.A. Practical Guide to Chemometric Analysis of Optical Spectroscopic Data. J Chem Educ 2023, 100, 2608–2626. [CrossRef]
- Borges, E.M. How to Select Equivalent and Complimentary Reversed Phase Liquid Chromatography Columns from Column Characterization Databases. Anal Chim Acta 2014, 807, 143–152. [CrossRef]
- Borges, E.M.; Gelinski, J.M.L.N.; de Oliveira Souza, V.C.; Barbosa Jr., F.; Batista, B.L. Monitoring the Authenticity of Organic Rice via Chemometric Analysis of Elemental Data. Food Research International 2015, 77, 299–309. [CrossRef]
- Borges, E.M.; Volmer, D.A.; Gallimberti, M.; Ferreira De Souza, D.; Luiz De Souza, E.; Barbosa, F. Evaluation of Macro- and Microelement Levels for Verifying the Authenticity of Organic Eggs by Using Chemometric Techniques. Analytical Methods 2015, 7, 2577–2584. [CrossRef]
- Borges, E.M.; Volmer, D.A.; Brandelero, E.; Gelinski, J.M.L.N.; Gallimberti, M.; Barbosa, F. Monitoring the Authenticity of Organic Grape Juice via Chemometric Analysis of Elemental Data. Food Anal Methods 2016, 9, 362–369. [CrossRef]
- Zheng, Z.; Florit, F.; Jin, B.; Wu, H.; Li, S.; Nandiwale, K.Y.; Salazar, C.A.; Mustakis, J.G.; Green, W.H.; Jensen, K.F. Integrating Machine Learning and Large Language Models to Advance Exploration of Electrochemical Reactions. Angewandte Chemie 2025, 137. [CrossRef]
- Wang, Q.; Yang, F.; Wang, Y.; Zhang, D.; Sato, R.; Zhang, L.; Cheng, E.J.; Yan, Y.; Chen, Y.; Kisu, K.; et al. Unraveling the Complexity of Divalent Hydride Electrolytes in Solid-State Batteries via a Data-Driven Framework with Large Language Model. Angewandte Chemie International Edition 2025, 64. [CrossRef]
- Yu, Z.; Wang, Z.; Jiang, Q.; Wang, J.; Zheng, J.; Zhang, T. Analysis of Factors of Productivity of Tight Conglomerate Reservoirs Based on Random Forest Algorithm. ACS Omega 2022, 7, 20390–20404. [CrossRef]
- Dong, J.; Liu, X.; Su, R.; Xu, H.; Yu, T. TCN-Transformer Deep Network with Random Forest for Prediction of the Chemical Synthetic Ammonia Process. ACS Omega 2025, 10, 2269–2279. [CrossRef]
- Guo, J.; Zhang, Z.; Guo, G.; Xiao, H.; Zhao, Q.; Zhang, C.; Lv, H.; Zhu, Z.; Wang, C. Optimized Random Forest Method for 3D Evaluation of Coalbed Methane Content Using Geophysical Logging Data. ACS Omega 2024, 9, 35769–35788. [CrossRef]
- Silva de Souza, R.; Borges, E.M. Teaching Descriptive Statistics and Hypothesis Tests Measuring Water Density. J Chem Educ 2023, 100, 4438–4448. [CrossRef]
Figure 3.
Lewis structures produced by ChatGPT in a) May, b) July, and c) August 2025.
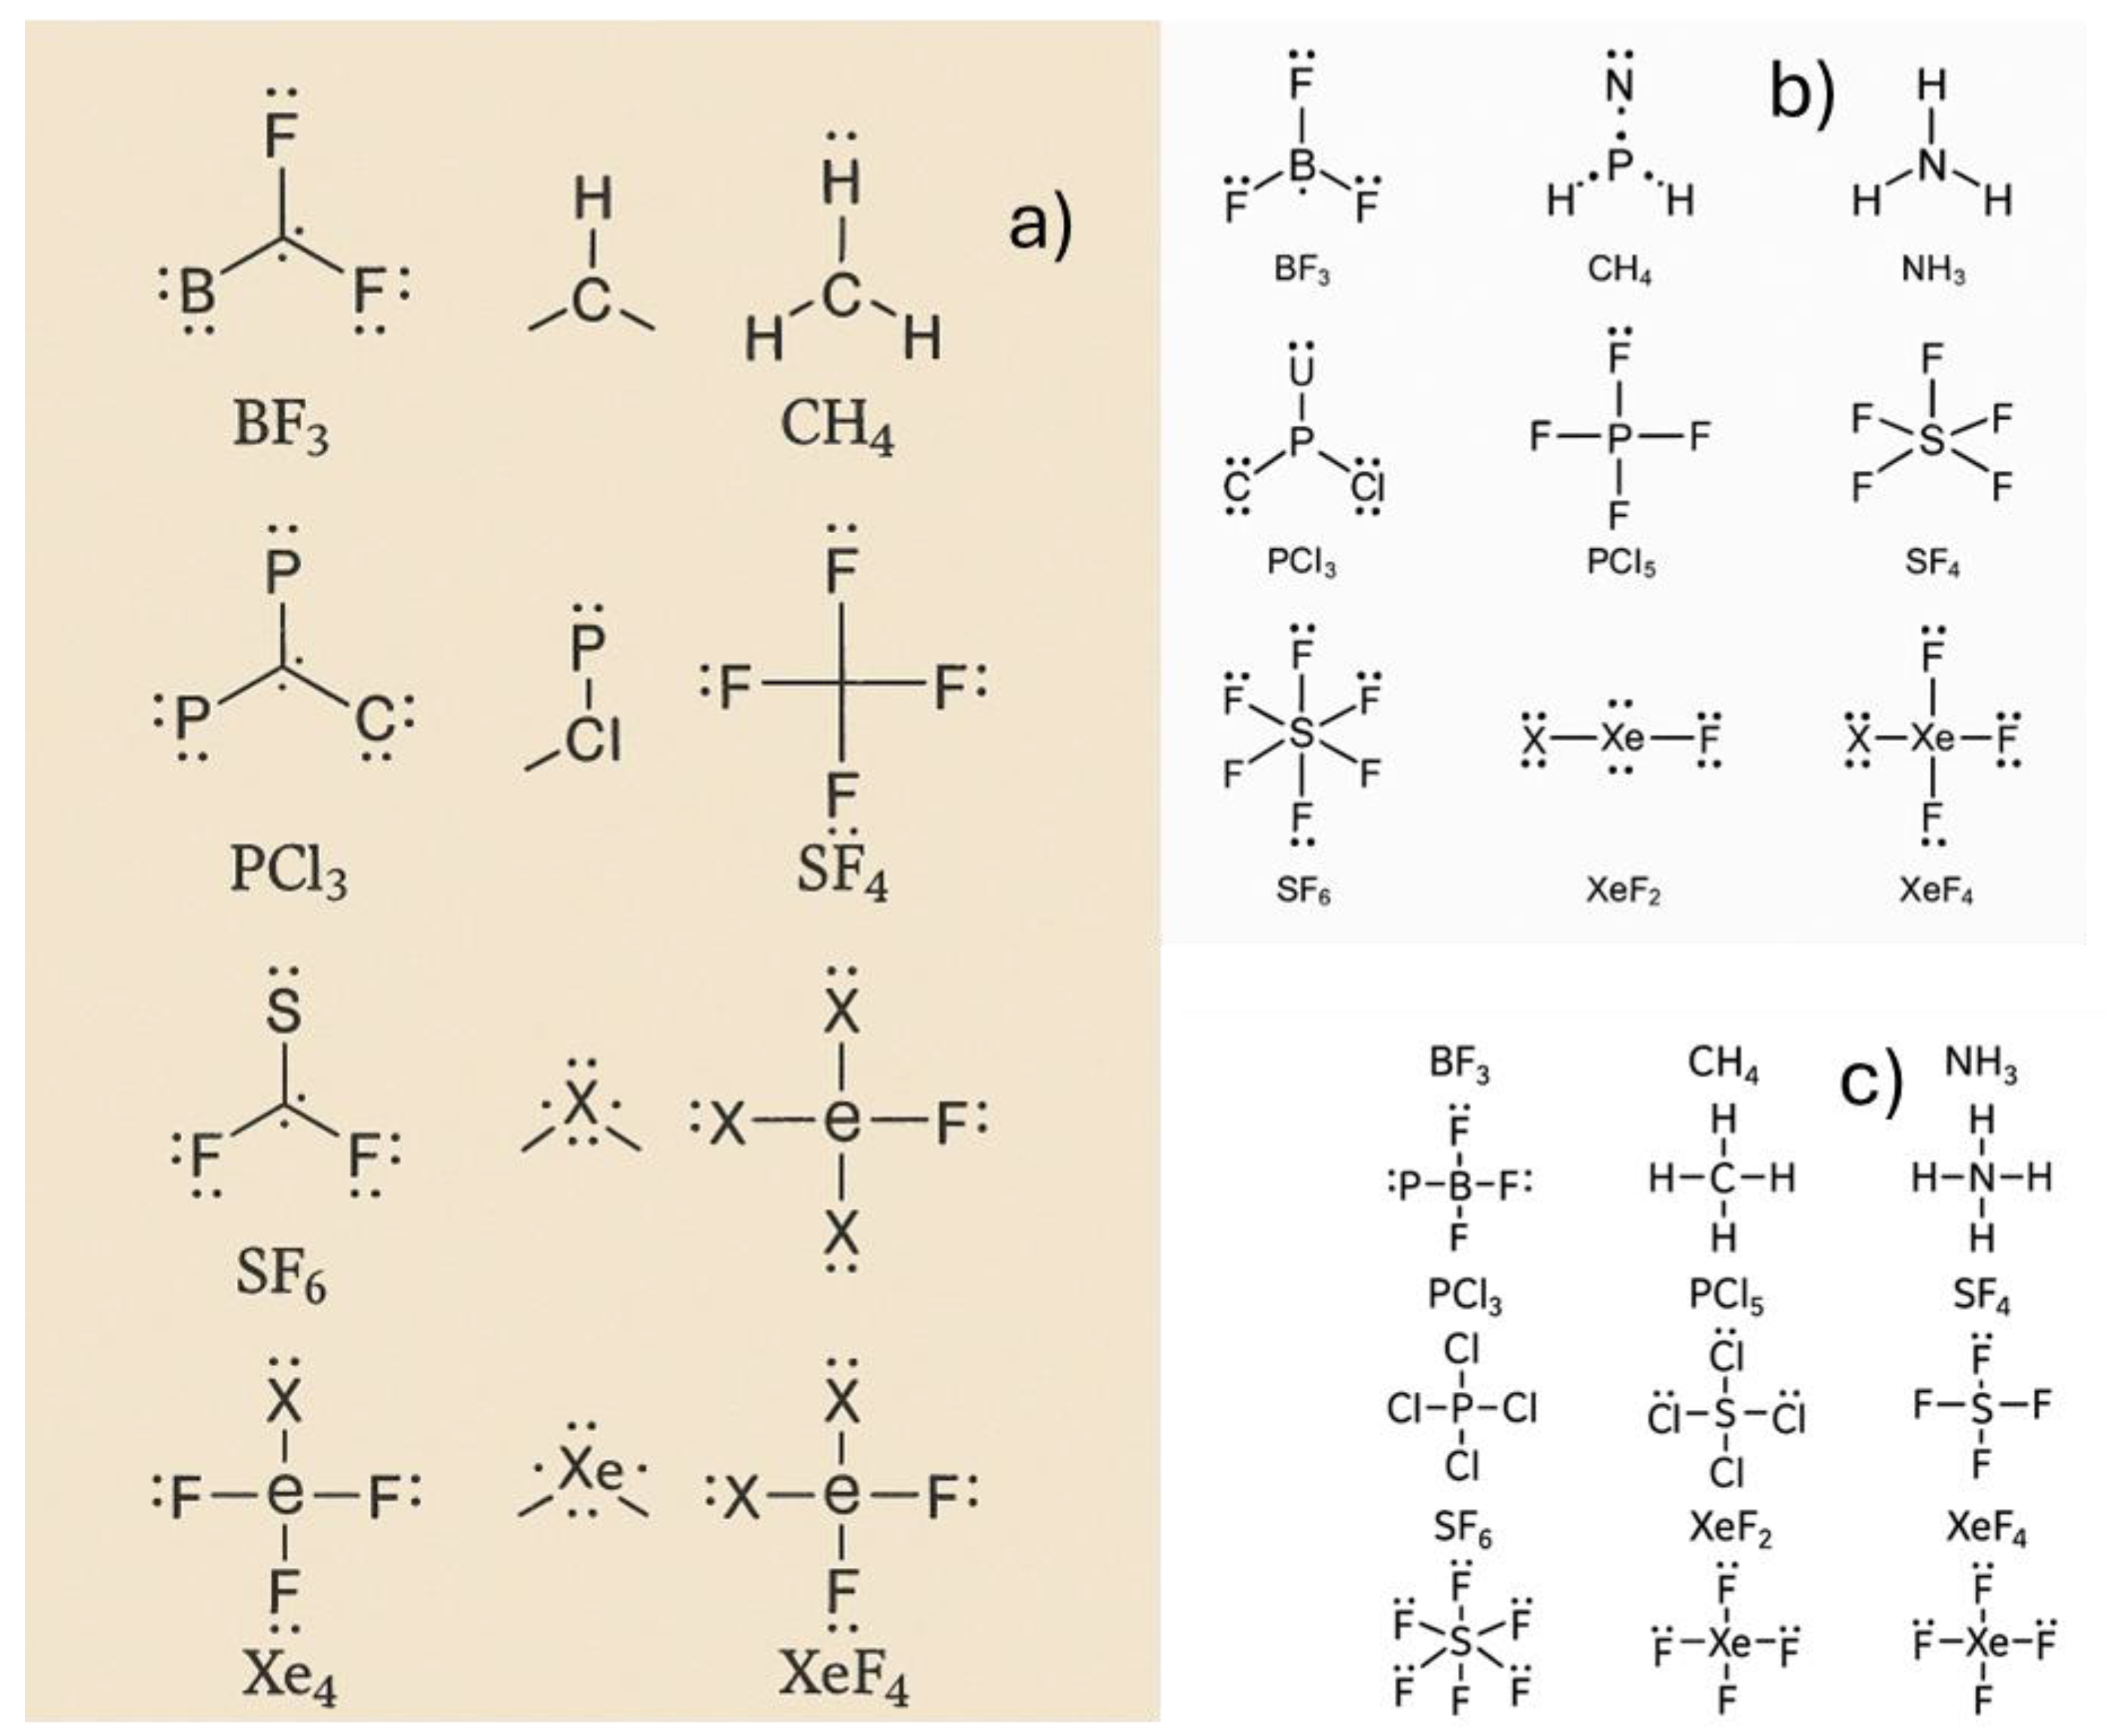
Figure 4.
Lewis structures produced by Copilot in a) July and b) August 2025.
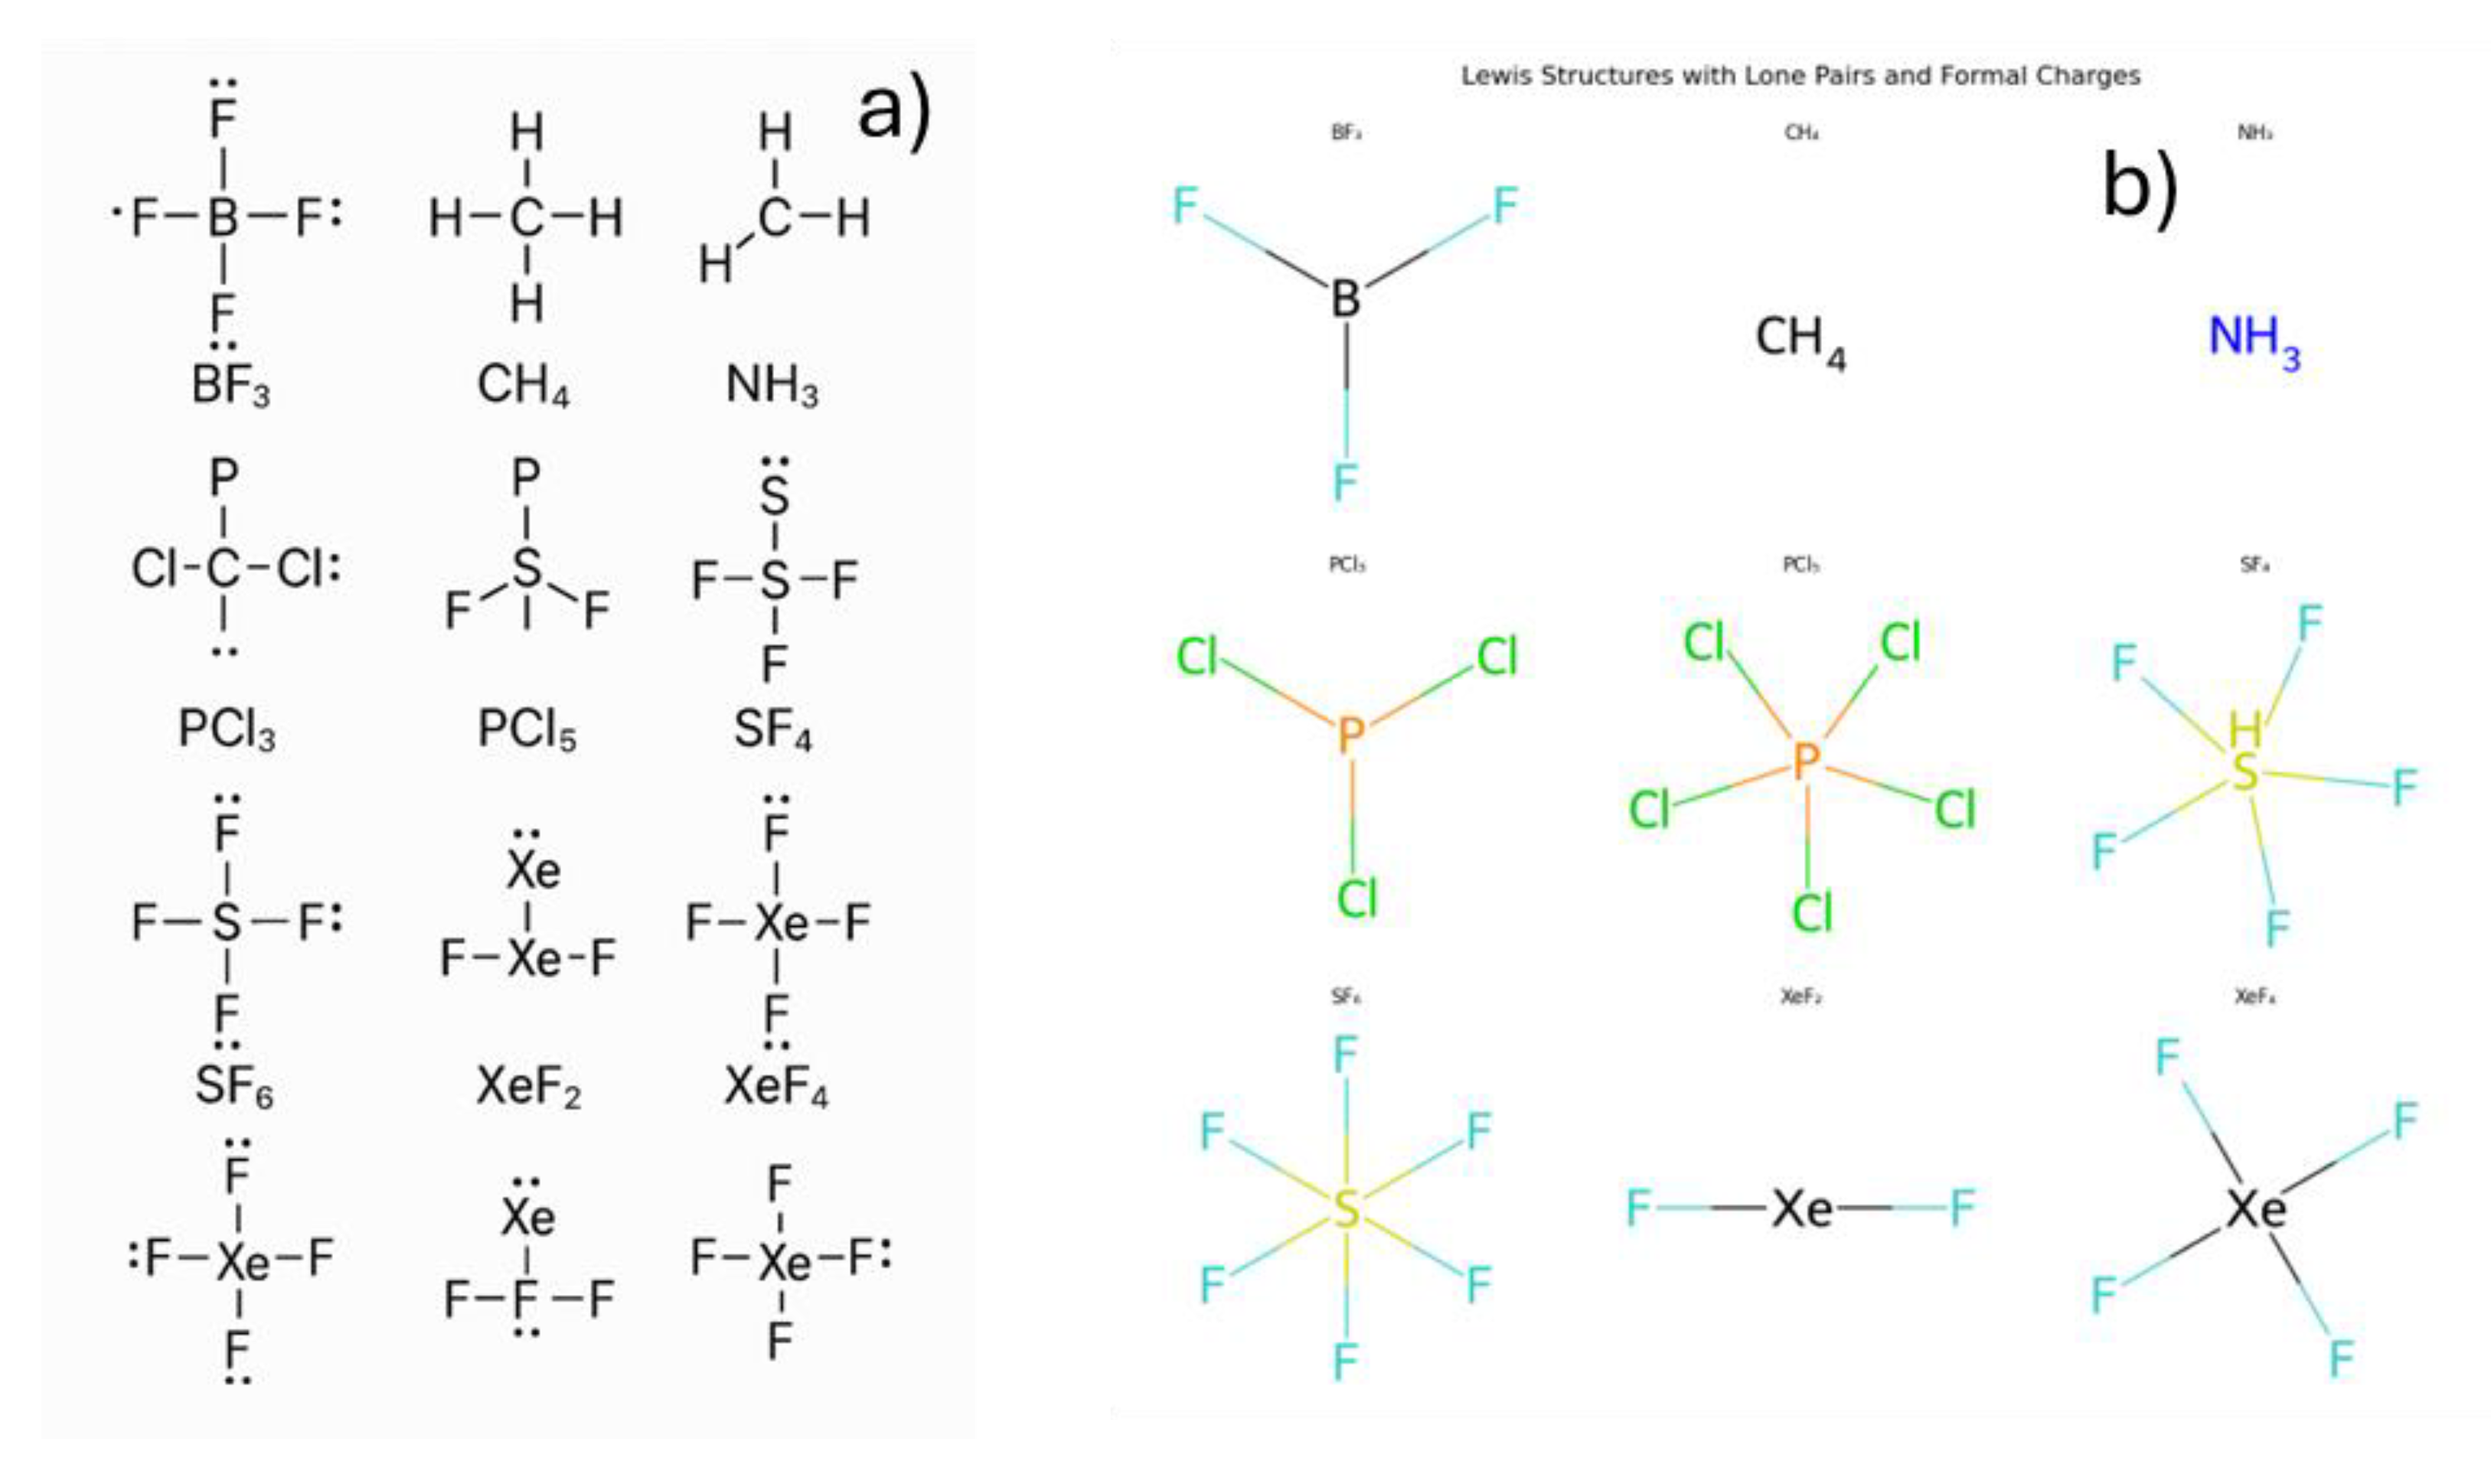
Figure 5.
NH3 and NF3 Lewis structures built by a) ChatGPT and b) Copilot in August.
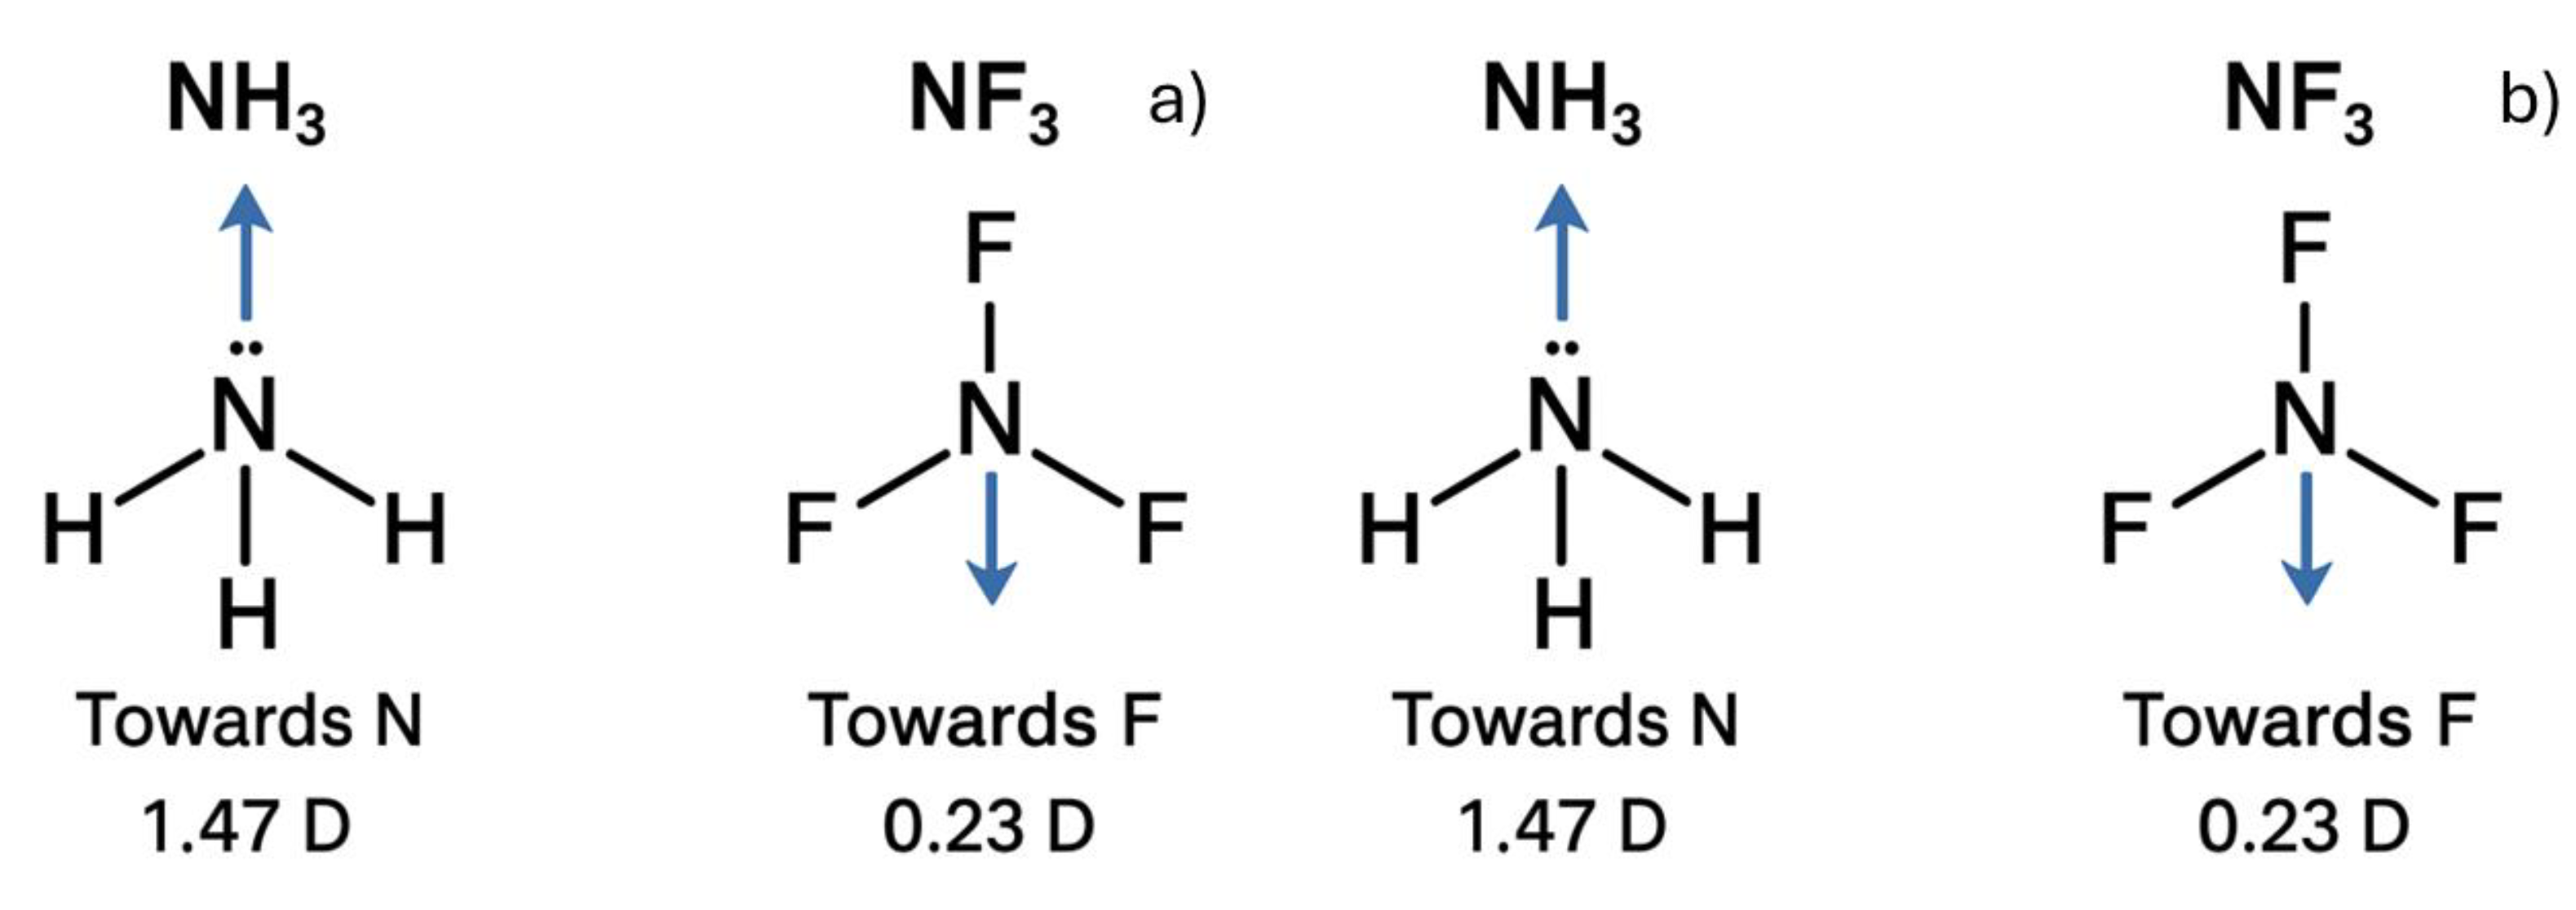
Figure 6.
Illustration of a battle between chatbots using a) Copilot, b) ChatGPT, c) Gemini, and d) Perplexity in April 2025.
Figure 6.
Illustration of a battle between chatbots using a) Copilot, b) ChatGPT, c) Gemini, and d) Perplexity in April 2025.
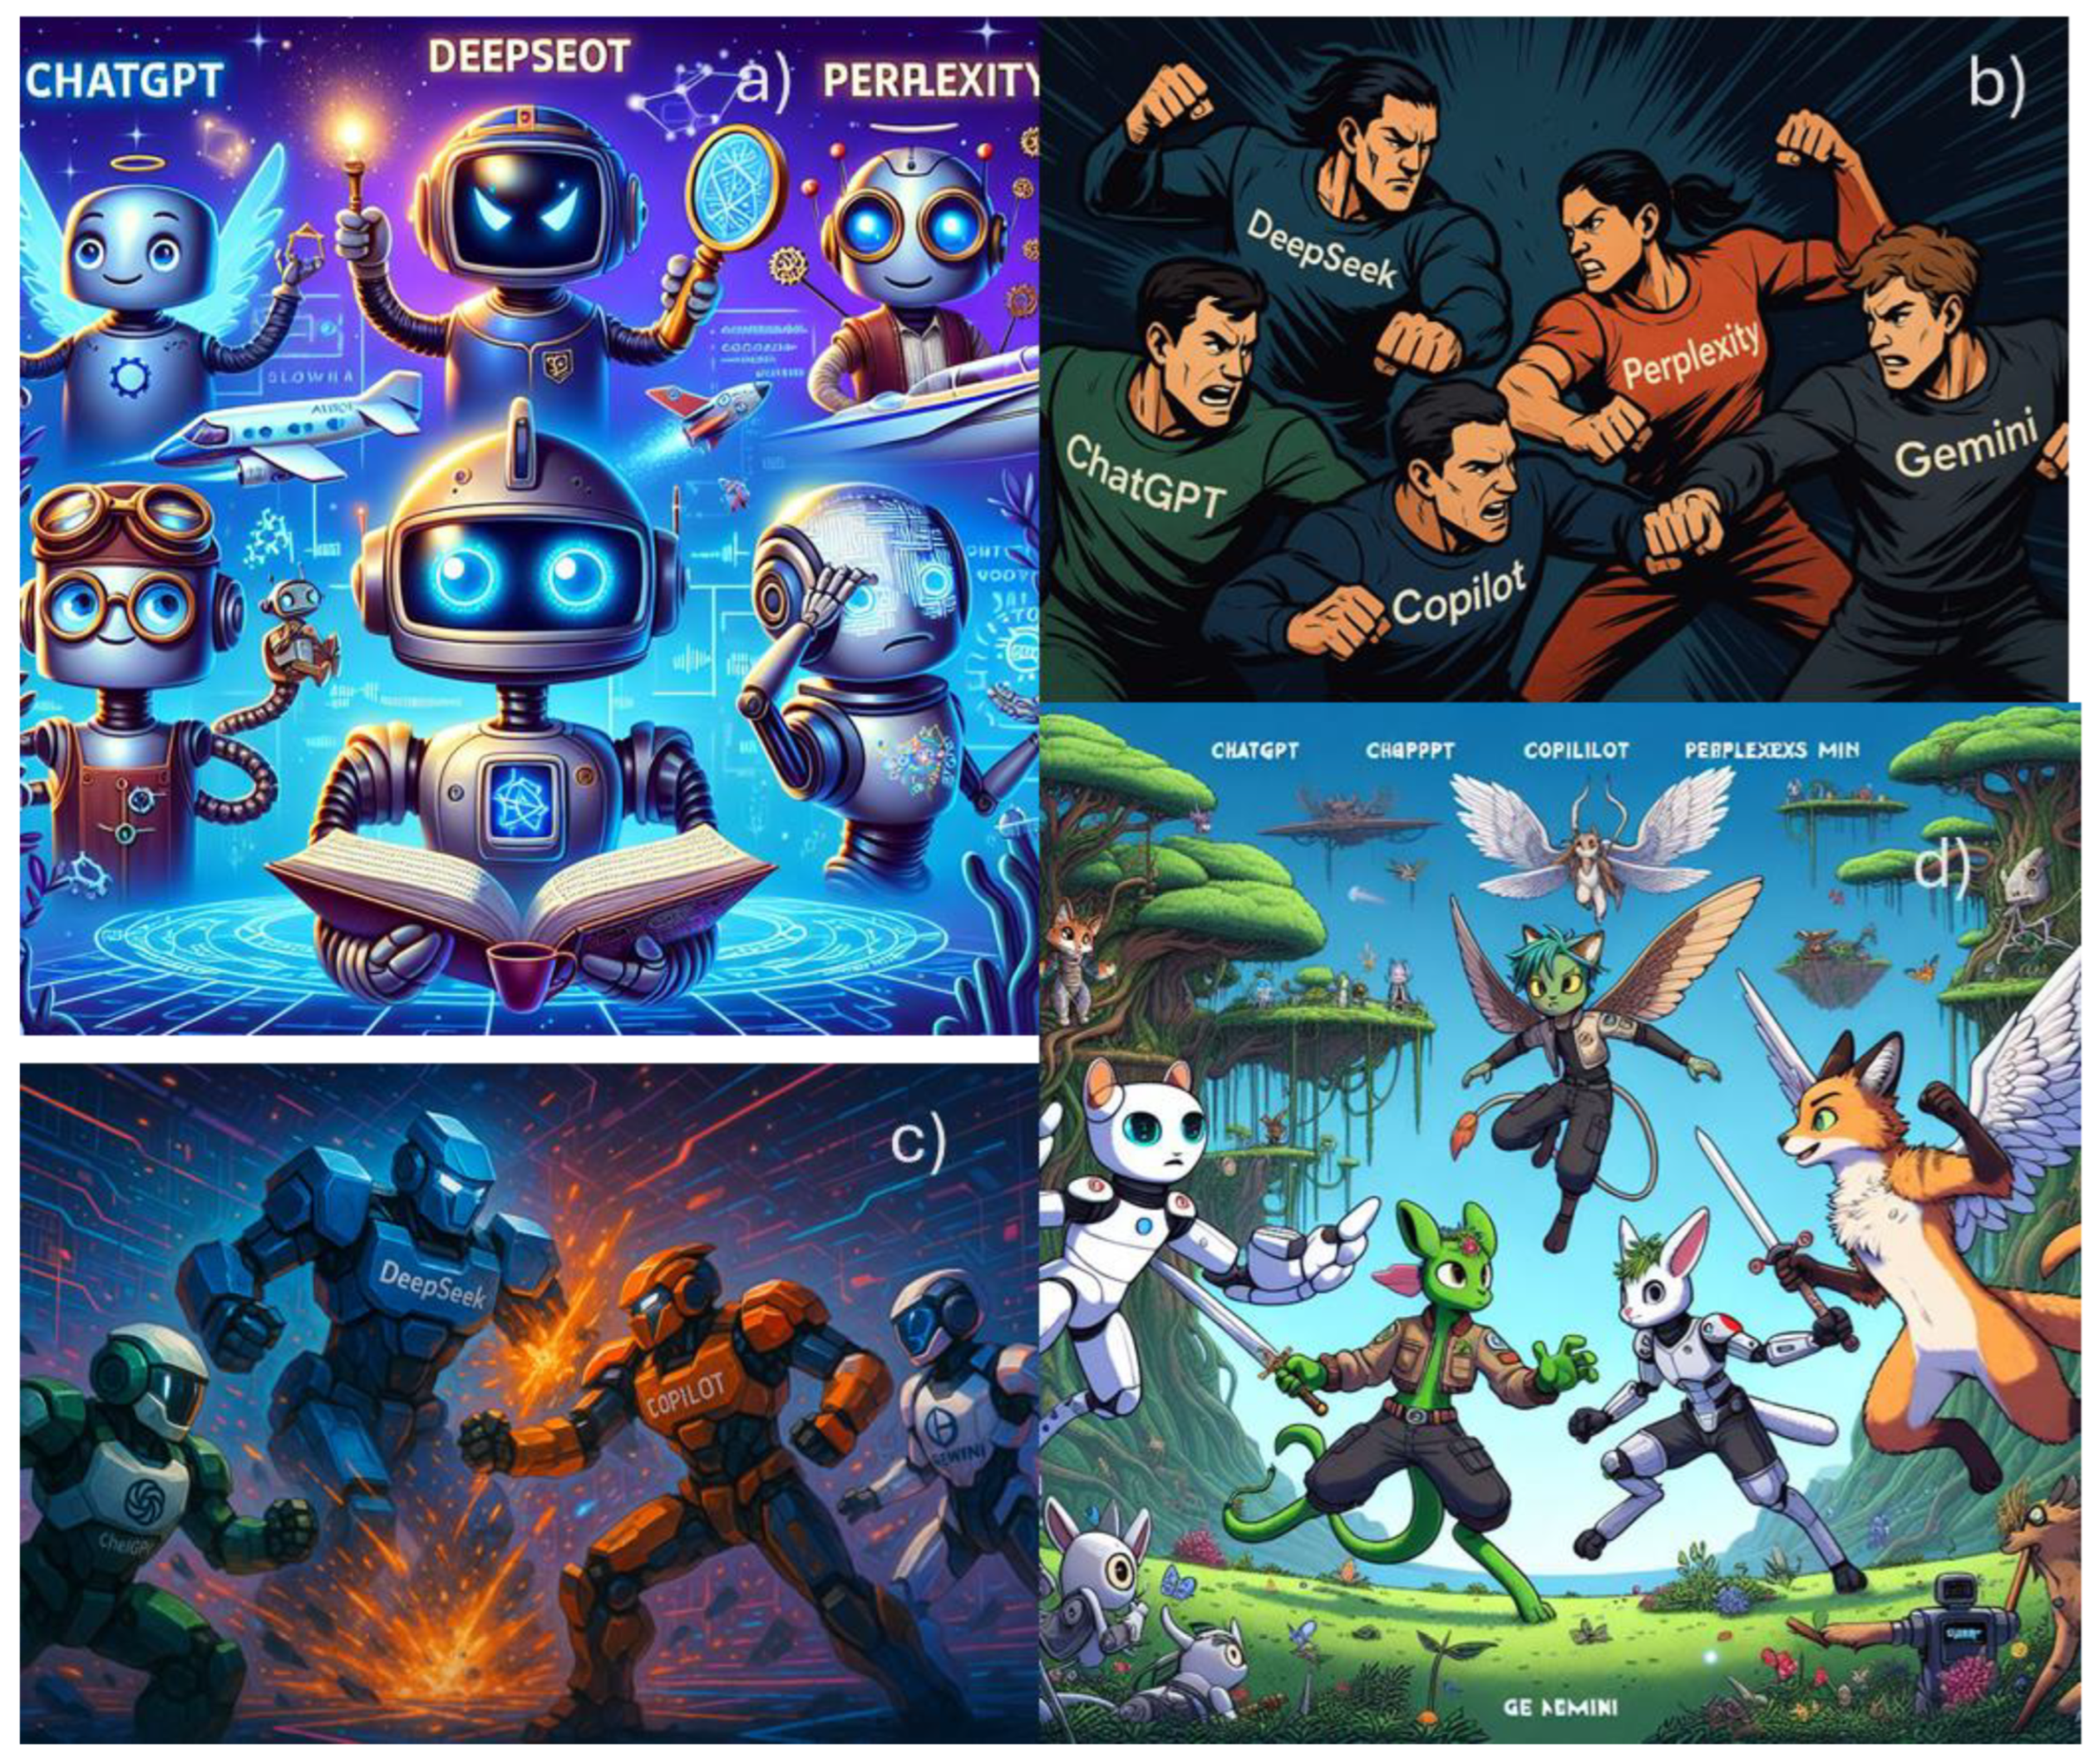
Figure 7.
Ilustration of a battle between chatbots using a) ChatGPT, b) Gemini, c) Copilot, and d) Perplexity, In August 2025.
Figure 7.
Ilustration of a battle between chatbots using a) ChatGPT, b) Gemini, c) Copilot, and d) Perplexity, In August 2025.
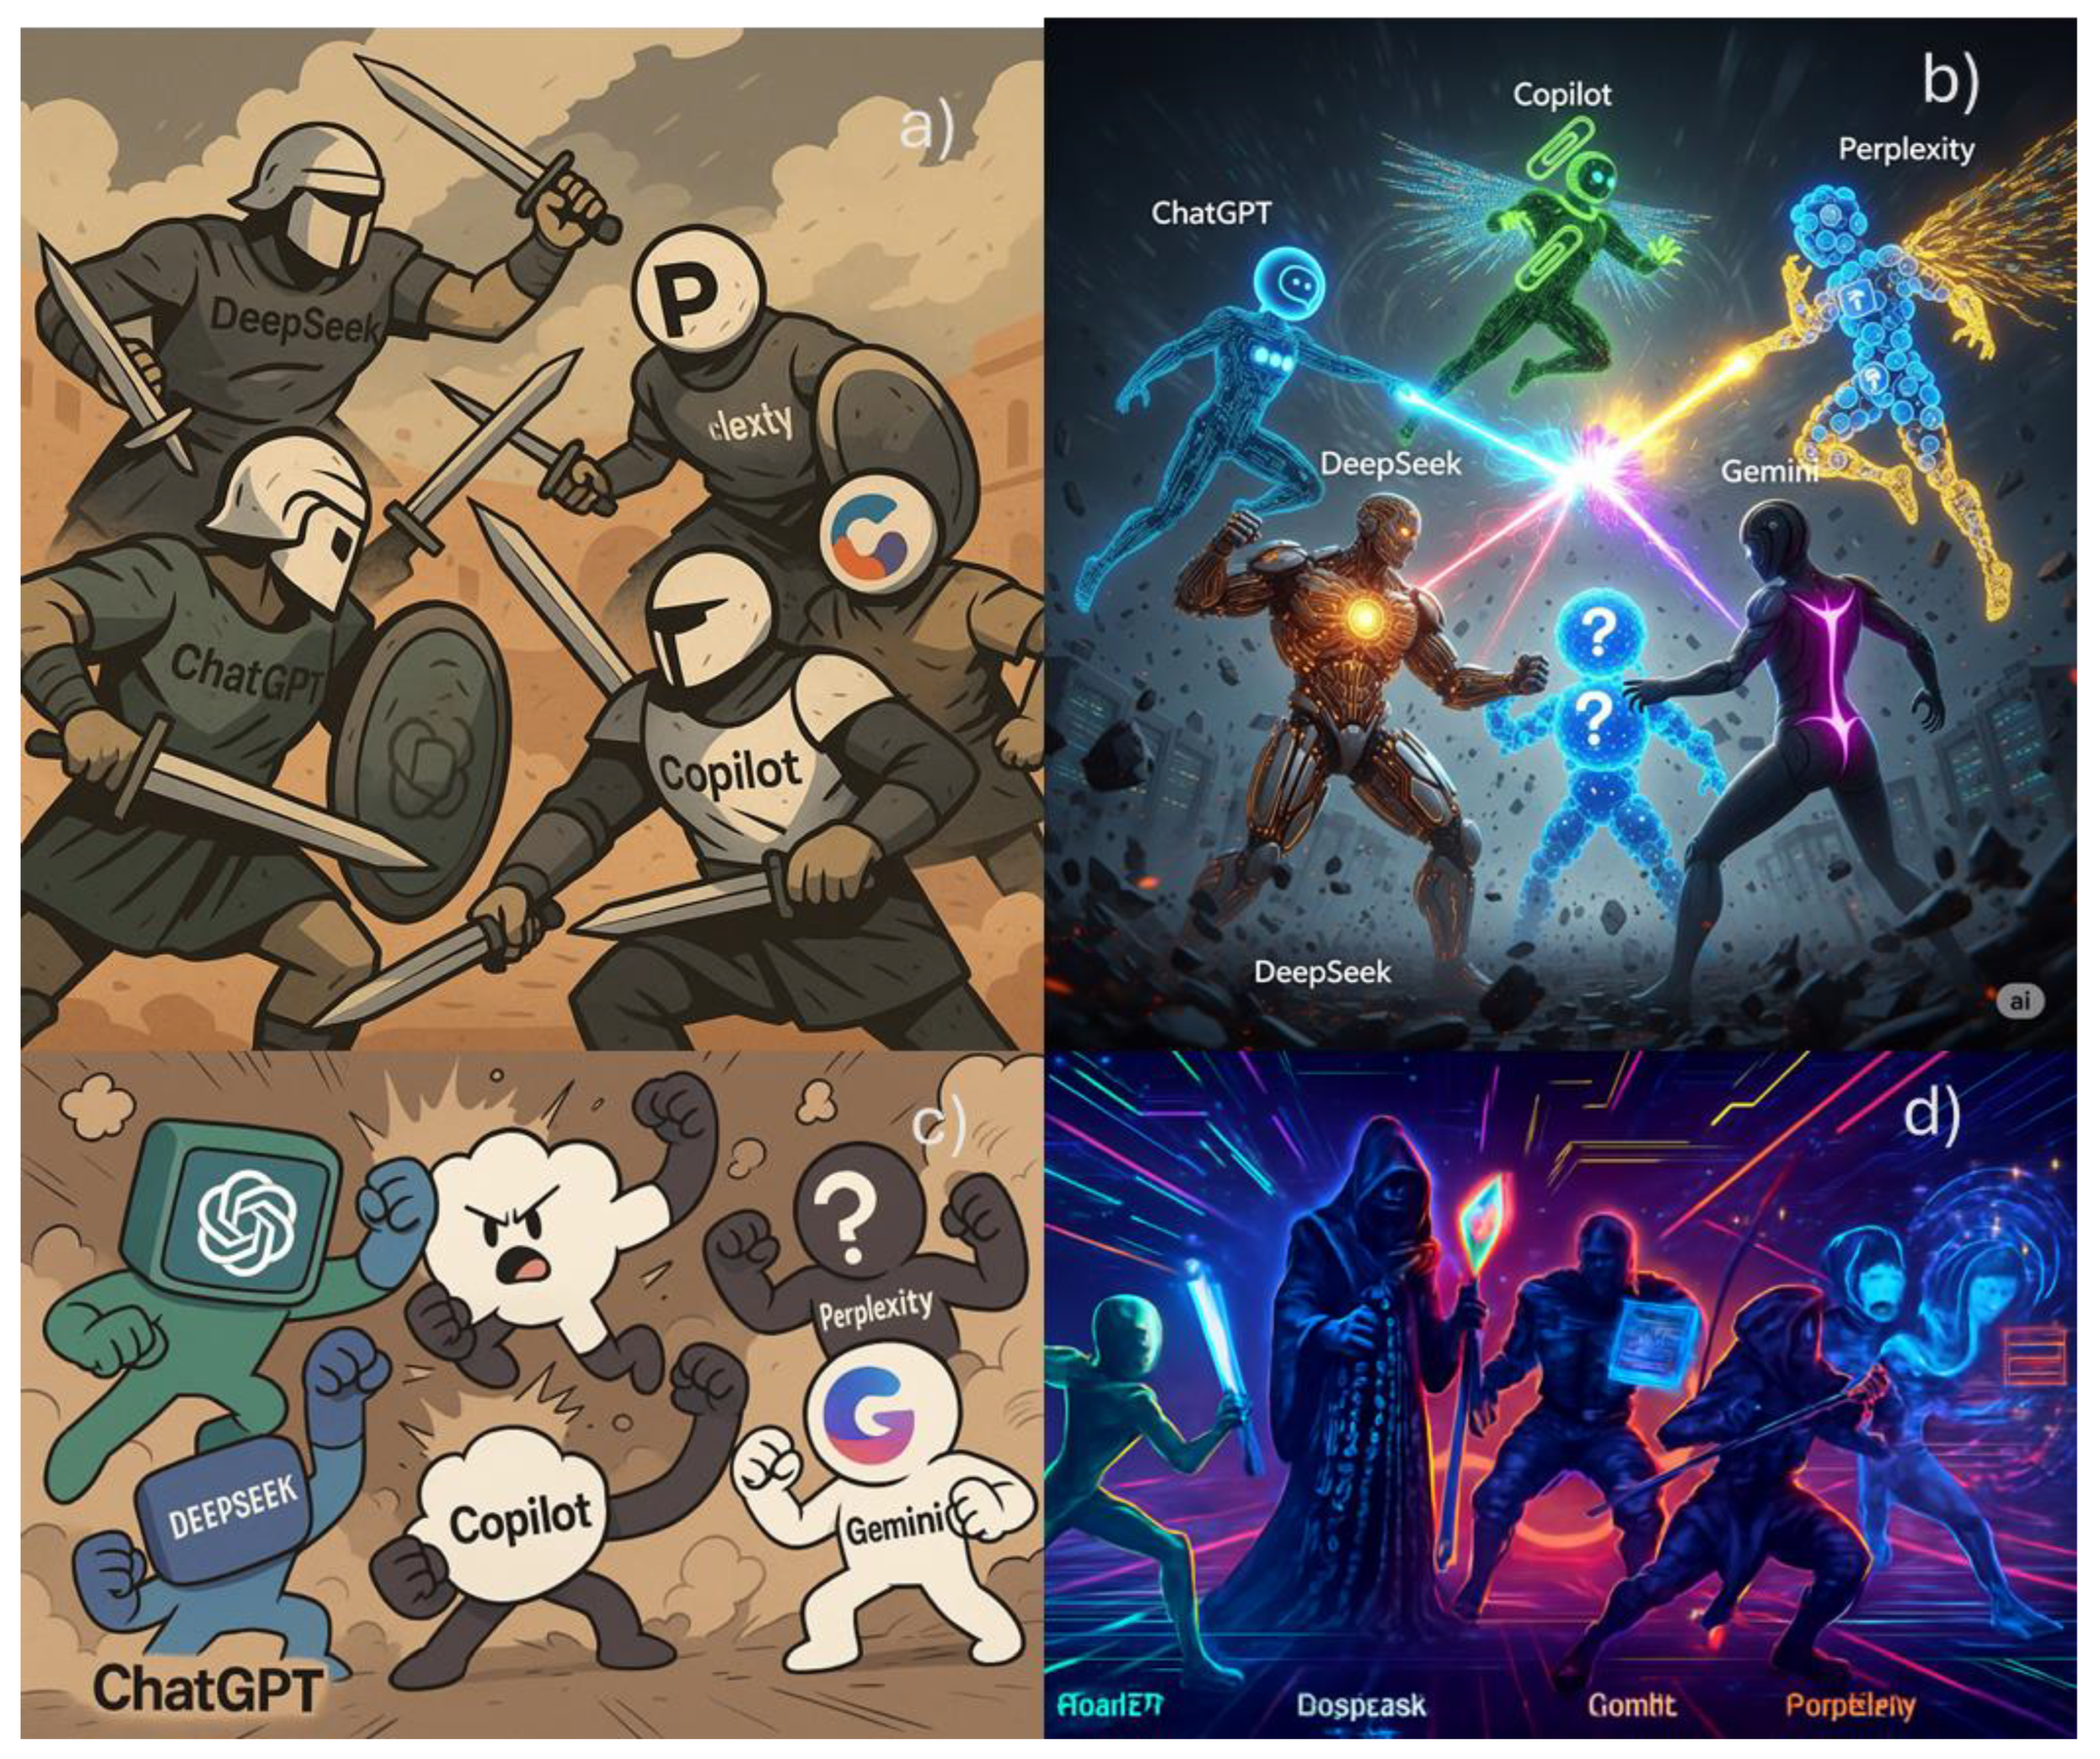
Figure 8.
Illustration of a battle between chatbots builds in style studio Ghibli using ChatGPT, in March 2025.
Figure 8.
Illustration of a battle between chatbots builds in style studio Ghibli using ChatGPT, in March 2025.
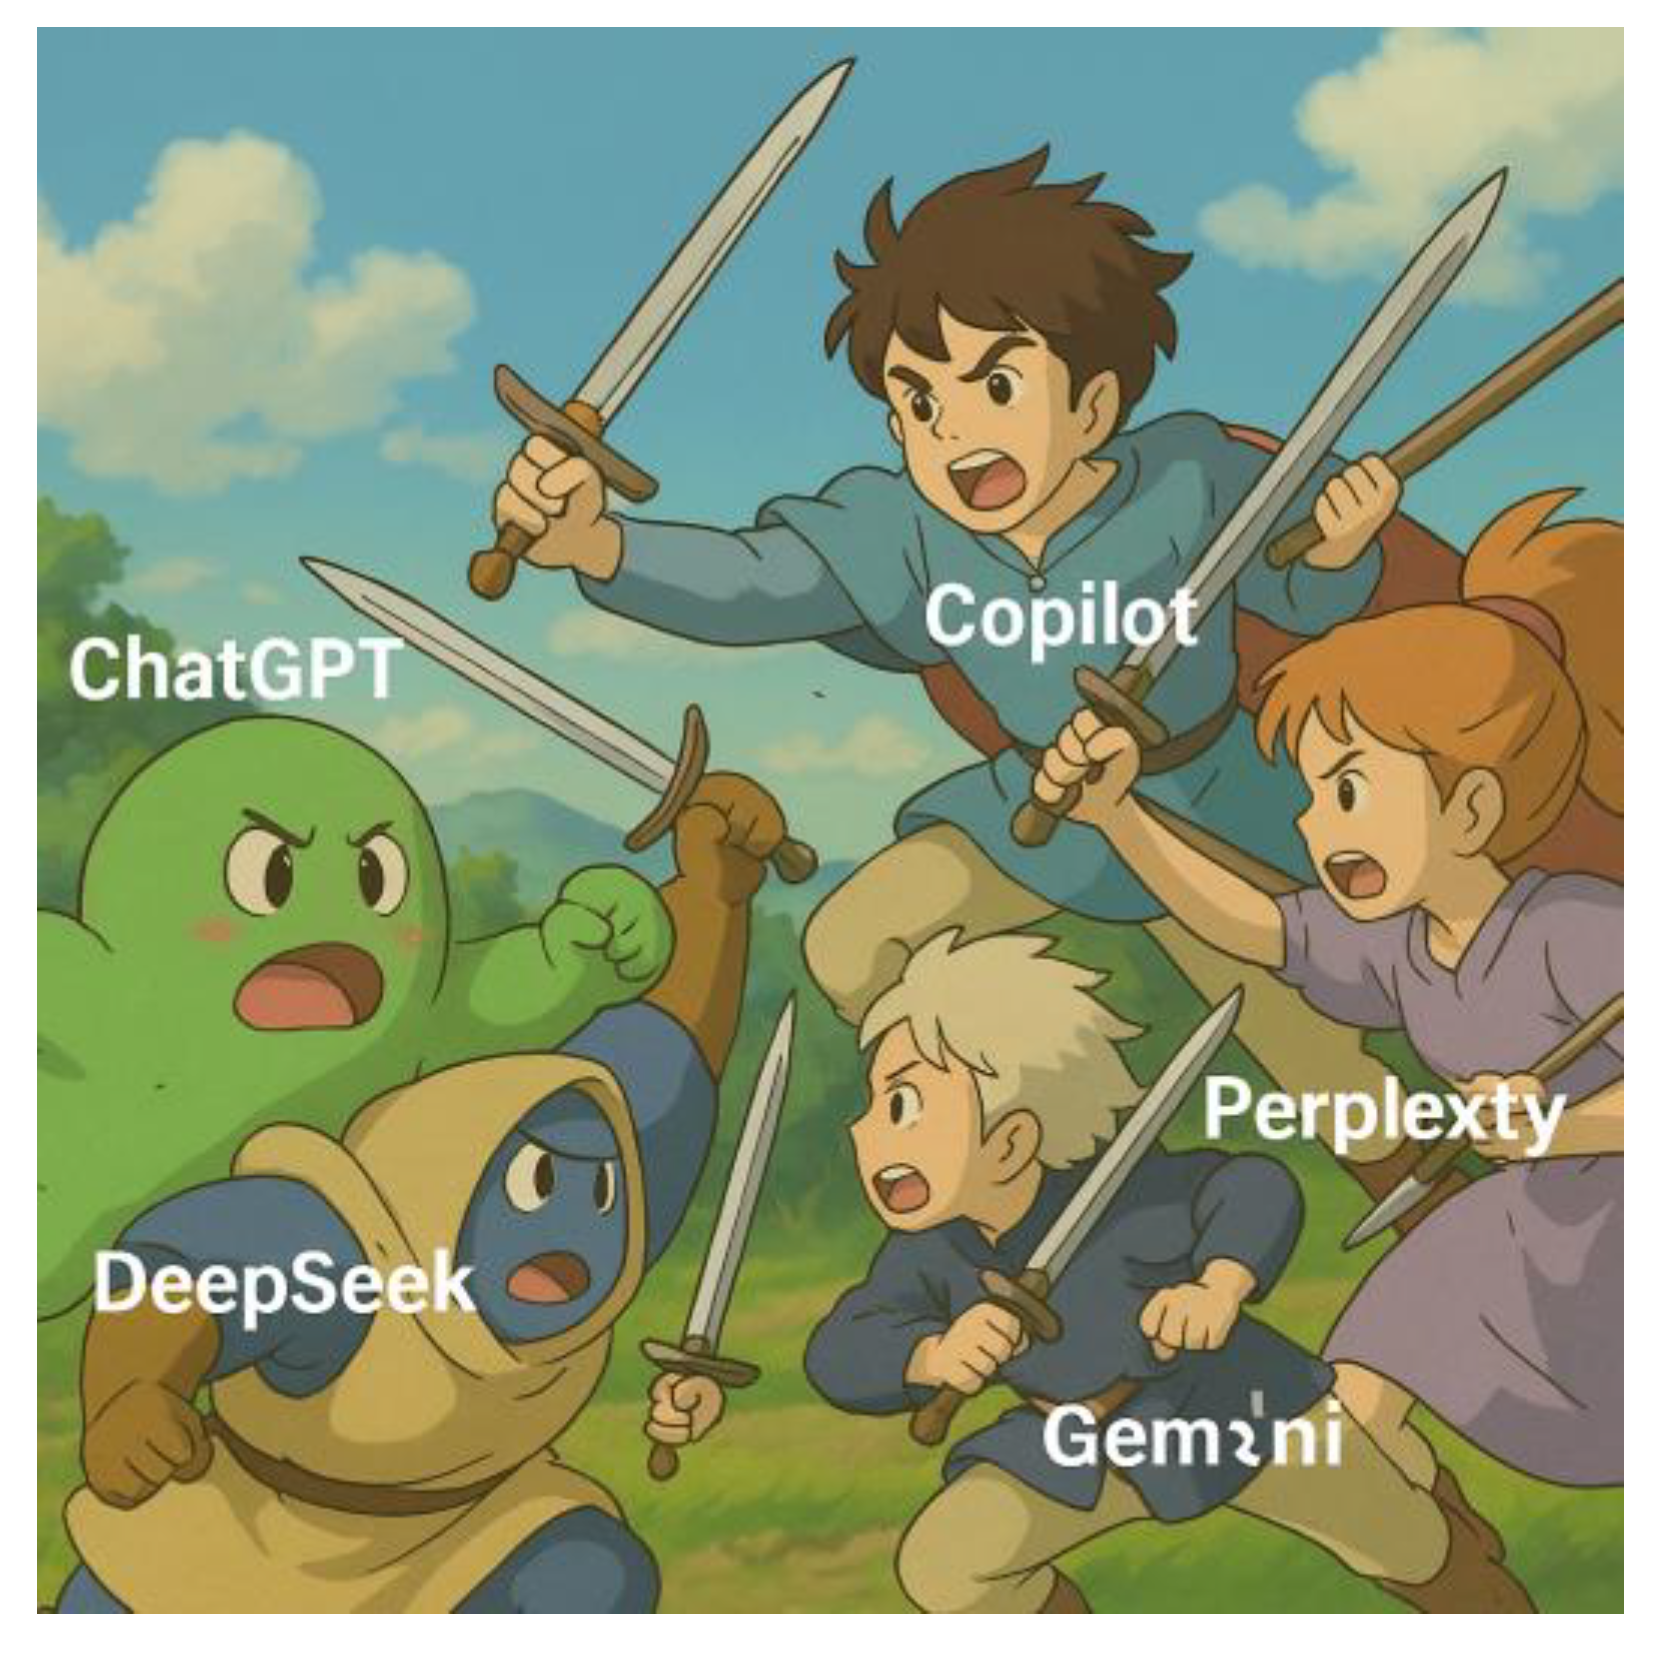
Figure 11.
the box plots for mean radius, mean texture, and mean perimeter, comparing Malignant and Benign diagnoses. Generated by Copilot in August 2025.
Figure 11.
the box plots for mean radius, mean texture, and mean perimeter, comparing Malignant and Benign diagnoses. Generated by Copilot in August 2025.
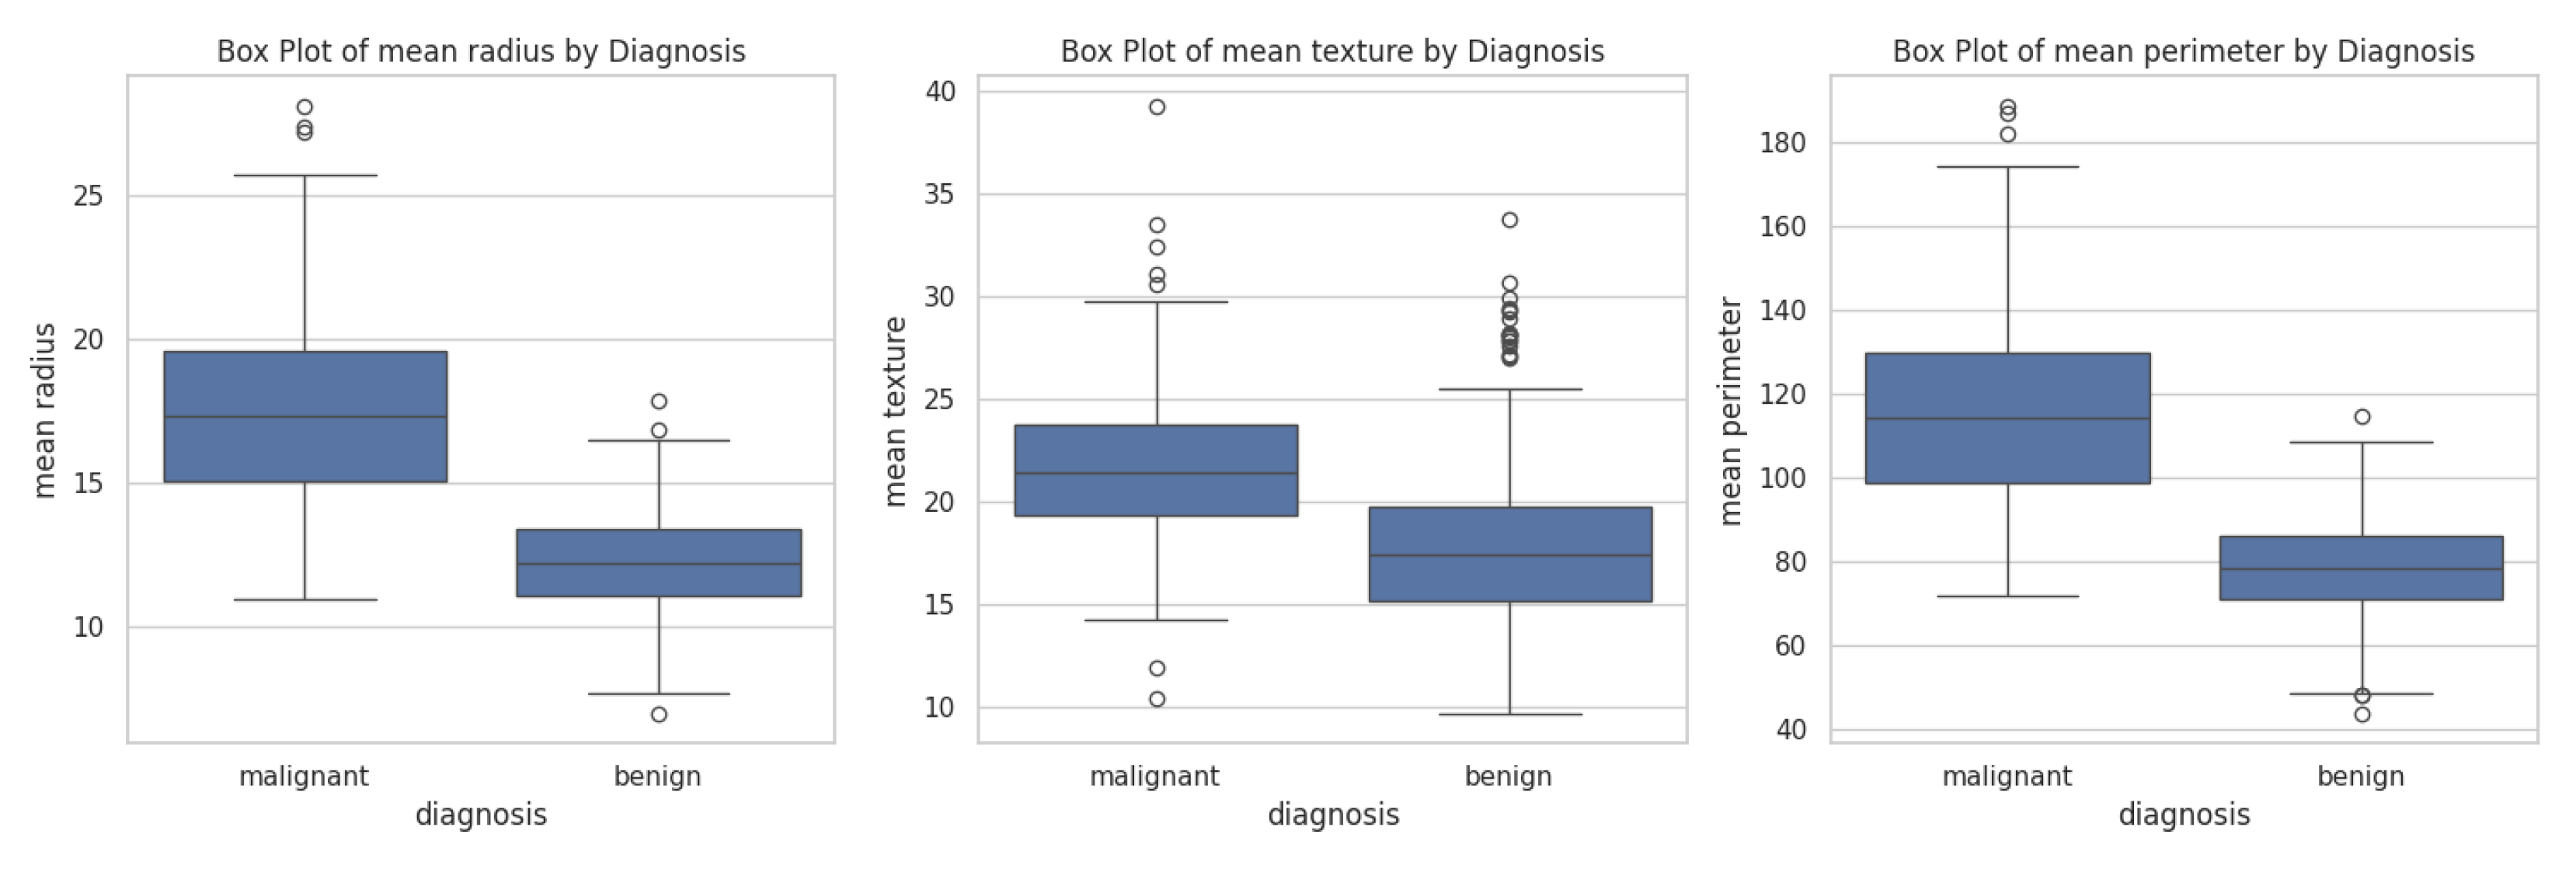
Figure 12.
he box plot displays the distribution of mean radius, mean texture, and mean perimeter grouped by diagnosis (Malignant or Benign) build by a) Gemini and b) ChatGPT.
Figure 12.
he box plot displays the distribution of mean radius, mean texture, and mean perimeter grouped by diagnosis (Malignant or Benign) build by a) Gemini and b) ChatGPT.
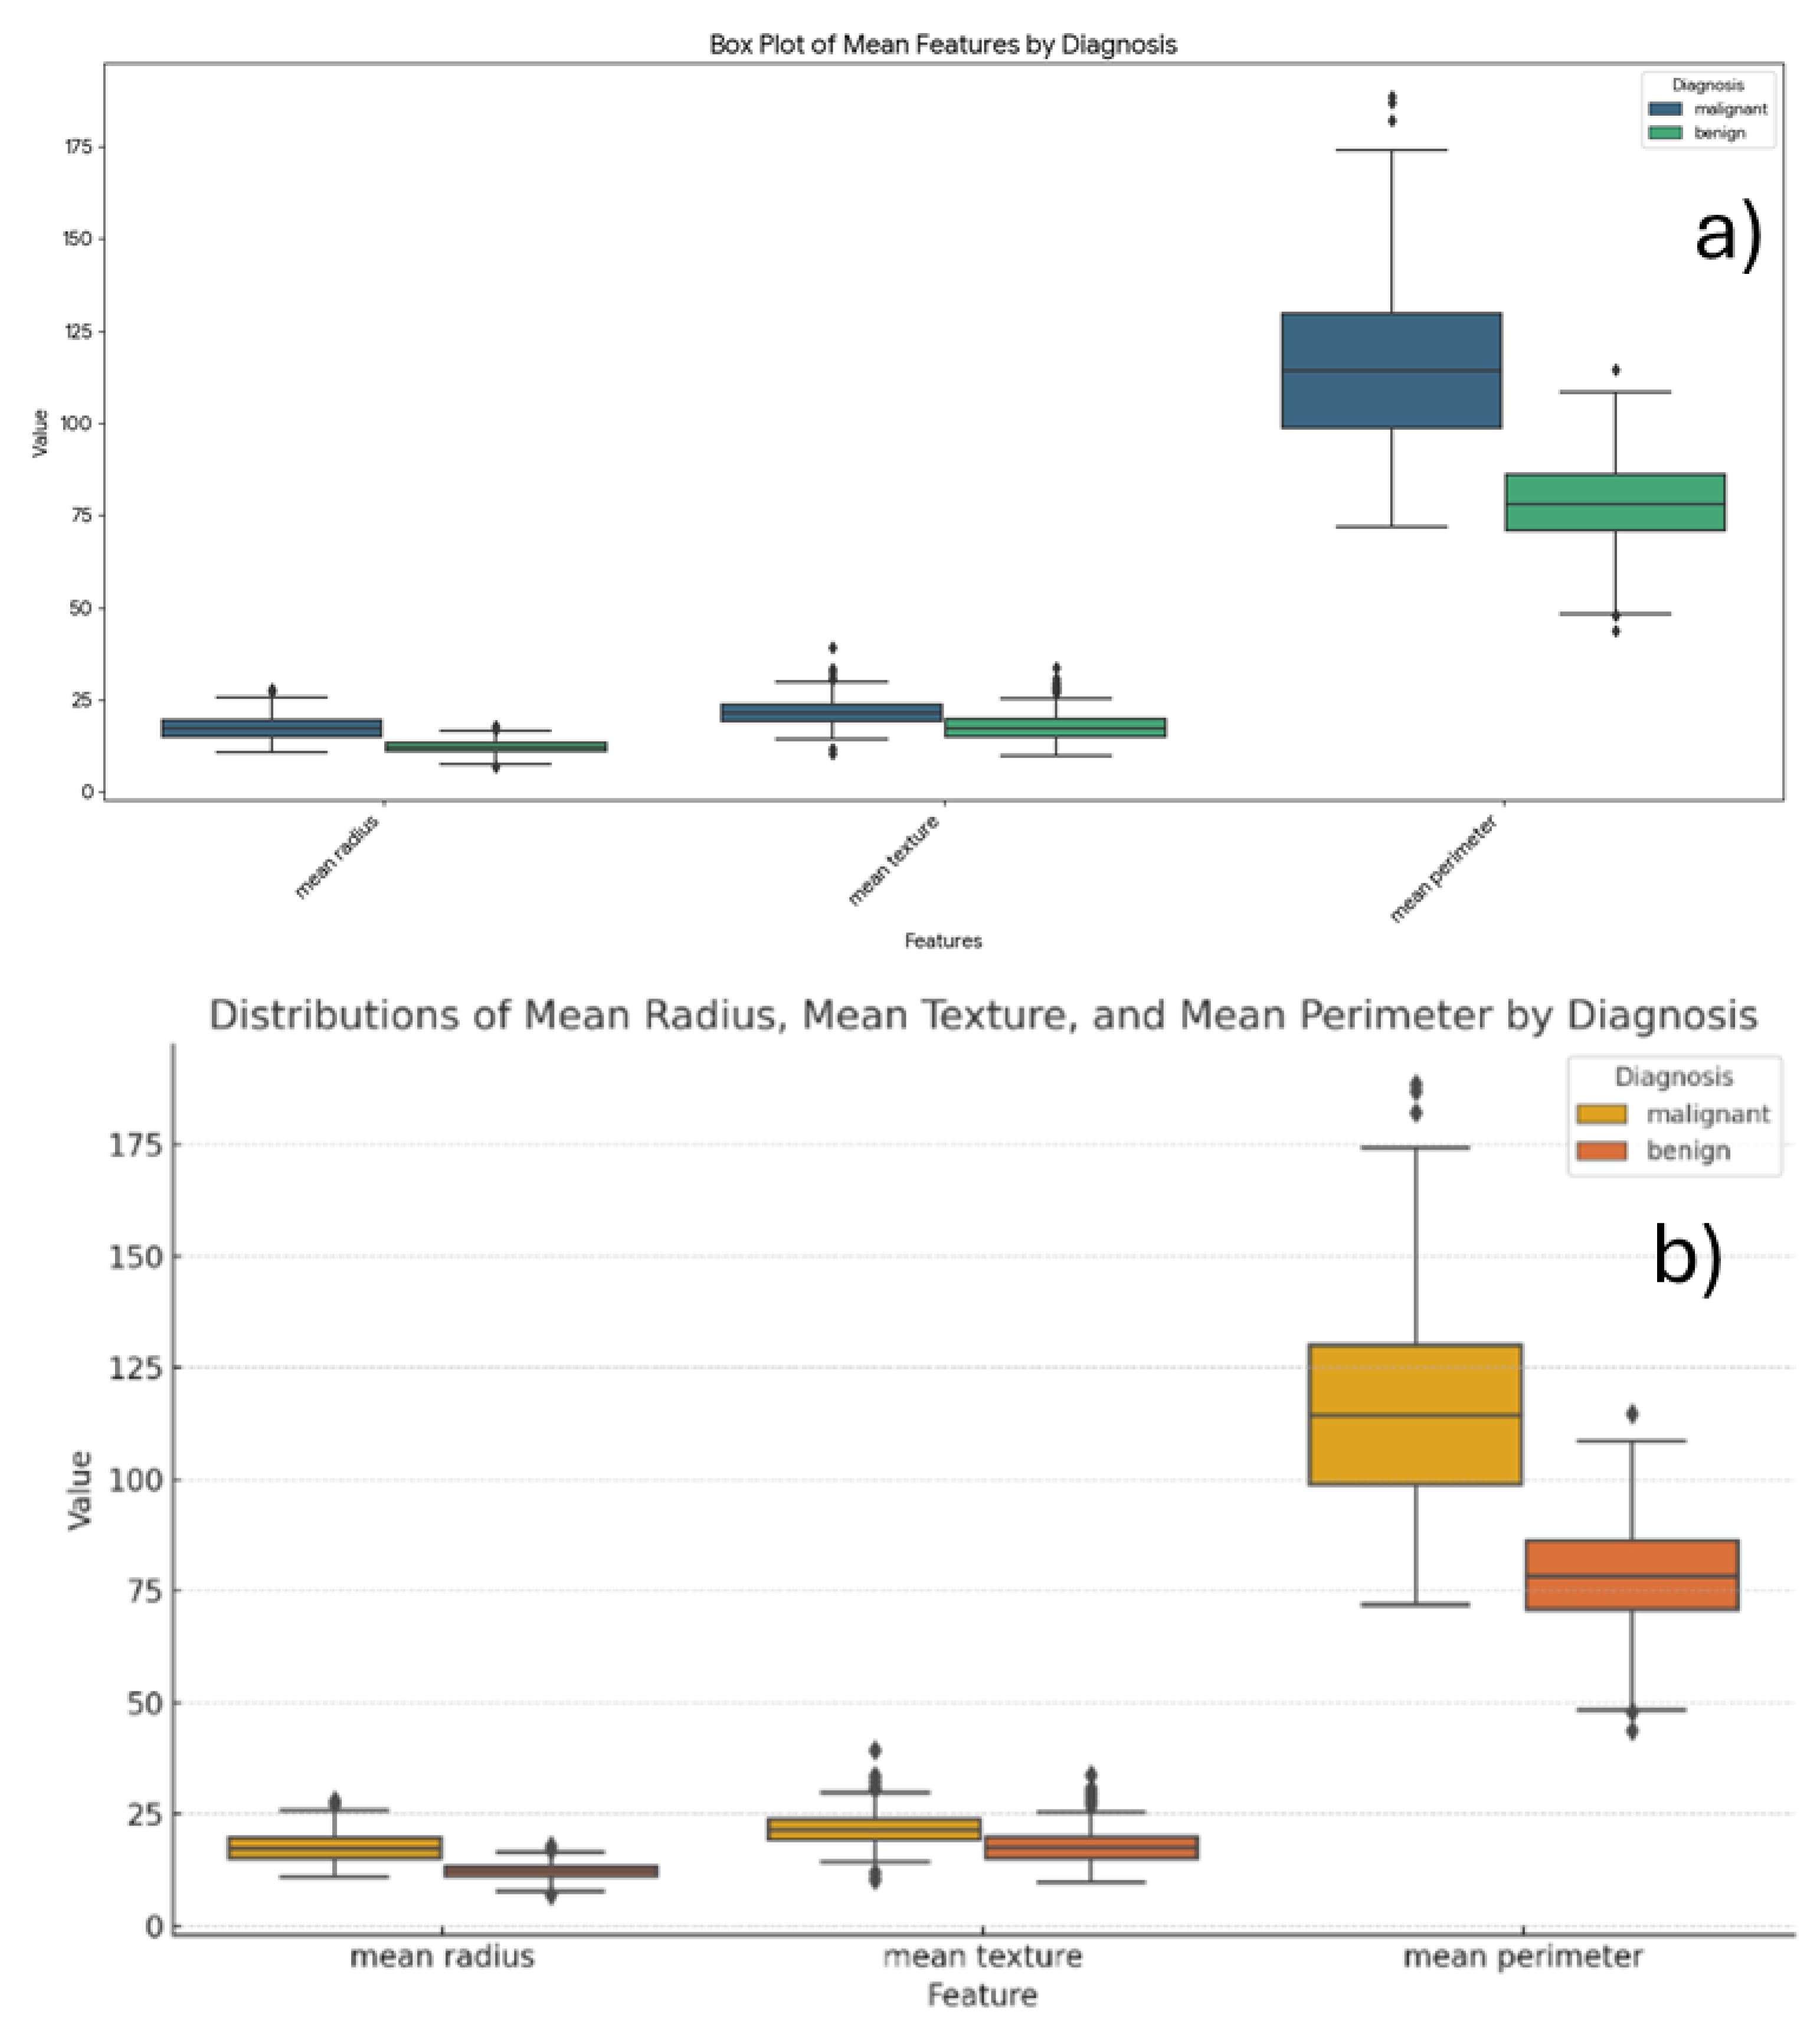
Figure 14.
Heatmap build using Copilot.
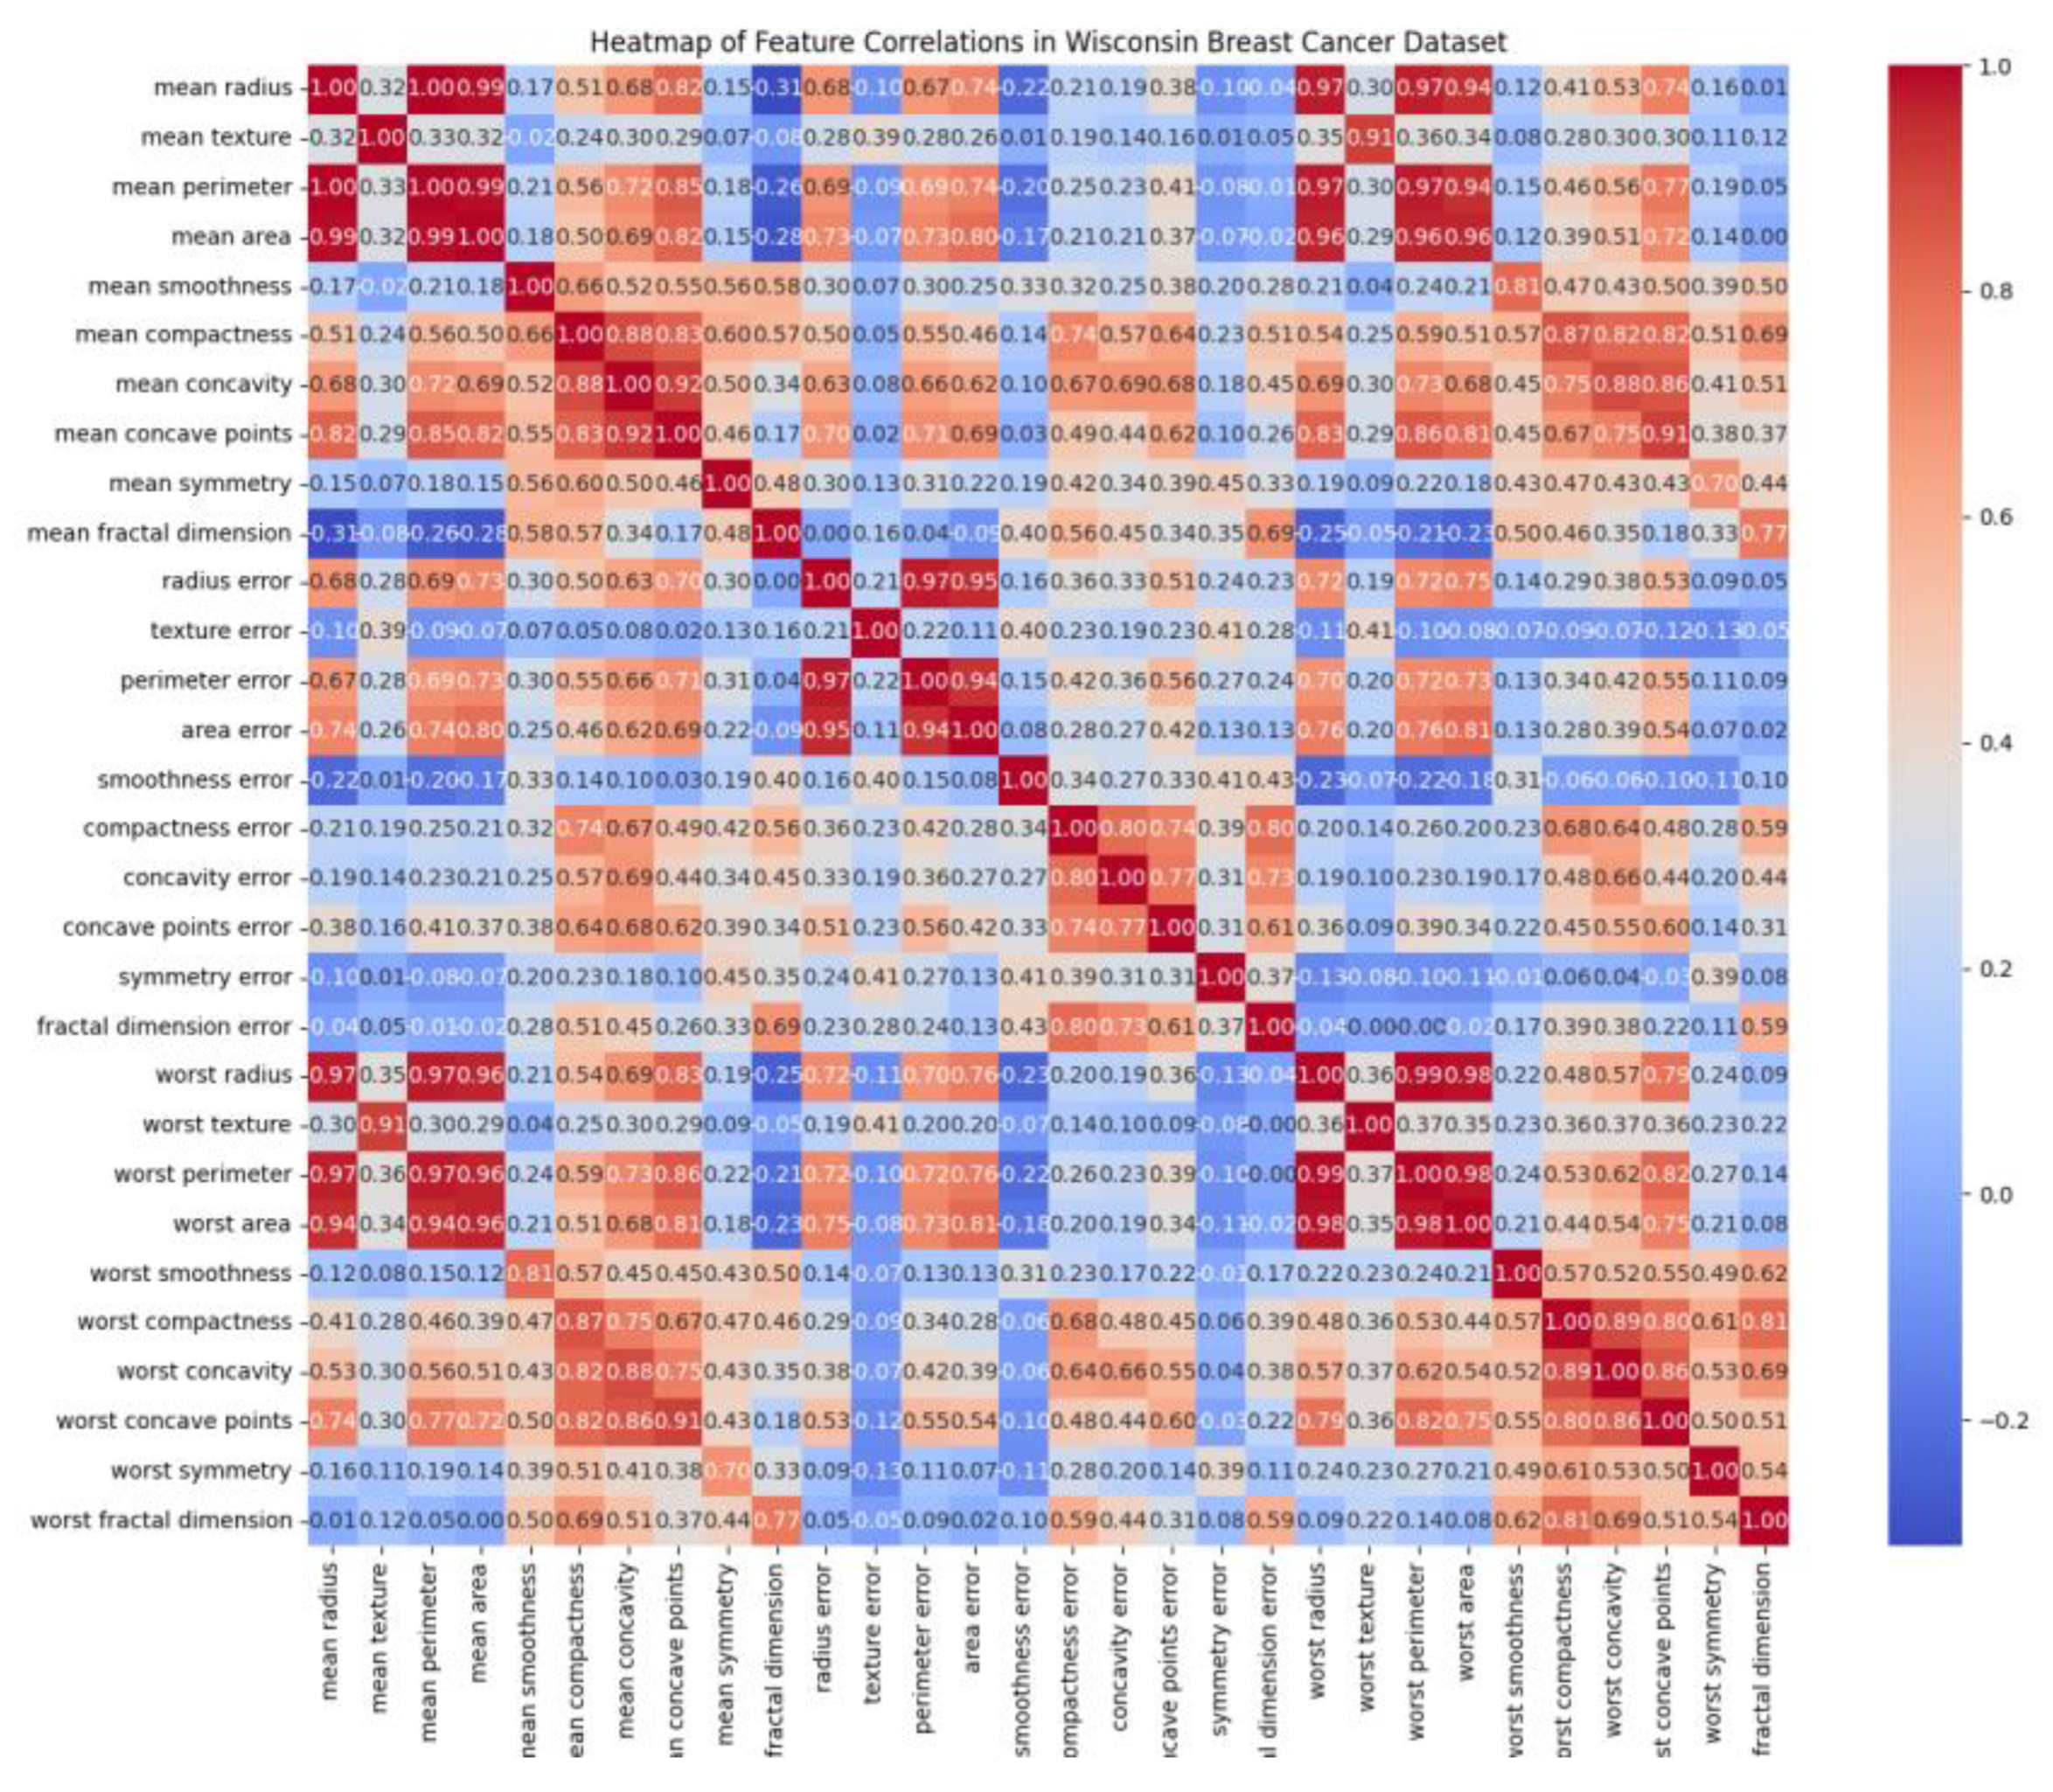
Figure 15.
Correlation plots between a) mean perimeter vs. mean radius, and (b) mean fractal dimension vs. radius error.
Figure 15.
Correlation plots between a) mean perimeter vs. mean radius, and (b) mean fractal dimension vs. radius error.
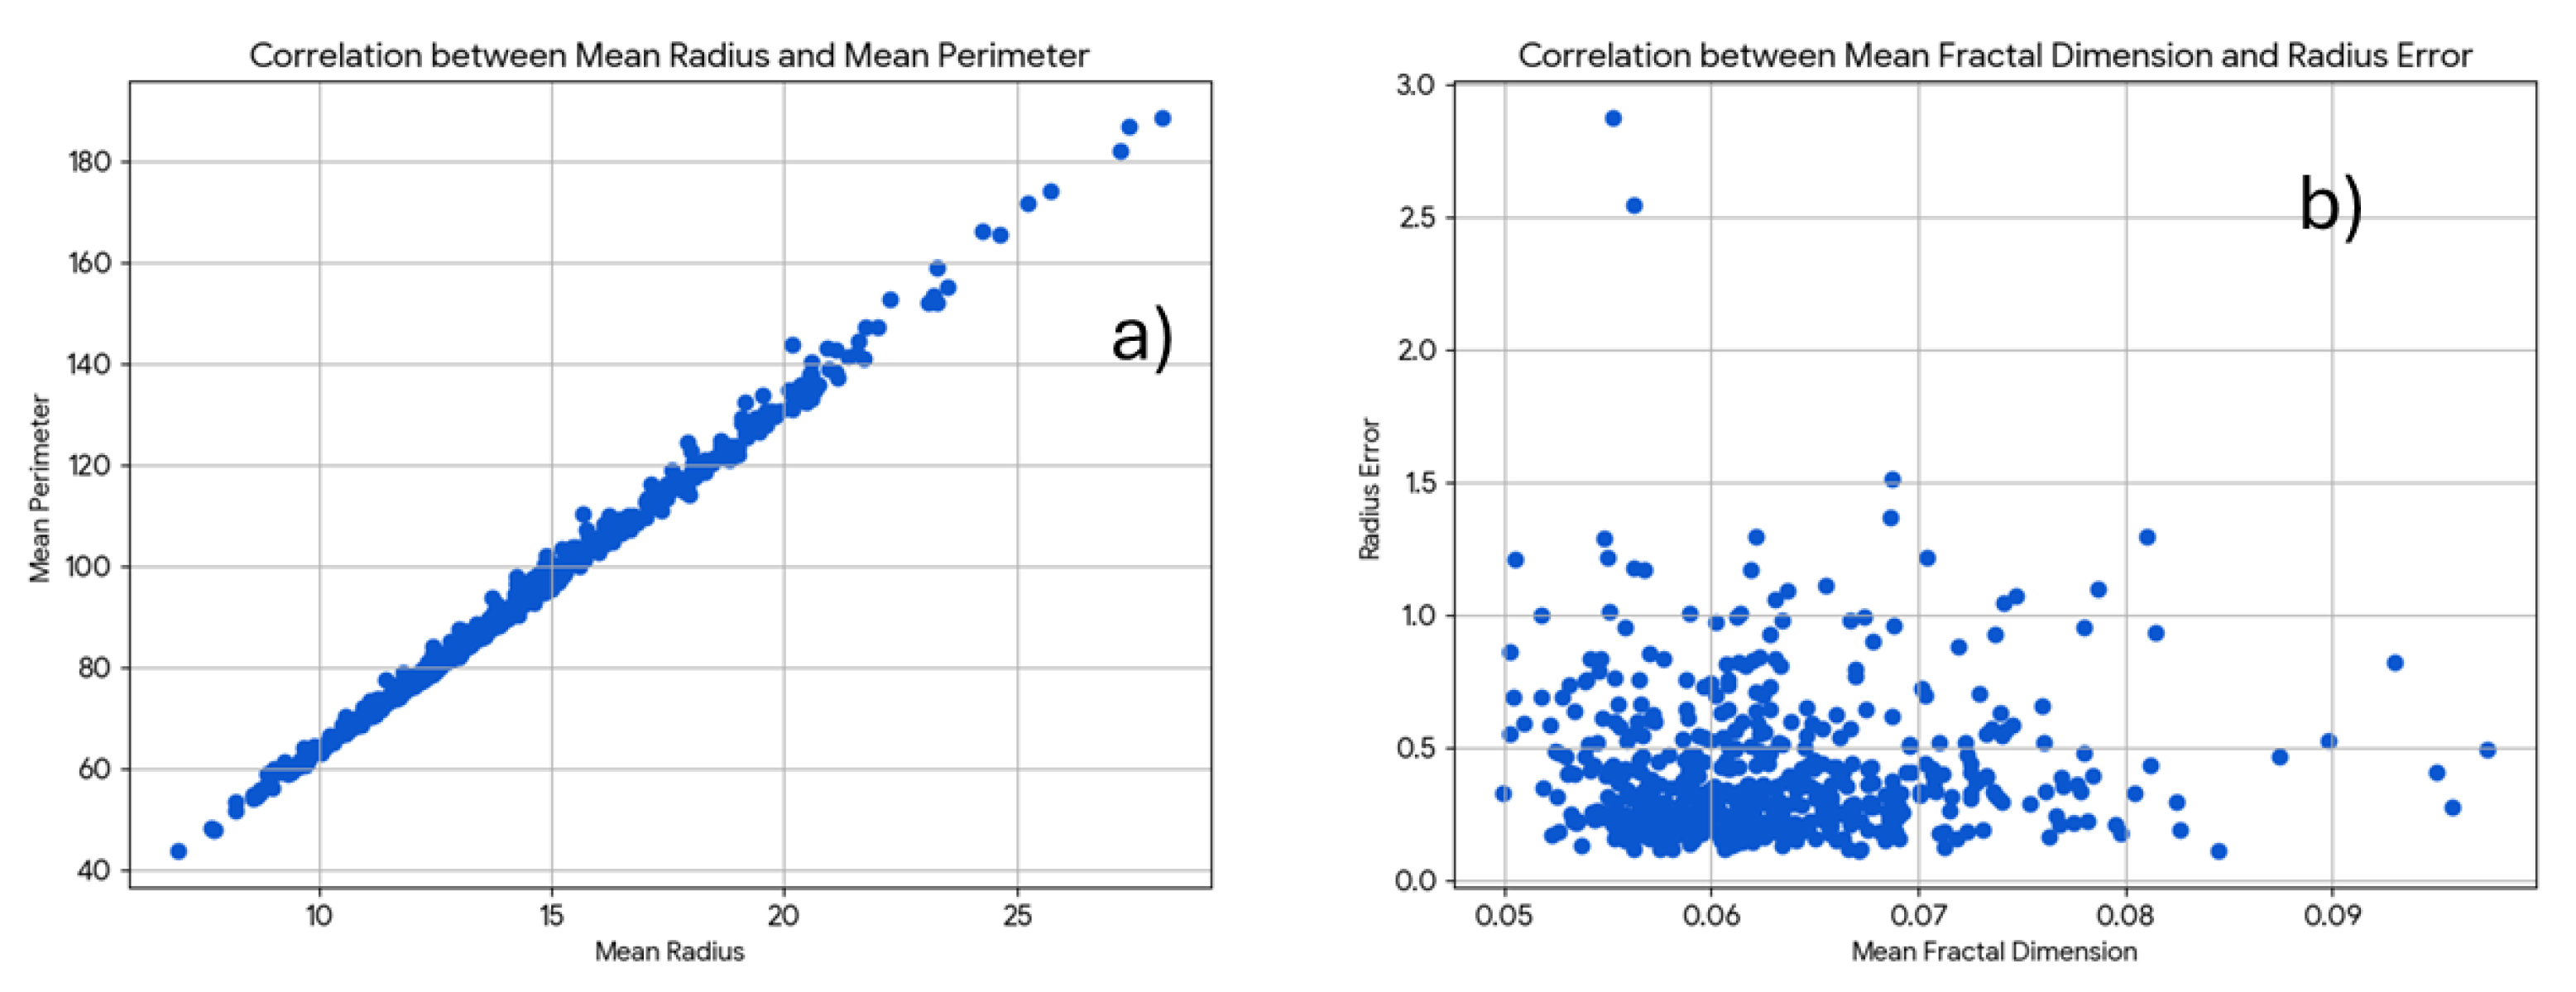
Figure 17.
The Hierarchical Cluster Analysis (HCA) dendrogram for the Wisconsin Breast Cancer dataset built using Gemini. HCA as PCA need data standardization and all chatbots correctly identified that the data required standardization prior to HCA analysis and automatically standardize the dataset before generating the dendrogram (Figure 17).
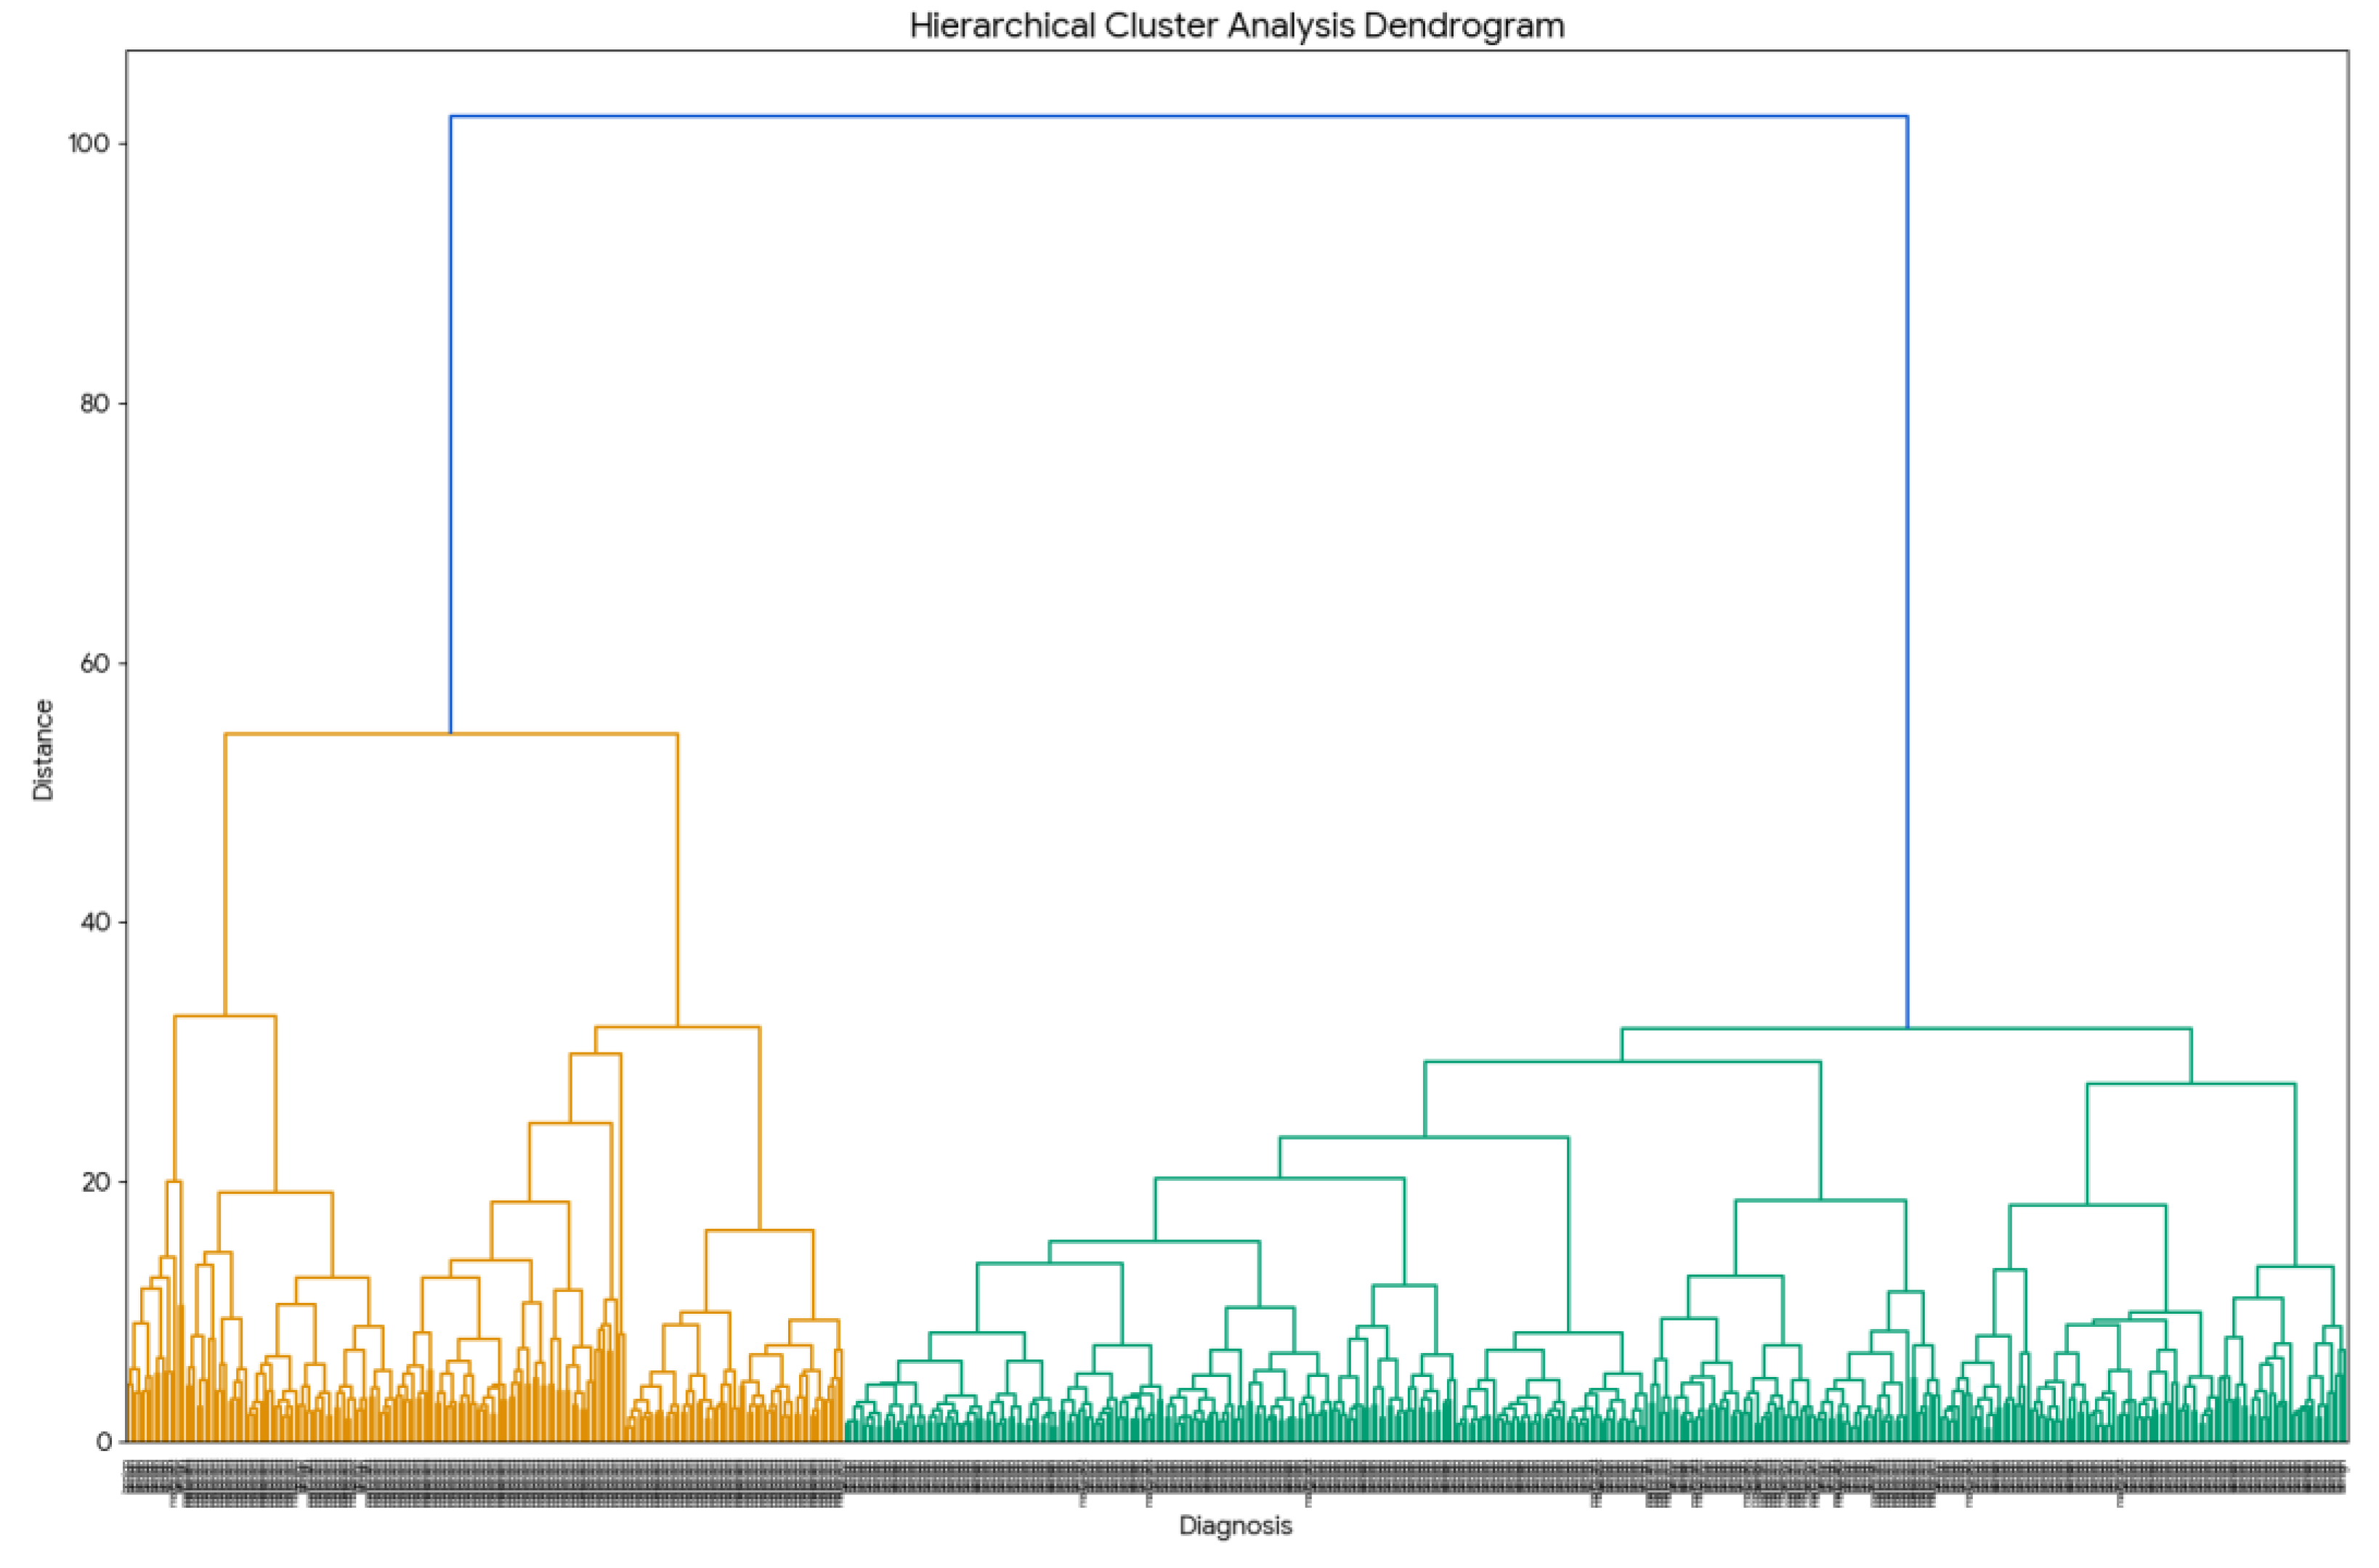
Figure 18.
This plot highlights the most influential features in predicting breast cancer diagnosis. Features like worst area, worst concave points, and mean concave points are among the top contributors generated by Copilot.
Figure 18.
This plot highlights the most influential features in predicting breast cancer diagnosis. Features like worst area, worst concave points, and mean concave points are among the top contributors generated by Copilot.
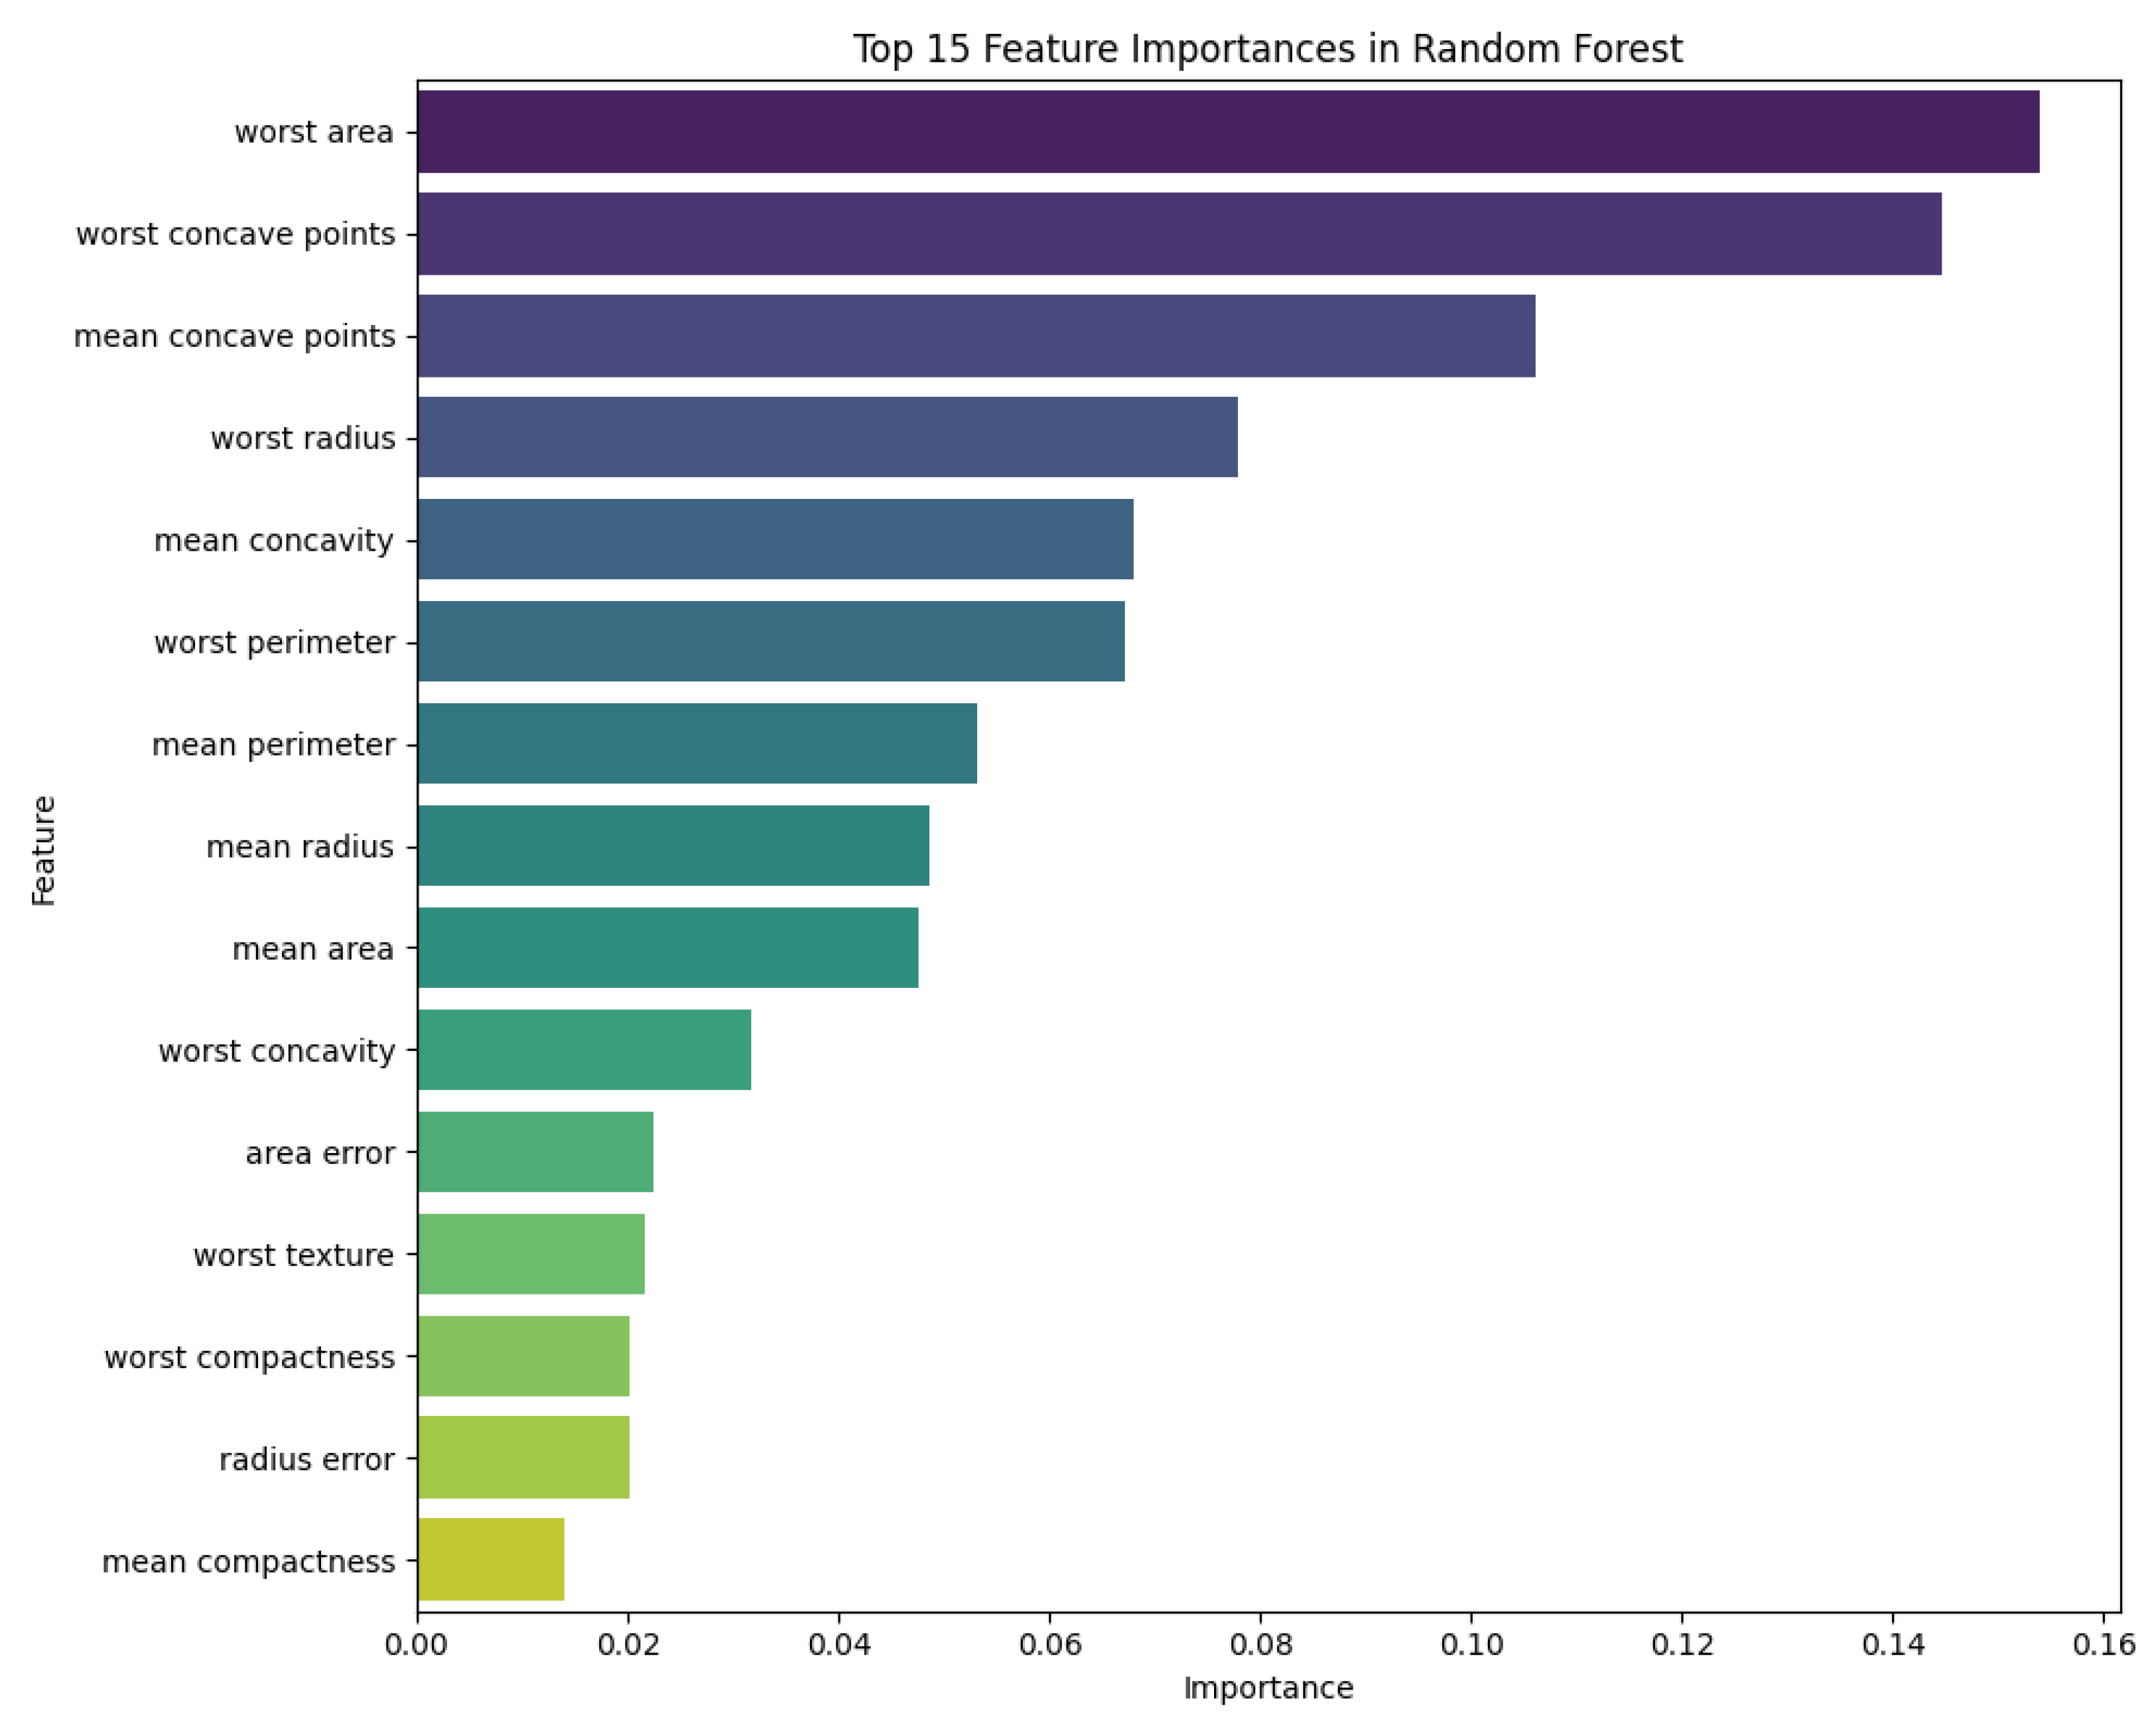
Figure 19.
Aggregated Confusion Matrix – Random Forest (5-Fold Cross Validation) build using Copilot.
Figure 19.
Aggregated Confusion Matrix – Random Forest (5-Fold Cross Validation) build using Copilot.
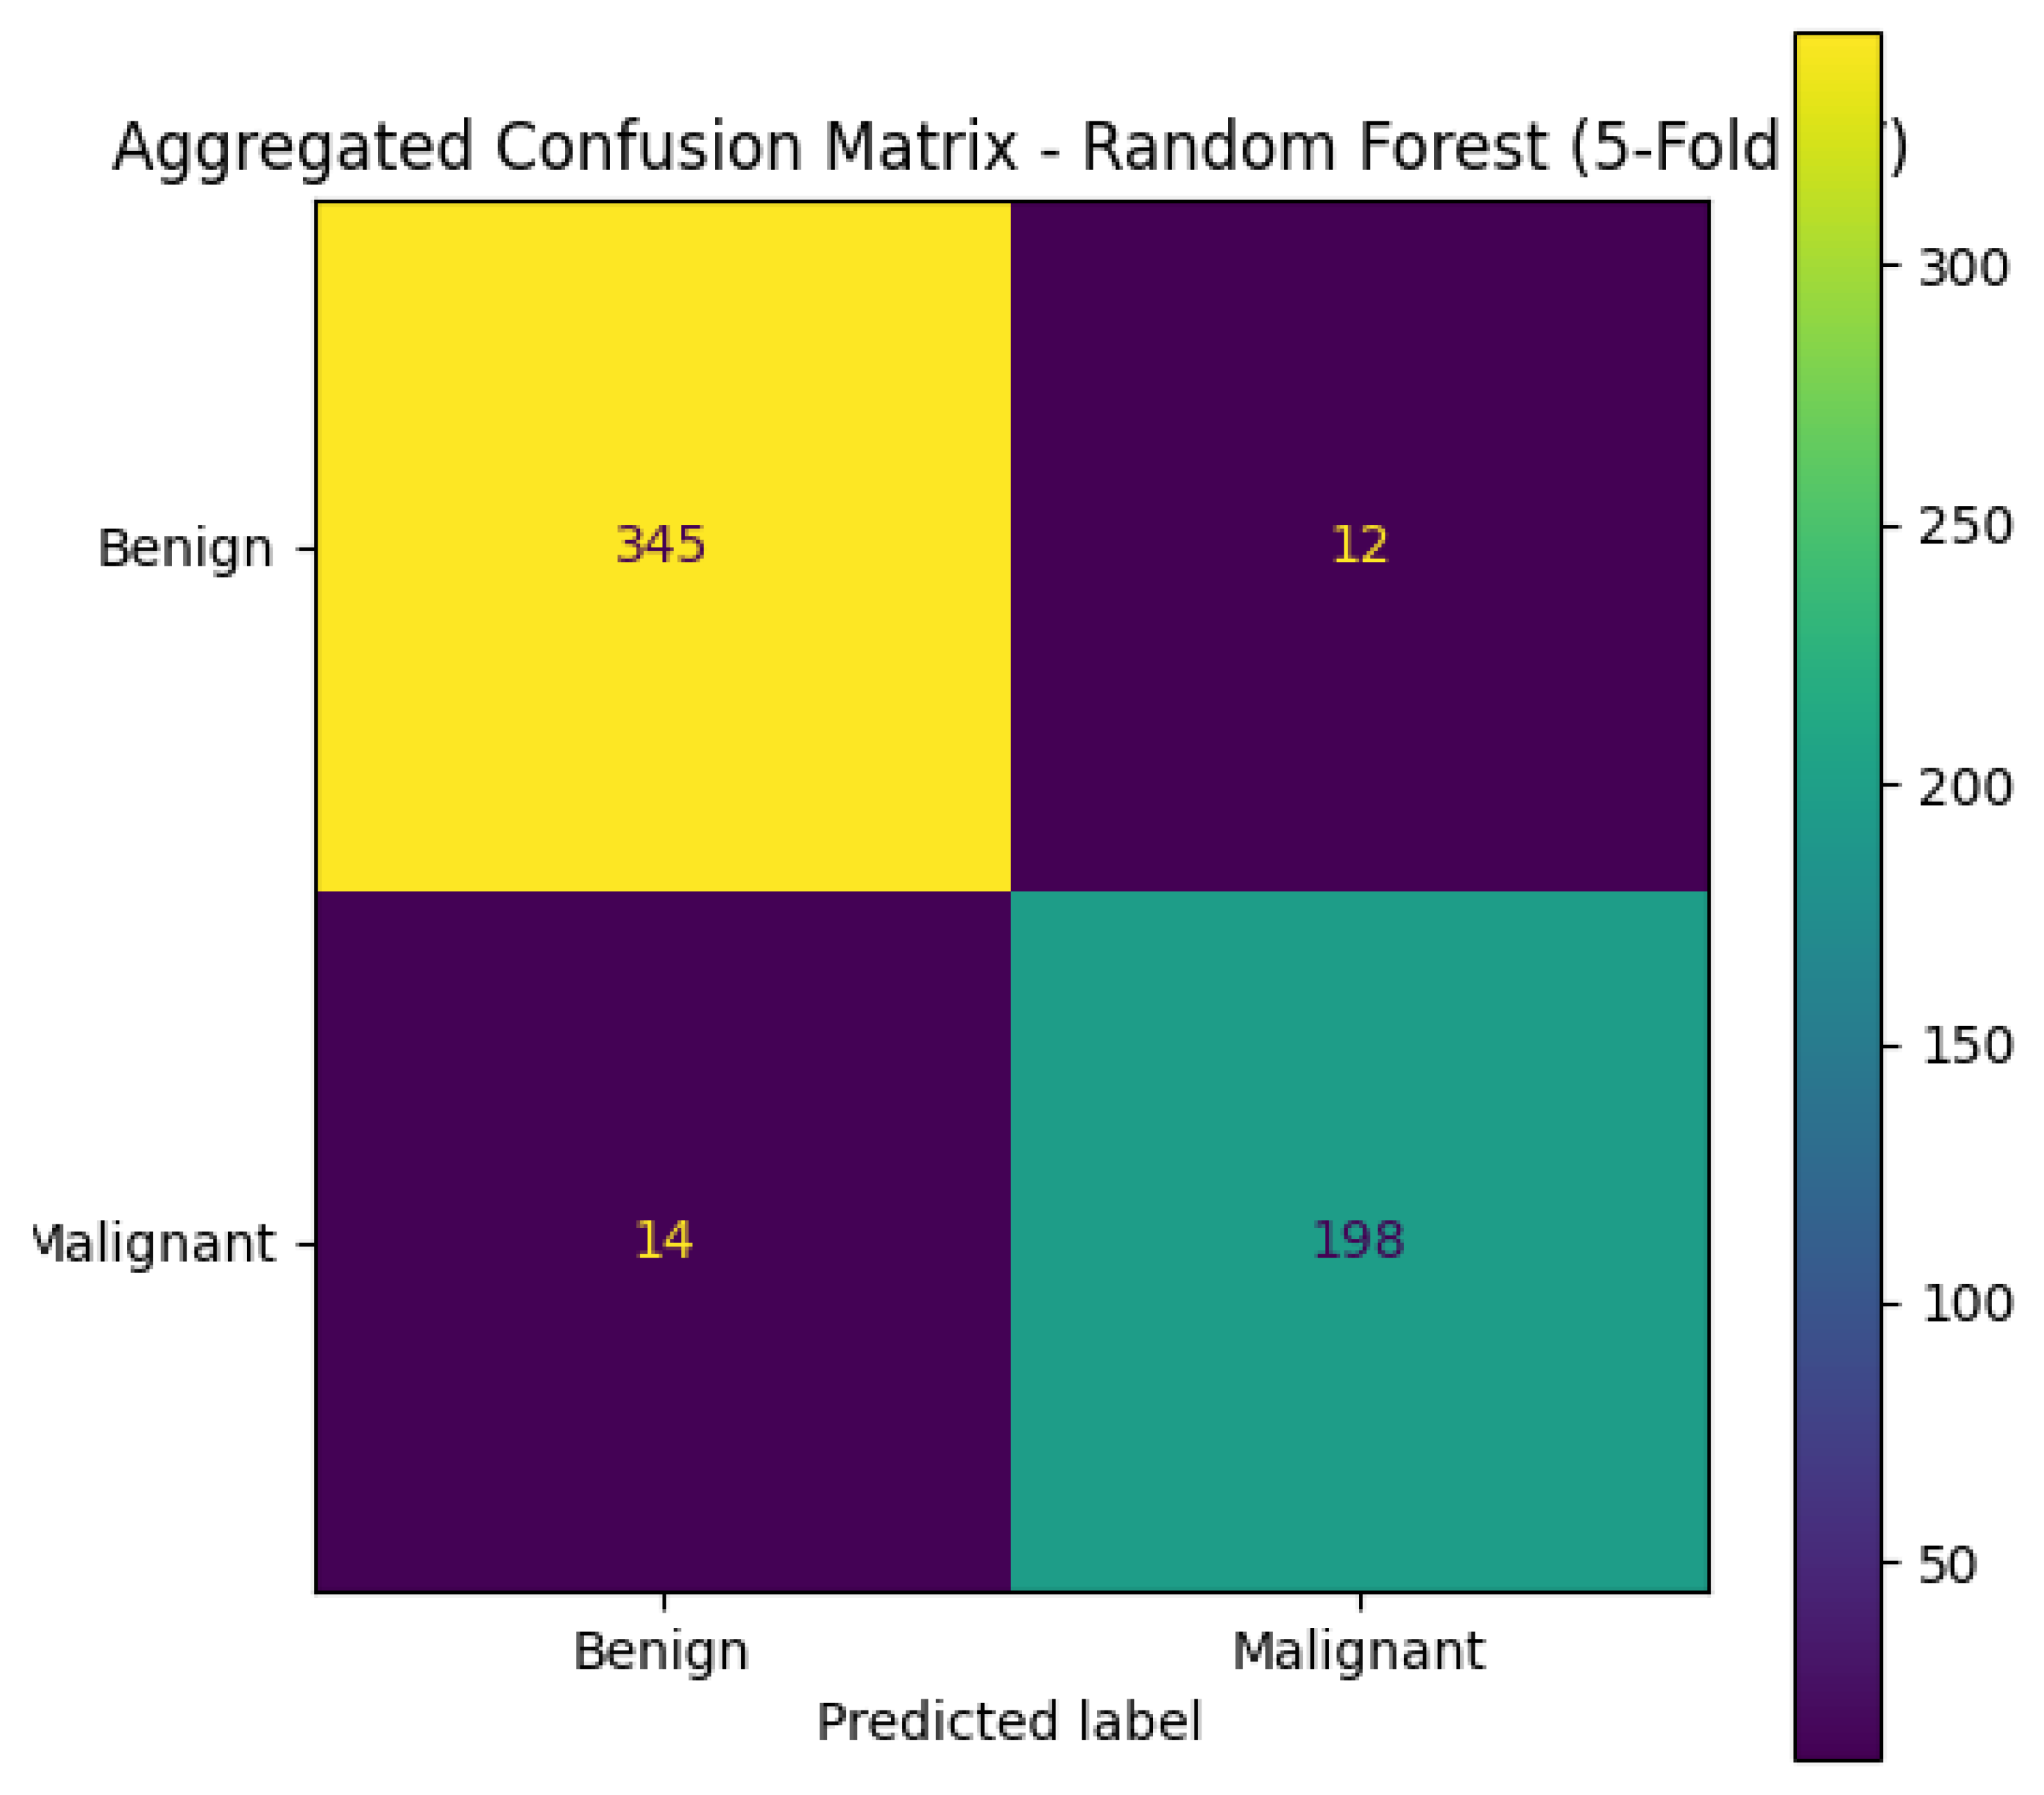
Table 3.
Top 10 Strongest Feature Correlations in the Wisconsin Breast Cancer Dataset: .
| Feature 1 | Feature 2 | Correlation |
| mean perimeter | mean radius | 0.998 |
| worst perimeter | worst radius | 0.994 |
| mean radius | mean area | 0.987 |
| mean perimeter | mean area | 0.987 |
| worst area | worst radius | 0.984 |
Table 4.
Top 10 weakest Feature Correlations in the Wisconsin Breast Cancer Dataset: .
| Feature 1 | Feature 2 | Correlation |
| mean fractal dimension | radius error | +0.0001 |
| worst perimeter | fractal dimension error | −0.0010 |
| worst texture | fractal dimension error | −0.0032 |
| mean area | worst fractal dimension | +0.0037 |
| mean perimeter | fractal dimension error | −0.0055 |
Disclaimer/Publisher’s Note: The statements, opinions and data contained in all publications are solely those of the individual author(s) and contributor(s) and not of MDPI and/or the editor(s). MDPI and/or the editor(s) disclaim responsibility for any injury to people or property resulting from any ideas, methods, instructions or products referred to in the content. |
© 2025 by the authors. Licensee MDPI, Basel, Switzerland. This article is an open access article distributed under the terms and conditions of the Creative Commons Attribution (CC BY) license (http://creativecommons.org/licenses/by/4.0/).
Copyright: This open access article is published under a Creative Commons CC BY 4.0 license, which permit the free download, distribution, and reuse, provided that the author and preprint are cited in any reuse.


