Submitted:
15 August 2025
Posted:
15 August 2025
You are already at the latest version
Abstract
In today’s highly competitive and volatile environment, supply chains in emerging economies face ongoing challenges related to inventory management, demand forecasting, and distribution efficiency. This research proposes a predictive approach based on machine learning, specifically using ensemble stacking techniques, to optimize key logistics processes. Real-world data from a commercial company was used to develop a predictive framework that integrates various base algorithms Random Forest, CatBoost, XGBoost, Gradient Boosting, Decision Trees, and K-Nearest Neighbors combined through a Linear Regression meta-model. Performance evaluation using metrics such as MSE, RMSE, MAE, and R² revealed significant improvements in predictive accuracy compared to individual models, particularly in indicators such as material demand, purchase profitability, sales revenue, and inventory levels. The findings confirm that stacked models not only enhance forecasting capabilities but also offer a scalable, adaptable, and cost-effective solution to support logistics decision-making in resource-constrained contexts. This approach presents a strong alternative for boosting operational efficiency in supply chains across developing regions.
Keywords:
supply chain
; ensemble stacking
; demand
; inventory
; distribution
; machine learning
1. Introduction
In the current global context, supply chains face increasingly complex challenges, leading to economic damage [1]. Globalization has increased the interdependence between suppliers, distributors, and consumers, creating greater exposure to risks such as demand fluctuations [2], variability in delivery times, and inventory management difficulties [3]. These factors are exacerbated by uncertainty in demand and product performance, along with challenges in replenishment and decision-making under uncertain conditions, all of which are critical factors affecting the stability and efficiency of supply chains. These issues are particularly relevant in environments with higher risks associated with demand, distribution, and sales [4,5]. This situation requires companies to seek more advanced methods to optimize their logistics operations and improve decision-making accuracy in logistics strategies [6]. However, traditional logistics management cannot always anticipate these changes with sufficient accuracy, resulting in high costs, excess inventory, stockouts, and prolonged delivery times [7,8]. Therefore, predicting and managing these aspects efficiently has become a key challenge for companies [9,10].
To address these challenges, various methodologies based on advanced artificial intelligence and machine learning techniques have been explored in logistics management, as artificial intelligence stands out as a key tool for improving efficiency, sustainability, and agility in logistics [11,12]. As technology continues to advance, its integration into logistics operations promises to transform further the way companies manage their supply chains and meet the growing demands of the global market [13,14,15]. Furthermore, machine learning is revolutionizing logistics management by improving operational efficiency and decision-making across various key areas [16,17,18]. By using advanced algorithms, ML enables the processing of large volumes of data to identify complex patterns and make accurate predictions, helping reduce costs, improve production, and optimize [18,19]. In particular, the use of predictive models, such as ensemble stacking, has shown great potential for improving prediction accuracy by combining multiple models to generate more robust results, as it is used to combine several predictive models, enhancing prediction accuracy and decision-making efficiency in various areas [20,21,22]. Thus, these approaches allow for considering various factors and complex patterns that influence supply chain logistics, from demand fluctuations to optimizing delivery times and inventory management.
Various studies have applied machine learning techniques to logistics management, such as [23], which developed a machine learning model to improve workforce planning in logistics, focusing on forecasting staffing needs based on the number of delivery points. This model was tested in a company and proved more accurate than manual forecasts and other automated models, especially in the short term. However, it suggests improvements for future research. The study [24] focused on improving product inventory management by proposing a deep reinforcement learning method that combines offline learning with online planning to optimize inventory levels. This approach outperforms traditional methods and is effective in supply chains with multiple products and stores. Furthermore, the research [25] proposed an approach to improve demand forecasting in the retail industry by predicting demand for each segment. A Bayesian model is then used to combine forecasts from different analytical techniques, which is validated with a case study, showing an improvement in the accuracy of daily demand predictions. Finally, the research [26] addressed inventory control to satisfy customer demand while minimizing costs by facing demand uncertainty. It used ensemble deep learning forecasting methods to predict future demand, optimizing inventory through safety stock calculation based on the forecasted demand distribution to maintain an adequate service level. However, these models often face limitations due to a lack of flexibility in the face of dynamic changes or the limited capacity of individual models to capture the full complexity of the system. Despite advancements in these approaches, many models do not meet expectations as they fail to adequately adapt to unpredictable market fluctuations or the interaction of multiple variables within the supply chain. This can result in inaccurate predictions that directly affect decision-making and the optimization of logistical resources.
For this reason, it was decided to investigate and optimize the supply chain of a commercial enterprise using machine learning models to improve accuracy, reduce costs, and optimize logistical processes in complex environments [27,28,29]. Therefore, this approach will enable better decision-making by integrating multiple information sources and forecasting variations in demand, delivery times, and inventories, allowing for more effective distribution.
It is worth noting that the significance of this research lies in its potential to transform logistics management, providing companies with more accurate and reliable tools to anticipate and manage resources efficiently, thereby improving efficiency and accuracy in logistics management across various sectors [30,31]. Additionally, improvements in logistics predictions not only optimize costs but also enhance customer satisfaction by ensuring a more agile and responsive supply chain.
2. Materials and Methods
The methodology used in this research is ensemble stacking, a machine-learning technique that improves prediction accuracy by combining the results of several models [32,33,34]. Instead of relying on a single algorithm, various models are employed to capture different patterns in the data. Each model makes its prediction, and a subsequent meta-model learns to merge them for better predictions optimally. Additionally, stacking is flexible and adapts to various types of data and problems, making it an effective tool in applications where high accuracy and reliability in predictions are required [35,36].
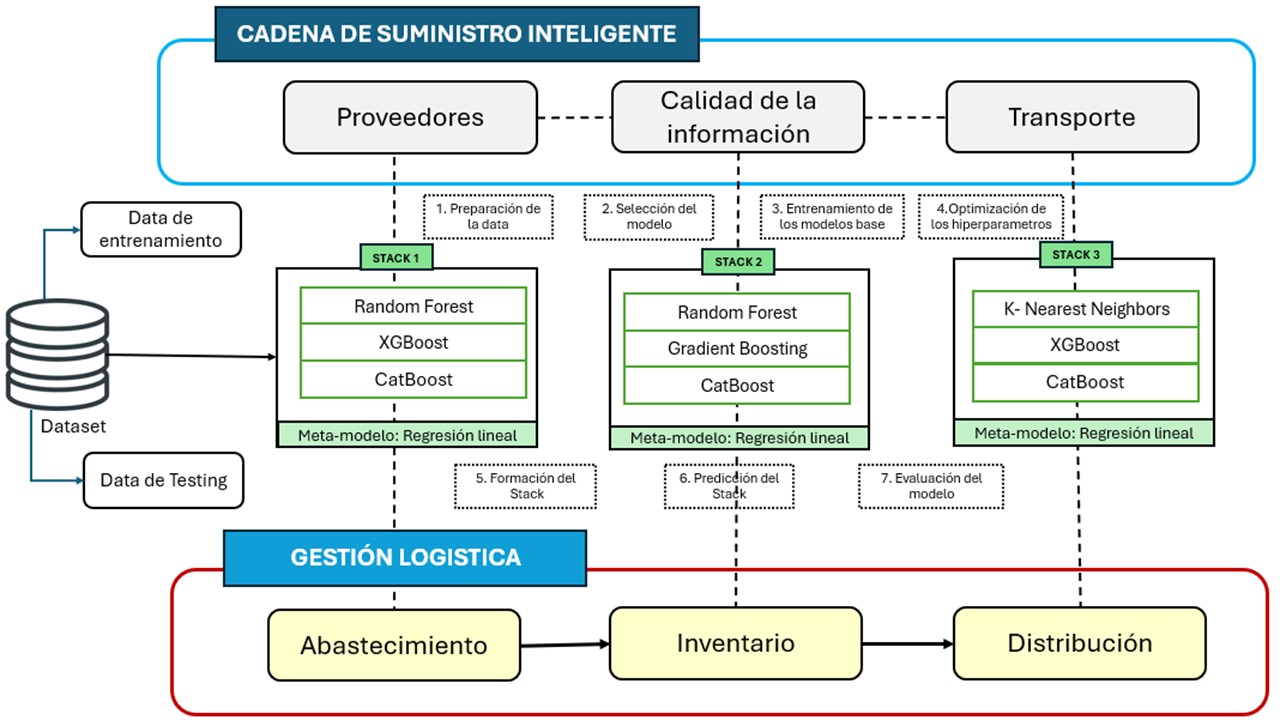
Thus, this approach improves logistical processes such as sourcing, inventory, and distribution. By integrating ensemble stacking, the supply chain’s ability to adapt to market changes, better meet customer needs, and maintain operational efficiency at all times is optimized. Below, Figure 1 presents the diagram of the design of the intelligent supply chain model using ensemble stacking, which illustrates how this technique transforms the traditional supply chain into a more agile and precise one.
Furthermore, this research addresses three fundamental areas within supply chain management: sourcing, inventory, and distribution. These areas are key to achieving effective prediction in logistics management. Specifically, it focuses on forecasting the material demand by location, the profitability of the material demand purchased by location, the monthly income generated from material sales by location, the total amount of material inventoried monthly by category, the average amount of material inventoried monthly by location, and the average amount of material distributed monthly by category.
2.1. Models used
The ensemble stacking model is built from the following base models, each selected for its characteristics and ability to capture specific patterns in the data:
Random Forest: Builds multiple decision trees randomly and makes predictions by taking the consensus of these trees, which improves accuracy and reduces the risk of overfitting [37].
GBoost: A boosting technique that enhances performance through the sequential creation of models, where each model corrects the errors of its predecessor, excelling in prediction tasks [38].
Gradient Boosting: An iterative method where models are trained sequentially, each focusing on correcting the errors of the previous ones, and the final prediction is the weighted sum of all contributions [38].
CatBoost: Based on decision trees, optimized for working with categorical data, providing fast and accurate performance on these datasets [38].
Decision Tree: A model that divides the data into homogeneous subgroups through decisions based on specific features, easy to interpret and visually represent [39].
K-Nearest Neighbors (KNN): A classification or regression method that predicts a value based on the “K” nearest data points to the instance in question, using a distance measure to determine proximity [40].
Regresion Lineal (meta-model): A technique that combines the predictions of several previous models, adjusting the results to improve overall accuracy by using the outputs of other models as the basis [40].
2.2. Phases of Ensemble Stacking
2.2.1. Data Preparation
The necessary data for training the model is collected and processed in this phase. The data is related to the following indicators: material demand forecasting by location, the profitability of material demand acquired by location, monthly income generated from material sales by location, the total amount of material inventoried monthly by category, the average amount of material inventoried monthly by location, and the average amount of material distributed monthly by category. Additionally, this phase includes data cleaning, normalization, converting categorical variables into numerical values, and splitting the data into training and testing sets. Figure 2 below shows the initial dataset of this project.
2.2.2. Model Selection
In this phase, the machine learning algorithms that will be part of the ensemble stacking model are selected to choose a combination of base models that maximize prediction accuracy and improve system performance. Table 1 below shows each indicator with its selected base models and meta-model.
2.2.3. Training of Base Model
Each base model is trained independently using the training dataset. During this process, the hyperparameters of each model are adjusted to optimize their predictive capacity. Subsequently, the performance of each model is evaluated individually on the test set to ensure that each one is providing accurate predictions. In Figure 3, the training of the stacking model is shown for each indicator. For more details, see the following figure.
2.2.4. Hyperparameter Optimization
In this stage, an optimization is carried out to find the best hyperparameters for each base model, maximizing its predictive capacity. This process is applied to all indicators considered in the study, such as demand forecasting, profitability, monthly revenue, inventory, and distribution. At the end of the process, the best hyperparameters for each base model are selected, and the obtained results are printed, improving the ensemble’s accuracy and optimizing the stacking model’s ability to make more precise predictions.
2.2.5. Formation of the Stack
In this phase, the Stacking model is constructed by incorporating both the optimized base models and the meta-model. The Stacking process facilitates the integration of predictions from the base models, enhancing the system’s overall performance. During this phase, the predictions generated by the base models for each of the previously mentioned indicators are merged, resulting in a more robust model that maximizes the individual advantages of each base model. For more details, see Figure 4.
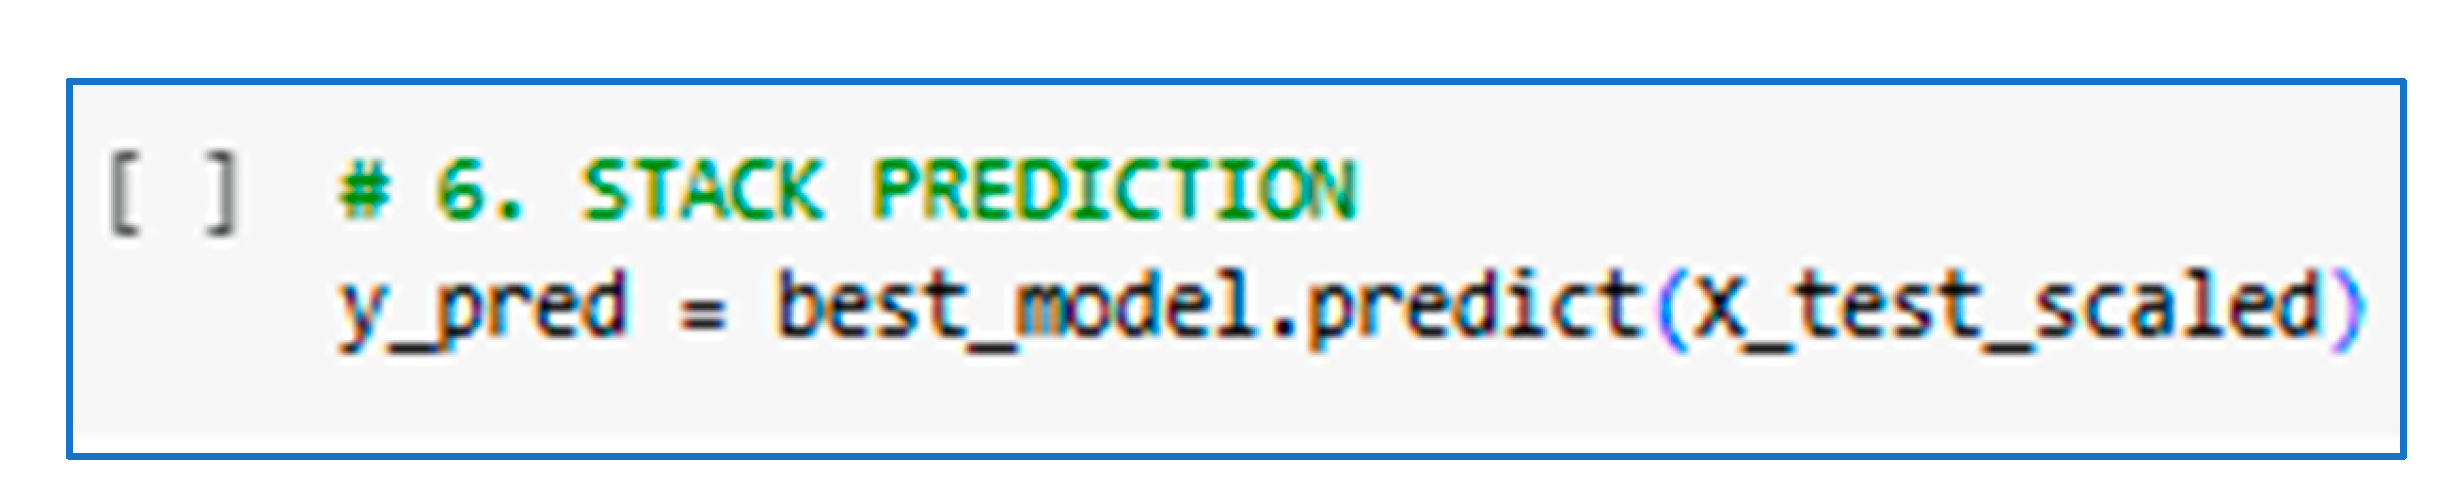
2.2.6. Stack Prediction
The meta-model generates the final prediction by combining the outputs of the base models, improving the accuracy of the individual predictions from each model. In this phase, the final predictions for the six indicators are obtained: material demand, demand profitability, sales revenue, total inventory by category, average inventory by location, and material distributed by category. This process reflects the joint performance of the entire Stacking model, providing a more robust and accurate prediction for logistics management. The following code was used for each indicator.
Figure 5.
Stack Prediction.
2.2.7. Model Performance Metrics
Finally, the performance of the model is evaluated using metrics such as MSE (Mean Squared Error), R² (coefficient of determination), MAE (Mean Absolute Error), and RMSE (Root Mean Squared Error), which allow for assessing both the precision and the model’s fit to the data. These metrics were chosen because they provide a comprehensive evaluation of performance in terms of absolute error and explanatory power of the model [41]. Therefore, this evaluation allows for verifying the model’s effectiveness and making necessary adjustments. Below, the formulas for each metric to be used are presented.
3. Results
This section presents the results obtained after implementing the ensemble stacking model for logistics management prediction. Various base algorithms were used, including Random Forest, XGBoost, Gradient Boosting, CatBoost, Decision Tree, and KNN. Subsequently, the performance of these models was combined through a meta-model based on linear regression, aiming to improve the overall model accuracy and reduce errors derived from individual models.
3.1. Model Performance
The model’s performance was evaluated using several accuracy metrics, including MSE, R², MAE, and RMSE, which allow for evaluating both the precision and the model’s fit to the data. These metrics were chosen because they provide a comprehensive evaluation of performance in terms of absolute error and the model’s explanatory power. Table 2 presents the results obtained from the prediction of material demand by location below. The prediction is also visualized in Figure 6.
In Table 3, the results obtained from the profitability of material demand purchased by location are presented, and the prediction is also visualized in Figure 7.
In Table 4, the results obtained from monthly revenue generated by material sales by location are presented, and the prediction is also visualized in Figure 8.
In Table 5, the results obtained from the total amount of material inventoried monthly by category are presented, and the prediction is also visualized in Figure 9.
In Table 6, the results obtained from the average monthly inventory by location are presented, and the prediction is also visualized in Figure 10.
In Table 7, the results obtained from the average monthly material distributed by category are presented, and the prediction is also visualized in Figure 11.
As observed, the meta-model of the ensemble stacking shows significant improvement compared to the base models. The reduction in RMSE indicates higher precision in the predictions, while the increase in accuracy and F1-score metrics reflects more balanced performance, with fewer false positives and negatives. In Figure 12, the results by indicator are shown.
4. Discussion
The results show that implementing an ensemble stacking model for logistics management prediction in intelligent supply chains significantly improves the accuracy of predictions. This result is consistent with previous studies such as research [23], which developed a machine learning model to forecast personnel needs in logistics, surpassing both manual and automatic methods. Likewise, research [24] optimizes inventory management using deep reinforcement learning, enhancing traditional methods. Additionally, research [25] combines analytical techniques with a Bayesian model to improve demand forecasting in the retail industry. Research [26] utilizes deep learning forecasts to optimize inventories. For more details on the results obtained, see Table 8.
5. Conclusions
This study demonstrates that using an ensemble stacking model for logistics management prediction in intelligent supply chains substantially improves prediction accuracy compared to individual models. By combining several base algorithms, the ensemble model can capture complex patterns in the data and offer greater generalization capability across different logistics scenarios.
While the improved performance is a positive finding, it is important to consider the challenges associated with training time and the need for computational resources, which could be a limiting factor in certain environments. However, the results are highly promising and suggest that ensemble stacking-based approaches could be valuable for enhancing logistics management, particularly when accurate predictions are critical for strategic decision-making.
Future work is recommended to explore optimizing base models and applying advanced hyperparameter tuning techniques to reduce training time. It is also recommended that this model be implemented in real-time prediction scenarios, allowing for greater operational efficiency in the supply chain.
References
- Y. Guo, F. Liu, J.-S. Song, and S. Wang, “Supply chain resilience: A review from the inventory management perspective,” Fundamental Research, Aug. 2024. [CrossRef]
- Y. Tadayonrad and A. B. Ndiaye, “A new key performance indicator model for demand forecasting in inventory management considering supply chain reliability and seasonality,” Supply Chain Analytics, vol. 3, p. 100026, Sep. 2023. [CrossRef]
- C.-Y. Chiang, Z. Qian, C.-H. Chuang, X. Tang, and C.-C. Chou, “Examining demand and supply-chain antecedents of inventory dynamics: Evidence from automotive industry,” Int J Prod Econ, vol. 259, p. 20 May 1088; 38. [CrossRef]
- Y. Zhao, H. Zhou, K. Kang, and B. Liu, “Robust ordering, production, and replenishment in a supply chain for innovative products: A two-echelon newsvendor problem with partial information in yield and demand,” Int J Prod Econ, vol. 279, p. 109414, Jan. 2025. [CrossRef]
- K. Sadeghi R. and M. Qaisari Hasan Abadi, “Sustainable supply chain resilience for logistics problems: Empirical validation using robust and computational intelligence methods,” J Clean Prod, vol. 437, p. 140267, Jan. 2024. [CrossRef]
- M.-F. Hsu, “Decision-making framework for sustainability-related supply chain risk management,” Comput Ind Eng, vol. 200, p. 110825, Feb. 2025. [CrossRef]
- X. Sun, Y.-H. Kuo, W. Xue, and Y. Li, “Technology-driven logistics and supply chain management for societal impacts,” Transp Res E Logist Transp Rev, vol. 185, p. 20 May 1035; 23. [CrossRef]
- E. Karelina, D. Ptitsyn, A. Podgornyy, S. Evtykov, and A. Marusin, “Formal strategy for solving problems of management and organization of processes in the transport and logistics systems of the Arctic region,” Transportation Research Procedia, vol. 57, pp. 2021. [CrossRef]
- N. Na, “Research on Supply Chain Demand Prediction Model Based on LSTM,” Procedia Comput Sci, vol. 243, pp. 2024. [CrossRef]
- Z. Liu, Y. Wang, and J. Feng, “Identifying supply chain R&D partners via multilayer institutional cooperation network and tailored link prediction,” Comput Ind Eng, vol. 201, p. 110887, Mar. 2025. [CrossRef]
- O. Bhowmik, S. O. Bhowmik, S. Chowdhury, J. H. Ashik, G. I. Mahmud, M. M. Khan, and N. U. I. Hossain, “Application of artificial intelligence in reverse logistics: A bibliometric and network analysis,” Supply Chain Analytics, vol. 7, p. 100076, Sep. 2024. [Google Scholar] [CrossRef]
- N. Bouanba, O. Barakat, and A. Bendou, “Artificial Intelligence & Agile Innovation: Case of Moroccan Logistics Companies,” Procedia Comput Sci, vol. 203, pp. 444–449, 2022. [CrossRef]
- G. Mugurusi and P. N. Oluka, “Towards Explainable Artificial Intelligence (XAI) in Supply Chain Management: A Typology and Research Agenda,” in Advances in Production Management Systems. Artificial Intelligence for Sustainable and Resilient Production Systems, 2021, pp. 32–38. [CrossRef]
- F. Olan, S. Liu, J. Suklan, U. Jayawickrama, and E. O. Arakpogun, “The role of Artificial Intelligence networks in sustainable supply chain finance for food and drink industry,” Int J Prod Res, vol. 60, no. 14, pp. 4418–4433, Jul. 2022. [CrossRef]
- Q. Liu, Y. Ma, L. Chen, W. Pedrycz, M. J. Skibniewski, and Z.-S. Chen, “Artificial intelligence for production, operations and logistics management in modular construction industry: A systematic literature review,” Information Fusion, vol. 109, p. 102423, Sep. 2024. [CrossRef]
- Alshdadi, A. A. Almazroi, and N. Ayub, “IoT-driven load forecasting with machine learning for logistics planning,” Internet of Things, vol. 29, p. 101441, Jan. 2025. [Google Scholar] [CrossRef]
- Benmamoun, and H. Hachimi, “Forecasting supply chain disruptions in the textile industry using machine learning: A case study,” Ain Shams Engineering Journal, vol. 15, no. 12, p. 103116, Dec. 2024. [CrossRef]
- M. Khedr and S. R. S, “Enhancing supply chain management with deep learning and machine learning techniques: A review,” Journal of Open Innovation: Technology, Market, and Complexity, vol. 10, no. 4, p. 100379, Dec. 2024. [CrossRef]
- P. Eichenseer, L. Hans, and H. Winkler, “A data-driven machine learning model for forecasting delivery positions in logistics for workforce planning,” Supply Chain Analytics, vol. 9, p. 100099, Mar. 2025. [CrossRef]
- Wu, C. Lin, D. Barnes, and Y. Zhang, “Partner selection in sustainable supply chains: A fuzzy ensemble learning model,” J Clean Prod, vol. 275, p. 123165, Dec. 2020. [Google Scholar] [CrossRef]
- H. Eldin Elzain, O. Abdalla, A. Al-Maktoumi, A. Kacimov, and M. Eltayeb, “A novel approach to forecast water table rise in arid regions using stacked ensemble machine learning and deep artificial intelligence models,” J Hydrol (Amst), vol. 640, p. 131668, Aug. 2024. [CrossRef]
- C.-F. Chien, C.-C. Ku, and Y.-Y. Lu, “Ensemble learning for demand forecast of After-Market spare parts to empower data-driven value chain and an empirical study,” Comput Ind Eng, vol. 185, p. 109670, Nov. 2023. [CrossRef]
- P. Eichenseer, L. Hans, and H. Winkler, “A data-driven machine learning model for forecasting delivery positions in logistics for workforce planning,” Supply Chain Analytics, vol. 9, p. 100099, Mar. 2025. [CrossRef]
- T. Demizu, Y. Fukazawa, and H. Morita, “Inventory management of new products in retailers using model-based deep reinforcement learning,” Expert Syst Appl, vol. 229, p. 120256, Nov. 2023. [CrossRef]
- M. Seyedan, F. Mafakheri, and C. Wang, “Cluster-based demand forecasting using Bayesian model averaging: An ensemble learning approach,” Decision Analytics Journal, vol. 3, p. 100033, Jun. 2022. [CrossRef]
- M. Seyedan, F. Mafakheri, and C. Wang, “Order-up-to-level inventory optimization model using time-series demand forecasting with ensemble deep learning,” Supply Chain Analytics, vol. 3, p. 100024, Sep. 2023. [CrossRef]
- Vafeiadis, A. Nizamis, D. Ioannidis, and D. Tzovaras, “Utilizing machine learning on freight transportation and logistics applications: A review,” ICT Express, vol. 9, no. 3, pp. 284–295, Jun. 2023. [CrossRef]
- H. Lee, S. G. Kim, H. Park, and P. Kang, “Pre-launch new product demand forecasting using the Bass model: A statistical and machine learning-based approach,” Technol Forecast Soc Change, vol. 86, pp. 49–64, Jul. 2014. [CrossRef]
- V. Siriwardena, D. Kosgoda, H. N. Perera, and I. Nielsen, “Inventory Decisions Under Stochastic Demand Scenario with High Inflation Rate – Machine Learning Approach,” IFAC-PapersOnLine, vol. 58, no. 19, pp. 2024. [CrossRef]
- E. Saha and P. Rathore, “A smart inventory management system with medication demand dependencies in a hospital supply chain: A multi-agent reinforcement learning approach,” Comput Ind Eng, vol. 191, p. 20 May 1101; 65. [CrossRef]
- W. Villegas-Ch, A. M. Navarro, and S. Sanchez-Viteri, “Optimization of inventory management through computer vision and machine learning technologies,” Intelligent Systems with Applications, vol. 24, p. 200438, Dec. 2024. [CrossRef]
- Kora, “A comprehensive review on ensemble deep learning: Opportunities and challenges,” Journal of King Saud University - Computer and Information Sciences, vol. 35, no. 2, pp. 757–774, Feb. 2023. [CrossRef]
- O. Sagi and L. Rokach, “Ensemble learning: A survey,” WIREs Data Mining and Knowledge Discovery, vol. 8, no. 4, Jul. 2018. [CrossRef]
- D. Mienye and Y. Sun, “A Survey of Ensemble Learning: Concepts, Algorithms, Applications, and Prospects,” IEEE Access, vol. 10, pp. 99129–99149, 2022. [CrossRef]
- Maclin, “Popular Ensemble Methods: An Empirical Study,” Journal of Artificial Intelligence Research, vol. 11, pp. 169–198, Aug. 1999. [CrossRef]
- S. O. Adebusola, P. A. Owolawi, J. S. Ojo, and P. S. Maswikaneng, “Optimized quality of service prediction in FSO links over South Africa using ensemble learning,” Opt Commun, vol. 579, p. 131509, Apr. 2025. [CrossRef]
- Breiman, “Random forests. Machine Learning,” Mach Learn, vol. 45, no. 1, pp. 2001; 32. [CrossRef]
- T. Chen and C. Guestrin, “XGBoost: A Scalable Tree Boosting System,” in Proceedings of the 22nd ACM SIGKDD International Conference on Knowledge Discovery and Data Mining, New York, NY, USA: ACM, Aug. 2016, pp. 785–794. [CrossRef]
- R. Quinlan, “Induction of decision trees,” Mach Learn, vol. 1, no. 1, pp. 81–106, Mar. 1986. [CrossRef]
- G. Rebala, A. Ravi, and S. Churiwala, “Machine Learning Definition and Basics,” in An Introduction to Machine Learning, Cham: Springer International Publishing, 2019, pp. 1–17. [CrossRef]
- Y. Deng, M. R. Eden, and S. Cremaschi, “Metrics for Evaluating Machine Learning Models Prediction Accuracy and Uncertainty,” 2023, pp. 1325–1330. [CrossRef]
Figure 1.
Diagram of the design of the intelligent supply chain model using the ensemble stacking technique.
Figure 1.
Diagram of the design of the intelligent supply chain model using the ensemble stacking technique.
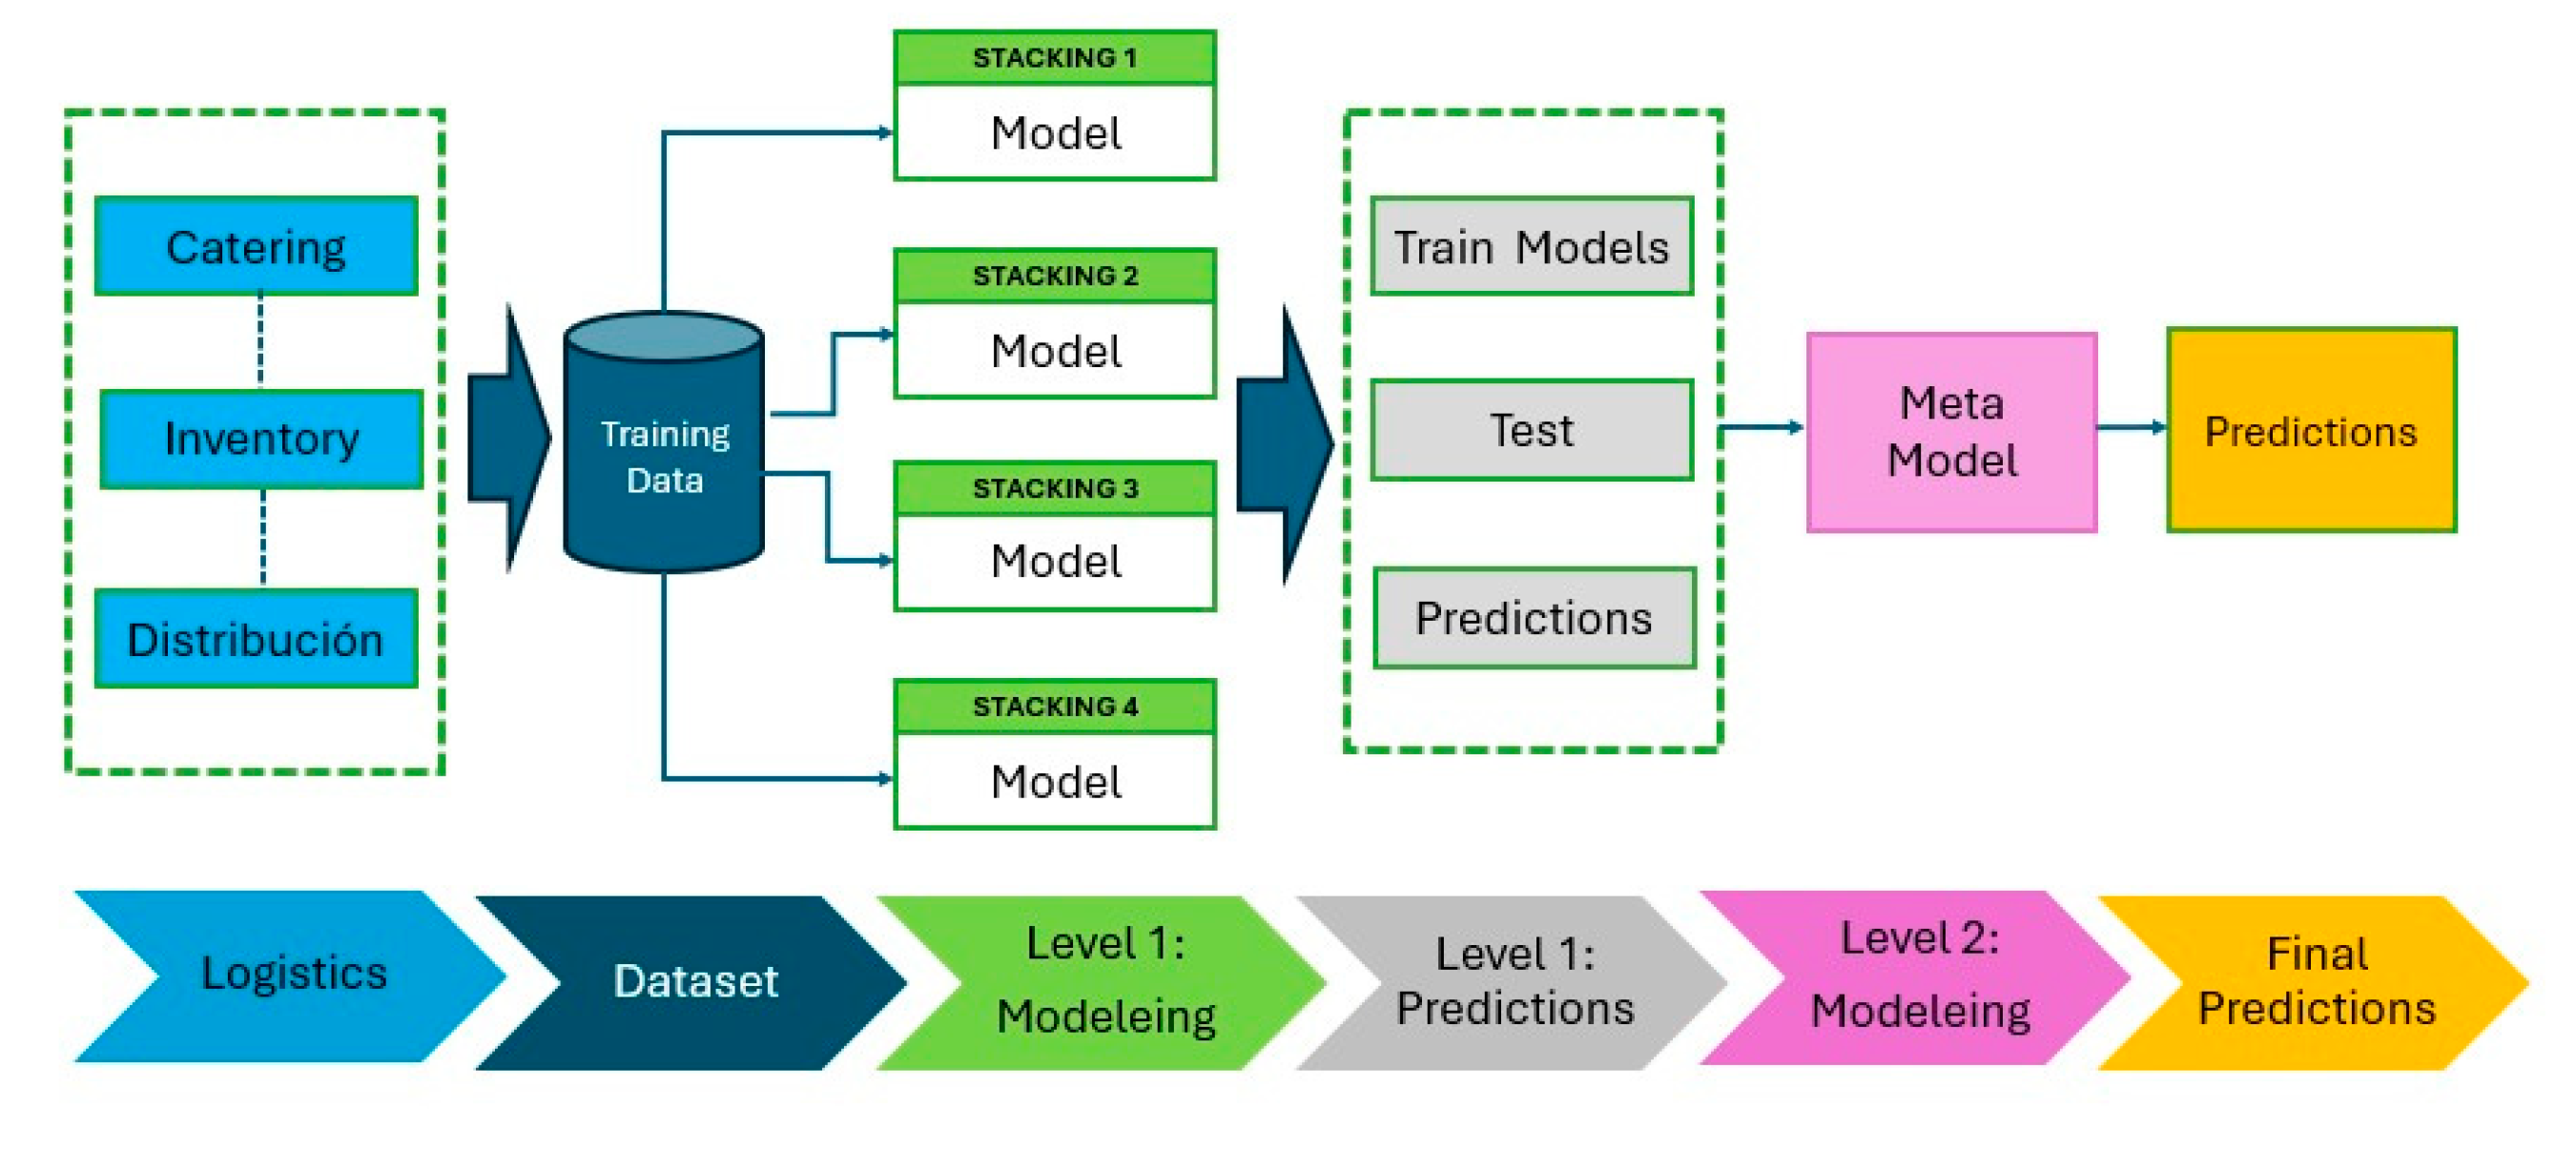
Figure 2.
Project dataset.
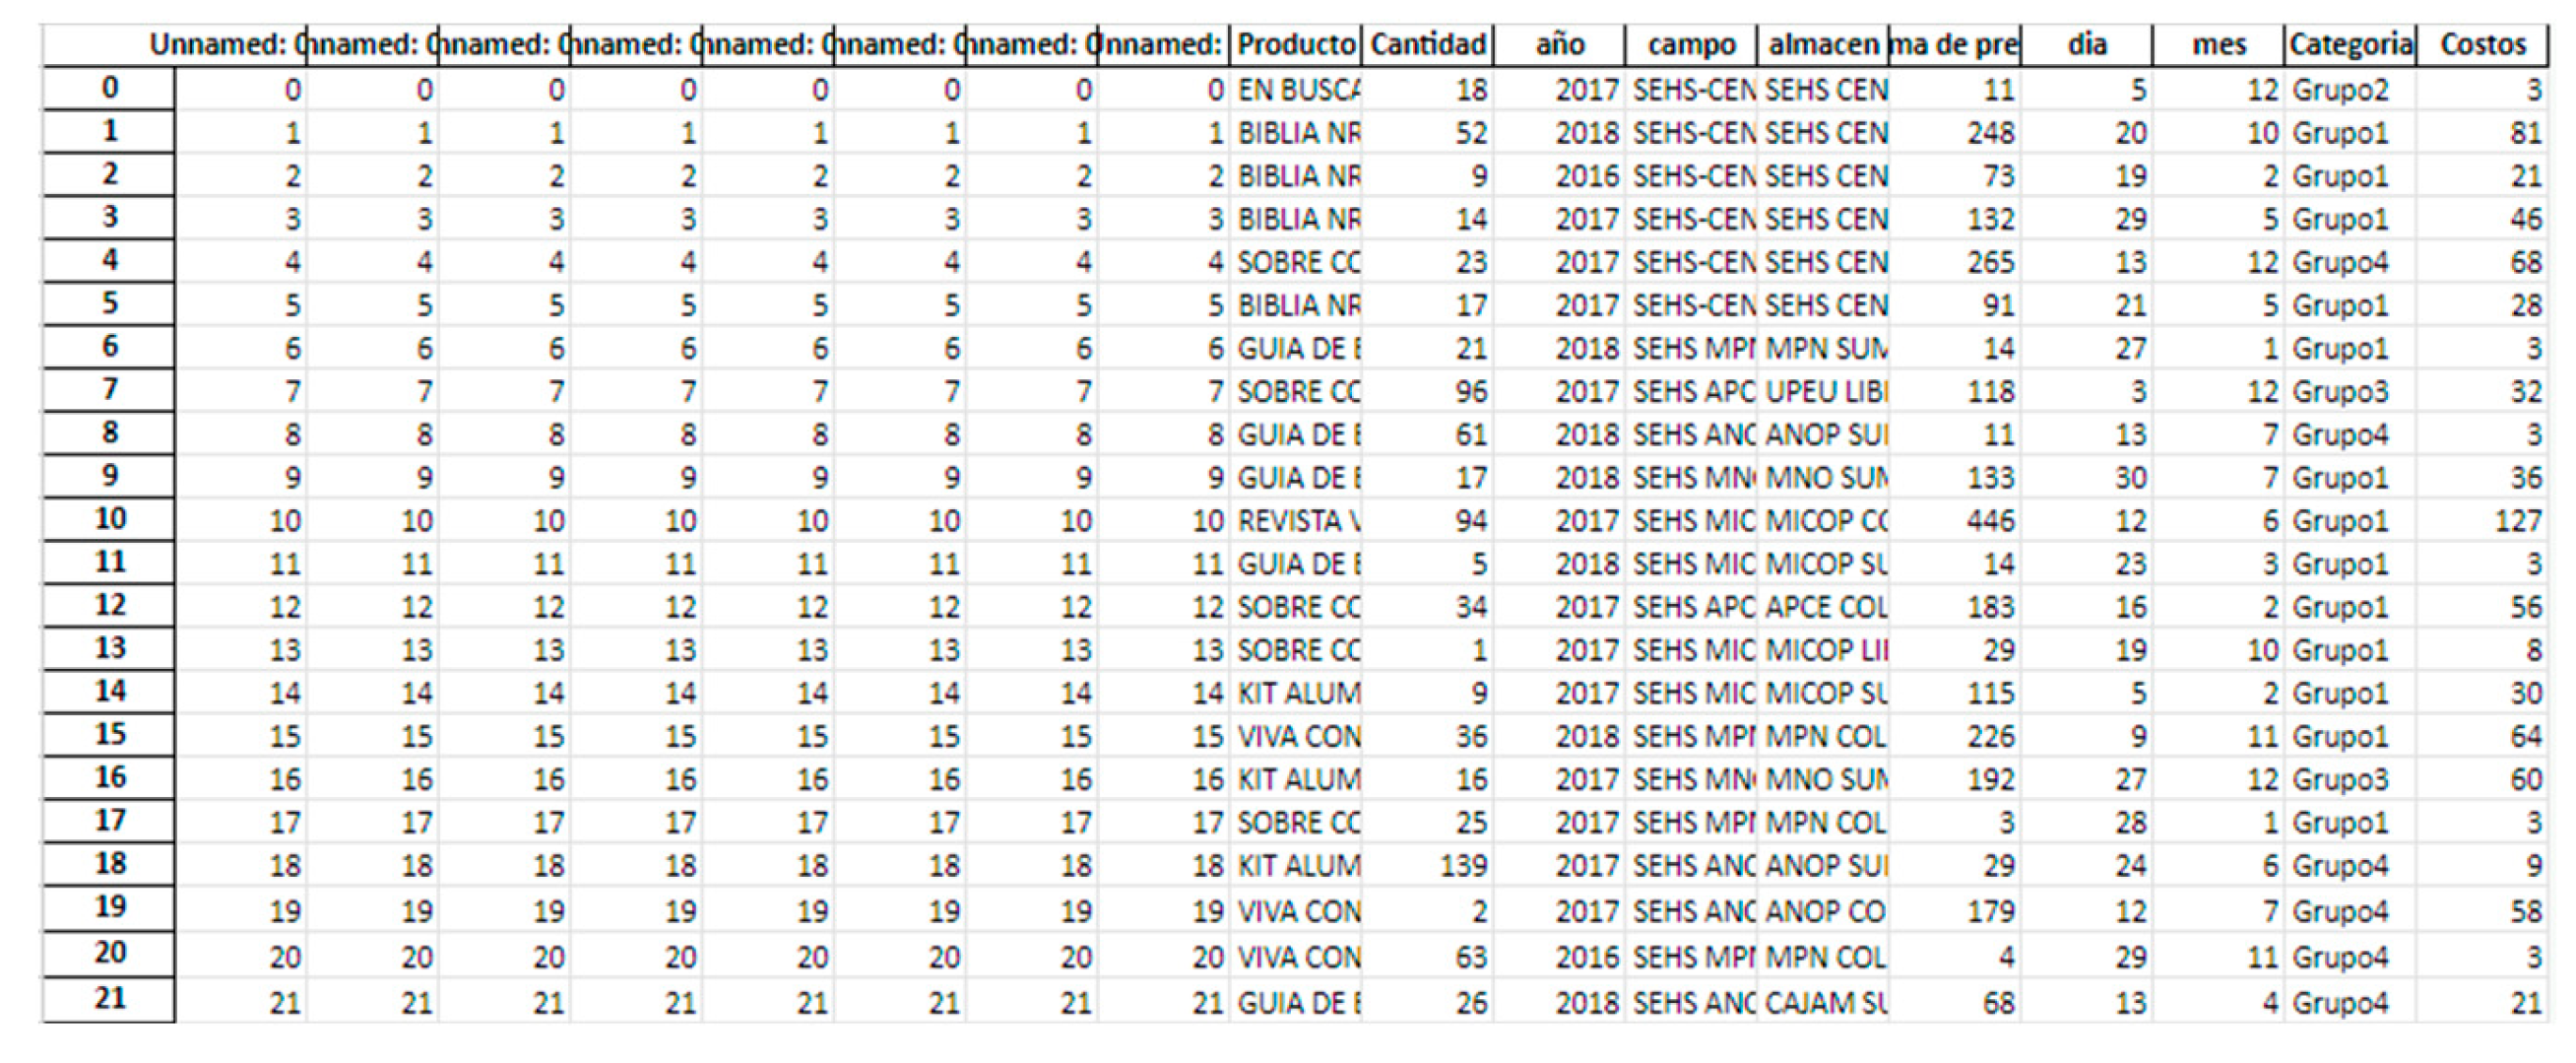
Figure 3.
Model training. a) Indicator 1, b) Indicator 2, c) Indicator 3, d) Indicator 4, e) Indicator 5, f) Indicator 6.
Figure 3.
Model training. a) Indicator 1, b) Indicator 2, c) Indicator 3, d) Indicator 4, e) Indicator 5, f) Indicator 6.
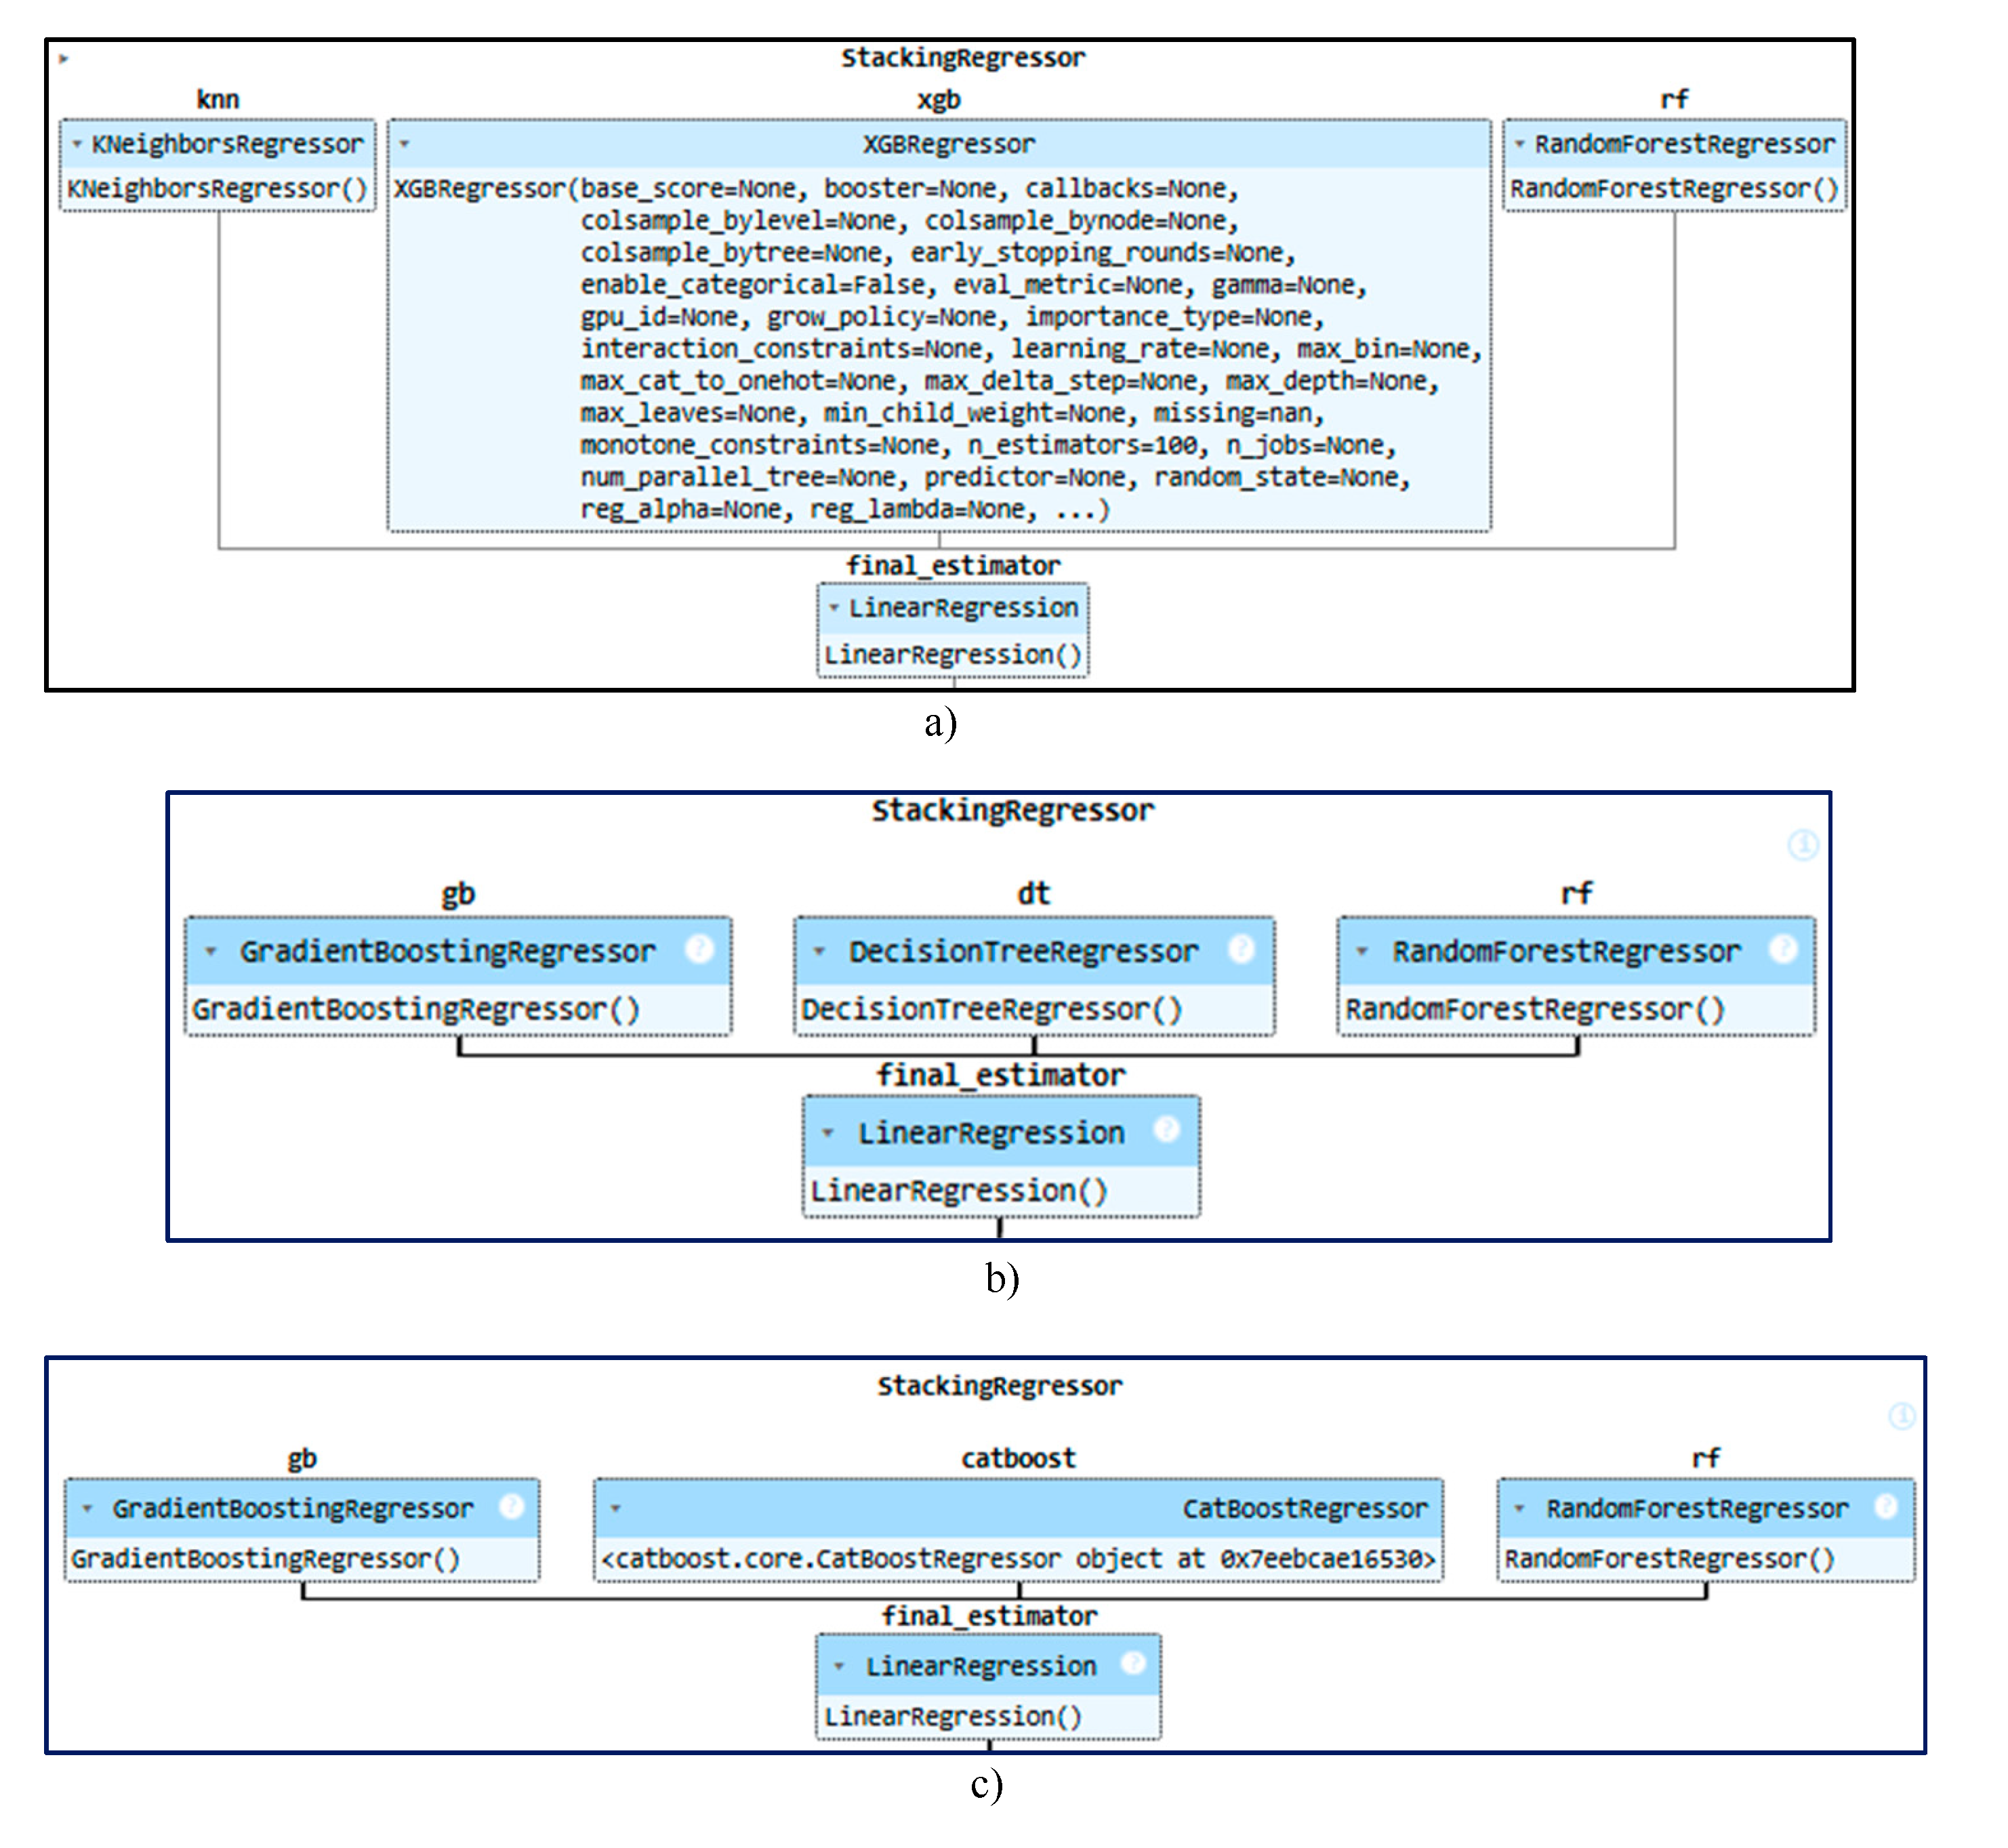
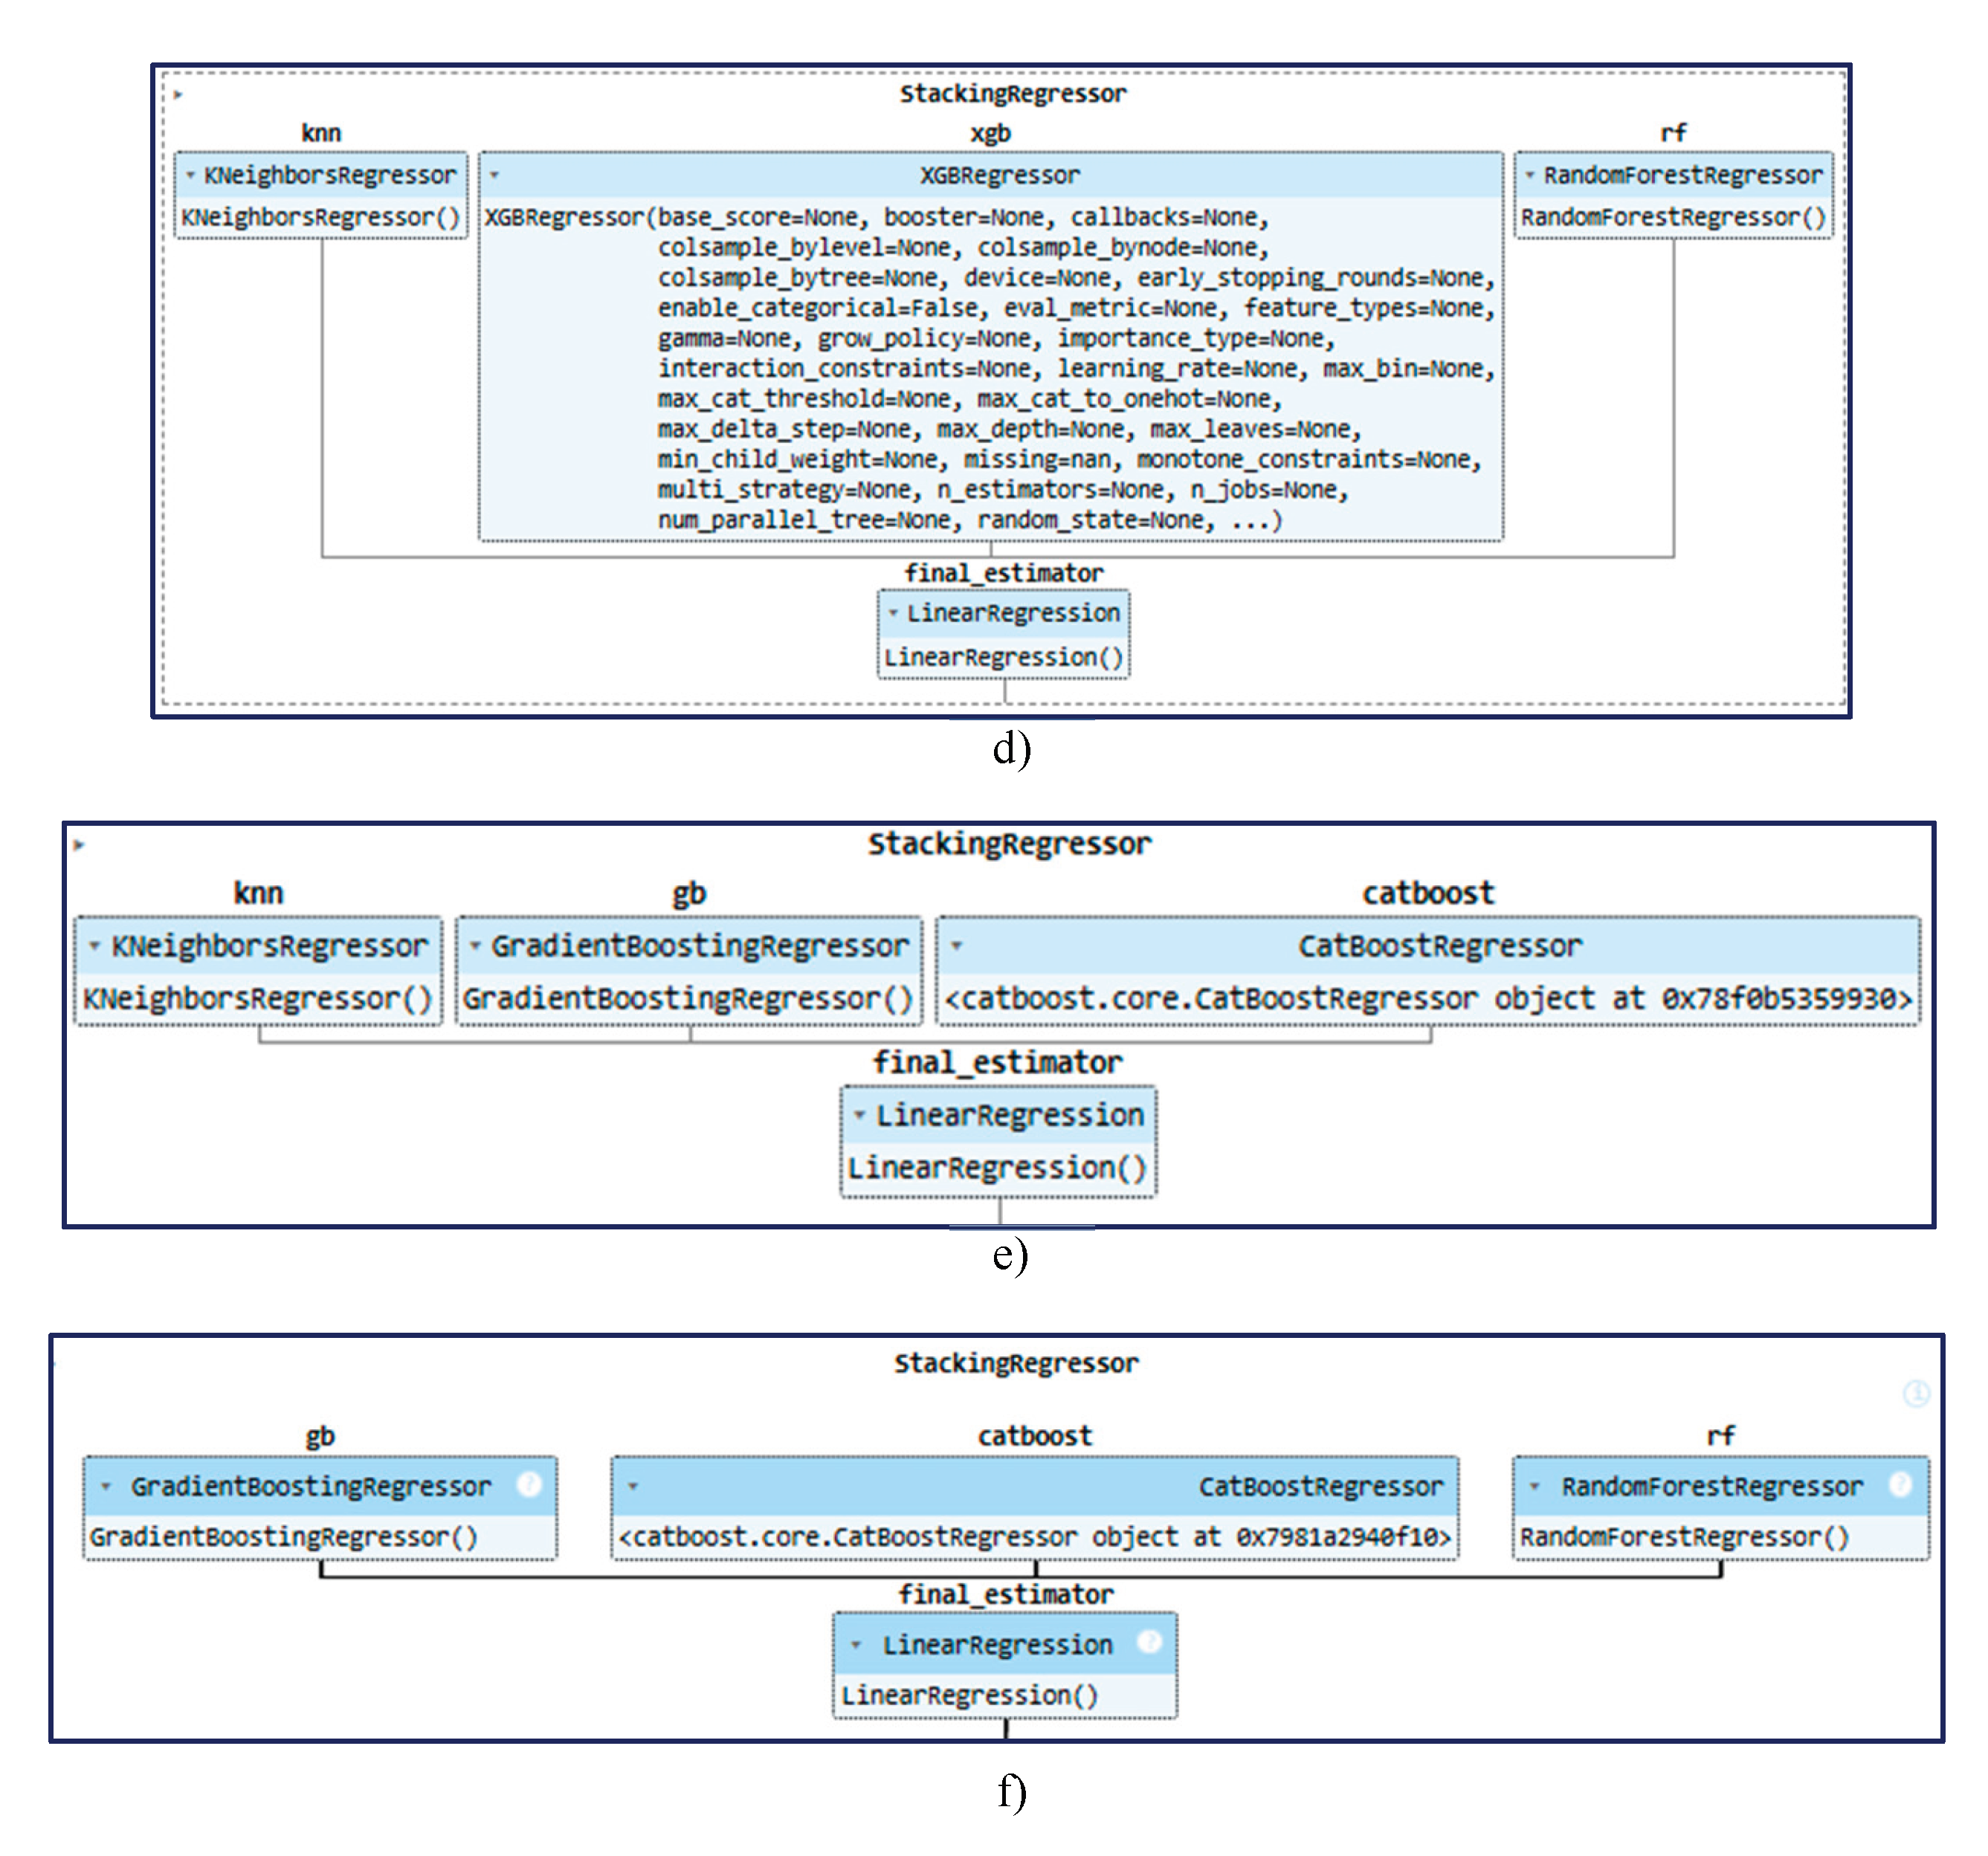
Figure 4.
Formation of the stack. a) Indicator 1, b) Indicator 2, c) Indicator 3, d) Indicator 4, e) Indicator 5, f) Indicator 6.
Figure 4.
Formation of the stack. a) Indicator 1, b) Indicator 2, c) Indicator 3, d) Indicator 4, e) Indicator 5, f) Indicator 6.
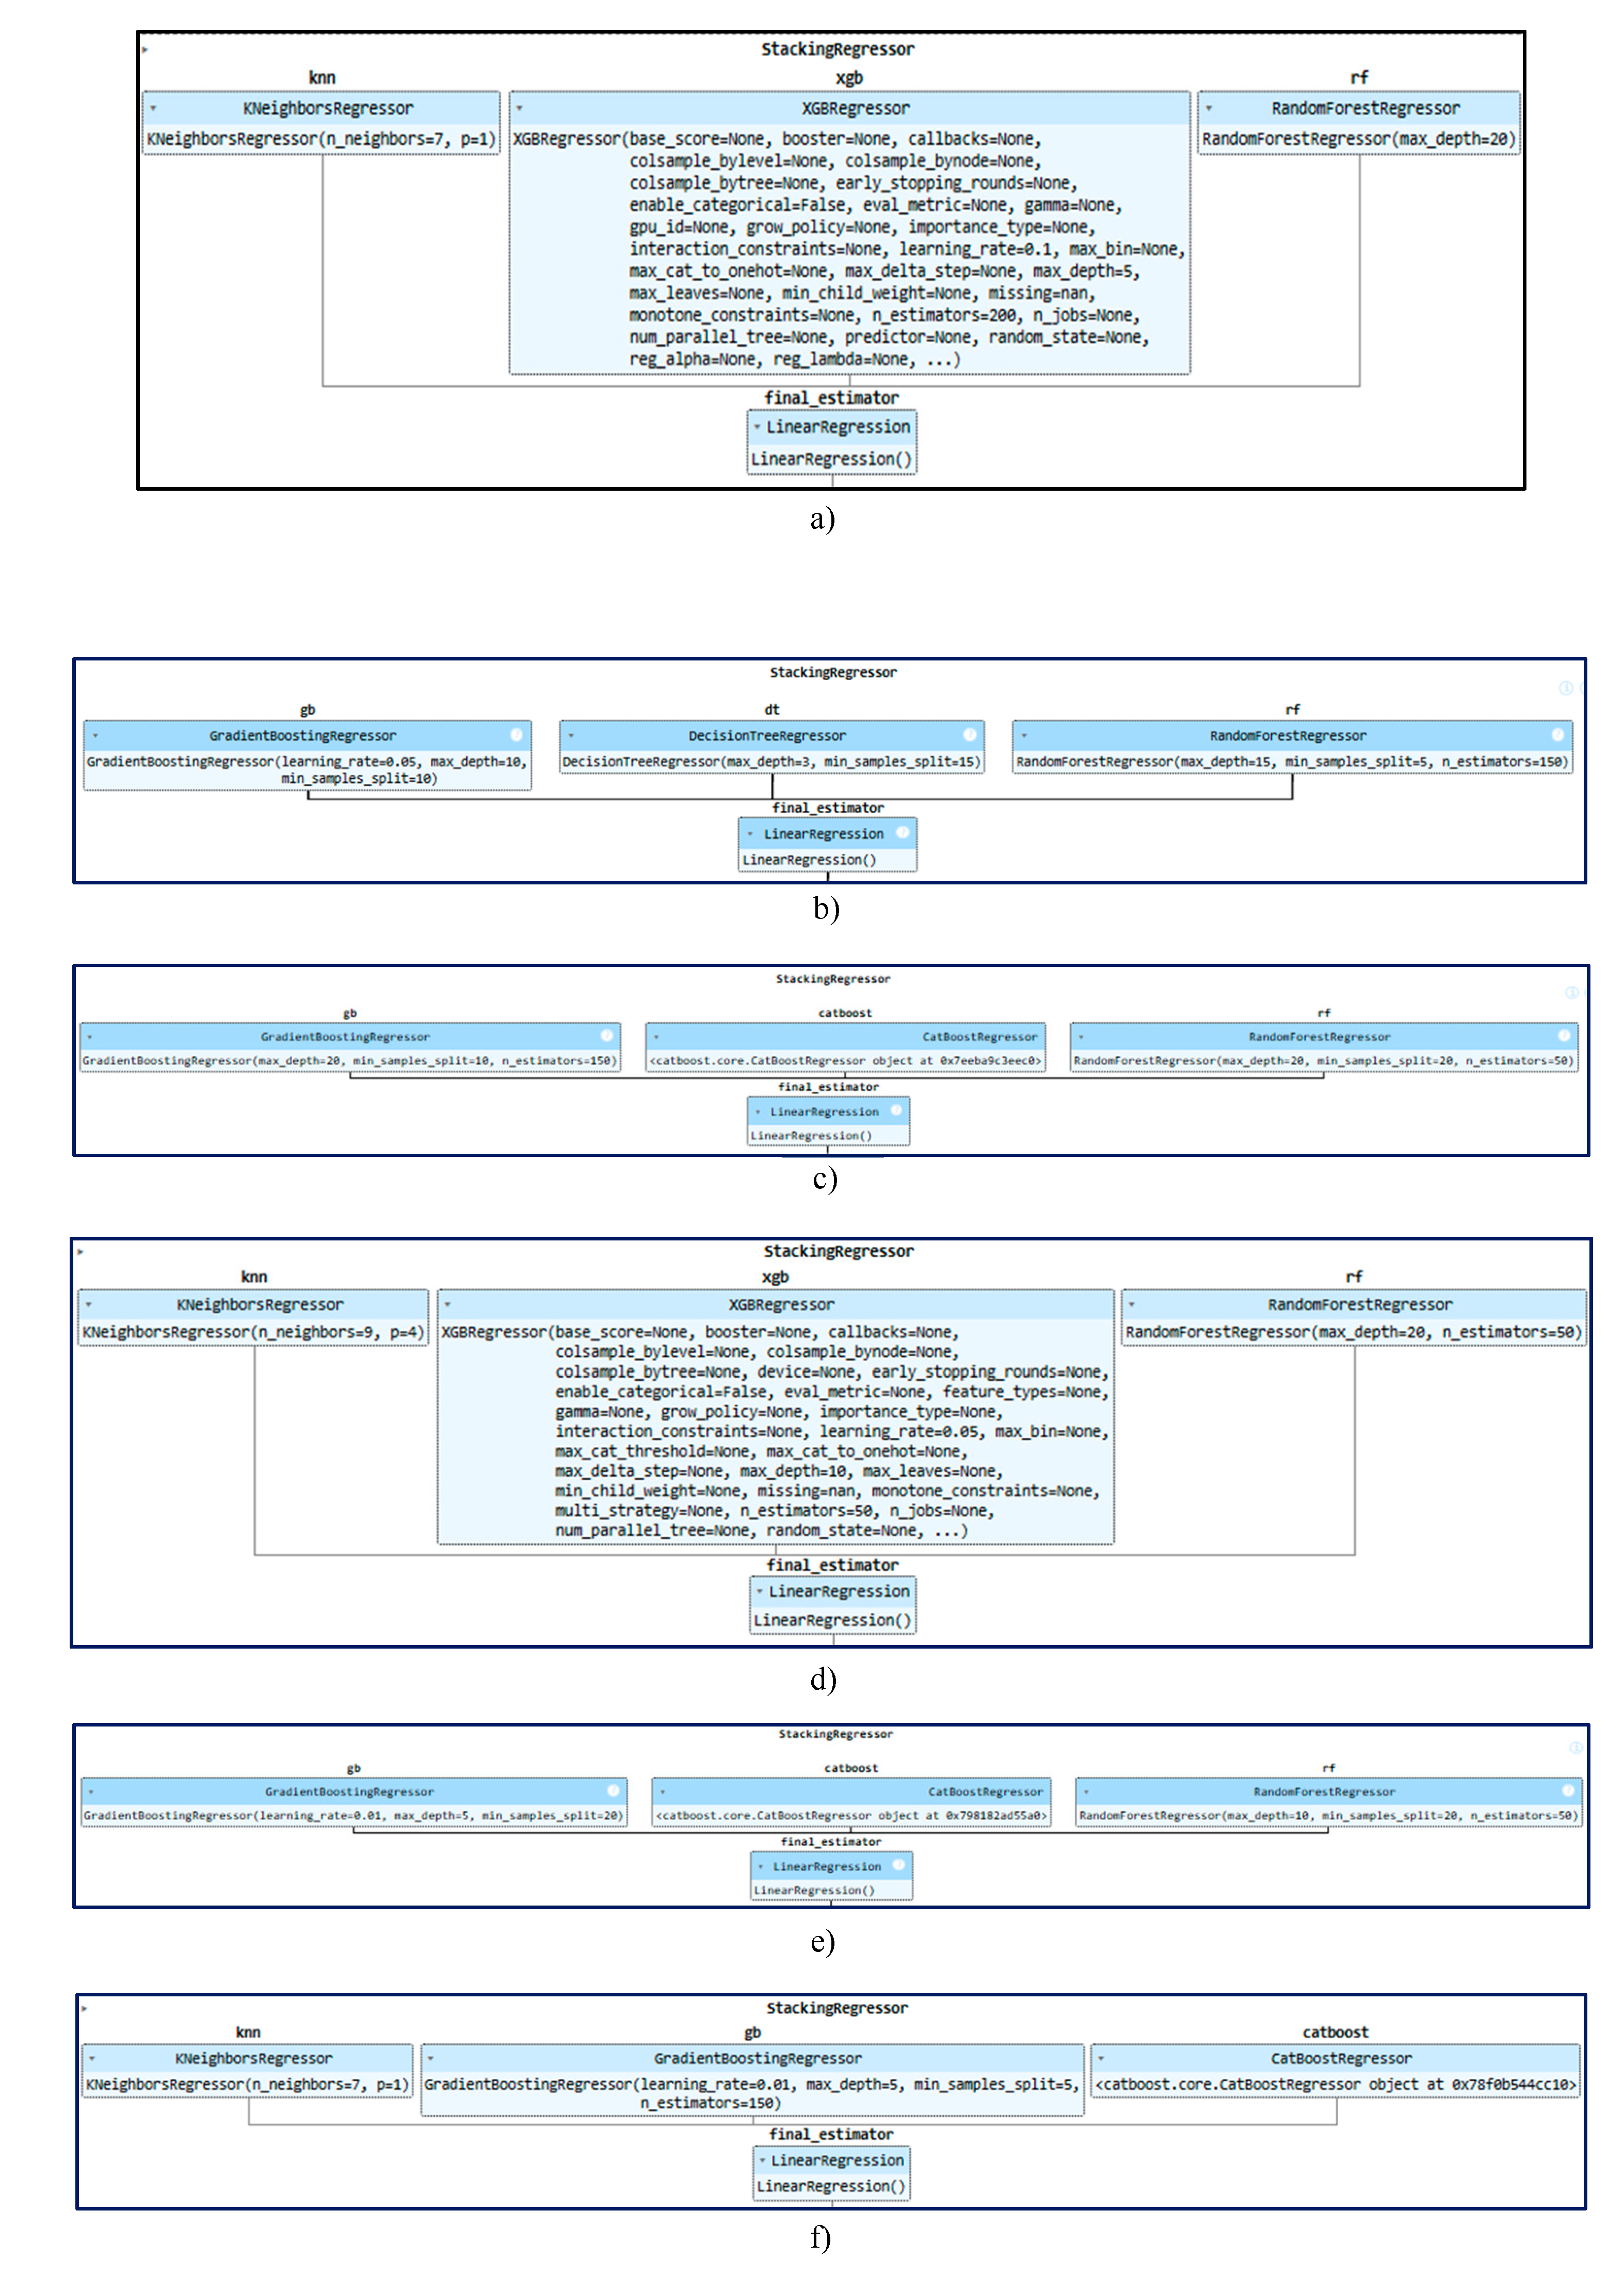
Figure 7.
Prediction of Indicator 2.
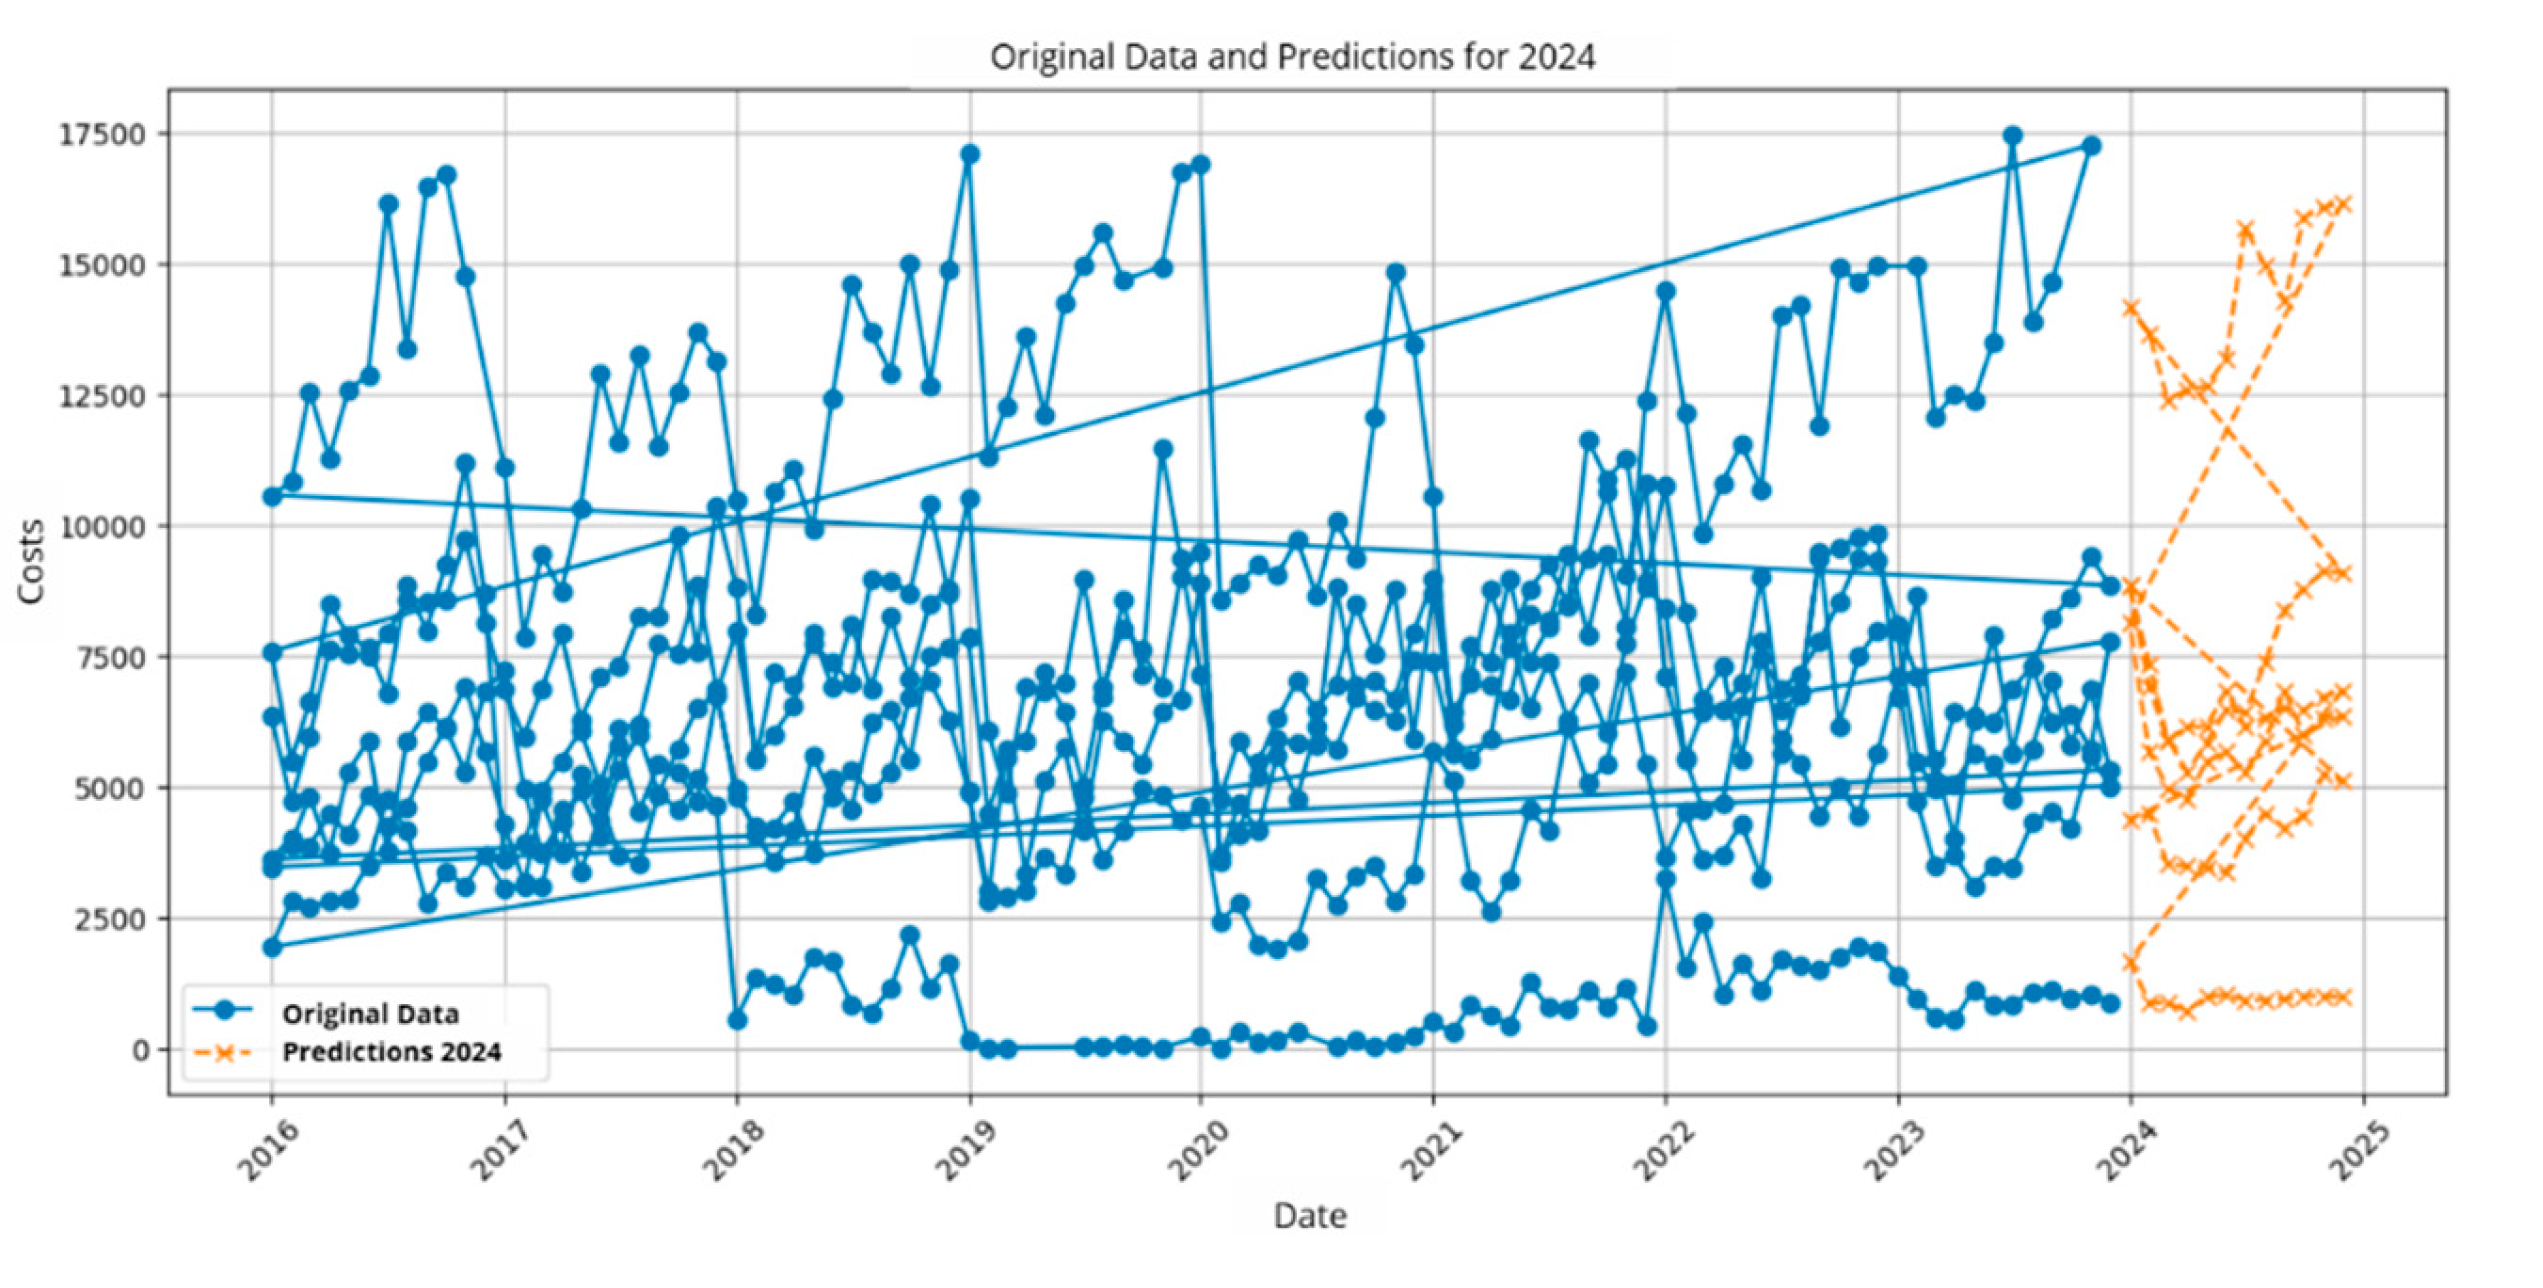
Figure 8.
Prediction of Indicator 3.
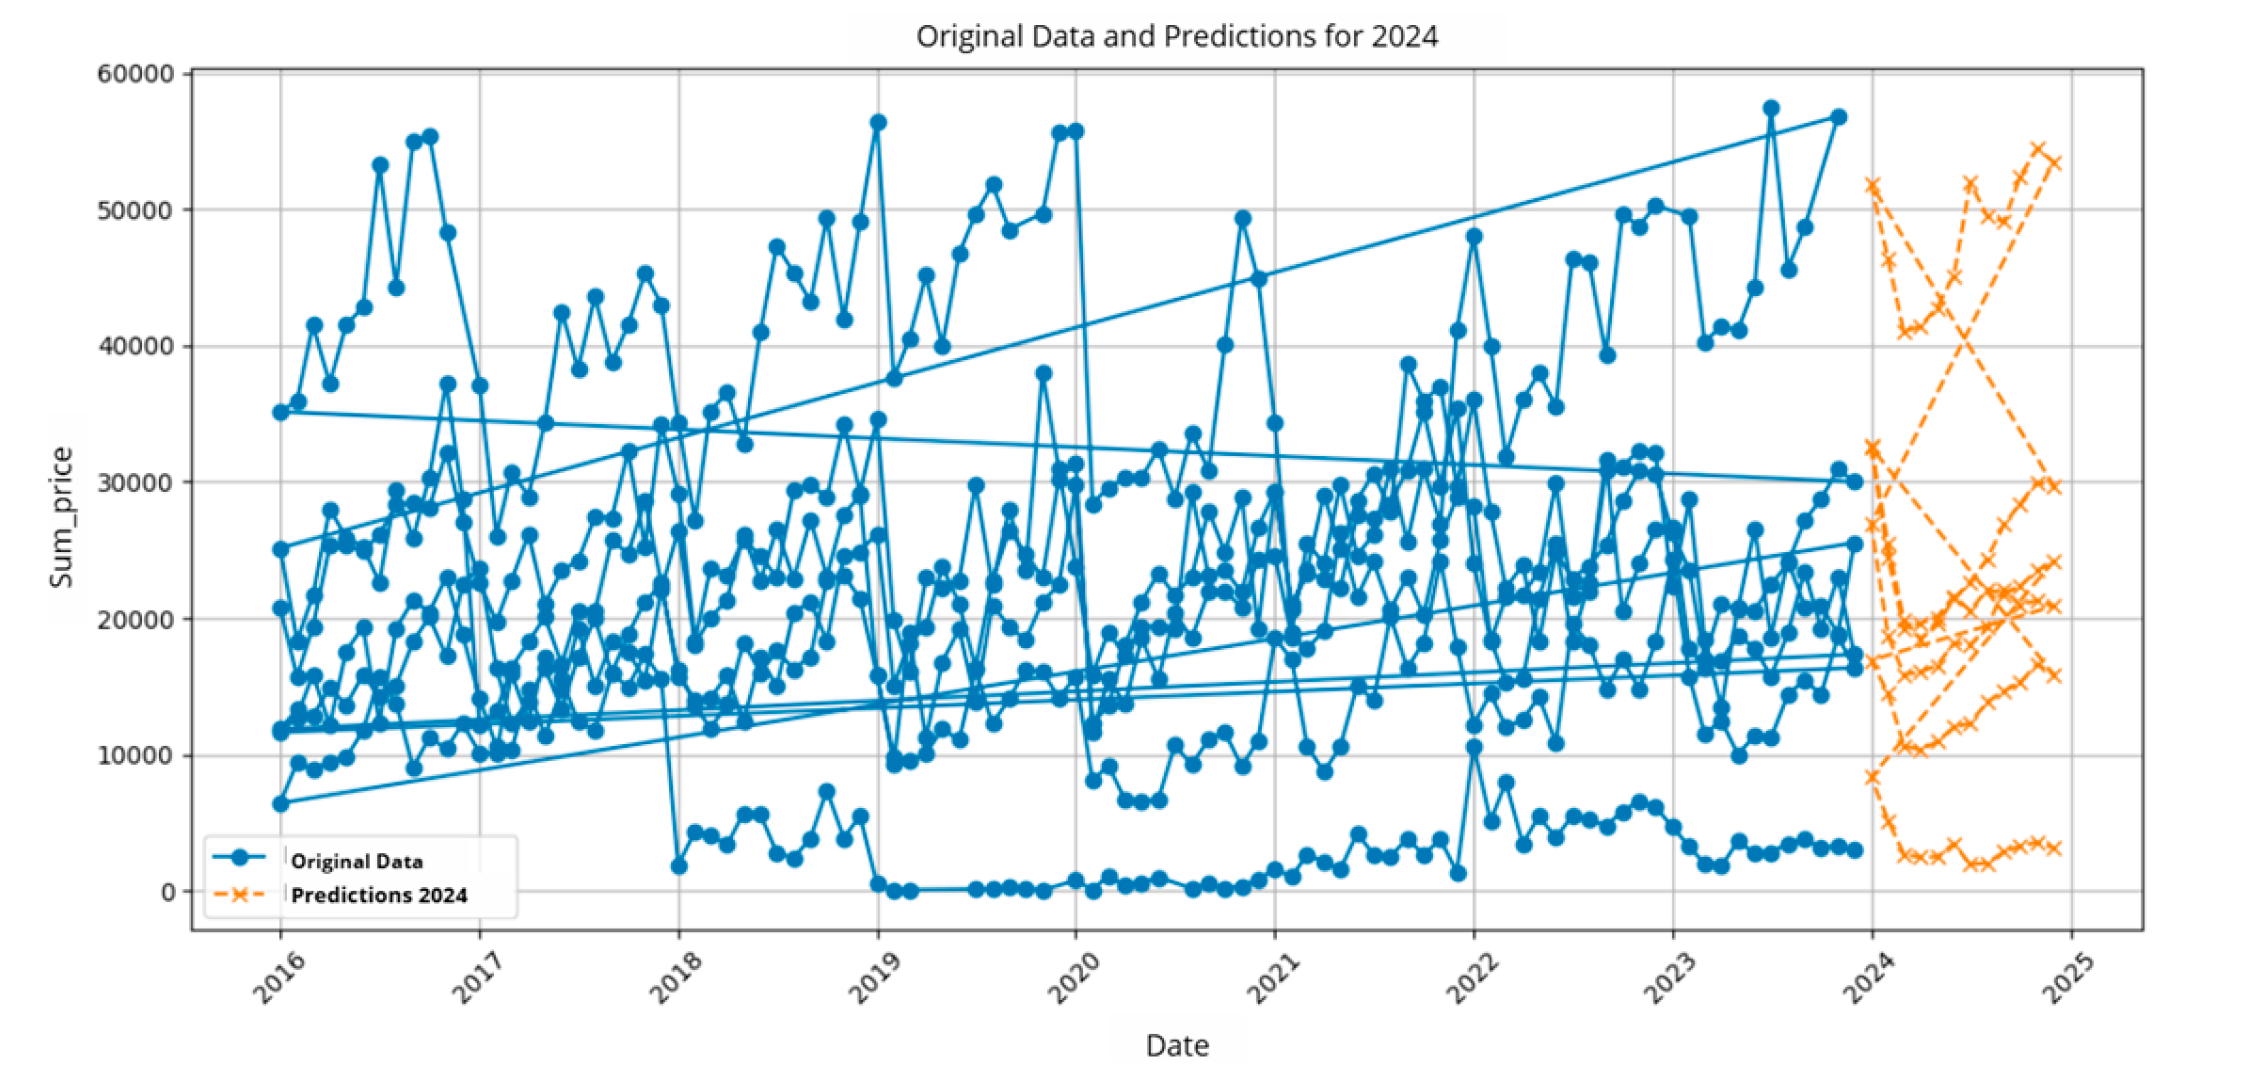
Figure 9.
Prediction of Indicator 4.
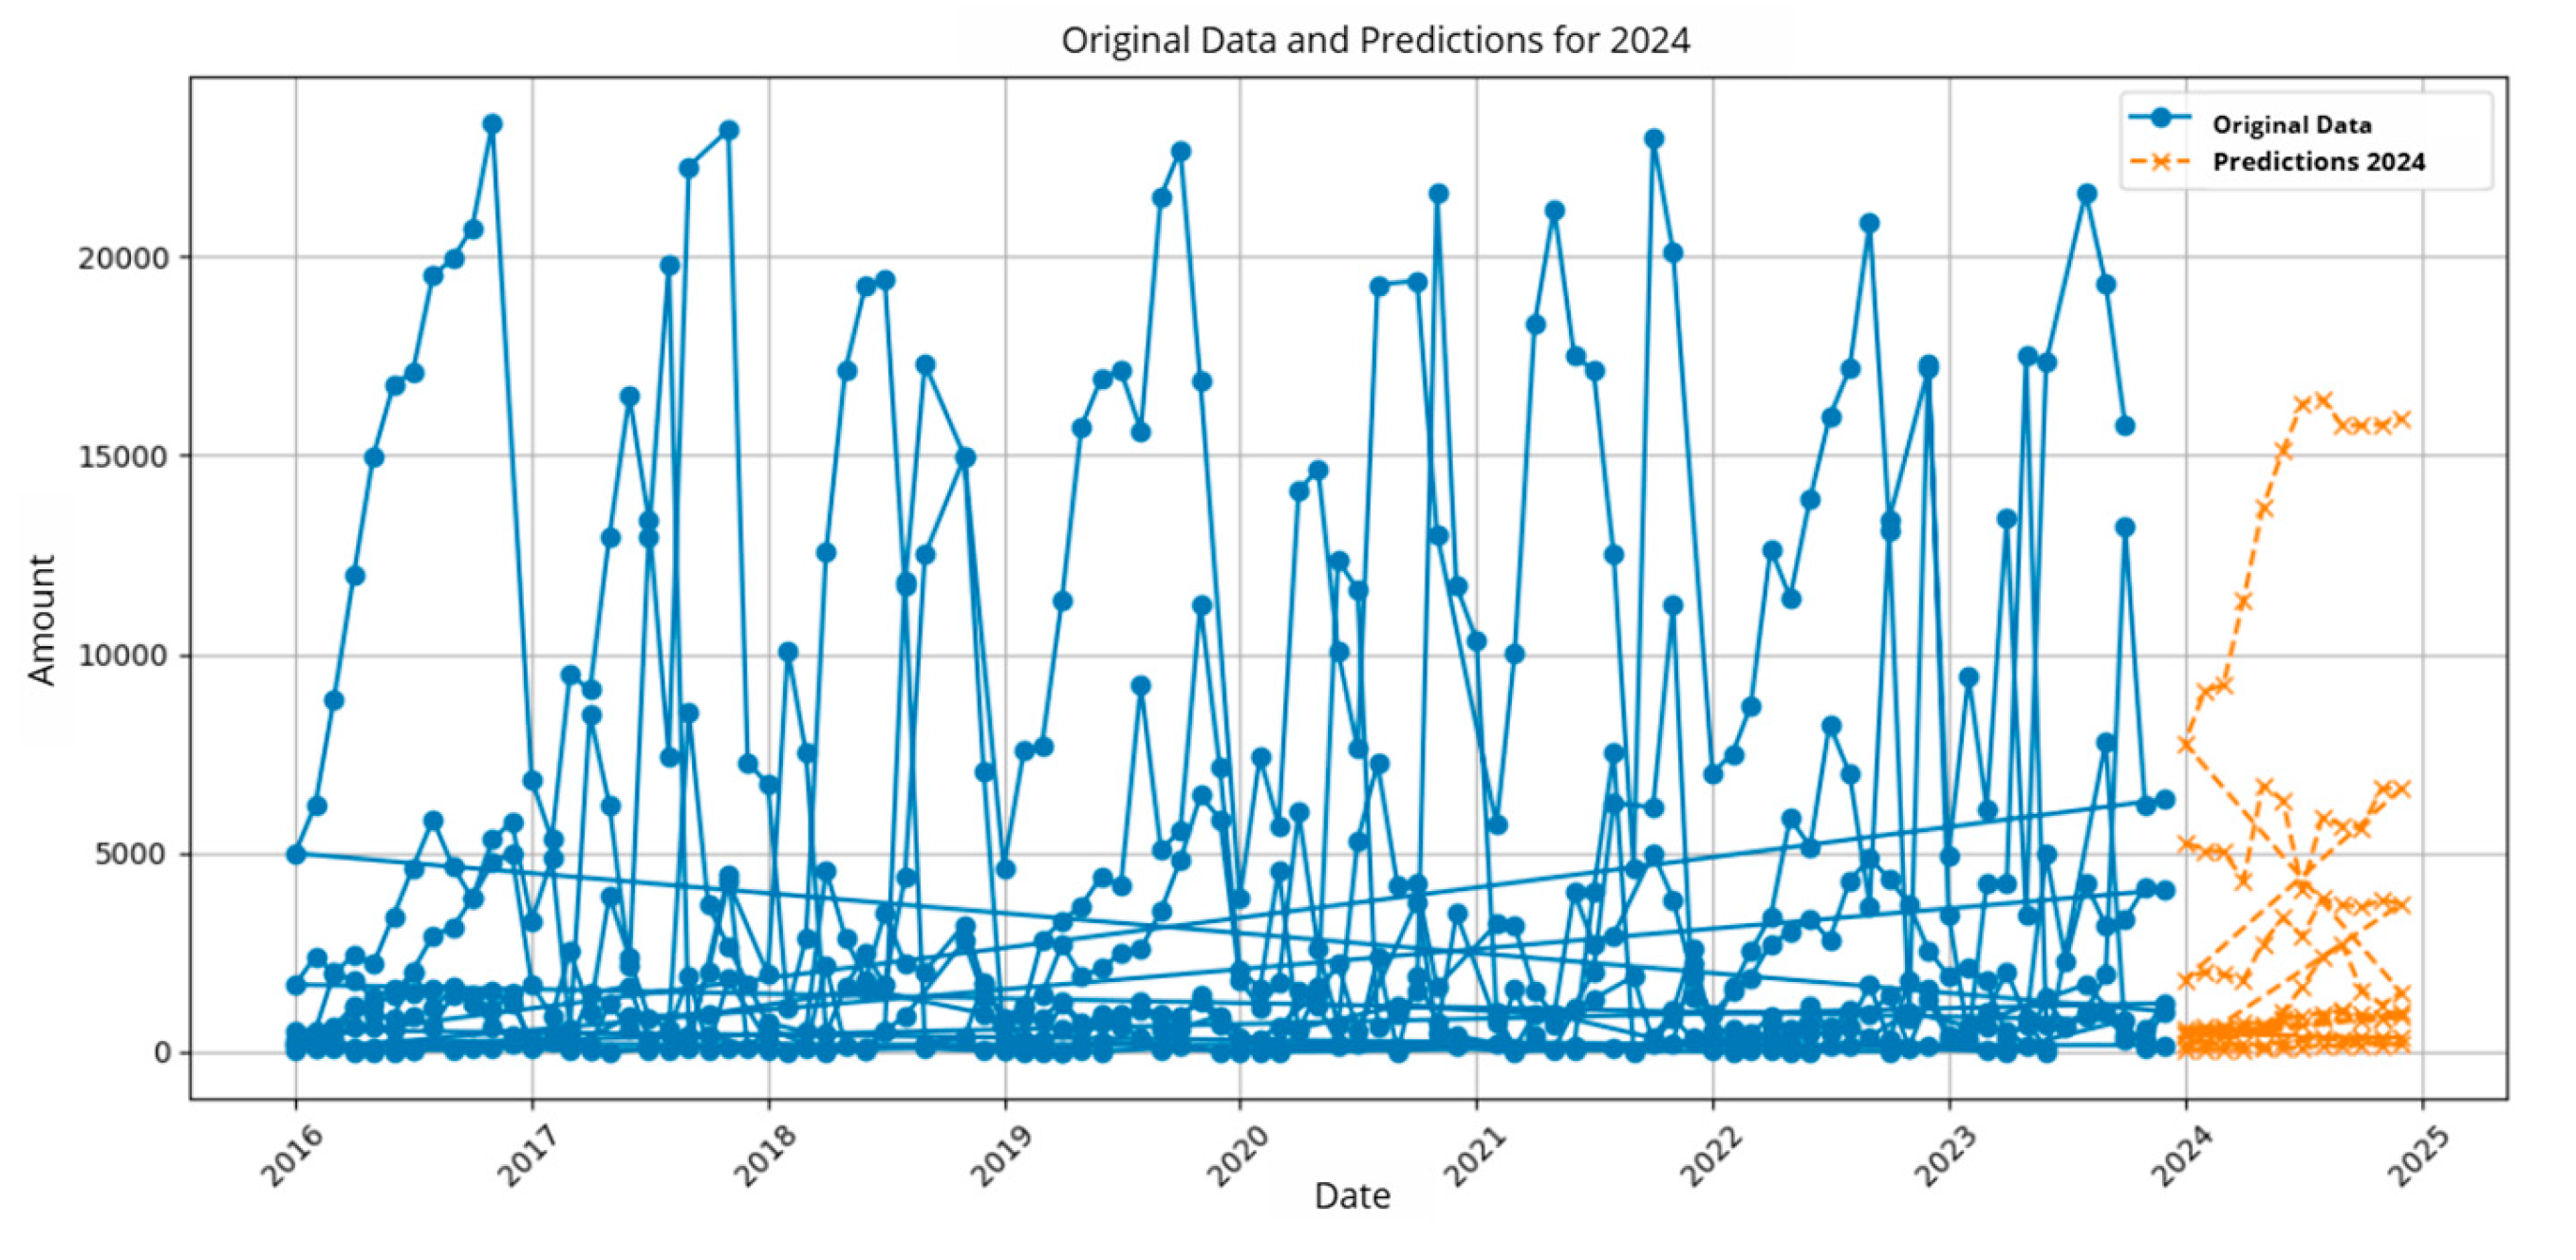
Figure 10.
Prediction of Indicator 5.
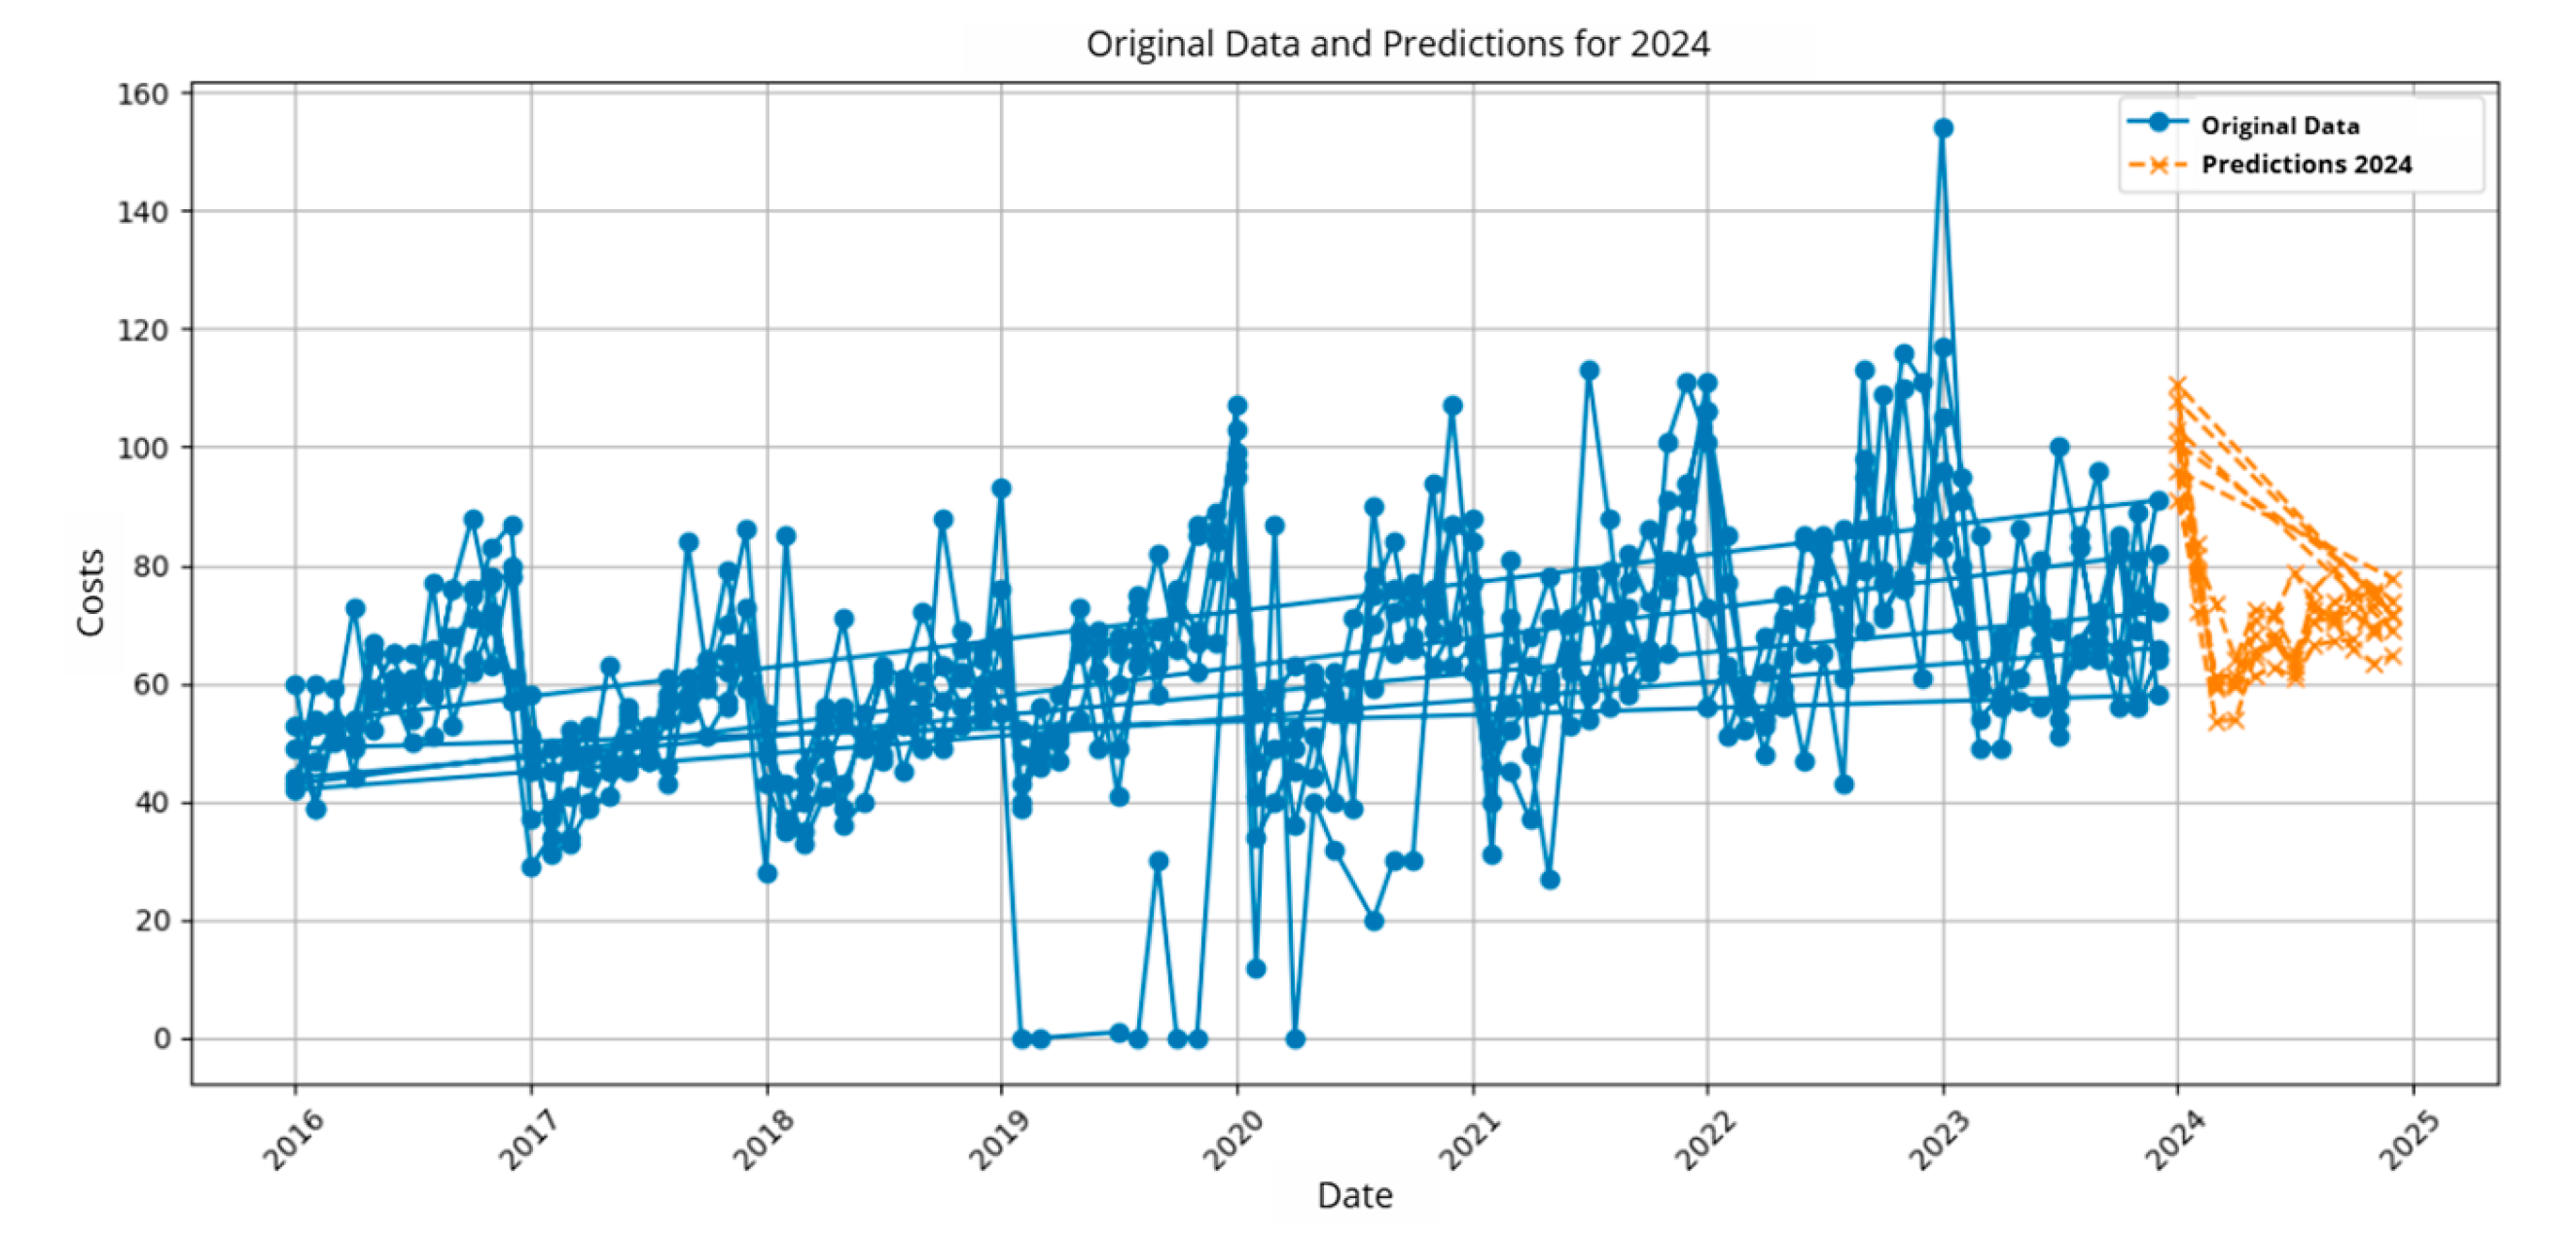
Figure 11.
Prediction of Indicator 6.
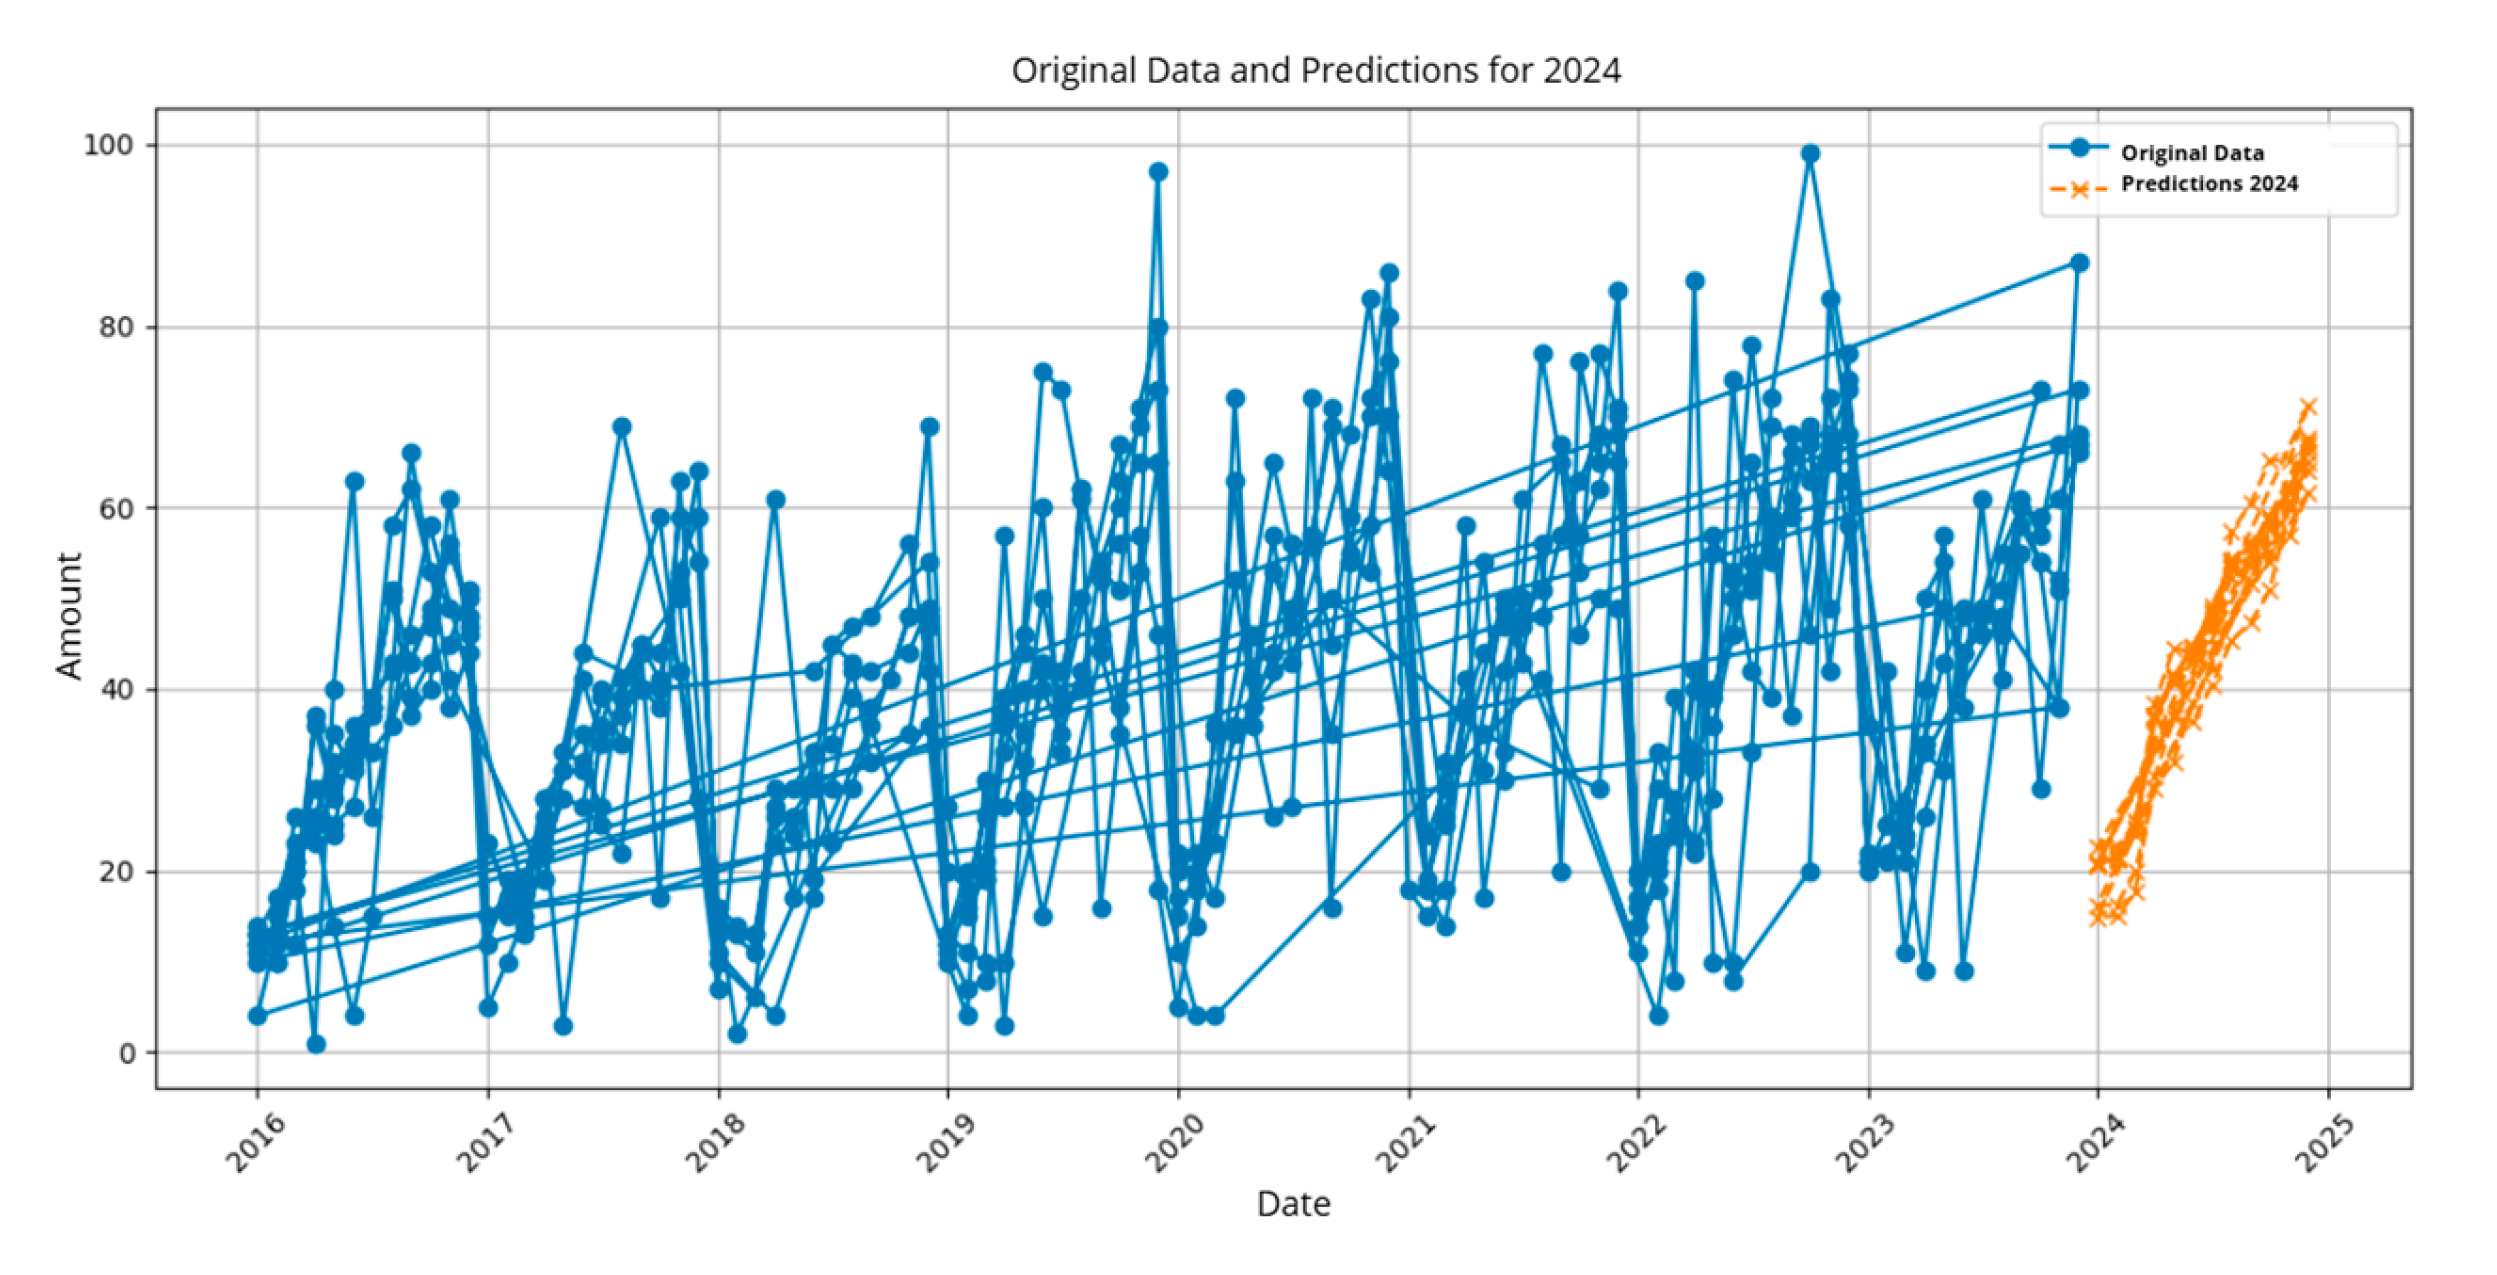
Figure 12.
Stacking Metrics by Indicator.
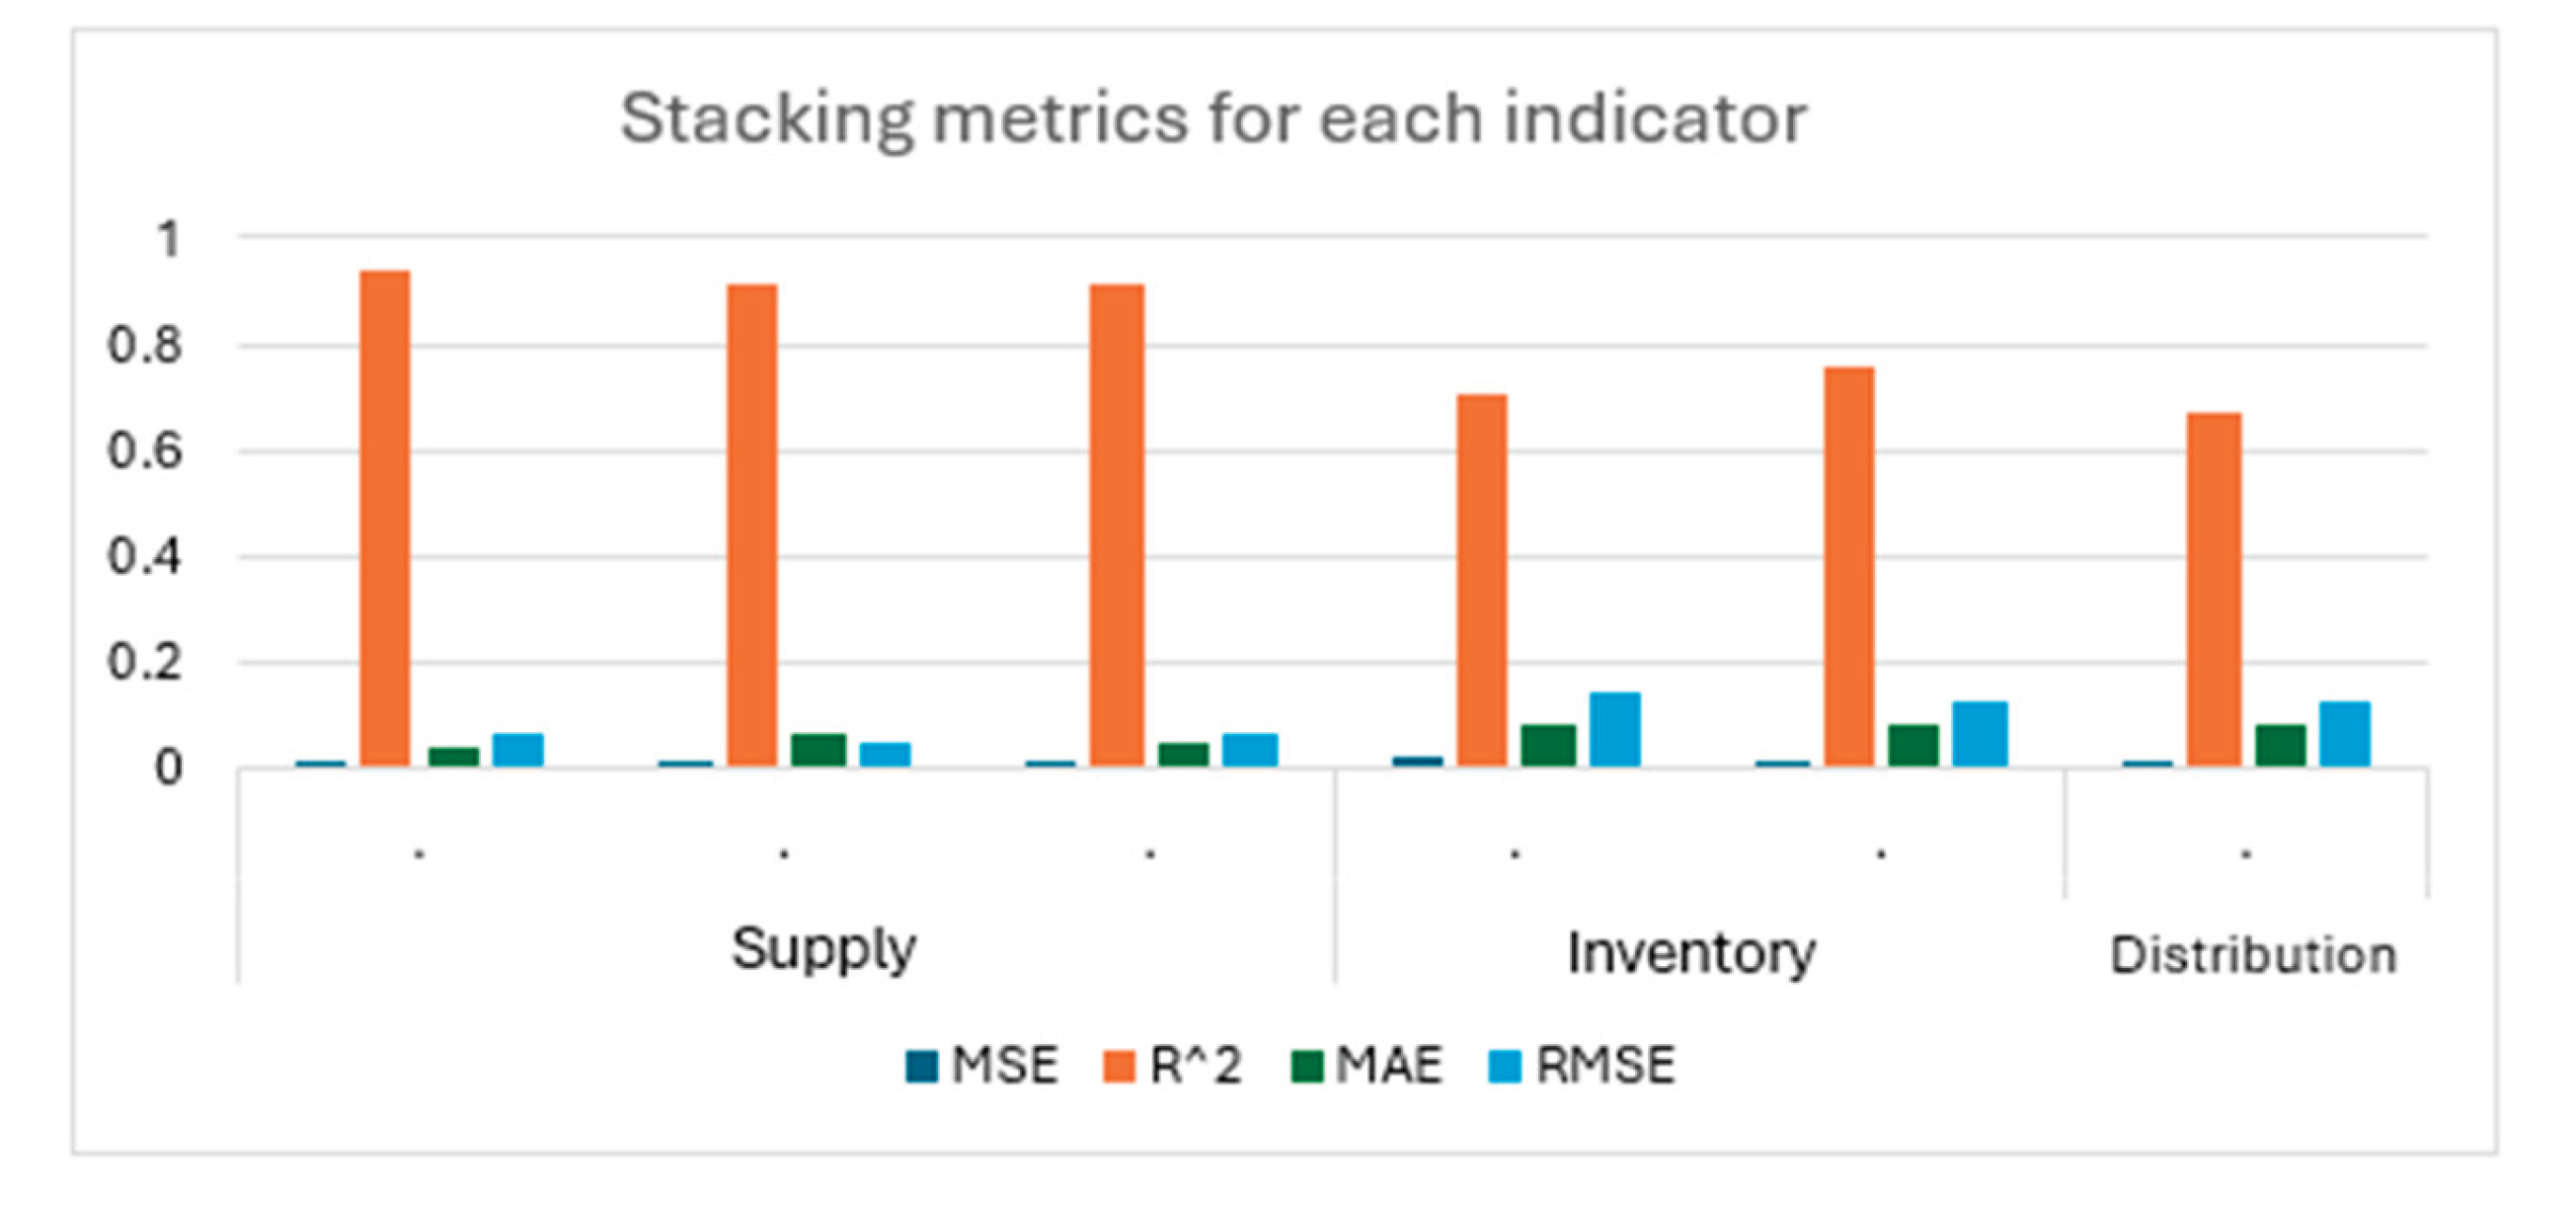

Table 1.
Composition of Stacking Models.
| Logistics Management | Indicator | Stacking | ML Models |
| Catering | Demand forecast for materials by location | 1 | K-Nearest Neighbors (KNN) |
| XGBoost | |||
| Random Forest | |||
| Linear Regression (meta-model) | |||
| Profitability of material purchased by location | 2 | Random Forest | |
| Decision Tree | |||
| Gradient Boosting | |||
| Linear Regression (meta-model) | |||
| Monthly revenue generated by material sales by location | 3 | Gradient Boosting | |
| Catboost | |||
| Random Forest | |||
| Linear Regression (meta-model) | |||
| Inventory | Total monthly inventory by category | 1 | K-Nearest Neighbors (KNN) |
| XGBoost | |||
| Random Forest | |||
| Linear Regression (meta-model) | |||
| Average monthly inventory by location | 2 | Gradient Boosting | |
| CatBoost | |||
| Random Forest | |||
| Linear Regression (meta-model) | |||
| Distribution | Average monthly material distributed by category | 1 | Catboost |
| K-Nearest Neighbors (KNN) | |||
| XGBoost | |||
| Linear Regression (meta-model) |
Table 2.
Evaluation of Metrics – Indicator 1.
| Models | MSE | R² | RMSE | MAE |
|---|---|---|---|---|
| KNN | 0.0040 | 0.9068 | 0.0632 | 0.0482 |
| XGBoost | 0.0030 | 0.9295 | 0.0549 | 0.0420 |
| Random Forest | 0.0036 | 0.9149 | 0.0603 | 0.0458 |
| Meta- model | 0.0025 | 0.9419 | 0.0498 | 0.0379 |
Table 3.
Evaluation of Metrics – Indicator 2.
| Models | MSE | R² | RMSE | MAE |
|---|---|---|---|---|
| Gradient Boosting | 0.0043 | 0.9010 | 0.0657 | 0.0485 |
| Decision Tree | 0.0092 | 0.7896 | 0.0958 | 0.0712 |
| Random Forest | 0.0046 | 0.8942 | 0.0680 | 0.0505 |
| Meta-model | 0.0039 | 0.9106 | 0.0625 | 0.0480 |
Table 4.
Evaluation of Metrics – Indicator 3.
| Models | MSE | R² | RMSE | MAE |
|---|---|---|---|---|
| Gradient Boosting | 0.0043 | 0.9016 | 0.0653 | 0.0479 |
| CatBoost | 0.0042 | 0.9034 | 0.0648 | 0.0494 |
| Random Forest | 0.0044 | 0.8996 | 0.0660 | 0.0496 |
| Meta-model | 0.0038 | 0.9117 | 0.0619 | 0.0451 |
Table 5.
Evaluation of Metrics – Indicator 4.
| Models | MSE | R² | RMSE | MAE |
|---|---|---|---|---|
| KNN | 0.0194 | 0.7019 | 0.1392 | 0.0848 |
| XGBoost | 0.0315 | 0.5152 | 0.1775 | 0.1073 |
| Random Forest | 0.0240 | 0.6301 | 0.1551 | 0.0925 |
| Meta-Model | 0.0191 | 0.7058 | 0.0838 | 0.1383 |
Table 6.
Evaluation of Metrics – Indicator 5.
| Models | MSE | R² | RMSE | MAE |
|---|---|---|---|---|
| Gradient Boosting | 0.0179 | 0.7064 | 0.1338 | 0.0828 |
| CatBoost | 0.0175 | 0.7124 | 0.1324 | 0.0850 |
| Random Forest | 0.0177 | 0.7097 | 0.1331 | 0.0852 |
| Meta-Model | 0.0147 | 0.7589 | 0.1213 | 0.0771 |
Table 7.
Evaluation of Metrics – Indicator 6.
| Models | MSE | R² | RMSE | MAE |
|---|---|---|---|---|
| KNN | 0.0153 | 0.6588 | 0.1239 | 0.0865 |
| XGBoost | 0.0122 | 0.7299 | 0.1103 | 0.07726 |
| CatBoost | 0.0049 | 0.8910 | 0.0700 | 0.0520 |
| Meta-Model | 0.0147 | 0.6722 | 0.1214 | 0.0837 |
Table 8.
Comparison with Other Similar Studies.
| Reference | Models | Metrics | |||
|---|---|---|---|---|---|
| MAE | RMSE | MSE | R2 | ||
| [23] | MA | 160.6 | 180.79 | 191979.06 | - |
| NS | 163.43 | 184.08 | 191963.34 | - | |
| LR | 109.17 | 127.02 | 103381.32 | - | |
| LGBM | 76.02 | 82.96 | 42045.96 | - | |
| [24] | MA | 0.666 | 1.001 | - | 0.24 |
| BNN | 0.625 | 0.969 | - | 0.287 | |
| MAML | 0.636 | 0.956 | - | 0.306 | |
| [25] | LST | 67.147 | 11.927 | 8.169 | - |
| Prophet | 304.366 | 316.661 | 9.92 | - | |
| Simple average | 29.041 | 35.813 | 8.753 | - | |
| BMA | 27.393 | 32.887 | 8.177 | - | |
| [26] | MLP | 5.05 | 5.93 | 12.64 | - |
| LSTM | 4.18 | 5.21 | 10.12 | - | |
| 1D-CNN | 6.2 | 7.96 | 14.76 | - | |
| Poposed model | 3.56 | 4.99 | 9.58 | - | |
Disclaimer/Publisher’s Note: The statements, opinions and data contained in all publications are solely those of the individual author(s) and contributor(s) and not of MDPI and/or the editor(s). MDPI and/or the editor(s) disclaim responsibility for any injury to people or property resulting from any ideas, methods, instructions or products referred to in the content. |
© 2025 by the authors. Licensee MDPI, Basel, Switzerland. This article is an open access article distributed under the terms and conditions of the Creative Commons Attribution (CC BY) license (http://creativecommons.org/licenses/by/4.0/).
Copyright: This open access article is published under a Creative Commons CC BY 4.0 license, which permit the free download, distribution, and reuse, provided that the author and preprint are cited in any reuse.


