
Submitted:
12 August 2025
Posted:
13 August 2025
You are already at the latest version
Abstract
ASB9 is a member of the ASB family of proteins, which act as a substrate-recognition component of E3 ubiquitin ligases and regulate various biological processes. We previously identified ASB9 as induced in bovine granulosa cells (GC) by LH/hCG and reported ASB9 binding partners including protease-activated receptor 1 (PAR1). We aimed to study ASB9 mechanisms of action in GC and determine whether ASB9 induction by LH/hCG is necessary for the regulation of PAR1 and signaling pathways involved in GC function and activity. Cultured GC were treated with different doses of FSH, LH and thrombin. RT-qPCR analyses revealed that thrombin increased PAR1 expression, while FSH had no effect on PAR1. Treatment with LH significantly downregulated PAR1, even in the presence of thrombin, possibly via ASB9. The phosphorylation profile of MAPK3/1 in thrombin-treated GC suggest a PAR1-mediated control. ASB9 induction appeared to have a negative effect on MAPK pathway although thrombin treatment blocked briefly (within an hour) the negative effect of ASB9 on PAR1. Proliferation assays showed that ASB9 negatively regulates GC number, while increasing apoptosis. These data provide evidence for ASB9 mode of action and its potent functional effects on PAR1 regulation, GC proliferation and potentially the ovulatory process in bovine species.
Keywords:
Bovine
; Granulosa cells
; Ovulation
; Follicular development
; Proliferation
; Apoptosis
; MAPK
; ASB9
; PAR1
1. Introduction
In mammals, a surge of luteinizing hormone (LH) is crucial for the final stages of ovarian follicle maturation and ovulation. While baseline levels of both LH and follicle-stimulating hormone (FSH) support the initial growth of follicular cells, it’s the significant preovulatory increase in circulating LH that triggers a series of essential events within the follicle. [1]. Following the selection of the dominant follicle in a cow during the normal estrous cycle, the pituitary gland releases more estradiol, which raises preovulatory LH [2]. This LH surge stimulates cumulus cell expansion, the resumption of meiosis in the oocyte, and the eventual rupture of the follicle to release the oocyte and the differentiation of granulosa cells into luteal cells [3,4,5]. Specific biochemical and molecular alterations in follicular cell function characterize these processes [6]. They involve a complex network of signaling pathways, including protein kinase A (PKA), protein kinase C (PKC), phosphatidylinositol 3-kinase (PI3K), tyrosine kinase–mediated pathways and mitogen-activated protein kinase (MAPK) signaling pathways, all of which are activated by LH [7,8] [9,10].
Consequently, gonadotropin stimulation induces the differentiation of somatic cells in the ovary and regulates the expression of genes that impact follicle development and oocyte maturation [7,9]. For instance, the LH-mediated surge in intracellular signaling consequently causes the rapid downregulation or silencing of genes in GC that regulate the growth of a bovine dominant follicle, while LH/hCG stimulates an array of genes involved in ovulation and luteinization, as demonstrated in a variety of species, including rodents and bovine species [9,10,11,12]. The precise coordination of these events is necessary to produce a mature, fertilizable oocyte and to form the corpus luteum, which is vital for a successful pregnancy [11,12,13]. Therefore, studying gene function during these final stages of follicular development and ovulation is critical to better understand and regulate ovarian activity.
Data from various laboratories have identified genes that are induced in granulosa cells of bovine ovulatory follicles in response to LH surge or hCG injection, such as Ankyrin repeats and suppressor of cytokine signaling (SOCS)-box protein 9 (ASB9) [14,15,16,17]. ASB9 is a member of the ASB family and is differentially expressed in ovulatory follicles compared to other stages of follicular development [15,17]. The SOCS box protein superfamily includes 18 protein members that make up the ankyrin repeat and SOCS box containing (ASB) family. These proteins interact with Cul5-Rbx2 to form E3 ubiquitin ligases (E3), which play significant roles through ubiquitination-mediated pathways [18,19,20]. However, ASB members interact with a wide range of target substrates, so they have a variety of other functions, including regulation of the cell cycle, carcinogenesis, proliferation and apoptosis [21,22].
To better understand the role of ASB9 in granulosa cells, we sought to confirm that ASB9 controls granulosa cell function by altering target genes. ASB9 modulates binding partners, such as protease-activated receptor 1 (PAR1), to inhibit GC proliferation. ASB9 also influences MAPK signaling by modulating these partners. PAR1 is a seven transmembrane domain G protein-coupled receptor (GPCR) and is uniquely activated by N-terminal proteolytic cleavage [23]. Cleavage of the N-terminus unmasks a tethered ligand that binds to the receptor and triggers intracellular signaling [24,25]. The activation of PAR1 by thrombin has been shown to lead to the activation of the MAPK3/1 signaling pathway, resulting in increased proliferation, while the inhibition of PAR1 and MAPK3/1 activation inhibits cell proliferation and migration [26].
ASB9 regulates the activity and function of granulosa cells (GCs), a finding from our previous study [17]. To further investigate this, our current research focused on the role of ASB9 induction in GC. Using in vitro bovine GC models, we analyzed how ASB9 regulates PAR1 and its effects on PAR1-activated signaling pathways (MAPKs) and overall GC activity.
2. Materials and Methods
2.1. Cell Culture
For the in vitro model, bovine ovaries were obtained from the slaughterhouse, irrespective of the stage of the estrous cycle, and granulosa cells (GC) were collected from medium and large follicles (follicle size ≥ 6 mm, by observation). GC from six to eight follicles were collected by aspiration, pooled, and washed. Cell viability was estimated with 0.4% Trypan blue stain, and cells were seeded at a density of 1 × 10⁶ and cultured in 24-well plates (n = 3 independent experiments) to analyze gene and protein expression following various treatments.
Serum-free culture. Cultures were performed in serum-free McCoy’s 5A medium supplemented with L-glutamine (2 mM), insulin (10 ng/ml), nonessential amino acids (1 mM), bovine serum albumin (BSA; 0.1%), sodium selenite (4 ng/mL), transferrin (5 µg/mL), androstenedione (100 nM), penicillin (100 IU), and streptomycin (0.1 mg/ml). The cells were incubated at 37°C in a humidified 5% CO2 atmosphere for 6 days. The medium was replaced every 48h with fresh medium. The treatments consisted of the addition of exact amounts of FSH (1 ng/mL), LH (10 ng/mL) and thrombin (10 mg/mL) in separate experiments and for different durations (15 min, 30 min, 1h, 6h and 12h), followed by analyses of the target ASB9 and PAR1 proteins and mRNA in GC.
Serum-based culture. Cultures were performed in McCoy’s 5A medium (from Thermo Fisher Scientific) containing L-glutamine (2 mM) supplemented with fetal calf serum (2%), insulin (10 ng/ml), nonessential amino acids (1 mM), sodium selenite (4 ng/mL), transferrin (5 µg/mL), androstenedione (100 nM), penicillin (100 IU), streptomycin (0.1 mg/ml) and follicle-stimulating hormone (FSH; 1 ng/ml). FSH was added to the culture medium to induce LH receptor expression prior to treating the cells with LH. The cells were incubated at 37°C in a humidified 5% CO2 atmosphere for 48h. The medium was then replaced with serum-free McCoy’s medium without FSH for 18h, after which LH or thrombin was added without any changes to the medium. Treatments were performed to analyze the LH-induced effects and thrombin-induced effects on ASB9 and PAR1 expression in GC. The treatments consisted of the addition of exact amounts of LH (10 ng/mL) and thrombin (10 mg/mL) in separate experiments and for different durations (15min, 30min, 1h, 6h and 12h), followed by analyses of the target proteins ASB9 and PAR1, respectively.
2.2. RNA Preparation and RT‒qPCR Analyses
Total RNA was extracted from bovine GC of in vitro samples using the TRIzol Plus RNA Purification Kit (Invitrogen) and quantified by absorbance at 260 nm using a NanoDrop spectrophotometer (Thermo Fisher Scientific). Reverse transcription was performed using SMART Scribe Reverse Transcriptase (Takara Bio). cDNA levels were analyzed by RT-qPCR using SsoAdvanced Universal SYBR Green Supermix (Bio-Rad) following the manufacturer’s instructions. RT-qPCR data were analyzed using the Livak (2-ΔΔCt) method [27] with RPL19 used as a housekeeping gene [28]. Bovine-specific primer sequences for ASB9, PAR1, TNFAIP6, AREG, RPL19, StAR, CYP11A1 and CYP19A1 were used, as presented in Table 1.
2.3. Western Blot Analyses
Granulosa cells from in vitro samples were obtained as described above, and the cells were lysed with M-PER buffer (Thermo Fisher Scientific) supplemented with complete protease inhibitors (Sigma-Aldrich) according to the manufacturer’s protocol. Protein concentrations were determined using a Pierce BCA Protein Assay Kit (Thermo Fisher Scientific). Western blot analyses were performed as previously described [17]. Samples (6 µg of total protein per line) were resolved on Novex WedgeWell 4-20% Tris-glycine mini-gels (Invitrogen) and electrophoretically transferred onto polyvinylidene difluoride membranes (PVDF; Bio-Rad) in a Bio-Rad Wet Blot Transfer Machine. After transfer, the membranes were incubated with blocking buffer (5% nonfat dry milk in TTBS (10 mM Tris-HCL, 150 mM NaCl, and 0.1% Tween-20; pH 7.5)) for 2 h. The membranes were then incubated overnight at 4°C with specific primary antibodies against ASB9 (Abcam; 1 ng/mL), MAPK3/1 and p-MAPK3/1 (both from Cell Signaling; 1:1000), and PAR1 (Invitrogen; 0.5 mg/mL). Immunoreactive proteins were visualized by incubation with a goat anti-rabbit secondary antibody coupled with HRP (Cell Signaling; 1:1000) for anti-ASB9, anti-MAPK3/1 and anti-p-MAPK3/1 and a rabbit-anti-goat IgG (H+L) secondary antibody (Invitrogen; 1:1000) for anti-PAR1 for 2 h at room temperature. Revelation was performed using the SuperSignal West Atto Ultimate Sensitivity Chemiluminescent Substrate (Thermo Fisher Scientific). β-actin was used as a reference protein with anti-β-actin antibodies (ACTB; Santa Cruz; 200 µg/ml; 1:2000). Semiquantitative analysis was performed using NIH ImageJ software.
2.4. Functional Analyses
The pQE system (Qiagen) was used for the cloning of ASB9 and generation of the pQE-ASB9 plasmid construct for ASB9 overexpression in GC [15]. GC cells were collected from the ovaries of the slaughterhouse and cultured in 12-well plates at a density of 1×10⁶ cells/well in McCoy’s 5A medium as described above (n = 2 independent experiments with triplicate wells for each treatment). GC cells were transfected with the pQE-ASB9 construct using Xfect Transfection Reagent (Takara Bio) according to the manufacturer’s protocol. Nanoparticle complexes from the Xfect transfection kit were applied to GC and incubated for 9h at 37°C, after which they were removed and replaced with serum-free McCoy’s medium without supplementation for 24h. Treatments were added without medium change. The treatments consisted of the addition of exact amounts of LH (10 ng/mL) and thrombin (10 mg/mL) in separate experiments and for different durations (15 min, 30 min, 1h, 6h and 12h). The cells were collected for protein extraction and western blot analyses. The effects of ASB9 overexpression were assessed by analyzing the expression of ASB9 and protease activate receptor 1 (PAR1). The MAPK pathway was also verified by analyzing the phosphorylation levels of MAPK3/1 (ERK1/2).
2.5. Proliferation and Caspase 3/7 Activity Assays
Granulosa cells were plated in 96-well plates (1x10⁴ cells per well) in McCoy’s medium and then treated with LH (10 ng/mL) or thrombin (10 mg/mL). Cell number was measured using CellTiter Proliferation and Viability Assays (Promega). Then, 20 μl of MTS assay reagent was added to each well, and the plates were incubated at 37°C for 2 h. The absorbance at 490 nm was read in a SpectraMax luminometer plate reader (Molecular Devices). For caspase 3/7 activity, GC were also cultured in 96-well plates (1x10⁴ cells per well) and treated with LH or thrombin. Caspase 3/7 activity was determined using a luminescent assay (Caspase-Glo 3/7 Assay; Promega Corp.). Caspase-Glo 3/7 reagent (100 μl) was added to the culture plate, and the cells in the culture medium were incubated at room temperature for 1h before the luminescence of each well was measured at 490 nm in a SpectraMax luminometer plate reader (Molecular Devices).
2.6. Statistical Analysis
The statistical analyses for all in vitro experiments were performed using Prism software 10 for macOS (GraphPad Software Inc.). Samples or treatments were compared using one-way analysis of variance [29]. When ANOVA indicated a significant difference [30], the Tukey-Kramer test was used for multiple comparisons of individual means among treatments and times. The data are presented as the means ± SEMs, and variables whose p value was <0.05 are represented by an asterisk (*) or with different letters. RT-qPCR data are presented as normalized amounts of the respective genes relative to 2-ΔΔCt using RPL19 as a housekeeping gene.
3. Results
3.1. ASB9 and PAR1 Expression are Differentially Regulated by Gonadotropins (LH and FSH) and Thrombin
We previously performed CRISPR/Cas9-mediated knockdown of ASB9 in GC to verify the effects of ASB9 silencing on target binding partners [17]. The data showed that ASB9 influences the MAPK3/1 pathway in granulosa cells by presumably interacting with PAR1 on LH-regulated ovulatory genes. We aimed to investigate the mechanism of action of ASB9 in bovine GC and its impact on the effects of PAR1 on GC activity. First, we used an in vitro model of GC collected from follicles. Total RNA was extracted from cultured GC after FSH, LH and thrombin treatments (15 min and 1 h). The ASB9 and PAR1 levels in the samples were analyzed by quantitative RT-qPCR using the specific primers listed in Table 1.
PAR1 induction in GC in vitro was significantly greater following treatment with thrombin for 1h (Figure 1A, p<0.05), whereas FSH had no effect on PAR1 expression. However, the combination of FSH and thrombin resulted in a much greater increase in PAR1 expression than thrombin alone (p<0.05). In contrast, PAR1 was significantly reduced with LH treatment (1h), even in the presence of thrombin (Figure 1B, p<0.05), suggesting negative regulation of PAR1 by LH, possibly via ASB9. The results also showed that ASB9 expression decreased significantly in the presence of thrombin, while LH induced ASB9 expression (Figure 1C and D, p<0.05). The combination of FSH and thrombin also increased ASB9 expression in contrast to the decrease when treated individually (Figure 1C, p<0.05).
3.2. ASB9 Effects on Target Binding Partners
To better understand the mechanism of action and function of ASB9 in bovine GC and its effects on PAR1, we performed a second experiment using the same in vitro model of GC collected from medium and large follicles (follicle size ≥ 6 mm). Total RNA was extracted from collected GC after LH and thrombin treatments (15 min, 1 h, 6 h and 12 h). ASB9 and PAR1 expression was analyzed by RT-qPCR. In addition to mRNA expression analyses, total protein extracts were analyzed by western blot using anti-ASB9 antibodies to verify ASB9 regulation in vitro following treatment with LH. Western blot results revealed that ASB9 protein expression in GC in vitro increased 12h after treatment with LH as compared to 30min and 6h (Figure 2A, p<0.05), confirming previously reported results from our laboratory using an in vivo model [17]. Basal ASB9 expression also increased over time since there was more protein in the control at 12 h than in the control at 30 minutes. However, the effect of LH induction in combination with thrombin more than doubled the amount of the ASB9 protein in GC (Figure 2A, p<0.05). On the other hand, the qPCR results indicated greater expression of PAR1 in cells treated with thrombin, while treatment with LH significantly decreased the expression of PAR1 at 6 h and 12 h, even in the presence of thrombin (Figure 2D and E, p<0.05). This suggests that while thrombin seems to counter the negative effects of ASB9 on PAR1 early on (1 h), thrombin does not affect ASB9 at 6h or 12 h when LH-induced ASB9 expression is increased (Figure 2B,C, p<0.05).
3.3. Regulation of PAR1 by Thrombin
Total protein extracts were analyzed by western blot using anti-PAR1 antibodies. The results revealed no change in the amount of PAR1 at 15min, 30min or 1h (Figure 3A). Despite the absence of a change in protein expression, thrombin could stimulate PAR1 expression in GC, as shown by the qPCR analysis, and PAR1 mRNA expression increased significantly in thrombin-treated GC at 15 min (Figure 3B).
3.4. Thrombin Treatment Increased MAPK3/1 (ERK1/2) Phosphorylation in GC, Possibly Through PAR1
To analyze the regulation of MAPK phosphorylation by PAR1 in GC, we investigated PAR1 induction using in vitro GC culture at different times after LH and thrombin treatment (15 minutes, 30 minutes and 1 hour; n = 3 for each time point). Total protein extracts were analyzed by western blot using total MAPK3/1 (tMAPK3/1) and phospho MAPK3/1 (pMAPK3/1) antibodies, and the ratio of pMAPK3/1 to tMAPK3/1 and the ratio of tMAPK3/1 to β-actin were analyzed and compared among the various treatments and times. Western blot analyses revealed a relative increase in the level of MAPK3/1 phosphorylation in GC very early following treatment with thrombin (Figure 4A,B). This relative increase in MAPK3/1 phosphorylation is likely modulated by an increase in PAR1 in response to thrombin treatment.
Furthermore, we analyzed MAPK phosphorylation in cultured GC in response to LH treatment. Analyses revealed that pMAPK3/1 significantly increased at 30 min, while total MAPK3/1 significantly decreased at the same time and at 1 h post-LH treatment (Figure 4). These data are also consistent with previously published data using in vitro samples following treatment with LH at different times (15 min, 30 min, 1 h, and 12 h) in ASB9-inhibited GC [17].
3.5. ASB9 Affects Proliferation, Differentiation and Apoptosis of GC Cells In Vitro
To analyze the effects of ASB9 on GC activity, we tested the expression of LH-response genes TNFAIP6 (Figure 5A,B) and AREG (Figure 5C,D) as well as steroidogenic enzymes CYP19A1 (Figure 5E,F), CYP11A1 (Figure 5G,H) and StAR (Figure 5I,J) by RT-qPCR. The mRNA levels of CYP11A1 and StAR in GC in vitro increased 12 h after LH treatment (Figure 5F,J, p<0.05), while the expression of CYP19A1 decreased at 6 h (Figure 5G, p<0.05). The expression of AREG and TNFAIP6, two LH response genes, increased after 6 h and 12 h of LH treatment (Figure 5A–D, p<0.05).
We previously carried out yeast two-hybrid screening to identify ASB9 interactions in granulosa cells [15]. Furthermore, experiments were conducted to analyze the effects of ASB9 on GC proliferation and apoptosis. Proliferation tests showed that following ASB9 overexpression, the number of GC decreased (Figure 6A, p<0.05); however, ASB9 activity was unaffected by thrombin. After 6 h, treatment with LH significantly increased the expression of the proliferation marker CCND2, whereas at 12 h, CCND2 expression was reduced (Figure 6B, p<0.05). This result was in contrast with thrombin treatment, which increased CCND2 at both 6 and 12 hours (Figure 6C, p<0.05). On the other hand, the effects of LH on ASB9-mediated GC cell apoptosis were demonstrated, as BAX expression increased (Figure 6D, p<0.05) but then decreased following thrombin treatment (Figure 6E, p<0.05) at 12h. However, the caspase 3/7 assay results did not significantly differ among the treatments.
The current data are consistent with previously reported data and support the hypothesis that ASB9 inhibits the MAPK signaling pathway in granulosa cells of ovulatory follicles by targeting specific proteins, such as PAR1, which blocks proliferation and the initiation of GC differentiation (Figure 7).
4. Discussion
We previously identified and reported that target genes, including ASB9, are downregulated in GC of bovine ovulatory follicles following hCG/LH treatment [15,17]. The present study offers new insights into how ASB9 regulates GC proliferation through the PAR1 and MAPK3/1 signaling pathways using an in vitro model. We found that ASB9 protein expression in GC increased 12 hours after LH treatment. These findings mimic and confirm our prior in vivo results, which showed that ASB9 protein expression began to increase in the ovulatory follicle 12 hours after hCG injection, continued to rise at 18 hours, and reached its strongest induction at 24 hours post-hCG [15,17]. These data support the role of ASB9 in regulating the expression of downstream target genes and their signaling pathways in the follicle prior to ovulation. Overexpression of ASB9 (LH-induced gene) led to a decrease in GC number. LH stimulation led to a decrease in the cell proliferation marker CCND2 (12h after LH treatment), an increase in MAPK3/1 phosphorylation (30min after LH treatment) and an increase in the abundance of the apoptosis marker BAX (12h after LH treatment). These results are in line with previously reported data (10) and demonstrate that, by altering the expression of CCND2, ASB9 could have an effect on the G1 phase and the G1-S checkpoint of the cell cycle and seems to be associated with a reduction in GC proliferation. Research indicates that CCND2 is essential for ovarian folliculogenesis and plays a significant role in inducing the early-to-mid G1 phase transition (27). Conversely, the increase in BAX expression in GC following ASB9 induction with LH is consistent with the role of ASB9 as a brake on GC proliferation/cell cycle progression to initiate GC differentiation or control GC apoptosis. These observations could also suggest that ASB9 is involved in granulosa cell differentiation into luteal cells, similar to its perceived role in mouse spermatogenesis, where overexpression of ASB9 in the spermatogonial stem cell (SSC) line significantly inhibited cell proliferation and increased apoptosis [31]. Additionally, a recent study using porcine GC showed that ASB9 inhibition increases GC number by regulating cell cycle-related genes, including PCNA, CCND2, and CCNE2 [32].
Since our previous studies identified binding partners for ASB9 in GC, including PAR1 [14,15,17], we hypothesized that LH-induced ASB9 could regulate GC function by affecting MAPK3/1 signaling through PAR1 to block GC proliferation. PAR1 is a G protein-coupled receptor (GPCR) and is uniquely activated by N-terminal proteolytic cleavage [23]. Cleavage of the N-terminus unmasks a tethered ligand that binds to the receptor and triggers intracellular signaling [33]. The activation of PAR1 by thrombin has been shown to lead to the activation of the MAPK3/1 signaling pathway, resulting in increased proliferation, while the inhibition of PAR1 and MAPK3/1 activation inhibits cell proliferation and migration [26]. According to analyses of preovulatory DNA microarray data, LH/hCG can stimulate the thrombin-THBD-APC-PAR1/4 system in preovulatory follicles [34]. The localization of prothrombin and PAR1 in GC suggests that these factors may be important mediators of cellular function in the ovarian follicle [35].
In this study, the data showed greater expression of PAR1 in cultured granulosa cells treated with thrombin, while treatment with LH significantly decreased the expression of PAR1 at both 6 h and 12 h, even in the presence of thrombin. This suggests that while thrombin seems to counter the negative effects of ASB9 on PAR1 early on (1 h), thrombin does not affect ASB9 at 12 h when LH-induced ASB9 expression is increased. This result supports our previous data from an in vivo model, which showed a reduction in PAR1 expression in ovulatory follicles 24 h post hCG compared to day 5 dominant follicles [15]. For a better understanding of PAR1 regulation, we administered thrombin to GC in addition to LH and FSH. FSH had no effect on PAR1, thrombin increased PAR1 mRNA expression in GC in vitro, and LH treatment decreased PAR1, even in the presence of thrombin, confirming that LH negatively regulates PAR1, potentially through ASB9 induction. ASB9 may have a negative effect on PAR1 through the well-known effect of ASB proteins, which regulate the turnover of a range of proteins by targeting them for polyubiquitination and subsequent proteasomal degradation [36].
Moreover, we analyzed MAPK3/1 phosphorylation in our in vitro model and detected a relative increase in MAPK3/1 phosphorylation in GC very early following thrombin treatment. This relative increase in MAPK3/1 phosphorylation is likely modulated by an increase in PAR1 in response to thrombin treatment. Additionally, we examined the response of cultured GC to LH treatment in terms of MAPK phosphorylation. The results of the analyses revealed that at 30 minutes, pMAPK3/1 significantly increased, while at the same time and one hour after LH treatment, total MAPK3/1 significantly decreased. These results align with our previously published data using in vitro samples following LH treatment at different times in ASB9-inhibited GC [17]. The observations from in vitro experiments were comparable to the data in GC samples at 24h post-hCG injection from an in vivo model demonstrating a significant reduction in pMAPK3/1 compared to tMAPK3/1 [17]; moreover, ASB9 induction by LH was the strongest [15,17].
LH-dependent phosphorylation and activation of MAPK3/1 have been demonstrated in granulosa cells of different species [10]. Complex transcriptional regulation of target LH-induced genes is required for the control of GC growth and function via various signaling pathways. This regulation influences the optimal physiological status of the follicle before ovulation. The LH-induced MAPK3/1 pathway has been shown to be essential for ovulation [30]. Inhibition of MAPK3/1 in vivo leads to an anovulatory phenotype with trapped oocytes and defective follicular rupture [37]. In mouse preovulatory follicles, LH stimulates the phosphorylation of MAPK3/1 within 30 minutes, and after two hours of stimulation, the phosphorylation levels increase. MAPK3/1 is first activated in mural granulosa cells and subsequently in cumulus cells over time [10,38]. Similarly, we provide insight into the potential role of PAR1 activation in cell proliferation through the MAPK3/1 signaling pathway. Moreover, it is known from the literature [39,40,41,42] that PAR1 dose-thrombin activation modulates cell survival through MAPK3/1 signaling pathway activation [43]. Together, these findings suggest that LH-induced ASB9 is involved in regulating granulosa cell proliferation by affecting MAPK3/1 signaling through ASB9 binding partners such as PAR1. Two additional investigations that reported ASB9 involvement in cancer provided evidence of the detrimental effects of ASB9 on cell proliferation [44,45]. However, other research has demonstrated that thrombin-induced PAR1 activation in astrocytes triggers the MAPK3/1 signaling pathway, which in turn promotes the exponential growth of cells [46].
LH triggers the production of ASB9 in bovine granulosa cells, which in turn, decreases the ability of PAR1 to promote GC proliferation. While PAR1 likely controls the phosphorylation of MAPK3/1 in thrombin-treated GC, ASB9’s induction by LH reduces this phosphorylation. Thrombin can temporarily counteract ASB9’s negative effects, but only for a brief window before ASB9 is fully induced by LH. Overall, the data highlight ASB9 as a crucial regulator of ovarian GC proliferation and activity.
5. Conclusions
This research provides strong evidence that ASB9 is a critical regulator of granulosa cell function. Its induction by LH during the preovulatory period is linked to the downregulation of PAR1, a negative effect on the MAPK pathway, and a decrease in GC proliferation while increasing apoptosis. These findings suggest that ASB9 plays a potent functional role in controlling GC activity and may be a key player in the bovine ovulatory process.
Author Contributions
Investigations, D.N.G. and K.N.; Visualization, D.N.G. and K.N.; Validation, D.N.G. and K.N.; Formal analysis, D.N.G. and K.N.; Writing-Original draft preparation, D.N.G.; Methodology, D.N.G. and K.N.; Conceptualization, K.N.; Resources, K.N.; Writing-Review and Editing, D.N.G. and K.N.; Supervision, K.N.; Project Administration, K.N.; Funding Acquisition, K.N. All authors have read and agreed to the published version of the manuscript.
Funding
This study was supported by a Discovery Grant from the Natural Sciences and Engineering Research Council of Canada (NSERC) (RGPIN#04516) to K. Ndiaye and by an Alliance Grant from NSERC (#RN001413) to K. Ndiaye. The funders had no role in the study design, data collection and analysis, decision to publish, or preparation of the manuscript.
Institutional Review Board Statement
The Animal Ethics Committee of the Faculty of Veterinary Medicine of the University of Montreal reviewed and approved all the experimental protocols, as the animals were cared for in accordance with the Canadian Council on Animal Care guidelines.
Data Availability Statement
All the data generated or analyzed during this study are included in this published article.
Acknowledgments
The authors thank Dr. Jacques G. Lussier for his suggestions and critical comments throughout the progress of this project.
Conflicts of Interest
The authors declare that they have no competing interests.
Abbreviations
The following abbreviations are used in this manuscript:
| AREG | Amphiregulin |
| ASB | Ankyrin repeat Socs-box |
| ASB9 | Ankyrin repeat Socs-box protein 9 |
| BAX | Bcl-2 like protein 4 |
| CCND2 | Cyclin-D 2 |
| CCNE2 | Cyclin-E 2 |
| Cul5-RBX2 | Cullin-RING ligase 5—RING protein RBX2 |
| CYP11A1 | Cytochrome P450 Cholesterol Side-Chain Cleavage, Family 11, Subfamily A, Polypeptide 1 |
| CYP19A1 | Cytochrome P450, Family 19, Subfamily A, Polypeptide 1 |
| E3 | Ubiqutin ligase |
| ERK1/2 | Extracellular-Signal-Regulated Kinase |
| FSH | Follicle-Stimulating Hormone |
| GC | Granulosa Cell |
| hCG | Human Chorionic Gonadotropin |
| LH | Luteinizing Hormone |
| MAPK3/1 | Mitogen-activated protein kinase 3/1 |
| PAR1 | Protease-Activated Receptor 1 |
| RPL19 | Ribosomal Protein L19 |
| StAR | Steroidogenic Acute Regulatory protein |
| SOCS | Suppressor of cytokine signaling |
| TNFAIP6 | Tumor Necrosis Factor-Inducible Gene 6 Protein |
References
- Gérard, N.; Robin, E. Cellular and molecular mechanisms of the preovulatory follicle differenciation and ovulation: What do we know in the mare relative to other species. Theriogenology 2019, 130, 163–176. [Google Scholar] [CrossRef]
- Carvalho, P.; Santos, V.; Giordano, J.; Wiltbank, M.; Fricke, P. Development of fertility programs to achieve high 21-day pregnancy rates in high-producing dairy cows. Theriogenology 2018, 114, 165–172. [Google Scholar] [CrossRef] [PubMed]
- Fang, L.; Sun, Y.-P.; Cheng, J.-C. The role of amphiregulin in ovarian function and disease. Cell. Mol. Life Sci. 2023, 80, 1–21. [Google Scholar] [CrossRef] [PubMed]
- Baddela, V.S.; Michaelis, M.; Sharma, A.; Plinski, C.; Viergutz, T.; Vanselow, J. Estradiol production of granulosa cells is unaffected by the physiological mix of nonesterified fatty acids in follicular fluid. J. Biol. Chem. 2022, 298, 102477. [Google Scholar] [CrossRef] [PubMed]
- Godin, P.; Tsoi, M.F.; Morin, M.; Gévry, N.; Boerboom, D. The granulosa cell response to luteinizing hormone is partly mediated by YAP1-dependent induction of amphiregulin. Cell Commun. Signal. 2022, 20, 1–15. [Google Scholar] [CrossRef]
- Adams, G.P.; Singh, J. Ovarian Follicular and Luteal Dynamics in Cattle. Bovine Reproduction2021. p. 292-323.
- Duffy, D.M.; Ko, C.; Jo, M.; Brannstrom, M.; E Curry, T. Ovulation: Parallels With Inflammatory Processes. Endocr. Rev. 2018, 40, 369–416. [Google Scholar] [CrossRef]
- Gershon, E.; Dekel, N. Newly Identified Regulators of Ovarian Folliculogenesis and Ovulation. Int. J. Mol. Sci. 2020, 21, 4565. [Google Scholar] [CrossRef]
- Chakravarthi, V.P.; Ratri, A.; Masumi, S.; Borosha, S.; Ghosh, S.; Christenson, L.K.; Roby, K.F.; Wolfe, M.W.; Rumi, M.K. Granulosa cell genes that regulate ovarian follicle development beyond the antral stage: The role of estrogen receptor β. Mol. Cell. Endocrinol. 2021, 528, 111212–111212. [Google Scholar] [CrossRef] [PubMed]
- Conti, M.; Hsieh, M.; Zamah, A.M.; Oh, J.S. Novel signaling mechanisms in the ovary during oocyte maturation and ovulation. Mol. Cell. Endocrinol. 2012, 356, 65–73. [Google Scholar] [CrossRef]
- Perry, G.A.; Ketchum, J.N.; Quail, L.K. Importance of preovulatory estradiol on uterine receptivity and luteal function. Anim. Reprod. 2023, 20, e20230061. [Google Scholar] [CrossRef] [PubMed]
- Selvaraju, S.; Binsila, B.K.; Krishnappa, B.; Arangasamy, A. Essential Roles of Metabolic Hormones on Gonadal Functions and Fertility of Livestock. Springer Nature Singapore; 2022. p. 69-82.
- Thatcher, W.W. A 100-Year Review: Historical development of female reproductive physiology in dairy cattle. J. Dairy Sci. 2017, 100, 10272–10291. [Google Scholar] [CrossRef] [PubMed]
- Lussier, J.G.; Diouf, M.N.; Lévesque, V.; Sirois, J.; Ndiaye, K. Gene expression profiling of upregulated mRNAs in granulosa cells of bovine ovulatory follicles following stimulation with hCG. Reprod. Biol. Endocrinol. 2017, 15, 88–88. [Google Scholar] [CrossRef] [PubMed]
- Benoit, G.; Warma, A.; Lussier, J.G.; Ndiaye, K.; Hansen, P.J. Gonadotropin regulation of ankyrin-repeat and SOCS-box protein 9 (ASB9) in ovarian follicles and identification of binding partners. PLOS ONE 2019, 14, e0212571. [Google Scholar] [CrossRef] [PubMed]
- Ndiaye, K.; Fayad, T.; Silversides, D.W.; Sirois, J.; Lussier, J.G. Identification of Downregulated Messenger RNAs in Bovine Granulosa Cells of Dominant Follicles Following Stimulation with Human Chorionic Gonadotropin1. Biol. Reprod. 2005, 73, 324–333. [Google Scholar] [CrossRef]
- Nosratpour, S.; Ndiaye, K. Ankyrin-repeat and SOCS box-containing protein 9 (ASB9) regulates ovarian granulosa cells function and MAPK signaling. Mol. Reprod. Dev. 2021, 88, 830–843. [Google Scholar] [CrossRef]
- Kohroki, J.; Nishiyama, T.; Nakamura, T.; Masuho, Y. ASB proteins interact with Cullin5 and Rbx2 to form E3 ubiquitin ligase complexes. FEBS Lett. 2005, 579, 6796–6802. [Google Scholar] [CrossRef]
- Kostrhon S, Prabu JR, Baek K; et al. CUL5-ARIH2 E3-E3 ubiquitin ligase structure reveals cullin-specific NEDD8 activation. Nature Chemical Biology. 2021, 17, 1075–83. [Google Scholar] [CrossRef]
- Bano, I.; Soomro, A.S.; Abbas, S.Q.; Ahmadi, A.; Hassan, S.S.U.; Behl, T.; Bungau, S. A Comprehensive Review of Biological Roles and Interactions of Cullin-5 Protein. ACS Omega 2022, 7, 5615–5624. [Google Scholar] [CrossRef]
- Anasa, V.V.; Ravanan, P.; Talwar, P. Multifaceted roles of ASB proteins and its pathological significance. Front. Biol. 2018, 13, 376–388. [Google Scholar] [CrossRef]
- Huang, L.; Yuan, H.; Shi, S.; Song, X.; Zhang, L.; Zhou, X.; Gao, L.; Pang, W.; Yang, G.; Chu, G. CLOCK inhibits the proliferation of porcine ovarian granulosa cells by targeting ASB9. J. Anim. Sci. Biotechnol. 2023, 14, 1–17. [Google Scholar] [CrossRef]
- Russo, A.; Soh, U.J.K.; Paing, M.M.; Arora, P.; Trejo, J. Caveolae are required for protease-selective signaling by protease-activated receptor–1. Proc. Natl. Acad. Sci. 2009, 106, 6393–6397. [Google Scholar] [CrossRef]
- Heuberger, D.M.; Schuepbach, R.A. Protease-activated receptors (PARs): mechanisms of action and potential therapeutic modulators in PAR-driven inflammatory diseases. Thromb. J. 2019, 17, 1–24. [Google Scholar] [CrossRef]
- Vu TK, Hung DT, Wheaton VI, Coughlin SR. Molecular cloning of a functional thrombin receptor reveals a novel proteolytic mechanism of receptor activation. Cell 1991, 64, 1057–68. [Google Scholar] [CrossRef]
- Wang Q, Liu Q, Wang T, Yang H, Han Z, Zhang P. Endothelial cell protein C receptor promotes MGC803 gastric cancer cells proliferation and migration by activating ERK1/2. Medical Oncology. 2015;32.
- Livak, K.J.; Schmittgen, T.D. Analysis of relative gene expression data using real-time quantitative PCR and the 2−ΔΔCT Method. Methods 2001, 25, 402–408. [Google Scholar] [CrossRef]
- Crookenden, M.; Walker, C.; Kuhn-Sherlock, B.; Murray, A.; Dukkipati, V.; Heiser, A.; Roche, J. Technical note: Evaluation of endogenous control gene expression in bovine neutrophils by reverse-transcription quantitative PCR using microfluidics gene expression arrays. J. Dairy Sci. 2017, 100, 6763–6771. [Google Scholar] [CrossRef]
- Sweett, H.; Fonseca, P.A.S.; Suárez-Vega, A.; Livernois, A.; Miglior, F.; Cánovas, A. Genome-wide association study to identify genomic regions and positional candidate genes associated with male fertility in beef cattle. Sci. Rep. 2020, 10, 1–14. [Google Scholar] [CrossRef]
- Siddappa D, Beaulieu É, Gévry N, Roux PP, Bordignon V, Duggavathi R. Effect of the transient pharmacological inhibition of Mapk3/1 pathway on ovulation in mice. PLoS One, 2015; 10, e0119387. [Google Scholar]
- Li, N.; Zhou, Q.; Yi, Z.; Zhang, H.; Zhou, D. Ubiquitin protein E3 ligase ASB9 suppresses proliferation and promotes apoptosis in human spermatogonial stem cell line by inducing HIF1AN degradation. Biol. Res. 2023, 56, 1–14. [Google Scholar] [CrossRef] [PubMed]
- Huang, L.; Yuan, H.; Shi, S.; Song, X.; Zhang, L.; Zhou, X.; Gao, L.; Pang, W.; Yang, G.; Chu, G. CLOCK inhibits the proliferation of porcine ovarian granulosa cells by targeting ASB9. J. Anim. Sci. Biotechnol. 2023, 14, 1–17. [Google Scholar] [CrossRef]
- INVALID CITATION !!! (17, 18).
- Cheng, Y.; Kawamura, K.; Deguchi, M.; Takae, S.; Mulders, S.M.; Hsueh, A.J.W. Intraovarian Thrombin and Activated Protein C Signaling System Regulates Steroidogenesis during the Periovulatory Period. Mol. Endocrinol. 2012, 26, 331–340. [Google Scholar] [CrossRef]
- Roach, L.E.; Petrik, J.J.; Plante, L.; LaMarre, J.; Gentry, P.A. Thrombin Generation and Presence of Thrombin Receptor in Ovarian Follicles1. Biol. Reprod. 2002, 66, 1350–1358. [Google Scholar] [CrossRef] [PubMed]
- Liu, P.; Verhaar, A.P.; Peppelenbosch, M.P. Signaling Size: Ankyrin and SOCS Box-Containing ASB E3 Ligases in Action. Trends Biochem. Sci. 2019, 44, 64–74. [Google Scholar] [CrossRef]
- Schuermann Y, Rovani MT, Gasperin B, Ferreira R, Ferst J, Madogwe E, et al. ERK1/2-dependent gene expression in the bovine ovulating follicle. Sci Rep. 2018; 8, 16170. [Google Scholar]
- Panigone, S.; Hsieh, M.; Fu, M.; Persani, L.; Conti, M. Luteinizing Hormone Signaling in Preovulatory Follicles Involves Early Activation of the Epidermal Growth Factor Receptor Pathway. Mol. Endocrinol. 2008, 22, 924–936. [Google Scholar] [CrossRef]
- Chalmers, C.J.; Balmanno, K.; Hadfield, K.; Ley, R.; Cook, S.J. Thrombin inhibits Bim (Bcl-2-interacting mediator of cell death) expression and prevents serum-withdrawal-induced apoptosis via protease-activated receptor 1. Biochem. J. 2003, 375, 99–109. [Google Scholar] [CrossRef]
- Donovan, F.M.; Pike, C.J.; Cotman, C.W.; Cunningham, D.D. Thrombin Induces Apoptosis in Cultured Neurons and Astrocytes via a Pathway Requiring Tyrosine Kinase and RhoA Activities. J. Neurosci. 1997, 17, 5316–5326. [Google Scholar] [CrossRef]
- Hirota, Y.; Osuga, Y.; Yoshino, O.; Koga, K.; Yano, T.; Hirata, T.; Nose, E.; Ayabe, T.; Namba, A.; Tsutsumi, O.; et al. Possible Roles of Thrombin-Induced Activation of Protease-Activated Receptor 1 in Human Luteinized Granulosa Cells. J. Clin. Endocrinol. Metab. 2003, 88, 3952–3957. [Google Scholar] [CrossRef]
- Zain, J.; Huang, Y.Q.; Feng, X.; Nierodzik, M.L.; Li, J.J.; Karpatkin, S. Concentration-dependent dual effect of thrombin on impaired growth/apoptosis or mitogenesis in tumor cells. Blood 2000, 95, 3133–8. [Google Scholar] [CrossRef]
- Flynn, A.N.; Buret, A.G. Proteinase-activated receptor 1 (PAR-1) and cell apoptosis. Apoptosis 2004, 9, 729–737. [Google Scholar] [CrossRef] [PubMed]
- Mori; Tokuoka, M. ; Miyoshi, N.; Hitora, T.; Mimori, K.; Tanaka, F.; Shibata, K.; Ishii, H.; Sekimoto, M.; Doki, Y.; et al. Clinical significance of ASB9 in human colorectal cancer. Int. J. Oncol. 2010, 37, 1105–1111. [Google Scholar] [CrossRef]
- Uranbileg, B.; Enooku, K.; Soroida, Y.; Ohkawa, R.; Kudo, Y.; Nakagawa, H.; Tateishi, R.; Yoshida, H.; Shinzawa, S.; Moriya, K.; et al. High ubiquitous mitochondrial creatine kinase expression in hepatocellular carcinoma denotes a poor prognosis with highly malignant potential. Int. J. Cancer 2013, 134, 2189–2198. [Google Scholar] [CrossRef] [PubMed]
- Wang, H.; Ubl, J.J.; Stricker, R.; Reiser, G. Thrombin (PAR-1)-induced proliferation in astrocytes via MAPK involves multiple signaling pathways. Am. J. Physiol. Physiol. 2002, 283, C1351–C1364. [Google Scholar] [CrossRef]
Figure 1.
PAR1 and ASB9 regulation in granulosa cells (GC) after FSH, LH and thrombin treatments. (A and B) RT‒qPCR analyses of in vitro samples indicated greater expression of PAR1 mRNA in thrombin-treated cells, while treatment with LH significantly decreased PAR1 expression (b, c, p<0.05). PAR1 mRNA expression increased in cells treated with the combination of FSH and thrombin (b, c, p<0.05). (C and D) RT‒qPCR analyses of in vitro samples showed greater expression of ASB9 mRNA in cells treated with LH than in control cells, however this expression was greater in the combination of LH with thrombin (p<0.05). ASB9 mRNA expression decreased in the presence of thrombin or FSH, although the combination of FSH and thrombin resulted in stronger ASB9 expression than treatment with FSH or thrombin alone (d, p<0.05). CTRL, control; FSH, follicle-stimulating hormone; LH, luteinizing hormone; Thr, thrombin (n = 4 repetitions for each sample). *p<0.05. ANOVA, Tukey-Kramer multiple comparison.
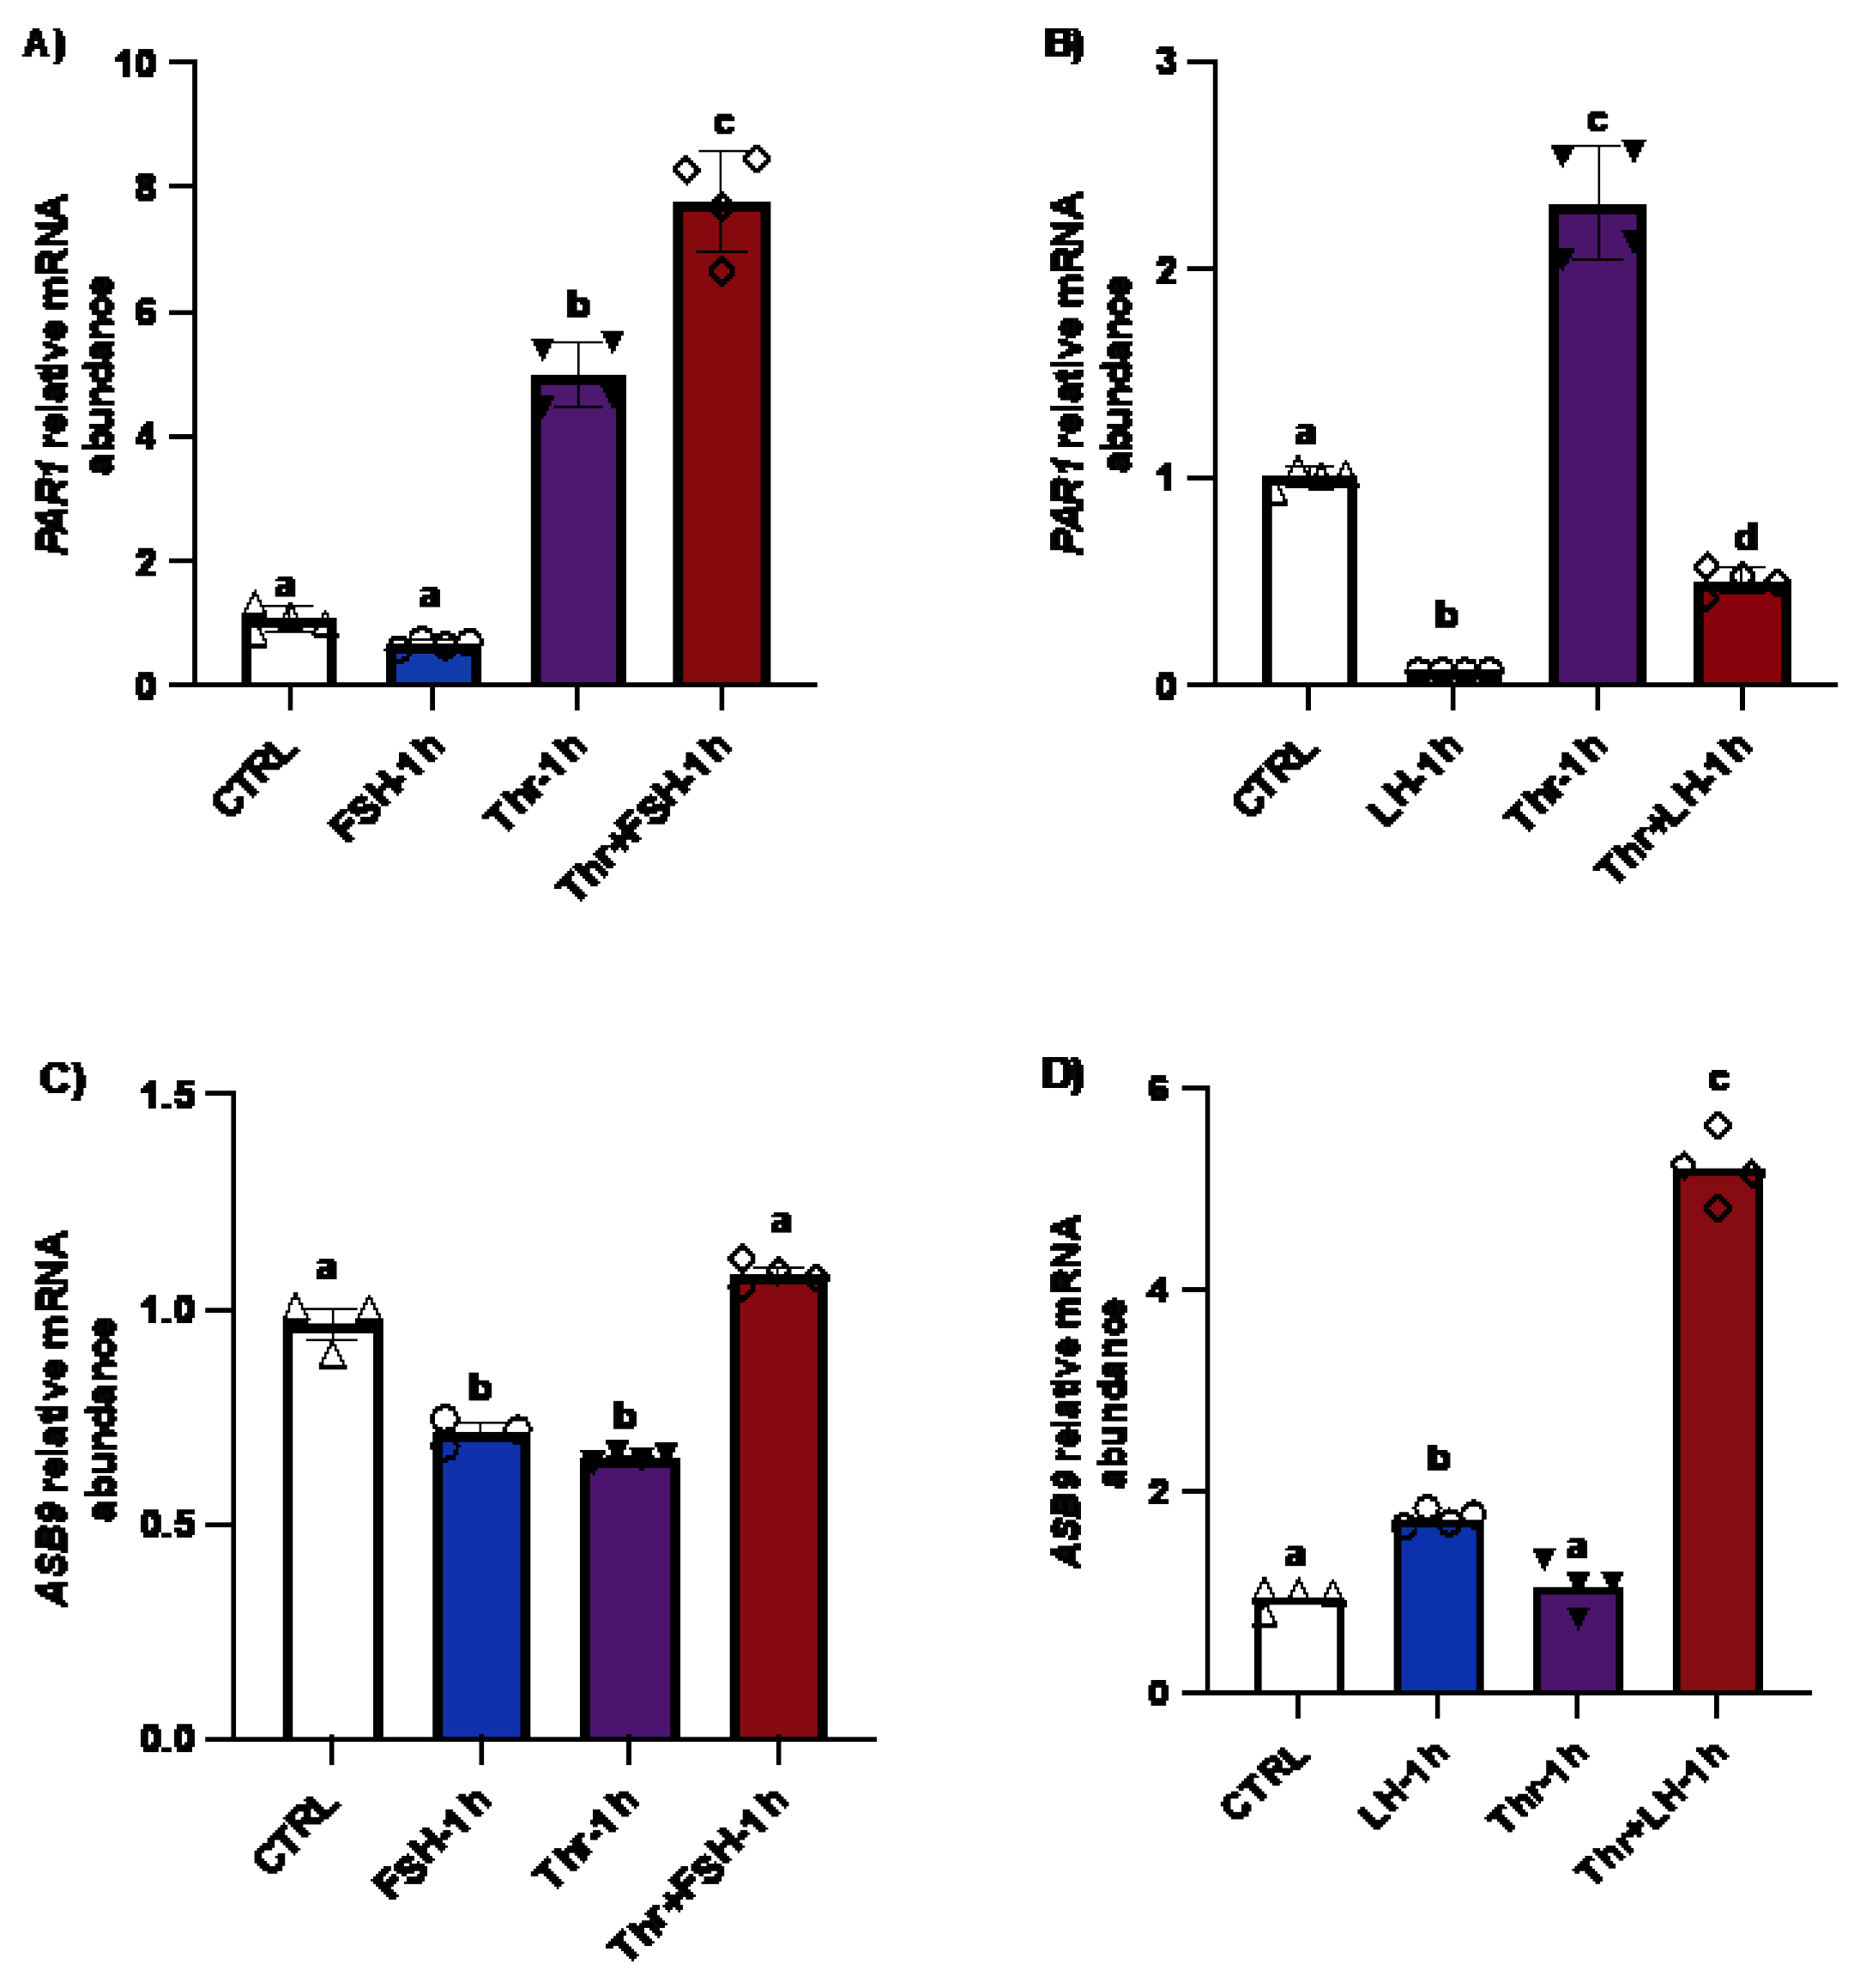
Figure 2.
ASB9 and PAR1 regulation in granulosa cells (GC) after LH and thrombin treatments. (A) Western blot analyses of in vitro samples revealed stronger ASB9 induction at 12 h post-LH treatment than at 30 min and 6h post-LH treatment. The combination of LH and thrombin after 12 h significantly increased ASB9 expression compared to that in the separate treatments (p<0.05). Beta-actin was used as a control. RT‒qPCR analyses of in vitro samples showed increased ASB9 mRNA expression in cells treated with LH at 6h and 12h (B and C). In contrast, thrombin treatment had no effect on ASB9 expression either at 6h or at 12h as compared to the control (p<0.05). Moreover, the results indicated greater expression of PAR1 mRNA in cells treated with thrombin, while LH treatment significantly decreased PAR1 expression at both 6 h (p<0.05) and 12 h (p<0.05) (D and E). In vitro samples for RT‒qPCR: CTRL, control; LH, luteinizing hormone; Thr, thrombin; ACTB, β-actin; h, hours; n = 3 repetitions for each sample. Different letters denote significant differences among samples (p<0.05). ANOVA, Tukey-Kramer multiple comparison.
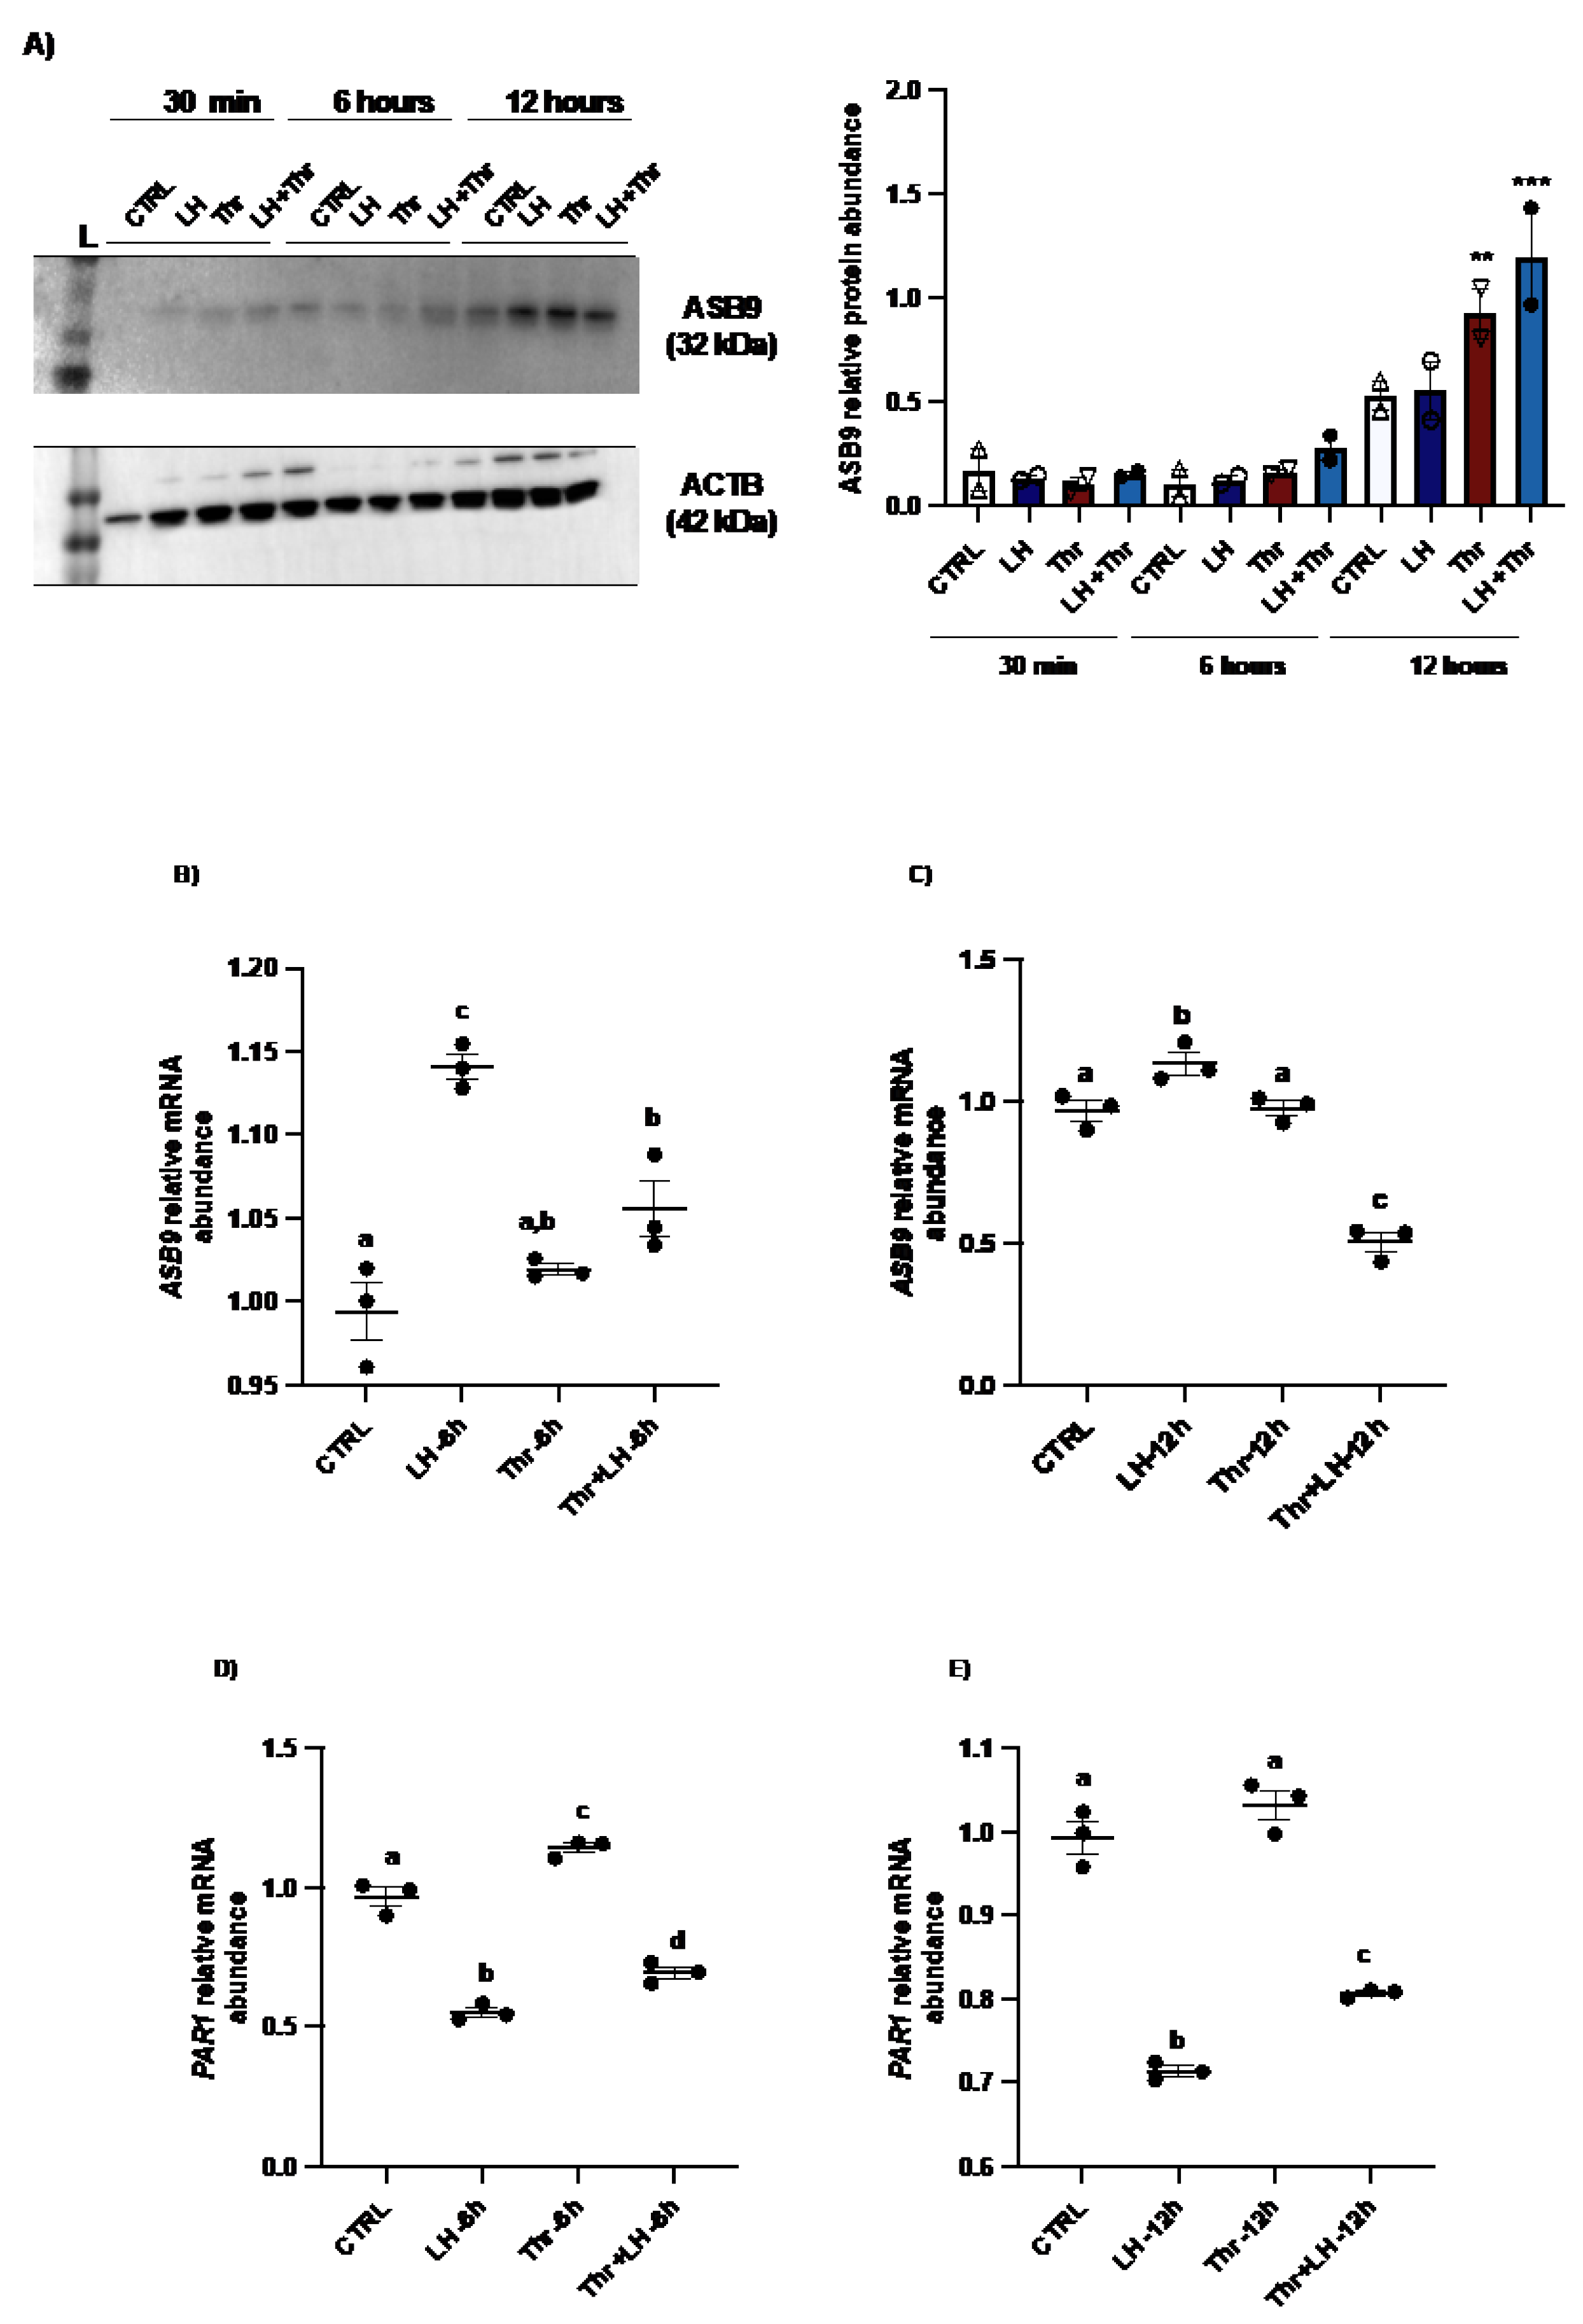
Figure 3.
PAR1 protein expression and regulation in bovine granulosa cells post-LH and thrombin treatments. Western blot analyses of in vitro samples showed that PAR1 expression remained unchanged (3A). However, qPCR data showed that PAR1 mRNA expression increased significantly in thrombin-treated GC at 15 min (3B). In vitro samples: CTRL, control; LH, luteinizing hormone; Thr, thrombin; min, minutes. n = 3 repetitions for each sample.

Figure 4.
MAPK3/1 protein expression and regulation in bovine granulosa cells post-LH and thrombin treatments. Western blot analyses using in vitro samples showed an increase in MAPK3/1 phosphorylation in GC treated with thrombin (4A and 4B). CTRL, control; LH, luteinizing hormone; Thr, thrombin; ACTB, β-actin; min, minutes; n = 3 repetitions for each sample. Different letters denote significant differences among samples within each time point (p<0.05). ANOVA, Tukey-Kramer multiple comparison.
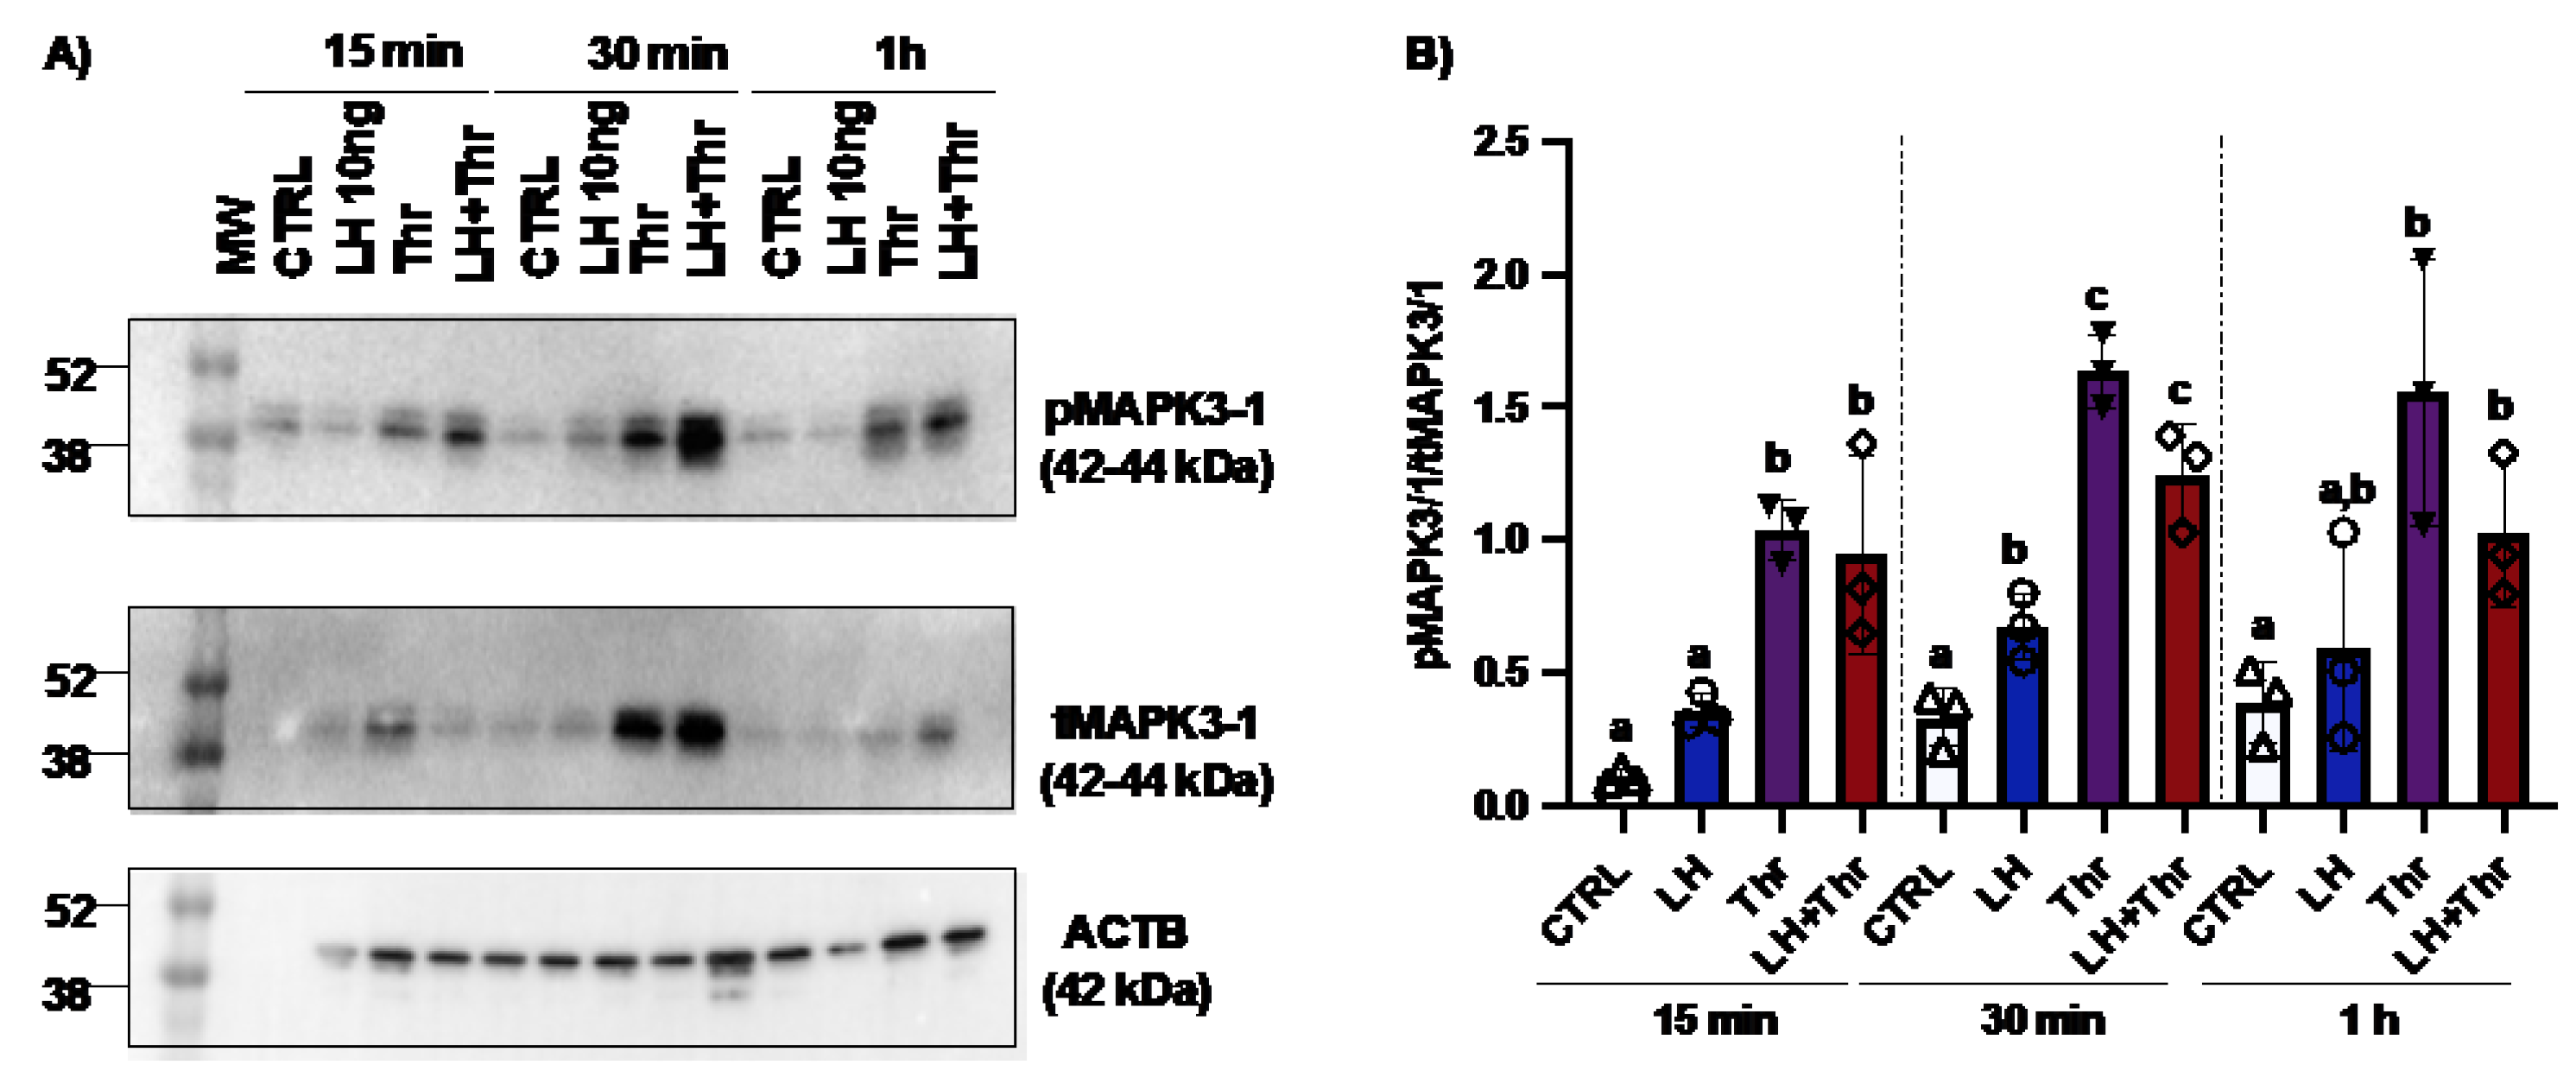
Figure 5.
Expression and regulation of the steroidogenesis markers TNFAIP6 and AREG as well as CYP11A1, CYP19A1 and StAR in GC after LH and thrombin treatments. RT‒qPCR analyses of in vitro samples revealed that CYP11A1 mRNA expression (G and H) increased in the presence of LH or thrombin at 6 and 12h but decreased in the presence of LH combined with thrombin at 12h (p<0.05). StAR mRNA expression (I and J) decreased in cells treated with LH at 6h but increased in cells treated with LH or thrombin at 1 h. Combined treatment with LH + thrombin reduced StAR expression at 6h but not at 12h (p<0.05). The results showed greater expression of TNFAIP6 (A and B) and AREG (C and D) mRNAs and LH response genes in cells treated with LH at 6 and 12h, while thrombin decreased their expression at 12 h (p<0.05). CYP19A1 mRNA expression was reduced when cells were treated with LH at 6 and 12h and increased in the presence of thrombin at 6 and 12h (p<0.05). CTRL, control; LH, luteinizing hormone; Thr, thrombin; n = 3 repetitions for each sample. Different letters denote significant differences among samples (p<0.05). ANOVA, Tukey-Kramer multiple comparison.
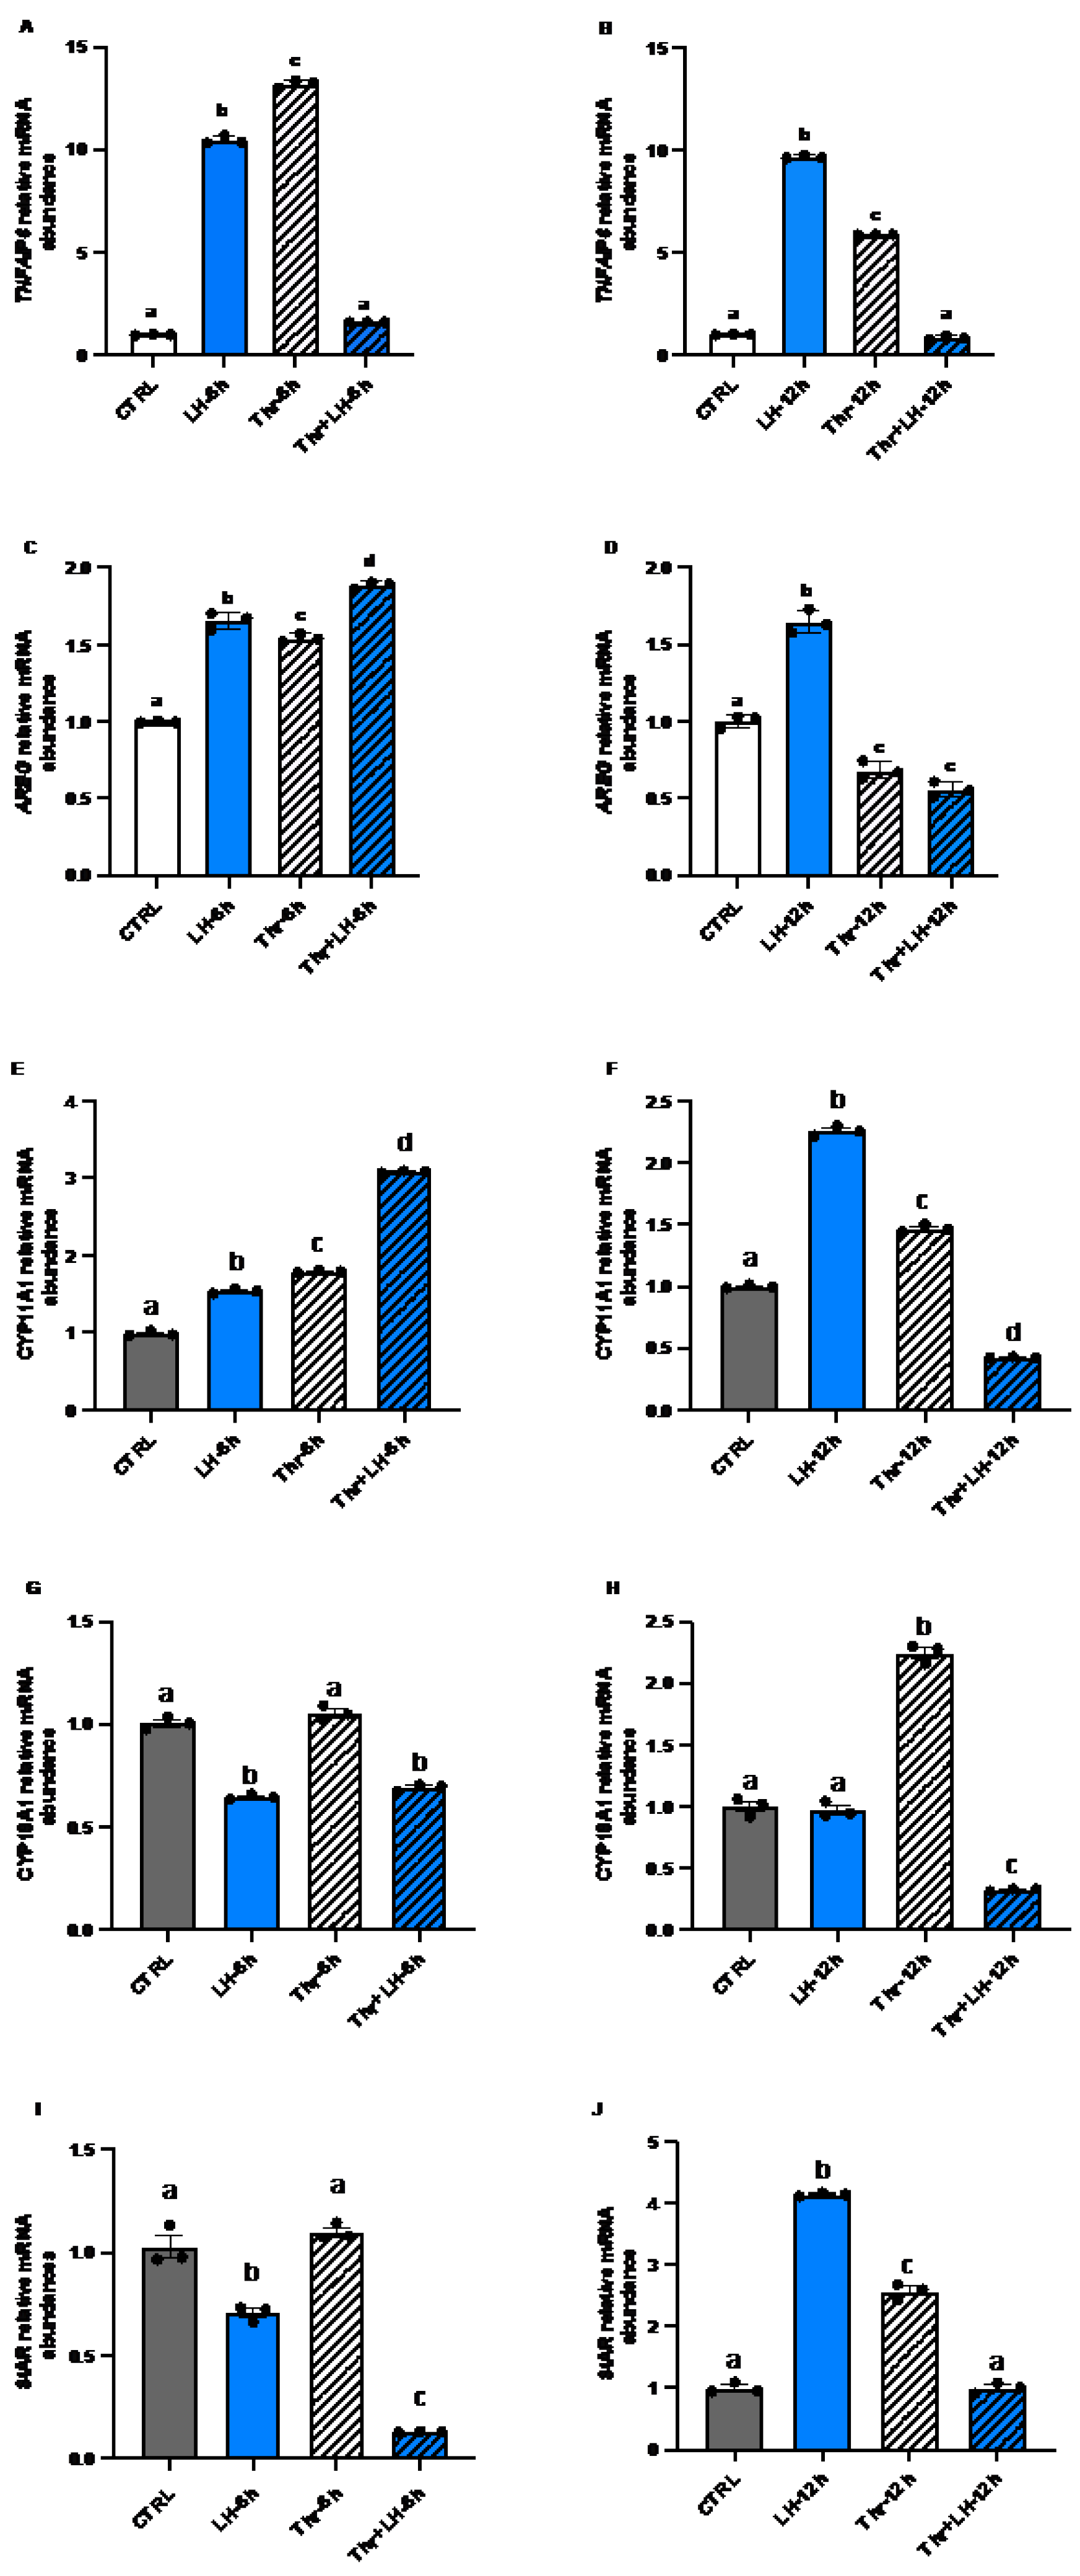
Figure 6.
Effects of ASB9 overexpression and LH and thrombin treatments on granulosa cell (GC) proliferation and apoptosis. (A) Proliferation assay (MTS assay) analysis showed that the number of GC decreased following ASB9 overexpression, while the presence of thrombin did not alter the effect of ASB9 (p<0.05). (B and C) RT‒qPCR analyses showed that treatment with LH resulted in a significant decrease in CCND2 mRNA expression after 12h (p<0.05), while treatment with thrombin for 6h or 12h resulted in an increase in CCND2 (p<0.05). (D and E) RT‒qPCR analyses of in vitro samples showed that BAX expression was reduced after thrombin treatment (c, d, p<0.05) and increased in the presence of LH at 12 hours (b, p<0.05). CTRL, control; LH, luteinizing hormone; Thr, thrombin; +ASB9, ASB9 overexpression; n = 4 repetitions for each sample. Different letters denote significant differences (p<0.05). ANOVA, Tukey-Kramer multiple comparison.
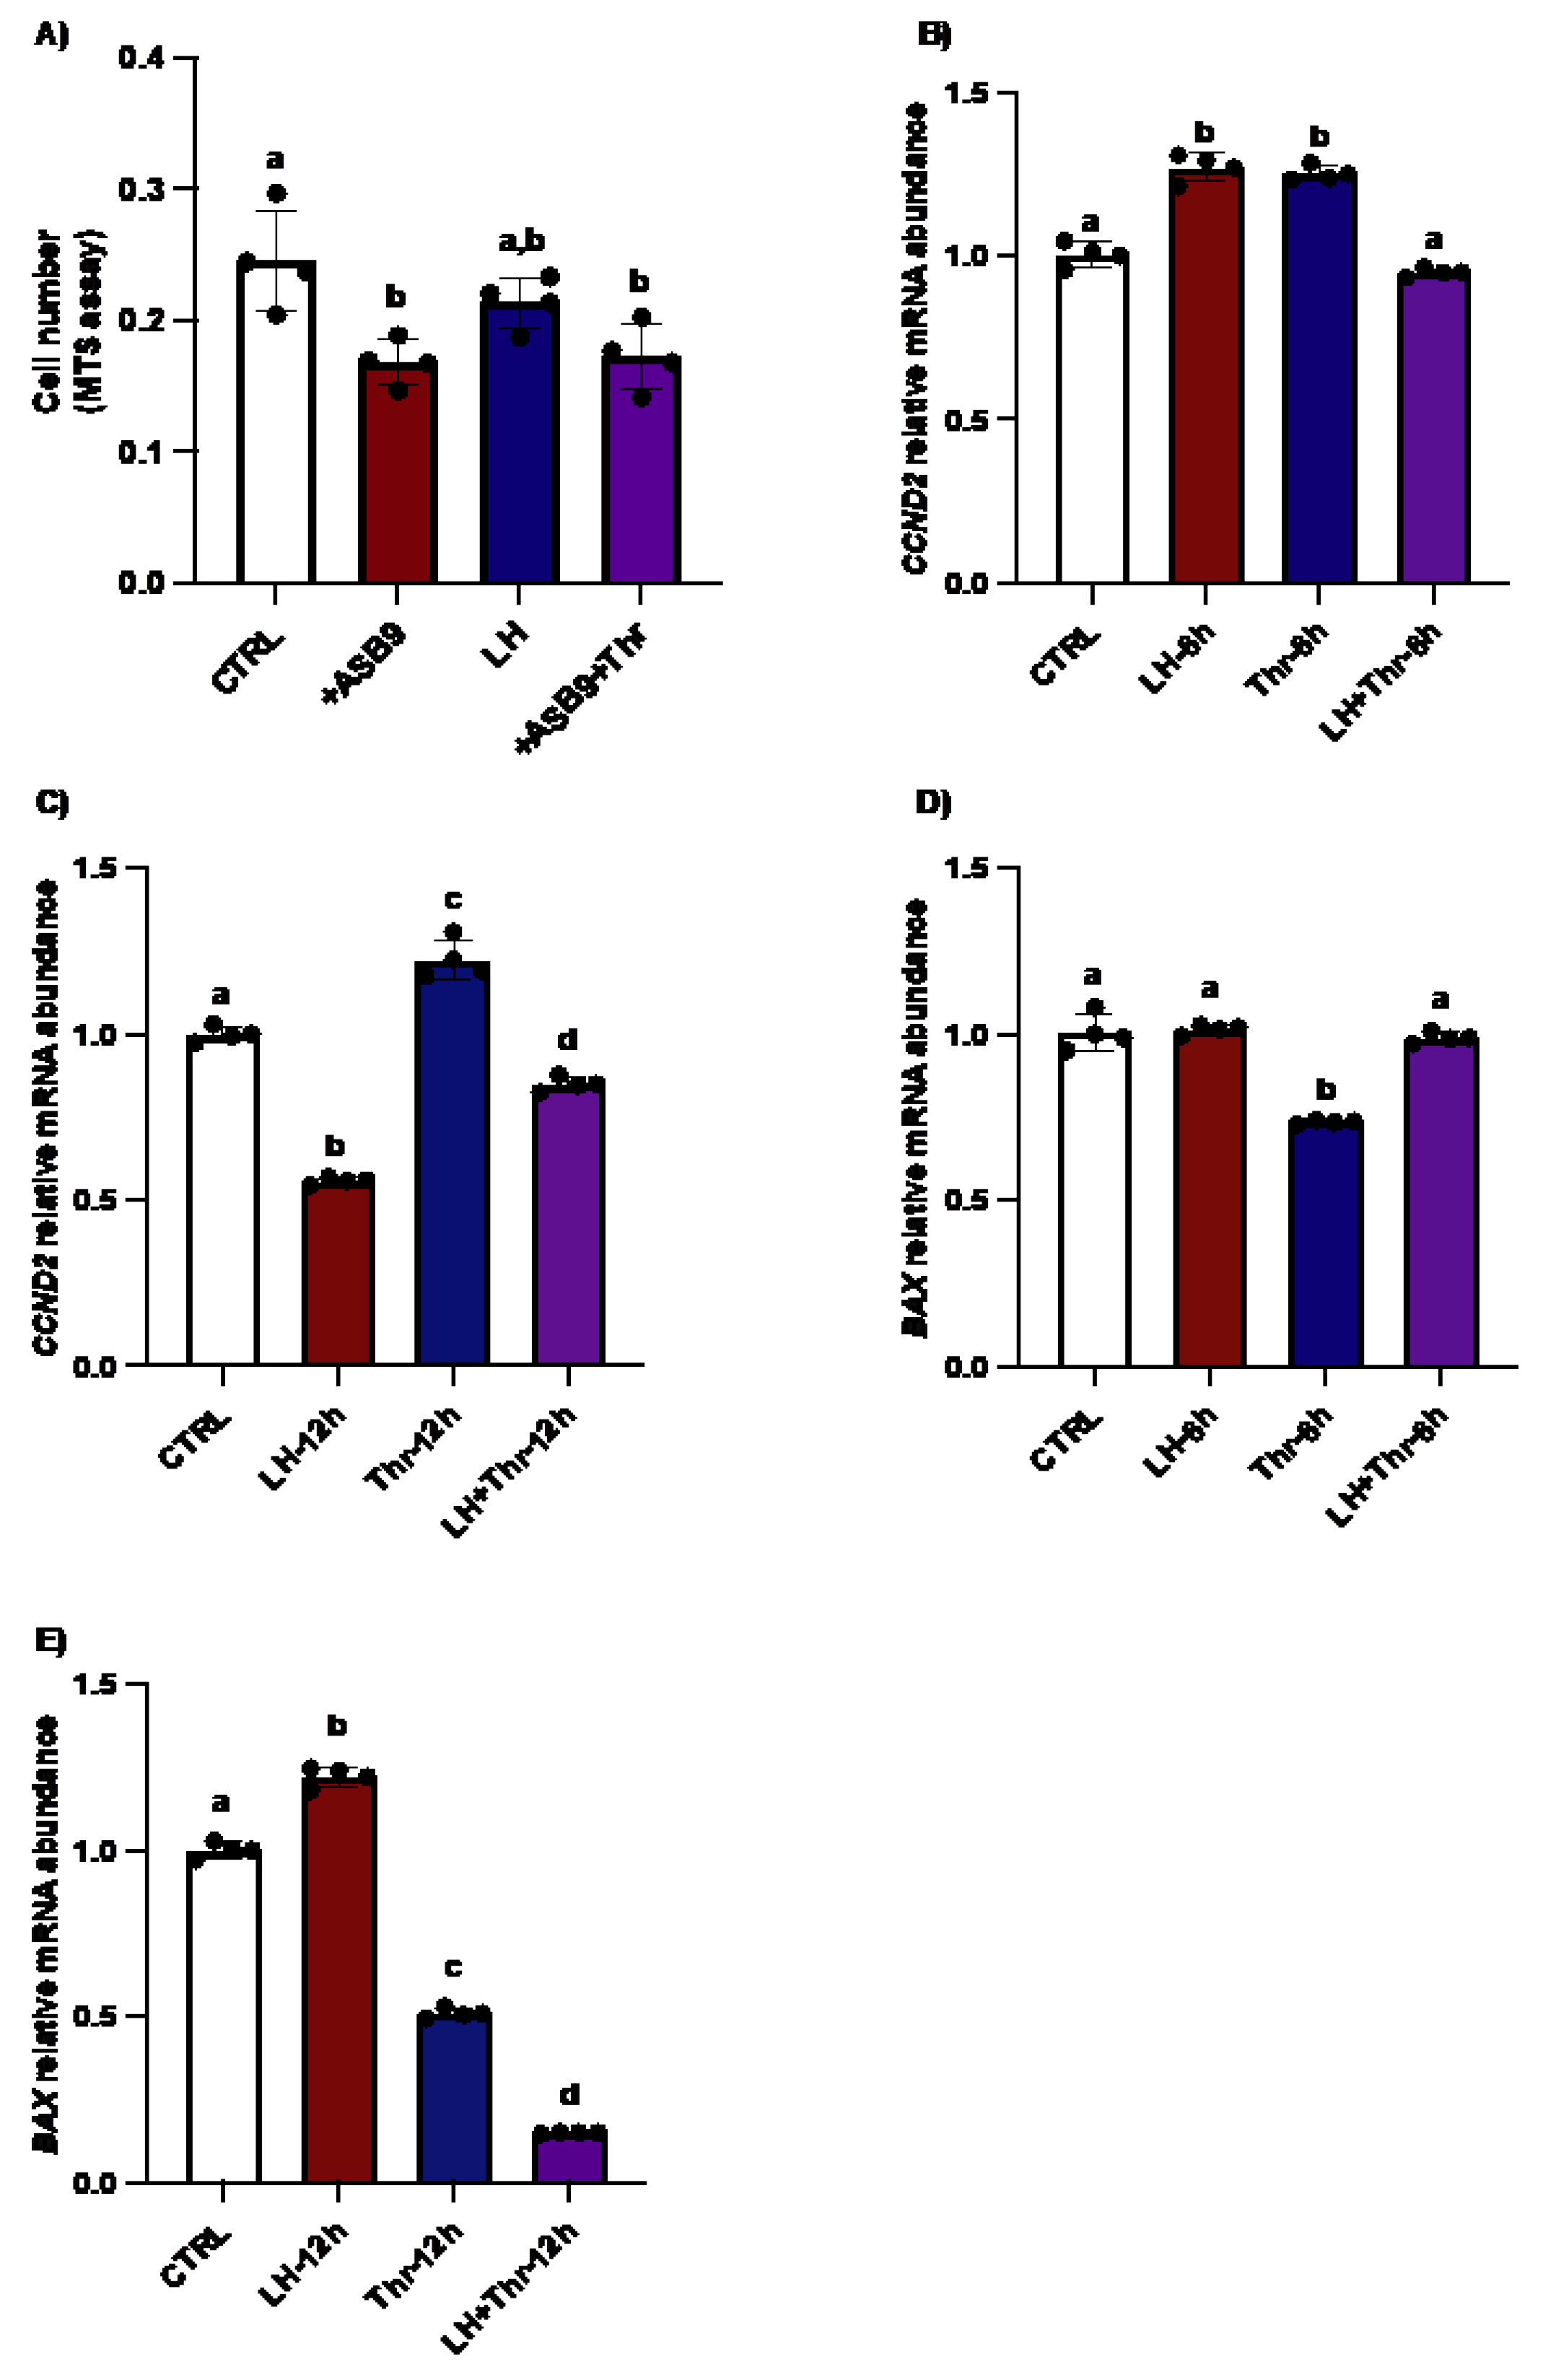
Figure 7.
Proposed mechanism of action of ASB9 in GC on PAR1-induced cell proliferation. PAR1, which couples to G proteins, activates different intracellular signaling pathways, including the MAPK3/1 pathway, leading to cell proliferation. Following induction by LH/hCG, ASB9 binds to and inhibits PAR1, likely through the ubiquitin proteasome pathway of protein degradation, resulting in the inhibition of the PAR1-activated MAPK pathway and the reduction/blockade of granulosa cell proliferation. Granulosa cells expressing ASB9 after LH induction stop proliferating and instead move toward differentiation, which was also evidenced by a decrease in CCND2 expression. Additionally, we suspect that ASB9 may contribute to cell death by upregulating the expression of proapoptotic markers, as evidenced by the data demonstrating increased BAX expression. Thrombin stimulation of PAR1 leads to the activation of different signaling pathways, such as the MAPK3/1, AKT and P38 pathways. In granulosa cells, thrombin could block the negative action of ASB9, enabling increased proliferation/survival of granulosa cells through PAR1 and MAPK3/1 activation. PAR-1, protease-activated receptor-1; MAPK3/1, mitogen-activated protein kinase 3/1 (ERK1/2); JNK, c-Jun N-terminal kinase; JAK, Janus activated kinase; STAT, signal transducer and activator of transcription. AKT, protein kinase B; P38, p38 mitogen-activated protein kinase; GC, granulosa cell.
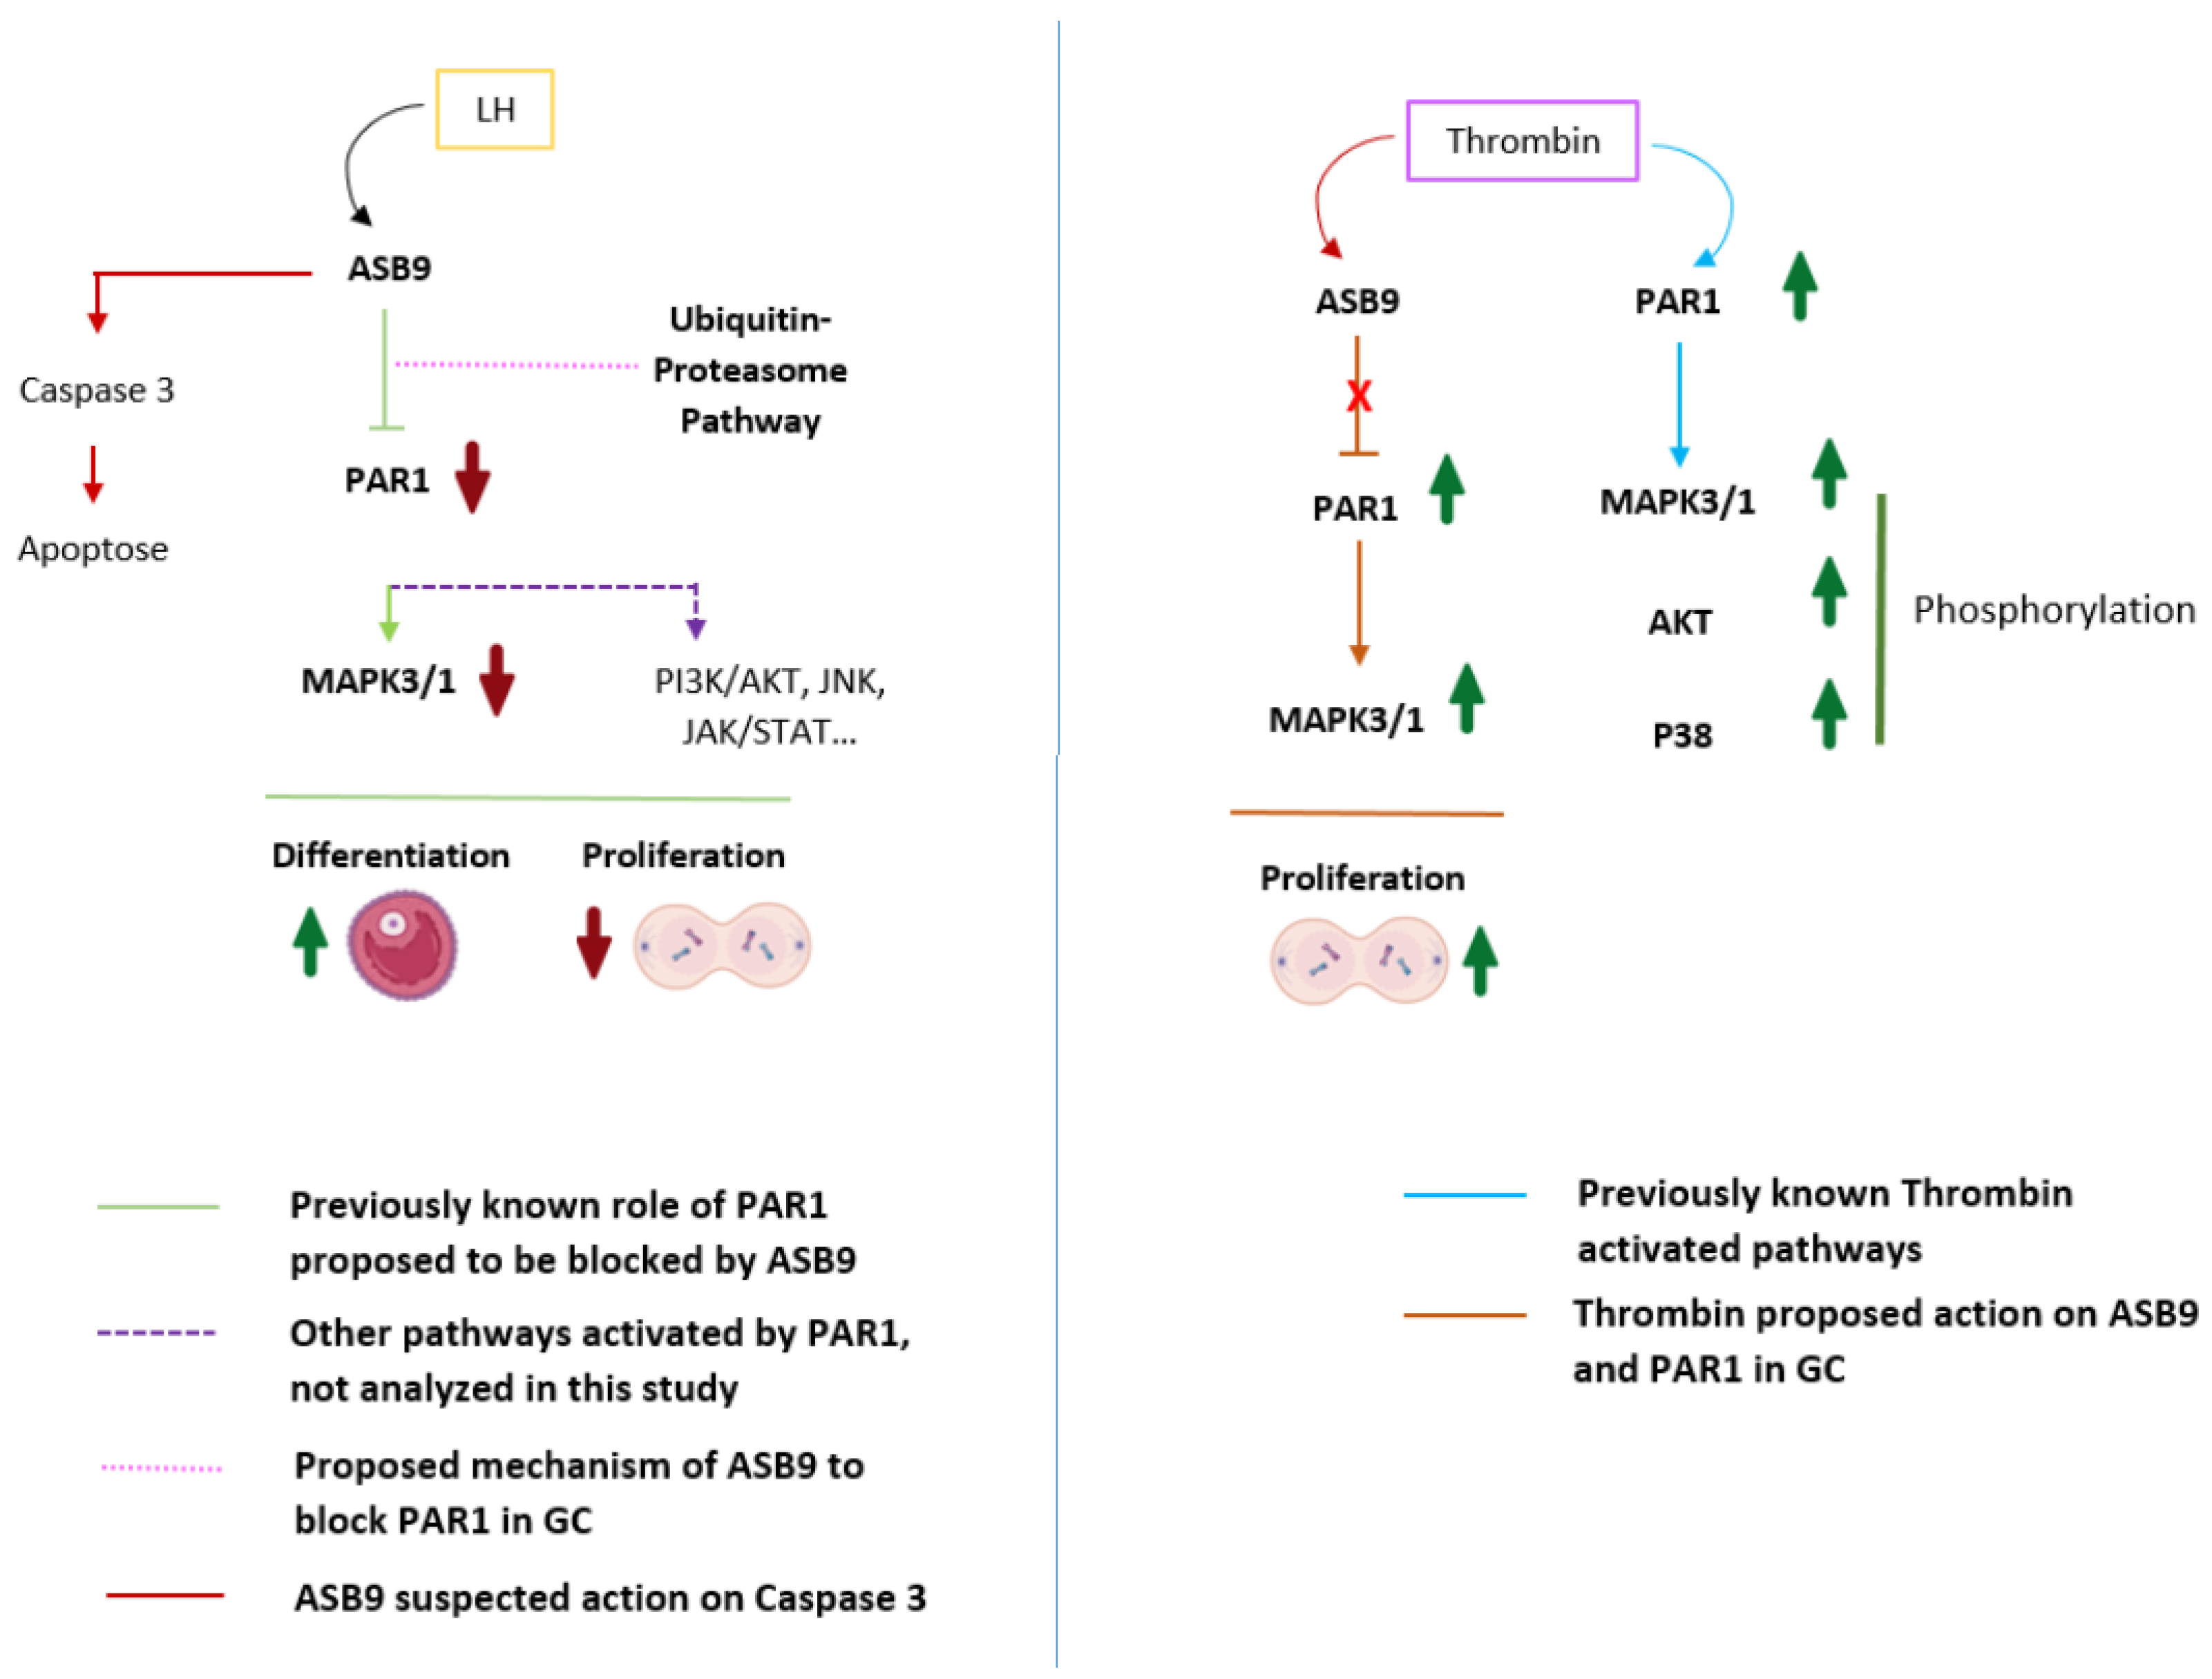

Table 1.
Primers used for qPCR analysis of Bos taurus gene expression.
| Gene name | Primer sequences (5`- 3`)a | Accession # | AS (bp) |
|---|---|---|---|
| ASB9 | Fwd: TCACTGCAGATCGTGTGTCTC;123456789Rv: TCTTAGCAGCTTCGTGGATGG | AY438595 | 165 |
| PAR1 | Fwd: GCCTGGCTGACTGTCTTTATC;123456789Rv: AGCACACACACGAAGAGTACG | NM_001103097 | 170 |
| AREG | Fwd: CTTTCGTCTCTGCCATGACCTT;123456789Rv: CGTTCTTCAGCGACACCTTCA | NM_001099092.1 | 192 |
| CYP19A1 | Fwd: ATCTGTGCTGATTCCATCACCAAG;123456789Rv: GAAGGAGAGCTTGCCATGCATC | NM_176644.2 | 167 |
| CYP11A1 | Fwd: GTGCAAGTGGCCATCTATGCC;123456789Rv: GTGTCCACGTCACCGATATGC | NM_174305.1 | 161 |
| TNFAIP6 | Fwd: CTCCAGGCTTCCCAAATGAGT;123456789Rv: GCTGGGTCATCTTCAAGGTCA | NM_001007813 | 118 |
| StAR | Fwd: GGAAAAGACACGGTCATCACT;123456789Rv: AGTTTGGTCCTTGAGGGACTT | NM_174189.3 | 177 |
| CCND2 | Fwd: GGGCAAGTTGAAATGGAACCT;123456789Rv: TGGCAAACTTGAAGTCAGTGG | NM_001076372 | 155 |
| BAX | Fwd: TGTCGCCCTTTTCTACTTTGC;123456789Rv: CAAAGATGGTCACTGTCTGCC | NM_173894 | 200 |
| RPL19 | Fwd:GACCAATGAAATCGCCAATGC;123456789Rv: ACCTATACCCATATGCCTGCC | NM_001040516 | 154 |
Abbreviations: AS, amplicon size (base pairs); Fwd, forward primer; quantitative reverse transcription polymerase chain reaction; Rv, reverse primer. a All primers were designed and validated by the authors. Each primer was used at a final concentration of 600 nM.
Disclaimer/Publisher’s Note: The statements, opinions and data contained in all publications are solely those of the individual author(s) and contributor(s) and not of MDPI and/or the editor(s). MDPI and/or the editor(s) disclaim responsibility for any injury to people or property resulting from any ideas, methods, instructions or products referred to in the content. |
© 2025 by the authors. Licensee MDPI, Basel, Switzerland. This article is an open access article distributed under the terms and conditions of the Creative Commons Attribution (CC BY) license (http://creativecommons.org/licenses/by/4.0/).
Copyright: This open access article is published under a Creative Commons CC BY 4.0 license, which permit the free download, distribution, and reuse, provided that the author and preprint are cited in any reuse.


