
Submitted:
12 August 2025
Posted:
13 August 2025
You are already at the latest version
Abstract
The European sweet chestnut, Castanea sativa Mill., is an ecologically and culturally significant Croatian forest tree. However, its genetic diversity and population structure re-main insufficiently understood. This research examined three chestnut populations (PET, HRK, and BAC) from Zrin Mountain, Croatia’s largest continuous chestnut area, utilizing seven nuclear SSR markers. In order to assess the genetic diversity, and population structure, 153 individuals were genotyped. The study revealed that all populations exhibited a moderate level of genetic variety (mean He = 0.571), with the BAC population exhibiting the highest allelic richness and number of private alleles. AMOVA revealed that 67% of the total genetic variance resided within individuals and only 3% among populations. Population differentiation was low to moderate (FST = 0.064; PhiPT = 0.146), with high inferred gene flow (Nm = 7.48). The STRUCTURE and PCoA studies showed that the HRK population was the most genetically different. In contrast, PET and BAC had in-creased genetic similarity and integration. These findings emphasize the relevance of gene flow among chestnut stands and local genetic resources. The findings establish a founda-tion for the sustainable management and conservation planning of Croatian chestnut populations in the context of a broader European environment.
Keywords:
Castanea sativa
; conservation genetics
; genetic diversity
; gene flow
; microsatellites (SSRs)
1. Introduction
The European sweet chestnut (Castanea sativa Mill.) is a broadleaf tree species indigenous to Europe. It covers approximately 2.5 million hectares, stretching from the Atlantic coast of Portugal across central and southern Europe to the Black Sea, with around 1.7 million hectares concentrated in southern Europe [1,2]. It thrives in temperate climates with well-drained, acidic soils and is valued for its edible nuts, durable timber, and ornamental appeal [1]. Chestnut populations are shaped by both natural processes and centuries of human activity, resulting in a mosaic of wild and cultivated stands. Old groves and coppice forests are common in central and southern Europe, where regeneration occurs through a combination of natural seed dispersal and human influence. Coppiced stands, in particular, are dominated by younger trees due to periodic cutting and resprouting cycles [1,3,4,5]. Successful regeneration depends on competition, climate, and the prevalence of diseases.
Over the past two centuries, chestnut has faced severe challenges, including habitat fragmentation and the introduction of invasive pathogens and pests such as chestnut blight (Cryphonectria parasitica) [6], chestnut gall wasp (Dryocosmus kuriphilus) [7], and root and ink diseases caused by Phytophthora species [8]. Additionally, the expansion of cultivated varieties into wild populations has raised concerns about genetic integrity [9,10]. These pressures have intensified interest in the genetic diversity and resilience of natural chestnut populations [11].
In Croatia, chestnut is an ecologically and culturally significant noble deciduous tree, covering approximately 136,000 hectares in mixed and pure stands—around 4.9% of the nation’s forest area [12]. It forms four main forest communities: Querco-castanetum sativae Horvat 1938, Aposeri foetide-Castanetum sativae ass. nova, Helleboro multifidi-Castanetum sativae Anić 1953 nom. nov., and Castaneo sativae-Fagetum Marinček & Župančič 1995 [13]. Chestnut stands are scattered across continental Croatia, the Istrian Peninsula, and the islands of Krk and Cres, with the largest continuous stands found on Zrin and Petar Mountains [14,15]. The remarkable quality and health of these forests can be traced to historical factors. For centuries, Zrin and Petar Mountains served as Europe’s military frontier against the Ottoman Empire, during which diverse ethnic groups—including Croats, Vlachs, Serbs, Germans, and Hungarians, introduced resilient agroforestry practices including chestnut cultivation [16]. In recent decades, chestnut forest area has declined due to widespread dieback, removal of infected trees, and reduced reliance on chestnut timber for traditional uses [17,18].
Genetic diversity and population structure in forest trees have commonly been investigated using microsatellite markers, simple sequence repeats (SSRs), valued for their high polymorphism, codominant inheritance, and reproducibility [19]. The earliest SSR applications in forest trees date to the 1990s with Pinus radiata [20] and were subsequently extended to multiple Quercus species [21,22,23,24,25,26]. In chestnut (Castanea sativa), SSR markers were first introduced by Buck et al. and by Marinoni et al. in 2003 [27,28]. Two marker series, the EMCs loci (e.g., EMCs-4, EMCs-15, EMCs-25, EMCs-32, EMCs-38) and the CsCAT loci (e.g., CsCAT1, CsCAT3, CsCAT6, CsCAT16) have since found widespread use in chestnut genetics. These SSR loci are effective tools for evaluating genetic diversity, quantifying population differentiation, and identifying cultivars in both wild and cultivated chestnut populations across Europe [29,30,31,32,33,34]
Recent studies have revealed a rich genetic landscape within Croatian chestnut populations. Idžojtić et al. [35] identified 11 multilocus genotypes among 72 individuals of the traditional “Lovran Marron” variety. Prgomet et al. [36] reported 62 alleles across 10 SSR loci in 17 wild trees from Istria and Primorsko-Goranska County. Poljak et al. [37] encompassing populations from Croatia and the surrounding region, found three genetic clusters across central Europe and the western Balkans, shaped by glacial refugia and human-mediated gene flow. These findings highlight the genetic uniqueness of Croatian chestnut germplasm and underscore the need for targeted conservation measures.
The primary objective of this study is to enhance understanding of the genetic diversity and structure of chestnut populations on Zrin Mountain that is the part of the largest area of chestnut distribution in Croatia. Using a combination of EMC and CsCAT markers, we aim to place Croatian chestnut populations in a broader European context. Insights from this research are expected to support informed conservation strategies, especially in light of current threats such as climate change, invasive pathogens, and ongoing human pressures.
2. Materials and Methods
2.1. Study Area and Plant Material Collection
The study was conducted on Zrin Mountain in central Croatia, where three chestnut locations—PET, HRK, and BAC—were selected based on their inclusion in previous research and monitoring projects. The PET and HRK sites host permanent monitoring plots established within the framework of the project “Protection of Sweet Chestnut Forests” [38]. The BAC locality has been part of the “Experimental Chestnut Grove” project [39]. All three sites are characterized by uneven-aged coppice stands dominated by naturally regenerating chestnut trees.
Leaf material was collected using a simple random sampling approach. Two to three healthy, fully expanded leaves were sampled from each tree at a minimum spacing of 20 meters to reduce the likelihood of sampling closely related individuals. Each sampled tree was labeled with a unique identifier in ascending numerical order, starting at 1. The collected leaf samples were immediately stored in plastic bags containing 12 g of silica gel (Kemika, Croatia) to ensure rapid desiccation and preservation of DNA integrity. Samples were then transported to the laboratory for molecular analysis. Detailed information about the sampled trees is provided in Figure 1 and Table 1. The map generation was performed using QGIS version 2.16, ‘Nødebo.’
2.2. DNA Isolation, SSR Amplification, and Analysis
Genomic DNA was extracted from approximately 0.1 g of dried leaf tissue. For samples collected in 2011 and 2013, DNA was isolated using a modified CTAB protocol [40], in which the extraction buffer was supplemented with 2% polyvinylpyrrolidone (PVP). DNA from samples collected in 2016 was extracted using the NucleoSpin Plant II kit (Macherey-Nagel, Düren, Germany), following the manufacturer’s instructions.DNA concentration was quantified spectrophotometrically at 260 nm (A260) using a BioSpec-nano spectrophotometer (Shimadzu, Kyoto, Japan). Concentrations ranged from 111.86 ng/µL to 4070.93 ng/µL for CTAB-extracted samples and from 1.75 ng/µL to 83.44 ng/µL for samples extracted with the commercial kit. DNA quality was evaluated via electrophoresis in 0.8% agarose gel (Sigma-Aldrich, Massachusetts, USA) prepared in 1× TBE buffer and stained with SYBR™ Safe DNA Gel Stain (Thermo Fisher Scientific, Massachusetts, USA). DNA samples (100 µL) were stored in 2 mL Eppendorf microcentrifuge tubes at −20 °C until use.
Initial SSR amplification was performed using fifteen fluorescently labeled SSR primer pairs (Applied Biosystems, Warrington, UK; Table S1 and Table 2), which were tested in single-primer PCR reactions on DNA from two chestnut samples under the same conditions as applied in multiplex PCR. After primer selection, genotyping was performed using two multiplex PCR reactions. Multiplex mixture 1 contained primers EMCs2, EMCs10, EMCs13, EMCs15, and EMCs17; multiplex mixture 2 contained EMCs25 and CsCAT15. Each 20 μL PCR reaction consisted of 1× PCR buffer, 200 μM of each dNTP, 1 U of Taq DNA polymerase (TAKARA Co. Ltd, Tokyo, Japan), and 1–2 ng of genomic DNA. Primer concentrations ranged from 0.1 µM to 0.4 µM depending on the locus. The PCR thermal profile included an initial denaturation at 94°C for 5 min, followed by 30 cycles of denaturation at 94°C for 30 s, annealing at 55°C for 1 min, and extension at 72°C for 40 s, with a final elongation step at 72°C for 2 min. PCR products were separated using capillary electrophoresis on a 3500 Genetic Analyzer (Applied Biosystems), and allele sizes were determined using GeneMapper™ IDX Software v1.5 (Applied Biosystems).
2.3. Genetic Analyses
Genetic diversity parameters—including the number of different alleles (Na), effective alleles (Ne), rare and private alleles, observed heterozygosity (Ho), expected heterozygosity (He), unbiased expected heterozygosity (uHe), fixation index (F), PhiPT, and analysis of molecular variance (AMOVA)—were calculated using GenAlEx version 6.5 [41]. Principal Coordinate Analysis (PCoA) was performed in GenAlEx to visualize genetic relationships among individuals based on multilocus genotype data.
To infer population structure, a model-based Bayesian clustering analysis was conducted using STRUCTURE version 2.3.3 [42]. The analysis tested values of K (number of genetic clusters) from 1 to 10 using the admixture model and correlated allele frequencies. Each run included a burn-in period of 20,000 iterations followed by 200,000 Markov Chain Monte Carlo (MCMC) iterations, replicated 20 times for each K value.
The optimal number of clusters (K) was determined by evaluating the log-likelihood probability [LnP(K)] and calculating the ΔK statistic using STRUCTURE SELECTOR [43]. The results were processed and visualized using CLUMPAK (http://clumpak.tau.ac.il), which integrates the outputs from STRUCTURE SELECTOR and aligns replicates using CLUMPP [44], followed by graphical display via DISTRUCT [45].
3. Results
3.1. SSR Primer Screening and PCR Amplification
Testing of fifteen fluorescently labeled SSR primer pairs (Table S1 and Table 2) was conducted in single-primer PCR reactions using DNA from two chestnut samples. Loci that produced well-resolved and reproducible electropherogram peaks, with clear differentiation between homozygous and heterozygous genotypes, were selected for inclusion in the multiplex PCR assays.
Out of the 15 tested loci, five (EMCs38, CsCAT7, CsCAT6, CsCAT34, and CsCAT41) were excluded due to the presence of three or more alleles per genotype, indicating potential non-specific amplification or duplicated loci. Two loci (CsCAT3 and CsCAT16) failed to amplify, and one locus (CsCAT8) produced poorly resolved peaks, making reliable allele scoring difficult.
Based on expected product sizes and fluorescent dye compatibility, the remaining seven loci were grouped into two multiplex PCR reactions. Multiplex 1 included five loci (EMCs2, EMCs10, EMCs13, EMCs15, and EMCs17), while multiplex 2 included two loci (EMCs25 and CsCAT15) (Figure 2a,b).
3.2. Genetic Diversity Analysis of Loci and Populations
Allele frequency analysis across the seven selected microsatellite loci revealed distinct patterns of genetic variation and population differentiation among the three chestnut populations (Table 3). Sample sizes were consistent across loci and populations, ensuring comparability of genetic parameters. The total number of alleles per locus ranged from three (EMCs13, EMCs15) to ten (EMCs25), with the highest allelic richness observed at CsCAT15 (eight alleles) and EMCs25 (Table S2).
Locus EMCs2 exhibited a shared dominant allele (159) across populations (0.520–0.635), with minor alleles contributing little to inter-population differentiation. At locus EMCs10, allele 216 was prevalent across all populations, especially in HRK (0.775), whereas allele 226 had higher frequency in PET (0.346), indicating regional allele frequency shifts. EMCs13 was dominated by allele 158 in all populations, but allele 155 was more frequent in HRK (0.324), further supporting population-specific allele distributions. At locus EMCs15, allele 88 was the most common across all populations (ranging from 0.558 in PET to 0.670 in BAC), suggesting a shared ancestral allele. However, population-specific patterns were observed, such as the higher frequency of allele 82 in HRK (0.314) and allele 79 in PET (0.337), indicating localized genetic divergence. Locus EMCs17 showed population-specific trends: allele 213 was dominant in PET (0.558) and BAC (0.530), while allele 209 was most frequent in HRK (0.441). The locus EMCs25 exhibited the highest allelic richness (ten alleles), with several private alleles observed exclusively in BAC, such as alleles 158 (0.330) and 144 (0.130). In contrast, PET and HRK shared alleles like 156, though their relative frequencies differed. Finally, locus CsCAT15 displayed high allelic diversity, including several rare and private alleles. For instance, allele 132 was frequent in PET (0.510) and BAC (0.490) but rare in HRK (0.088), while allele 122 was predominant in HRK (0.578), highlighting pronounced differentiation.
Overall, the presence of shared alleles alongside distinct frequency profiles and private alleles—particularly in BAC—suggests both common ancestry and localized genetic divergence, possibly due to historical isolation or limited gene flow.
As shown in Table S3, the number of alleles (Na) per locus ranged from 3 to 7 across populations, with an overall mean of 4.238, indicating moderate allelic richness. The effective number of alleles (Ne) averaged 2.444, reflecting intermediate levels of allele frequency evenness. The Shannon’s Information Index (I) had a mean value of 1.030, suggesting moderate genetic diversity, with the highest I recorded at EMCs25 (1.389) and the lowest at EMCs10 (0.855).
The mean observed heterozygosity (Ho) was 0.488, slightly lower than both the expected heterozygosity (He = 0.571) and unbiased expected heterozygosity (uHe = 0.576), indicating a mild deficit of heterozygotes. This deficit may be attributed to inbreeding, genetic drift, or population structure. Notably, locus EMCs25 had low Ho (0.296) despite high He (0.682), resulting in a strong positive fixation index (F = 0.567), suggesting considerable inbreeding or substructuring at this locus.
Across all loci, the mean fixation index (F) was 0.127, indicating a modest excess of homozygosity. While some loci exhibited negative F values—suggesting heterozygote excess (e.g., EMCs10 and EMCs15)—others such as EMCs25 showed high F values, pointing to strong inbreeding.
As shown in Table 3 and the mean population differentiation (FST) was 0.064 (SE = 0.015), indicating low but statistically significant genetic differentiation among populations. FST values ranged from 0.009 (EMCs2) to 0.112 (EMCs25), suggesting locus-specific evolutionary or demographic pressures. Gene flow, estimated from FST, had a mean Nm value of 7.484 (SE = 3.432), reflecting moderate to levels of gene exchange. Locus EMCs2 had extremely high inferred gene flow (Nm = 27.342), corresponding to its low FST, possibly reflecting neutrality or historical admixture. In contrast, EMCs25 showed restricted gene flow (Nm = 1.974), consistent with its higher differentiation.
The average inbreeding coefficient within populations (FIS) was 0.125 (SE = 0.078), with locus-specific variation from slightly negative (EMCs15: –0.048) to highly positive (EMCs25: 0.565), indicating heterogeneity in mating patterns or substructure. The overall inbreeding coefficient (FIT) had a mean value of 0.176 (SE = 0.081), reinforcing the presence of inbreeding or population subdivision. These results suggest that while gene flow among populations remains relatively high, local genetic structure and inbreeding persist, particularly at loci showing high differentiation, likely influenced by environmental heterogeneity or limited dispersal.
Although private alleles (Table 4) in HRK were of low frequency, their presence indicates some level of genetic distinctiveness, potentially representing rare or recent variants. In contrast, the BAC population not only harbored more private alleles but also exhibited higher frequencies. Notably, three private alleles were found at locus EMCs25, including allele 144, which occurred at a relatively high frequency of 0.130. This suggests possible local adaptation, historical isolation, or unique selective pressures in the BAC population.
The elevated number and frequency of private alleles in BAC point to its greater genetic differentiation and support the hypothesis that it may represent a more genetically distinct or isolated gene pool. The presence of moderately frequent private alleles also implies restricted gene flow and potential long-term divergence. Meanwhile, HRK contributes to overall diversity through rare, unique alleles, despite their lower frequency.
The PET population, by contrast, exhibited no private alleles, indicating lower levels of genetic differentiation or possibly higher levels of gene flow and genetic mixing with the other populations. This absence suggests PET may function as a genetic connector or intermediary within the regional chestnut metapopulation.
Genetic diversity indices were estimated for the chestnut populations PET, HRK, and BAC using seven SSR loci. Mean and SE values of genetic diversity indices were shown in Table 5. The number of alleles per locus (Na) was identical in PET and HRK (4.143), while slightly higher in BAC (4.429), indicating increased allelic richness. The BAC population also exhibited the highest number of effective alleles (Ne = 2.631), followed by PET (2.390) and HRK (2.313), suggesting a more balanced allele frequency distribution in BAC.
Shannon’s Information Index (I), which incorporates both allele richness and evenness, was also highest in BAC (1.096), followed by PET (1.015) and HRK (0.979). Observed heterozygosity (Ho) was highest in PET (0.511), slightly lower in BAC (0.506), and lowest in HRK (0.448). Similarly, expected heterozygosity (He) was greatest in BAC (0.590), reflecting higher genetic variability, and lowest in HRK (0.553).
The inbreeding coefficient (F) was lowest in PET (0.074), indicating minimal deviation from Hardy–Weinberg equilibrium, while the highest value was observed in HRK (0.179), suggesting a potential deficit of heterozygotes. An intermediate F value was recorded in BAC (0.127).
Overall, the BAC population exhibited the highest genetic diversity across most parameters (Na, Ne, I, He), whereas the HRK population showed comparatively lower diversity and signs of increased inbreeding.
3.3. Genetic Differentiation Between Chestnut Populations: PET, HRK, and BAC
AMOVA based on individual genotypes indicated that most genetic variation occurred within individuals (67%), followed by variation among individuals within populations (30%), and only a small fraction among populations (3%) (Figure 3, Table 6).
R-statistics (Table 7) were employed to evaluate genetic differentiation within and among chestnut populations, using the stepwise mutation model appropriate for microsatellite loci. The analysis revealed low among-population differentiation, with an RST value of 0.033 (p = 0.001), indicating minimal divergence attributable to allele size differences. This suggests that stepwise mutation processes contribute little to the observed population structure. In contrast, within-individual differentiation was substantial, as evidenced by RIS = 0.311 and RIT = 0.333 (p = 0.001 for both), indicating high genetic diversity both within individuals and within populations. These findings are consistent with the pre-dominantly outcrossing mating system of chestnut. The estimated gene flow (Nm = 7.385) was high, supporting the hypothesis of extensive pollen and/or seed dispersal among populations, which likely contributes to the low genetic differentiation observed at the population level.
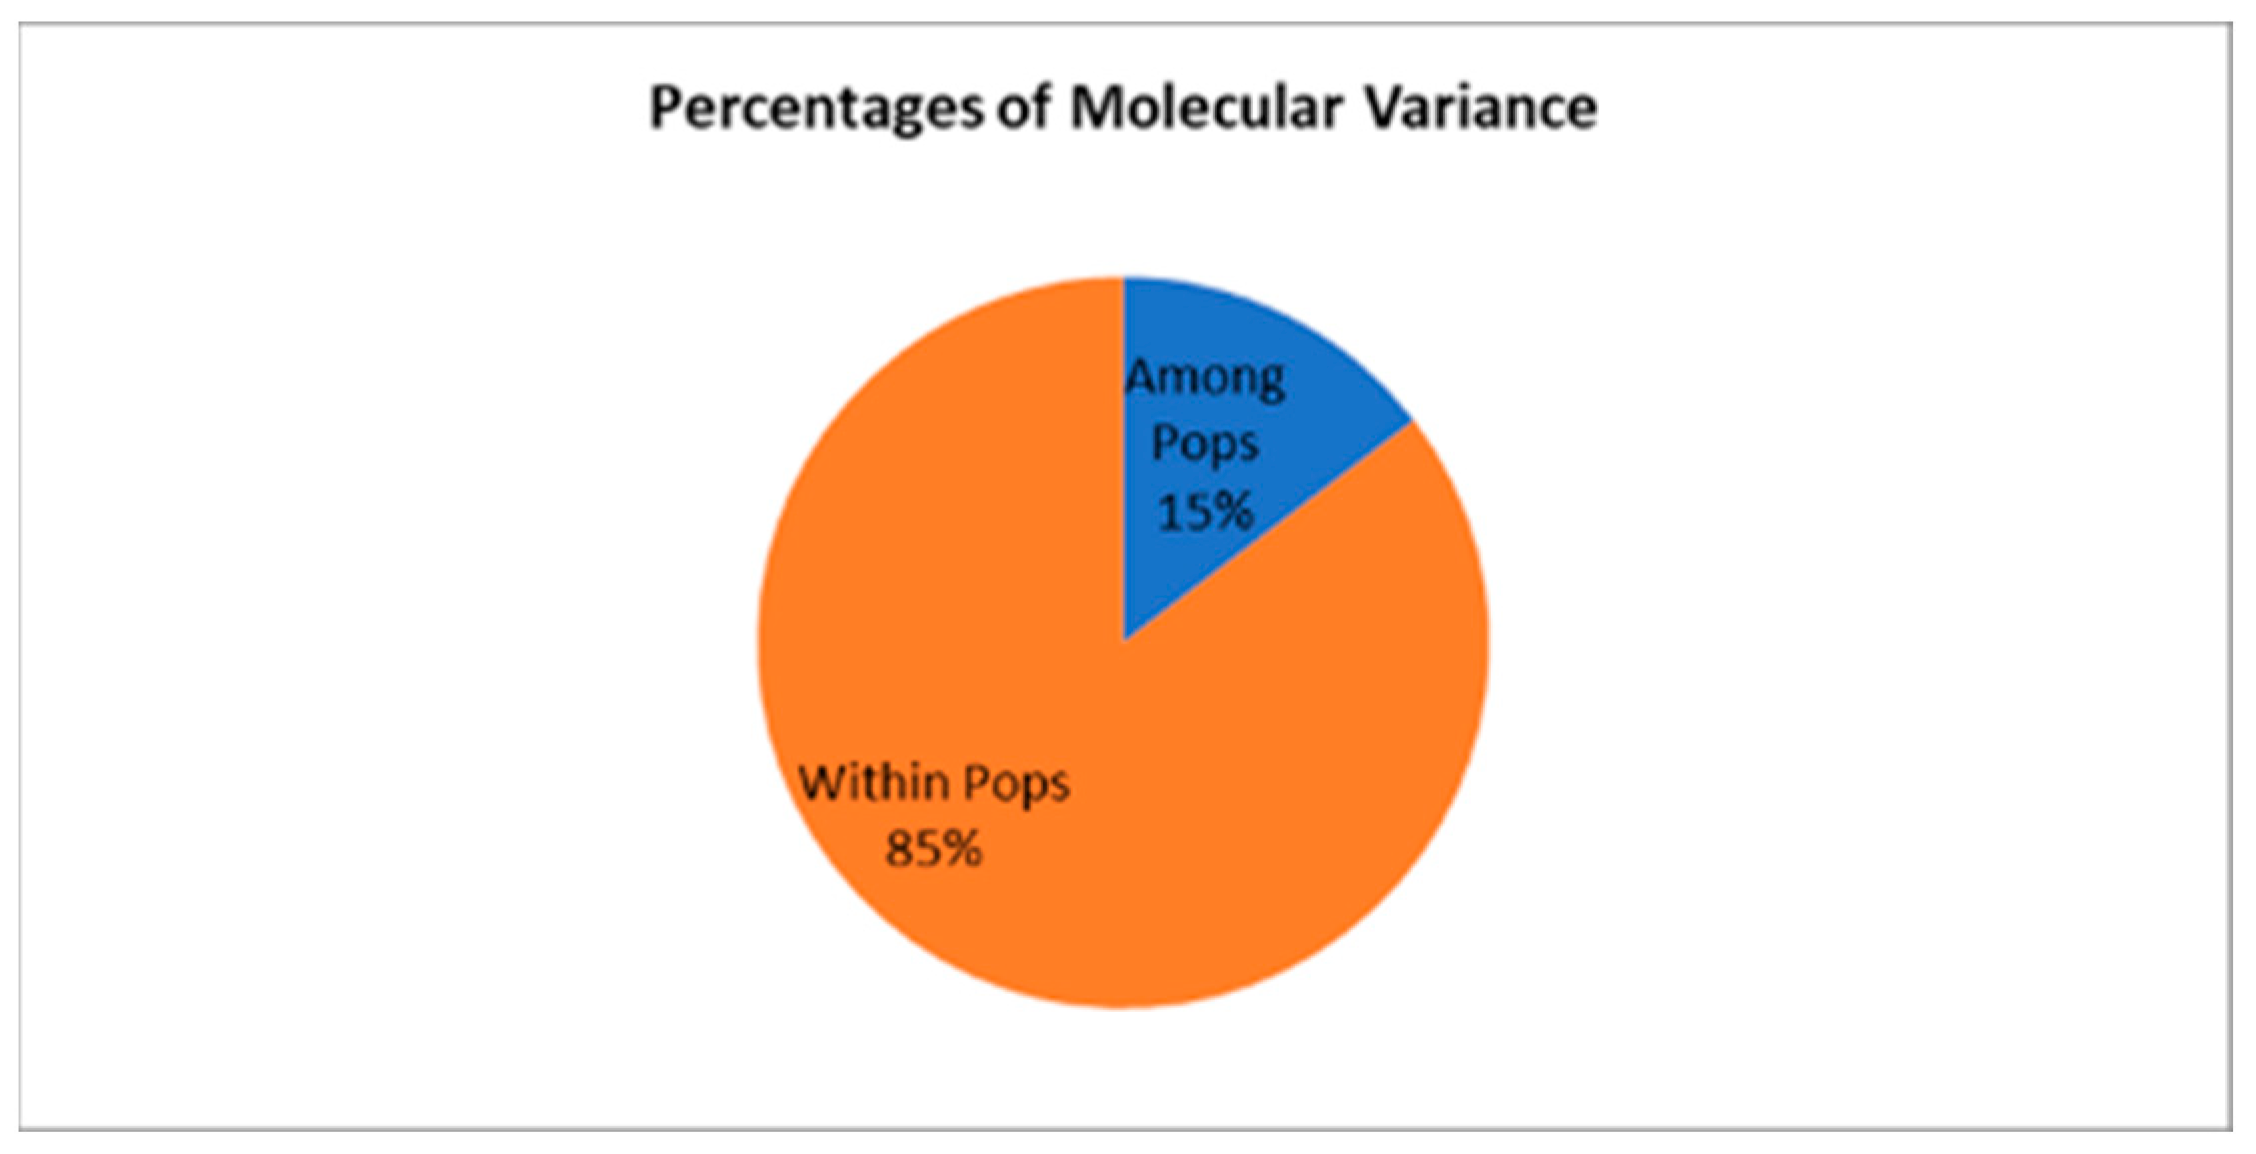
A two-level AMOVA, which partitions variance only among and within populations, yielded a higher proportion of among-population variance (15%), with the remaining 85% occurring within populations (Table 8). This increase reflects the combination of among-individual and within-individual variation into a single within-population component, thereby inflating the relative contribution of population differences.
To complement standard AMOVA, the PhiPT statistic was calculated to assess genetic differentiation among populations by partitioning molecular variance while excluding the within-individual component [10,46]. PhiPT is particularly appropriate for SSR data, as it considers repeat length polymorphisms and the genetic distance between alleles, rather than relying solely on allele frequencies. This provides a more nuanced measure of genetic differentiation for highly polymorphic loci. As shown in Table 9, 14.6% of the total genetic variation was attributed to differences among populations, while 85.4% was distributed within populations. This differentiation was statistically significant (p < 0.01), indicating that the observed population structure is unlikely to result from random genetic variation alone. These findings suggest a moderate level of genetic differentiation among the three chestnut populations studied. The estimated number of migrants per generation (Nm) was 1.461, suggesting moderate gene flow sufficient to counteract much of the genetic differentiation caused by drift.
Figure 4.
Percentages of molecular variance from two-level AMOVA for Castanea sativa Populations.
Pairwise Nei’s genetic distance and identity values (Figure 5) revealed low to moderate differentiation among populations. The smallest genetic distance was observed between PET and BAC (0.063; identity = 0.939), indicating a close genetic relationship. PET and HRK showed intermediate differentiation (distance = 0.179; identity = 0.836), whereas the largest distance was between HRK and BAC (0.244; identity = 0.783), suggesting comparatively greater divergence.
Pairwise FST values (Figure 6) supported these patterns, with the lowest genetic differentiation between PET and BAC (FST = 0.018), followed by PET and HRK (FST = 0.058), and the highest between HRK and BAC (FST = 0.067). All FST values were within the range generally interpreted as low differentiation (0.05–0.15), indicating substantial within-population diversity and genetic connectivity.
To better elucidate the genetic structure among chestnut populations, three differentiation metrics—PhiPT, FST, and RST—were compared. The overall PhiPT value of 0.146 indicated moderate and statistically significant population differentiation, incorporating both allele frequency and genetic distance. Pairwise FST estimates ranged from 0.018 to 0.067, suggesting low to moderate levels of differentiation based solely on allele frequency variation. In contrast, the overall RST value was considerably lower (0.033; p = 0.001), in-dicating minimal genetic differentiation when accounting for the stepwise mutation mod-el characteristic of microsatellite evolution. This discrepancy among metrics underscores their differing sensitivities: PhiPT and FST capture frequency-based divergence, while RST incorporates the magnitude of allele size differences due to mutational steps. The relatively low RST suggests that mutation-driven processes have a limited role in shaping the genetic structure of these populations. Instead, the combined pattern—moderate differentiation based on PhiPT and FST, but low differentiation by RST—implies that gene flow and genetic drift, rather than stepwise mutation, are the predominant forces maintaining genetic connectivity among chestnut populations.
3.5. Population Genetic Structure Analysis
Principal Coordinates Analysis (PCoA, Figure 7) revealed clear patterns of genetic relatedness among the three populations, POP1 (PET), POP2 (HRK) and POP3 (BAC). The first two axes accounted for 100% of the total genetic variation, with axis 1 alone explaining 84.82% and axis 2 explaining the remaining 15.18%. Axis 3 contributed no additional variation. POP1 (PET) and POP3 (BAC) clustered closely along the first coordinate axis, indicating high genetic similarity, while POP2 (HRK) was positioned more distantly, suggesting greater genetic divergence. Additionally, POP3 (BAC) showed distinct separation along the second coordinate, though the overall spatial proximity between POP1 (PET) and POP3 (BAC) supports their close genetic relationship.
STRUCTURE analysis, (Figure 8) based on SSR loci, was conducted to evaluate the population structure of three chestnut populations: PET (POP1), HRK (POP2), and BAC (POP3). The most likely number of genetic clusters (K) was inferred using both ΔK (K-Delta) and LnP(K) methods. The ΔK method identified the optimal K value (K = 2) as the optimal value by detecting the highest rate of change in the log-likelihood between successive K values, while the LnP(K) plot further supported model fit across the tested K values. At K = 1, all individuals were assigned to a single genetic cluster, as expected under the assumption of no population structure. At K = 2, a clear genetic separation was observed: individuals from POP1 (PET) primarily grouped into one cluster (red), POP2 (HRK) into another (green), and POP3 (BAC) displayed admixture from both, suggesting gene flow and greater genetic similarity between POP1 and POP3. At K = 3, all populations exhibited evidence of admixture. Notably, POP2 began to show a distinct third cluster (blue), reinforcing its unique genetic profile. POP3 continued to exhibit the highest degree of admixture, indicating potential historical gene flow from both POP1 and POP2. These findings support the interpretation of POP2 as the most genetically differentiated group among the three populations.
4. Discussion
4.1. SSR Marker Performance and Genetic Resolution
The screening of fluorescently labeled SSR primers proved effective for genotyping chestnut, with seven loci retained after rigorous evaluation based on peak clarity, amplification quality, and allelic reliability. Following the recommendations of Guichoux et al. [47], loci with polyploid-like profiles, inconsistent amplification, or unresolved peaks were excluded to ensure marker robustness. The successful implementation of multiplex PCR protocols enabled efficient and cost-effective genotyping, critical for large-scale population studies. Among the retained loci, EMCs25 and CsCAT15 displayed high allelic richness, confirming their informativeness for assessing population diversity, as previously emphasized by Selkoe and Toonen [48].
4.2. Genetic Diversity and Allelic Patterns
All three Croatian populations exhibited moderate genetic diversity, aligning with previous European studies on chestnut populations using SSR markers [49]. Among them, PET displayed the highest observed heterozygosity, while BAC showed the greatest number and frequency of private alleles, suggesting historical isolation or site-specific evolutionary processes [50]. The observed deficit in heterozygosity (Ho < He) and moderate fixation index (F = 0.127) may indicate underlying population structure or mild inbreeding—patterns typical for outcrossing hardwoods [51]. Locus-specific signals, especially from EMCs25, further highlight heterogeneity in demographic or selective histories. Differences in genetic structure may also reflect age-class variation among individuals. Genetic diversity and differentiation are shaped by evolutionary forces—mutation, gene flow, and genetic drift—which accumulate over generations [52,53]. Thus, population demography and management history likely contributed to the observed spatial and genetic patterns.
4.3. Population Differentiation
AMOVA results revealed that 67% of total genetic variation resided within individuals, with only 3% among populations, a distribution consistent with outcrossing, wind-pollinated tree species [54]. The PhiPT value (0.146, p = 0.001) and pairwise FST values (0.018–0.067) indicate low to moderate population differentiation, similar to other European chestnut populations [55]. High inferred gene flow (Nm = 7.48) suggests substantial connectivity, limiting population divergence [56]. However, elevated differentiation at specific loci (e.g., EMCs25) and low local Nm values point to possible microevolutionary processes such as local selection or dispersal barriers [57].
The application of R-statistics provided additional insight into mutation-scaled differentiation. The low RST (0.033) relative to PhiPT and FST supports the conclusion that mutation plays a limited role in shaping population structure, with gene flow and drift acting as stronger evolutionary forces [58]. High intra-individual variance (RIS = 0.311; RIT = 0.333) reflects the outcrossing mating system and reinforces the species' capacity to maintain high within-individual genetic diversity [59]. These findings underscore the importance of using both frequency-based and mutation-sensitive statistics when interpreting SSR data.
4.4. Population Structure Patterns
PCoA and STRUCTURE analyses provided complementary insights into population structure. PET and BAC clustered closely, whereas HRK formed a distinct genetic unit. STRUCTURE analysis identified K = 2 as the most probable number of genetic clusters, with BAC showing evidence of admixture and HRK appearing genetically distinct—patterns consistent with FST and PhiPT results. The genetic proximity between PET and BAC suggests historical or recent gene flow, while HRK's differentiation may reflect geographic or ecological isolation. These patterns mirror findings in other Mediterranean forest tree species [60], and the presence of private alleles in HRK and BAC further supports localized evolutionary processes or restricted gene exchange.
4.5. Implications for Conservation and Genetic Resource Management
Although overall differentiation among populations was low, the presence of private alleles and site-specific inbreeding patterns highlights the importance of localized conservation strategies. BAC’s high allelic richness and HRK’s elevated inbreeding coefficient may result from historical bottlenecks or habitat fragmentation, underscoring the need for targeted management and monitoring [61]. Conservation measures should aim to maintain both genetic connectivity and the unique genetic attributes of isolated populations, particularly in the context of increasing threats from climate change, invasive pathogens, and land-use change.
4.6. Conservation Implications for European Chestnut
These findings have broader implications for chestnut conservation at the European scale. The high within-population diversity (67%) emphasizes the importance of preserving multiple genetically rich stands to maintain adaptive potential. The presence of population-specific alleles in BAC and HRK aligns with the goals of the Pan-European strategy for forest genetic resource conservation [62]. Given its allelic richness and unique gene pool, the BAC population is a strong candidate for both in situ and ex situ conservation. Despite low overall FST and high gene flow, STRUCTURE and R-statistics revealed moderate population structuring, particularly in HRK, warranting regionally adapted conservation approaches. These genetic data can inform seed sourcing, restoration, and breeding efforts, supporting forest resilience under future environmental conditions, including disease pressure and climate change [63,64]. Ultimately, this study provides essential genetic insights that can guide evidence-based conservation and management of sweet chestnut across Europe, reinforcing its ecological and genetic value in forest ecosystems.
5. Conclusions
This study presents a comprehensive evaluation of the genetic diversity, structure, and conservation relevance of three chestnut populations in Croatia using highly informative SSR markers. The selected loci demonstrated strong genotyping performance, enabling accurate assessment of population-level genetic variability. All three populations exhibited moderate genetic diversity, consistent with patterns reported for other European chestnut populations. Notably, the BAC population displayed the highest number and frequency of private alleles, while HRK emerged as the most genetically distinct group. Analyses using AMOVA, F-statistics, and R-statistics consistently revealed high levels of genetic variation within populations and low to moderate differentiation among them—typical of outcrossing, wind-pollinated, and long-lived forest species. STRUCTURE and PCoA analyses corroborated these findings, highlighting the genetic distinctiveness of HRK and the admixed nature of BAC. These results suggest a combination of historical gene flow and localized evolutionary pressures shaping current genetic structure. The presence of population-specific genetic signatures, private alleles, and evidence of inbreeding underscores the importance of implementing both in situ and ex situ conservation strategies. Effective conservation planning should aim to preserve gene flow while protecting the unique genetic composition of isolated or differentiated populations. Overall, this study highlights the value of molecular tools in supporting conservation efforts and provides a solid genetic foundation for the sustainable management of European chestnut. The prioritization of genetically diverse and distinct populations, such as BAC and HRK, is essential for maintaining the adaptive potential of chestnut under current and future environmental challenges.
Supplementary Materials
The following supporting information can be downloaded at the website of this paper posted on Preprints.org; Table S1: SSR primers that were tested but not used for genotyping Castanea sativa because they did not produce evaluable peak results; Table S2. Allele frequencies and sample sizes for each locus in three Castanea sativa populations (PET, HRK, BAC); Table S3. Sample size, number of alleles, number of effective alleles, information index, observed heterozygosity, expected and unbiased expected heterozygosity, and fixation index for each population, with mean ± SE over populations and grand mean ± SE over all loci.
Author Contributions
Conceptualization, S.N.A., N.Ć., M.I.; methodology, S.N.A. N.Ć., M.K.V., and G.K.; software, N.Ć., M.K.V., G.K.; investigation, S.N.A., N.Ć., S.B.; data curation, N.Ć., S.N.A., M.K.V.; writing—original draft preparation, N.Ć., S.N.A., S.B., M.K.V., G.K.; writing—review and editing, N.Ć., S.N.A., M.K.V., G.K., M.G.P., M.I.; funding acquisition, S.N.A., M.I. All authors have read and agreed to the published version of the manuscript.
Funding
This research was supported by the project “Protection of Sweet Chestnut Forests”, funded by Croatian Forests Ltd., and by the project “Experimental Chestnut Grove”, funded by the Association for Ecology and Development "Chestnut Road", in partnership with the City of Petrinja, Croatian Forests Ltd., Sisak Forest Administration, the Croatian Forest Research Institute, and the Centre for Plum and Chestnut from Donja Bačuga.
Data Availability Statement
Not applicable here.
Acknowledgments
The authors thank Boris Liović M.Sc. for collecting BAC population samples, Edita Roca for technical support for microsatellite amplification, and Danijela Ivanković, B.Sc. on the creation of a map of chestnut sampling locations in central Croatia.
Conflicts of Interest
The authors declare no conflict of interest. The funders had no role in the design of the study; in the collection, analyses, or interpretation of data; in the writing of the manuscript; or in the decision to publish the results.
References
- Conedera, M.; Tinner, W.; Krebs, P. The cultivation of sweet chestnut (Castanea sativa (Mill.)) in Europe, from its origin to the present spread and decline. Veg. Hist. Archaeobot. 2016, 25, 233–242. [Google Scholar] [CrossRef]
- Fernández-López, J.; Alía, R. EUFORGEN Technical Guidelines for Genetic Conservation and Use for European Chestnut (Castanea sativa); International Plant Genetic Resources Institute: Rome, Italy, 2003; 6p, Available online: https://www.euforgen.org/fileadmin/templates/euforgen.org/upload/Publications/Technical_guidelines/Technical_guidelines_Castanea_sativa.pdf (accessed on 6 August 2025).
- Conedera, M.; Manetti, M.C.; Giudici, F.; Amorini, E. Distribution and economic potential of the sweet chestnut (Castanea sativa Mill.) in Europe. Ecol. Mediterr. 2004, 30, 179–193. [Google Scholar] [CrossRef]
- Tumpa, T.; Islam, M.T.; Chowdhury, M.S.H.; Nath, T.K. Coppicing behavior and carbon sequestration potential of sweet chestnut (Castanea sativa): A review. Sustainability 2022, 14, 925. [Google Scholar] [CrossRef]
- Manthos, I.; Tsiripidis, I.; Kazoglou, Y.; Papaioannou, C.; Fotiadis, G. Genetic and ecological insights into marginal chestnut populations in northern Greece. Forests 2025, 16, 112. [Google Scholar] [CrossRef]
- Heiniger, U.; Rigling, D. Biological control of chestnut blight in Europe. Annu. Rev. Phytopathol. 1994, 32, 581–599. [Google Scholar] [CrossRef]
- EFSA Panel on Plant Health. Risk assessment of Dryocosmus kuriphilus for the EU territory. EFSA Journal 2010, 8, 1619. [Google Scholar] [CrossRef]
- Vettraino, A.M.; Natili, G.; Anselmi, N.; Vannini, A. Recovery and pathogenicity of Phytophthora species associated with ink disease of chestnut in Italy. Plant Pathol. 2005, 54, 478–488. [Google Scholar] [CrossRef]
- Mattioni, C.; Martin, M.A.; Chiocchini, F.; Cherubini, M.; Gaudet, M.; Villani, F. Genetic structure of European sweet chestnut (Castanea sativa Mill.) populations: Evidence from nuclear microsatellite markers. Ann. For. Sci. 2013, 70, 675–685. [Google Scholar] [CrossRef]
- Bouffartigue, N.; Curt, T.; Rey, F.; Bouchaud, M. Cultivated–wild hybridization and genetic introgression in chestnut. Ann. For. Sci. 2020, 77, 79. [Google Scholar] [CrossRef]
- Casasoli, M.; Derory, J.; Morera-Dutrey, C.; Brendel, O.; Porth, I.; Scotti-Saintagne, C.; Bodénès, C.; Kremer, A.; Villani, F. Comparison of quantitative trait loci for adaptive traits between oak and chestnut based on EST-linked markers. BMC Genet. 2006, 7, S10. [Google Scholar] [CrossRef]
- Novak Agbaba, S.; Liović, B.; Medak, J.; Slade, D. Chestnut Research in Croatia. Acta Hortic. 2005, 693, 49–54. [Google Scholar] [CrossRef]
- Medak, J. Fitocenološke značajke šuma pitomog kestena u sjeverozapadnoj Hrvatskoj [Phytocoenological Characteristics of Sweet Chestnut (Castanea sativa) Forests in Northwestern Croatia]; Master’s Thesis, University of Zagreb, Faculty of Forestry, Zagreb, Croatia, 2004. [Google Scholar]
- Medak, J. Šumske zajednice i staništa pitomog kestena (Castanea sativa Mill.) u Hrvatskoj [Forest Communities and Habitats of Sweet Chestnut (Castanea sativa Mill.) in Croatia]; Ph.D. Dissertation, University of Zagreb, Faculty of Forestry and Wood Technology, Zagreb, Croatia, 2009. [Google Scholar]
- Idžojtić, M.; Mlinarec, J.; Zebec, M.; Franić, R. Morphological and molecular characterization of chestnut populations in Croatia. Šum. List 2010, 134, 499–510. [Google Scholar] [CrossRef]
- Turnock, D. Historical dimensions of the Carpathian frontier: Central Europe’s military borderlands. GeoJournal 1997, 43, 193–210. [Google Scholar] [CrossRef]
- Hruševar, D.; Bakrač, K.; Miko, S.; Ilijanić, N.; Šparica Miko, M.; Hasan, O.; Mitić, B. Vegetation history in Central Croatia from ~10,000 Cal BC to the beginning of the Common Era—Filling the palaeoecological gap for the Western Balkans. Diversity 2023, 15, 235. [Google Scholar] [CrossRef]
- Ježić, M.; Nuskern, L.; Peranić, K.; Popović, M.; Ćurković-Perica, M.; Mendaš, O.; Škegro, I.; Poljak, I.; Vidaković, A.; Idžojtić, M. Regional Variability of Chestnut (Castanea sativa) Tolerance Toward Blight Disease. Plants 2024, 13, 3060. [Google Scholar] [CrossRef]
- Ellegren, H. Microsatellites: Simple sequences with complex evolution. Nat. Rev. Genet. 2004, 5, 435–445. [Google Scholar] [CrossRef] [PubMed]
- Smith, D.N.; Devey, M.E. Occurrence and inheritance of microsatellites in Pinus radiata. Genome 1994, 37, 977–983. [Google Scholar] [CrossRef]
- Dow, B.D.; Ashley, M.V.; Howe, H.F. Characterization of highly variable (GA/CT) n microsatellites in the bur oak, Quercus macrocarpa. Theor. Appl. Genet. 1995, 91, 137–141. [Google Scholar] [CrossRef]
- Dow, B.D.; Ashley, M.V. Microsatellite analysis of seed dispersal and parentage of saplings in bur oak, Quercus macrocarpa. Mol. Ecol. 1996, 5, 615–627. [Google Scholar] [CrossRef]
- Steinkellner, H.; Fluch, S.; Turetschek, E.; Lexer, C.; Streiff, R.; Kremer, A.; Burg, K.; Glossl, J. Identification and characterization of (GA/CT)_n-microsatellite loci from Quercus petraea. Plant Mol. Biol. Rep. 1997, 15, 295–303. [Google Scholar] [CrossRef]
- Kampfer, S.; Lexer, C.; Glössl, J.; Steinkellner, H. Characterization of (GA)_n microsatellite loci from Quercus robur. Hereditas 1998, 129, 183–186. [Google Scholar] [CrossRef]
- Lexer, C.; Heinze, B.; Steinkellner, H.; Kampfer, S.; Glössl, J. Microsatellite analysis of maternal half-sib families of Quercus robur: I. Isolation and characterization of microsatellite loci. Theor. Appl. Genet. 1999, 99, 18–26. [Google Scholar] [CrossRef]
- Aldrich, P.R.; Michler, C.H.; Sun, W.; Romero-Severson, J. Microsatellite markers for northern red oak (Quercus rubra). Mol. Ecol. Notes 2002, 2, 472–474. [Google Scholar] [CrossRef]
- Buck, E.J.; Hadonou, M.; James, C.J.; Blakesley, D.; Russell, K. Isolation and characterization of polymorphic microsatellites in European chestnut (Castanea sativa Mill.). Mol. Ecol. Notes 2003, 3, 239–241. [Google Scholar] [CrossRef]
- Marinoni, D.; Akkak, A.; Bounous, G.; Botta, R. DNA typing of chestnut cultivars in Italy. Acta Hortic. 2003, 622, 167–174. [Google Scholar] [CrossRef]
- Mattioni, C.; Martin, M.A.; Chiocchini, F.; Cherubini, M.; Gaudet, M.; Villani, F. Landscape genetics of European sweet chestnut (Castanea sativa Mill.): Indications for conservation strategies. Tree Genet. Genomes 2008, 4, 563–574. [Google Scholar] [CrossRef]
- Martín, M.A.; Mattioni, C.; Cherubini, M.; Taurchini, D.; Villani, F. Genetic diversity in European chestnut populations by means of genomic and genic microsatellite markers. Tree Genet. Genomes 2010, 6, 735–744. [Google Scholar] [CrossRef]
- Pereira-Lorenzo, S.; Ramos-Cabrer, A.M.; Barreneche, T. Analysis of the genetic diversity and structure of chestnut cultivars from Spain and France using microsatellites. Ann. Appl. Biol. 2010, 156, 387–397. [Google Scholar] [CrossRef]
- Villani, F.; De Lorenzis, G.; Marconi, G.; D’Angiolillo, F.; Bounous, G.; Cherubini, M.; et al. Genetic diversity and differentiation of European chestnut (Castanea sativa Mill.) in Italy. Tree Genet. Genomes 2019, 15, 66. [Google Scholar] [CrossRef]
- Mattioni, C.; Martin, M.A.; Pollegioni, P.; Choimet, C.; Villani, F. Landscape genetics structure and conservation priorities in Castanea sativa populations. Tree Genet. Genomes 2020, 16, 1. [Google Scholar] [CrossRef]
- Cavallini, G.; Giannini, R.; Mattioni, C.; Cherubini, M.; Villani, F. Patterns of genetic variation in European chestnut and conservation strategies. Forests 2024, 15, 415. [Google Scholar] [CrossRef]
- Idžojtić, M.; Zebec, M.; Mlinarec, J.; Franić, R. Genetic characterization of Lovran Marron chestnut (Castanea sativa Mill.) in Croatia. Šum. List 2012, 136, 283–291. Available online: https://hrcak.srce.hr/94589 (accessed on 6 August 2025).
- Prgomet, S.; Poljak, I.; Jukić, D.; Idžojtić, M.; Hanzer, V. Genetic Diversity of Chestnut Populations from Istria and Gorski Kotar. Šum. List 2014, 138, 415–422. Available online: http://www.sumari.hr/sumlist/gootxt.asp?id=201411&s=27 (accessed on 6 August 2025).
- Poljak, I.; Idžojtić, M.; Šatović, Z.; Ježić, M.; Ćurković Perica, M.; Simovski, B.; Acevski, J.; Liber, Z. Genetic Diversity of the Sweet Chestnut (Castanea sativa Mill.) in Central Europe and the Western Part of the Balkan Peninsula, and Evidence of Marron Genotype Introgression into Wild Populations. Tree Genet. Genomes 2017, 13, 18. [Google Scholar] [CrossRef]
- Croatian Forest Research Institute. Protection of Sweet Chestnut Forests, 2006-2010. Available online: https://www.sumins.hr/projekti/zastita-suma-pitomog-kestena/ (accessed on 5 August 2025).
- Croatian Forest Research Institute. Experimental Chestnut Grove, 2013-2015. Available online: https://www.sumins.hr/projekti/pokusni-nasad-pitomog-kestena-gornja-bacuga/ (accessed on 1 August 2025).
- Doyle, J.J.; Doyle, J.L. A Rapid DNA Isolation Procedure for Small Quantities of Fresh Leaf Tissue. Phytochem. Bull. 1987, 19, 11–15. [Google Scholar]
- Peakall, R.; Smouse, P.E. GenAlEx 6.5: Genetic analysis in Excel. Population genetic software for teaching and research—An update. Bioinformatics 2012, 28, 2537–2539. [Google Scholar] [CrossRef]
- Pritchard, J.K.; Stephens, M.; Donnelly, P. Inference of population structure using multilocus genotype data. Genetics 2000, 155, 945–959. [Google Scholar] [CrossRef]
- Li, Y.L.; Liu, J.X. STRUCTURESELECTOR: A web-based software to select and visualize the optimal number of clusters using multiple methods. Mol. Ecol. Resour. 2018, 18, 176–177. [Google Scholar] [CrossRef]
- Jakobsson, M.; Rosenberg, N.A. CLUMPP: A cluster matching and permutation program for dealing with label switching and multimodality in analysis of population structure. Bioinformatics 2007, 23, 1801–1806. [Google Scholar] [CrossRef]
- Rosenberg, N.A. DISTRUCT: A program for the graphical display of population structure. Mol. Ecol. Notes 2004, 4, 137–138. [Google Scholar] [CrossRef]
- Manthos, I.; Sotiropoulos, T.; Karapetsi, L.; Xanthopoulou, A.; Madesis, P. Genetic characterization of Greek chestnut (Castanea sativa Mill.) germplasm collections in Parnon Mountain—AMOVA indicates high within-individual variation (~84%) and low between-region differentiation (ΦPT ≈ 0.222, p < 0.001). Not. Bot. Horti Agrobo. 2025, 53. [Google Scholar] [CrossRef]
- Guichoux, E.; Lagache, L.; Wagner, S.; Chaumeil, P.; Léger, P.; Lepais, O.; Lepoittevin, C.; Malausa, T.; Revardel, E.; Salin, F.; Petit, R.J.; et al. Current trends in microsatellite genotyping. Mol. Ecol. Resour. 2011, 11, 591–611. [Google Scholar] [CrossRef]
- Selkoe, K.A.; Toonen, R.J. Microsatellites for ecologists: A practical guide to using and evaluating microsatellite markers. Ecol. Lett. 2006, 9, 615–629. [Google Scholar] [CrossRef]
- Mattioni, C.; Martin, M. A.; Chiocchini, F.; Cherubini, M.; Gaudet, M.; Pollegioni, P.; Velichkov, I.; Jarman, R.; Chambers, F. M.; Paule, L.; Damian, V. L.; Crainic, G. C.; Villani, F. Landscape Genetics Structure of European Sweet Chestnut (Castanea sativa Mill): Indications for Conservation Priorities. Tree Genet. Genomes 2017, 13, 39. [Google Scholar] [CrossRef]
- Petit, R.J.; Hampe, A.; Cheddadi, R. Climate changes and tree phylogeography in the Mediterranean. Taxon 2005, 54, 877–885. [Google Scholar] [CrossRef]
- Hamrick, J.L.; Godt, M.J.W. Effects of life history traits on genetic diversity in plant species. Phil. Trans. R. Soc. Lond. B 1996, 351, 1291–1298. [Google Scholar]
- Escudero, A.; Iriondo, J.M.; Torres, M.E. Spatial analysis of genetic diversity as a tool for plant conservation. Biol. Conserv. 2003, 113, 351–365. [Google Scholar] [CrossRef]
- Austerlitz, F.; Garnier-Géré, P. Evolutionary models of seed dispersal and genetic diversity. Heredity 2003, 91, 260–268. [Google Scholar] [CrossRef]
- Excoffier, L.; Smouse, P.E.; Quattro, J.M. Analysis of molecular variance inferred from metric distances among DNA haplotypes: Application to human mitochondrial DNA restriction data. Genetics 1992, 131, 479–491. [Google Scholar] [CrossRef]
- Pereira-Lorenzo, S.; Ramos-Cabrer, A.M.; Barreneche, T. Genetic variability and structure of local chestnut (Castanea sativa Mill.) populations from northwestern Spain. Tree Genetics & Genomes 2010, 6, 705–715. [Google Scholar] [CrossRef]
- Slatkin, M. Gene flow and the geographic structure of natural populations. Science 1987, 236, 787–792. [Google Scholar] [CrossRef]
- Holderegger, R.; Kamm, U.; Gugerli, F. Adaptive vs. neutral genetic diversity: Implications for landscape genetics. Landscape Ecol. 2006, 21, 797–807. [Google Scholar] [CrossRef]
- Slatkin, M. A measure of population subdivision based on microsatellite allele frequencies. Genetics 1995, 139, 457–462. [Google Scholar] [CrossRef]
- Lefèvre, F.; Boivin, T.; Bousquet, J.; et al. . Conserving adaptive genetic diversity in forest trees. For. Ecol. Manag. 2004, 197, 1–4. [Google Scholar] [CrossRef]
- Aravanopoulos, F.A.; et al. Population genetic structure in Mediterranean forest trees. Forests 2015, 6, 909–934. [Google Scholar] [CrossRef]
- Jump, A.S.; Peñuelas, J. Running to stand still: adaptation and the response of plants to rapid climate change. Ecol. Lett. 2006, 8, 1010–1020. [Google Scholar] [CrossRef] [PubMed]
- Koskela, J.; Buck, A.; Teissier du Cros, E. Conserving forest genetic resources in Europe; Bioversity International: Rome, Italy, 2013; Available online: http://www.euforgen.org/fileadmin/bioversity/publications/pdfs/1216.pdf.
- FAO. State of the World’s Forest Genetic Resources; Food and Agriculture Organization of the United Nations: Rome, Italy, 2014; Available online: https://www.fao.org/3/i3825e/i3825e.pdf (accessed on 6 August 2025).
- de Cuyper, B.; Muzikar, P.; Aravanopoulos, F.; Westergren, M.; Koskela, J.; Bozzano, M.; Brožová, Z.; Collin, E.; de Vries, S.M.G.; Ducousso, A.; Frank, A.; Kramer, K.; Lefèvre, F.; Kraigher, H. Guidelines for Conservation and Use of Forest Genetic Resources. Forests 2020, 11. [Google Scholar] [CrossRef]
Figure 1.
Chestnut sampling locations in central Croatia 1. PET, 2. HRK, 3. BAC.
Figure 2.
Profile of one sample of chestnut DNA amplified using multiplex 1 at five loci: (a) EMCs15, CsCAT15, EMCs17, EMCs2, and EMCs10 and multiplex 2 at two loci, (b) EMCs25 and EMCs13.
Figure 2.
Profile of one sample of chestnut DNA amplified using multiplex 1 at five loci: (a) EMCs15, CsCAT15, EMCs17, EMCs2, and EMCs10 and multiplex 2 at two loci, (b) EMCs25 and EMCs13.
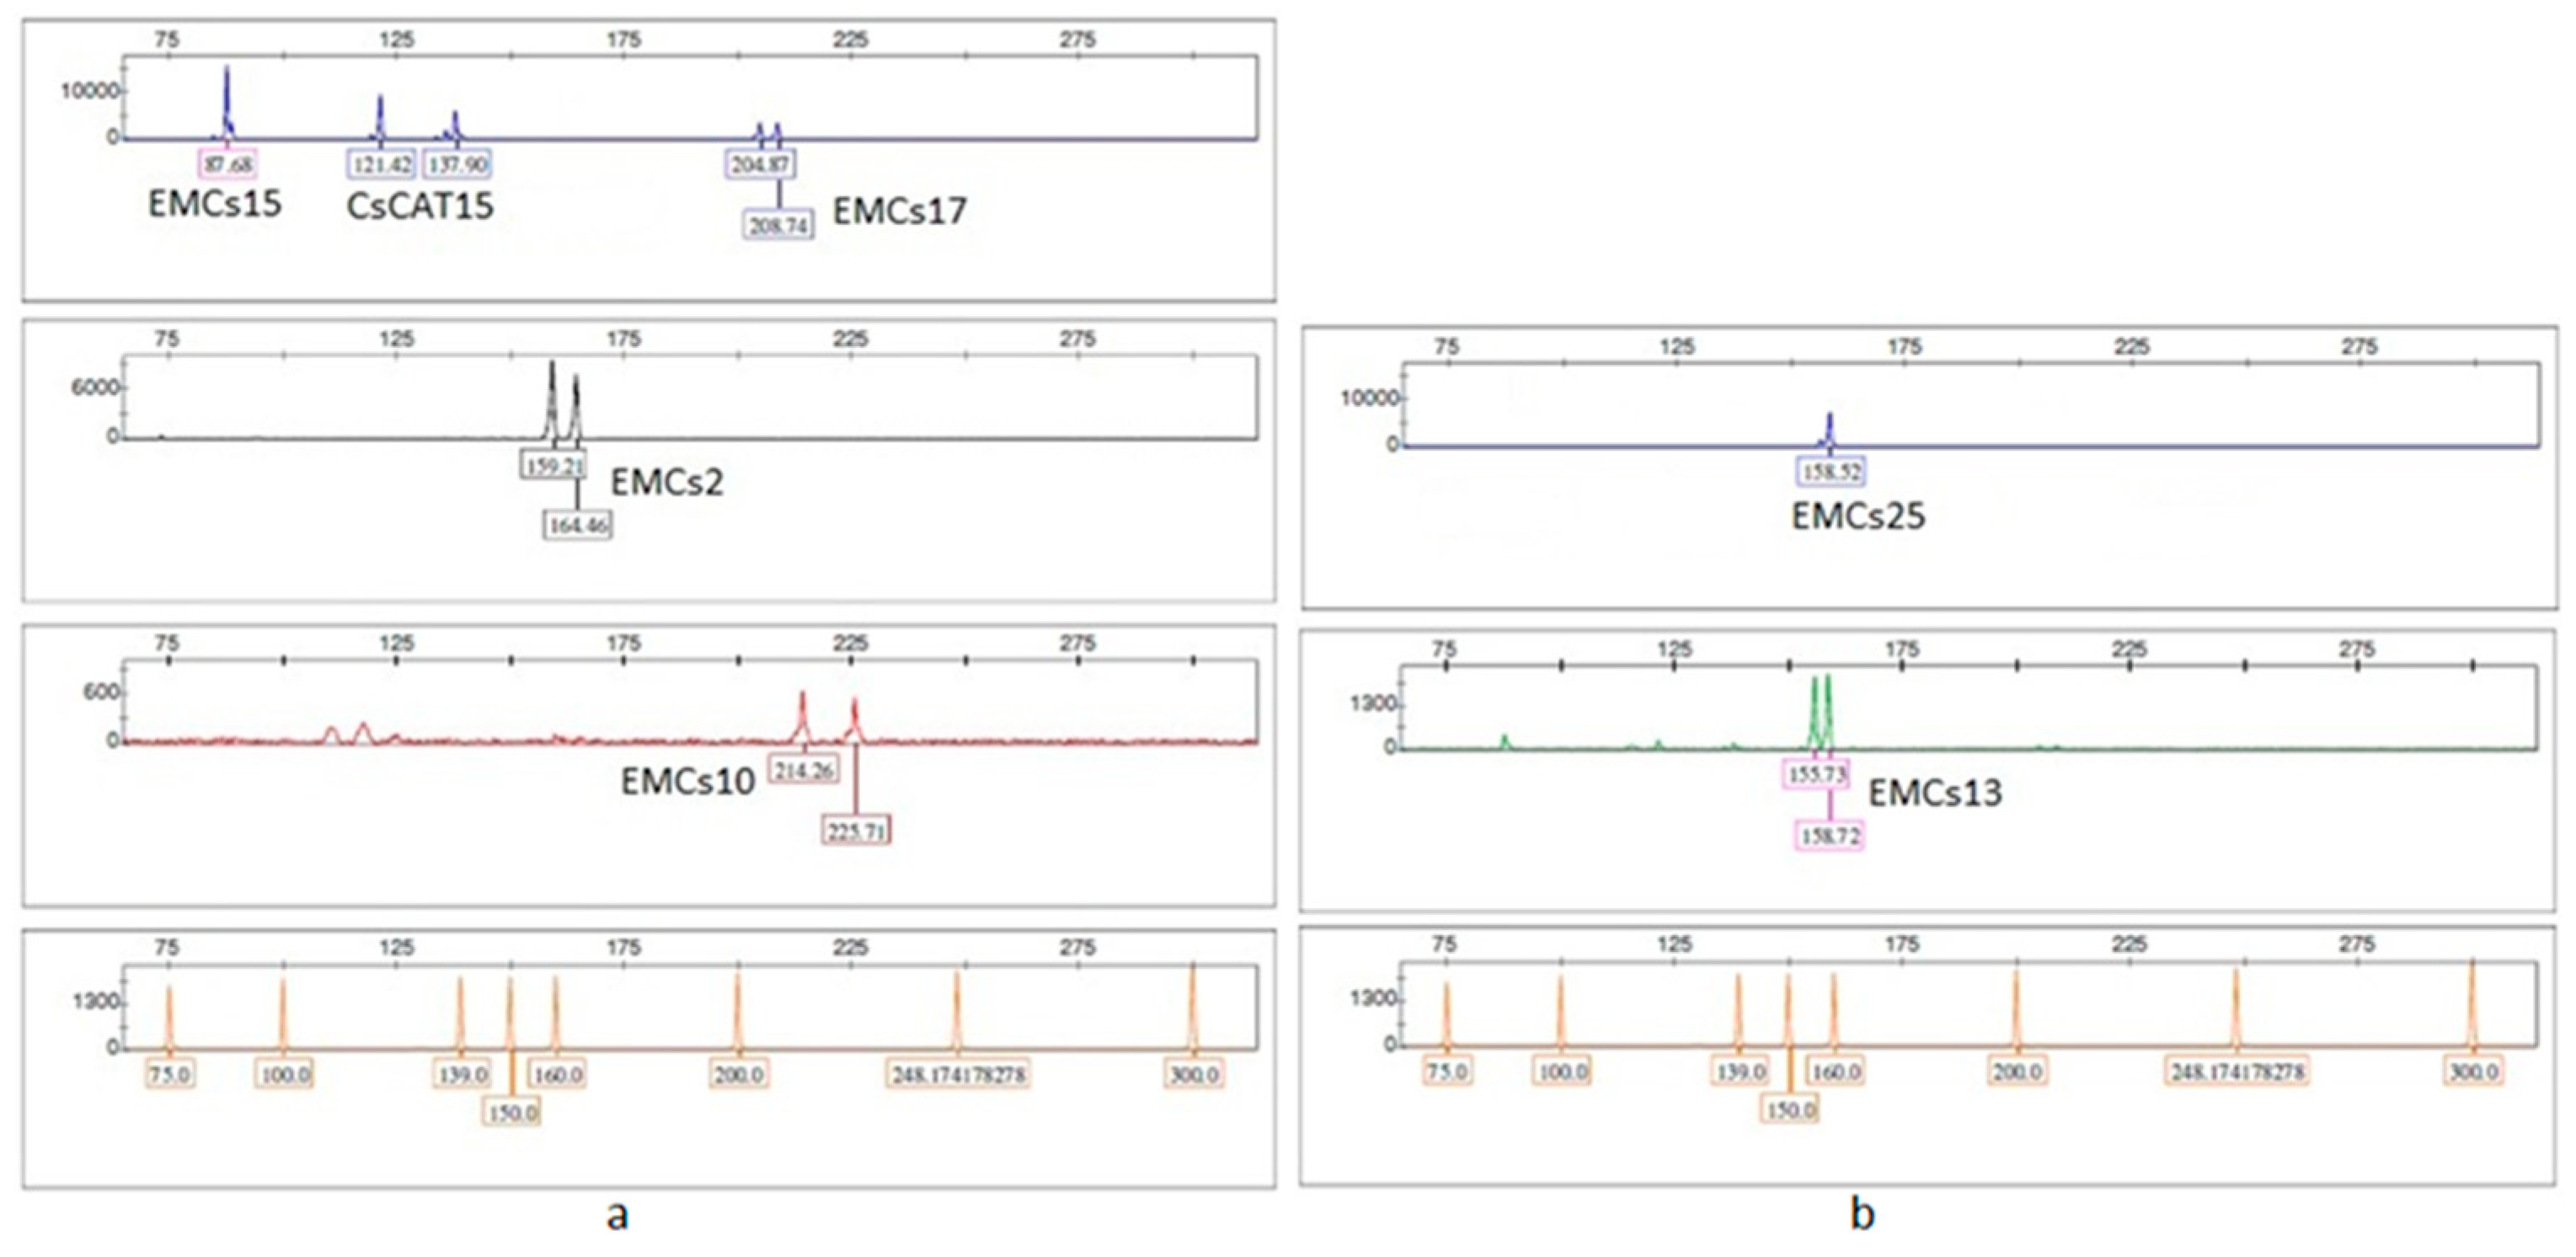
Figure 3.
Percentages of molecular variance from AMOVA for Castanea sativa populations. Variation is partitioned into three components: among populations (3%), among individuals within populations (30%), and within individuals (67%).
Figure 3.
Percentages of molecular variance from AMOVA for Castanea sativa populations. Variation is partitioned into three components: among populations (3%), among individuals within populations (30%), and within individuals (67%).
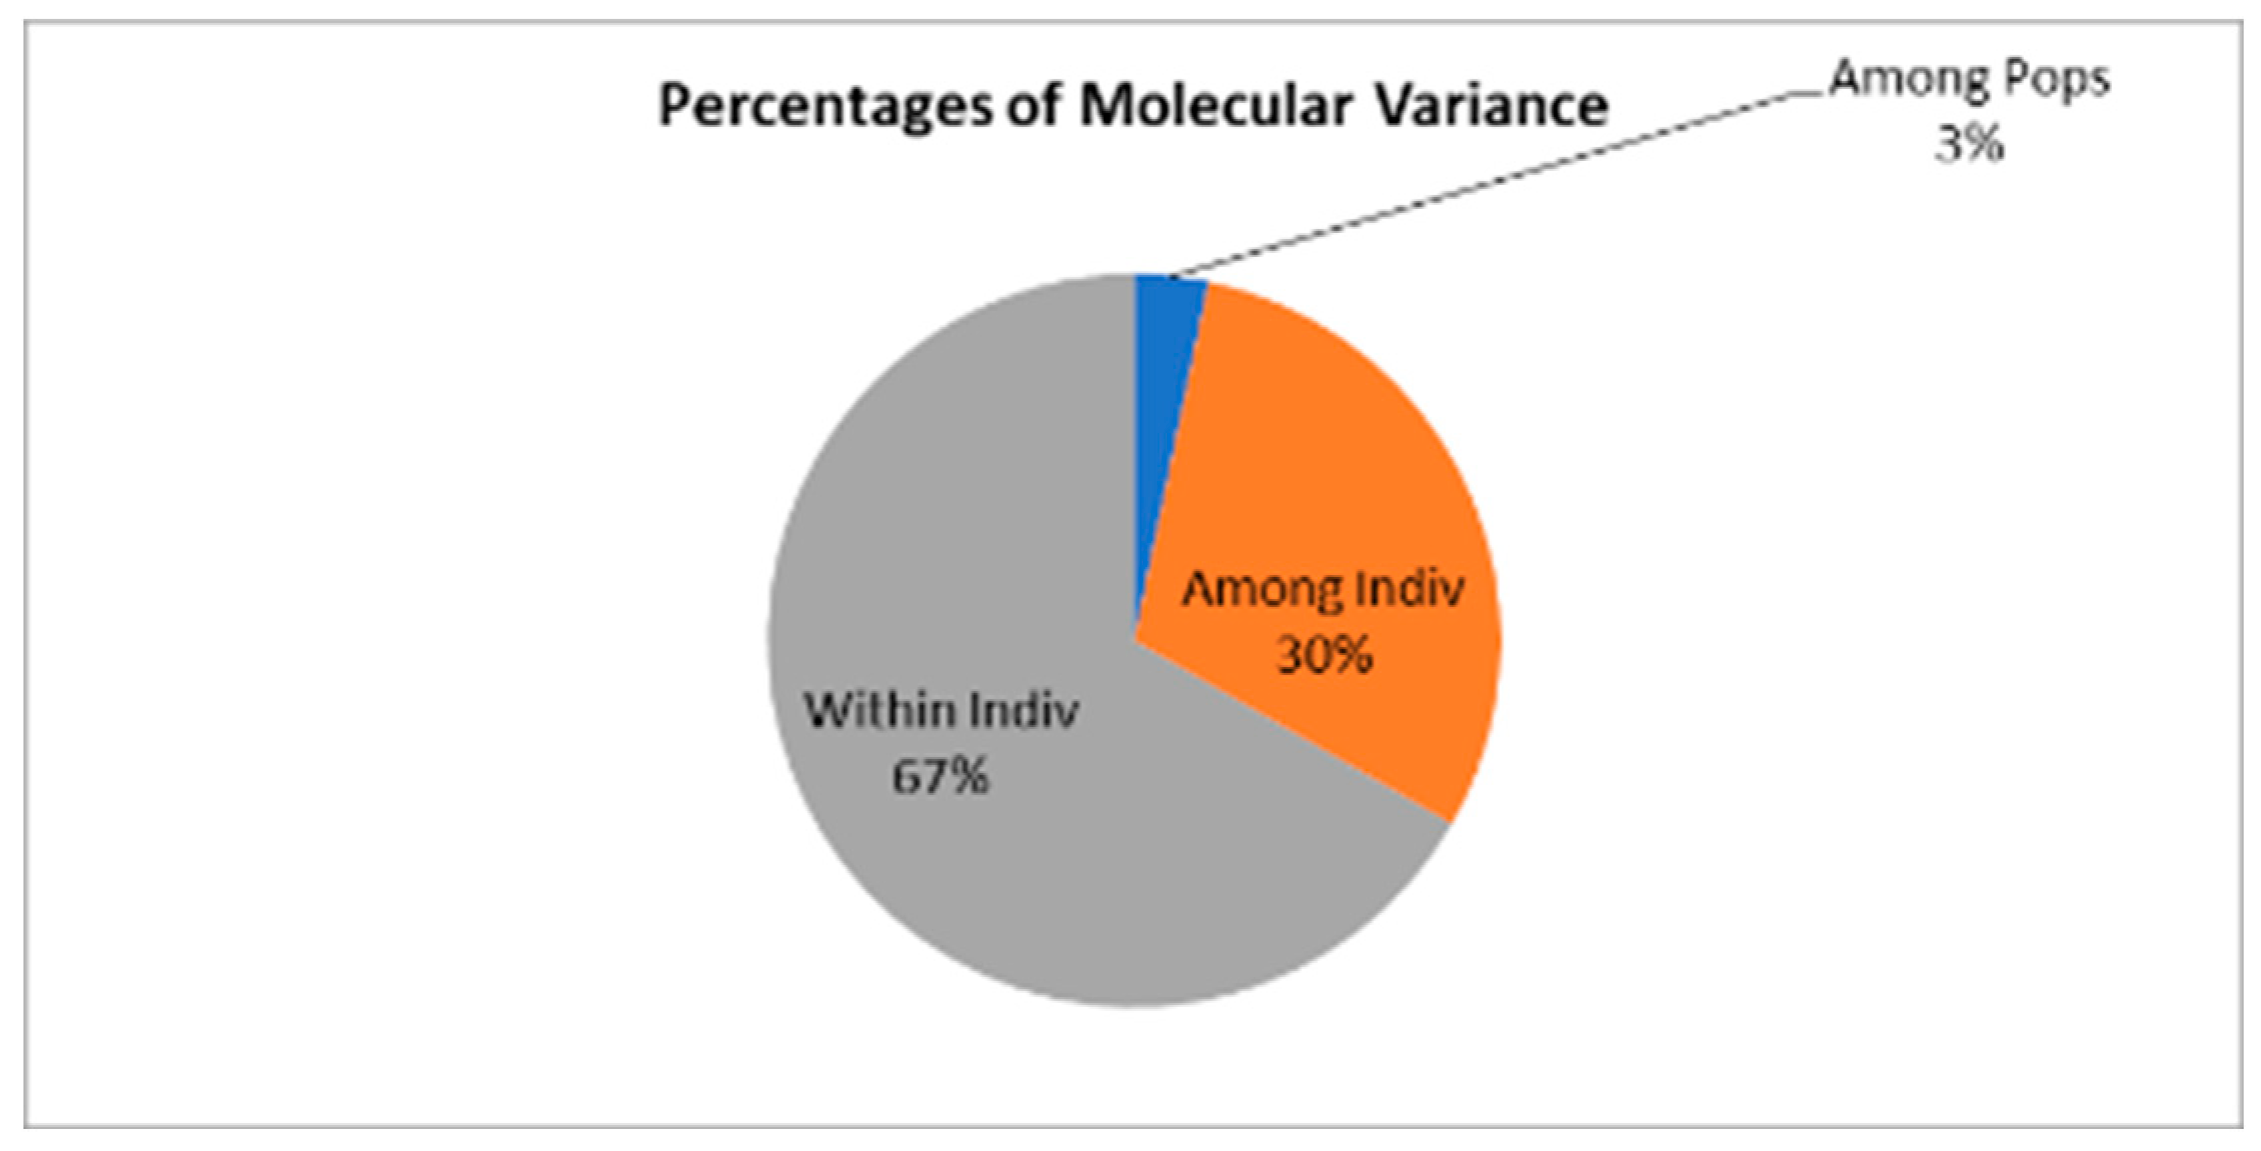
Figure 5.
Heatmap displaying Nei’s genetic distance (upper triangle) and Nei’s genetic identity (lower triangle) among Castanea sativa populations from Petrova Gora (PET), Hrvatska Kostajnica (HRK), and Bačuga (BAC). Warmer (red) shades indicate higher genetic distance (greater differentiation), whereas cooler (blue) shades indicate lower genetic distance or higher genetic identity (greater similarity).
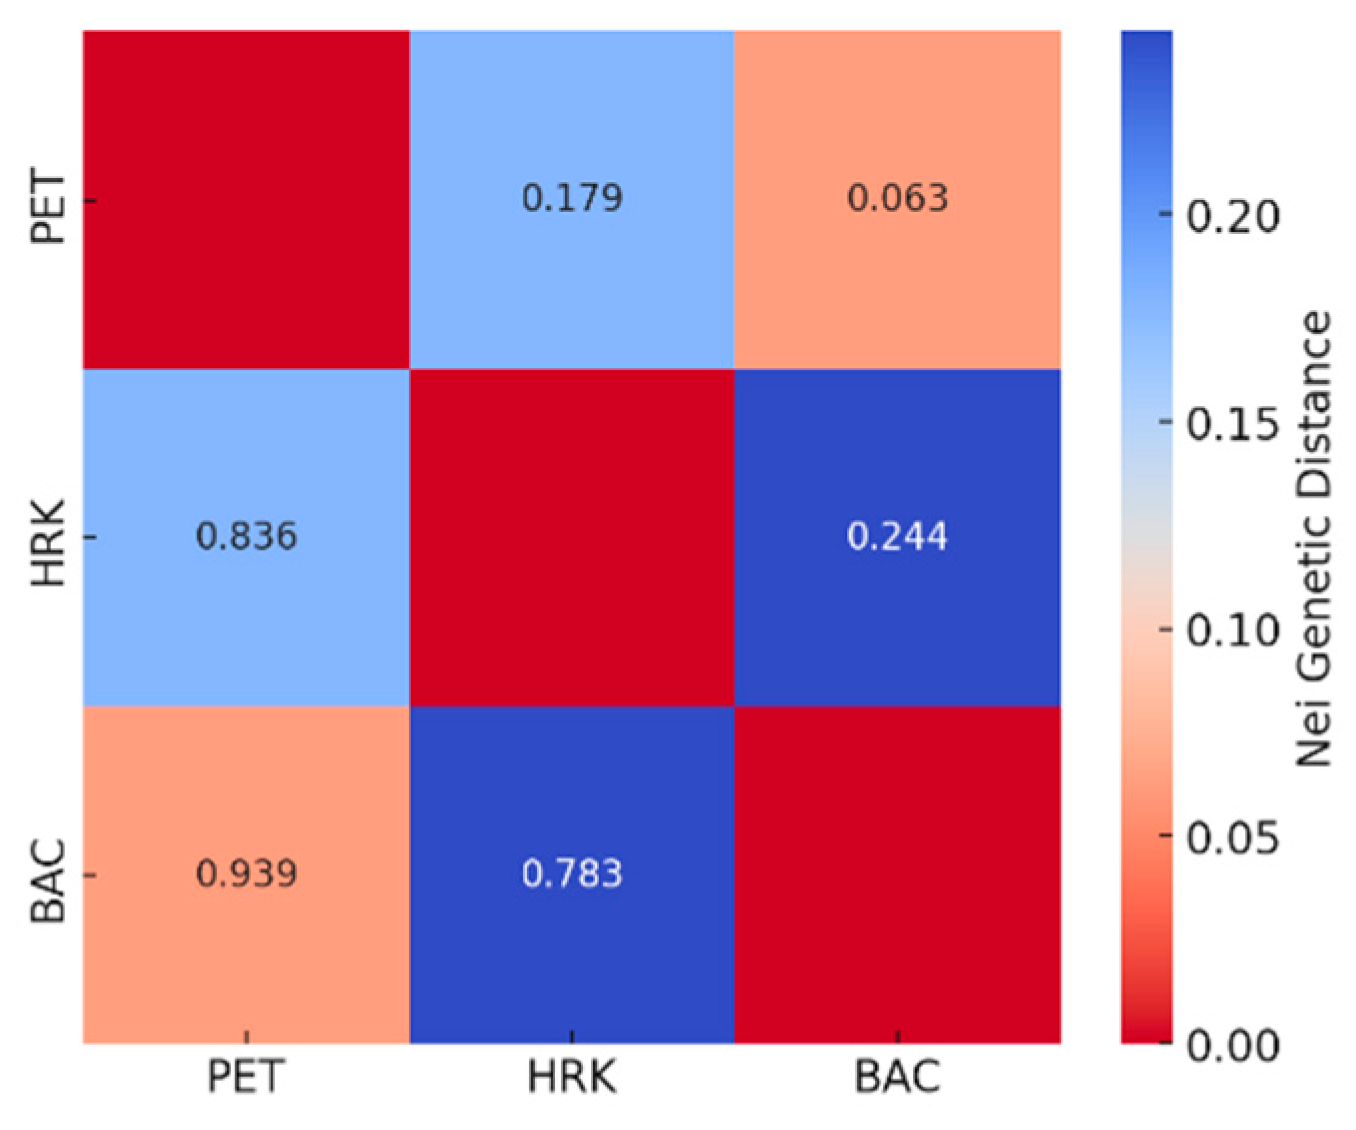
Figure 6.
Heatmap of pairwise FST values (lower triangle) showing genetic differentiation among Castanea sativa populations from Petrova Gora (PET), Hrvatska Kostajnica (HRK), and Bačuga (BAC). Warmer (orange to red) shades indicate higher FST values and greater genetic differentiation, while lighter shades indicate lower FST values and higher genetic similarity.
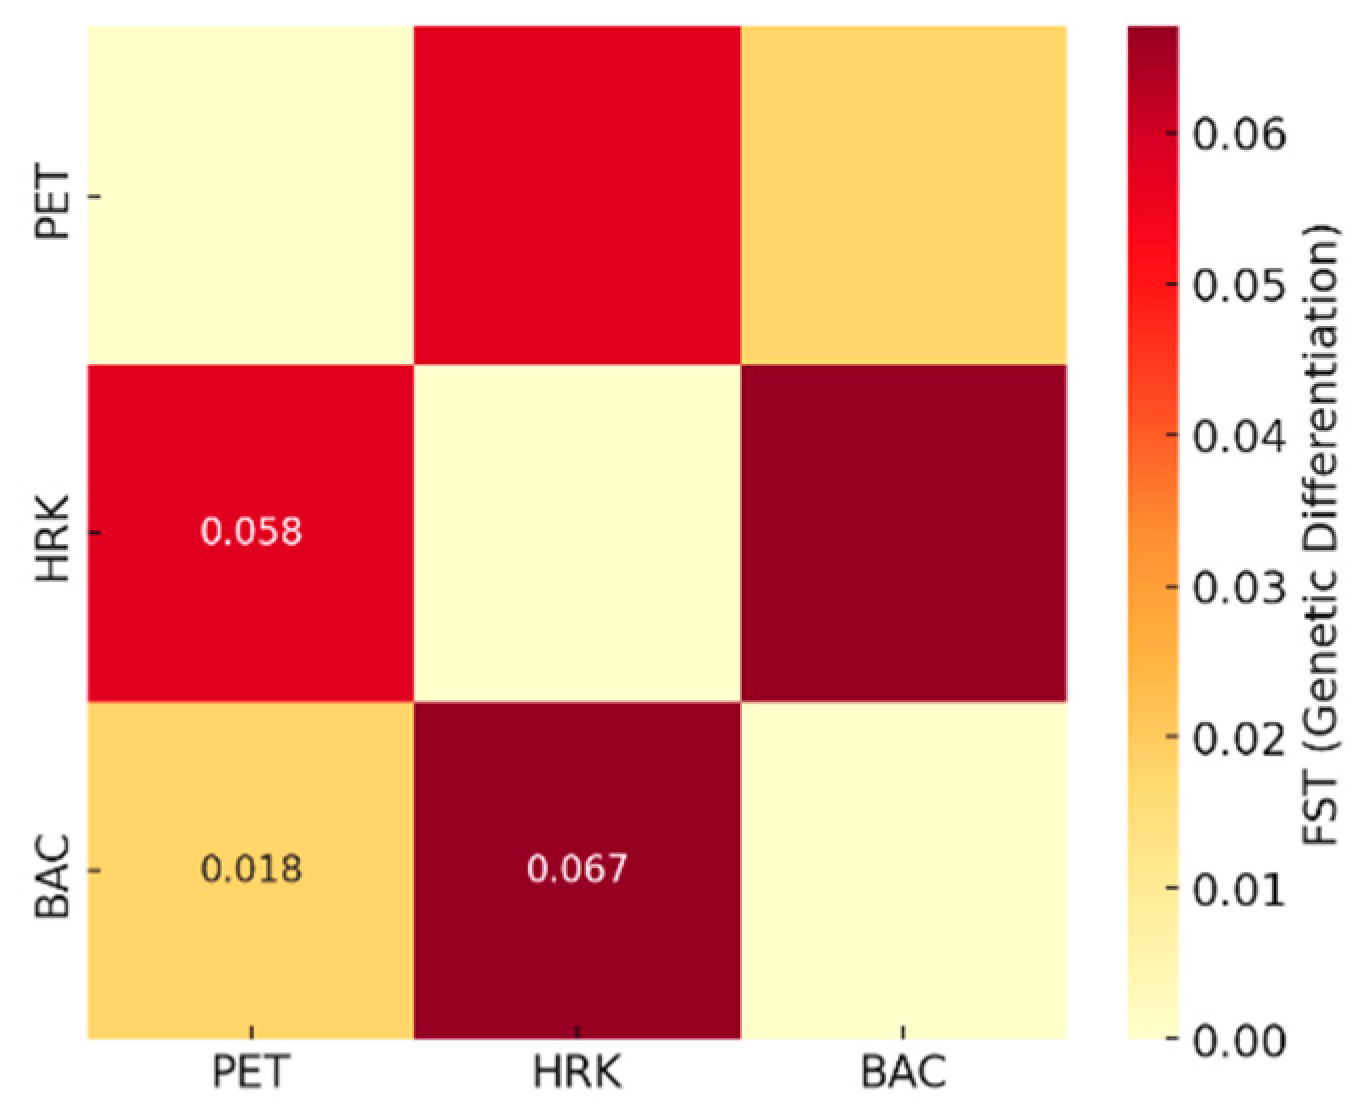
Figure 7.
Principal Coordinates Analysis (PCoA) illustrating the genetic relationships among three Castanea sativa populations POP1 (PET), POP2 (HRK), and POP3 (BAC) based on SSR marker data.
Figure 7.
Principal Coordinates Analysis (PCoA) illustrating the genetic relationships among three Castanea sativa populations POP1 (PET), POP2 (HRK), and POP3 (BAC) based on SSR marker data.
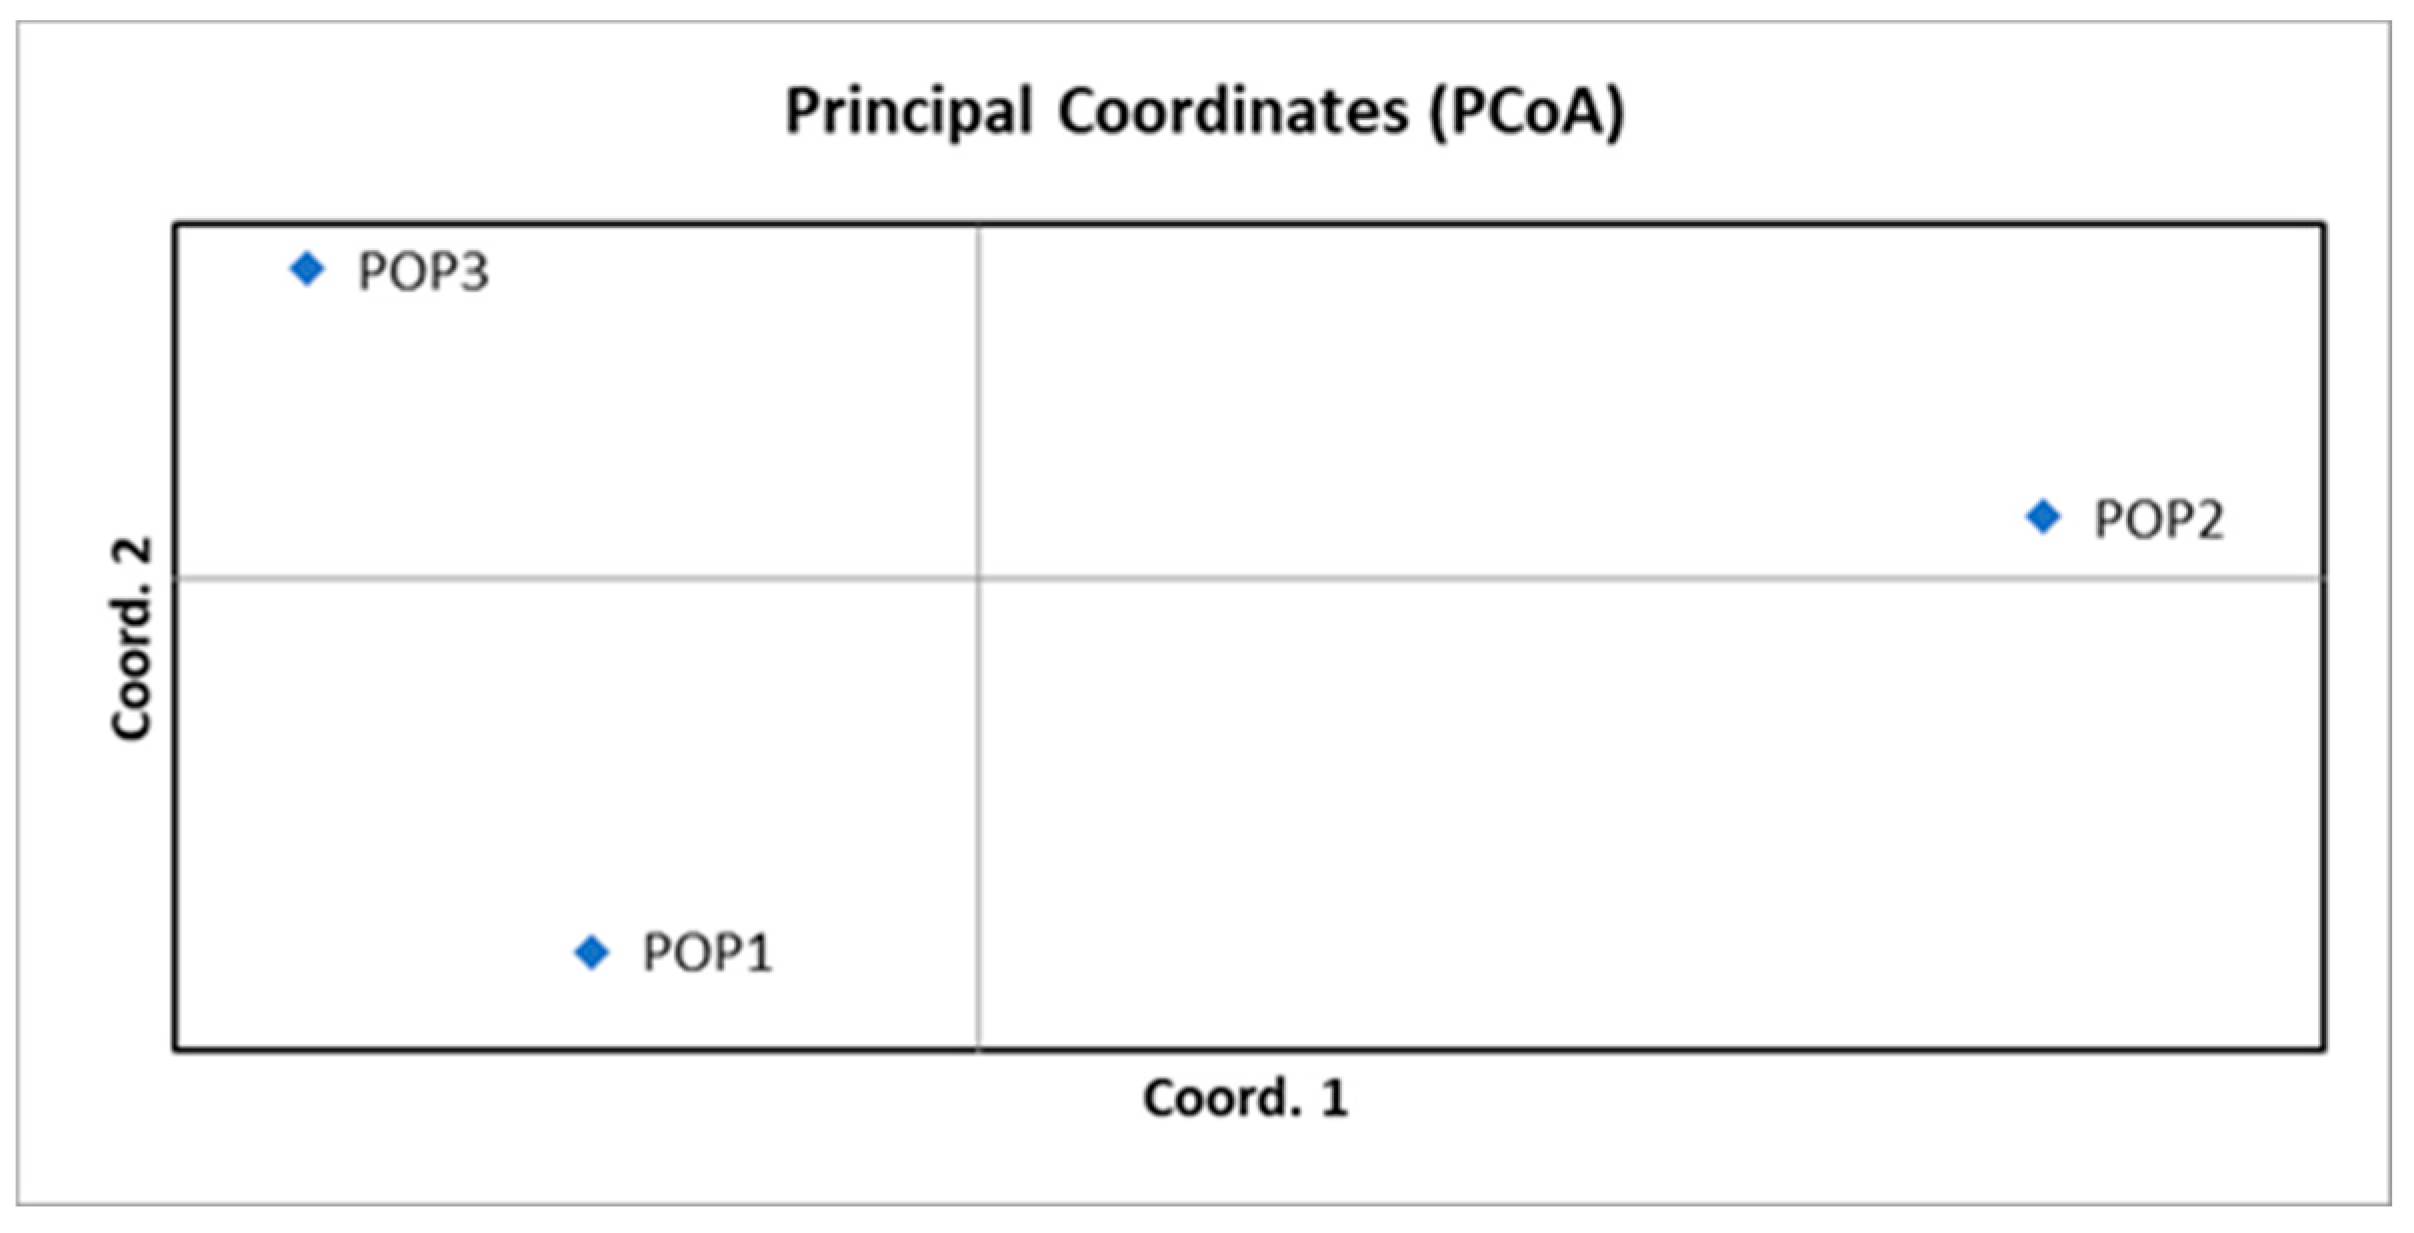
Figure 8.
STRUCTURE analysis of three Castanea sativa populations. (A) ΔK and (B) LnP(K) plots used to determine the most appropriate number of genetic clusters (K), identifying K = 2 as the optimal value. (C) Bar plots showing individual assignment probabilities at K = 1, 2, and 3 based on SSR loci, for the three populations: 1. PET, 2. HRK, and 3. BAC.
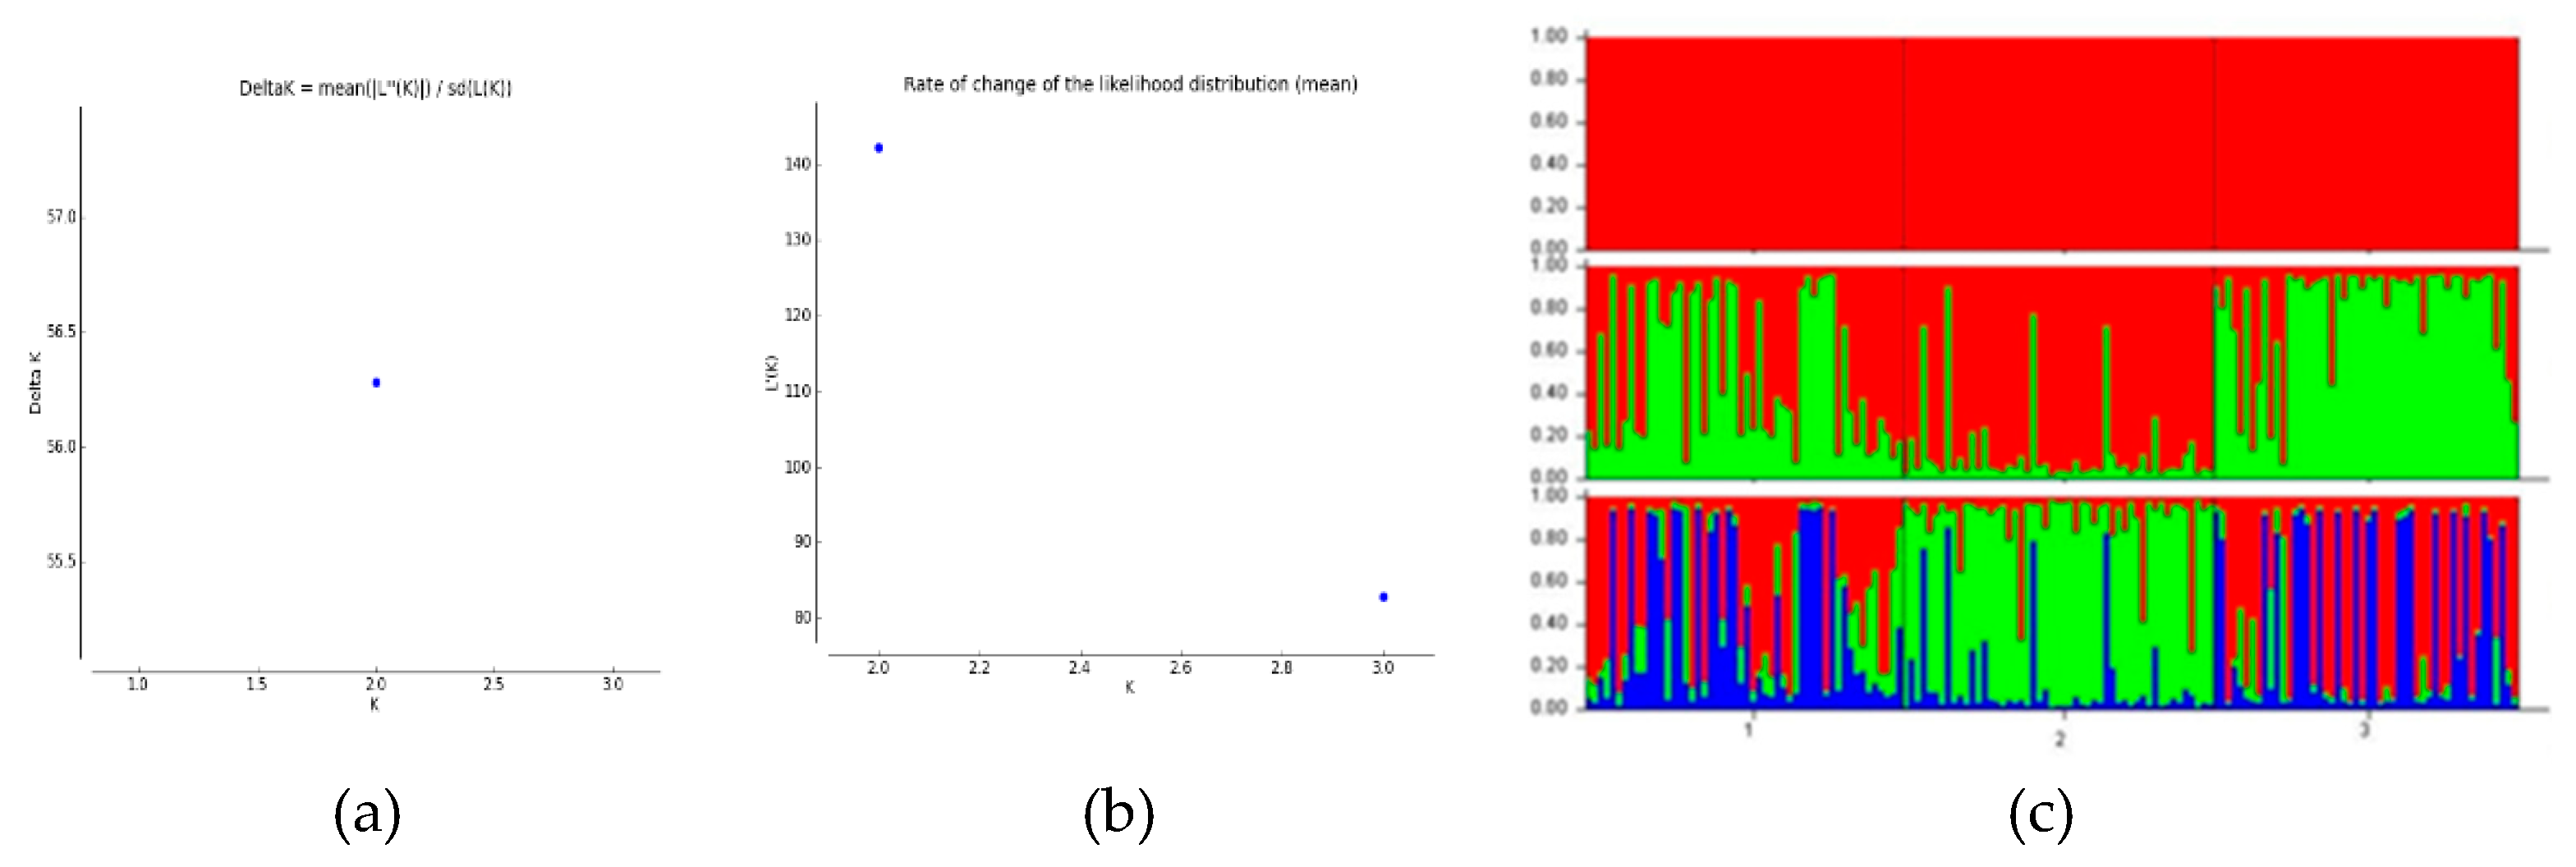

Table 1.
Sampling locations of Castanea sativa populations on Zrin Mountain with geographic coordinates, altitude range, ownership type, year of sample collection, and sample size (N).
Table 1.
Sampling locations of Castanea sativa populations on Zrin Mountain with geographic coordinates, altitude range, ownership type, year of sample collection, and sample size (N).
| Code | Location Description |
Latitude / Longitude |
Altitude (m) | Ownership | Sampling Year | N |
|---|---|---|---|---|---|---|
| PET | Department 47a, Management Unit Vučjak–Tješnjak, Forest Office Petrinja, Forest Administration Sisak, Croatian Forests Ltd. | 45.416972°N, 16.255232° E | 170–390 | State forest | 2011 | 52 |
| HRK | Department 90a, Management Unit Šamarica I, Forest Office Hrvatska Kostajnica, Forest Administration Sisak, Croatian Forests Ltd. |
45.229502°N, 16.493670° E | 140–240 | State forest | 2013 | 51 |
| BAC | Hrastovička Gora | 45.386900°N, 16.273600° E | 374 | Private forest | 2016 | 50 |
Table 2.
Characteristics of the SSR markers used for genotyping Castanea sativa populations.
| Locus | Label | 5'-3' Sequences (F / R) | Expected Length (bp) | Repeat Motif | Reference |
|---|---|---|---|---|---|
| EMCs2 | NED | GCTGATATGGCAATGCTTTTCCTC/ GCCCTCCAGCCTCACTTCATCAG | 172–178 | (CGG)₇ | [27] |
| EMCs10 | PET | GTCTCCCCCAATCATAAGTAGGTC/ TCAAGGGAACATTAGGTCATTTTT | 218–230 | (CA)₈ | [27] |
| EMCs13 | VIC | TAGTCGGAGTACGGGCACAG/ TGATATGAGCATTTGACTTTGATT | 158–164 | (GCA)₈ | [27] |
| EMCs15 | 6-FAM | CTCTTAGACTCCTTCGCCAATC/ CAGAATCAAAGAAGAGAAAGGTC | 089–095 | (CAC)₉ | [27] |
| EMCs17 | 6-FAM | CGCCACGATTAGCTCATTTTCA/ GAGGTAGGGTCTTCTTCGGTCATC | 210–222 | (AGC)₄(CCAA)₅ | [27] |
| EMCs25 | 6-FAM | ATGGGAAAATGGGTAAAGCAGTAA/ AACCGGAGATAGGATTGAACAGAA | 140–158 | (GA)₁₂ | [27] |
| CsCAT15 | 6-FAM | TTCTGCGACCTCGAAACCGA/ GCTAGGGTTTTCATTTCTAG | 125–160 | (TC)₁₂ | [28] |
Table 3.
Genetic diversity and genetic differentiation values calculated with microsatellite (SSR) markers (FIT; Fixation index, FIS; inbreeding coefficient; FST; genetic differentiation coefficient between populations, Nm; Gene flow between populations).
Table 3.
Genetic diversity and genetic differentiation values calculated with microsatellite (SSR) markers (FIT; Fixation index, FIS; inbreeding coefficient; FST; genetic differentiation coefficient between populations, Nm; Gene flow between populations).
| Parameter | EMCs2 | EMCs10 | EMCs13 | EMCs15 | EMCs17 | EMCs25 | CSCAT15 | Total |
|---|---|---|---|---|---|---|---|---|
| Number of alleles and length (bp) | 4 (214,216, 222,226) |
10 (138,140, 144,146, 148,150, 154,156, 158,160) |
3 (155,158, 161) |
3 (79,82, 88) |
4 (156,159, 162,165) |
8 (118,120, 122,124, 128,132, 134,138) |
4 (205,209, 213,217) |
36 alleles |
| Mean±SE | ||||||||
| FIS | -0.033 | 0.565 | 0.095 | -0.48 | 0.037 | 0.13 | 0.13 | 0.125±0.078 |
| FIT | -0.004 | 0.614 | 0.134 | 0.009 | 0.045 | 0.221 | 0.213 | 0.176±0.081 |
| FST | 0.028 | 0.112 | 0.043 | 0.055 | 0.009 | 0.104 | 0.096 | 0.064±0.015 |
| Nm | 8.689 | 1.974 | 5.55 | 4.326 | 27.342 | 2.146 | 2.36 | 7.484±3.432 |
Table 4.
List of private alleles in Castanea sativa population, HRK and BAC.
| Population | Locus | Allele | Frequency |
|---|---|---|---|
| HRK | CsCAT15 | 120 | 0,020 |
| HRK | CsCAT15 | 134 | 0,010 |
| HRK | EMCs25 | 154 | 0,029 |
| BAC | CsCAT15 | 118 | 0,010 |
| BAC | EMCs2 | 156 | 0,010 |
| BAC | EMCs25 | 144 | 0,130 |
| BAC | EMCs25 | 150 | 0,010 |
Table 5.
Genetic diversity parameters (Mean and SE), for Castanea sativa populations PET, HRK, BAC. N: average number of alleles observed, Na: number of different alleles, Ne: effective allele number, I: Shannon index, Ho: observed heterozygosity, He: expected heterozygosity, F: Fixation index, Stat: statistic (Mean and SE), Pop: population.
| Pop | Stat | N | Na | Ne | I | Ho | He | F |
|---|---|---|---|---|---|---|---|---|
| PET | Mean | 52 | 4.143 | 2.39 | 1.015 | 0.511 | 0.569 | 0.074 |
| SE | 0.553 | 0.173 | 0.081 | 0.07 | 0.03 | 0.127 | ||
| HRK | Mean | 51 | 4.143 | 2.313 | 0.979 | 0.448 | 0.553 | 0.179 |
| SE | 0.508 | 0.157 | 0.071 | 0.043 | 0.036 | 0.071 | ||
| BAC | Mean | 50 | 4.429 | 2.631 | 1.096 | 0.506 | 0.59 | 0.127 |
| SE | 0.571 | 0.321 | 0.113 | 0.044 | 0.042 | 0.085 | ||
| Total | Mean | 51 | 4.238 | 2.444 | 1.03 | 0.488 | 0.571 | 0.127 |
| SE | 0.3 | 0.129 | 0.051 | 0.03 | 0.02 | 0.054 |
Table 6.
Analysis of Molecular Variance (AMOVA) showing the partitioning of genetic variation among populations, among individuals, and within individuals.
Table 6.
Analysis of Molecular Variance (AMOVA) showing the partitioning of genetic variation among populations, among individuals, and within individuals.
| Source | df | SS | MS | Est. Var. | % |
|---|---|---|---|---|---|
| Among Populations |
2 | 1542.097 | 771.048 | 5.480 | 3% |
| Among Individuals |
150 | 31826.374 | 212.176 | 50.300 | 30% |
| Within Individuals |
153 | 17071.000 | 111.575 | 111.575 | 67% |
| Total | 305 | 50439.471 | 167.355 | 100% |
Note: df = degrees of freedom; SS = sum of squares; MS = mean square; Est. Var. = estimated variance; % = percentage of total variance.
Table 7.
R-statistics describing the genetic structure among and within Castanea sativa populations based on SSR marker data. RST was calculated based on the stepwise mutation model using SSR markers. p-values are based on 999 permutations. Gene flow (Nm) was estimated as Nm = (1 − RST) / (4 × RST).
| Statistic | Value | P(rand ≥ data) | Interpretation |
|---|---|---|---|
| RST | 0.033 | 0.001 | Among-population differentiation (stepwise model) |
| RIS | 0.311 | 0.001 | Within-individual diversity relative to subpopulations |
| RIT | 0.333 | 0.001 | Within-individual diversity relative to total population |
| Nm | 7.385 | — | Estimated gene flow (number of migrants per generation) |
Table 8.
Two-level AMOVA for Castanea sativa populations.
| Source | df | SS | MS | Est. Var. | % |
|---|---|---|---|---|---|
| Among Pops | 2 | 90.659 | 45.330 | 0.798 | 15% |
| Within Pops | 150 | 698.903 | 4.659 | 4.659 | 85% |
| Total | 152 | 789.562 | 5.457 | 100% |
Table 9.
Summary statistics from AMOVA and gene flow analysis among Castanea sativa populations. PhiPT—fixation index from AMOVA; Nm—number of migrants per generation.
Table 9.
Summary statistics from AMOVA and gene flow analysis among Castanea sativa populations. PhiPT—fixation index from AMOVA; Nm—number of migrants per generation.
| Stat | Value | P (rand ≥ data) |
|---|---|---|
| PhiPT | 0.146 | 0.001 |
| Nm | 1.461 |
Disclaimer/Publisher’s Note: The statements, opinions and data contained in all publications are solely those of the individual author(s) and contributor(s) and not of MDPI and/or the editor(s). MDPI and/or the editor(s) disclaim responsibility for any injury to people or property resulting from any ideas, methods, instructions or products referred to in the content. |
© 2025 by the authors. Licensee MDPI, Basel, Switzerland. This article is an open access article distributed under the terms and conditions of the Creative Commons Attribution (CC BY) license (http://creativecommons.org/licenses/by/4.0/).
Copyright: This open access article is published under a Creative Commons CC BY 4.0 license, which permit the free download, distribution, and reuse, provided that the author and preprint are cited in any reuse.


