
Submitted:
12 August 2025
Posted:
12 August 2025
You are already at the latest version
Abstract
Soil respiration (Rs), the second largest carbon flux in terrestrial ecosystems, plays a key role in regulating soil carbon pools. However, its seasonal and annual responses to extreme events in monsoon forests remain unclear. This study used a continuous multichannel automated chamber system to monitor Rs over three years of drought (2019–2021) in an Asian monsoon forest in Taiwan. We assessed seasonal and annual Rs patterns and examined how drought influenced autotrophic (Rr) and heterotrophic (Rh) respiration through changes in soil temperature and moisture. Results showed Rs declined from 5.20 ± 2.08 to 3.86 ± 1.20 μmol CO₂ m⁻² s⁻¹, and Rh from 3.36 ± 1.21 to 3.15 ± 0.98 μmol CO₂ m⁻² s⁻¹ over the study period. Spring Rr values dropped significantly—by 29.3% in 2020 and 62.2% in 2021 compared to 2019 (p < 0.05), while Rh remained unchanged (p > 0.05). These results suggest that spring drought strongly suppresses autotrophic respiration but has minimal effect on Rh. Incorporating these dynamics into carbon models could improve predictions of carbon cycling under climate change. This study highlights the importance of spring drought in shaping soil carbon fluxes in Asian monsoon forests.
Keywords:
autotrophic respiration
; drought
; heterotrophic respiration
; soil temperature
; soil moisture
1. Introduction
Forest is considered to be a carbon sinks that adsorbed CO2 from atmosphere [1]. Approximately 1146 Pg of carbon is stored in global forests, and over two-third of the total carbon is preserved in litter and soil [2]. Soil respiration (Rs), which is the CO2 efflux from the soil surface to the atmosphere, dominates soil carbon pools and fluxes [3]. Rs contributes 60%–90% of ecosystem respiration in forests [4]. Consequently, the global estimate of Rs can reach 66-100 Pg C y-1[5]. Rs is mainly divided into autotrophic respiration (Rr) and heterotrophic respiration (Rh) [6]. Thus, Rs is affected by biotic factors, such as plant roots and soil microbes, and by abiotic factors, such as soil water content and soil temperature [7,8,9]. Previous studies have demonstrated that soil temperature and soil water content are the key factors that dominate Rs and therefore are well modeled by a broad set of temperature- and/or soil water content-dependent functions in temperate forests [8,10,11], subtropical forests [12], and tropical forests [7]. The Rs will continuously increase and possibly accelerate global warming and climate change in the next few decades [3,13]. However, accurately modeling the Rs variations in forests could face a severe challenge when clarifying the responses and feedbacks of terrestrial ecosystems to climate change and global carbon budget [14,15].
Extreme climate events (e.g., drought and extreme precipitation events) across the world are major terrestrial disturbances and are known to affect forest structures, dynamics and functions [16,17]. Droughts occur will reduce Rs levels due to lower root and soil microbial activities [18,19,20,21]. In contrast, some studies have reported that drought may increase the Rs levels by increasing the growth of root systems [17,22]. However, the intensity and frequency of extreme droughts are anticipated to increase [23], but the scientific understanding of the impact of droughts on Rs is still uncertain, especially in monsoon regions. Climate change intensifies drought damage to forests and thereby affects Rs. Therefore, to forecast Rs levels and their relationships with climate change is helpful for strategies formulation of forest soil carbon management.
Investigating the seasonal and annual variations in Rs in monsoon forests can clarify how forests respond to climate change, especially extreme events. A multichannel automated chamber system was used to collect Rs data continuously during normal and extreme climate events. Continuous observations with high-resolution datasets provide an excellent tool to measure the influence of short-term environmental changes on Rs and can therefore serve as data that are suitable for accurate estimations of the effects of potential long-term extreme climate changes. The aims of this study were to (1) assess the seasonal and annual Rs levels; (2) clarify the relationship between Rs, soil temperature and soil moisture; and (3) examine the responses of soil temperature and moisture on autotrophic and heterotrophic respiration under drought events.
2. Materials and Methods
2.1. Site Description
The Xiaping Botanical Garden Site (XP, 23°77ʹN, 120°77ʹE) was established in 1966 in the Experimental Forest, National Taiwan University (EXFO, NTU), central Taiwan. This evergreen broad-leaf forest site is located at 155 m a.s.l. The average slope of this forest is less than 5°. Tropical and subtropical plantation species were tested for tree growth over 55 years. The dominant tree species are Castanopsis indica, Alstonia scholaris, and Eucalyptus maculata, and the stand density was 365 stems ha–1 in 2021. The mean tree height and diameter at breast height (DBH) and were 26 ± 7 m and 26 ± 12 cm, respectively. The soil classification is Inceptisol, and the bedrock consists of lithic sandstone. The litter layer thickness ranges from 2 to 6 cm, and the annual litterfall amounts were 11 and 9 t ha-1 yr-1 in 2019 and 2020, respectively. The soil depths range from 90-100 cm. The soil texture is loam and has a low bulk density (0.73 g cm-3) at depths of 0-10 cm (Table 1). The soil pH, soil organic carbon content, and total nitrogen were 5.7 ± 0.3, 55.8 ± 0.8 g kg-1 and 3.2 ± 0.1 g kg-1 in the 0-10 cm depth range, respectively. In 1995-2020, the mean annual temperature (MAT) was 22.8°C and the mean annual precipitation (MAP) was 2,197 mm at the Chushan meteorological station (Figure 1).
2.2. Automated Chamber Set and Measurement
In this study, the Rs data based on the chamber method were measured using a multichannel automated chamber system [8,11]. Briefly, the system was combined three components: chamber and air compressor, data logger (CR1000, Campbell Scientific Inc., Logan, UT, USA), and control and measure unit (a control device with an infrared gas analyzer, IRGA, LI-820, LI-COR, Lincoln, NE, USA). An automated chamber (90 cm × 90 cm × 50 cm) equipped with two microfans for mixing air, sampling tubes connected to measure unit for collecting gas samples, and lids for controlling the chamber opening/closing. The gas sample flow was through the IRGA using microdiaphragm pump (flow rate was 700 ml min-1, 5 Lmin-1; CH-50, Enomoto Ltd., Tokyo, Japan). When the measurements start, the chamber lid was closed and two microfans mixed air sequentially, and the Rs data were continuously measured for 150 s. When measurement was ended, the chamber lid was opened until the next measurement. Finally, all datasets were collected and stored instantly for analyzing.
In October 2018, 12 chambers were randomized placed on the forest soil surface of 20 m diameter, and the measurement components were installed at the center of the circle. All understory plants inside the chambers were cut every two weeks to prevent plants from growing on the sides to exclude root respiration in the chambers. From 15 January 2019 to 31 August 2021, all chambers were divided into total Rs and Rh groups. The Rh chambers were trenched (5 cm × 60 cm trenches) along the chamber boundaries. Consequently, we inserted PVC plates (400 cm × 60 cm × 0.4 cm) into the trenches to prevent root extended into the chambers. The autotrophic soil respiration (Rr) levels were calculated as the differences between the Rs and Rh.
In each chamber, we set a thermocouple probe at 5-cm depth and connected to the data logger to monitor the soil temperatures. The soil moisture sensors (SM300, Delta-T Device Ltd., Cambridge, UK) around the chambers were set at 10-cm depth and also connected to the data logger to monitor soil moisture.
2.3. Data Processing
The Rs (μmol CO2 m-2 s-1) were calculated using the following equation:
where V, P, and R are the chamber volume (m3), the atmospheric pressure (Pa), and the ideal gas constant (8.314 Pa m3 K–1 mol–1), Respectively. S, T, and δC/δt are the soil surface area in the chamber (m2), the air temperature in the chamber (K), and the slope of the CO2 ratio (μmol mol-1 s-1), respectively. The soil surface area and chamber volume are 0.81 m2 and 0.405 m3, respectively. Considering the effect of soil temperature on Rs, we transformed the equation as follows [24]:
where a, b and Tsoil are Rs at 0°C, the temperature sensitivity constant, and the soil temperature at a depth of 5 cm, respectively.
The temperature sensitivity index (Q10 coefficient), which is the relative increase in Rs with a 10°C increase in soil temperature, was used b value to estimate:
On the other hand, Lloyd and Taylor (1994 developed the following model to present Rs:
where Rref, E0, and Tref are Rs at a specified reference soil temperature, the temperature sensitivity index, and the specified reference soil temperature (288.15 K), respectively. T0 and Ts are the soil temperature when Rs is zero (227.13 K), and the measured soil temperature, respectively. We used Equation (4) to fill the missing Rs and Rh data values (gaps) in each chamber when we tested the annual temperature-response equation. The gap days counted 45 during the 1045 days of measurements from October 2018 to August 2021. The largest gaps occurred from 20 November to 2 December and from 20 July to 10 August 2020 due to an electric power breakdown, and these gaps were the only gaps longer than 30 days during the three years of observations.
The relationship between Rs and soil moisture was analyzed as follow. First, we subtracted the observation and simulated Rs values calculated by Equation 2. The residual values (RRs) were analyzing the relationship between Rs and soil moisture using concave-downward regression equation:
where RRs, θ, c1, and c2 are the temperature-normalized Rs, the soil moisture content (%), and curve-fitting parameters, respectively. Finally, the variance analysis and regression analysis of all data were applied using Sigmaplot 14.0 software (Systat Software Inc., San Jose, CA, USA).
3. Results
3.1. Seasonal Variations in Rs and the Influences of Soil Temperature and Moisture
We measured about 4 years of continuous soil respiration data. The daily soil temperatures at 5-cm depth ranged from 20.1-30.8°C with peaks in July and August (Figure 2a). The mean annual soil temperatures for Rs and Rh did not show differences from 2019 to 2021 (p>0.05, Figure 3a). The daily soil moisture levels varied between 4.3 and 24.4% and gradually decreased from 17% to 6% from September to November due to a lack of precipitation. The soil moisture levels exhibited peaks that generally occurred on days with high precipitation. In comparison with the annual mean soil moisture levels from 2019 to 2021, the annual mean soil moisture level was 1.86% lower in 2020 and 2.12% lower in 2021 than in 2019, respectively (Figure 3b). Specially, the soil moisture was sustained 4.6% to 8.55% between April and June due to drought event prolonged to late spring season (Figure 2b). The annual precipitation amounts were 2418.5 mm (10% higher than MAP) and 1281 mm (41.6% less than MAP) from 2019 to 2020, respectively (Figure 2b and Figure 3c). High precipitation amounts occurred from April to August, and the annual precipitation proportions of 62.9% and 47.9% were concentrated from June to August from 2019 to 2020, respectively.
The precipitation event characteristics from 2019 to 2021 are shown in Table 2. The total accumulation from precipitation events (<10 mm) consisted 9.5% to 14.5% of the total annual precipitation between 2019 and 2020 (Table 2). On the other hand, precipitation levels greater than 50 mm comprised 21.5% to 50.3% of the strong precipitation events between 2019 and 2020. Spring drought occurred in 2020 and 2021, especially the prolonged spring drought event occurred till the precipitation in June in 2021. The annual precipitation in 2020 was less than 47% of that in 2019 (Figure 2b and Table 2). Specifically, the spring precipitation in 2020 and 2021 were less than 12.4% and 69.1% of that in 2019, respectively (Figure 2b).
3.2. Rs, Rh and Rr Magnitudes at Interannual Timescales
The annual mean soil respiration values from 2019 to 2021 were 5.20 ± 2.08 μmol CO2 m-2 s-1, 4.62 ± 1.23 μmol CO2 m-2 s-1, and 3.86 ± 1.20 μmol CO2 m-2 s-1 for Rs, 3.36 ± 1.21 μmol CO2 m-2 s-1, 3.35 ± 0.89 μmol CO2 m-2 s-1, and 3.15 ± 0.98 μmol CO2 m-2 s-1for Rh, and 1.97 ± 1.01 μmol CO2 m-2 s-1, 1.26 ± 0.36 μmol CO2 m-2 s-1, and 0.69 ± 0.31 μmol CO2 m-2 s-1 for Rr, respectively (Figure 2c and 3d). The mean annual Rs values were significantly higher than those of the Rh and Rr in the same year (p<0.05, Figure 3d). The mean annual Rs and Rr values were significantly higher in 2019 than in 2020 and 2021 (p<0.05). However, the mean annual Rh values exhibited no differences among the 3 years (p>0.05).
3.3. Partition of Heterotrophic Respiration in Soil Respiration
The monthly mean Rr and Rh partition and the differences in Rr and Rh from 2019 to 2021 were shown in Figure 4, respectively. Generally, the growing and non-growing season were showed higher and lower Rs, respectively. The Rs values exhibited their highest peaks in July in 2019 and 2020 (Figure 4a and b) and in June in 2021 (Figure 4c). The Rh/Rs ratios varied from 0.52 to 0.80, 0.69 to 0.73, and 0.73 to 0.90 from 2019 to 2021, respectively. The Rh/Rs ratios were greater than 0.68 before May and decreased to 0.52-0.59 from June to November 2019. On the other hand, the Rh/Rs ratios remained above 0.70 in 2020 and 2021 (Figure 4a, b and c). We also compared the differences in Rr and Rh between 2019 and 2020 and 2019 and 2021. The Rr differences between 2019 and 2020 exhibited positive values from March to December. Moreover, the Rr differences between 2019 and 2021 exhibited positive values from February to August. However, the Rh differences between 2019 and 2020 exhibited positive values from March to May, tended toward zero from June to August, and exhibited negative values from September to December. (Figure 4d). The Rh differences between 2019 and 2021 exhibited positive values from March to May and July to August, and negative values in June (Figure 4e).
3.4. Seasonal Variations in Rs and Rh with Soil Temperature, Temperature Sensitivity, and Soil Moisture
The Rs and Rh levels increased exponentially with soil temperature at 5-cm depth from 2019 to 2021 (p<0.001, Figure 5). Specifically, the coefficients of determination (R2) for Rs and Rh from 2019 to 2021 varied from 0.411 to 0.628 and from 0.221 to 0.614, respectively. The temperature sensitivity (Q10) values for the Rs and Rh from 2019 to 2021 varied from 2.03 to 5.20 and from 1.78 to 3.22, respectively (Figure 5).
The relationships among the Rs, Rh and soil moisture levels were analyzed by using temperature-normalized Rs and Rh data (RRs: the residuals of the measured Rs and predicted values of Rs using Equation 5). In general, the relationship between the Rs and soil moisture exhibited a concave-downward curve. However, this relationship was relatively weak when we calculated the RRs data from 2019 to 2021. Therefore, we used a linear equation to replace the concave-downward curve in this study. The significant relationships between the temperature-normalized soil respiration and soil moisture are shown in Figure 6 (p<0.001). Specifically, the coefficients of determination for Rs and Rh from 2019 to 2021 varied from 0.232 to 0.342 and from 0.234 to 0.420, respectively (Figure 6).
3.5. Drought Inhibited Environmental Factors, Rs, Rh, and Rr Magnitude in Spring
The mean soil temperature values for Rs and Rh in 2021 were significantly higher than those in 2019 and 2020, respectively (p<0.05, Figure 7a). In contrast, the sum of spring precipitation decreased by12.4% and 69.1% in 2020 and in 2021 compared with that in 2019, respectively. Furthermore, the mean spring values of the volumetric soil moisture were significantly lower 25.7% in 2020 and 51.9% in 2021 than that in 2019, respectively (p<0.05, Figure 7b). The mean spring values for the Rs, Rh and Rr from 2019 to 2021 were shown in Figure 7d. The mean Rs values in spring were significantly higher than those for Rh and Rr in the same year (p<0.05, Figure 7d). The mean Rr values in spring were significantly lower 29.3% in 2020 and 62.2% in 2021 than in 2019, respectively (p<0.05). However, the mean spring Rh values exhibited no differences among these 3 years (p>0.05).
The relationships between the differences in monthly mean soil moistures and monthly mean Rh and Rr values in non-growing season between 2019 and 2020 are shown in Figure 8. The differences in soil moisture significantly increased with the Rh differences (R2=0.941 in 2020, R2=0.875 in 2021, p<0.001) (R2=0.780 in 2020, R2=0.896 in 2021, p<0.001). On the other hand, the differences in soil moisture also increased with the Rr differences (R2=0.780 in 2020, R2=0.896 in 2021, p<0.001).
4. Discussion
4.1. Impacts of Temperature and Moisture on the Rs Components
Soil temperature and soil moisture were demonstrated the main drivers of Rs [25], and the apparent seasonal Rs patterns were explained well by the soil temperatures in all years. This finding, which was the same as those for broadleaved evergreen temperate forests [26], tropical [27,28], and subtropical forest [23,29], demonstrated that the Rs levels were highest in summer and lowest in winter (Figure 3 and 5). Soil moisture can restrict root and microbial activity under high and low moisture conditions and subsequently decrease the Rs. Soil moistures of 15%-25% are considered to be optimal for soil respiration in subtropical forests [30]. Low soil moisture leads to water stress in plants and microorganisms [19]. According to this effect, decreased precipitation levels are expected to suppress Rs. Precipitation reduction experiments have shown that the Rs levels decrease with decreasing soil moisture [22,28,29]. In this study, we found that the influence of drought on Rs was due to a variety of factors and was seasonally related, which resulted in the Rs being less sensitive to drought in the winter season. Moreover, the soil moisture levels at 10-cm depths ranged between 4.3% and 24.4% during the entire experimental period. The soil suffered water deficits, especially in 2020 and prolonged to June 2021, which resulted in a positive correlation between Rh and soil moisture. These results are possibly related to the coupling of low soil temperatures and soil moistures during the winter seasons in 2019 and 2020. Lower soil temperatures decrease root and microbial activities and the diffusion of organic substrates [28]. Furthermore, the occurrence of less than 6% of annual precipitation during both winter seasons in 2019 and 2020 and prolonged to late spring in 2021 leads to low soil moisture and Rs values, and similar results were also reported for tropical forests [28]. In contrast, the soil temperatures may not be a limiting factor for Rs in either summer season during the experimental periods. However, the lower frequency and strength of precipitation significantly restricted the soil moisture in 2020 and 2021, which may have resulted in a decrease in Rs.
4.2. Response of Temperature Sensitivity on Rs Components
Soil-water deficits weaken the sensitivity of Rs to soil temperature, and our study results found that drought led to decreases in the Q10 values of Rs and Rh, which were consistent with previous results for temperate forests [31,32]. The annual Q10 values for Rs that were affected by drought were similar to those in normal years, which reflected a stricter relationship between Q10 and root activities [33]. Furthermore, the results also suggest that the Rh was less sensitive than Rr to drought conditions, which indicated that drought might have a gentle response mechanism for the decomposition of soil organic matter.
4.3. Responses of Different Respiration Components to Seasonal Variations
In this study, spring drought decreased the Rr levels more significantly than the Rh levels (p<0.05, Figure 4c and 7d). Hinko-Najera, Fest, Livesley and Arndt [26] and Huang, Wu, Gong, You, Sha and Lu [29] reported that the Rr levels were suppressed more than the Rh levels during prolonged droughts in a dry temperate broadleaved evergreen forest and in a subtropical forest. The different responses of the Rr and Rh to drought might result from the differences in internal plant C allocation by shifting more C to growth than to Rr [26] and root phenology [34].
The seasonal variations in Rr were likely to be controlled by the plant phenology. Fine root growth is mainly controlled by soil moisture [26], and a reduction in Rr due to drought or suppression of fine root growth during summer has been reported [26,32]. The Rr levels gradually increased from March to May and rapidly increased from June to August in 2091 and 2020, which was characterized by a period of rapid plant growth. The higher soil moisture levels from May to August 2019 benefited plant growth and resulted in higher Rr values. Drought may limit plant growth and decrease litter production, which restricts the supply of photosynthesis products to root respiration [22]. Positive differences in the Rr levels between 2019 and 2020 and 2019 and 2021 were observed from June to August and could be attributed to the phonological development of the plants in the normal year. Matteucci, et al. [35] reported that Rh is predominantly influnced by soil moisture in hot and dry growing seasons and by soil temperature in wet and cold seasons. Lower soil moisture alleviates the respiration increase at higher temperatures due to the substrate availability may depend on water content [36]. In this study, the differences in the seasonal Rh patterns during the normal and drought occurred years could be attributed to the different precipitation distributions (Figure 2). Furthermore, drought stress may limit Rh levels by reducing the diffusion of organic substrates to the microbial community [22,37]. In our findings, spring drought might limit root development, especially in the growing season, and therefore, the Rr levels would decrease significantly. In contrast, the soil temperatures explained > 87.5% of the seasonal variations in Rh in drought years, but the Rh values were not affected by soil moisture changes (Figure 8). Microbial activities are similar for all biochemical processes that are temperature dependent within an optimal range of soil moisture [37]. Moreover, microbial communities adapt to the lower soil bulk density and loamy texture in which the maximum soil moisture is less than 25%, which resulted in the Rh levels not being limited by soil moisture when the soil temperatures were not a limiting factor. The stronger effect of soil moisture on Rs in 2020 and 2021 relative to that in 2019, as well as the greater decrease in Rr than Rh under drought, suggests that drought amplified the water limitation effects on CO2 emissions, especially those from autotrophic respiration (Figure 8). Therefore, the contribution of Rr to Rs significantly decreased, which suggested a more pronounced negative effect on the Rr than on Rh. In this study, the factors that controlled the seasonal variations in respiration that differed for Rr and Rh reflected drought behavior. Notably, we observed that prolonged drought event did not cause tree mortality in this experiment period, likely the deeper roots of larger trees can relieve soil water stress [38,39]. Our results highlight the need to calculate the different responses to drought between Ra and Rh in monsoon forests when predicting the reaction of the ecosystem carbon balance in response to future drought events.
5. Conclusions
The results of the present study demonstrate that prolonged spring drought significantly inhibited the Rs levels, which were primarily driven by the decrease in Rr due to lower soil moisture content. However, the Rh levels were largely decoupled from the soil temperatures in drought events when the soil moisture availability was limited. In the present study, the factors that controlled the seasonal variations in respiration that differed for Rr and Rh reflected drought behavior. Our results highlight the need to calculate the different responses to drought between Ra and Rh in monsoon forests when predicting the reaction of the ecosystem carbon balance in response to future drought events. In summary, the inhibition effects of spring drought on Rr and the negligible effect of spring drought on Rh should be incorporated into models to improve predictions of the global carbon cycle. The findings for spring drought provide new perspective to the effects of precipitation variation on soil respiration in Asian monsoon forests in Taiwan and possible have noteworthy implications for the soil and global carbon budgets under future climate change.
Author Contributions
Conceptualization, P.-N.C., J.-C.Y. and W.-T.L.; methodology, P.-N.C., J.-C.Y. and W.-T.L.; formal analysis, J.-C.Y. and W.-T.L.; writing—original draft preparation, P.-N.C. and J.-C.Y.; writing—review and editing, P.-N.C., J.-C.Y. and W.-T.L.; visualization, P.-N.C.; funding acquisition, P.-N.C. All authors have read and agreed to the published version of the manuscript.
Funding
Please add: This research was partially supported by the Ministry of Science Technology, grant number MOST107-2313-B-002-035 and MOST 109-2313-B-002-038 and by the Experimental Forest, National Taiwan University (110EXFOE03).
Data Availability Statement
The data presented in this study are amiable on request from the corresponding author. The data are not publicly available due to privacy.
Acknowledgments
This field works supported by the Experimental Forest, National Taiwan University. Data from the publication are available from the Experimental Forest, National Taiwan University. We greatly appreciate the anonymous reviewers for their constructive and insightful comments and suggestions that significantly improved the quality of our paper.
Conflicts of Interest
The authors declare no conflict of interest.
References
- Lal, R.; Smith, P.; Jungkunst, H.F.; Mitsch, W.J.; Lehmann, J.; Nair, P.K.R.; McBratney, A.B.; Sá, J.C.D.; Schneider, J.; Zinn, Y.L.; et al. The carbon sequestration potential of terrestrial ecosystems. Journal of Soil and Water Conservation 2018, 73, A145-A152. [CrossRef]
- Dixon, R.K.; Solomon, A.M.; Brown, S.; Houghton, R.A.; Trexier, M.C.; Wisniewski, J. Carbon Pools and Flux of Global Forest Ecosystems. Science (New York, N.Y.) 1994, 263, 185-190. [CrossRef]
- Bond-Lamberty, B.; Thomson, A. Temperature-associated increases in the global soil respiration record. Nature 2010, 464, 579. [CrossRef]
- Law, B.E.; Kelliher, F.M.; Baldocchi, D.D.; Anthoni, P.M.; Irvine, J.; Moore, D.; Van Tuyl, S. Spatial and temporal variation in respiration in a young ponderosa pine forests during a summer drought. Agricultural and Forest Meteorology 2001, 110, 27-43. [CrossRef]
- Jian, J.; Steele, M.K.; Thomas, R.Q.; Day, S.D.; Hodges, S.C. Constraining estimates of global soil respiration by quantifying sources of variability. Global Change Biology 2018, 24, 4143-4159. [CrossRef]
- Zhao, X.; Liang, N.; Zeng, J.; Mohti, A. A simple model for partitioning forest soil respiration based on root allometry. Soil Biology and Biochemistry 2021, 152, 108067. [CrossRef]
- Chiang, P.N.; Yu, J.C.; Lai, Y.J. Soil respiration variation among four tree species at young afforested sites under the influence of frequent typhoon occurrences. Forests 2021, 12, 787. [CrossRef]
- Teramoto, M.; Liang, N.; Ishida, S.; Zeng, J. Long-term stimulatory warming effect on soil heterotrophic respiration in a cool-temperate broad-leaved deciduous forest in northern Japan. Journal of Geophysical Research: Biogeosciences 2018, 123, 1161-1177. [CrossRef]
- Yan, Z.; Bond-Lamberty, B.; Todd-Brown, K.E.; Bailey, V.L.; Li, S.; Liu, C.; Liu, C. A moisture function of soil heterotrophic respiration that incorporates microscale processes. Nature Communications 2018, 9, 2562. [CrossRef]
- Liang, N.S.; Teramoto, M.; Takagi, M.; Zeng, J.Y. Data Descriptor: High-resolution data on the impact of warming on soil CO2 efflux from an Asian monsoon forest. Sci. Data 2017, 4, 11. [CrossRef]
- Yan, T.; Song, H.H.; Wang, Z.Q.; Teramoto, M.; Wang, J.S.; Liang, N.S.; Ma, C.; Sun, Z.Z.; Xi, Y.; Li, L.L.; et al. Temperature sensitivity of soil respiration across multiple time scales in a temperate plantation forest. Sci Total Environ 2019, 688, 479-485. [CrossRef]
- Yu, J.-C.; Chiang, P.-N.; Lai, Y.-J.; Tsai, M.-J.; Wang, Y.-N. High rainfall inhibited soil respiration in an Asian monsoon forest in Taiwan. Forests 2021, 12, 239. [CrossRef]
- Li, W.; Wang, J.; Zhang, X.; Shi, S.; Cao, W. Effect of degradation and rebuilding of artificial grasslands on soil respiration and carbon and nitrogen pools on an alpine meadow of the Qinghai-Tibetan Plateau. Ecol Eng 2018, 111, 134-142. [CrossRef]
- Hashimoto, S.; Carvalhais, N.; Ito, A.; Migliavacca, M.; Nishina, K.; Reichstein, M. Global spatiotemporal distribution of soil respiration modeled using a global database. Biogeosciences 2015, 12, 4121-4132. [CrossRef]
- van Gestel, N.; Shi, Z.; van Groenigen, K.J.; Osenberg, C.W.; Andresen, L.C.; Dukes, J.S.; Hovenden, M.J.; Luo, Y.; Michelsen, A.; Pendall, E.; et al. Predicting soil carbon loss with warming. Nature 2018, 554, E4-E5. [CrossRef]
- Barba, J.; Lloret, F.; Poyatos, R.; Molowny-Horas, R.; Yuste, J.C. Multi-temporal influence of vegetation on soil respiration in a drought-affected forest. iForest 2018, 11, 189-198. [CrossRef]
- Chang, C.T.; Sperlich, D.; Sabate, S.; Sanchez-Costa, E.; Cotillas, M.; Espelta, J.M.; Gracia, C. Mitigating the stress of drought on soil respiration by selective thinning: Contrasting effects of drought on soil respiration of two oak species in a mediterranean forest. Forests 2016, 7, 16. [CrossRef]
- Darenova, E.; Holub, P.; Krupkova, L.; Pavelka, M. Effect of repeated spring drought and summer heavy rain on managed grassland biomass production and CO2 efflux. Journal of Plant Ecology 2016, 10, 476-485. [CrossRef]
- Davidson, E.A.; Belk, E.; Boone, R.D. Soil water content and temperature as independent or confounded factors controlling soil respiration in a temperate mixed hardwood forest. Global Change Biology 1998, 4, 217-227. [CrossRef]
- Rahman, M.M.; Hicks, L.C.; Verheyen, K.; Rousk, J.; Carnol, M. Effects of drought legacy and tree species admixing on bacterial growth and respiration in a young forest soil upon drying and rewetting. Soil Biol Biochem 2018, 127, 148-155. [CrossRef]
- Davidson, E.A.; Verchot, L.V.; Cattanio, J.H.; Ackerman, I.L.; Carvalho, J.E.M. Effects of soil water content on soil respiration in forests and cattle pastures of eastern Amazonia. Biogeochemistry 2000, 48, 53-69. [CrossRef]
- Zheng, P.F.; Wang, D.D.; Yu, X.X.; Jia, G.D.; Liu, Z.Q.; Wang, Y.S.; Zhang, Y.G. Effects of drought and rainfall events on soil autotrophic respiration and heterotrophic respiration. Agr Ecosyst Environ 2021, 308, 9. [CrossRef]
- Huang, S.; Ye, G.; Lin, J.; Chen, K.; Xu, X.; Ruan, H.; Tan, F.; Chen, H.Y.H. Autotrophic and heterotrophic soil respiration responds asymmetrically to drought in a subtropical forest in the Southeast China. Soil Biology and Biochemistry 2018, 123, 242-249. [CrossRef]
- Lloyd, J.; Taylor, J.A. On the Temperature-dependence of soil respiration. Functional Ecology 1994, 8, 315-323. [CrossRef]
- Raich, J.W. Temporal variability of soil respiration in experimental tree plantations in lowland Costa Rica. Forests 2017, 8, 40. [CrossRef]
- Hinko-Najera, N.; Fest, B.; Livesley, S.J.; Arndt, S.K. Reduced throughfall decreases autotrophic respiration, but not heterotrophic respiration in a dry temperate broadleaved evergreen forest. Agricultural and Forest Meteorology 2015, 200, 66-77. [CrossRef]
- Deng, Q.; Zhang, D.; Han, X.; Chu, G.; Zhang, Q.; Hui, D. Changing rainfall frequency rather than drought rapidly alters annual soil respiration in a tropical forest. Soil Biology and Biochemistry 2018, 121, 8-15. [CrossRef]
- Zhang, X.; Zhang, Y.; Sha, L.; Wu, C.; Tan, Z.; Song, Q.; Liu, Y.; Dong, L. Effects of continuous drought stress on soil respiration in a tropical rainforest in southwest China. Plant Soil 2015, 394, 343-353. [CrossRef]
- Huang, C.; Wu, C.; Gong, H.; You, G.; Sha, L.; Lu, H. Decomposition of roots of different diameters in response to different drought periods in a subtropical evergreen broad-leaf forest in Ailao Mountain. Glob Ecol Conserv 2020, 24, e01236. [CrossRef]
- Yi, Z.; Fu, S.; Yi, W.; Zhou, G.; Mo, J.; Zhang, D.; Ding, M.; Wang, X.; Zhou, L. Partitioning soil respiration of subtropical forests with different successional stages in south China. Forest Ecology and Management 2007, 243, 178-186. [CrossRef]
- Liu, Q.; Wang, R.; Li, R.; Hu, Y.; Guo, S. Temperature sensitivity of soil respiration to nitrogen fertilization: Varying effects between growing and non-growing seasons. PLoS ONE 2016, 11, e0168599. [CrossRef]
- Rey, A.; Pegoraro, E.; Tedeschi, V.; De Parri, I.; Jarvis, P.G.; Valentini, R. Annual variation in soil respiration and its components in a coppice oak forest in Central Italy. Global Change Biology 2002, 8, 851-866. [CrossRef]
- Zou, J.; Tobin, B.; Luo, Y.; Osborne, B. Response of soil respiration and its components to experimental warming and water addition in a temperate Sitka spruce forest ecosystem. Agricultural and Forest Meteorology 2018, 260-261, 204-215. [CrossRef]
- Carbone, M.S.; Still, C.J.; Ambrose, A.R.; Dawson, T.E.; Williams, A.P.; Boot, C.M.; Schaeffer, S.M.; Schimel, J.P. Seasonal and episodic moisture controls on plant and microbial contributions to soil respiration. Oecologia 2011, 167, 265-278. [CrossRef]
- Matteucci, M.; Gruening, C.; Goded Ballarin, I.; Seufert, G.; Cescatti, A. Components, drivers and temporal dynamics of ecosystem respiration in a Mediterranean pine forest. Soil Biology and Biochemistry 2015, 88, 224-235. [CrossRef]
- Li, X.; Guo, D.; Zhang, C.; Niu, D.; Fu, H.; Wan, C. Contribution of root respiration to total soil respiration in a semi-arid grassland on the Loess Plateau, China. Sci Total Environ 2018, 627, 1209-1217. [CrossRef]
- Davidson, E.A.; Janssens, I.A. Temperature sensitivity of soil carbon decomposition and feedbacks to climate change. Nature 2006, 440, 165. [CrossRef]
- Kume, T.; Takizawa, H.; Yoshifuji, N.; Tanaka, K.; Tantasirin, C.; Tanaka, N.; Suzuki, M. Impact of soil drought on sap flow and water status of evergreen trees in a tropical monsoon forest in northern Thailand. Forest Ecology and Management 2007, 238, 220-230. [CrossRef]
- Zhou, L.; Liu, Y.; Zhang, Y.; Sha, L.; Song, Q.; Zhou, W.; Balasubramanian, D.; Palingamoorthy, G.; Gao, J.; Lin, Y.; et al. Soil respiration after six years of continuous drought stress in the tropical rainforest in Southwest China. Soil Biology and Biochemistry 2019, 138, 107564. [CrossRef]
Figure 1.
Monthly average air temperatures and monthly precipitation at the Chushan meteorological station (1995-2020).
Figure 1.
Monthly average air temperatures and monthly precipitation at the Chushan meteorological station (1995-2020).
Figure 2.
Daily variation in (a) soil temperature at 5-cm depth of soil, and soil moisture content at 10 cm depth of soil, (b) precipitation, and (c) soil respiration (Rs, soil respiration; Rh, heterotrophic respiration; Rr, autotrophic respiration).
Figure 2.
Daily variation in (a) soil temperature at 5-cm depth of soil, and soil moisture content at 10 cm depth of soil, (b) precipitation, and (c) soil respiration (Rs, soil respiration; Rh, heterotrophic respiration; Rr, autotrophic respiration).
Figure 3.
Mean annual values of (a) soil temperature, (b) soil moisture, and (c) annual precipitation and mean annual values of (d) soil respiration (Rs), heterotrophic respiration (Rh), and autotrophic respiration (Rr). The annual values in 2021 represented Jan to Aug results. Different capital letters indicate differences among treatments within the same year at p<0.05. Different lowercase letters indicate differences among years at p<0.05.
Figure 4.
Figure 4. Monthly partition of autotrophic and heterotrophic soil respiration (Rr and Rh, respectively) in (a) 2019, (b) 2020, (c) 2021, and (d) the differences in Rr and Rh between 2019 and 2020, and (e) the differences in Rr and Rh between 2019 and 2021.
Figure 4.
Figure 4. Monthly partition of autotrophic and heterotrophic soil respiration (Rr and Rh, respectively) in (a) 2019, (b) 2020, (c) 2021, and (d) the differences in Rr and Rh between 2019 and 2020, and (e) the differences in Rr and Rh between 2019 and 2021.
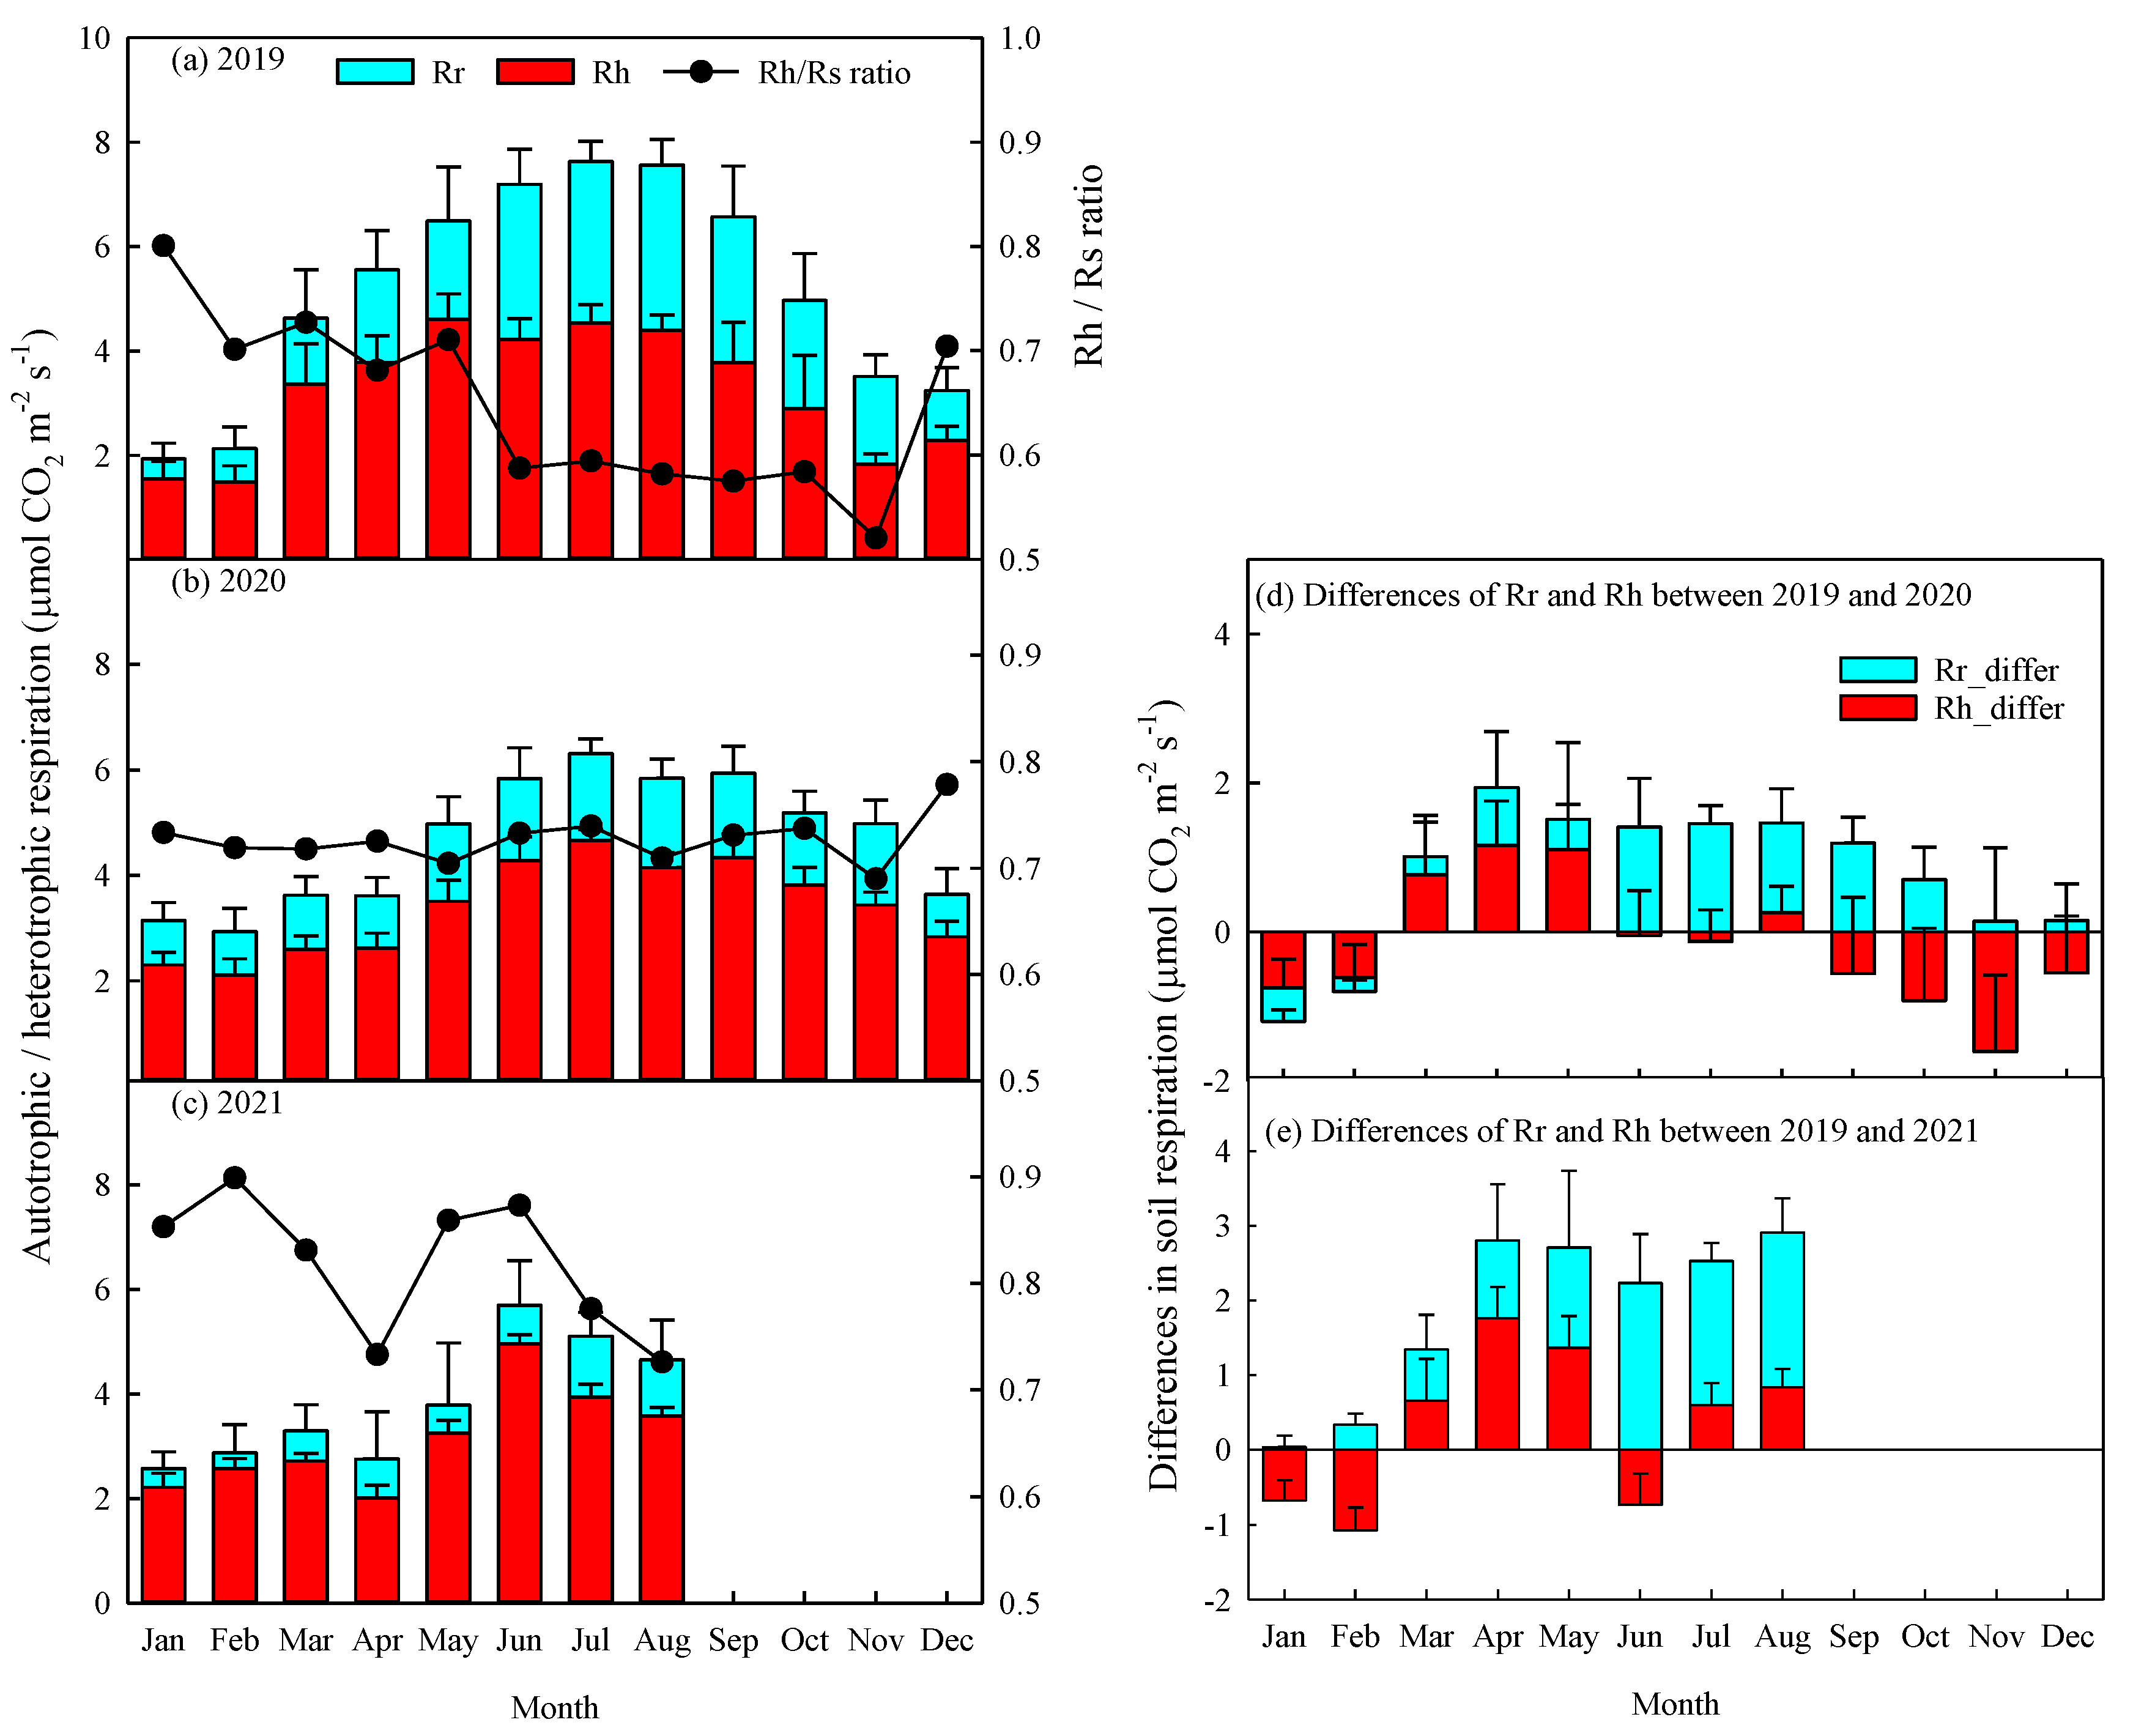
Figure 5.
Relationships between half-hourly mean soil respiration (Rs, μmol CO2 m-2 s-1), heterotrophic respiration (Rh), and hourly soil temperature at 5-cm depth (°C) in (a) 2019, (b) 2020, and (c) 2021. The data represented Jan to Aug results in 2021. Asterisks indicate a significance: ***p < 0.001.
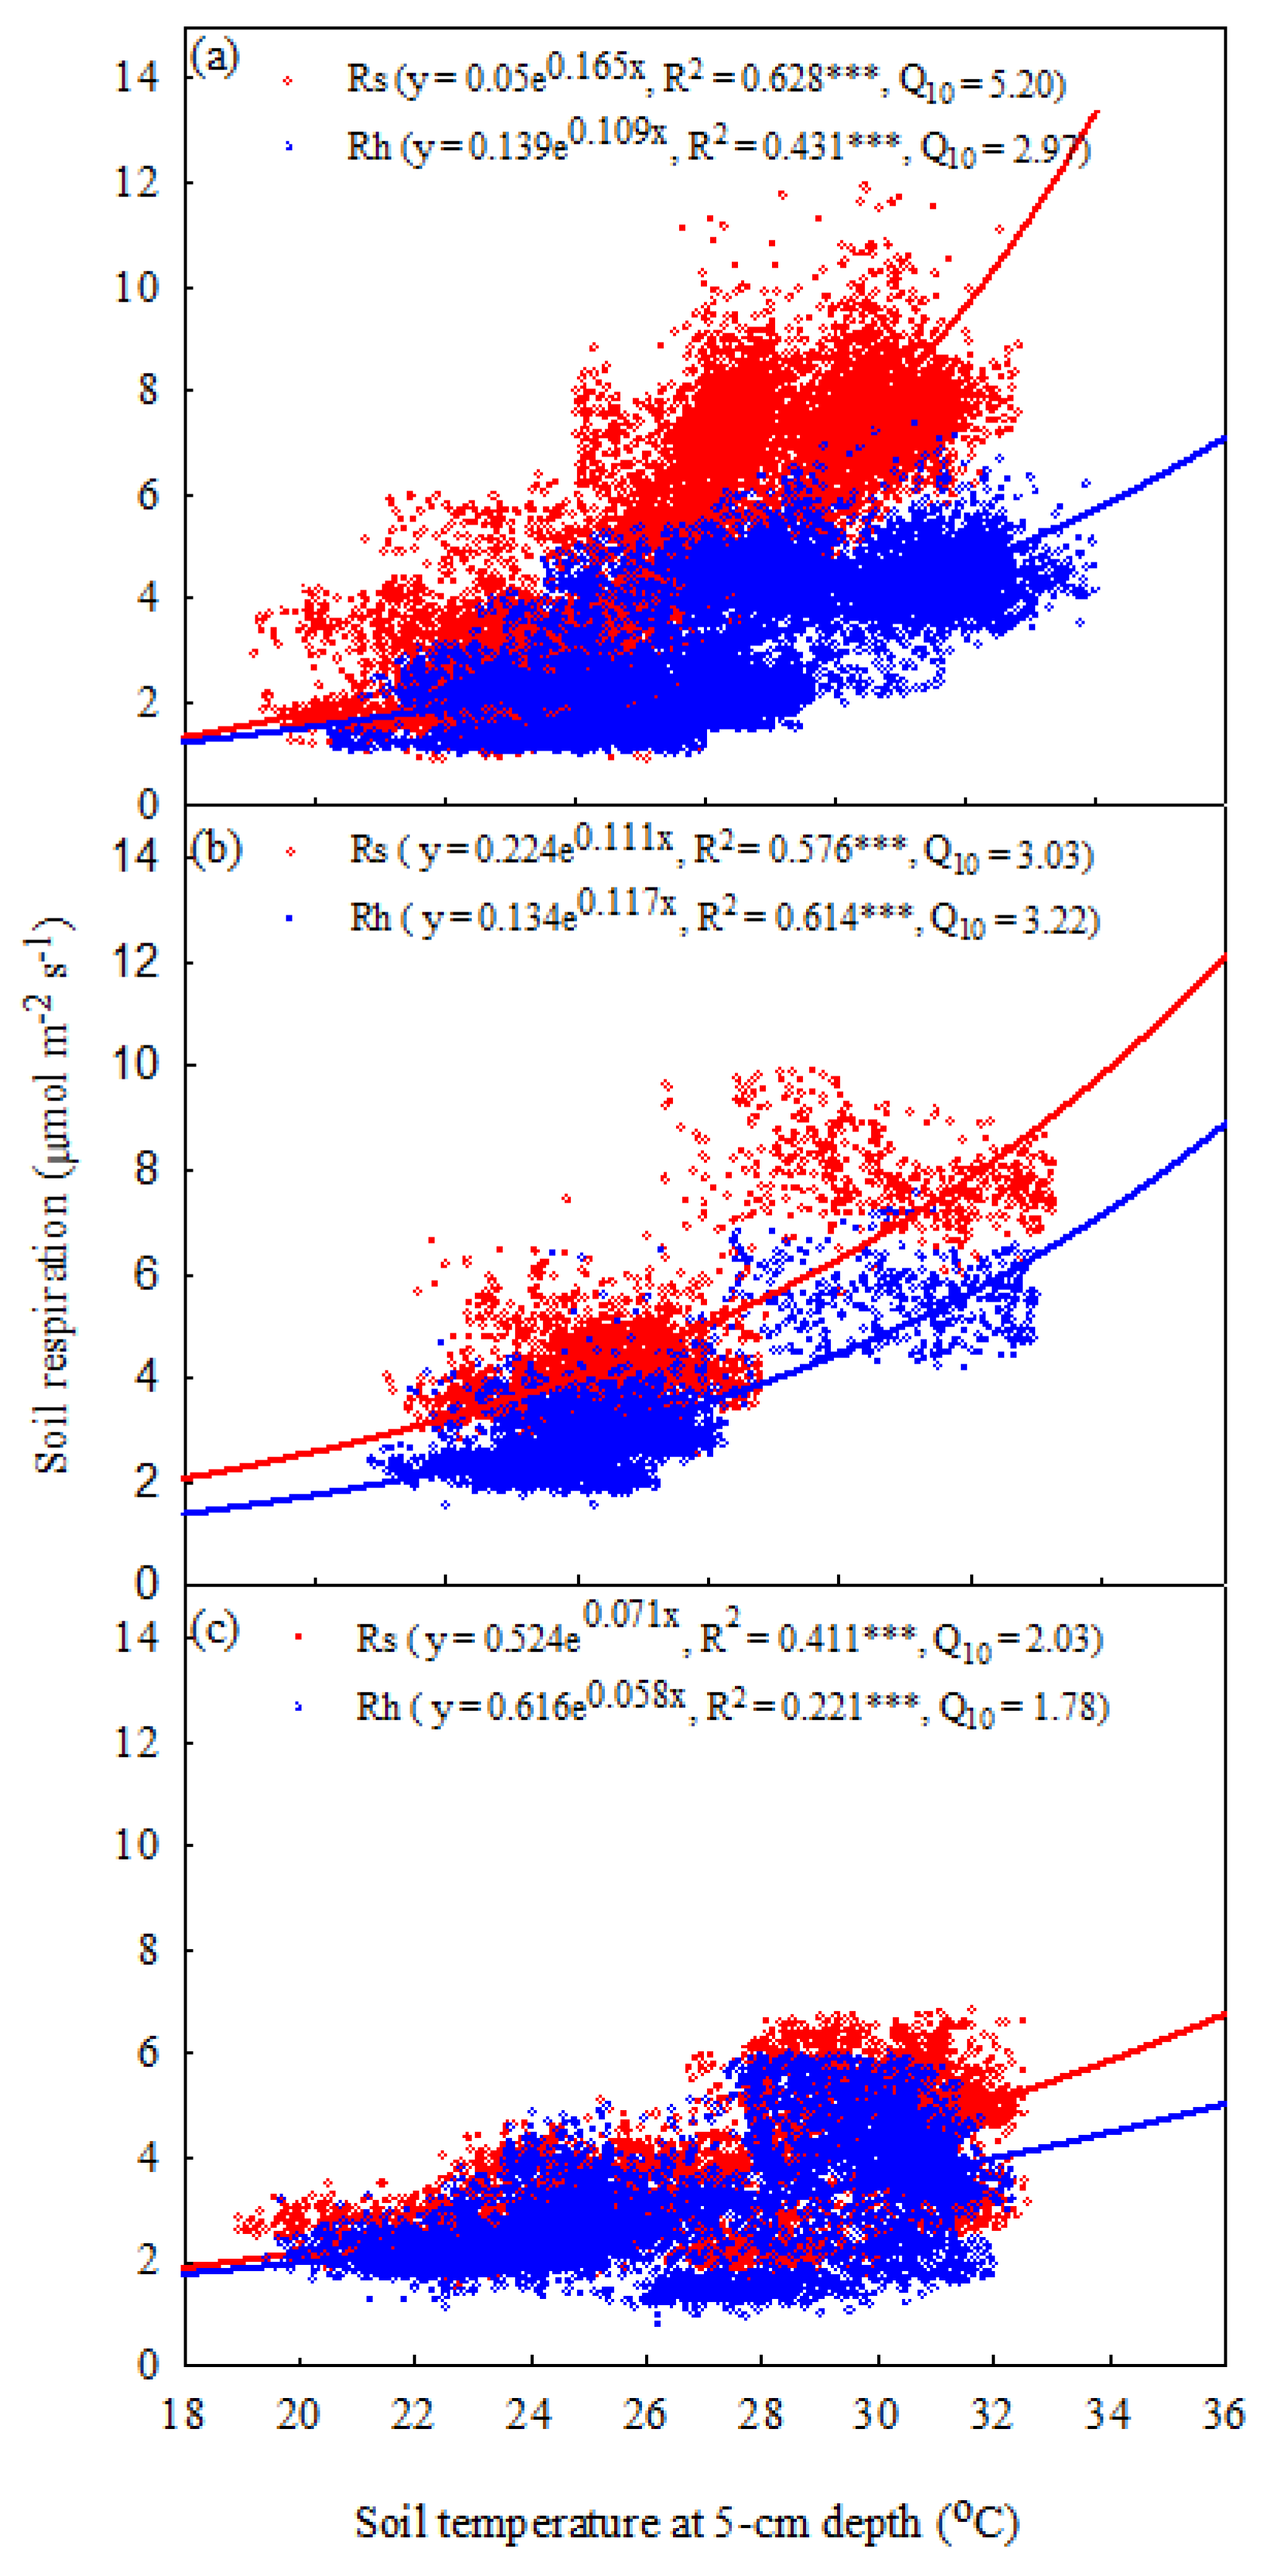
Figure 6.
Relationships between half-hourly temperature normalized soil respiration (Rs, μmol CO2 m-2 s-1), heterotrophic respiration (Rh), and hourly soil moisture at 10 cm depth (%) in (a) 2019, (b) 2020, and (c) 2021. The data represented Jan to Aug results in 2021. Asterisks indicate a significance: ***p < 0.001.
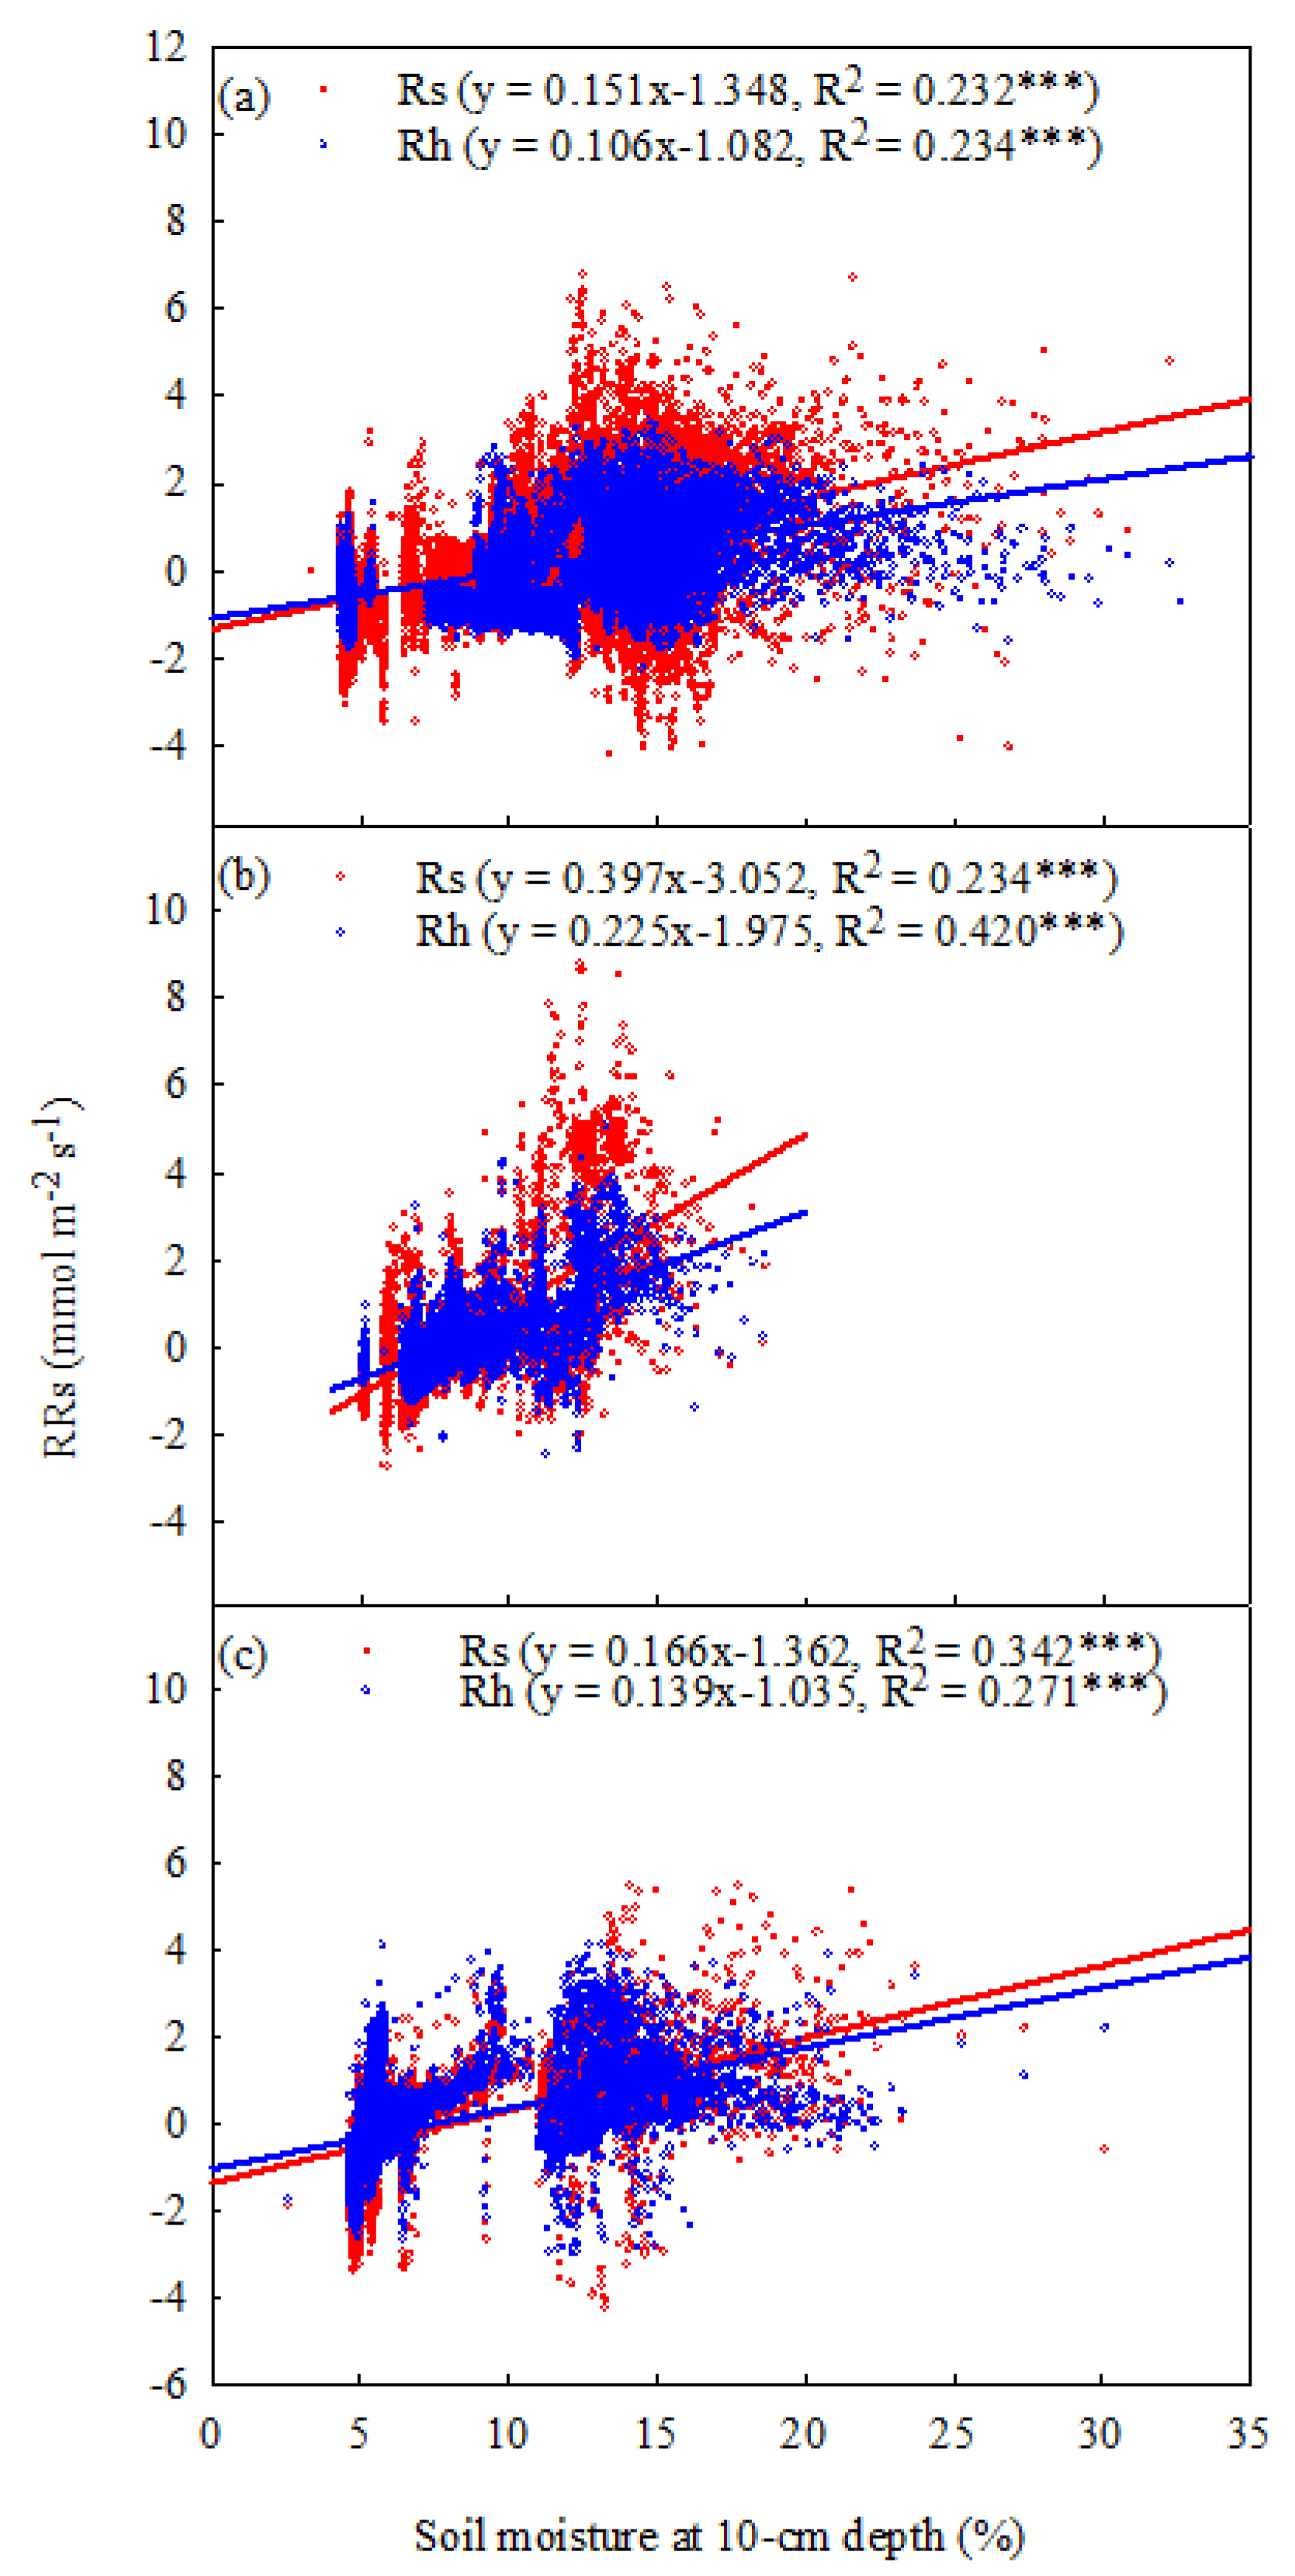
Figure 7.
Mean values of (a) soil temperature, (b) soil moisture, (c) sum of rainfall, (d) mean soil respiration (Rs), heterotrophic respiration (Rh), and autotrophic respiration (Rr) in the spring season (Mar - May). Different capital letters indicate differences among years in the same treatment at p<0.05. Different lowercase letters indicate differences between treatments in the same year at p<0.05.
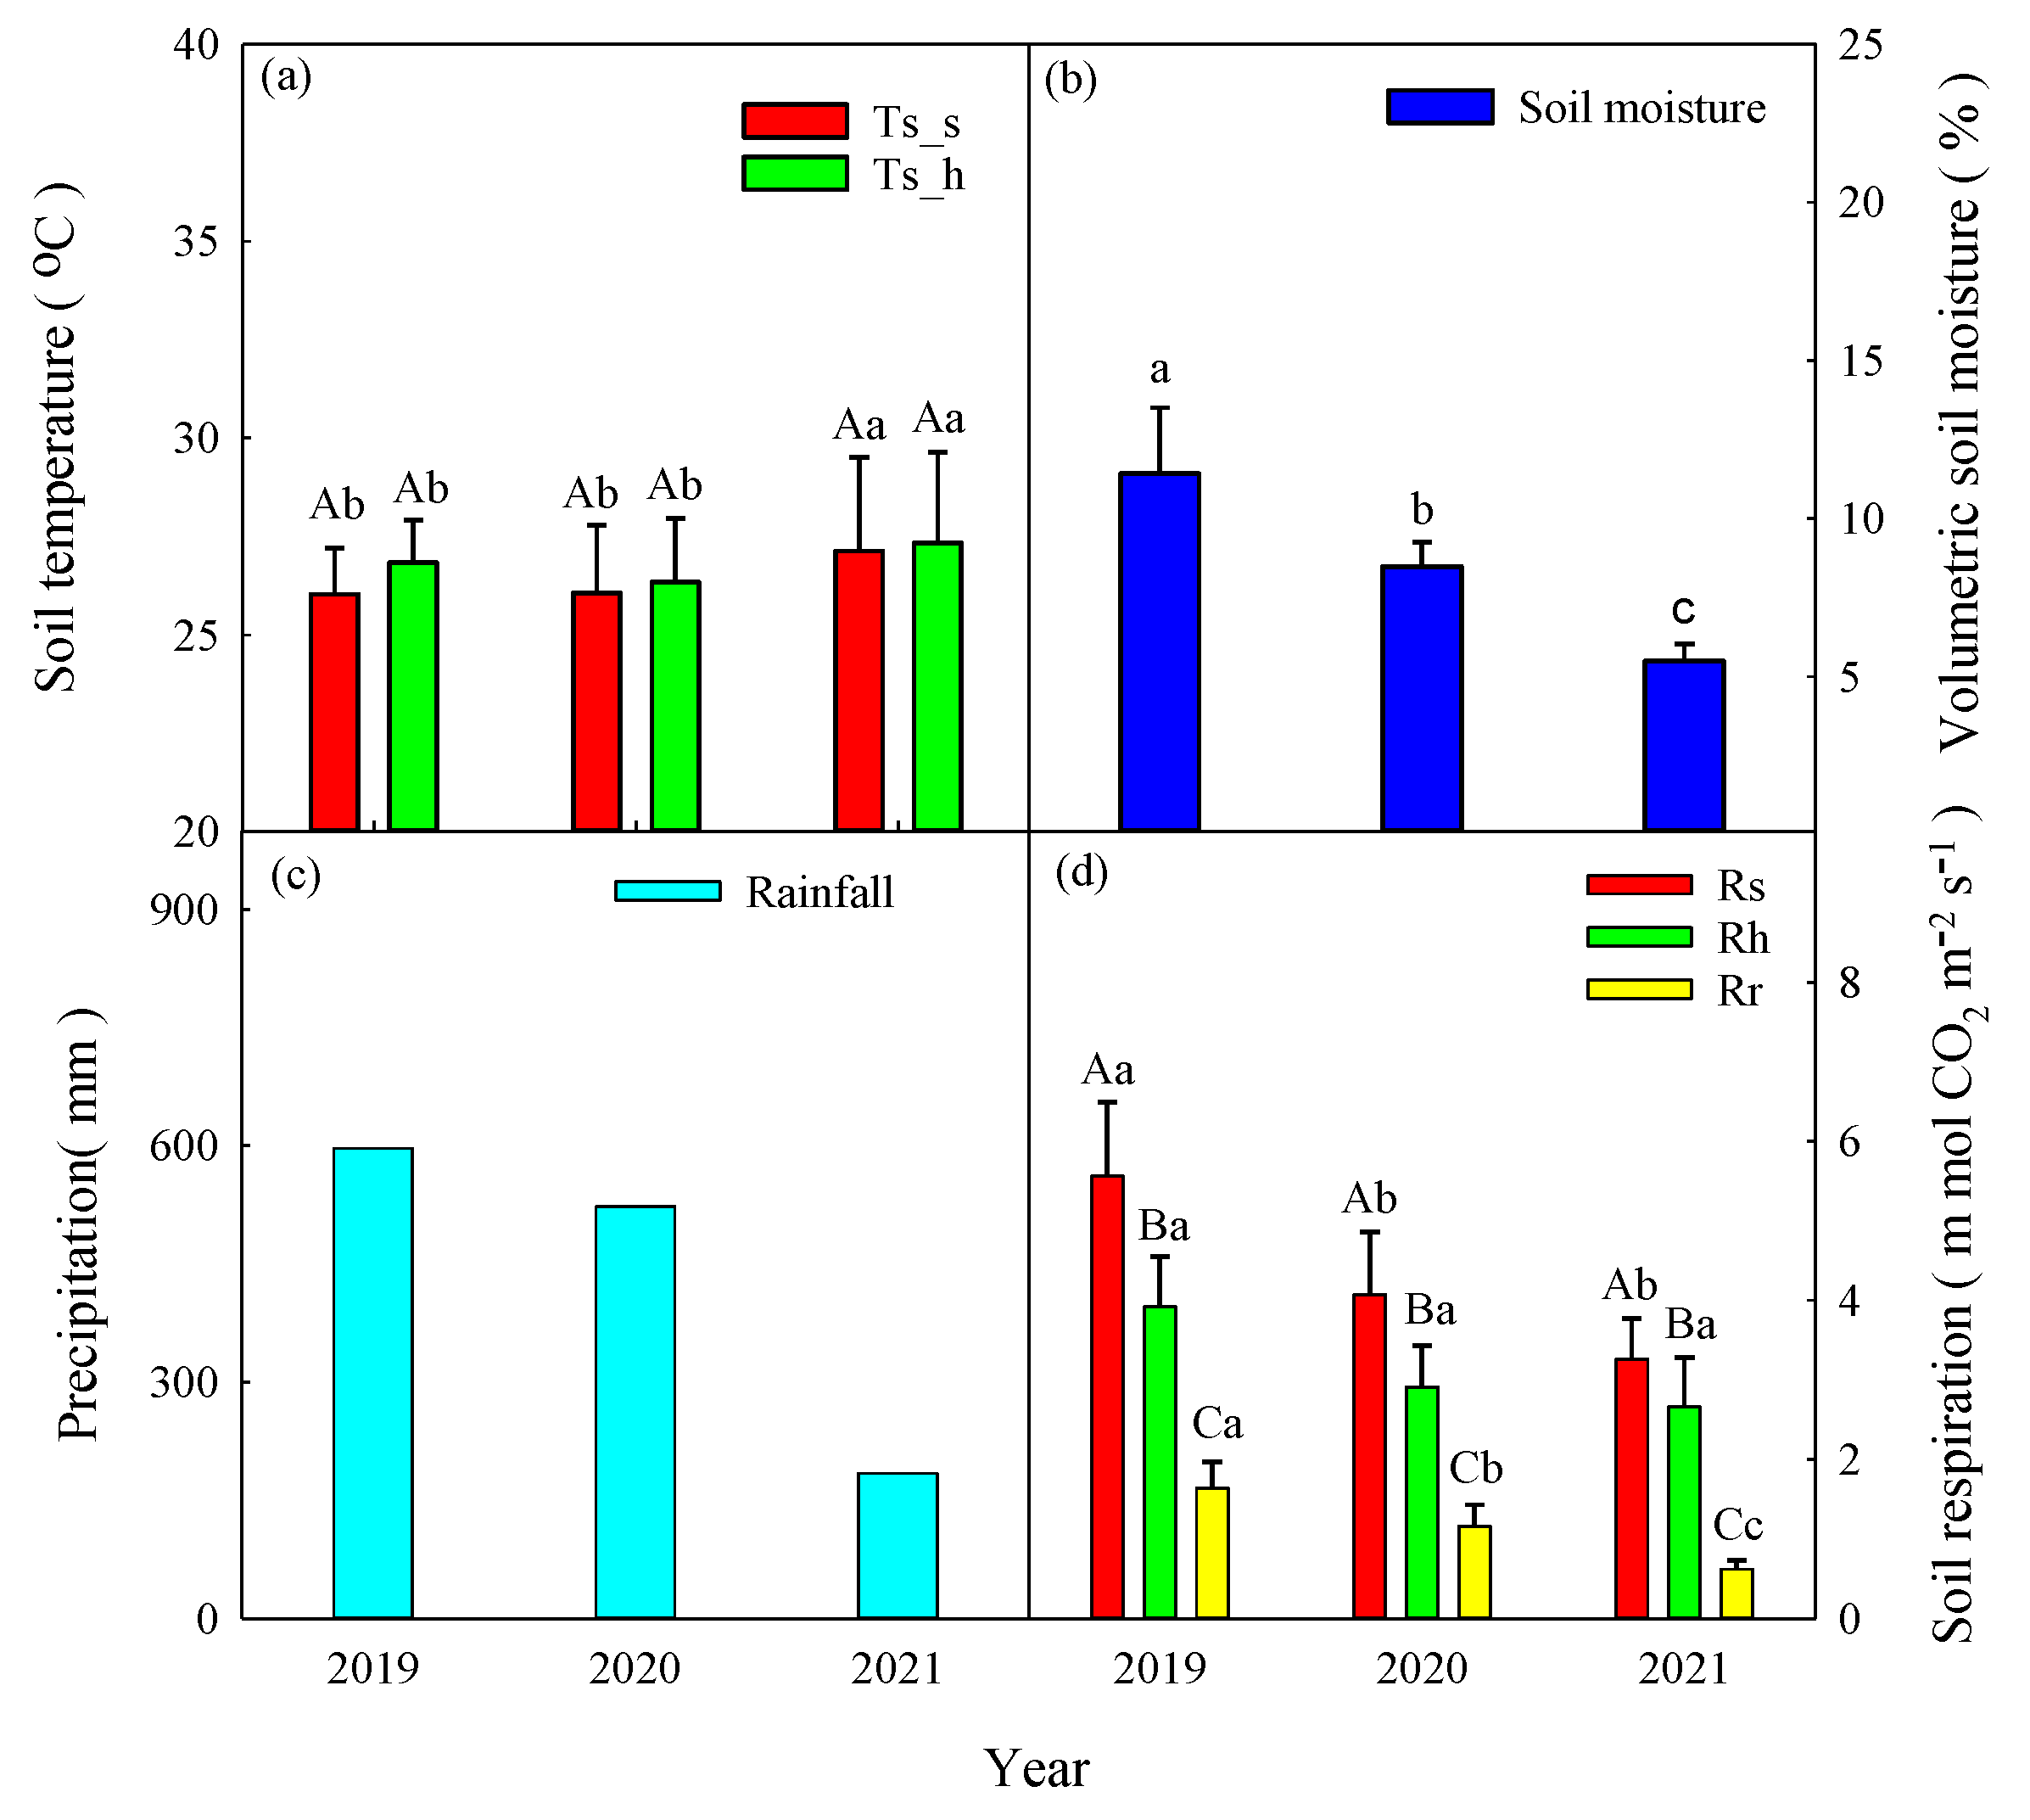
Figure 8.
Relationships between the differences of monthly mean soil moisture and monthly mean (a) Rh and (b) Rr between 2019 and 2020 and between 2019 and 2021. Solid lines represent linear regression models and dash line represent 95% confidence intervals. Asterisks indicate a significance: *p < 0.05.
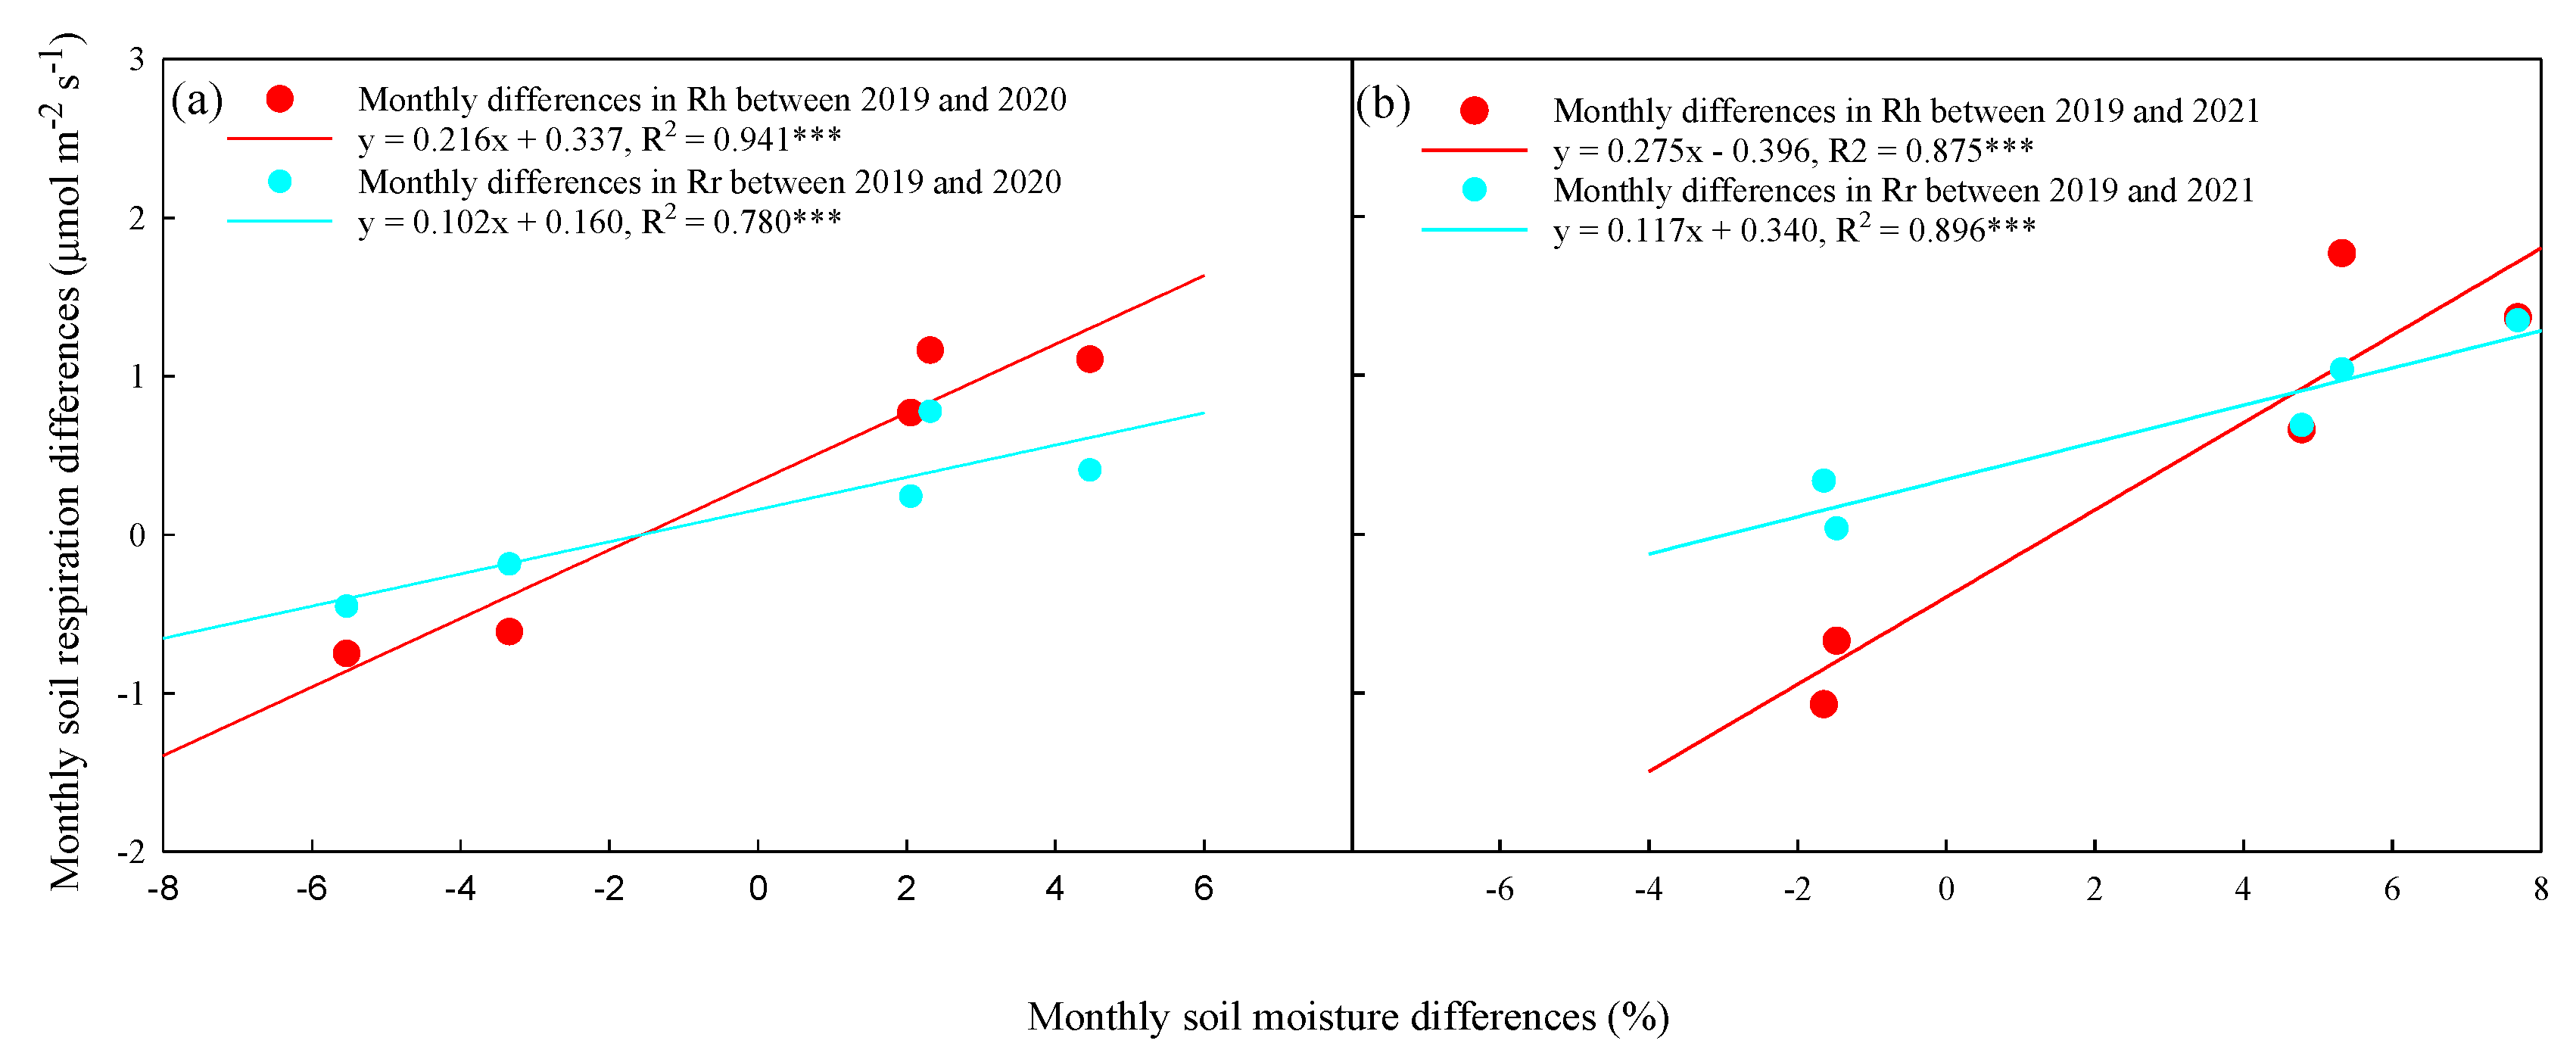

Table 1.
Soil properties of different soil layer in this experimental site.
| Soil depth (cm) | BD (g cm-3) |
SOC (g kg-1) |
TN (g kg-1) |
pH | Soil texture | ||
|---|---|---|---|---|---|---|---|
| Sand (%) |
Silt (%) |
Clay (%) |
|||||
| 0-10 | 0.73 ± 0.02 | 55.8 ± 0.8 | 3.2 ± 0.1 | 5.6± 0.2 | 42 | 38 | 20 |
| 10-20 | 0.82 ± 0.02 | 35.9 ± 1.2 | 2.3 ± 0.2 | 6.1 ± 0.2 | 42 | 36 | 22 |
BD: bulk density, SOC: soil organic carbon, TN: total nitrogen.
Table 2.
Precipitation event characteristics in the study area. Numbers in parentheses indicate percentages of annual precipitation.
Table 2.
Precipitation event characteristics in the study area. Numbers in parentheses indicate percentages of annual precipitation.
| Year | Total (mm) | 0.5-10 mm | 10-20 mm | 20-50 mm | > 50 mm |
|---|---|---|---|---|---|
| 2019 | 2418.5 | 229.5 (9.5%) |
257.5 (10.6%) |
719 (19.3%) |
1215.5 (50.3%) |
| 2020 | 1281 | 186 (14.5%) |
352.5 (27.5%) |
466.5 (25.7%) |
276 (21.5%) |
| 2021 (Jan to Aug) |
2197 | 94.5 (4.3%) |
131 (6.0%) |
635 (28.9%) |
1336.5 (60.8%) |
Disclaimer/Publisher’s Note: The statements, opinions and data contained in all publications are solely those of the individual author(s) and contributor(s) and not of MDPI and/or the editor(s). MDPI and/or the editor(s) disclaim responsibility for any injury to people or property resulting from any ideas, methods, instructions or products referred to in the content. |
© 2025 by the authors. Licensee MDPI, Basel, Switzerland. This article is an open access article distributed under the terms and conditions of the Creative Commons Attribution (CC BY) license (http://creativecommons.org/licenses/by/4.0/).
Copyright: This open access article is published under a Creative Commons CC BY 4.0 license, which permit the free download, distribution, and reuse, provided that the author and preprint are cited in any reuse.


