Submitted:
12 August 2025
Posted:
12 August 2025
You are already at the latest version
Abstract
As of mid-2025, California maintains a target (and legal agreement with truck OEMs) to reach 100% zero-emission M/HD truck sales by 2036. The US federal government has relaxed its targets but maintains truck fuel economy standards, incentivizing EV uptake. To meet these ambitions, ZEVs require adequate charging infrastructure rollout at scale. This paper reviews studies that estimate the M/HD charging and investment needs in California and the US. This paper then develops a new matrix that entails charging needs by charging power for each truck type from Class 2b to Class 8, the charger-to-vehicle ratio for each truck type, and the charger investment costs. This paper projects that California may require about 151 to 156 thousand chargers on the road by 2030, and increase to 434 to 460 thousand chargers on the road by 2035. The associated charging infrastructure investment—including both new charger installation and charger replacement—can reach approximately $7.1 to $7.4 billion by 2030, and $16.4 to $17.8 billion by 2035. Thus, achieving the number of chargers and managing these investments needs will likely be challenging.
Keywords:
medium-duty
; heavy-duty
; zero emission
; truck
; charging
; infrastructure
; California
1. Introduction
In 2022, the transportation sector contributed nearly 30 percent of the anthropogenic greenhouse gas (GHG) emissions in the United States (U.S.) [2]. Within the transportation sector, light-duty vehicles (LDVs) and medium- and heavy-duty vehicles (M/HDVs) contribute to 58 percent and 23 percent of the US transportation GHG emissions, respectively [3]. Implementing solutions for transitioning to a carbon-neutral transportation sector is critical to advancing the national climate goals.
Today, the battery-electric M/HD vehicle market is nascent, with less than 60,000 units sold globally. China remains the primary market with more than 50,000 trucks sold in 2024, far outnumbering the 7,700 and 1,400 trucks sold in Europe and the U.S. within the same time period [4]. Battery-electric and fuel-cell electric vehicles are being viewed as the decarbonization solutions for the M/HDV sector, the former being the preferred solution for the very near term for a variety of applications. Many have pointed out that the build-out of a reliable zero-emission vehicle (ZEV) charging and refueling infrastructure network needs to happen faster than the rate of deployment of the ZEVs.
California maintains a target (and legal agreement with truck OEMs) to reach 100% ZEV medium and heavy duty truck sales by 2036 [1]. While the federal government has relaxed a sales target for ZEVs, it continues to incentivize the increase the deployment of ZEVs via the Greenhouse Gas Emissions Standards for Heavy-Duty Vehicles.
To meet these state and federal targets, ZEVs require affordable and timely rollout of charging infrastructure at scale. This will require estimating accurately the charging needs and associated capital investments to support the ZEV deployments - and very few studies have addressed this due to a variety of factors such as uncertainty in the timing, location, and scale of ZEV deployments (i.e., electric load) that drive the electric utility grid investments regionally. With this in mind, this research product is aimed at benchmarking the charger needs to support M/HD ZEVs in California and the U.S. by 2030. Following a thorough assessment of the existing literature and summarizing the similarities and discrepancies in reviewed studies, the authors propose a ‘new’ vehicle/charger matrix reflecting the present industry considerations for M/HDV charging patterns and linking future M/HD battery electric truck fleet types and sizes, and charging needs, based on the common understandings from reviewed studies and expert opinions. While the scope of the papers reviewed focuses on the U.S. and California, the modeling approach and results, along with the discussion on barriers and future research directions, focuses on California. However, it is intended to inform the M/HD ZEV transitions in other parts of the world.
The paper is organized as follows. Section 2 outlines the methodology. Section 3 summarizes findings from the most relevant and recent works. Section 4 elaborates a matrix that can be used for projecting future M/HD charging needs, along with preliminary results of estimations on future M/HD charging needs in California. Section 5 contextualizes key challenges in practices and highlights directions for future research.
2. Materials and Methods
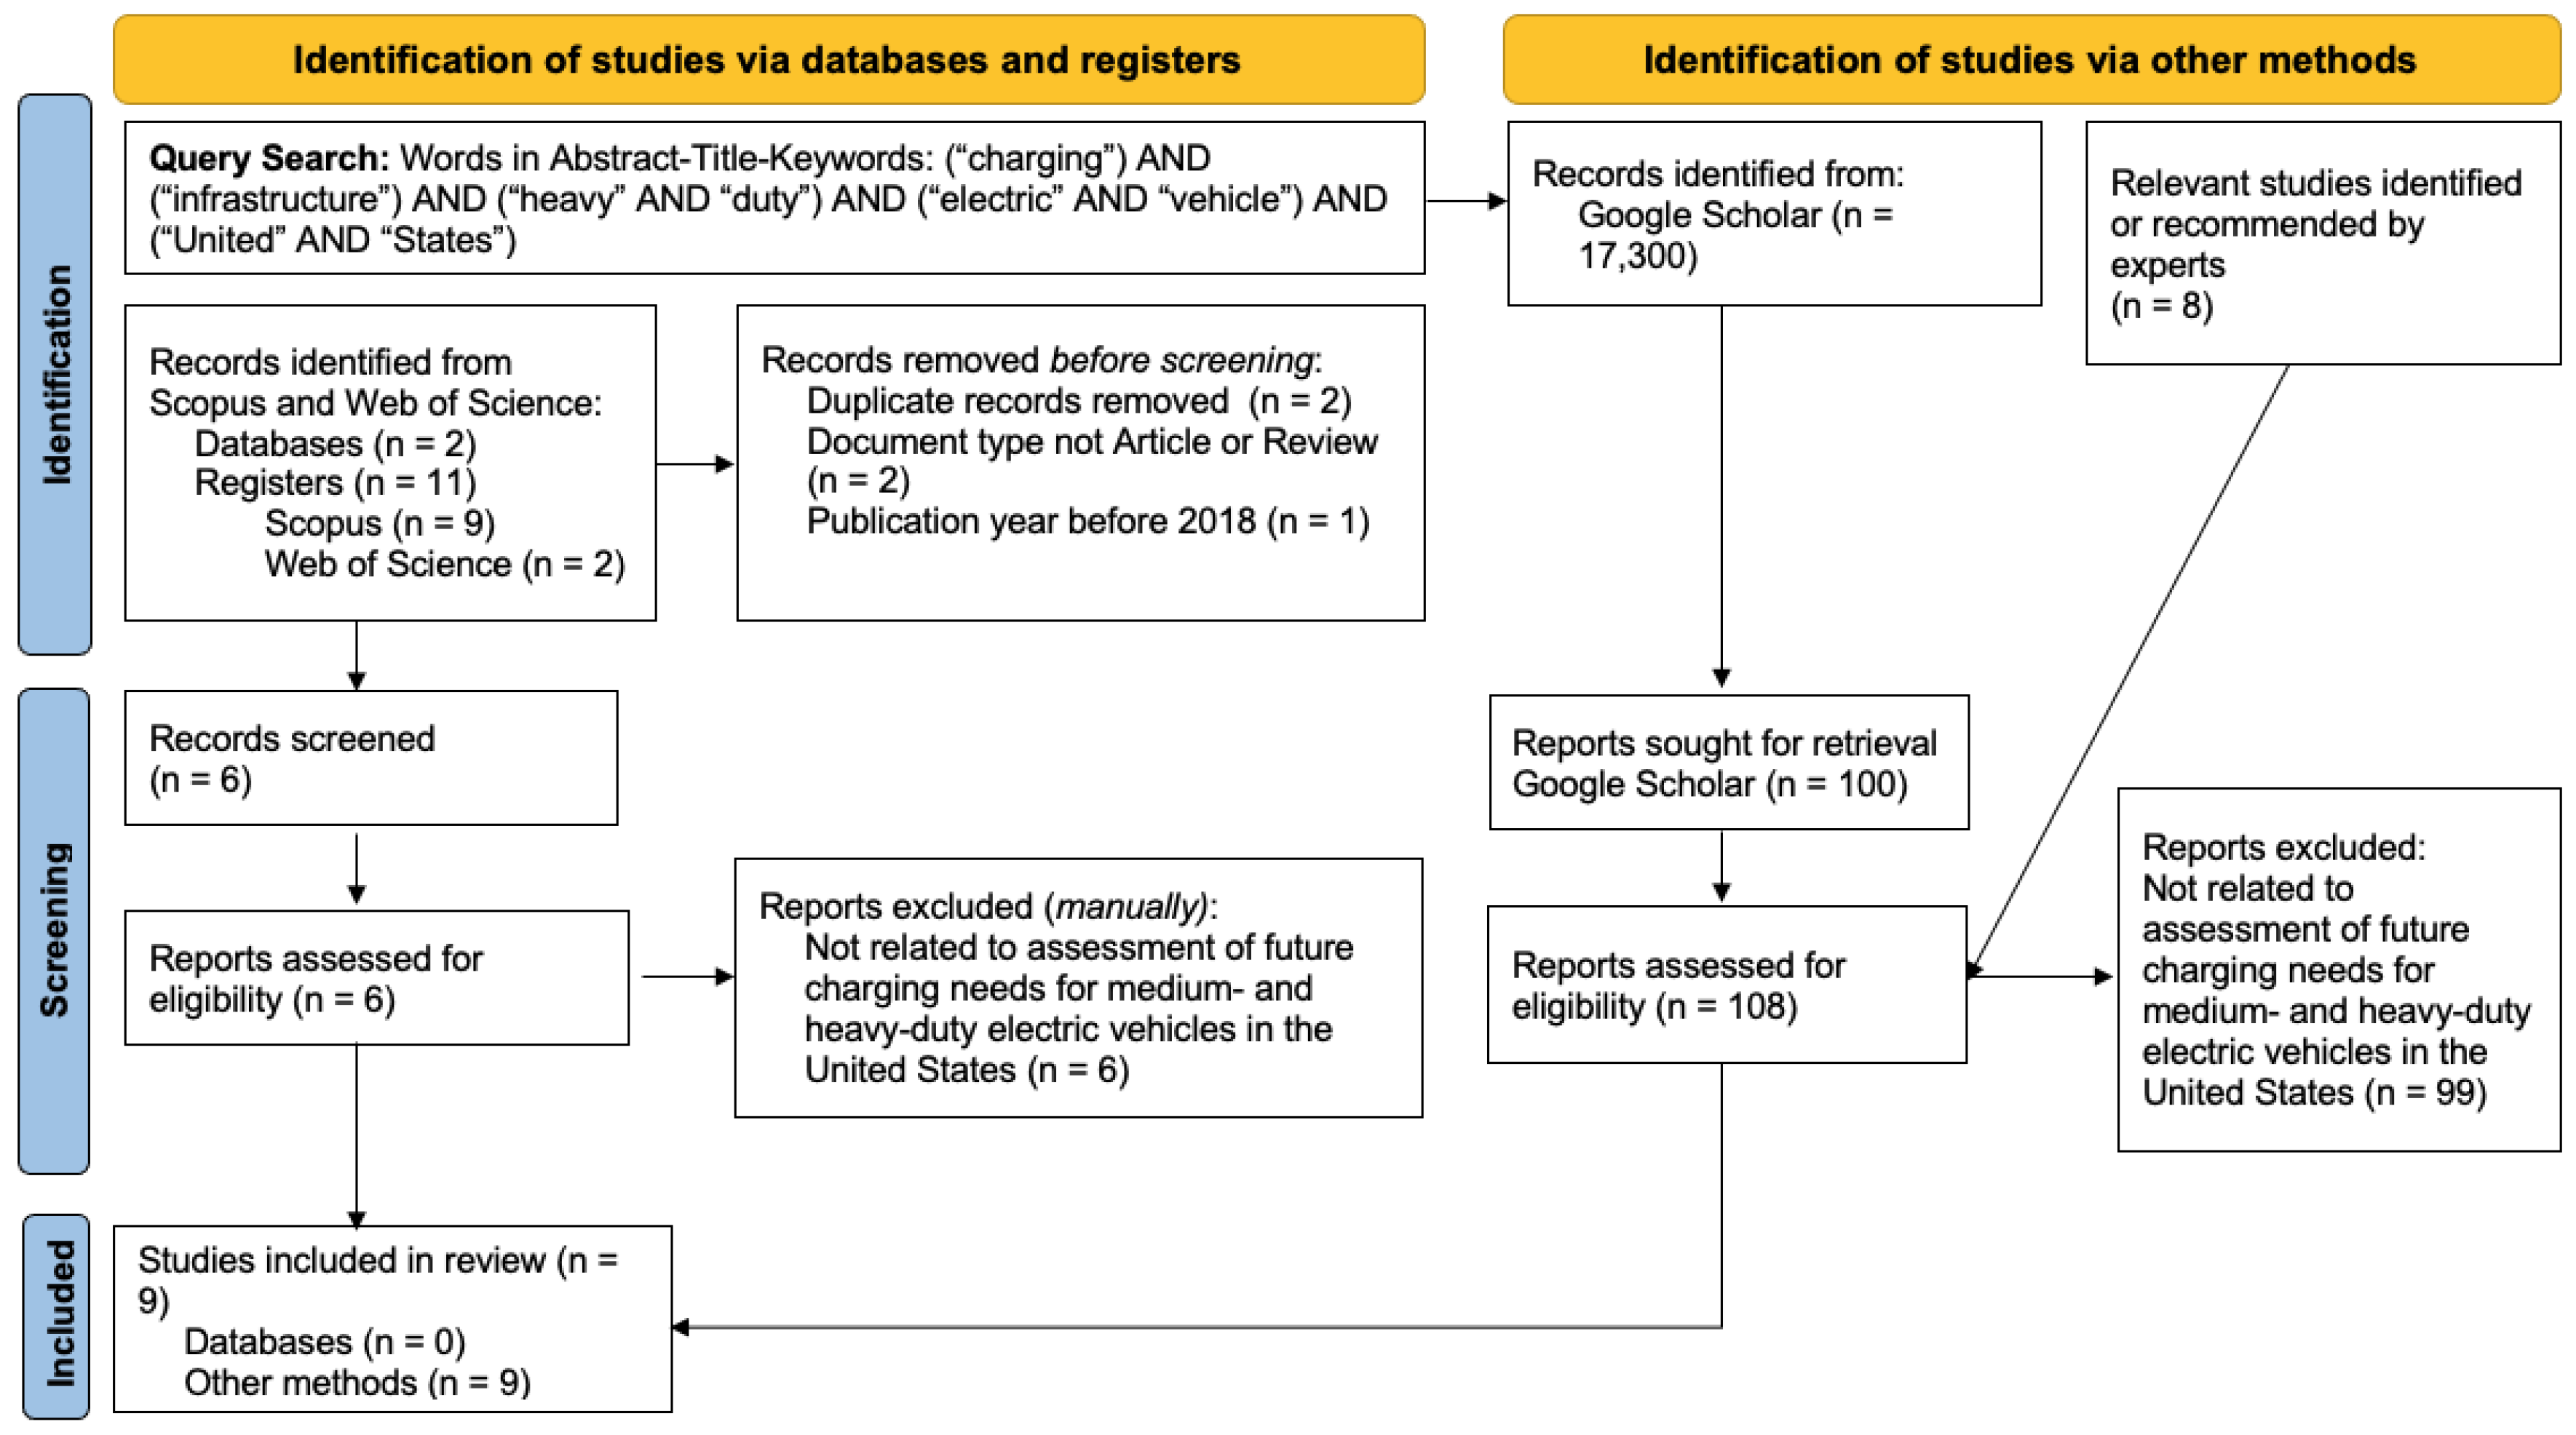
Following the guidelines from the Prisma review method [8], this paper collects studies that investigate the future charging needs and associated investment needs for medium- and heavy-duty BEVs in the U.S. This paper uses two search engines, Scopus and Web of Science, as the primary method of identifying peer-reviewed literature. Google Scholar is also used to complement the search by including grey literature.
As indicated in Error! Reference source not found., this paper conducted searches in January 2024. It used the following combinations of search queries for words on the abstract, title, and keywords: (“charging”) AND (“infrastructure”) AND (“heavy” AND “duty”) AND (“electric” AND “vehicle”) AND (“United” AND “States”). With Google Scholar, over 17,000 results were found and only the first 100 results were considered eligible. This cut-off criterion is commonly used in systematic reviews based on web-based search engines [9]. All results were published after 2017. In the screening process, the title, abstract, and keywords of each paper are reviewed to assess its eligibility to be included in this review paper. The exclusion criteria are whether the study is relevant to estimating the future needs of charging infrastructure and associated investment for M/HD BEVs in the U.S.
No peer-reviewed journal articles were found, though nine records of grey literature were found via Google Scholar and expert recommendation, resulting in a total of nine studies. These studies are compared across a range of aspects, including dates published, scope, variables addressed, methods used, and others.
Figure 1.
Flow diagram of literature review.
3. Results
3.1. Studies Found
At the time of writing, a total of 9 studies were reviewed in this research (Table 1). One study was published in 2021 and three studies were published in 2023, with the rest published in 2022. Three studies were published as government agency documents, such as a senate bill (SB) or assembly bill (AB), and the rest of the studies are either conducted by think tanks, consultancies, or research centers in academia. Five reviewed studies focus on the charging needs for M/HD BEVs in the United States, and the other four reviewed studies focus on California.
3.2. Future Charging Needs
This section describes the future charging needs estimated in reviewed papers, a discussion of charger ratios specifically will be in the next section.
As shown in Table 2, at the national level, reviewed studies estimate that about 470,000 to 1,602,855 chargers will be needed by 2030 in the U.S., from a charger-count perspective. This indicates a significant charging infrastructure gap for M/HD battery electric trucks in the U.S. before 2030. From a charger-count perspective, at least 183 charging ports for M/HD battery electric trucks will need to be built every day in the U.S. till 2030 to meet the projections. For depot charging, 470,000 to 580,000 chargers (usually privately operated and assumed to be used for overnight charging) will be needed by 2030 in the U.S. For on-road (which is usually considered for the public and is fast or ultrafast (In some studies [4,12], opportunity fast charging is assumed to have charging power ranges from 150kW to 350kW and opportunity ultrafast charging’s charging power can be up to 2MW)) charging, reviewed studies have different projections based on charging power and truck classification.
At the California state level, reviewed studies estimate that about 70,000 to 109,000 depot chargers and 5,500 to 9,500 public chargers will be needed by 2030. However, some studies report their estimated charging needs in the unit of the number of charging “stations” which can include multiple chargers [16] or have significantly higher estimations than others [15].
The studies use different methods and models for estimating the future charging needs for MDHD electric trucks. Some studies [14,16,17] utilize CEC’s Medium-Duty and Heavy-Duty Electric Vehicle Infrastructure Load, Operations and Deployment Tool (HEVI-LOAD) while other studies [4,10,11,13,15] develop their modeling methods based on various assumptions.
One factor that may lead to different estimates of charging needs for M/HD battery electric trucks is the estimated and projected total number of trucks or stock size. At the California state level, studies usually project that the future M/HD BEV stock value by 2030 will be about 0.11 to 0.16 million. At the U.S. level, the variation in the estimated M/HD BEV stock values is larger, ranging from about 0.49 to 2.93 million by 2030 (Table 2). In addition to the fleet size, the MDHD segment considered in each study is different too. As shown in Appendix B1, some studies do not clarify how many MDHDs will be powered by electricity versus hydrogen; some studies include Class 3 trucks (e.g., mini-bus or heavy-duty pick-up trucks) while others do not; and some studies classify trucks into broader terms, namely medium- and heavy-duty vehicles. We define “medium-duty” to include Class 2b through 6 and “heavy-duty” to include Classes 7 and 8. Most studies use different terminologies and scopes when it comes to charging, some studies take home charging into account for M/HD charging infrastructure in the U.S. while some only consider depot charging for the M/HD sector. Charging power is also not clearly defined under each different charging category. For example, some studies assume depot charging to be private while some studies assume that depot charging can be publicly accessible as well. Some studies assume on-road charging is usually fast or ultrafast charging while some assume public on-road charging can be Level 2 public as well. Even though no official source has clearly defined ultrafast charging, some studies have already considered ultrafast charging (e.g., 2MW) in their projections of future charging infrastructure needs for M/HD battery electric trucks.
The variation in the assumption of charger composition is another reason that may lead to differences in estimating how many chargers will be needed. As shown in Table 2, [10] assumes that, in the low-cost scenario, 90 percent of the M/HD fleet will charge at depot/home while 10 percent charge at on-road charging; and in the high-cost scenario, 75% of the M/HD fleet will charge at depot/home while 25% will charge at on-road charging by 2030. In another study [17], 82 percent of the M/HD charging load is assumed to happen at depot charging and the rest will happen at on-road charging or fast charging. [14] assume that the share of depot charging will increase from 88% in 2030 to 90% in 2035 in California, and the share of public charging will decrease from 12% in 2030 to 10% in 2035. [13] also provide the share of overnight charging, fast charging, and ultrafast charging for each different vehicle category (e.g., short-haul truck, long-haul truck, school bus, and transit bus).
3.3. Charger-to-Vehicle Ratio
To compare the estimates of charging needs for M/HD battery electric trucks in reviewed studies with different geographic scopes and charging characteristics, this paper calculates the overall charger-to-vehicle ratio in each study and compares them (Figure 2). Two studies [10,11] generate more than one possible charger-to-vehicle ratio in their studies because these studies have multiple scenarios.
In reviewed studies, the charger-to-vehicle ratio by 2030 ranges from about 0.3 to 1.2 chargers/vehicle. The mean is around 0.7 chargers/vehicle, the upper quartile is about 1.0 chargers/vehicle and the lower quartile is about 0.5 chargers/vehicle. Among five studies focusing on the U.S., the mean charger-to-vehicle ratio is about 0.72; among three assessments focusing on California, the mean charger-to-vehicle ratio is about 0.63.
It is important to note that reviewed studies do not specify the number of ports each charger has in their studies. It is possible that a charger may have one, two, or more ports; and some vehicles may have more than 1 charge port. Additionally, this paper does not further summarize the charger-to-vehicle ratio based on charger type (i.e., depot versus public on-road) because each study has its unique way of classifying and presenting its estimated charging needs. For example, [10] models 37 truck Class-use case combinations and presents the depot and on-road charging by truck Class and charging power level. [14,15,17] categorize chargers into either public charging or fleet depot charging; however, it is unclear how many M/HD battery electric trucks will end up charging at the depot versus on-road. [11] projects the total number of chargers needed based on the number of daily charging events for each charger and the charging time per day.
3.4. Associated Investment Needs for M/HD Charging
Reviewed studies all expect that a significant amount of capital investment will be needed to build out the charging infrastructure for M/HD BEVs towards 2030. According to the reviewed studies, the cumulative investment for charging MDHDs through 2030 can be up to $180 billion by 2030 at the U.S. level. Though such estimations may vary, the magnitude of investment needs for M/HD charging is on the $150 billion. At the California level, estimations of investment needs for M/HD charging vary largely, ranging from $3.58 billion through 2030 to almost $15 billion through 2035. Variations can depend on the truck type, M/HD battery electric truck stock size, and charging type considered.
Different charger compositions can lead to variations in the total upfront investment cost estimates. In one study, the high-cost scenario is associated with a higher share of depot charging while the low-cost scenario is associated with a higher share of public or on-road charging [10]. This study also assumes charging power at depot charging ranges from 10kW to 16.6kW while [4] assumes charging power at depot charging ranges from 50kW to 150kW and at some private destination opportunity charging can be at 350kW.
The investment cost per charger assumed in each study can contribute to the variations in the investment estimates (Figure 3). In reviewed studies, the investment for chargers at 50kW can range from $40,000 to $112,000 per charger; investment for chargers at 150kW can range from $50,000 to $154,000 per charger; and investment for chargers at 350kW can range from $150,000 to $255,000 per charger.
Another factor that may explain the wide range of estimations of investment needs for charging infrastructure is the cost segment (Table 3). Not every study clarifies the cost segments considered as capital investment for M/HD charging infrastructure because, for example, the cost of charging infrastructure can be highly site-specific [11]. Among reviewed studies, [10] includes costs for charger hardware and software, labor, planning, installation, electrical upgrades, and other costs like design and permitting. (Bernard et al., 2022) also includes a relatively exhaustive range of costs, including charger hardware, installation, and electrical upgrades, as well as electric utility connection and construction permit. They also mention that costs for subsidies, inflation, the rising price of materials, and potential electricity grid upgrades are not included due to significant variations in project and location. Only two studies take the impact of learning and economies of scale into consideration, assuming a 3% and 2% EVSE cost reduction every year, respectively, through 2030 [4,10]. [10] also points out that they do not assume any decline in the cost of labor or other materials costs over time.
4. A Matrix for Projecting M/HD Charging Needs and Scenario Analysis Results
Results in reviewed studies show that the charging infrastructure and associated investments will need to scale up significantly and quickly in the U.S. to support the electric M/HD market expected in various ambitious scenarios. However, studies reviewed so far provide a wide range of estimates with different levels of detail and scope, making it unclear to identify the capacity shortfall and associated investment gap. A more comprehensive projection is needed to benchmark the M/HD charging infrastructure needs, from a charger-count perspective, along with associated investment needs. This will help both the industry and policymakers to prepare appropriate financing strategies and business models, as well as policies and incentives.
The matrix is more detailed than that used in any of the reviewed studies, It covers three parts, including (1) charging patterns (i.e., public versus depot charging, and charging power) for each type of truck, (2) charger-to-vehicle ratio, and (3) the net present value of the average investment per charger by charging power. It also separates charging at depots from public charging stations. In this paper and the matrix, ‘depot charging’, is defined as charging at a centralized location, such as the operator’s depot or hub; depot charging may also appear as private charging. ‘Public charging’ is defined as charging stations or locations that offer public access, such as urban areas and highways; ‘public charging’ may also appear as on-road charging. Nevertheless, this paper takes the charger lifespan and replacement into consideration. Specifically, this paper assumes that a M/HD charger lasts for approximately 10 years; therefore, chargers that are installed in 2024 will need to be replaced starting in 2034, chargers installed in 2025 will be replaced in 2035, and so on.
For each different truck class, a certain charging profile is assumed when it comes to future charging. For example, it is assumed that the vast majority of Class 8 long-haul trucks will charge at public charging stations, with a small portion of charging at depots. We assume that most Class 7 and 8 short-haul trucks will charge at depots from 50kW to 350kW, with some on-road public charging. For MD vocational trucks, we assume charging occurs only at depots, using Level 2 up to 150kW. Most of the HD pickups are assumed to charge at depots or at homes; most chargers are thus Level 2, while some on-road charging may occur between 50kW and 150kW. Similar types of assumptions are made for other vehicle types.
These estimates, and our overall matrix of vehicle types, recharging locations (depot or public), recharging power levels, and numbers of chargers per vehicle, are built upon our findings from the reviewed studies, as well as our own outreach to fleets and experts (These experts are from a Fleet Advisory Panel at the Institute of Transportation Studies at the University of California, Davis). to solicit their opinions, from their experience with M/HD charging in practice. Our resulting vehicle/charger matrix is presented in Appendix B1 through Appendix B3. It can be used for projecting M/HD charging needs and associated investment needs for any given electric M/HD fleet size, and is used throughout our analysis.
There are several things to note. First, the percentage number in Appendix B1 indicates the share of the total battery electric M/HD fleet that will be charged at a certain charging power and location. For example, we assume that thirteen percent of the short-haul trucks will charge at 350kW in a public charging station while twenty percent of them will charge at 150kW in depot charging stations. In most of the cases, each row is added up to 100 percent, except for heavy-duty pickup trucks and short-haul trucks. This is because this study assumes that some trucks, especially heavy-duty pickup and short-haul, could charge at multiple types of charging station and charging power level.
Second, assumptions of the charger-to-vehicle ratio proposed in this matrix (Appendix B2) will only apply to public charging. Based on several reviewed studies and experts’ opinions, this study assumes that the charger-to-vehicle ratio is 1 for depot charging, meaning 1 charger will support 1 truck across all types of charging power. It is important to note that the charger-to-vehicle ratio is a ratio that is derived from dividing the total number of chargers by the total electric M/HD stock. It doesn’t mean that, for example, ten electric M/HD trucks will be using one 350kW public charger. This ratio is more of an average number that is applied to the whole fleet and charging system.
Third, the average investment cost per charger by charging power in Appendix B3 is derived based on reviewing relevant assumptions used in reviewed studies. As discussed in Section 3.4, charging investment estimates considered in reviewed studies vary due to the cost segment considered. Most studies included charger hardware and labor costs but excluded soft costs, such as networking, electrical upgrades, and planning effort associated with charging infrastructure deployment. This study acknowledges its limitations, given variations in, for example, cost segments. The actual, final investment needs for each charger will depend on multiple factors, including installation costs, the investment cost for the electric upgrade from the utility side, the cost of local labor, the possible fluctuation in the cost of hardware, and the potential for future cost reduction due to learning and economies of scale. Therefore, investment per charger shown here is an approximation, and future research should continue to refine this. Tracking actual project costs will help improve future estimates.
Finally, an important aspect considered in this study is time – namely the evolution of charging practices over time, between 2025 and 2035. For example, this study assumes that an increasing percentage of long-haul trucks will charge (at public charging stations) using 1MW versus 350kW chargers, over time. The effect of time also changes our assumption of the public-charger-to-vehicle ratio. For example, it is assumed that in early years (e.g. 2025-2030), there will need to be many more public chargers than vehicles to ensure vehicles can find chargers when needed, based both on locations and time-of-day. However, as the system grows beyond 2030, we expect this ratio to decline, indicating that more vehicles will be able to use the same charger over the course of a day, especially if systems emerge to allow planning of their charging schedule and be able to book chargers in advance.
We then apply this matrix to two future scenarios, with somewhat greater sales and stocks of electric trucks in one than the other. These variations in M/HD BEV sales and stock projections are then linked to (the same set of ratios of) charger requirements, to derive total charger numbers and investment costs of needed chargers. The projections and scenarios used for this are taken from the UC Davis California Transportation Transition Model (CA TTM) [18]. This model allows users to investigate scenarios of market penetration by new vehicle technologies and transportation fuels, as well as impacts on economic costs and GHG emission reductions, in California.
As is discussed in that paper, the scenarios used in this paper reflect recent TTM updates based on ongoing changes to the California Advanced Clean Truck (ACT) and Advanced Clean Fleet (ACF) regulations that may affect ZEV penetration. We continue to assume a 100% ZEV sales share for trucks is achieved by 2036. But it is important to note that there are important uncertainties around these regulations. The main scenario in that report, also used here, assumes that the target of 100% ZEV sales for all truck types is achieved by 2036; the report also points out that the suspension of the ACF and ACT due to EPA waiver revocation may cause a delay in achieving this target. But California clearly remains committed to its ZEV goals and has indicated plans for identifying alternative policies to achieve these.
Table 4 shows the estimated M/HD BEV stock numbers in two different scenarios from 2022 to 2035 in the updated CA TTM. For reference, the M/HD BEV stock number in the “High Fuel Cell” scenario is about 148 thousand by 2030, coming close to the estimation in [15]. In the “High Electrification” scenario, M/HD BEV stock is projected to reach 179 thousand by 2030, surpassing all relevant estimations in California-focused reviewed studies [14,17].
After applying assumptions in Appendix B1 through Appendix B3 to stock numbers in two different scenarios in , this study arrives at the following results of future M/HD charging needs in California in 2030 and 2035.
As shown in Figure 4, in the “High Electrification” scenario, the annual number of M/HD chargers will steadily increase and reach about 39.3 thousand installations in 2030. From a charger-count perspective, many chargers will be installed for heavy-duty pickup trucks (HD pickup, Class 2b) and medium-duty urban trucks (MD, Classes 4 to 6). In terms of the types of chargers and charger power levels, many M/HD charger installations are expected to be for depot Level 2, 50kW, or 150kW in California.
The M/HD charging infrastructure needs can be affected by the composition of different zero-emission vehicle choices for the M/HD sector. As depicted in Figure 4, in the “High Fuel Cell” scenario, the number of M/HD battery electric trucks is lower, but still very substantial. The annual number of M/HD chargers will steadily increase and reach about 37.5 thousand installations in 2030. Just like the distribution in the “High Electrification” scenario, many chargers installed will be for heavy-duty pickup trucks (HD pickup, Class 2b) and medium-duty urban trucks (MD, Classes 4 to 6) from a charger-count perspective and most of the M/HD chargers are expected to be for depot Level 2, 50kW, or 150kW in California. As shown in the figures, the number of charger installations increases steadily each year; however, a spike appears in 2034 and 2035. This is mostly due to the consideration of charger replacement. As described in the previous section, the average charger lifespan is assumed to be 10 years.
While charger lifespan and replacement are considered in this study, it is important to note and distinguish the number of charger installations needed and the number of chargers on the road. Because in this study charger replacement starts to rollout in 2034.
As shown in Figure 5, in the High Electrification scenario, a total number of 156 thousand M/HD chargers will be needed on the road by 2030 and increase to nearly 460 thousand by 2035. For the High Fuel Cell scenario, a total number of 151 thousand M/HD chargers will need to be on the road by 2030 and increase to 434 thousand by 2035. From a charger-count perspective, both estimation of charging needs in 2030 to support the electrification of Class 2b trucks through Class 8 trucks are with the range of existing estimations in reviewed studies (i.e., a total of 112 thousands to 155 thousands of chargers needed by 2030).
When it comes to the associated investment costs needed for installing all the M/HD chargers, it should cover associated investments for both new installation and replacing the obsolete chargers after an average of 10-year usage. As shown in Figure 6, in the High Electrification scenario, the investment needs for M/HD charging infrastructure in the is approximately $7.4 billion to support 179 thousand battery-electric trucks through 2030, and approximately $17.8 billion through 2035 to support 517 thousand battery-electric trucks in California. In the High Fuel Cell scenario, the associated investment needs for M/HD charging infrastructure will be about $7.1 billion to support 148 thousand battery-electric trucks, and $16.4 billion through 2035 to support 379 thousand battery-electric M/HD in California.
5. Conclusions
Based on the reviewed literature, it is evident that a considerable scale of charging infrastructure and investments will be needed in the U.S. M/HD sector, and specifically within California, by 2030. However, the wide range of estimates for charging infrastructure in reviewed studies indicates many questions and estimation challenges.
Basic challenges in estimating the M/HD charging infrastructure needs are estimating the number of trucks, where they will charge and how often, and the power levels needed. This paper is mainly concerned with providing simplified, but foundational, estimates of total charging power needed and the investment costs associated with these chargers. But these questions break into deeper ones.
For example, a major challenge in estimating the M/HD charging infrastructure needs is the complexity associated with the planning and systematic rollout of charging infrastructure for precise geographic locations, especially the details of when and where chargers are needed. Additionally, as [13] mentioned in their study, energy demand for charging in the M/HDVs will be very localized and densely concentrated in certain regions such as ports (e.g., the Port of Long Beach and the Port of Los Angeles) industrial and warehousing complexes, and freight corridors. An increase in energy demand in these regions puts unprecedented pressure on the local grid demands, nearby necessitating major utility upgrades and updated and expedited planning processes, as well as future operation and maintenance, to power and operate the chargers. Beyond studies like this one that would provide insights about the ballpark level of charging infrastructure needs, there are other considerations that may support the charging infrastructure planning as follows.
- Creating a detailed roadmap for charging infrastructure planning in cooperation with fleets and stakeholders;
- Setting up charging pilot programs with detailed data acquisition and analysis to better understand battery electric truck charging behavior in their operations;
- On-going tracking of the system and where new investment is needed;
- Standardization of both hardware and software to create a clear view on the level of power needed in different situations.
- Coordinate with the utility earlier on to identify any technical challenges and associated costs.
A second consideration is a deeper look at the market for BETs and competing technologies. Unlike the LDV sector which considers electrification as a promising and primary pathway for decarbonization, the M/HD sector has several other business and operational considerations that need to be factored in. Two studies [13,16] indicate some considerations of hydrogen fuel cell M/HD market penetration in their scenarios while the rest of the studies do not. This could be attributed to the relatively slower pace of FCEV market penetration to date [4]. In [16], the future depot charging infrastructure needs will be about 152 to 392 stations by 2025 and increase to about 2566 to 7468 stations by 2040, depending on the scenarios (advanced battery adoption scenario versus advanced hydrogen fuel cell adoption scenario). This indicates that the consideration of different levels of FCEV market penetration could make a significant difference in the future charging infrastructure needs for M/HDs. Especially for long-haul trucks, demand for public charging infrastructure can decrease if the market penetration of fuel cell trucks is significant.
Another challenge in estimating the charging infrastructure needs is the state of charging technology. There are various emerging alternative charging solutions, such as battery swapping, overhead catenary charging, and wireless in-road charging. None of the reviewed studies project the future charging infrastructure needs for M/HD BEVs around a wide adoption of any aforementioned emerging technologies. Yet some solutions (e.g., battery swapping) may change the charging infrastructure needs and therefore require further use-case evaluation through pilot programs and public-private partnerships [4].
Based on results from Section 4 where the proposed matrix is applied to two different M/HD BEV scenarios, it is clear that a significant amount of capital investment will be needed to support an ambitious increase in the amount of M/HD BEVs in California. There are still uncertainties around how many battery electric M/HD BEVs will become available and functional within each vehicle Class and how those trucks will be charged in the future. The magnitude of investment in charging infrastructure can reach up to $11 billion or even $16 billion by 2035, depending on different scenarios and choosing between battery electric versus hydrogen fuel cell electric trucks. Discussion on the details of how these uncertainties will affect the estimations of future M/HD charging needs and associated investment needs is not in the scope of this study but could be explored in future studies. Furthermore, how to recover the significant upfront investment cost for charging infrastructure remains challenging, especially when the charger utilization is relatively low at first. Achieving reasonably high utilization of chargers will be important in any case where a ROI is needed. If chargers are built out ahead of demand, this will provide good availability and may help incentivize BET purchases; however, there is a risk of low charger utilization. Operators are likely to need financing and other economic support during the transition to high numbers of BETs on the road and resulting in high charger utilization. These are not examined in the current paper, but future studies can examine the availability of adequate funding opportunities and investigate if the investment of charging infrastructure will decline with scale and experience or increase due to supply chain disruption and material cost increases.
Last but not least, when it comes to estimating the investment needs for building out the charging infrastructure for M/HDVs, one major piece missing from the existing literature is the needed utility side upgrades, which vary case by case and may be particularly difficult to estimate. Other factors affecting investment costs may also be neglected, such as economies of scale in the numbers of chargers purchased and installed, and the rising price of materials with pressures on the supply chain. Charger operation and maintenance costs are generally neglected. Finally, considering the cost associated with the time to drive (to a charger) and searching for charging opportunities should also be included in the cost of charging. These are all outside the scope of the current paper, but important areas for future research.
6. Conclusions
This paper summarizes the charging needs and associated investment needs for deploying a charging infrastructure for M/HD BEVs across California and the U.S. by 2035 and proposes a ‘new’ vehicle/charger matrix to capture M/HDV charging needs with additional context and details. These include more detailed classifications across truck type (or Classes), charging type, and charging power. Depot versus public charging is also differentiated. The matrix is constructed based on our literature review but also common understandings and expert opinions that we solicited in discussions with OEMs and fleets.
Projecting the charging needs to support the future demand growth in M/HD electric trucks is critical and faces various uncertainties, including charging distribution (locations and power levels), affordability, power and energy demand on the grid relative to capacity, and the ability to charge companies to achieve adequate returns on their investments. Clearly there is no single right answer for projecting the future needs and investment needs for M/HD BEV charging infrastructure. Such forecasts are highly sensitive to many unknown factors that arise from the complex and nuanced operations and applications in the HD sector. As future work, the authors are developing a new set of projections that will provide more granularity on the future needed charging infrastructure related to the number of trucks of different types, application duty cycles, charging patterns, and charging power, with associated investment needs and policy recommendations for enabling the smooth and energy-affordable transition to ZEVs.
The study also acknowledges that there are other practical and operational challenges to deploying the charging infrastructure for M/HD BEVs, including long permitting times for the installation of charging or refueling stations, lengthy utility-side installation, high capital cost of charging stations, and access to charging at an affordable charging price. Generally, these challenges are not discussed in the reviewed papers but could affect the rate of charger rollout and the ultimate extent, in some cases.
Author Contributions
For research articles with several authors, a short paragraph specifying their individual contributions must be provided. Conceptualization, Hong Yang, Marshall Miller, and Lewis Fulton; methodology, Hong Yang, Marshall Miller, and Lewis Fulton; software, Hong Yang; validation, Hong Yang; formal analysis, Hong Yang and Marshall Miller; investigation, Hong Yang; data curation, Aravind Kailas, Marshall Miller, and Hong Yang; writing—original draft preparation, Hong Yang; writing—review and editing, Hong Yang, Aravind Kailas, Marshall Miller, and Lewis Fulton; visualization, Hong Yang; supervision, Lewis Fulton and Marshall Miller; project administration, Lewis Fulton and Marshall Miller; funding acquisition, Lewis Fulton. All authors have read and agreed to the published version of the manuscript.
Funding
This research was funded by the Energy Futures program funding, within the Institute of Transportation Studies at UC Davis, and the range of sponsors of these programs.
Acknowledgments
We thank the UC Davis fleet Advisory Panel for sharing their comments with us on the initial draft of this manuscript.
Conflicts of Interest
The authors declare that they have no known competing financial interests or personal relationships that could have appeared to influence the work reported in this paper.
Abbreviations
The following abbreviations are used in this manuscript:
| BEVs | Battery electric vehicle |
| EVs | Electric vehicles |
| CA | California |
| CEC | California Energy Commission |
| CARB | California Air Resources Board |
| DCFC | Direct current fast charger |
| DOE | Department of Energy |
| EVSE | Electric vehicle supply equipment |
| FCEVs | Fuel-cell electric vehicles |
| ICE | Internal combustion engine vehicles |
| IEPR | Integrated Energy Policy Report |
| MDVs | Medium-duty vehicles (Class2b-6) |
| M/HD | Medium- and heavy-duty (Class2b-8) |
| NA | Not applicable |
| HDVs | Heavy-duty vehicles (Class 7 and 8) |
| PEVs | Plug-in electric vehicles (including battery electric vehicles and plug-in hybrid electric vehicles) |
| U.S. | United States |
| ZEV | Zero-emission vehicle |
Appendix A. Estimated Charging Needs and Assumptions of M/HD Battery electric truck stock in reviewed studies
| Citation | Has Estimates of Public Charging? | Has Estimates of Private Charging? | Has Estimates of Electric M/HD Stock Size? | Details About Modeled Charging Type |
| [10] | Yes, referring as on-road charging. | Yes, including home charging and depot charging. | Yes, including Class 3 to 8. | Class 3 (home Level 2, 11.5kW) Class 3 (depot Level 2, 10kW) Classes 4-6 (depot Level 2, 10kW & 16.6 kW) Classes 4-6 (depot 50kW) Classes 4-6 (on-road 150kW or 350kW) Classes 7-8 excl. long-haul (depot 50kW) Classes 7-8 excl. long-haul (depot 150kW) Classes 7-8 excl. long-haul (on-road 350kW) Long-haul trucks (on-road 350kW or 2MW) Motorhomes (on-road 350kW) |
| [11] | Only has estimates for the total charging needs without further distinguishing it by charging type. | Only has estimated truck stock without further distinguishing it by truck type or Classes. | 120 ~ 250kW, with an average of 210kW. | |
| [14] | Yes. | Yes, referring as depot charging. | Yes, including charging power from 19kW to 1600kW. | *(share of number of chargers) 19kW & 25kW (100% depot) 50 kW & 75kW (87% depot & 13% public) 100kW & 150kW (96% depot & 4% public) 225kW, 250kW, & 300kW (82% depot & 18% public) 350kW, 450kW, & 500kW (83% depot & 17% public) 750kW, 900kW, 1000kW, 1.05MW, 1.2MW, 1.4MW, 1.6MW (100% public) |
| [4] | Yes, including publicly accessible depot charging, and fast and ultrafast charging. | Yes, referring as overnight private depot charging. | Only has estimated truck stock without further distinguishing it by truck type or Classes. | Private charging (50kW DC and 100-150kW DC at depot) Private charging (350kW DC at destination opportunity) Public charging (100-150kW DC overnight) Public charging (350kW DCFC for en-route and destination fast) Public charging (1MW and 3MW DC for en-route and destination ultrafast) |
| [12] | No. | Yes, referring as fleet depot charging. | Only has estimated truck stock without further distinguishing it by truck type or Classes. | NA |
| [15] | Yes, including Level 2 public charging and DCFC charging. | No. | Yes, including MDV and HDV. | DCFC (50kW, 150kW, 350kW) |
| [16] | Yes. | Yes. | Yes, including Classes 4 to 8. | NA |
| [17] | Yes. | Yes, referring as depot charging. | Yes, including Classes 3 to 8. | Depot charging at 20kW, 50kW, 100kW, and 150kW; and public charging at 350kW, 500kW, 750kW, 1MW, 1.5MW. Classes 7 & 8 charger at both public and depot; Classes 4-6 charge at public, light-heavy-duty (10001-14000 lbs. GVWR) charge at public. |
| [13] | Yes, including fast and ultrafast chargers. | Yes, referring as overnight chargers. | Yes, including Classes 4 to 8 MDHD vehicles. | Overnight charging at 50-150kW, opportunity fast charging at 350kW, and opportunity ultrafast charging at 2MW. |
Appendix B

Table A1.
Proposed matrix for estimating the charging needs and investment needs from trucks (Class 2b to Class 8).
Table A1.
Proposed matrix for estimating the charging needs and investment needs from trucks (Class 2b to Class 8).
| Truck Type | Depot Charging | Public Charging | Total | ||||||||
|---|---|---|---|---|---|---|---|---|---|---|---|
| Level 2 | 50kW | 150kW | 350kW | 1MW | Level 2 | 50kW | 150kW | 350kW | 1MW | ||
| 2025 | |||||||||||
| HD pickup | 71% | 10% | 0% | 0% | 0% | 0% | 14% | 10% | 0% | 0% | 105% |
| HD voc | 0% | 10% | 90% | 0% | 0% | 0% | 0% | 0% | 0% | 0% | 100% |
| LH | 0% | 0% | 0% | 10% | 0% | 0% | 0% | 0% | 20% | 70% | 100% |
| MD urban | 8% | 64% | 8% | 0% | 0% | 0% | 5% | 15% | 0% | 0% | 100% |
| MD voc | 20% | 60% | 20% | 0% | 0% | 0% | 0% | 0% | 0% | 0% | 100% |
| SH | 0% | 0% | 45% | 30% | 0% | 0% | 0% | 0% | 20% | 10% | 105% |
| 2026 | |||||||||||
| HD pickup | 71% | 10% | 0% | 0% | 0% | 0% | 14% | 10% | 0% | 0% | 105% |
| HD voc | 0% | 10% | 90% | 0% | 0% | 0% | 0% | 0% | 0% | 0% | 100% |
| LH | 0% | 0% | 0% | 10% | 0% | 0% | 0% | 0% | 20% | 70% | 100% |
| MD urban | 8% | 59% | 8% | 0% | 0% | 0% | 10% | 15% | 0% | 0% | 100% |
| MD voc | 20% | 60% | 20% | 0% | 0% | 0% | 0% | 0% | 0% | 0% | 100% |
| SH | 0% | 0% | 45% | 30% | 0% | 0% | 0% | 0% | 20% | 10% | 105% |
| 2027 | |||||||||||
| HD pickup | 73% | 10% | 0% | 0% | 0% | 0% | 13% | 8% | 0% | 0% | 104% |
| HD voc | 0% | 10% | 90% | 0% | 0% | 0% | 0% | 0% | 0% | 0% | 100% |
| LH | 0% | 0% | 0% | 10% | 0% | 0% | 0% | 0% | 20% | 70% | 100% |
| MD urban | 8% | 64% | 8% | 0% | 0% | 0% | 5% | 15% | 0% | 0% | 100% |
| MD voc | 20% | 60% | 20% | 0% | 0% | 0% | 0% | 0% | 0% | 0% | 100% |
| SH | 0% | 0% | 45% | 30% | 0% | 0% | 0% | 0% | 19% | 10% | 104% |
| 2028 | |||||||||||
| HD pickup | 75% | 10% | 0% | 0% | 0% | 0% | 12% | 7% | 0% | 0% | 104% |
| HD voc | 0% | 10% | 90% | 0% | 0% | 0% | 0% | 0% | 0% | 0% | 100% |
| LH | 0% | 0% | 0% | 10% | 0% | 0% | 0% | 0% | 20% | 70% | 100% |
| MD urban | 8% | 64% | 8% | 0% | 0% | 0% | 5% | 15% | 0% | 0% | 100% |
| MD voc | 20% | 60% | 20% | 0% | 0% | 0% | 0% | 0% | 0% | 0% | 100% |
| SH | 0% | 0% | 45% | 30% | 0% | 0% | 0% | 0% | 19% | 10% | 104% |
| 2029 | |||||||||||
| HD pickup | 77% | 10% | 0% | 0% | 0% | 0% | 11% | 6% | 0% | 0% | 104% |
| HD voc | 0% | 10% | 90% | 0% | 0% | 0% | 0% | 0% | 0% | 0% | 100% |
| LH | 0% | 0% | 0% | 10% | 0% | 0% | 0% | 0% | 20% | 70% | 100% |
| MD urban | 8% | 64% | 8% | 0% | 0% | 0% | 5% | 15% | 0% | 0% | 100% |
| MD voc | 20% | 60% | 20% | 0% | 0% | 0% | 0% | 0% | 0% | 0% | 100% |
| SH | 0% | 0% | 45% | 30% | 0% | 0% | 0% | 0% | 19% | 10% | 104% |
| 2030 | |||||||||||
| HD pickup | 80% | 10% | 0% | 0% | 0% | 0% | 8% | 5% | 0% | 0% | 103% |
| HD voc | 0% | 10% | 90% | 0% | 0% | 0% | 0% | 0% | 0% | 0% | 100% |
| LH | 0% | 0% | 0% | 10% | 0% | 0% | 0% | 0% | 20% | 70% | 100% |
| MD urban | 8% | 64% | 8% | 0% | 0% | 0% | 5% | 15% | 0% | 0% | 100% |
| MD voc | 20% | 60% | 20% | 0% | 0% | 0% | 0% | 0% | 0% | 0% | 100% |
| SH | 0% | 0% | 45% | 30% | 0% | 0% | 0% | 0% | 18% | 10% | 103% |
| 2031 | |||||||||||
| HD pickup | 80% | 10% | 0% | 0% | 0% | 0% | 5% | 8% | 0% | 0% | 103% |
| HD voc | 0% | 10% | 90% | 0% | 0% | 0% | 0% | 0% | 0% | 0% | 100% |
| LH | 0% | 0% | 0% | 10% | 0% | 0% | 0% | 0% | 18% | 72% | 100% |
| MD urban | 8% | 64% | 8% | 0% | 0% | 0% | 5% | 15% | 0% | 0% | 100% |
| MD voc | 20% | 60% | 20% | 0% | 0% | 0% | 0% | 0% | 0% | 0% | 100% |
| SH | 0% | 0% | 44% | 31% | 0% | 0% | 0% | 0% | 16% | 11% | 102% |
| 2032 | |||||||||||
| HD pickup | 80% | 10% | 0% | 0% | 0% | 0% | 4% | 9% | 0% | 0% | 103% |
| HD voc | 0% | 10% | 90% | 0% | 0% | 0% | 0% | 0% | 0% | 0% | 100% |
| LH | 0% | 0% | 0% | 10% | 0% | 0% | 0% | 0% | 16% | 74% | 100% |
| MD urban | 8% | 64% | 8% | 0% | 0% | 0% | 5% | 15% | 0% | 0% | 100% |
| MD voc | 20% | 60% | 20% | 0% | 0% | 0% | 0% | 0% | 0% | 0% | 100% |
| SH | 0% | 0% | 43% | 32% | 0% | 0% | 0% | 0% | 15% | 12% | 102% |
| 2033 | |||||||||||
| HD pickup | 80% | 10% | 0% | 0% | 0% | 0% | 4% | 9% | 0% | 0% | 103% |
| HD voc | 0% | 10% | 90% | 0% | 0% | 0% | 0% | 0% | 0% | 0% | 100% |
| LH | 0% | 0% | 0% | 10% | 0% | 0% | 0% | 0% | 14% | 76% | 100% |
| MD urban | 8% | 64% | 8% | 0% | 0% | 0% | 5% | 15% | 0% | 0% | 100% |
| MD voc | 20% | 60% | 20% | 0% | 0% | 0% | 0% | 0% | 0% | 0% | 100% |
| SH | 0% | 0% | 42% | 33% | 0% | 0% | 0% | 0% | 14% | 13% | 102% |
| 2034 | |||||||||||
| HD pickup | 80% | 10% | 0% | 0% | 0% | 0% | 4% | 9% | 0% | 0% | 103% |
| HD voc | 0% | 10% | 90% | 0% | 0% | 0% | 0% | 0% | 0% | 0% | 100% |
| LH | 0% | 0% | 0% | 10% | 0% | 0% | 0% | 0% | 12% | 78% | 100% |
| MD urban | 8% | 64% | 8% | 0% | 0% | 0% | 5% | 15% | 0% | 0% | 100% |
| MD voc | 20% | 60% | 20% | 0% | 0% | 0% | 0% | 0% | 0% | 0% | 100% |
| SH | 0% | 0% | 41% | 34% | 0% | 0% | 0% | 0% | 13% | 14% | 102% |
| 2035 | |||||||||||
| HD pickup | 80% | 10% | 0% | 0% | 0% | 0% | 3% | 10% | 0% | 0% | 103% |
| HD voc | 0% | 10% | 90% | 0% | 0% | 0% | 0% | 0% | 0% | 0% | 100% |
| LH | 0% | 0% | 0% | 10% | 0% | 0% | 0% | 0% | 10% | 80% | 100% |
| MD urban | 8% | 64% | 8% | 0% | 0% | 0% | 5% | 15% | 0% | 0% | 100% |
| MD voc | 20% | 60% | 20% | 0% | 0% | 0% | 0% | 0% | 0% | 0% | 100% |
| SH | 0% | 0% | 40% | 35% | 0% | 0% | 0% | 0% | 12% | 15% | 102% |
Table A2.
Proposed public charger-to-vehicle ratios for trucks (Class 2b to Class 8) in California from 2025 to 2035.
Table A2.
Proposed public charger-to-vehicle ratios for trucks (Class 2b to Class 8) in California from 2025 to 2035.
| Year | Level 2 | 50kW | 150kW | 350kW | 1MW |
|---|---|---|---|---|---|
| 2025 | 1 | 0.5 | 0.5 | 0.4 | 0.2 |
| 2026 | 1 | 0.5 | 0.5 | 0.4 | 0.2 |
| 2027 | 1 | 0.4 | 0.4 | 0.4 | 0.2 |
| 2028 | 1 | 0.35 | 0.35 | 0.35 | 0.2 |
| 2029 | 1 | 0.3 | 0.3 | 0.3 | 0.2 |
| 2030 | 1 | 0.25 | 0.25 | 0.25 | 0.2 |
| 2031 | 1 | 0.24 | 0.24 | 0.24 | 0.18 |
| 2032 | 1 | 0.23 | 0.23 | 0.23 | 0.16 |
| 2033 | 1 | 0.22 | 0.22 | 0.22 | 0.14 |
| 2034 | 1 | 0.21 | 0.21 | 0.21 | 0.12 |
| 2035 | 1 | 0.2 | 0.2 | 0.2 | 0.1 |
Table A3.
Proposed EVSE charger investment cost by charging power in California (assuming 5% discount rate).
Table A3.
Proposed EVSE charger investment cost by charging power in California (assuming 5% discount rate).
| Year | Level 2 | 50kW | 150kW | 350kW | 1MW |
|---|---|---|---|---|---|
| 2024 | $9,450.00 | $66,150.00 | $110,250.00 | $199,500.00 | $714,000.00 |
| 2025 | $9,000.00 | $63,000.00 | $105,000.00 | $190,000.00 | $680,000.00 |
| 2026 | $8,571.43 | $60,000.00 | $100,000.00 | $180,952.38 | $647,619.05 |
| 2027 | $8,163.27 | $57,142.86 | $95,238.10 | $172,335.60 | $616,780.05 |
| 2028 | $7,774.54 | $54,421.77 | $90,702.95 | $164,129.14 | $587,409.57 |
| 2029 | $7,404.32 | $51,830.26 | $86,383.76 | $156,313.47 | $559,437.68 |
| 2030 | $7,051.74 | $49,362.15 | $82,270.25 | $148,869.97 | $532,797.79 |
| 2031 | $6,715.94 | $47,011.57 | $78,352.62 | $141,780.93 | $507,426.47 |
| 2032 | $6,396.13 | $44,772.92 | $74,621.54 | $135,029.45 | $483,263.30 |
| 2033 | $6,091.55 | $42,640.88 | $71,068.13 | $128,599.48 | $460,250.77 |
| 2034 | $5,801.48 | $40,610.36 | $67,683.94 | $122,475.69 | $438,334.06 |
| 2035 | $5,525.22 | $38,676.53 | $64,460.89 | $116,643.52 | $417,461.01 |
References
- Final Rule for Phase 2 Greenhouse Gas Emissions Standards and Fuel Efficiency Standards for Medium- and Heavy-Duty Engines and Vehicles. Available online: https://www.epa.gov/regulations-emissions-vehicles-and-engines/final-rule-phase-2-greenhouse-gas-emissions-standards (accessed July 22, 2025).
- Inventory of U.S. Greenhouse Gas Emissions and Sinks. https://www.epa.gov/ghgemissions/inventory-us-greenhouse-gas-emissions-and-sinks#:~:text=In%202022%2C%20U.S.%20greenhouse%20gas,sequestration%20from%20the%20land%20sector (accessed July 3, 2024).
- Fast Facts on Transportation Greenhouse Gas Emissions. https://www.epa.gov/greenvehicles/fast-facts-transportation-greenhouse-gas-emissions (accessed July 3, 2024).
- Bernard, M. R., Tankou, A., Cui, H., and Ragon, P.-L. Charging Solutions For Battery-Electric Truck. The International Council on Clean Transportation, 2022. https://theicct.org/wp-content/uploads/2022/12/charging-infrastructure-trucks-zeva-dec22.pdf.
- Advanced Clean Truck Regulation. https://ww2.arb.ca.gov/sites/default/files/2023-06/ACT-1963.pdf (accessed July 29, 2024).
- Advanced Clean Fleets Regulation. https://ww2.arb.ca.gov/rulemaking/2022/acf2022 (accessed July 29, 2024).
- Executive Order N-27-25. https://www.gov.ca.gov/wp-content/uploads/2025/06/CRA-Response-EO-N-27-25_-ATTESTED.pdf (accessed July 21, 2025).
- Abdullahi A, Candan SA, Abba MA, Bello AH, Alshehri MA, Afamefuna VE, Umar NA, and Kundakci B. Neurological and Musculoskeletal Features of COVID-19: A Systematic Review and Meta-Analysis. Frontiers in Neurology, 2020. Vol 11. [CrossRef]
- Page MJ, McKenzie JE, Bossuyt PM, Boutron I, Hoffmann, TC, Mulrow CD, Shamseer L, Tetzlaff, JM, Akl EA, Brennan SE, Chou R, Glanville J, Grimshaw JM, Hróbjartsson A, Lalu MM, Li T, Loder EW, Mayo-Wilson E, McDonald S, … and Moher D. The PRISMA 2020 statement: an updated guideline for reporting systematic reviews. BMJ, 2021; 372.
- U.S. Vehicle Electrification Infrastructure Assessment - Medium- and Heavy-Duty Truck Charging. https://atlaspolicy.com/wp-content/uploads/2021/11/2021-11-12_Atlas_US_Electrification_Infrastructure_Assessment_MD-HD-trucks.pdf (accessed August 10, 2025).
- Charging Infrastructure Challenges for the U.S. Electric Vehicle Fleet. https://truckingresearch.org/2022/12/charging-infrastructure-challenges-for-the-u-s-electric-vehicle-fleet/ (accessed August 10, 2025).
- Building the electric-vehicle charging infrastructure America needs, https://www.mckinsey.com/~/media/mckinsey/industries/public%20and%20social%20sector/our%20insights/building%20the%20electric%20vehicle%20charging%20infrastructure%20america%20needs/building%20the%20electric-vehicle-charging-infrastructure-america-needs-vf.pdf (accessed August 10, 2025).
- Near-term Infrastructure Deployment to Support Zero-emission Medium- and Heavy-duty vehicles in the United States. https://theicct.org/wp-content/uploads/2023/05/infrastructure-deployment-mhdv-may23.pdf (accessed August 10, 2025).
- California Air Resources Board. Draft 2022 State Strategy for the State Implementation Plan. https://ww2.arb.ca.gov/sites/default/files/2022-08/2022_State_SIP_Strategy.pdf (accessed August 10, 2025).
- Workforce Impacts of Achieving Carbon-Neutral Transportation in California. https://innovation.luskin.ucla.edu/wp-content/uploads/2022/09/Workforce-Impacts-of-Achieving-Carbon-Neutral-Transportation-in-California.pdf (accessed August 10, 2025).
- California Transportation Commission. California SB 671 Clean Freight Corridor Efficiency Assessment, 2023.
- California Transportation Commission. Assembly Bill 2127 Electric Vehicle Charging Infrastructure Second Assessment Staff Draft Report, 2023.
- Miller, M., Fulton, L., Yang, H., Zhao, J., & Burke, A. Technology and Fuel Transition Scenarios to Low Greenhouse Gas Futures for Cars and Trucks in California to 2050. eScholarship, 2025.
- Fulton, L., Miller, M., Burke, A., Wang, Q., and Yang C. Technology and Fuel Transition Scenarios to Low Greenhouse Gas Futures for Cars and Trucks in California. eScholarship, 2019.
Figure 2.
Charger-to-vehicle ratio electric M/HD battery-electric trucks in the U.S. to 2030 in reviewed studies.
Figure 2.
Charger-to-vehicle ratio electric M/HD battery-electric trucks in the U.S. to 2030 in reviewed studies.
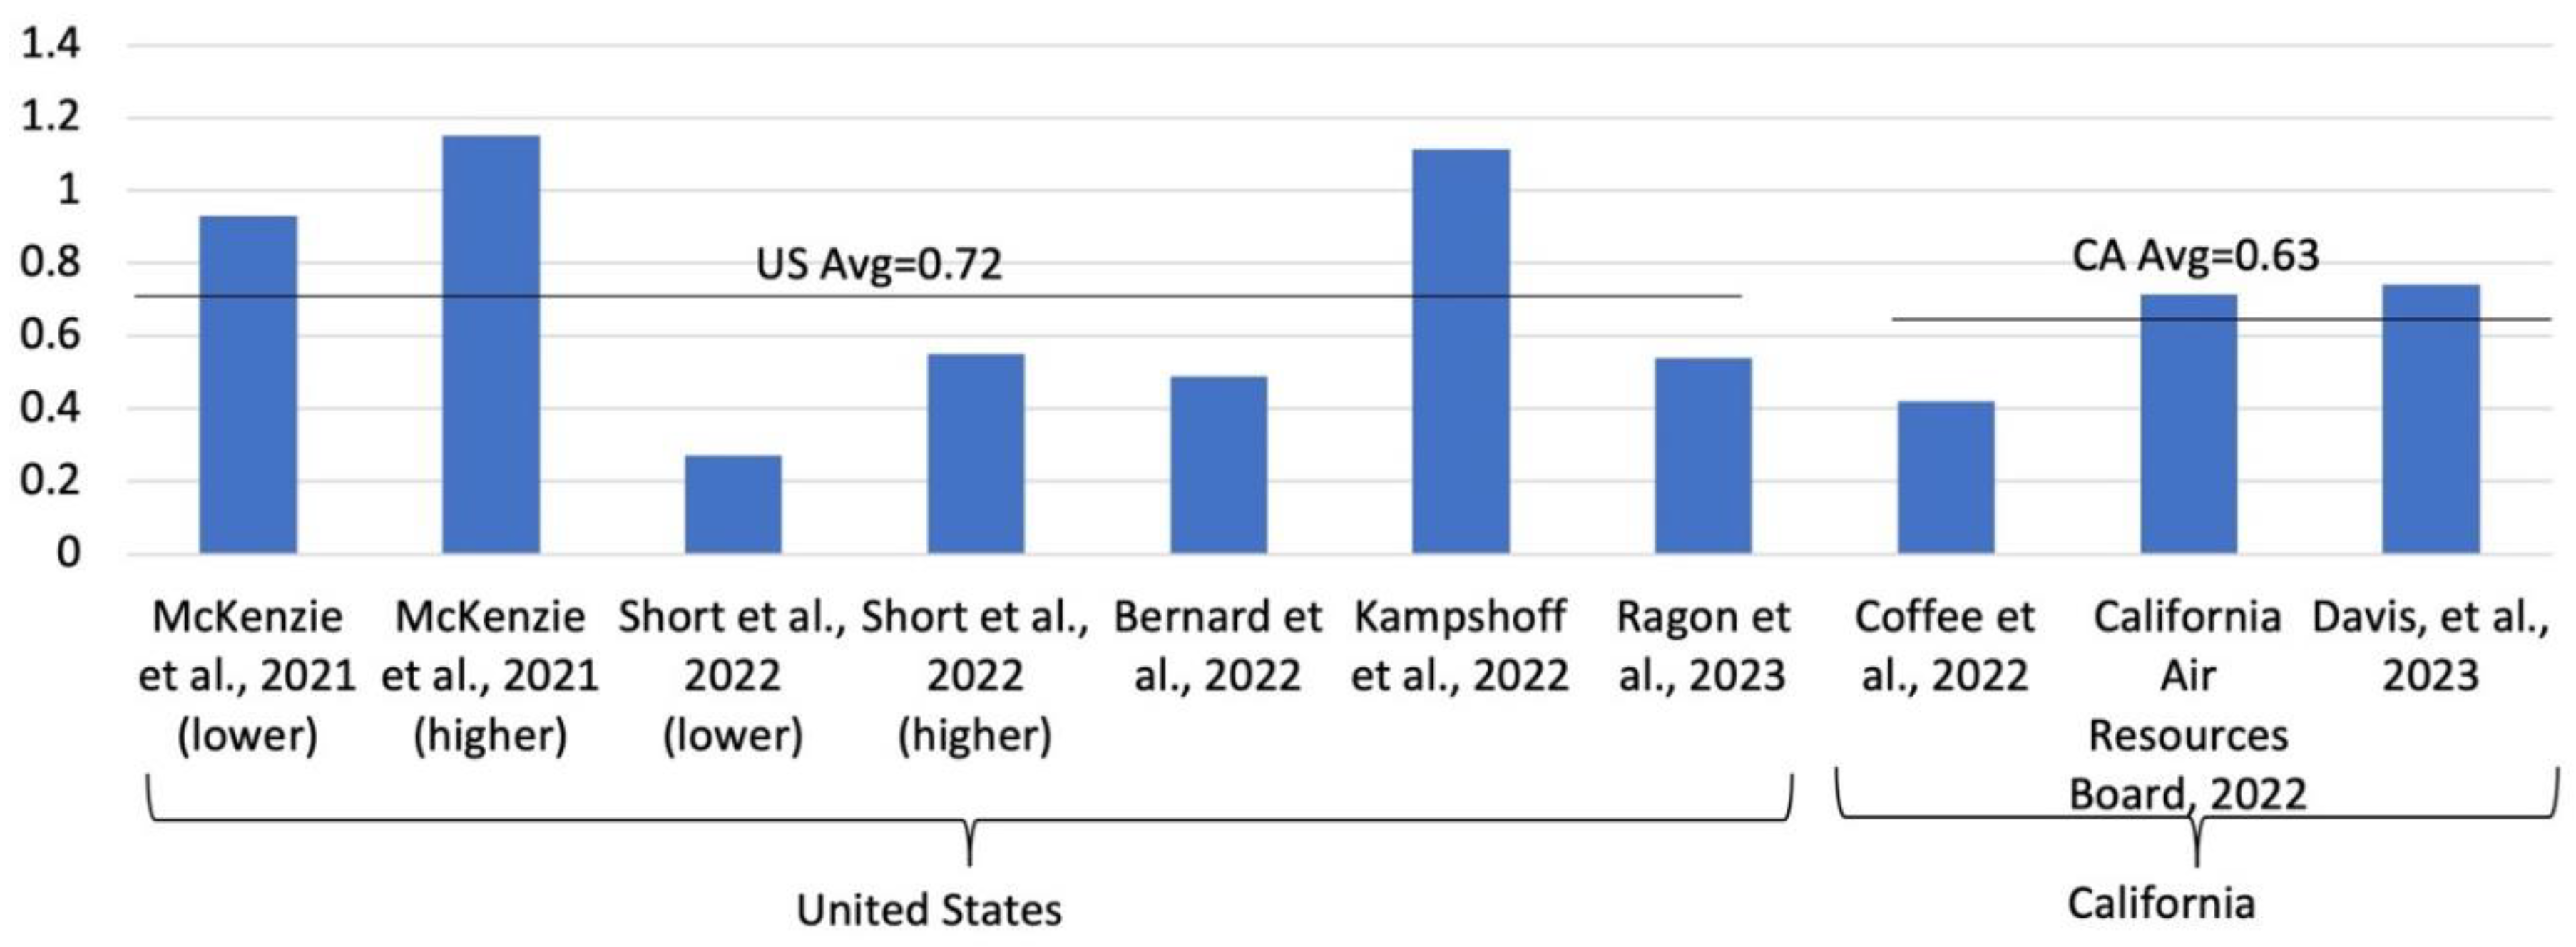
Figure 3.
Assumption of investment per charger in reviewed studies.
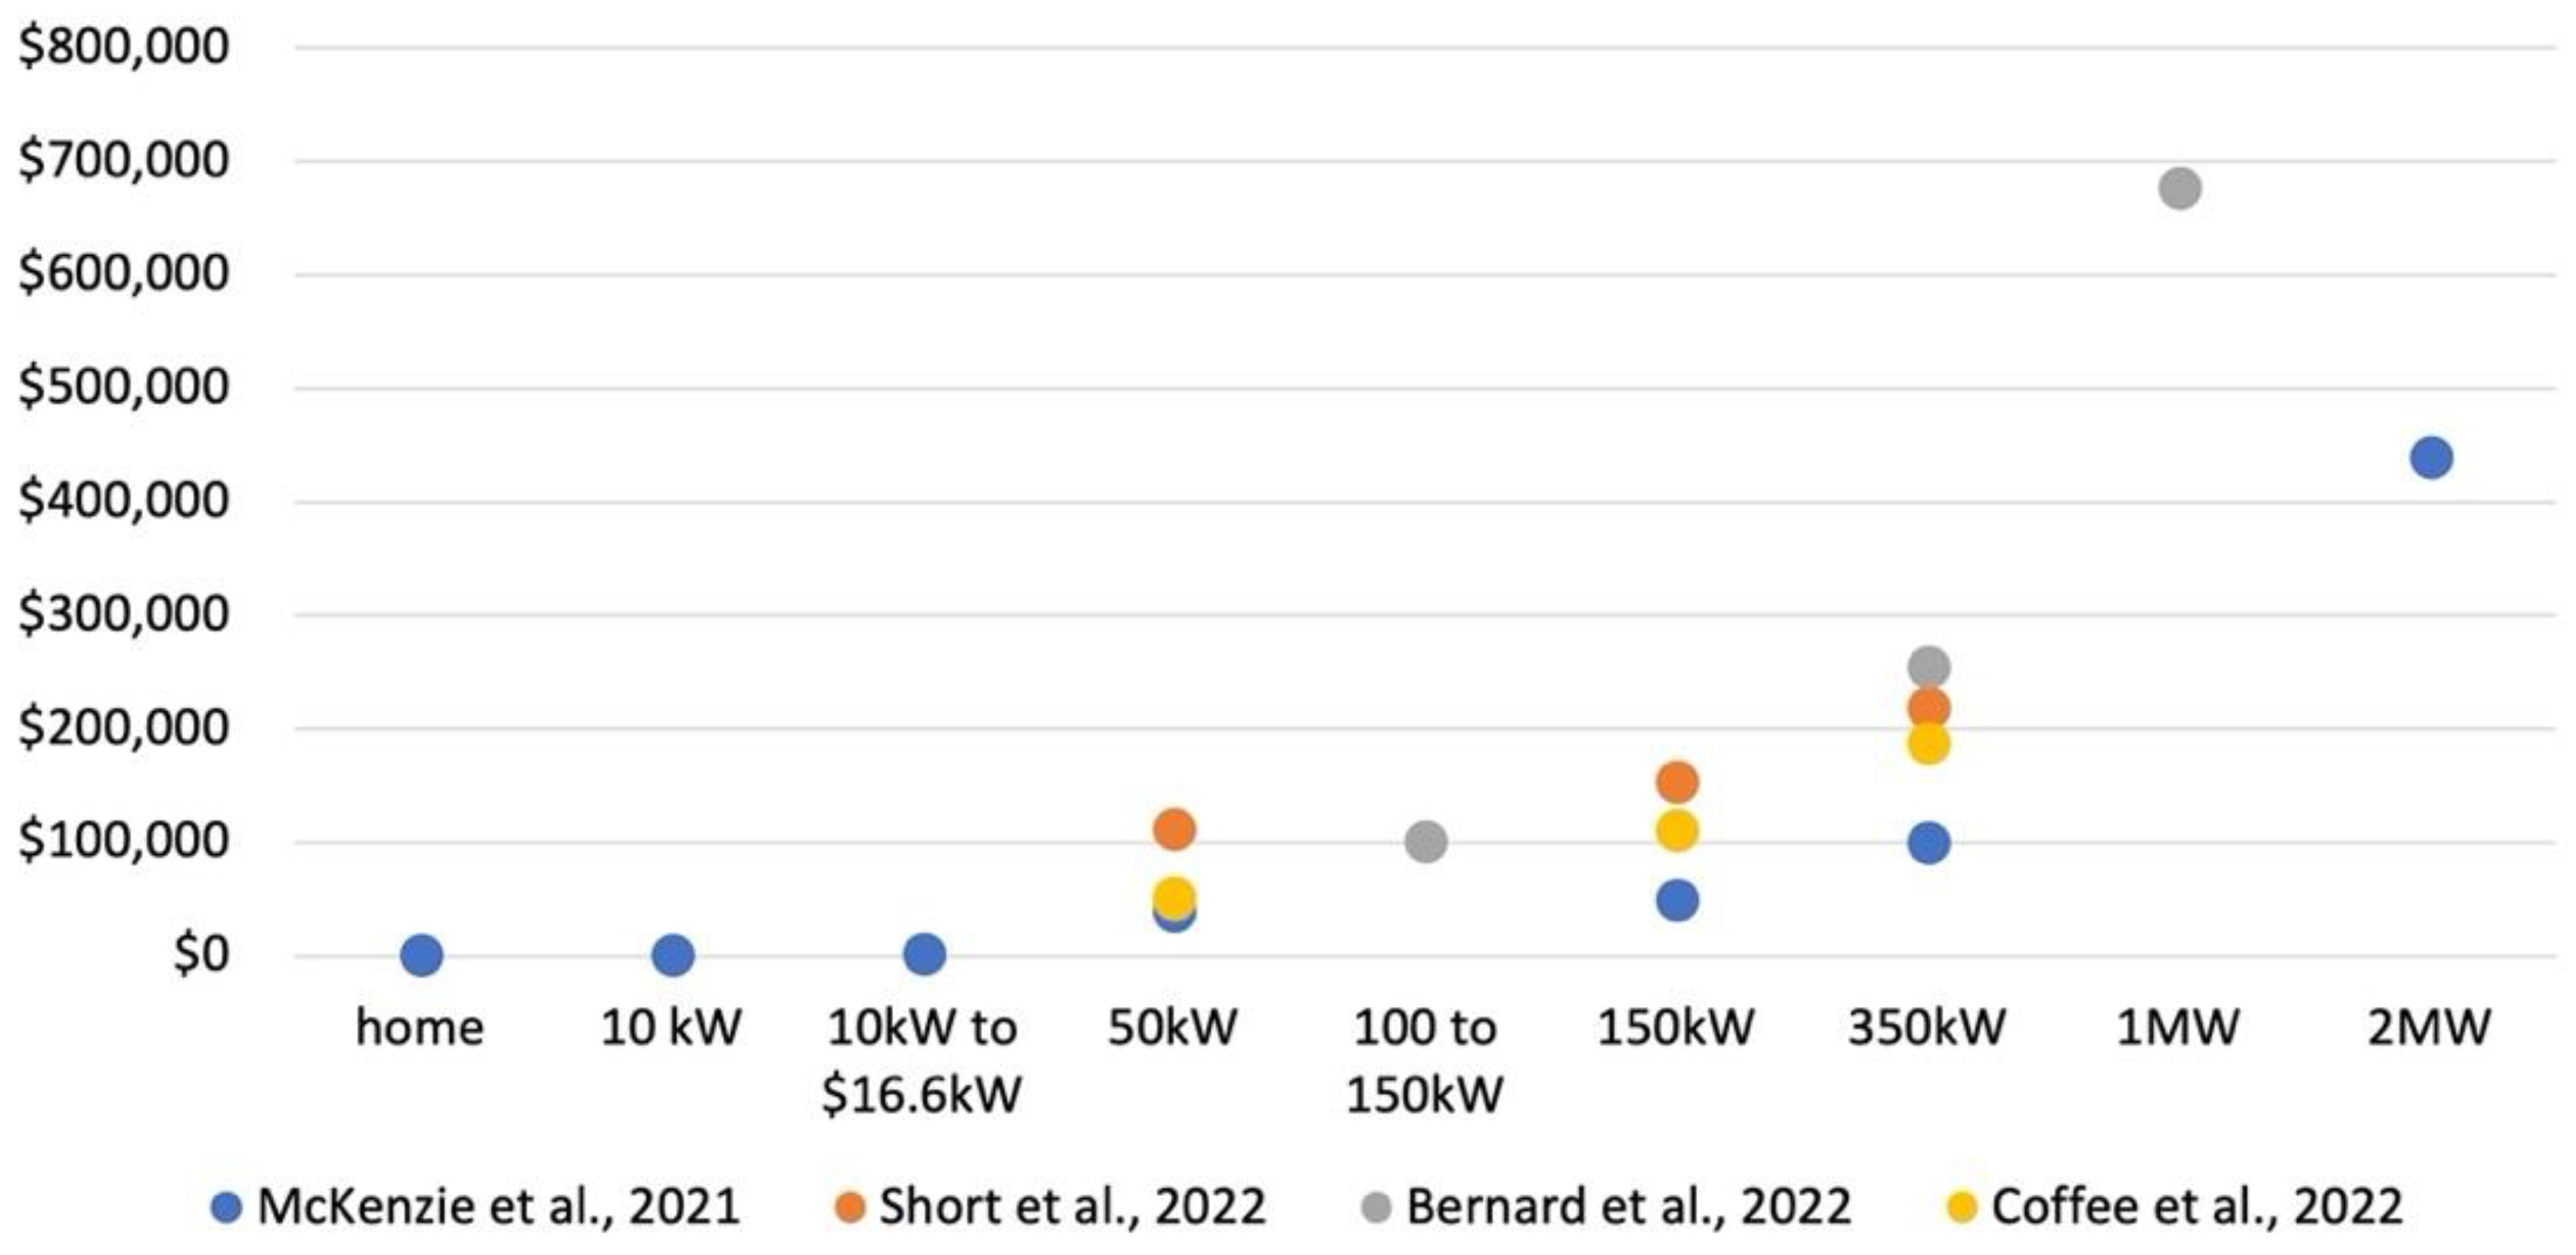
Figure 4.
Annual number of M/HD charger installations needed in California, 2025-2035. Note: figure from top left to top right: High Electrification scenario by vehicle type, High Electrification scenario by charging power; figure from bottom left to bottom right: High Fuel Cell scenario by vehicle type, High Fuel Cell scenario by charging power.
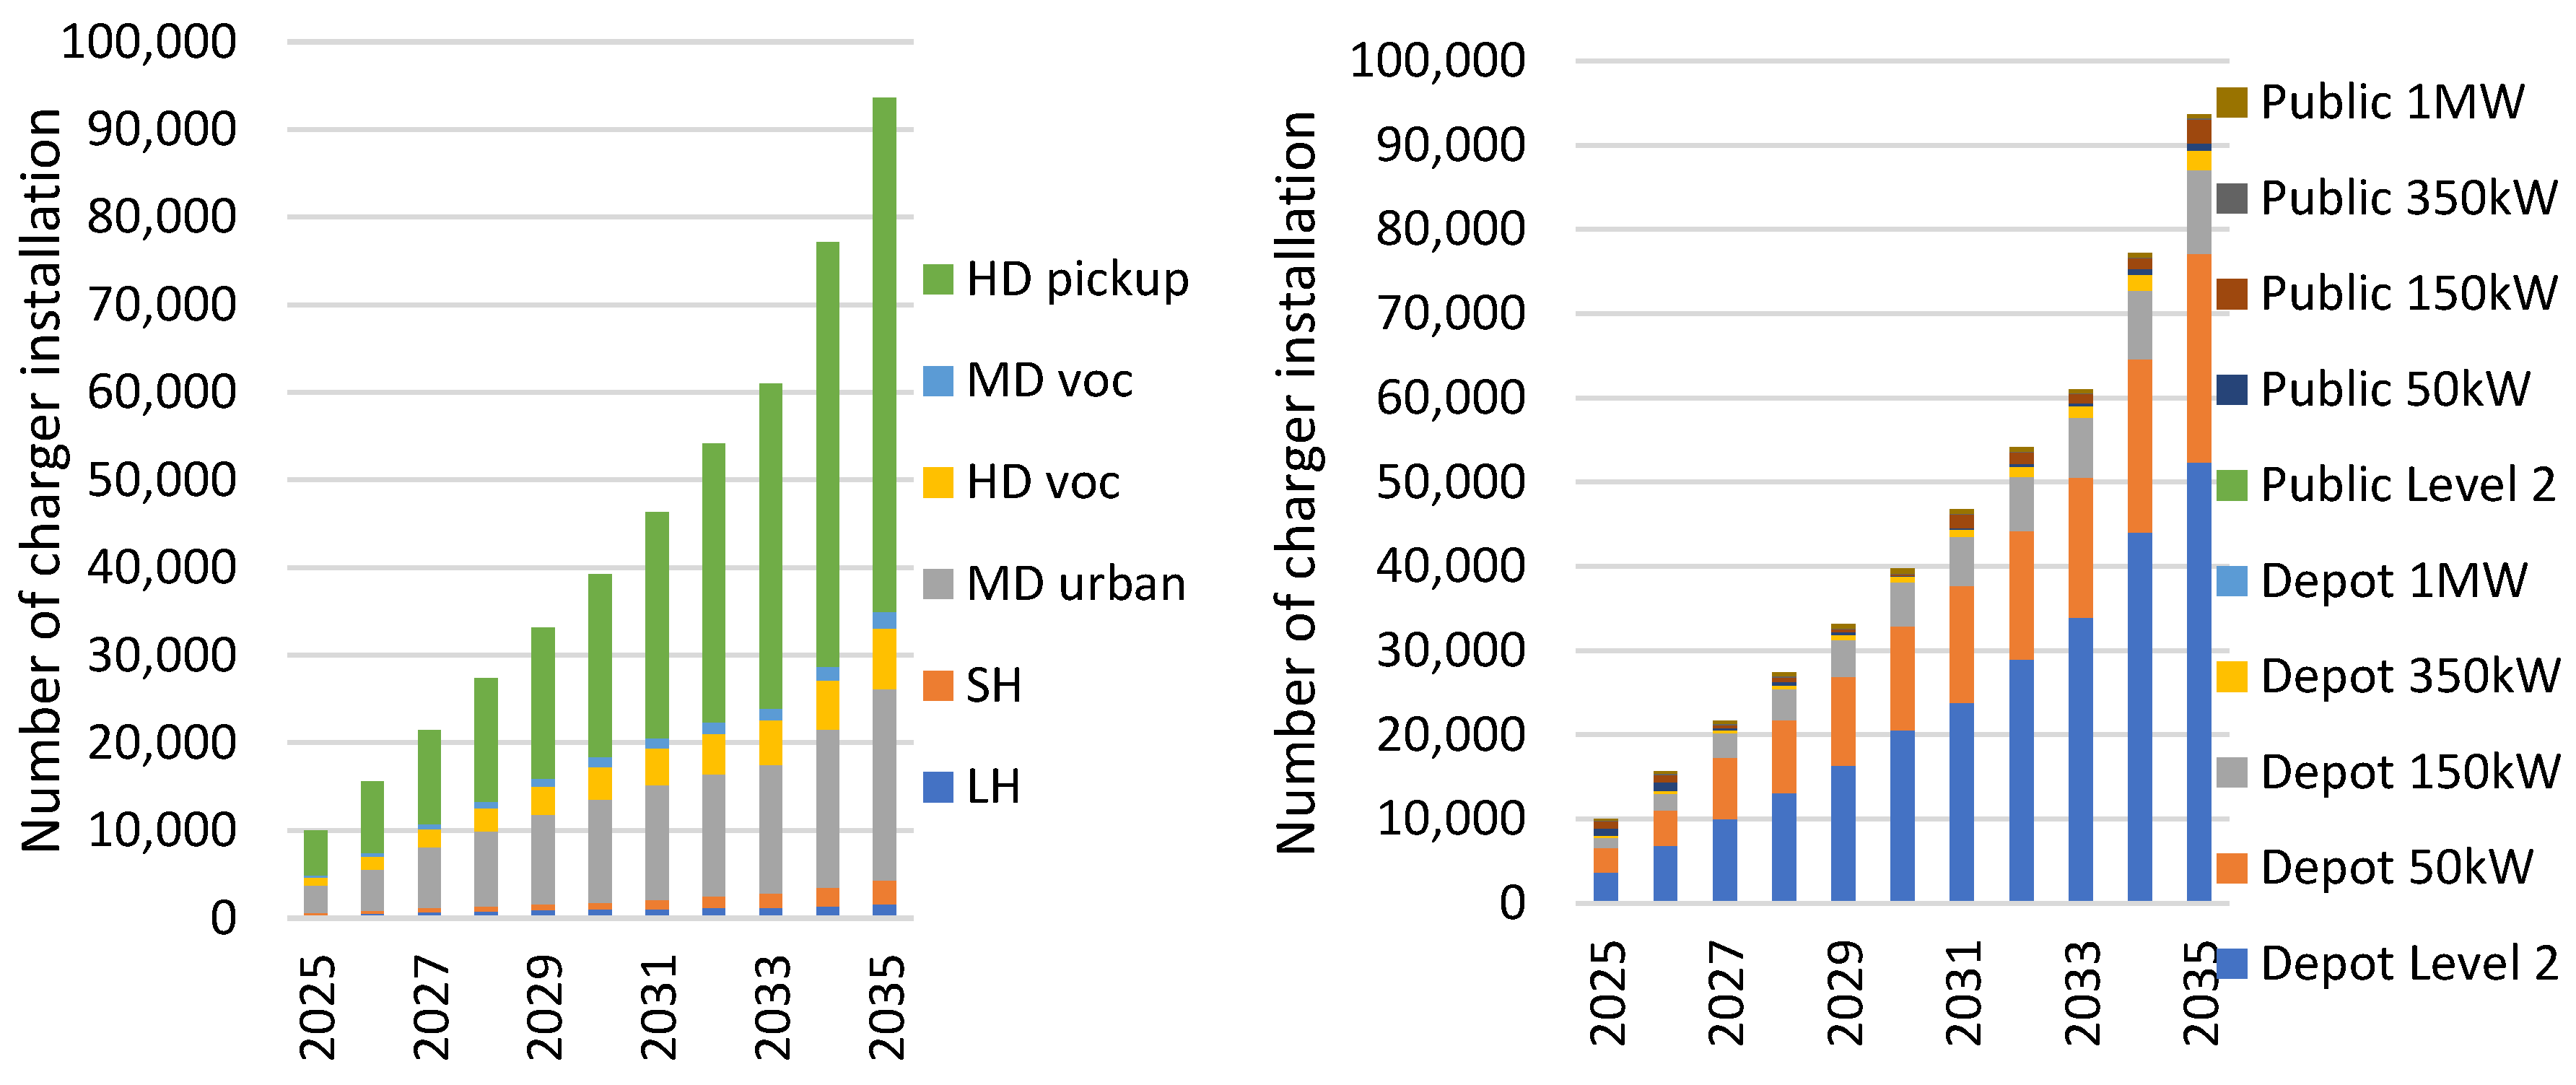
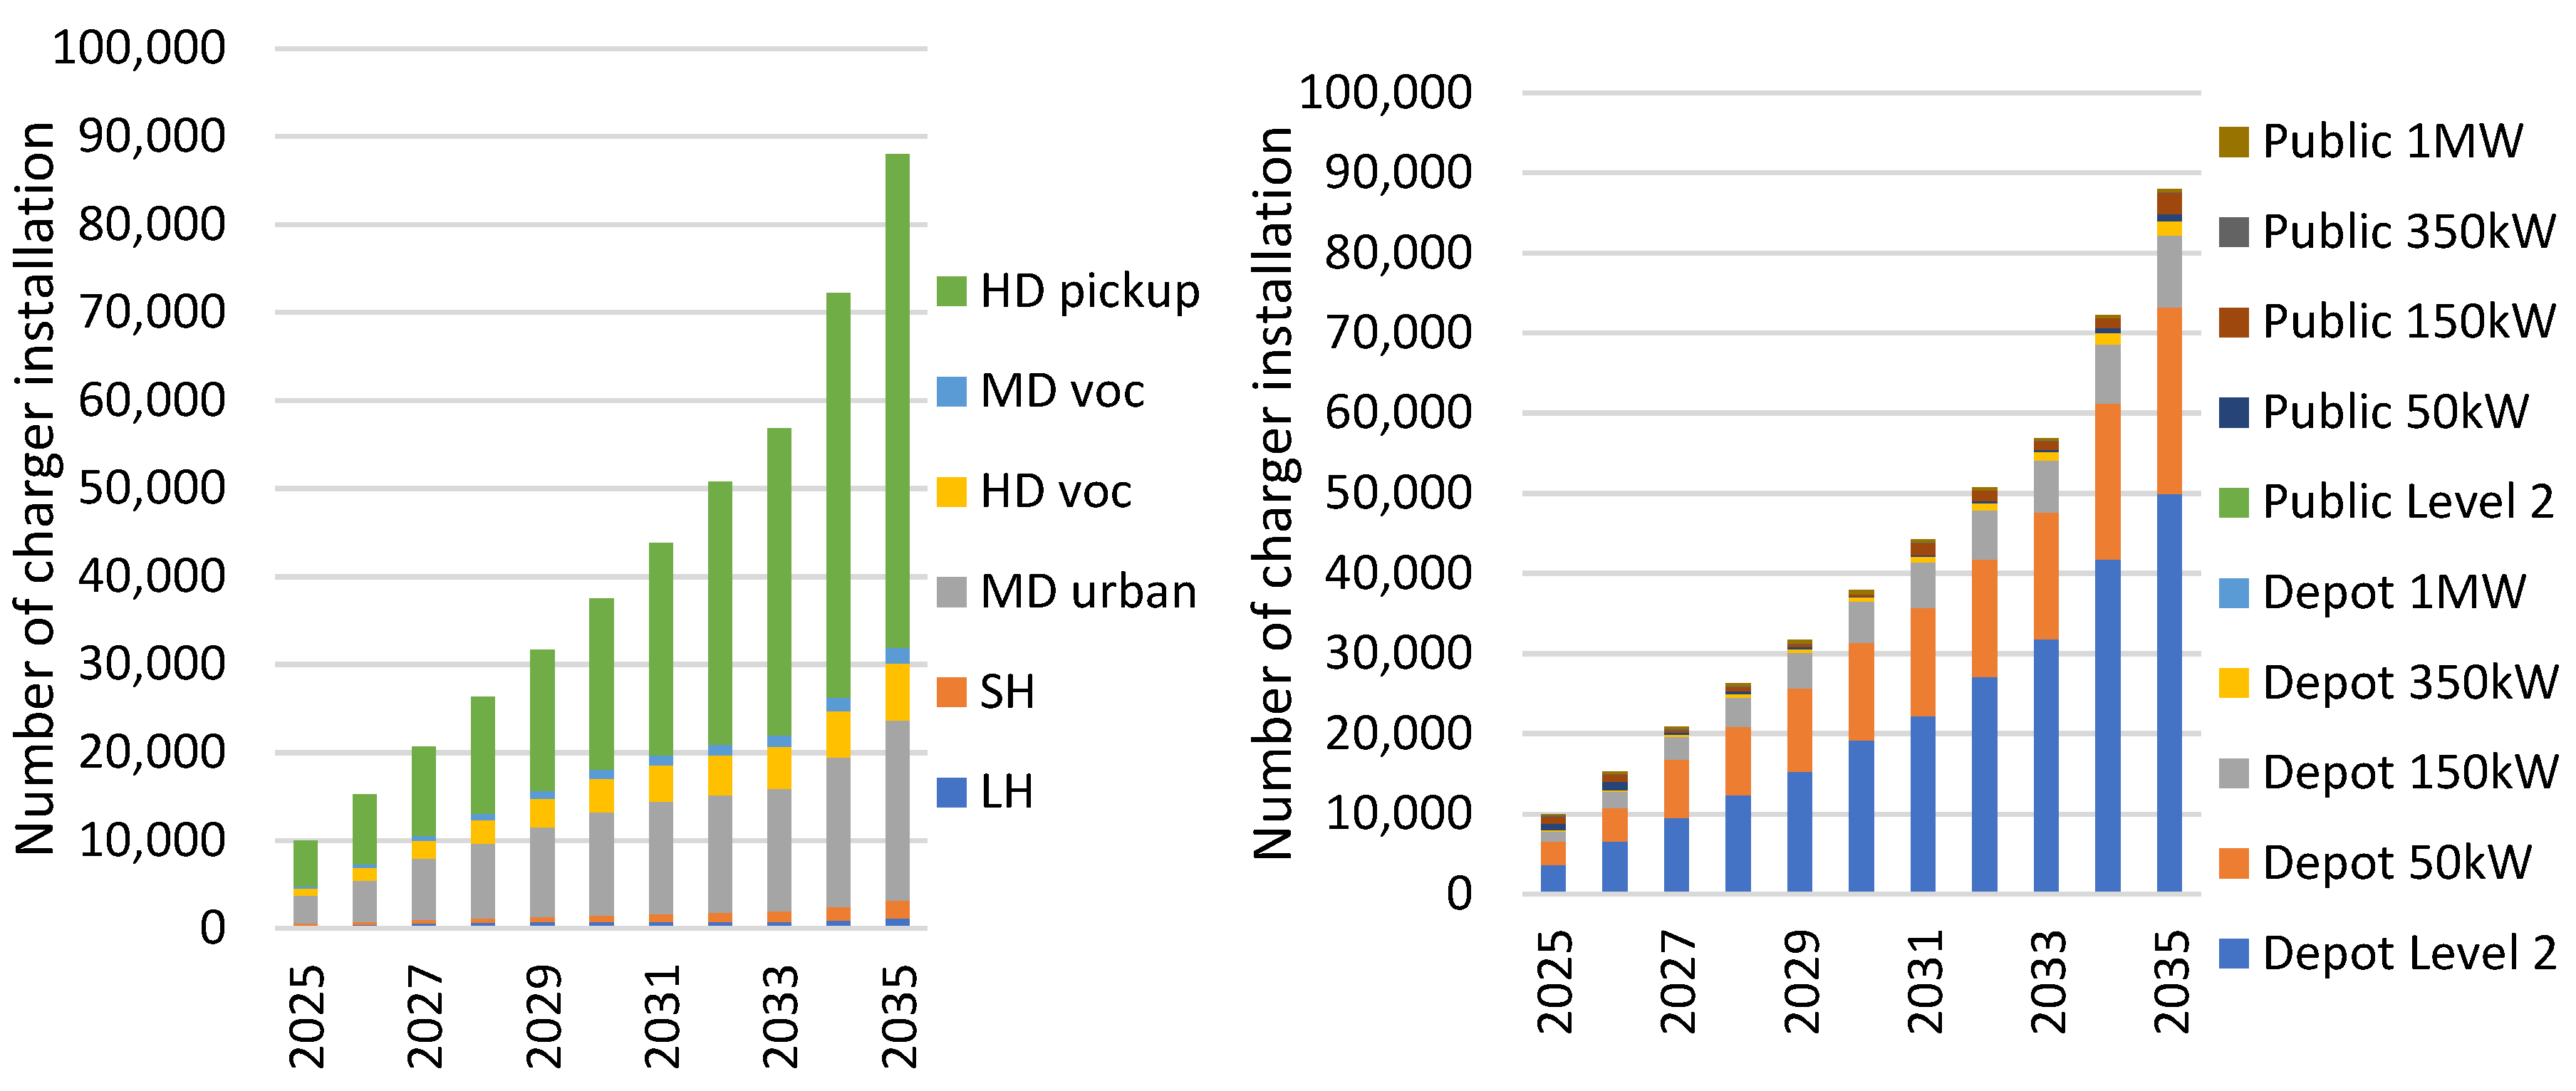
Figure 5.
The number of chargers needed on the road for M/HD trucks in California.
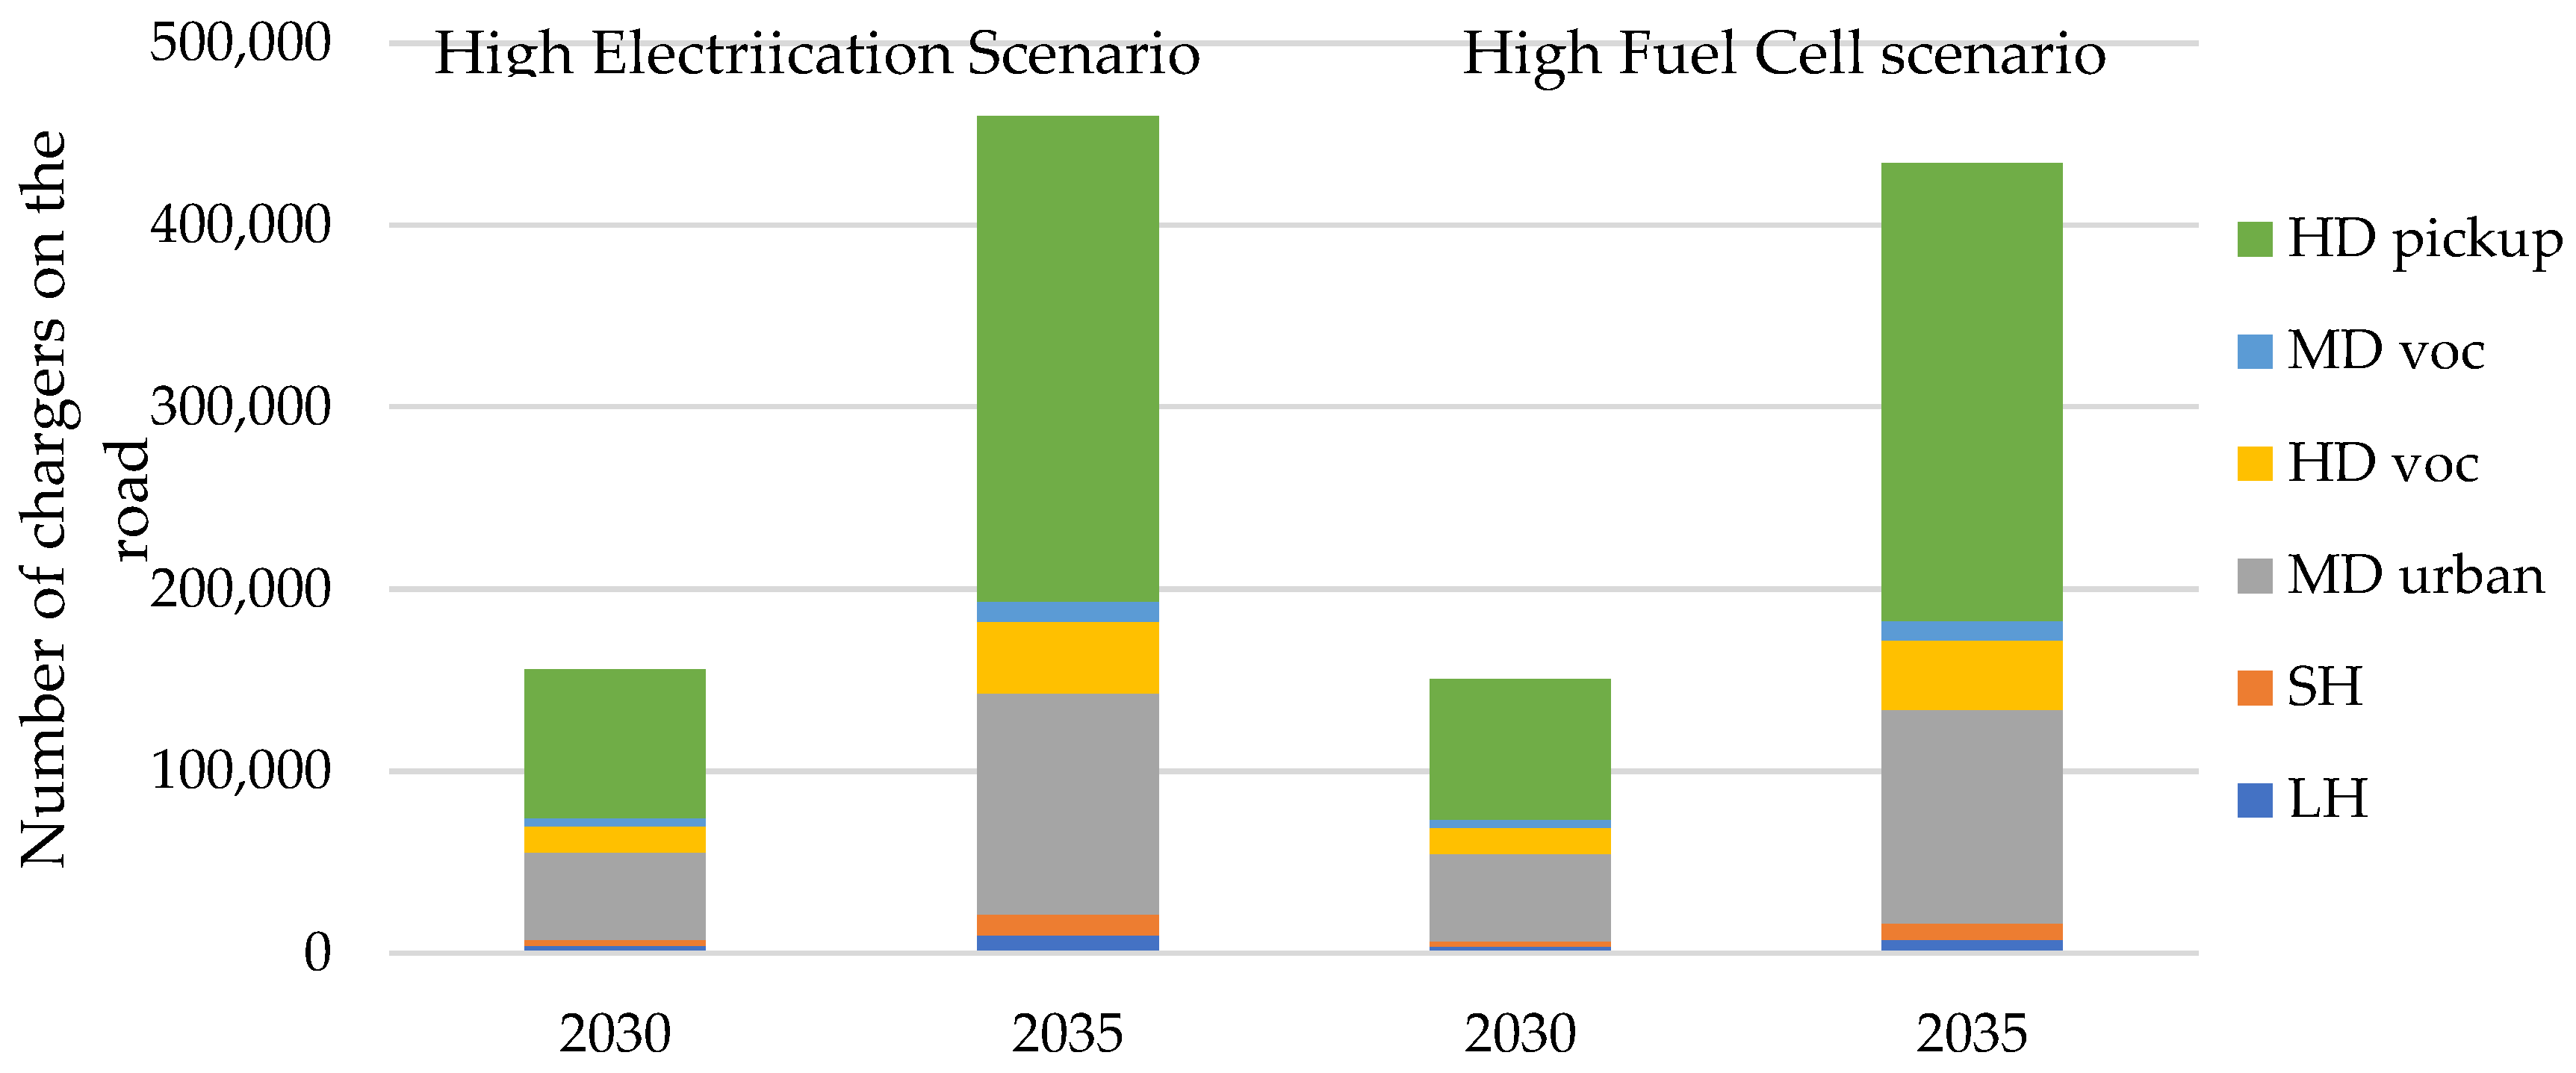
Figure 6.
Cumulative investment needs for M/HD charging in California.
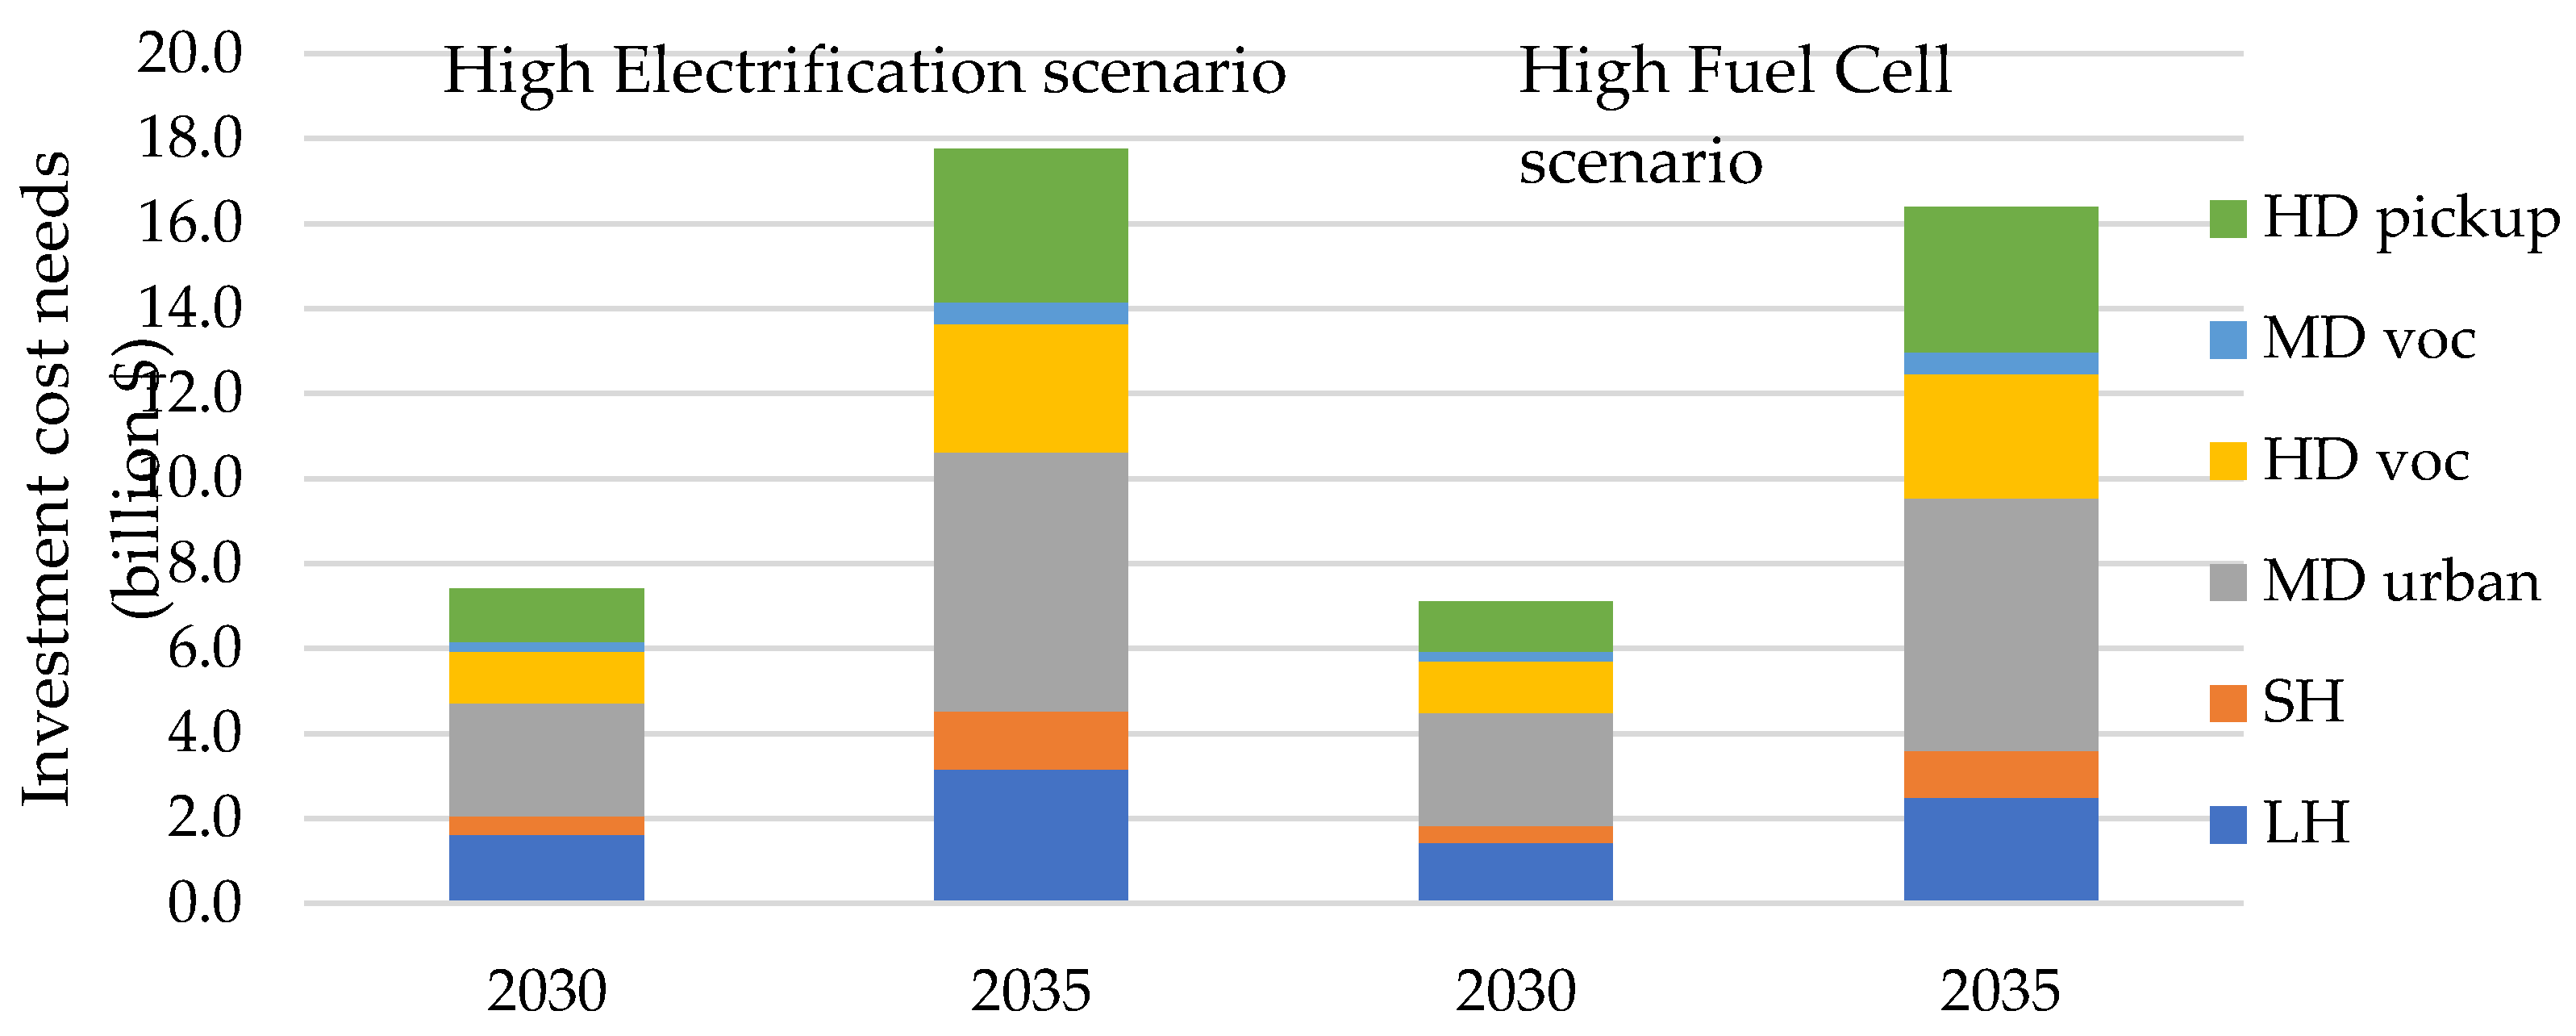
Table 1.
Summary of reviewed studies.
| Document Name | Citation | Type | Geography |
|---|---|---|---|
| U.S. Vehicle Electrification Infrastructure Assessment: Medium- and Heavy-Duty Truck Charging | [10] | Think tank report | U.S. |
| Charging Infrastructure Challenges for the U.S. Electric Vehicle Fleet | [11] | Think tank report | U.S. |
| Charging Solutions for Battery-Electric Trucks | [4] | Think tank report | U.S. |
| Building the electric vehicle charging infrastructure America needs | [12] | Consulting report | U.S. |
| Near-term Infrastructure Deployment to Support Zero-emission Medium- and Heavy-duty Vehicles in the United States | [13] | Think tank report | U.S. |
| Draft 2022 State Strategy for the State Implementation Plan | [14] | Government agency document | CA |
| Workforce Impacts of Achieving Carbon-Neutral Transportation in California | [15] | Consulting report | CA |
| SB 671 Clean Freight Corridor Efficiency Assessment | [16] | Government agency document | Priority corridors in CA and CA |
| Assembly Bill 2127 Electric Vehicle Charging Infrastructure Second Assessment Staff Draft Report | [17] | Government agency document | CA |
Table 2.
Assumption of M/HD battery electric truck stock, estimated charging needs, and observed charger-to-vehicle.
Table 2.
Assumption of M/HD battery electric truck stock, estimated charging needs, and observed charger-to-vehicle.
| Citation | Geography | M/HD BEV Stock in 2030 | Estimated Number of Chargers Needed by 2030 | Share of Private/Depot Versus Public/On-Road a | Charger-to-Vehicle Ratio to 2030 | |
|---|---|---|---|---|---|---|
| Private/Depot | Public/On-Road | |||||
| [10] | U.S. | 800,000 | 564,000 ~ 470,000 b ports, and 254,000 ports for home charging. | 53,000 ~ 93,000 350kW-ports or 10,000 ~ 19,000 2MW-ports for long-haul truck; 6,500 ~ 32,000 c ports for other trucks. | 89% ~ 97% versus 3% ~11% | 0.93 ~ 1.15 |
| [11] | U.S. | 2,925,000 | 801,427 ~ 1,602,855 d | NA | 0.27 ~ 0.55 | |
| [4] | U.S. | 4,700,000 by 2040 | 2,093,000 overnight private depot chargers, 69,000 public depot chargers by 2040. | 138,000 fast and ultrafast chargers by 2040. | 94% versus 6% | 0.49 |
| [12] | U.S. | 486,000 | 541,000 chargers | NA | NA | 1.11 |
| [13] | U.S. | 1,100,000 | 580,054 overnight chargers, 7,869 fast chargers, 5,639 ultrafast chargers. | 98% versus 2% | 0.54 | |
| [14] | CA | 112,000 | 70,391 chargers | 9,599 chargers | 88% versus 12% | 0.71 |
| [15] | CA | 146,000 e | 37,357 chargers for Level 2 public charging and 23,955 DCFC chargers. | Not sure f | 0.42 | |
| [16] | CA g | N/A | 152 ~ 392 private stations by 2025 (2566 ~ 7468 stations by 2040), depending on the scenario h | 17 ~ 50 public stations by 2025 (1099 ~ 3648 stations by 2040), depending on the scenario | 89% versus 11% (2025) |
N/A |
| [17] | CA | 155,000 | 109,497 depot chargers | 5,527 public chargers | 95% versus 5% | 0.74 |
Note:
- In this table, the share of private/depot versus public/on-road charging is calculated from a charger-count perspective, except for the one study [16], which reports estimations on a station-count basis.
- Depot charging will reach about 564,000 ports by 2030 in the low-cost scenario and 470,000 ports in the high-cost scenario.
- On-road charging for other trucks by 2030 will be about 6,500 ports in the low-cost scenario and 32,000 ports in the high-cost scenario.
- If daily charging events per charger is 1 and time charging per day is about 3.4 hours, then 1,602,855 chargers will be needed; if daily charging events per charger is 2 and time charging per day is about 6.9 hours, then 801,427 chargers will be needed [11].
- Thereinto, 125,000 will be battery-electric MDVs and 21,000 will be battery-electric HDVs by 2030.
- It is not clarified in the paper about how many DCFC chargers will be public versus private.
- Estimates in the table are at the state level. At the 6-priority-corridors level and by 2030, for accelerated battery electric adoption scenario, public charging will be 380 stations and private charging will be 1344 stations; for balanced adoption scenario, public charging will be 236 stations and private charging will be 843 stations; for accelerated hydrogen fuel cell adoption scenario, public charging will be 116 stations and private charging will be 464 stations.
- Advanced battery electric adoption scenario assumes battery-electric trucks become more cost-effective overtime, with charging infrastructure becoming viable for long-haul trips. Balanced adoption scenario assumes no predominantly used technology across use cases, though BEV continues to be used mostly for MD short and regional trips, FCEV for HD and long-haul. The accelerated hydrogen fuel cell adoption scenario assumes FC trucks become more cost-effective, alongside its charging infrastructure becoming viable for short-haul trips.
Table 3.
Cost segment of chargers for electric M/HD trucks in reviewed studies.
| Citation | Charger Hardware | Labor | Planning | Installation | Electrical Upgrades | Note |
|---|---|---|---|---|---|---|
| [10] | Yes | Yes | Yes | Yes | Yes a | Design, permitting, project management, and other site construction costs are included. It is assumed that EVSE hardware cost reduced by 3% per year for the next 10 years, and no further cost decline after 2030; cost of labor or other materials over time do not decline. |
| [11] | Yes | Yes | Regular maintenance and inspection cost b is not included. | |||
| [4] | Yes | Yes | Yes | Electric utility connection and construction permit are included. Cost for subsidies, inflation and the rising price of materials, or potential electricity grid upgrade due to significant variation in project and location are excluded. It is assumed that investment cost will be reduced by around 2% per year due to learning and scale effect. | ||
| [12] | Yes | Yes | Yes | |||
| [16] | Yes | Yes | Cost for site readiness and construction, design, and permitting are also included. | |||
| [15] | Yes c | Yes d |
Notes:
- Only electrical upgrades that are not covered by utilities are included. For example, the typical make-ready (conduit, panel, switchgear); for DCFC, front-of-meter customer transformers, conductor, utility poles (50% - 100% depending on scenario); for Long-haul truck charging, utility-side upgrades, incl. substation upgrades or new customer substations.
- The Department of Energy estimates that the cost of annual maintenance averages $400 per charger.
- Material cost includes cost for hardware, materials, and transformer.
- Labor cost includes cost for electrician, civil engineering, contractor, mobilization, permitting, taxes, design, and development.
Table 4.
Year-by-year M/HD BEV stock in the California Transportation Transition Model (thousand).
| High Electrification Scenario | ||||||||||||||
|---|---|---|---|---|---|---|---|---|---|---|---|---|---|---|
| LH | SH | MD Urban | HD voc | MD voc | HD pick up | Total BEV | Total FCEV | |||||||
| BEV | FCEV | BEV | FCEV | BEV | FCEV | BEV | FCEV | BEV | FCEV | BEV | FCEV | |||
| 2025 | 1.8 | 0.1 | 0.5 | 0.0 | 7.5 | 0.2 | 1.8 | 0.0 | 0.4 | 0.0 | 12.0 | 0.4 | 24.0 | 0.7 |
| 2026 | 3.3 | 0.3 | 0.9 | 0.1 | 12.9 | 0.4 | 3.2 | 0.0 | 0.9 | 0.0 | 20.3 | 1.2 | 41.5 | 2.1 |
| 2027 | 5.3 | 0.8 | 1.4 | 0.3 | 20.6 | 0.8 | 5.3 | 0.1 | 1.4 | 0.0 | 31.9 | 2.4 | 65.8 | 4.4 |
| 2028 | 7.8 | 1.4 | 2.0 | 0.5 | 30.5 | 1.4 | 7.9 | 0.2 | 2.2 | 0.1 | 46.5 | 4.0 | 96.9 | 7.5 |
| 2029 | 10.8 | 2.3 | 2.7 | 0.7 | 42.7 | 2.0 | 11.1 | 0.3 | 3.1 | 0.1 | 64.2 | 5.9 | 134.6 | 11.4 |
| 2030 | 14.3 | 3.3 | 3.5 | 1.0 | 57.0 | 2.8 | 14.8 | 0.5 | 4.2 | 0.2 | 84.9 | 8.3 | 178.7 | 16.0 |
| 2031 | 18.9 | 4.7 | 4.7 | 1.4 | 72.4 | 3.7 | 19.0 | 0.7 | 5.4 | 0.3 | 110.5 | 12.5 | 230.9 | 23.2 |
| 2032 | 24.8 | 6.4 | 6.2 | 1.8 | 89.0 | 4.7 | 23.6 | 1.0 | 6.6 | 0.4 | 140.7 | 18.6 | 291.0 | 32.9 |
| 2033 | 31.9 | 8.5 | 8.2 | 2.4 | 106.6 | 5.9 | 28.7 | 1.3 | 7.9 | 0.6 | 175.5 | 26.5 | 358.8 | 45.1 |
| 2034 | 40.3 | 11.0 | 10.6 | 3.0 | 125.1 | 7.2 | 34.2 | 1.7 | 9.2 | 0.8 | 214.7 | 36.2 | 434.1 | 59.9 |
| 2035 | 50.0 | 13.9 | 13.4 | 3.7 | 144.5 | 8.7 | 40.1 | 2.1 | 10.5 | 1.0 | 258.1 | 47.7 | 516.7 | 77.0 |
| High Fuel Cell scenario | ||||||||||||||
| LH | SH | MD Urban | HD voc | MD voc | HD pick up | Total BEV | Total FCEV | |||||||
| BEV | FCEV | BEV | FCEV | BEV | FCEV | BEV | FCEV | BEV | FCEV | BEV | FCEV | |||
| 2025 | 1.7 | 0.2 | 0.5 | 0.0 | 7.5 | 0.2 | 1.8 | 0.0 | 0.4 | 0.0 | 12.0 | 0.4 | 23.9 | 0.8 |
| 2026 | 3.0 | 0.7 | 0.8 | 0.2 | 12.1 | 1.2 | 3.2 | 0.1 | 0.8 | 0.1 | 19.4 | 2.2 | 39.2 | 4.4 |
| 2027 | 4.7 | 1.4 | 1.0 | 0.6 | 18.3 | 3.1 | 5.1 | 0.2 | 1.3 | 0.2 | 29.0 | 5.2 | 59.3 | 10.9 |
| 2028 | 6.8 | 2.5 | 1.2 | 1.2 | 25.9 | 6.0 | 7.6 | 0.5 | 1.8 | 0.5 | 40.8 | 9.7 | 84.2 | 20.2 |
| 2029 | 9.3 | 3.8 | 1.5 | 1.9 | 35.0 | 9.7 | 10.6 | 0.8 | 2.5 | 0.7 | 54.8 | 15.4 | 113.7 | 32.3 |
| 2030 | 12.2 | 5.4 | 1.8 | 2.7 | 45.4 | 14.3 | 14.1 | 1.2 | 3.3 | 1.1 | 70.7 | 22.5 | 147.6 | 47.2 |
| 2031 | 16.0 | 7.7 | 2.3 | 3.8 | 56.0 | 20.1 | 18.0 | 1.7 | 4.1 | 1.5 | 89.4 | 33.6 | 185.7 | 68.4 |
| 2032 | 20.6 | 10.6 | 3.1 | 5.0 | 66.6 | 27.2 | 22.3 | 2.3 | 4.9 | 2.1 | 110.5 | 48.7 | 228.1 | 95.8 |
| 2033 | 26.2 | 14.2 | 4.1 | 6.5 | 77.2 | 35.3 | 27.0 | 3.0 | 5.8 | 2.7 | 134.2 | 67.8 | 274.5 | 129.4 |
| 2034 | 32.8 | 18.6 | 5.5 | 8.1 | 87.8 | 44.6 | 32.1 | 3.7 | 6.6 | 3.4 | 160.2 | 90.7 | 324.8 | 169.1 |
| 2035 | 40.2 | 23.6 | 7.1 | 10.0 | 98.2 | 55.0 | 37.6 | 4.6 | 7.4 | 4.2 | 188.5 | 117.3 | 379.0 | 214.7 |
Disclaimer/Publisher’s Note: The statements, opinions and data contained in all publications are solely those of the individual author(s) and contributor(s) and not of MDPI and/or the editor(s). MDPI and/or the editor(s) disclaim responsibility for any injury to people or property resulting from any ideas, methods, instructions or products referred to in the content. |
© 2025 by the authors. Licensee MDPI, Basel, Switzerland. This article is an open access article distributed under the terms and conditions of the Creative Commons Attribution (CC BY) license (http://creativecommons.org/licenses/by/4.0/).
Copyright: This open access article is published under a Creative Commons CC BY 4.0 license, which permit the free download, distribution, and reuse, provided that the author and preprint are cited in any reuse.


