
Submitted:
10 August 2025
Posted:
12 August 2025
You are already at the latest version
Abstract
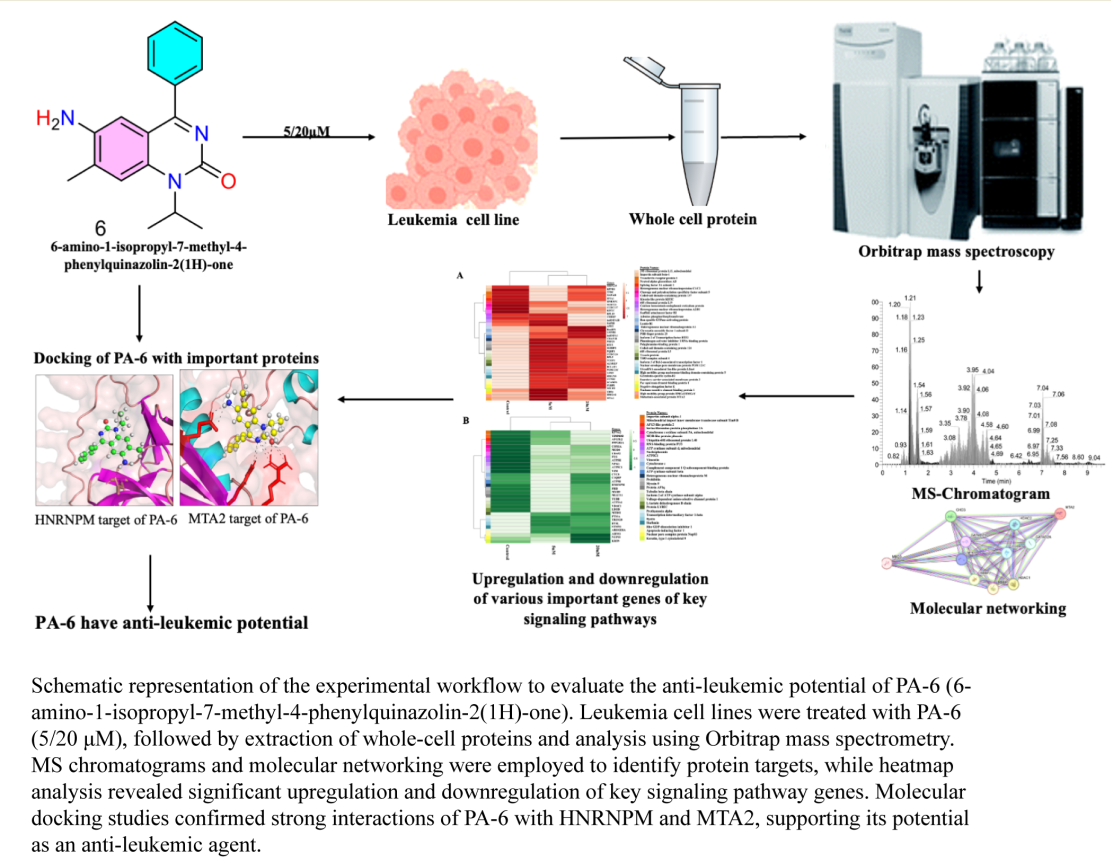
Leukemia is an aggressive hematologic malignancy that necessitates safer therapies due to the adverse effects of existing treatments. In this study, we evaluated the anti-leukemic potential of PA-6, a Proquazone analog (6-amino-1-isopropyl-7-methyl-4-phenylquinazolin-2(1H)-one), using a comprehensive systems biology approach and global proteomic analysis in K562 leukemia cells via Orbitrap mass spectrometry. PA-6 was synthesized and structurally confirmed through NMR and HRMS (ESI-TOF) analysis. Computational profiling, including pharmacokinetic and molecular docking studies, was performed before treating K562 cells with PA-6 (5/20µM, 48-72h). Proteomic analysis involved protein extraction, digestion, peptide purification, and Orbitrap MS/MS-based identification of differentially expressed proteins, followed by functional annotation. PA-6 exhibited favorable drug-likeness properties, such as optimal molecular weight, absorption, and blood-brain barrier permeability, indicating its potential as a therapeutic agent. Molecular docking identified MTA2 and HNRNPM proteins, which regulate RNA metabolism and chromatin remodeling, as potential targets of PA-6. In-vitro validation via cytotoxicity assays revealed dose-dependent suppression of key signaling pathways, leading to a significant reduction in K562 cell proliferation. Proteomic analysis further demonstrated alterations in apoptosis, RNA processing, and cell cycle regulation pathways, highlighting its molecular and cellular impact. Overall, this study provides valuable insights into PA-6's anti-leukemic potential, emphasizing its ability to disrupt crucial cellular and signaling processes in leukemia cells. Its promising pharmacokinetics, cell proliferation inhibition, and low toxicity suggest that PA-6 could serve as a potential therapeutic candidate for leukemia treatment.
Keywords:
cancer
; quinazolinone
; proquazone
; K562 leukaemia cell lines
; cytotoxicity
; proteomics
; differentially expressed proteins (DEP)
Highlights:
- •
- PA-6, a proquazone analog, was synthesized and investigated for its therapeutic efficacy against K562 leukemia cells.
- •
- Orbitrap mass spectrometry–based global proteomics and computational pharmacokinetics were employed to elucidate the PA-6’s mechanism of action.
- •
- PA-6 demonstrated optimal molecular weight, absorption, and blood-brain barrier permeability, underscoring its potential as a therapeutic agent.
- •
- Molecular docking studies identified MTA2 and HNRNPM, a key regulator of RNA metabolism and chromatin remodeling, as potential PA-6 targets.
- •
- In vitro cytotoxicity assays confirmed a dose-dependent inhibition of leukemia cell proliferation, attributed to a significant reduction in K562 cell viability through suppression of key signaling pathways.
- •
- PA-6 treatment induced significant alterations in apoptosis, RNA processing, and cell cycle regulation, further substantiating its anticancer potential.
- •
- These findings establish PA-6 as a promising, low-toxicity, effective anti-leukemic agent, warranting further preclinical investigation.
INTRODUCTION
Nitrogen-containing heterocyclic compounds are crucial in drug development and natural product synthesis due to their therapeutic properties. Studies have shown that over 85% of pharmacological products include heterocyclic compounds, which are valued for their ease of synthesis, modification, and functionalization to fit a variety of molecular frameworks, thus broadening their application in medicinal chemistry [1]. Quinazoline and quinazolinone are particularly noteworthy heterocycles known for their significant pharmacological activity [2,3,4] (Figure 1). These molecules demonstrate a wide range of biological effects, including antibacterial, antiviral, antifungal, anti-HIV, anti-inflammatory, and anti-tuberculosis activities [5,6,7,8]
The importance of quinazoline and quinazolinone rings as pharmacophores is exemplified by their presence in various drugs, such as Prazosin hydrochloride, Gefitinib, Doxazosin mesylate, Terazosin, and Afatinib, as well as in natural compounds like Febrifugine, Halofuginone, Luotonin, and Asperlicin [8,9].
It is also reported that these substances inhibit key tumor initiation and growth enzymes, such as HER-2 tyrosine kinase, DHFR, and EGFR [3]. The Quinazolinone derivative 6-amino-1-isopropyl-7-methyl-4-phenylquinazolin-2(1H)-one (PA-6) is also known as a potent anticancer agent that functions as both an apoptosis inducer and inhibitor [10]. These compounds are known to target intracellular elements, including microtubules and various receptor tyrosine kinases (RTKs), as well as proteins involved in apoptosis and the cell cycle.
In the current study, we hypothesize that a newly synthesized novel anti-cancer drug, Proquazone analog PA-6 (6-amino-1-isopropyl-7-methyl-4-phenylquinazolin-2(1H)-one) is cytotoxic to cancerous cells and selectively shuts down the essential pathways in the cancer cell line. To test the hypothesis, we treated the human chronic myelogenous leukemia (CML) cell line K562 with two distinct concentrations of PA-6 and examined changes in its proteomic profile. Our findings reveal significant alterations in the expression of proteins involved in translational processes, RNA metabolism, antioxidant defenses, and enzymes related to cancer metastasis.
RESULTS
Chemistry of Drug Synthesis
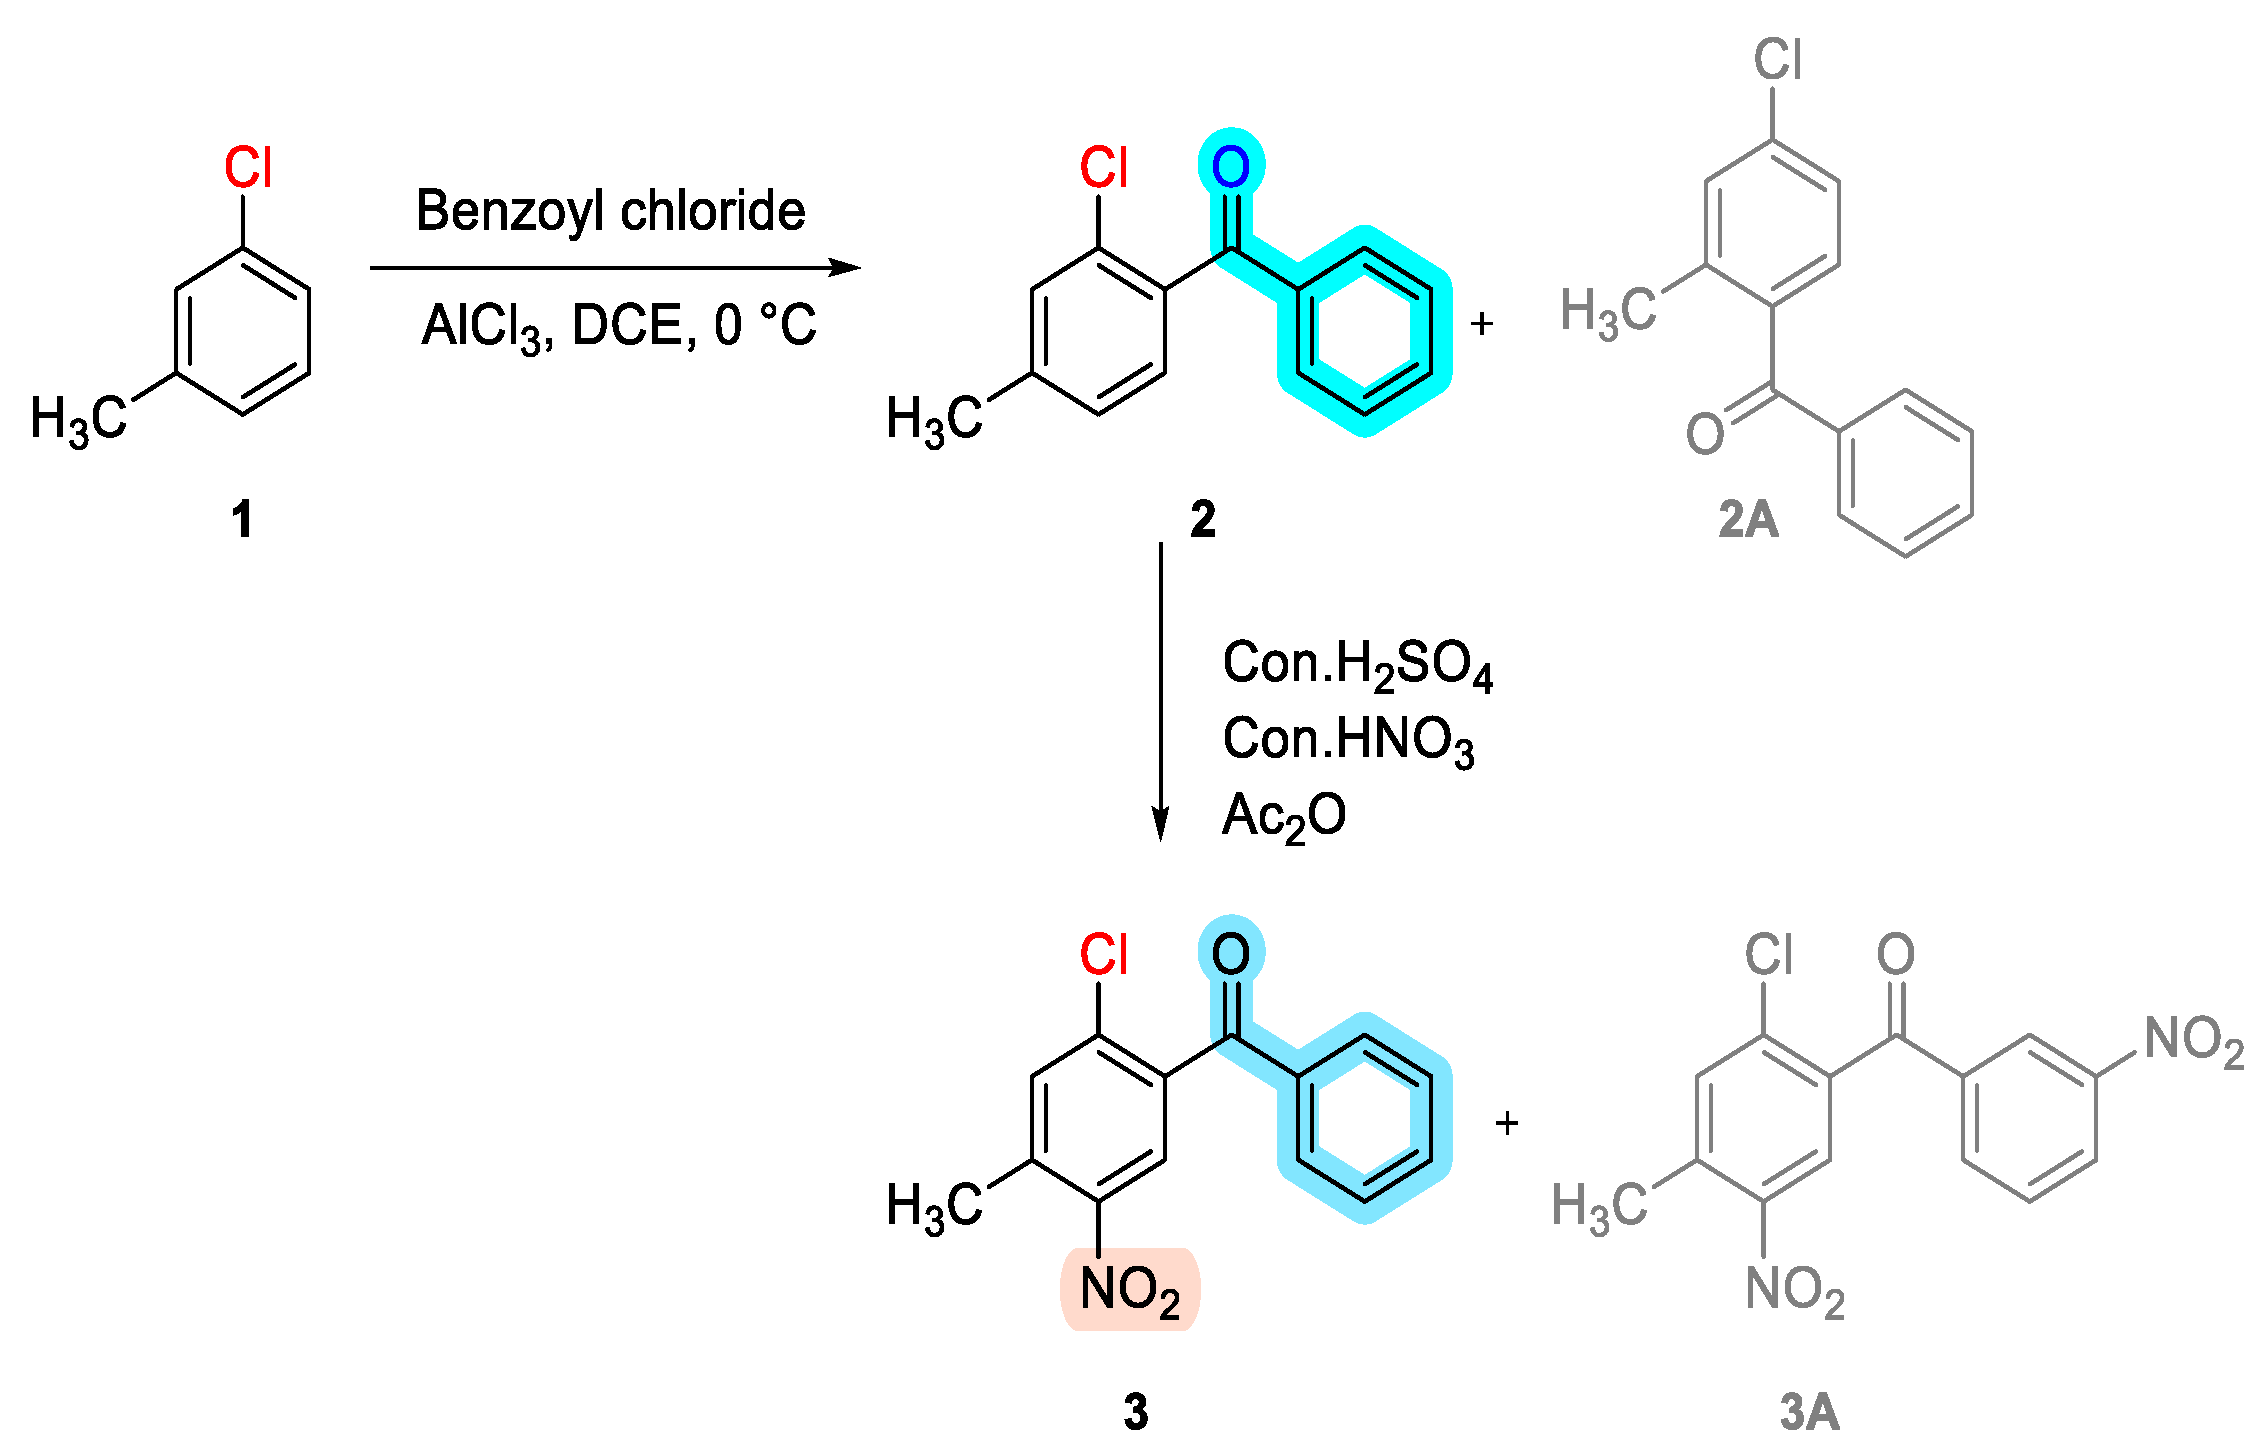
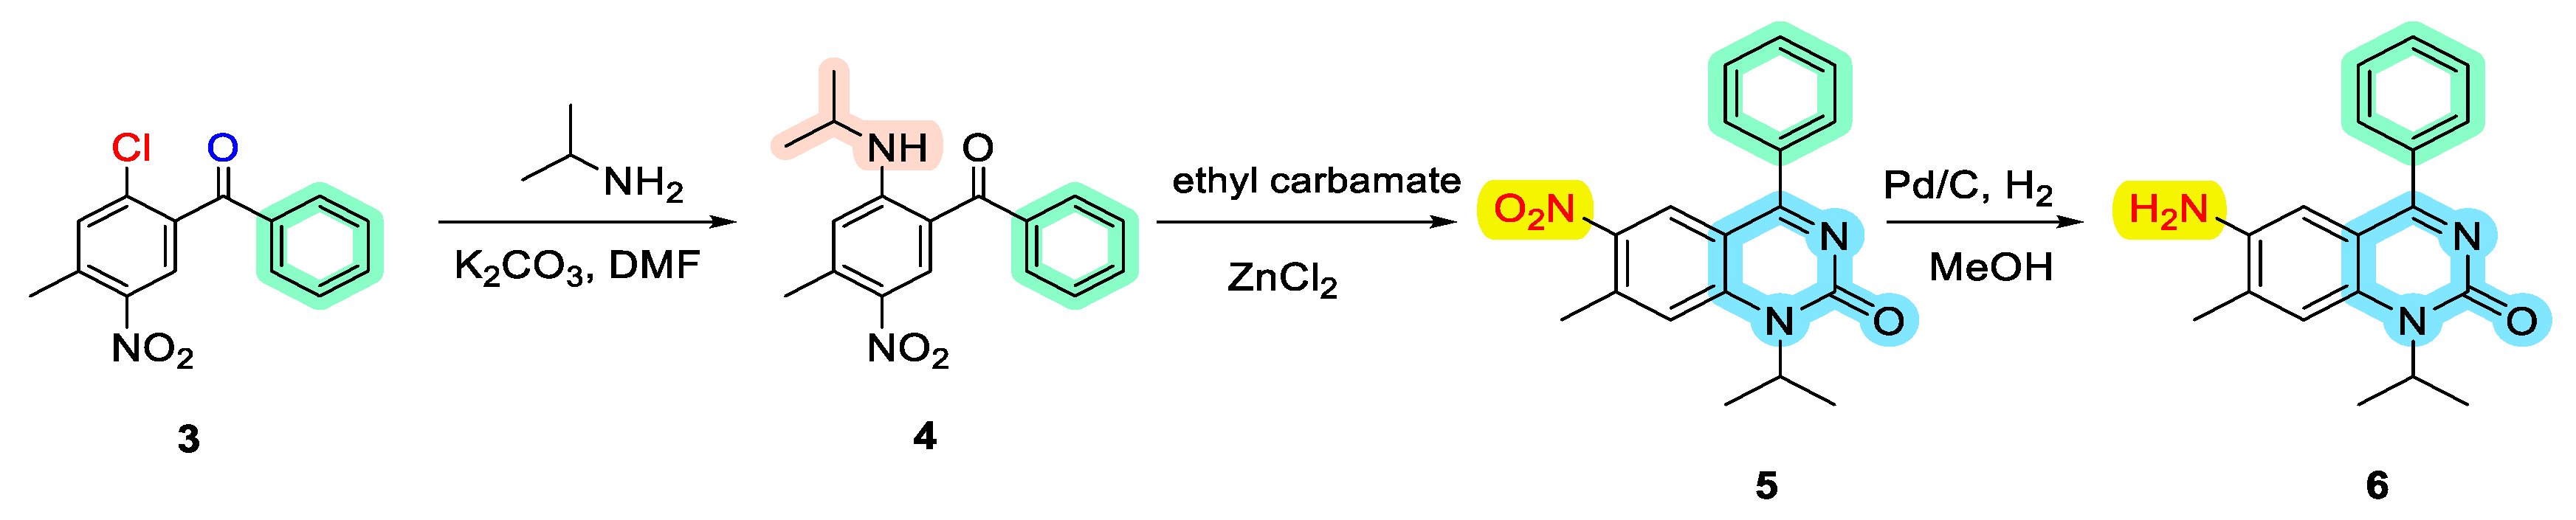
The target compounds were synthesized as described in Scheme 1. Intermediate compounds were obtained by Friedel-Crafts acylation of 1-chloro-3-methylbenzene (compound 1) in the presence of AlCl3. Treating compound 1 with benzoyl chloride resulted in the synthesis of 6-amino-1-isopropyl-7-methyl-4-phenylquinazolin-2(1H)-one. The structures of the synthesized compounds were confirmed through spectroscopic methods, including 1H NMR, 13C NMR, and HRMS (ESI-TOF).
Absorption, Distribution, Metabolism, and Excretion (ADME) Analysis
As per the SwissADME predictions, the molecular weight of PA-6 is ~294 g/mol, and this is well within the range of acceptable drug molecules. This compound has a moderate lipophilicity (LogP) value of 2.5, which suggests that the compound has a good hydrophilic–lipophilic profile compatible with aqueous solubility and membrane permeability. The topological polar surface area (TPSA) value is 70Ų, which correlates with efficient absorption and good bioavailability. Furthermore, this PA-6 is predicted to have an absorption rate by the gastrointestinal tract, and limited blood–brain barrier penetration, which reduces the likelihood of side effects on the central nervous system. This analysis showed the good potential of PA-6 in inhibiting cytochrome P450 isoenzymes (such as CYP2C9 and CYP2C19), but further lab-based functional studies are required to fully evaluate its metabolic stability and possible drug-drug interactions (Table 1).
Docking Analysis
The molecular docking findings showed that PA-6 favourably binds to both HNRNPM and MTA2. In case of HNRNPM, the best docked pose had a score of -7.296, significant van der Waals contribution of -14.40 kcal/mol, and the electrostatic energy of –7.671 kcal/mol. The docking analysis showed that Glu102, Arg70, and Arg72 residues are located in RNA recognition motifs of HNRNPM, which suggests that PA-6 binding may disrupt the protein’s RNA-binding function. In the case of MTA2, PA-6 showed the docking score of –7.5, with a notable van der Waals energy of –16.377 kcal/mol and an electrostatic energy contribution of –5.25 kcal/mol. In this protein molecule, the amino residues like Asp10, lying within the BAH domain, have emerged as a critical point of contact with PA-6 (Figure 2, Table 2). These molecular binding profiles show that PA-6 can interfere with the functions of both HNRNPM and MTA2 proteins, which are involved in RNA metabolism and chromatin remodelling activities.
Proquazone Analog (PA-6) Suppresses the Proliferation of K562 Cancer Cell Lines
The current study aimed to evaluate the efficacy of PA-6, a selective COX-2 inhibitor, on leukemia cancer lines using the MTT proliferation assay. A dose-dependent decline in K562 cell proliferation was observed 48 hours after PA-6 treatment, with the maximum decline at 45 mM, resulting in a 49.6% reduction in cell proliferation, as shown in Figure 3. At 100 mM, no further decrease was observed, and the percentage of cell proliferation was 76%. Since the maximum inhibition was observed at 45 µM, further experiments were performed under the 5 µM and 20 µM conditions for the proteomic profile.
Proteome Profiling of K562 Cell Lines
To investigate proteomic changes resulting from the enhanced cytotoxicity of our novel synthesized drug PA-6 in K562 cells, proteomic analysis was conducted following a 48-hour treatment period. This analysis aimed to compare protein expression levels between two lower concentrations of the drug (5 µM and 20 µM) and the control condition. A label-free quantitative approach was employed to characterize the total proteome profile, encompassing a total of 1076 proteins, as detailed in Table S1. Through rigorous analysis of the quantitative mass spectrometric data, significant fold changes between quinazolin-treated cells at two concentrations (5 µM and 20 µM) and untreated cells were calculated for all 1076 identified proteins. Applying a log2 fold change threshold of ±1.0, we identified 963 proteins that exhibited significant differences in abundance between the control and treatment conditions (1 and 2), which were considered differentially expressed proteins (DEPs).
Differentially Expressed Proteins Between Conditions
Among the 963 differentially expressed proteins (DEPs), 234 were upregulated and 729 were downregulated when comparing control and treatment 1 (5 µM drug administration), Table S2. Similarly, comparing control and treatment 2 (20 µM drug administration), 197 proteins were upregulated and 766 were downregulated, as summarized in Table S3. To ensure robustness in the identified proteins, only those with ≥5 peptide spectral matches (PSM) were included in all subsequent functional analyses. Accordingly, 91 proteins were upregulated and 312 were downregulated in condition 1 (control vs treatment 1), while 102 proteins were upregulated and 32 were downregulated in condition 2 (control vs treatment 2).
Homology Among Distinct Proteins
A comparative analysis between Treatment 1 versus Control and Treatment 2 versus Control identified specific upregulated and downregulated proteins (Tables S1 and S2). Enrichment and cluster analyses were conducted using String DB v11.0 to identify key proteins. A total of 63 proteins were specifically upregulated in Treatment 1, while 83 proteins were upregulated in Treatment 2. Further analysis revealed that 283 proteins were downregulated in Treatment 1, whereas only 4 proteins were downregulated in Treatment 2 (Table 3).
In Treatment 1, upregulated proteins included cytochrome, ribosomal, apoptotic, and prohibiting proteins, which were organized into 5 clusters with an average clustering coefficient of 0.561. Treatment 2 showed upregulation of ribonucleoproteins, histones, keratins, mitochondrial ribosomal proteins, spliceosome proteins, and cell cycle proteins, organized into 5 clusters with an average clustering coefficient of 0.527. Additionally, Treatment 1 exhibited upregulation of proteins involved in RNA metabolism, ribosomal proteins, histones, mitochondrial ribosomal proteins, dead box helicases, nucleoporins, keratins, and ubiquinones, organized into 8 clusters with an average clustering coefficient of 0.508. In contrast, Treatment 2 showed upregulation of only 4 proteins: GANAB (Glucosidase alpha II subunit), TFRC (Transferrin receptor), SF3A1 (Splicing factor 3A1), and ALB (Albumin), which formed a single cluster with an average clustering coefficient of 0.500. The comparative analysis of upregulated proteins revealed that in Treatment 2, proteins involved in protein metabolism (MRPL15, MRPL16, RPL19, RPL26, RPL31, RPL4, RPS10, RPS15A, RPS16, RPS26, RPS9, SERBP1), RNA metabolism (HNRNPM, KPNA2, HNRNPA3, HNRNPC, HNRNPF, HNRNPU), chaperones (HSP90AB1, SERPINH1, SURF6), cell cycle regulation (CCNB2, PPP2R1A), cytoskeletal proteins (KRT9, KRT8, STMN1, PTMA, TUBB), and membrane trafficking proteins (CLTA, RANBP1, CCDC137) were upregulated (Table 3). In contrast, Treatment 1 showed enrichment in subunits of the ATP synthase complex (ATP5A1, ATP5B, ATP5H), carbon metabolism enzymes (MDH2, LDHB, DLAT, SHMT2), and ribosomal proteins (RPL6, RPL35A, RPL23) (Table 3). Heatmap analysis of protein abundance (Figure 4) further illustrates the differential upregulation and downregulation in both treatments.
Among the downregulated proteins in both conditions, a notable decrease was observed in proteins involved in DNA metabolism (APRT-Adenine Phosphoribosyl transferase, CHAF1B-Chromatin Assembly Factor 1B, TCOF1-Treacle Protein), RNA metabolism (BCLAF1- Isoform 3 of Bcl-2-associated transcription factor 1, CCDC124-Coiled-Coil Domain Containing 124, BTF3-Beta-transducin repeat-containing protein, NUDT21-Nudix Hydrolase 21, NELFE-Negative Elongation Factor E, LSM4-LSM Complex Subunit 4, ALYREF-ALY RNA Export Factor, SERBP1-Serine and Arginine Rich Splicing Factor 1, SF3B1 - Splicing factor 3B subunit 1, SF3B2 - Splicing factor 3B subunit 2) and transporters (POM121C- Pore Membrane Protein 121C, SCAMP3-Secretory Carrier Membrane Protein 3, KPNB1- Importin subunit beta-1, TFRC-Transferrin receptor protein 1, NUP98-Nucleoporin 98) crucial for cell proliferation and stability. Treatment 2 exhibited a more pronounced decrease in four proteins (ALB, GANAB, SF3A1, TFRC) essential for cellular machinery compared to treatment 1 (Fig 4).
Functional Characterization of Proteins
To functionally characterize the proteome profile of PA-6-treated K562 cells, we performed an Over-Representation Analysis (ORA) of Gene Ontology (GO) annotations across three categories: Biological Process, Molecular Function, and Cellular Compartment. At a 5 µM dose of PA-6, we observed: i) A significant increase in signaling activities, with 42% of upregulated proteins versus 13% of downregulated proteins in the “mRNA metabolic process” (Biological Process) (Figure 5). ii) Activation of cellular machinery, with 60% of upregulated proteins versus 22% of downregulated proteins in “RNA binding” (Molecular Function), and 78% of upregulated proteins versus 8% of downregulated proteins in the “ribonucleoprotein complex” (Cellular Compartment) (Figure 5). These results suggest PA-6 treatment promotes RNA-related processes and cellular machinery activation.
At 20 µM PA-6 treatment in K562 cells, we observed notable changes: i) Decreased signaling activities, with 11% of upregulated proteins versus 30% of downregulated proteins in the “SRP-dependent co-translational protein targeting to membrane” (Biological Process). ii) Reduced transcriptional and translational processes, with 6% of upregulated proteins versus 30% of downregulated proteins in “RNA binding” (Molecular Function), and 15% of upregulated proteins versus 57% of downregulated proteins in the “ribosome” (Cellular Compartment) (Figure 6). iii) Alterations in cellular metabolism, with downregulation of proteins involved in cellular structure and organelle assembly, reflecting distinct patterns of DEPs in the Cellular Component category (Figure 6).
Pathway Analysis
Pathway analysis of key downregulated genes reveals significant associations with various cancers, primarily through their roles in RNA processing, transcription regulation, and tumor progression (Table S4). According to analysis BCLAF1 is implicated in small cell lung carcinoma and non-Hodgkin's lymphoma, where it modulates transcriptional regulation. RANBP1, involved in RNA export, is associated with breast and kidney cancers, influencing cellular survival pathways. SERBP1 regulates mRNA metabolism and is linked to gastric cancer, underscoring the importance of RNA processing in oncogenesis (Table S4). YBX1, a critical regulator of transcription and mRNA splicing, is dysregulated in breast and colorectal cancers, driving tumorigenic processes. LSM4 and APRT, involved in RNA decay and purine metabolism, are associated with renal carcinoma, highlighting their roles in cellular homeostasis and tumor progression (Table S4). CHERP and CHAF1B contribute to RNA processing and chromatin assembly, with CHAF1B overexpression being particularly relevant in liver carcinoma, suggesting its role in chromatin remodeling-driven tumorigenesis. C1QBP, implicated in immune regulation, promotes immune evasion in cancers such as breast cancer and leukemia, facilitating tumor survival [11]. Cyclin B2 (CCNB2) and KIF2C, key regulators of the cell cycle, are overexpressed in liver, ovarian, and breast cancers, promoting uncontrolled cell proliferation and chromosomal instability. FUBP1, along with HNRNPA1 and HNRNPA2B1, which are essential for RNA splicing, contributes to tumor progression in gliomas and lung adenocarcinomas, where splicing dysregulation drives oncogenesis. HMGA1 and HMGN5, chromatin remodeling factors, are overexpressed in a variety of cancers, driving tumorigenesis through alterations in gene expression (Table S4). KPNB1 and LMNB2, involved in nuclear protein import and chromosomal stability, are dysregulated in ovarian, breast, and colorectal cancers, contributing to chromosomal instability and malignant transformation. Additionally, genes like MTA2, MRPL15, and NUDT21, which regulate critical processes such as protein synthesis, mitochondrial function, and RNA processing, are frequently disrupted in cancer, promoting tumorigenesis through impaired cellular function (Table S4).
The upregulated selected genes play key roles in various diseases, particularly cancers, by regulating vital cellular processes like apoptosis, RNA metabolism, signal transduction, and mitochondrial function (Table S4). For example, AFG3L2 and FUS are linked to neurodegenerative diseases and cancers, while ARHGDIA and C1QBP contribute to cancer metastasis and immune evasion. AIFM1 and COX5A are involved in mitochondrial function and apoptosis, with implications for metabolic disorders and cancer [12]. HNRNPM and KPNA2 are essential for RNA processing and DNA repair, influencing tumorigenesis. Oncogenes like KRT9, LDHB, and MTDH drive cancer progression through cellular differentiation and metabolic reprogramming (Table S4). Additionally, TRIM28 regulates transcription and protein modification in atherosclerosis and cancer, while TUBB and UBA52 are involved in cell division, immune responses, and cancer metastasis. Vimentin (VIM) is critical for structural integrity and metastasis, while VDAC1 controls mitochondrial function and metabolism, linking it to diseases like diabetic nephropathy and epilepsy (Table S4). Collectively, these genes highlight the pivotal roles of RNA metabolism, transcriptional regulation, and chromatin dynamics in cancer progression, positioning them as potential biomarkers and therapeutic targets for personalized cancer treatment strategies.
DISCUSSION
In this study, we investigated the effects of the Proquazone analog PA-6 (6-amino-1-isopropyl-7-methyl-4-phenylquinazolin-2(1H)-one) on K562 leukemia cells. Treatment with 20 μM PA-6 for 48 hours resulted in a marked reduction in cell growth and a progressive increase in cell death, from 49.6% at 24 hours to 79.5% at 48 hours. Given the potent cytotoxicity of PA-6, we employed a global proteomic approach to analyze the molecular changes induced by this synthetic quinazoline derivative. Our proteomic profiling revealed significant downregulation of key proteins associated with critical cellular processes such as signaling pathways, transcription, translation, and cellular localization, especially at the higher 20 μM concentration. These findings suggest that PA-6 selectively impacts multiple cellular networks, providing valuable insights into its molecular mechanisms and potential as an anti-cancer agent.
To further interpret the therapeutic potential of PA-6, we performed in silico investigations to assess the drug likeness and explore its potential molecular targets. This systems biology approach provides an early understanding about PA-6’s pharmacokinetic properties and also its molecular interaction potential with key cancer associated proteins, giving insight into the mechanistic basis for its observed cytotoxic effects in leukaemia cells. ADME analysis of PA-6 predicted favorable pharmacokinetic properties like optimal molecular weight, LogP, and TPSA, indicating good oral bioavailability and intestinal absorption. These properties are important for optimizing pharmacokinetics and minimizing potential off target drug reactions [13].
Based on the encouraging ADME predictions, we determined the PA-6’s potential protein targets (HNRNPM and MTA2) within K562 proteomic dataset. Docking simulations have demonstrated strong molecular binding interactions between PA-6 and these targets. In particular, PA-6 exhibited key interactions with Glu102, Arg70, and Arg72 in HNRNPM, and Asp10 in the BAH domain of MTA2, suggesting that PA-6 may interfere with RNA-binding functions and chromatin-modifying activities, thereby contributing to its anti-leukemic effects. Overall, these computational findings support further in vitro and in vivo investigations of PA-6 as a novel leukemia therapy. MTA2 (Metastasis-Associated Protein 2) is a molecular regulatory protein that is involved in chromatin remodeling, mesenchymal transition, metastasis, and chemoresistance in cancers like breast, lung, and gastric cancer [14]. MTA2 inhibitors, along with RNAi and small molecule inhibitors, have the potential to reduce the tumor growth that enhances chemosensitivity [15]. The Heterogeneous Nuclear Ribonucleoprotein M2 (HNRNPM) acts as an RNA splicing regulator. Hence, this protein promotes tumor progression and metastasis, making it an ideal candidate for targeted therapies [16]. For example, combining PI3K/AKT/mTOR axis inhibition with HNRNPM inhibitors has shown the potential in cancer treatment preclinical studies [17].
Natural quinazoline and quinazolinone derivatives are known to modulate essential apoptotic pathways, including activation of caspase-9 and downregulation of the anti-apoptotic protein Bcl-2, while enhancing the pro-apoptotic Bax/Bcl-2 ratio in cancer cells such as MCF-7 [18,19]. Our proteomic analysis similarly identified a downregulation of BCLAF1 (Bcl-2-associated transcription factor 1) isoform 3 at the 5 μM dose, with upregulation at the 20 μM dose, suggesting a potential mechanism of drug resistance at higher concentrations. This finding implies that targeting apoptotic regulators could enhance therapeutic efficacy by overcoming chemoresistance in leukemia cells. Cancer progression is driven by both genetic and epigenetic alterations that lead to uncontrolled cell proliferation and evasion of growth-regulating mechanisms. These alterations affect key regulatory proteins, including nuclear factors like Myc, NF-κB, EZH2, and cyclins, as well as signaling pathways such as Wnt, Hedgehog, Hippo, Notch, PI3K-Akt, and Ras-ERK [20,21].
Quinazoline derivatives, such as MJ-33, have demonstrated anticancer properties by inducing apoptosis through the AKT/mTOR pathway and mitochondrial-dependent mechanisms in 5FU-resistant colorectal cancer cells. Additionally, MJ-33 reduced levels of MAPK, AKT, AP-1, and NF-κB, inhibiting matrix metalloproteinases (MMPs) in prostate cancer cells [22,23]. Other quinazoline derivatives like HMJ-30 and MJ-29 target IGF-1R in osteosarcoma, disrupting key signaling pathways involved in metastasis and invasion, including PI3K/AKT, Ras/MAPK, and NF-κB, while modulating MMPs and tissue inhibitors of metalloproteinases (TIMPs) [24,25]
In this study, 5 μM PA-6 treatment led to downregulation of critical proteins involved in cancer-related signaling, including MTA2, CCNB2, YBX1, and HMGA1, which are integral to key pathways such as MAPK/ERK, NF-κB, and PI3K/AKT. These pathways are involved in cell proliferation, survival, and metastasis, and their downregulation suggests that PA-6 disrupts these pathways, positioning it as a promising therapeutic candidate in cancer treatment. Notably, MTA2, CCNB2, YBX1, and HMGA1 are highly expressed in several cancers, including breast, lung, and prostate cancers [26,27,28,29,30,31,32]. The regulation of cell cycle checkpoints is emerging as a critical therapeutic target in leukemia. DNA integrity can be compromised by external agents, such as ionizing radiation and genotoxic compounds, as well as endogenous stressors, including reactive oxygen species (ROS), which induce DNA damage [33].
This damage often leads to strand breaks and adduct formation due to an imbalance between ROS production and antioxidant defenses. Kinases such as PIKK family members, ATM, and DNA-dependent protein kinase (DNA-PK) are essential in the DNA damage response (DDR), and inhibiting these kinases can disrupt DNA repair, promoting cancer cell proliferation. In our study, we observed downregulation of key cell cycle genes such as CCNB2 (Cyclin B2), KIF2C (Kinesin Family Member 2C), and RANBP1 (RAN Binding Protein 1), which play crucial roles in G2/M transition, mitotic spindle assembly, and mitotic progression [34]. The downregulation of these genes is consistent with p53-mediated cell cycle arrest [35,36,37,38]. Furthermore, the overexpression of TRIM28 (a regulator of p53-mediated cell cycle arrest) in our analysis further supports the notion that PA-6 induces cell cycle arrest, potentially through p53 activation [39]. Additionally, the nonsense-mediated mRNA decay (NMD) pathway plays a critical role in maintaining the integrity of cellular transcripts, preventing the synthesis of truncated or aberrant proteins. Disruptions in the NMD pathway, as well as other RNA processing mechanisms, can lead to significant cellular dysfunction and contribute to tumorigenesis [40]. These disruptions often involve altered splicing events, differential transcriptional regulation, nonsense-mediated degradation, and aberrant post-translational modifications [41]. In this study, several RNA-binding proteins (RBPs) implicated in transcription, splicing, translation, and mRNA stability were identified as key players in these processes. RBPs such as SF3B1, FUBP1, MTA2, HMGA1, PQBP1, MRPL15, RPL19, RPL5, and GANAB were significantly altered in response to PA-6 treatment, underscoring their involvement in critical cellular processes like cell cycle regulation, ribosome biogenesis, mRNA processing, and protein synthesis. These proteins are frequently dysregulated in cancer cells to support uncontrolled proliferation, metastasis, and resistance to cell death.
This showed that Proquazone analog PA-6 might be disrupting key cancer-related pathways, inducing significant changes in apoptosis, cell cycle regulation, and transcriptional regulation in K562 leukemia cells. The findings highlight the therapeutic potential of PA-6 as an anti-cancer agent, particularly for overcoming chemoresistance and targeting tumor-specific vulnerabilities. Further studies are warranted to explore the full scope of its molecular effects and evaluate its in vivo efficacy as a novel treatment for leukemia and potentially other cancers.
MATERIALS AND METHODS
The facile synthesis of Proquazone analog (PA-6), 6-amino-1-isopropyl-7-methyl-4-phenylquinazolin-2(1H)-one, begins with 1-chloro-3-methylbenzene. This compound (1) reacts with benzoyl chloride in the presence of aluminum chloride (AlCl3) via a Friedel-Crafts acylation protocol, yielding compounds 2 and 2A in a 2:1 ratio. Compound 2 is then reacted with acetic anhydride (Ac2O), sulfuric acid (H2SO4), and nitric acid (HNO3) to produce nitro derivatives, compounds 3 and 3A.
Scheme I.
chloro-4-methyl-5-nitrophenyl)(phenyl)methanone (3).
Compound 3 was coupled with isopropyl amine using the Ullmann protocol to obtain compound 4. Subsequently, compound 4 was treated with ethyl carbamate and ZnCl2 in a sealed tube at high temperature, resulting in the cyclized compound 5. The nitro group in compound 5 was then reduced in the presence of Pd/C under hydrogen pressure, yielding 6-amino-1-isopropyl-7-methyl-4-phenylquinazolin-2(1H)-one, compound PA-6.
Scheme II.
amino-1-isopropyl-7methyl-4-phenylquinazolin-2(1H)-one (6).
Scheme III.
Synthesis of 6-amino-1-isopropyl-7-methyl-4-phenylquinazolin-2(1H)-one.
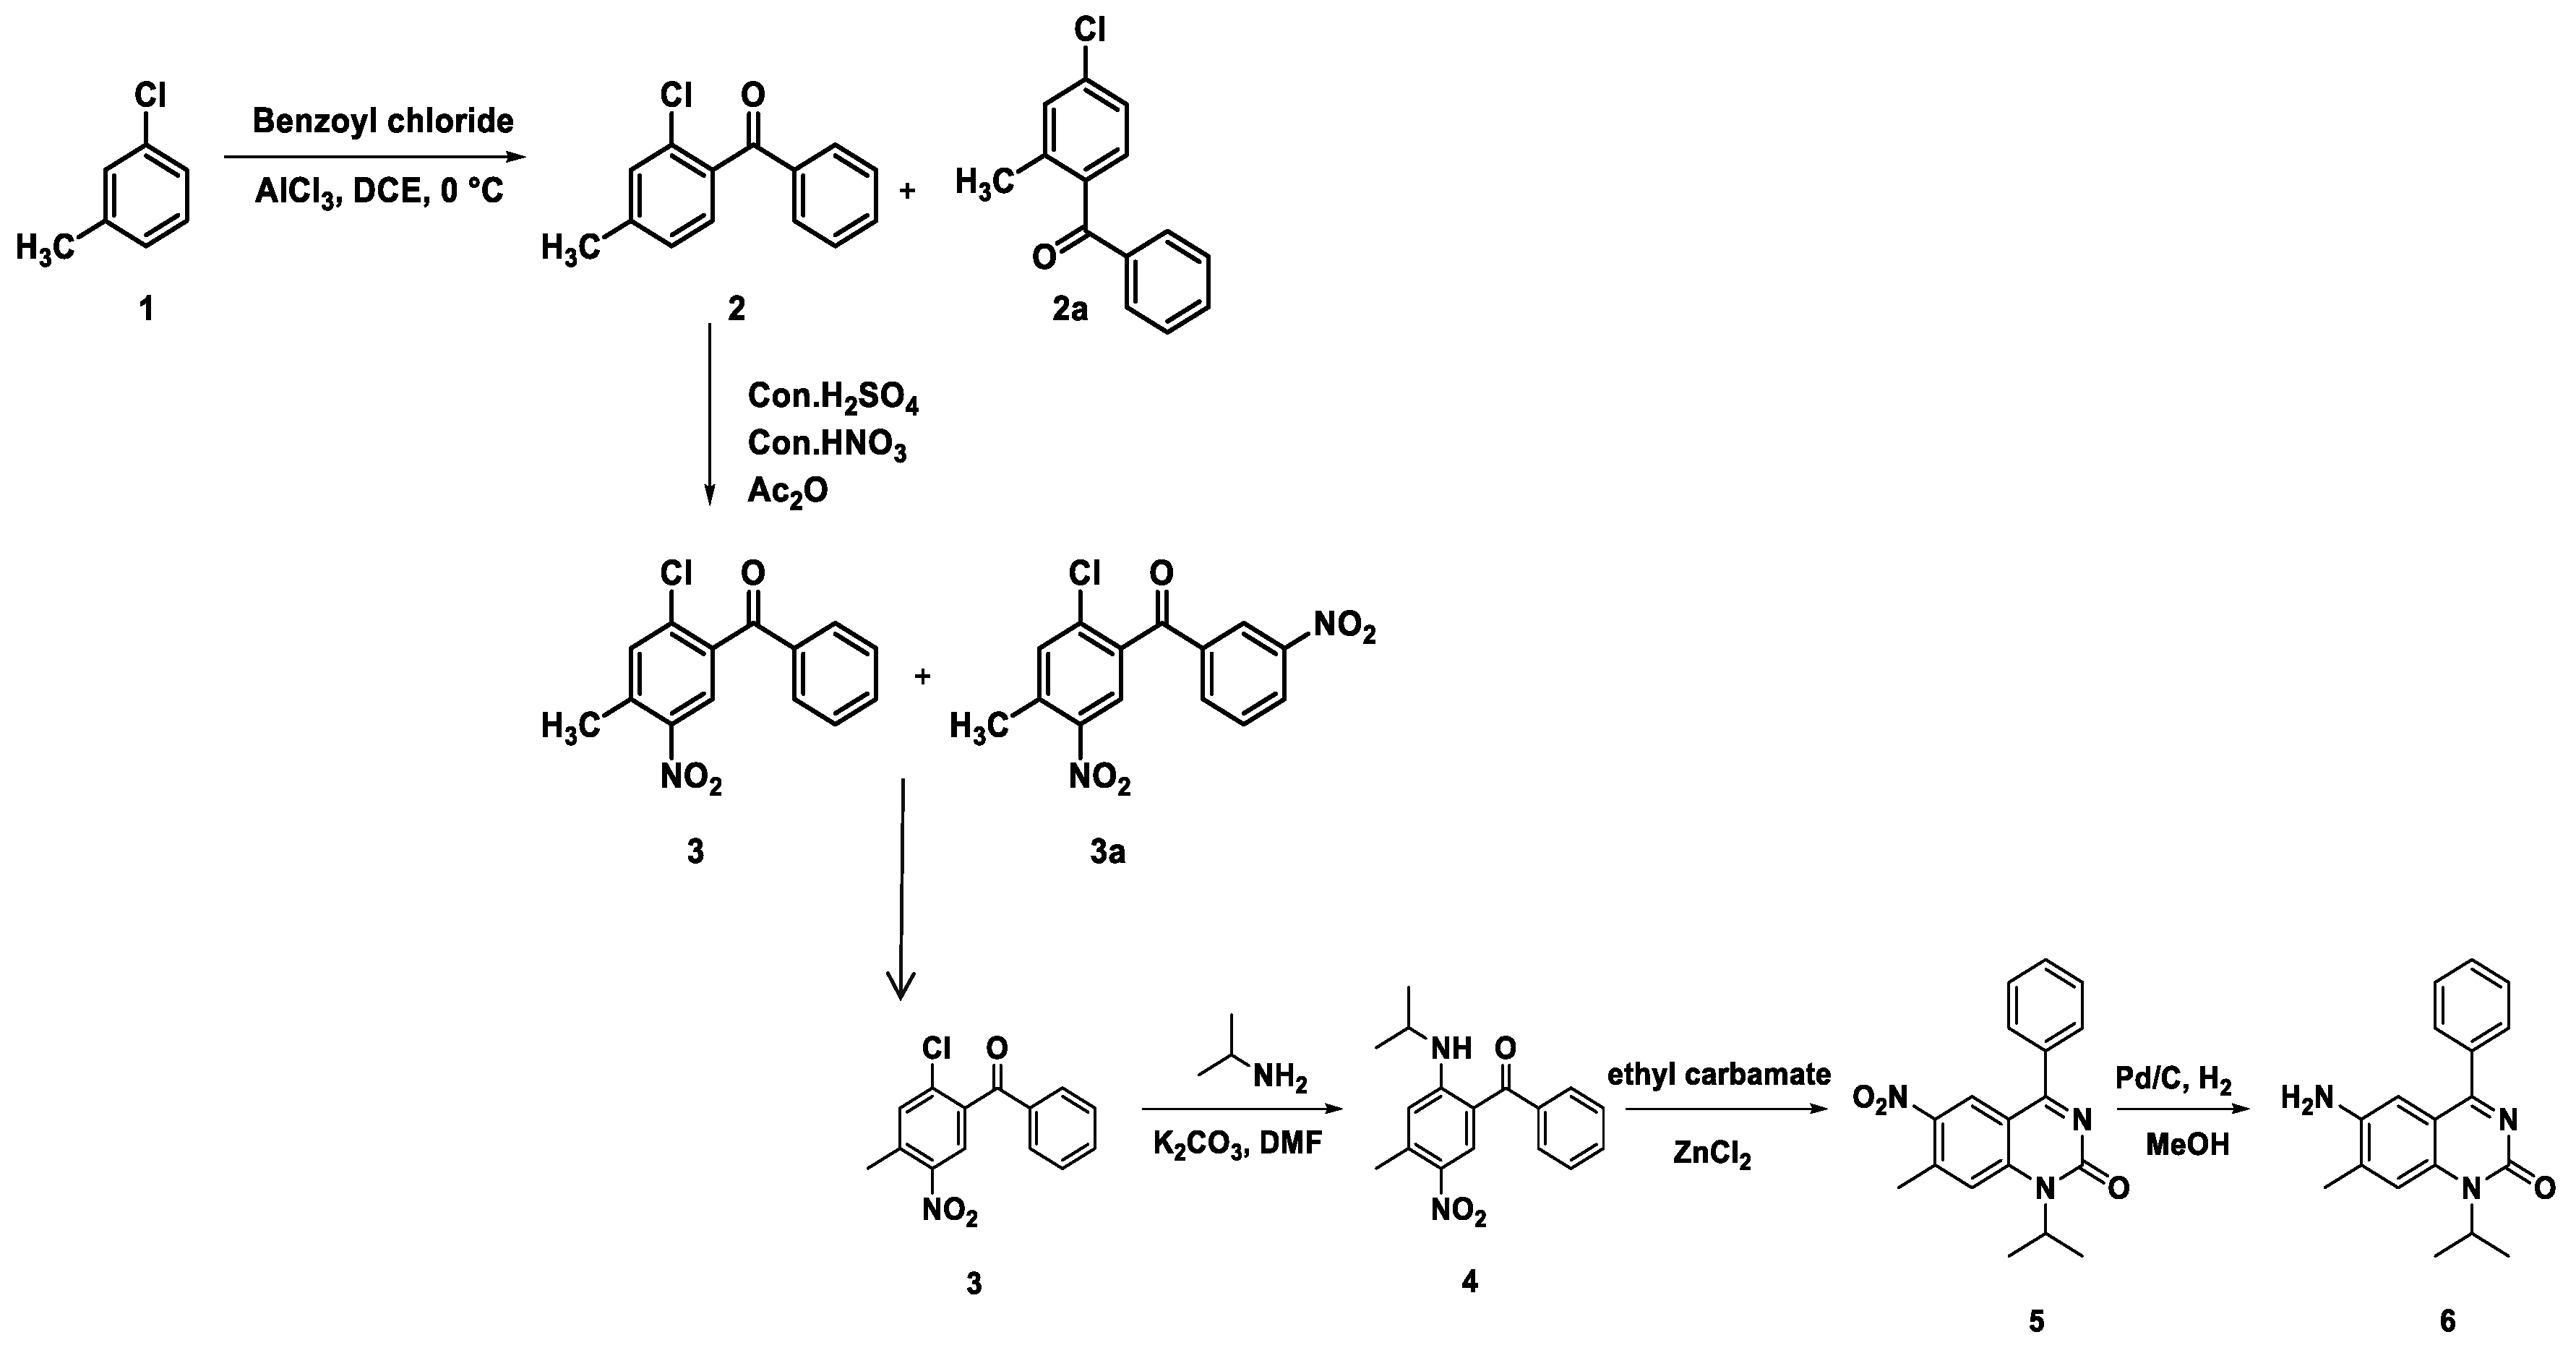
- Synthesis of (2-chloro-4-methylphenyl)(phenyl)methanone (2):

To a stirred solution of 1-chloro-3-methylbenzene (1) (2.0 g, 15.8 mmol) in dichloroethane (DCE) (50 mL), benzoyl chloride (2 mL) and aluminum chloride (AlCl3) (2.4 g) were added. The reaction mixture was heated at -10°C for 2-3 hours. The reaction was then quenched with diluted hydrochloric acid (HCl) and extracted with dichloromethane (CH2Cl2). The combined organic phases were dried over sodium sulfate (Na2SO4) and concentrated under reduced pressure. The crude product was purified by flash column chromatography using a gradient of 15% ethyl acetate (EtOAc) in hexane, yielding compound 2 (1.2 g) and compound 2A (0.8 g). 1H-NMR (500 MHz, CDCl3): δ =7.59-7.61 (m, 2H), 7.46-7.49(m, 1H), 7.28-7.31(m, 2H), 7.17-7.19(m, 2H), 7.17(d, J=5.2 Hz, 1H), 2.43(s, 3H). HRMS (ESI-TOF) m/z: [M+H]+ calcd for C14H12ClO2 247.0520, found: 247.0523.
- Synthesis of (2-chloro-4-methyl-5-nitrophenyl)(phenyl)methanone (3):

Compound 2 (1.0 g) was suspended in concentrated sulfuric acid (H2SO4) (10 mL) and stirred, to which concentrated nitric acid (HNO3) (1 mL) was added dropwise at -5°C. The reaction mixture was allowed to warm to room temperature and stirring continued for 3 hours. The reaction mixture was then poured into crushed ice and extracted with dichloromethane (CH2Cl2). The combined organic phases were dried over sodium sulfate (Na2SO4) and concentrated under reduced pressure. The crude product was purified by flash column chromatography using a gradient of ethyl acetate (EtOAc)/hexane (3:7), yielding compound 3 (300 mg) and compound 3A (200 mg). 1H NMR (500 MHz, CDCl3): δ =8.08(s, 1H), 7.81-7.83(m, 2H), 7.65-7.69(m, 1H), 7.50-7.54(m, 3H), 2.71(s, 3H). HRMS (ESI-TOF) m/z: [M+H]+ calcd for C14H11ClNO3 276.0422, found: 276.0425.
- Synthesis of (2-(isopropylamino)-4-methyl-5-nitrophenyl)(phenyl)methanone (4):

Compounds 3 (500 mg) were dissolved in ethanol (20 mL), and to this stirred solution, isopropylamine (2.5 mL), K2CO3 (1.5 g), and CuI (0.3 g) were added. The reaction mixture was heated at 80 °C for 5 hours. After cooling, the reaction mixture was diluted with water and extracted with dichloromethane (CH2Cl2). The combined organic phases were dried over sodium sulfate (Na2SO4), concentrated under reduced pressure, and the crude product was purified by flash column chromatography using a gradient of ethyl acetate (EtOAc)/hexane (3:7), yielding compound 4 (250 mg). 1H NMR (500 MHz, CDCl3): δ =9.15 (d, J=5 Hz, 1H), 8.5(s, 1H), 7.58-7.64(m, 3H), 7.28-7.58(m, 2H), 3.87-3.92(m, 1H), 2.71(s, 3H), 1.37(d, J=5 Hz, 6H). HRMS (ESI-TOF) m/z: [M+H]+ calcd for C17H19N2O3 299.1390, found: 299.1370.
- Synthesis of 1-isopropyl-7-methyl-6-nitro-4-phenylquinazolin-2(1H)-one (5):

The reaction mixture containing compound 4 (1.0 g), ethyl carbamate (5.0 g), and ZnCl2 (1.0 g) in a sealed tube was heated at 240 °C for 3 hours. After cooling, the reaction mixture was quenched with dilute hydrochloric acid (HCl) and extracted with dichloromethane (CH2Cl2). The combined organic phases were dried over sodium sulfate (Na2SO4), concentrated under reduced pressure, and the crude product was purified by column chromatography using a gradient of ethyl acetate (EtOAc)/hexane (2:8), yielding compound 5 (0.7 g). 1H NMR (500 MHz, CDCl3): δ = 8.58(s, 1H), 7.75(d, J=5 Hz, 2H), 7.56-7.64(m, 3H), 7.47(s, 1H), 5.11-5.31(m, 1H), 2.83(s, 3H), 1.68(d, J=11 Hz, 6H). HRMS (ESI-TOF) m/z: [M+H]+ calculated for C18H18N3O3 324.1343, found: 324.1345.
- Synthesis of 6-amino-1-isopropyl-7-methyl-4-phenylquinazolin-2(1H)-one (6):

Compound 5 (150 mg) was dissolved in methanol (10 mL) and to this stirred solution, 10% palladium on carbon (15 mg) was added. The reaction mixture was hydrogenated under an atmosphere of hydrogen (H2) using a balloon for 1 hour. After hydrogenation, the reaction mixture was filtered through celite, concentrated under reduced pressure, and the crude product was purified by column chromatography using a gradient of ethyl acetate (EtOAc)/hexane (4:6), yielding compound 6 (100 mg). 1H NMR (500 MHz, DMSO-d6): δ =7.61-7.62 (m, 2H), 7.56-7.57(m, 3H), 7.51(s, 1H), 6.91(s, 1H), 5.0 (br s, 2H), 3.65(br s, 2H) 2.28(s, 3H), 1.55(d, J=6.5Hz, 6H). 13C NMR (125 MHz, DMSO-d6):172.2, 154.9, 154.5, 154.1, 142.5, 137.7, 135.8, 133.6, 130.3, 129.5, 128.76, 115.9, 115.7, 110.6, 61.6, 48.1, 19.5, 19.1. HRMS (ESI-TOF) m/z: [M+H]+ calcd for C18H20N3O 294.1601, found: 294.1605 (Supplementry Figure S1–S4).
Absorption, Distribution, Metabolism, and Excretion (ADME) Analysis of PA-6
We assessed the ADME properties of PA-6 using SwissADME software. These ADME properties are important predictors about compounds' behavior in the body and inform us the efficacy and safety of the drug. The input options were SMILES string of the query compound and output consisted pharmacokinetic property predictions, including molecular weight (MW), lipophilicity (LogP), topological polar surface area (TPSA), aqueous solubility, gastrointestinal (GI) absorption, blood–brain barrier (BBB) permeability, and potential cytochrome P450 (CYP) enzyme interactions.
Molecular Docking of PA-6 with MTA2 and HNRNPM
We used Alphafold3 to generate high-confidence tertiary models of heterogeneous nuclear ribonucleoprotein M (HNRNPM) and metastasis-associated protein 2 (MTA2) by the molecular docking process. The HNRNPM contains RNA recognition motifs (RRMs), while MTA2 harbors a bromo-adjacent homology (BAH) domain crucial for chromatin remodeling. Initially, the secondary structure of PA-6 was converted to a tertiary structural configuration, energy minimized using Merck Molecular Force Field 94 (MMFF94), and then partial atomic charges were assigned before completing the molecular docking. DockThor was used for docking simulations by providing binding sites based on known functional domains. The highest ranked docking poses were analyzed for van der Waals (vdW) and electrostatic interactions, which identify key amino acid residues involved in the binding of PA-6.
Cell lines and Resources
This study was conducted on the human chronic myeloid leukemia cell line, K562, was obtained from the National Centre for Cell Science (NCCS) in Pune, India. Phosphate buffered saline (PBS), Roswell Park Memorial Institute (RPMI) 1640 medium, fetal bovine serum (FBS), penicillin, gentamicin, and streptomycin were purchased from GIBCO, Ltd. (BRL Life Technologies, Inc., Grand Island, NY). Chemicals including MTT [3-(4,5-dimethylthiazol-2-yl)-2,5-diphenyl tetrazolium bromide], proteinase K, RNase A, propidium iodide, phenylmethylsulfonyl fluoride (PMSF), leupeptin, aprotinin, pepstatin A, trypsin, Tween-20, Triton X-100, Ponceau S, Igepal CA-630, sodium orthovanadate, sodium bicarbonate, EDTA, and calcium chloride were purchased from Sigma Chemical Company (St. Louis, USA). Acrylamide, N,N’-methylene-bis-acrylamide, sodium dodecyl sulfate (SDS), ammonium persulfate, β-mercaptoethanol, and bromophenol blue were purchased from Bio-Rad Laboratories (Richmond, USA). K562 cells were cultured in RPMI medium supplemented with 10% FBS, 100 IU/ml penicillin, 100 µg/ml streptomycin, and 2 mM L-glutamine. They were maintained in a humidified atmosphere with 5% CO2 at 37°C and sub-cultured every 2 days. Different concentrations of Quinazolin-2(1H)-one (Control (without drug), 5 mg/mL, 10 mg/mL, 20 mg/mL Quinazolin, and 20 mg/mL celecoxib) and celecoxib (used as a positive drug control) were prepared in sterile water and stored at −20°C.
Cytotoxicity Assay
Cell line viability was assessed using the MTT assay (3-(4, 5-Dimethylthiazol-2-yl)-2,5-Diphenyltetrazolium Bromide). Paroquazone Analog (PA-6) in powdered form was dissolved in 0.1% dimethyl sulfoxide (DMSO) to create a stock solution with a concentration of 100 μM. This solution was then filter sterilized using a 0.22 μm filter and stored at 4°C. Serial dilutions were performed to prepare different concentrations of the drug (100, 50, 25, 10, and 5 μM). Cultures in the exponential growth phase were trypsinized and diluted in a culture medium to achieve a suspension of 1 x 10⁶ cells/mL. A 100 µL aliquot of this suspension was added to the appropriate wells of a sterile 96-well flat-bottomed microtiter plate. Each drug dilution was tested in triplicate, and three wells containing only complete medium served as blank controls to account for nonspecific dye reduction. The plates were incubated at 37°C in a humidified atmosphere with 5% CO2 for 48-72 hours, after which cell viability was evaluated. Following this incubation, 50 μL of MTT reagent (5 mg/mL) was added to each well, and the plates were incubated for an additional 2 hours at 37°C in a 5% CO2 incubator. The MTT solution was then removed, and 100 μL of isopropanol was added to dissolve the crystalline purple formazans. Absorbance was measured at 570 nm using a microplate reader.
Isolation of Proteins from Treated K562 Cell Lines
After exposing K562 cells to varying concentrations of Quinazolin-2(1H)-one (Control, 5 mg/mL, 20 mg/mL), cell lysis was performed according to the method described by [42]. To prepare the whole-cell extract, the cells were washed with PBS and resuspended in a lysis buffer containing 20 mM Tris, 1 mM EDTA, 150 mM NaCl, 1% NP40 (Nonidet P40), 0.5% sodium deoxycholate, 1 mM β-glycerophosphate, 1 mM Na3VO4 (sodium orthovanadate), 1 mM PMSF, 10 μg/mL leupeptin, and 20 μg/mL aprotinin. The mixtures were shaken at 4°C for 30 minutes, then centrifuged at 10,000xg for 10 minutes, and the supernatants were collected as whole-cell extracts. The protein content of these extracts was determined using the Bradford method (Bradford, 1976), with concentrations measured at 0.386 mg/mL for the control, 0.371 mg/mL for treatment 1, and 0.539 mg/mL for treatment 2.
Insolution Digestion (ISD) of Isolated Proteins
In-solution digestion (ISD) of proteins isolated from K562 cells (control and drug-treated) was performed as described by (REF). Briefly, whole-cell extracts were resuspended in 100 μL of ISD lysis buffer (8 M urea, 30% Acetonitrile (ACN),100 mM NH4HCO3) and incubated at 37°C for 30 minutes with shaking. To reduce disulfide bonds, DTT was added to a final concentration of 20 mM, and the samples were incubated at 37°C with shaking for an additional 30 minutes. The reduced proteins were then alkylated by adding IAA to a final concentration of 60 mM and incubated in the dark for 30 minutes at 37°C. For tryptic digestion, 2 μg of trypsin (Promega, MA, USA) was added at a ratio of 1:20 (enzyme) and the samples were digested for 12-14 hours at 37°C. Digestion was quenched by adding 0.1% formic acid. The samples were then dried under vacuum using a SpeedVac concentrator (Thermo Scientific, MA, USA) at 45°C, and the dried peptides were stored at 4°C until further use.
Peptide Desalting and ESI-LC Analysis
Dried peptide samples were resuspended in 0.5% TFA in 5% ACN and loaded onto C18 columns (Peptide Cleanup C18 Spin Tubes, Agilent, USA). The samples were washed with 0.05% TFA and eluted with 70% ACN in 0.1% FA. The eluates were dried using a SpeedVac concentrator (Thermo Scientific, MA, USA) at 45°C and stored at −80°C until instrumental analysis. Pure peptide samples were resuspended in 0.1% FA in water and analyzed using a Q-Exactive HF mass spectrometer (Thermo Scientific, MA, USA) coupled to a Thermo Ultimate 3000 nanoLC system (Thermo Scientific, MA, USA). The ion source capillary temperature was set to 150°C and the spray voltage to 1.8 kV. Samples were analyzed using a 50 mm × 75 μm PepMap RSLC nano column (Thermo Scientific, MA, USA). The mobile phase consisted of 0.1% FA (A) and 80% ACN in 0.1% FA (B). Gradient separation was conducted as follows: 5% B for 5 minutes, followed by a 60-minute gradient to 10% B, a 5-minute gradient to 30% B, 10 minutes at 95% B, and a 5-minute gradient back to 5% B, making the total analysis time 80 minutes.
Mass Spectrometry Acquisition
Purified tryptic-digested cell lysates were analyzed using a Q-Exactive HF mass spectrometer connected to an Easy-nLC 1000 pump (Thermo Scientific, San José, CA) employing a top 10 data-dependent acquisition (DDA) method. Full MS scans were acquired with the Orbitrap mass analyzer over the m/z 350–1800 range, with a resolution of 70,000 (at m/z 200), a target AGC value of 1e6, and a maximum injection time of 100 ms. The ten most intense peaks with charge states ≥2 was fragmented in the HCD collision cell with a normalized collision energy of 30%. Tandem mass spectra were acquired in the Orbitrap mass analyzer with a resolution of 35,000 (at m/z 200), a target AGC value of 1e6, and a maximum injection time of 120 ms. The ion selection threshold was set to 5.0e2, with a dynamic exclusion time of 20 seconds. Normal scan speed was used, with the spectrum data type set to centroid.
Data Analysis
Raw files were analyzed using Proteome Discoverer v2.4 (Thermo Scientific, San José, CA). Peptide identification was performed using SEQUEST HT against the UniProtKB human database integrated into Proteome Discoverer (release 2015_03, 42,060 sequences including isoforms) and using Mascot against the UniProtKB human database (release 2014_02, 20,508 sequences, http://www.uniprot.org/downloads). The search parameters were set as follows: carbamidomethylation as a static modification, oxidation of methionine as a dynamic modification, 10 ppm precursor tolerance, and 0.02 Da fragment tolerance. Up to one missed cleavage for tryptic peptides was allowed. The filters applied were 'high confidence' and 'at least two peptides per protein' (FDR ≤ 0.01).
Functional Annotations
Enrichment analysis of the differentially expressed proteins was conducted using ShinyGO v0.78, an intuitive graphical tool based on Bioconductor/R packages [REF]. The selected organism was Homo sapiens, and gene ontology was the functional classification based on Ensembl and STRING-db for Over-Representation Analysis (ORA). Classification based on gene ontology included “Biological Process,” “Molecular Function,” and “Cellular Process,” distinguishing between the up- and down-regulated Proquazone Analog (PA-6) induced DEPs. Reactome databases v3.7 were utilized for the pathway annotations of DEPs. All other parameters were set to default. A heat map representation was created to understand the cluster correlation patterns between conditions, where the color scale represented the abundance of the proteins. Distances between entities were calculated using euclidean matrices, with the average linkage method applied for both rows and columns. Pathway analysis was done with the help online database DAVID https://david.ncifcrf.gov. Heatmaps was constructed for both upregulated and downregulated important cancer markers using online sever https://biit.cs.ut.ee/clustvis/.
CONCLUSION
In conclusion, the proteomic analysis of K562 leukemia cells treated with the novel anti-cancer drug PA-6 revealed significant alterations in key cellular processes, including apoptosis, RNA metabolism, and translational machinery. Treatment with 20 µM PA-6 led to a marked suppression of transcriptional, translational, and signaling pathways, correlating with increased cytotoxicity. Molecular docking analysis showed that PA-6 binds favourably to HNRNPM and MTA2 with docking scores of -7.296 and -7.5, respectively, suggesting its potential to disrupt RNA binding and chromatin remodelling through significant van der Waals and electrostatic interactions, further supporting PA-6’s potential to interfere with these critical cellular functions. These findings highlight PA-6's potential to modulate cancer-related pathways and provide a foundation for future studies on its efficacy and safety. Further exploration of PA-6's in animal models could pave the way for safer and more effective future leukemia and other cancer treatments.
Supplementary Materials
The following supporting information can be downloaded at the website of this paper posted on Preprints.org. Supplementary materials related to this article are available online and include additional figures, tables, experimental protocols, and raw datasets. These materials provide extended data and methodological details that support and complement the findings presented in the main text. Specifically, the supplementary materials include ¹H NMR spectra, HPLC chromatogram, and electrospray ionization mass spectrum (ESI-MS) of compound PA 6, collectively confirming the structural integrity and purity of the synthesized compound. Figure S1.¹H NMR spectrum of Compound 6 recorded in CDCl₃ at 500 MHz. The spectrum was acquired on a 500.18 MHz NMR spectrometer using CDCl₃ as the solvent at 294.3 K. Prominent chemical shifts (δ, ppm) include signals at 0.98, 1.00, 1.02, 1.69, 1.711, 1.756, 1.93, 1.95, 2.38, 2.95, 2.96, 3.655, 5.196, 5.314, 6.11, 7.029, 7.281, 7.347, 7.489, 7.501, 7.516, 7.520, 7.533, 7.700, 7.704, 7.716, and 7.719 ppm, corresponding to various aliphatic, olefinic, and aromatic proton environments. Spectral parameters include a spectral width of 10330.578 Hz, acquisition time of 3.17 s, and 16 scans. The experiment was performed using the standard zg30 pulse program on a 5 mm PABBO BB− probe. Figure S2. HPLC chromatogram of Compound 6 monitored at 315 nm. High-performance liquid chromatography (HPLC) analysis of Compound 6 was conducted using a 2998 photodiode array detector at 315.0 nm. The sample was injected at a volume of 5.00 µL with a total run time of 30 minutes. Four peaks were detected at retention times (RT) of 3.902, 7.069, 7.885, and 12.283 minutes. The major peak at RT 7.885 minutes accounted for 99.39% of the total area, indicating high purity of the compound. Minor peaks contributed 0.42%, 0.15%, and 0.04% of the area, respectively. The analysis was performed under method ID 3377 using the PRO processing method. Figure S3. Electrospray ionization mass spectrum (ESI-MS) of Compound 6. The mass spectrum of Compound 6 was acquired using electrospray ionization in positive ion mode (ESI⁺) on a QDa detector, scanning from m/z 50 to 1200. A single major ion peak was observed at m/z 294.42 with a retention time of 7.872 minutes, indicating the molecular ion [M+H]⁺ of Compound 6. The analysis was performed with a 5.00 µL injection volume and a total run time of 30 minutes under report method ID 3395. Figure S4. ¹H NMR spectrum of Compound PA6 recorded in CDCl₃ at 500 MHz. The ¹H NMR spectrum of Compound PA6 was recorded on a 500.18 MHz NMR spectrometer using CDCl₃ as the solvent at 294.3 K. The spectrum was acquired using the standard zg30 pulse sequence with 16 scans and an acquisition time of 3.17 seconds. Prominent chemical shifts (δ, ppm) observed include: 0.98, 1.00, 1.02, 1.69, 1.711, 1.756, 1.93, 1.95, 2.38, 2.95, 2.96, 3.655, 5.196, 5.314, 6.11, 7.029, 7.281, 7.347, 7.489, 7.501, 7.516, 7.520, 7.533, 7.700, 7.704, 7.716, and 7.719 ppm. These signals are indicative of aliphatic, olefinic, and aromatic proton environments. The experiment was conducted using a 5 mm PABBO BB− probe with a spectral width of 10330.578 Hz and processed with exponential line broadening (LB = 0.30 Hz).
Author Contributions
MK1 and SP were responsible for conceptualizing and designing the study, conducting experiments, performing laboratory analyses, and data interpretation. MK wrote the original draft. AB synthesized the novel PA-6 drug. NSh and BB contributed to the ADME molecular docking bioinformatics analysis, data interpretation. MK2 was involved in critical revisions of the manuscript. RC made substantial contributions to its development through comprehensive editing, meticulous content review, and significant refinement of the final draft. All authors edited and approved the final version of the manuscript.
Funding
No specific funding was obtained for this work.
Data Availability Statement
The dataset associated with this article is publicly available on ProteomeXchange (http://www.proteomexchange.org/) under the identifier PXD002485, featuring data on Quinazolin-2(1H)-one (Control, 5 µg/mL, 20 µg/mL Quinazolin).
Conflicts of Interest
The authors declare that they have no conflict of interest regarding the publication of this work.
References
- Karthikeyan, S.; Grishina, M.; Kandasamy, S.; Mangaiyarkarasi, R.; Ramamoorthi, A.; Chinnathambi, S.; Pandian, G.N.; Kennedy, L.J. A review on medicinally important heterocyclic compounds and importance of biophysical approach of underlying the insight mechanism in biological environment. J. Biomol. Struct. Dyn. 2023, 41, 14599–14619. [Google Scholar] [CrossRef] [PubMed]
- Auti, P.S.; George, G.; Paul, A.T. Recent advances in the pharmacological diversification of quinazoline/quinazolinone hybrids. RSC Adv. 2020, 10, 41353–41392. [Google Scholar] [CrossRef] [PubMed]
- Antoniolli, G.; Lima, C.S.P.; Coelho, F. Recent advances in the investigation of the quinazoline nucleus and derivatives with potential anticancer activities. Futur. Med. Chem. 2025, 17, 1–19. [Google Scholar] [CrossRef]
- Mphahlele, M.J. A Review on the Synthesis and Chemical Transformation of Quinazoline 3-Oxides. Molecules 2022, 27, 7985. [Google Scholar] [CrossRef] [PubMed]
- Gatadi, S.; Lakshmi, T.V.; Nanduri, S. 4(3H)-Quinazolinone derivatives: Promising antibacterial drug leads. Eur. J. Med. Chem. 2019, 170, 157–172. [Google Scholar] [CrossRef]
- Zhao, J.; Zhang, Y.; Wang, M.; Liu, Q.; Lei, X.; Wu, M.; Guo, S.; Yi, D.; Li, Q.; Ma, L.; et al. Quinoline and Quinazoline Derivatives Inhibit Viral RNA Synthesis by SARS-CoV-2 RdRp. ACS Infect. Dis. 2021, 7, 1535–1544. [Google Scholar] [CrossRef]
- Dutta, A.; Sarma, D. Recent advances in the synthesis of Quinazoline analogues as Anti-TB agents. Tuberculosis 2020, 124, 101986. [Google Scholar] [CrossRef]
- Hassanzadeh, F.; Jafari, E.; Hakimelahi, G.H.; Khajouei, M.R.; Jalali, M.; Khodarahmi, G.A. Antibacterial, antifungal and cytotoxic evaluation of some new quinazolinone derivatives. 2012, 7, 87–94.
- Jafari, E.; Khajouei, M.R.; Hassanzadeh, F.; Hakimelahi, G.H.; Khodarahmi, G.A. Quinazolinone and quinazoline derivatives: recent structures with potent antimicrobial and cytotoxic activities. 2016, 11, 1–14.
- Mehndiratta, S.; Sapra, S.; Singh, G.; Singh, M.; Nepali, K. Quinazolines as Apoptosis Inducers and Inhibitors: A Review of Patent Literature. Recent Patents Anti-Cancer Drug Discov. 2016, 11, 2–66. [Google Scholar] [CrossRef]
- Scully, O.J.; Shyamasundar, S.; Matsumoto, K.; Dheen, S.T.; Yip, G.W.; Bay, B.H. C1QBP Mediates Breast Cancer Cell Proliferation and Growth via Multiple Potential Signalling Pathways. Int. J. Mol. Sci. 2023, 24, 1343. [Google Scholar] [CrossRef]
- Zou, R.; Zhao, W.; Xiao, S.; Lu, Y. A Signature of Three Apoptosis-Related Genes Predicts Overall Survival in Breast Cancer. Front. Surg. 2022, 9, 863035. [Google Scholar] [CrossRef]
- Pillai, N.; Dasgupta, A.; Sudsakorn, S.; Fretland, J.; Mavroudis, P.D. Machine Learning guided early drug discovery of small molecules. Drug Discov. Today 2022, 27, 2209–2215. [Google Scholar] [CrossRef]
- Chen, Y.-S.; Hung, T.-W.; Su, S.-C.; Lin, C.-L.; Yang, S.-F.; Lee, C.-C.; Yeh, C.-F.; Hsieh, Y.-H.; Tsai, J.-P. MTA2 as a Potential Biomarker and Its Involvement in Metastatic Progression of Human Renal Cancer by miR-133b Targeting MMP-9. Cancers 2019, 11, 1851. [Google Scholar] [CrossRef]
- Lin CL, Ying TH, Yang SF, Chiou HL, Chen YS, Kao SH, et al. MTA2 silencing attenuates the metastatic potential of cervical cancer cells by inhibiting AP1-mediated MMP12 expression via the ASK1/MEK3/p38/YB1 axis. Cell Death Dis. 2021;12(5):451.
- Passacantilli, I.; Frisone, P.; De Paola, E.; Fidaleo, M.; Paronetto, M.P. hnRNPM guides an alternative splicing program in response to inhibition of the PI3K/AKT/mTOR pathway in Ewing sarcoma cells. Nucleic Acids Res. 2017, 45, 12270–12284. [Google Scholar] [CrossRef]
- Jiang, N.; Dai, Q.; Su, X.; Fu, J.; Feng, X.; Peng, J. Role of PI3K/AKT pathway in cancer: the framework of malignant behavior. Mol. Biol. Rep. 2020, 47, 4587–4629. [Google Scholar] [CrossRef]
- Choudhary, S.; Doshi, A.; Luckett-Chastain, L.; Ihnat, M.; Hamel, E.; Mooberry, S.L.; Gangjee, A. Potential of substituted quinazolines to interact with multiple targets in the treatment of cancer. Bioorganic Med. Chem. 2021, 35, 116061–116061. [Google Scholar] [CrossRef]
- De, A.K.; Muthiyan, R.; Mondal, S.; Mahanta, N.; Bhattacharya, D.; Ponraj, P.; Muniswamy, K.; Kundu, A.; Kundu, M.S.; Sunder, J.; et al. A Natural Quinazoline Derivative from Marine Sponge Hyrtios erectus Induces Apoptosis of Breast Cancer Cells via ROS Production and Intrinsic or Extrinsic Apoptosis Pathways. Mar. Drugs 2019, 17, 658. [Google Scholar] [CrossRef] [PubMed]
- Abbott JR, Patel PA, Howes JE, Akan DT, Kennedy JP, Burns MC, et al. Discovery of Quinazolines That Activate SOS1-Mediated Nucleotide Exchange on RAS. ACS Med Chem Lett. 2018;9(9):941-6.
- Patni, A.P.; Harishankar, M.K.; Joseph, J.P.; Sreeshma, B.; Jayaraj, R.; Devi, A. Comprehending the crosstalk between Notch, Wnt and Hedgehog signaling pathways in oral squamous cell carcinoma - clinical implications. Cell. Oncol. 2021, 44, 473–494. [Google Scholar] [CrossRef] [PubMed]
- Ha HA, Chiang JH, Tsai FJ, Bau DT, Juan YN, Lo YH, et al. Novel quinazolinone MJ-33 induces AKT/mTOR-mediated autophagy-associated apoptosis in 5FU-resistant colorectal cancer cells. Oncol Rep. 2021;45(2):680-92.
- Hour, M.-J.; Tsai, S.-C.; Wu, H.-C.; Lin, M.-W.; Chung, J.-G.; Wu, J.-B.; Chiang, J.-H.; Tsuzuki, M.; Yang, J.-S. Antitumor effects of the novel quinazolinone MJ-33: Inhibition of metastasis through the MAPK, AKT, NF-κB and AP-1 signaling pathways in DU145 human prostate cancer cells. Int. J. Oncol. 2012, 41, 1513–1519. [Google Scholar] [CrossRef] [PubMed]
- Chiu YJ, Hour MJ, Jin YA, Lu CC, Tsai FJ, Chen TL, et al. Disruption of IGF-1R signaling by a novel quinazoline derivative, HMJ-30, inhibits invasiveness and reverses epithelial-mesenchymal transition in osteosarcoma U-2 OS cells. Int J Oncol. 2018;52(5):1465-78.
- Lu CC, Yang JS, Chiang JH, Hour MJ, Amagaya S, Lu KW, et al. Inhibition of invasion and migration by newly synthesized quinazolinone MJ-29 in human oral cancer CAL 27 cells through suppression of MMP-2/9 expression and combined down-regulation of MAPK and AKT signaling. Anticancer Res. 2012;32(7):2895-903.
- Singh, R.R.; Kumar, R. MTA Family of Transcriptional Metaregulators in Mammary Gland Morphogenesis and Breast Cancer. J. Mammary Gland. Biol. Neoplasia 2007, 12, 115–125. [Google Scholar] [CrossRef]
- Takeuchi, I.; Takaha, N.; Nakamura, T.; Hongo, F.; Mikami, K.; Kamoi, K.; Okihara, K.; Kawauchi, A.; Miki, T. High mobility group protein AT-hook 1 (HMGA1) is associated with the development of androgen independence in prostate cancer cells. Prostate 2011, 72, 1124–1132. [Google Scholar] [CrossRef]
- Zhou, C.; Ji, J.; Cai, Q.; Shi, M.; Chen, X.; Yu, Y.; Liu, B.; Zhu, Z.; Zhang, J. MTA2 promotes gastric cancer cells invasion and is transcriptionally regulated by Sp1. Mol. Cancer 2013, 12, 102–102. [Google Scholar] [CrossRef] [PubMed]
- Chen, D.-W.; Fan, Y.-F.; Li, J.; Jiang, X.-X. MTA2 expression is a novel prognostic marker for pancreatic ductal adenocarcinoma. Tumor Biol. 2013, 34, 1553–1557. [Google Scholar] [CrossRef] [PubMed]
- Zhao, S.; Wang, Y.; Guo, T.; Yu, W.; Li, J.; Tang, Z.; Yu, Z.; Zhao, L.; Zhang, Y.; Wang, Z.; et al. YBX1 regulates tumor growth via CDC25a pathway in human lung adenocarcinoma. Oncotarget 2016, 7, 82139–82157. [Google Scholar] [CrossRef]
- Wu, S.; Su, R.; Jia, H.; Birková, A. Cyclin B2 (CCNB2) Stimulates the Proliferation of Triple-Negative Breast Cancer (TNBC) Cells In Vitro and In Vivo. Dis. Markers 2021, 2021, 1–9. [Google Scholar] [CrossRef]
- Schnerch, D.; Yalcintepe, J.; Schmidts, A.; Becker, H.; Follo, M.; Engelhardt, M.; Wäsch, R. Cell cycle control in acute myeloid leukemia. . 2012, 2, 508–28. [Google Scholar]
- Shi H, Li Y, Ren X, Zhang Y, Yang Z, Qi C. A novel quinazoline-based analog induces G2/M cell cycle arrest and apoptosis in human A549 lung cancer cells via a ROS-dependent mechanism. Biochem Biophys Res Commun. 2017;486(2):314-20.
- Li, M.-J.; Yan, S.-B.; Chen, G.; Li, G.-S.; Yang, Y.; Wei, T.; He, D.-S.; Yang, Z.; Cen, G.-Y.; Wang, J.; et al. Upregulation of CCNB2 and Its Perspective Mechanisms in Cerebral Ischemic Stroke and All Subtypes of Lung Cancer: A Comprehensive Study. Front. Integr. Neurosci. 2022, 16, 854540. [Google Scholar] [CrossRef]
- Rensen, W.M.; Roscioli, E.; Tedeschi, A.; Mangiacasale, R.; Ciciarello, M.; A Di Gioia, S.; Lavia, P. RanBP1 downregulation sensitizes cancer cells to taxol in a caspase-3-dependent manner. Oncogene 2009, 28, 1748–1758. [Google Scholar] [CrossRef]
- Zuo, X.; Meng, P.; Bao, Y.; Tao, C.; Wang, Y.; Liu, X.; Bu, Y.; Zhu, J. Cell cycle dysregulation with overexpression of KIF2C/MCAK is a critical event in nasopharyngeal carcinoma. Genes Dis. 2023, 10, 212–227. [Google Scholar] [CrossRef]
- Morgado-Palacin, I.; Day, A.; Murga, M.; Lafarga, V.; Anton, M.E.; Tubbs, A.; Chen, H.-T.; Ergen, A.V.; Anderson, R.; Bhandoola, A.; et al. Targeting the kinase activities of ATR and ATM exhibits antitumoral activity in mouse models of MLL -rearranged AML. Sci. Signal. 2016, 9, ra91–ra91. [Google Scholar] [CrossRef]
- Prieto, C.; Kharas, M.G. RNA Regulators in Leukemia and Lymphoma. Cold Spring Harb. Perspect. Med. 2019, 10, a034967. [Google Scholar] [CrossRef]
- Liu, Q.; Yuan, Y.; Shang, X.; Xin, L. Cyclin B2 impairs the p53 signaling in nasopharyngeal carcinoma. BMC Cancer 2024, 24, 1–14. [Google Scholar] [CrossRef]
- Singh, P.; Saha, U.; Paira, S.; Das, B. Nuclear mRNA Surveillance Mechanisms: Function and Links to Human Disease. J. Mol. Biol. 2018, 430, 1993–2013. [Google Scholar] [CrossRef]
- Nagar, P.; Islam, R.; Rahman, M.A. Nonsense-Mediated mRNA Decay as a Mediator of Tumorigenesis. Genes 2023, 14, 357. [Google Scholar] [CrossRef]
- Green MR, and Joseph Sambrook.. Molecular Cloning : A Laboratory Manual. Cold Spring Harbor, NY: Cold Spring Harbor Laboratory Press. 2012;4th ed.
Figure 1.
Demonstration of Quinazoline/Quinazolinone core moieties containing natural compounds.
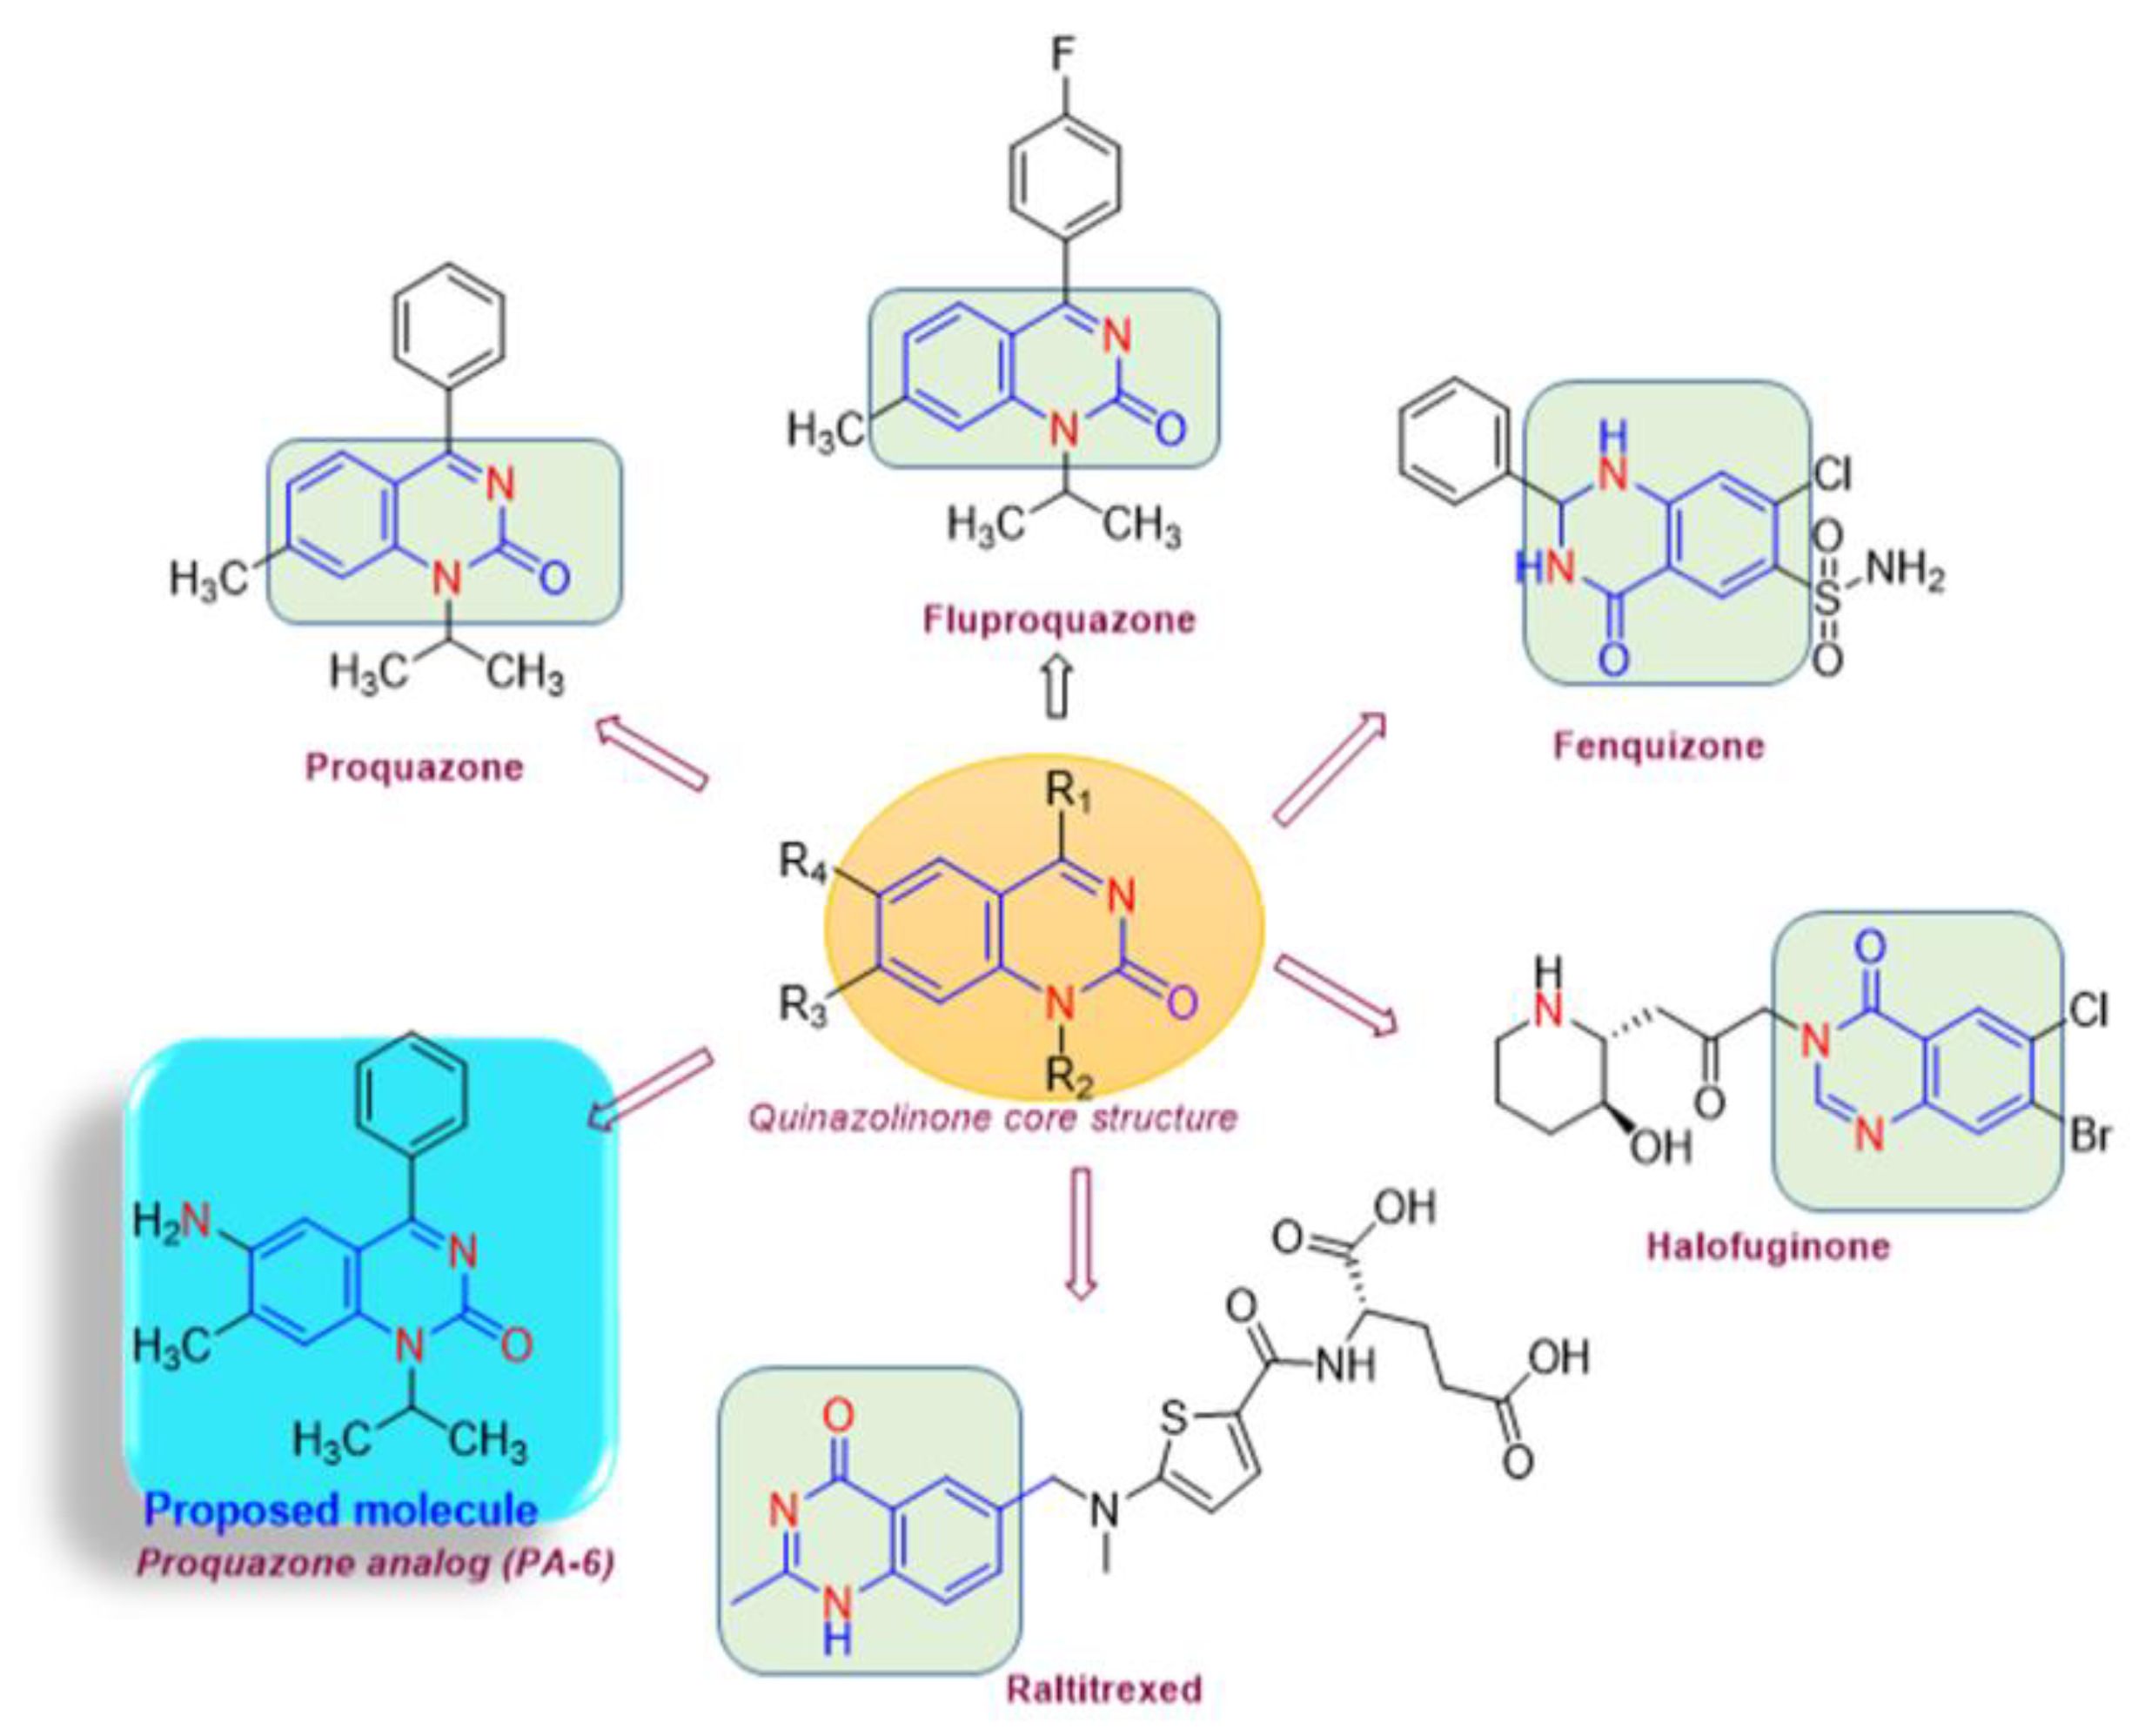
Figure 2.
Docking poses of PA-6 with target proteins: (A) PA-6 bound to HNRNPM, highlighting key interactions with Glu102, Arg70, and Arg72. (B) PA-6 docked within the MTA2 BAH domain, with Asp10 as the primary contact.
Figure 2.
Docking poses of PA-6 with target proteins: (A) PA-6 bound to HNRNPM, highlighting key interactions with Glu102, Arg70, and Arg72. (B) PA-6 docked within the MTA2 BAH domain, with Asp10 as the primary contact.
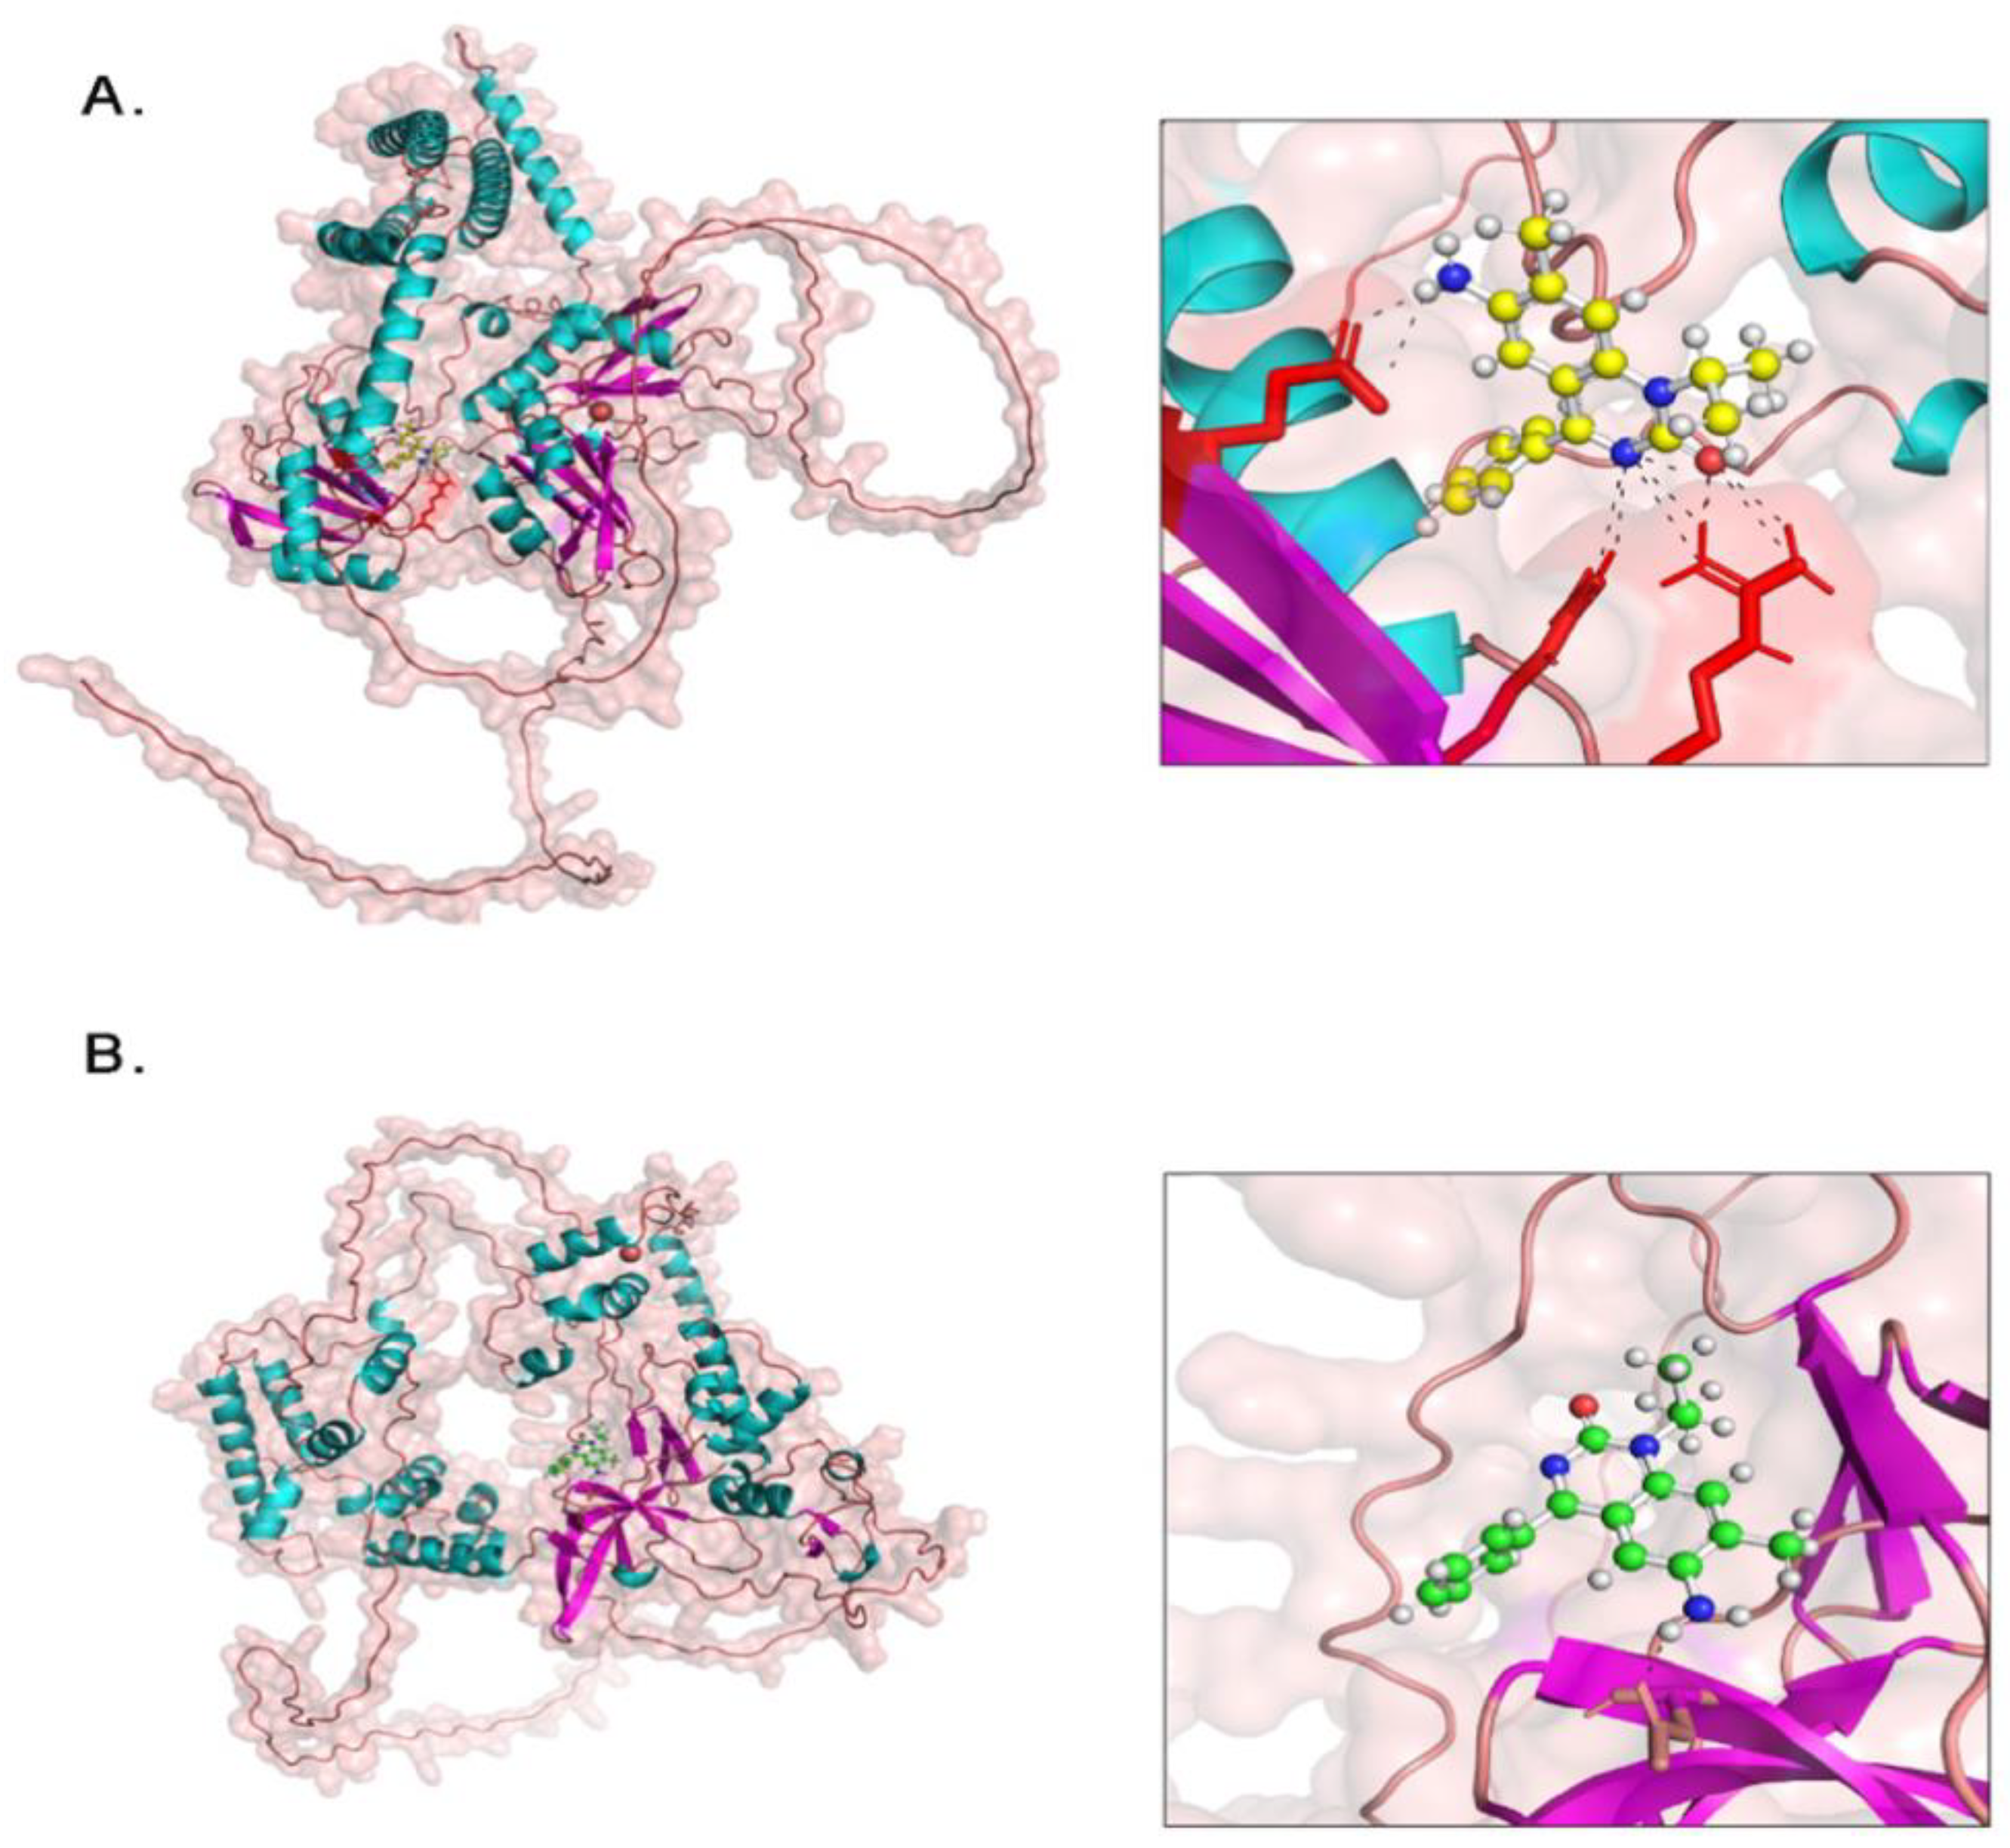
Figure 3.
Figure 3. PA-6 analog’s (Quinazolin-2(1-H)-one) effect on inhibiting leukemia cancer cell growth was evaluated by co-incubating K562 cells with varying concentrations of the PA-6 analog for 48 hours, followed by viability assessment using the MTT assay. Each concentration was tested in triplicate, and the results are presented as the percentage of treated cells compared to untreated cells. Error bars indicate the standard deviation of the mean.
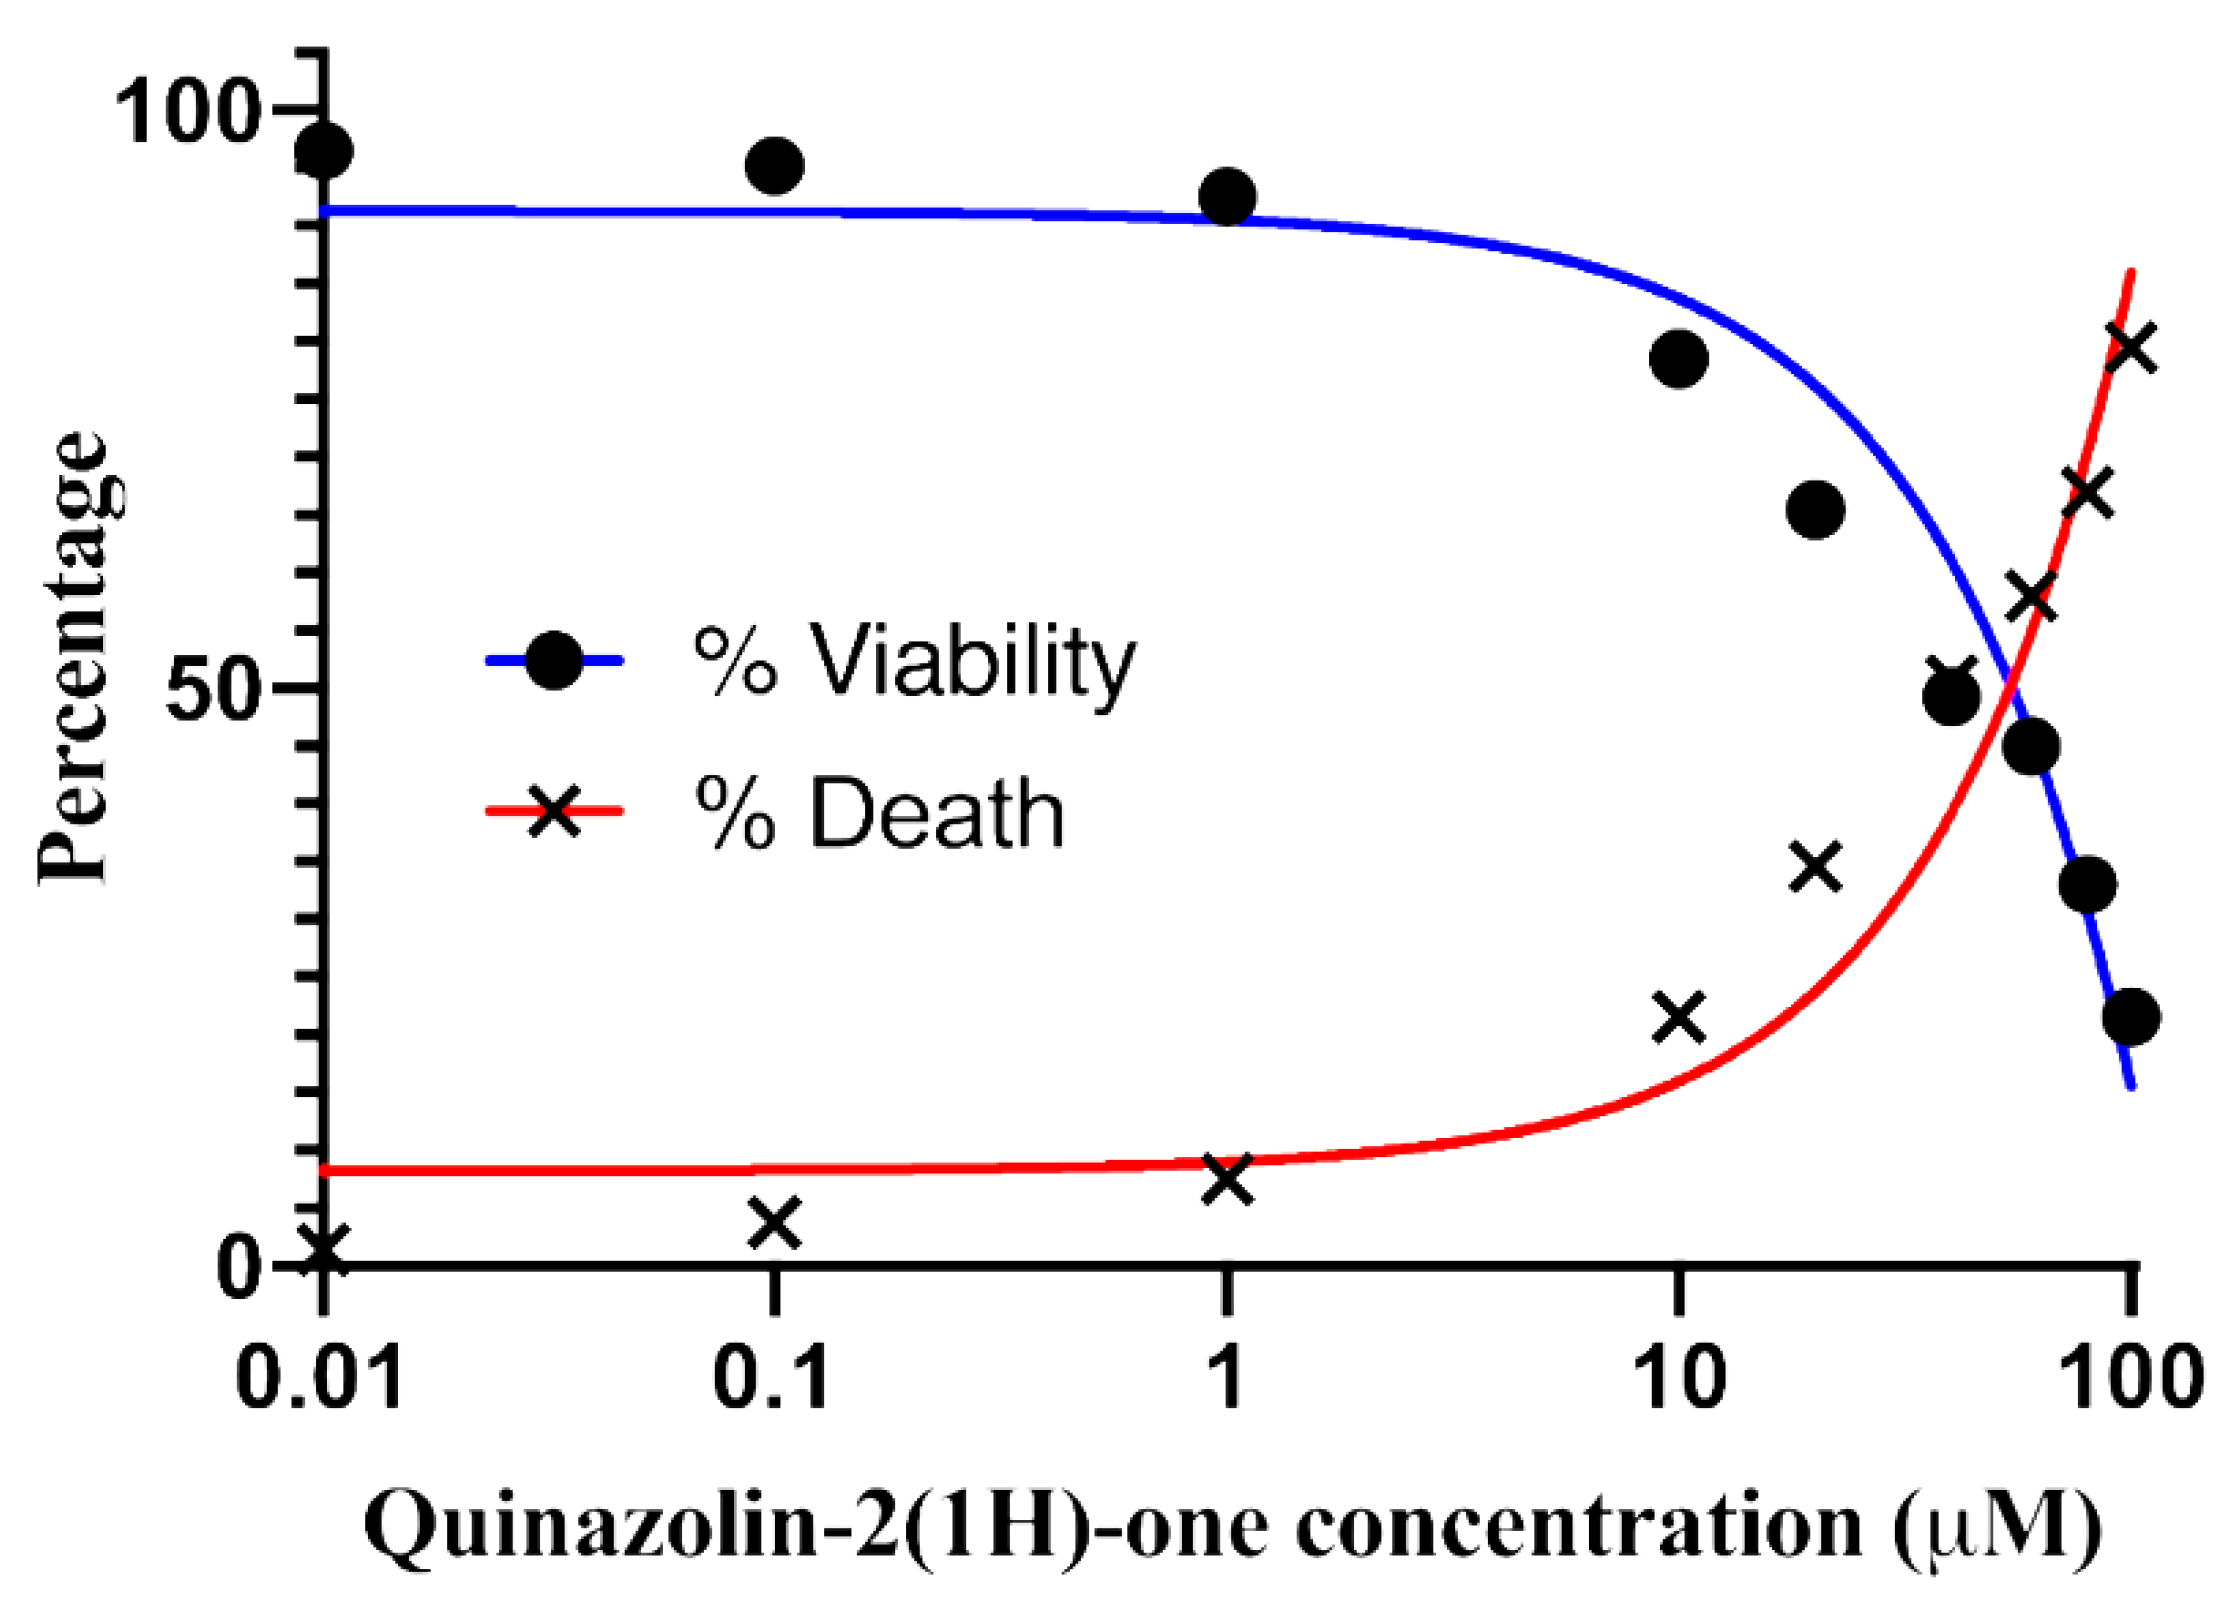
Figure 4.
Gene upregulation and downregulation: Depicts a heatmap illustrating common proteins among both up-regulated and down-regulated proteins in both conditions. The color scale represents their abundance: blue indicates negative correlation, while red indicates positive correlation. Euclidean distance metrics and the average linkage method were used for calculating distances for both rows and columns. (A) Heatmap showing common proteins among up-regulated proteins in both conditions. (B) Heatmap showing common proteins among down-regulated proteins in both conditions.
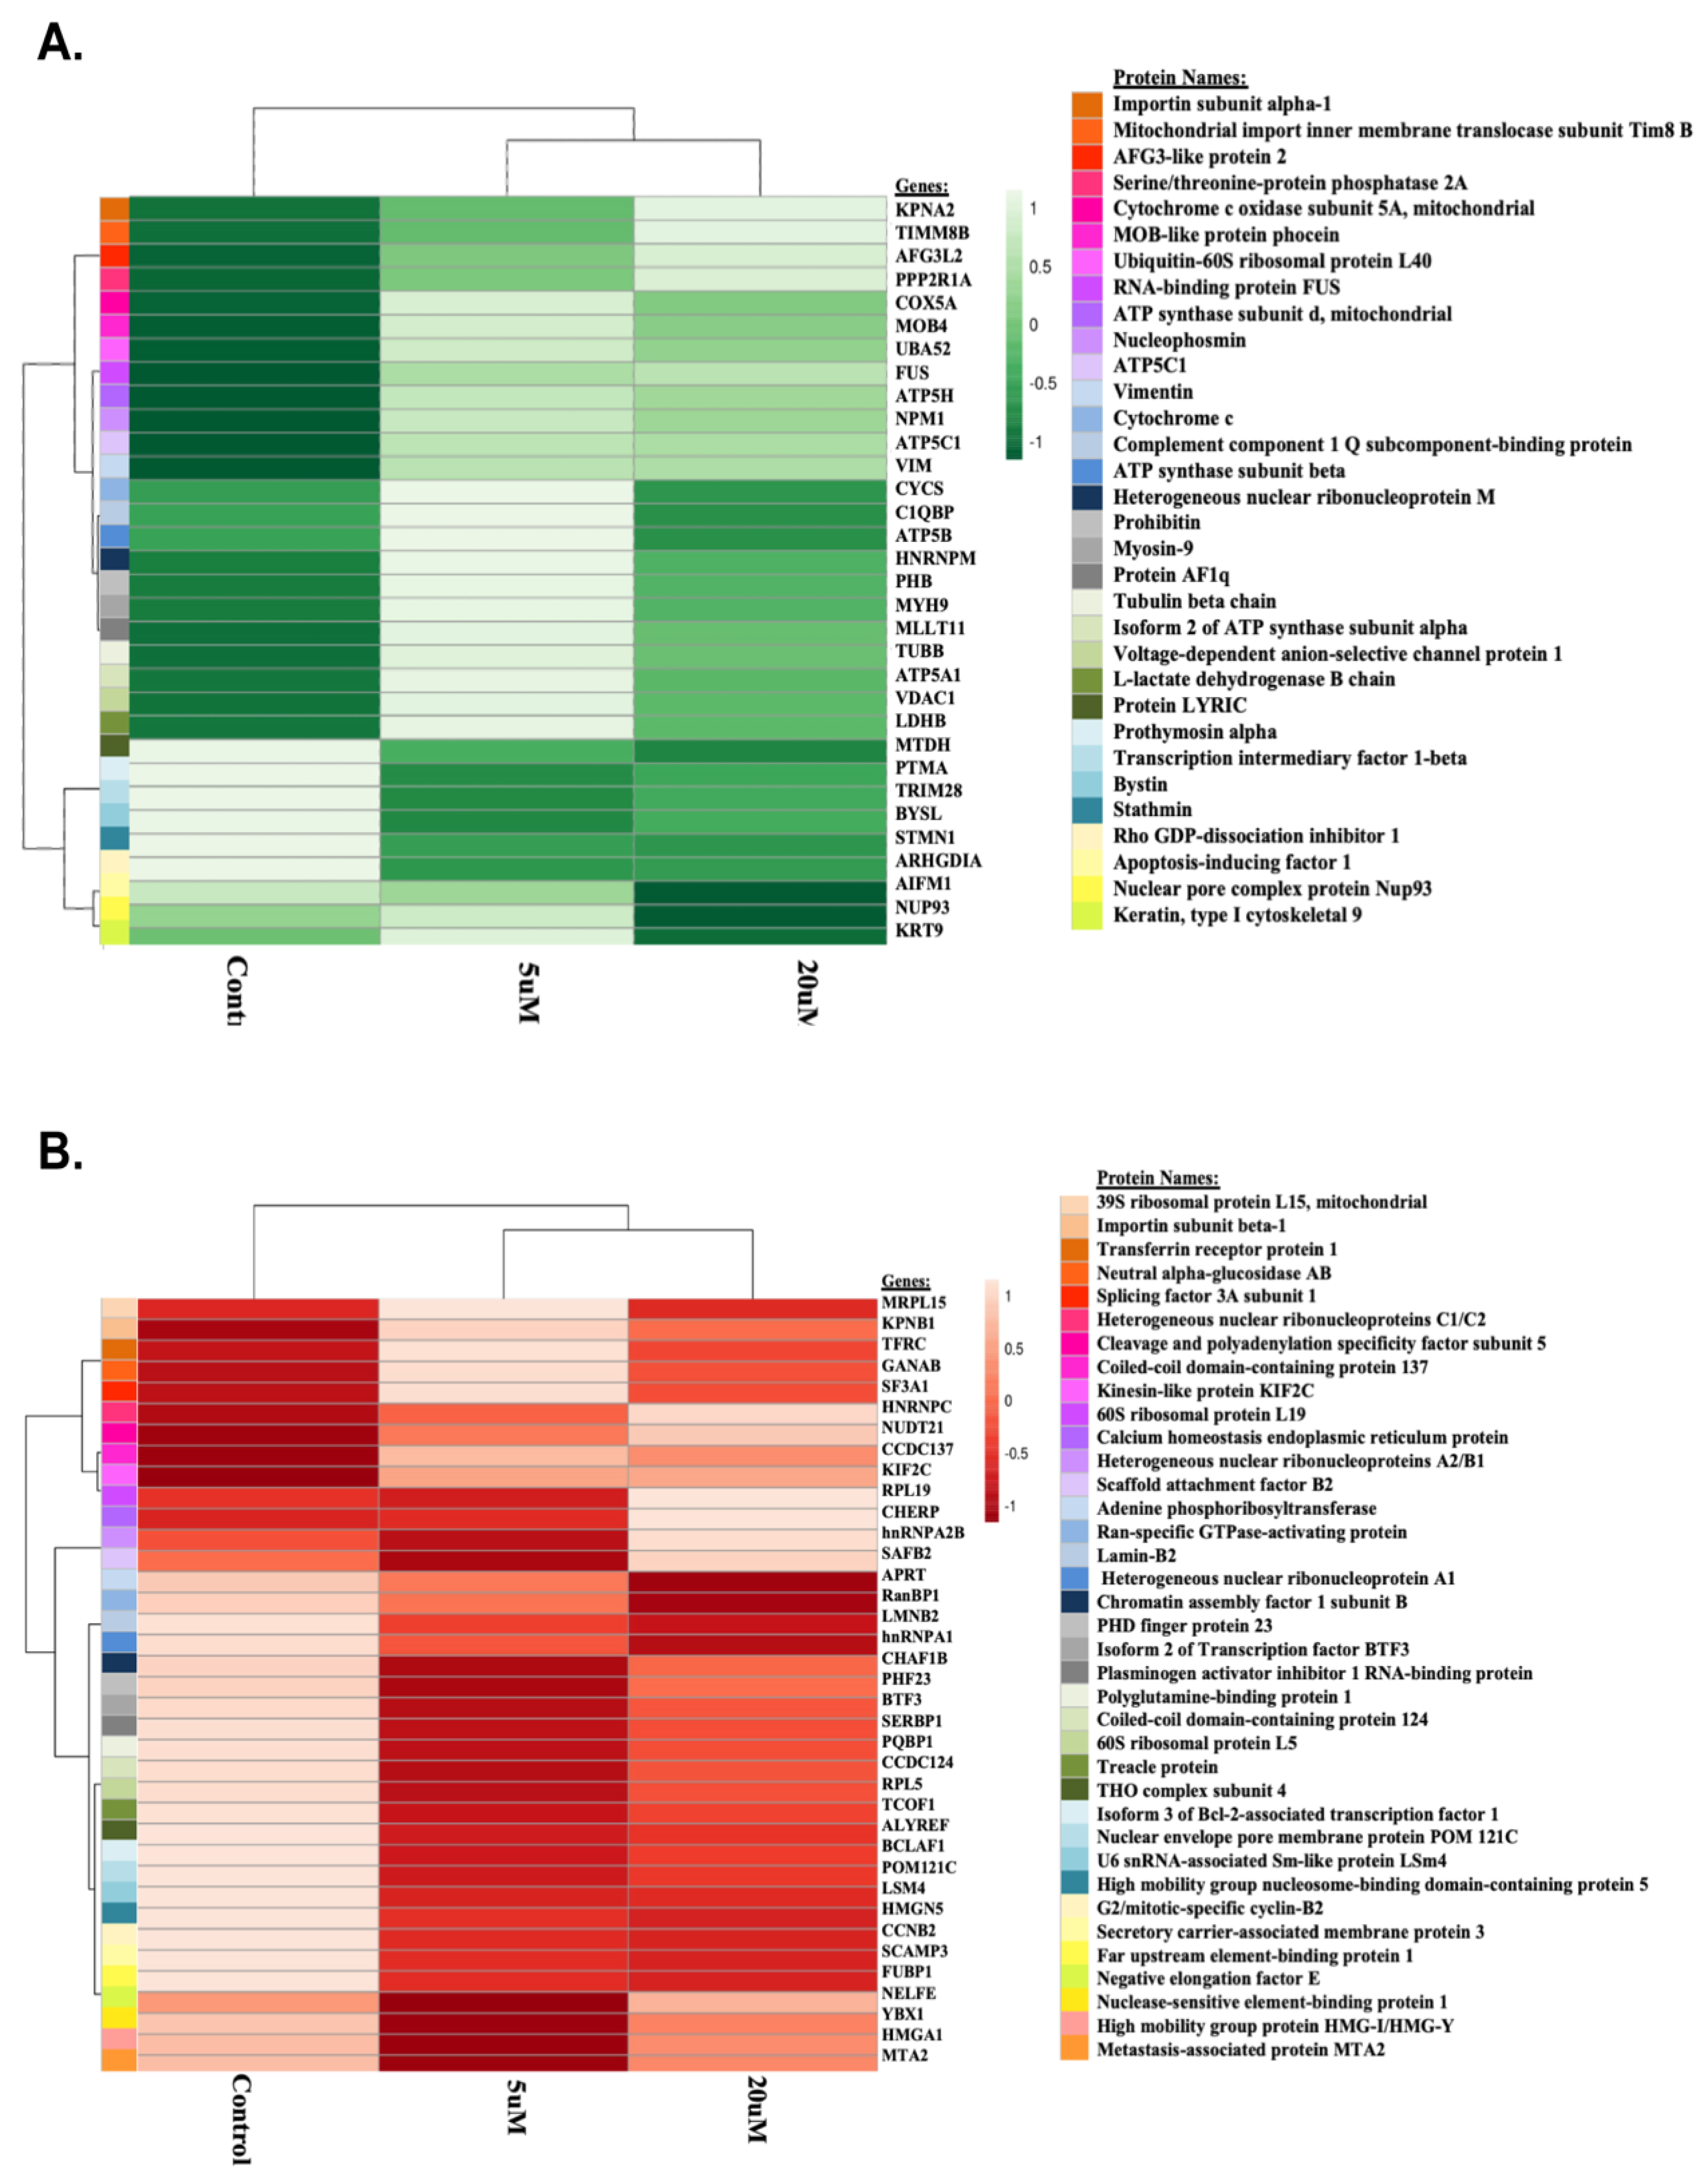
Figure 5.
Gene Ontology (GO) Classification, 5 µM PA-6 vs control: GO classification was performed to analyze the biological processes, molecular functions, and cellular components influenced by Treatment 1 (5 µM PA-6 administration compared to control) compared to the control. The dot plot visualizes fold enrichment values, where dot size corresponds to the number of proteins identified in the dataset relative to the database. (A) Dot plot of up-regulated proteins. (B) Dot plot of down-regulated proteins.
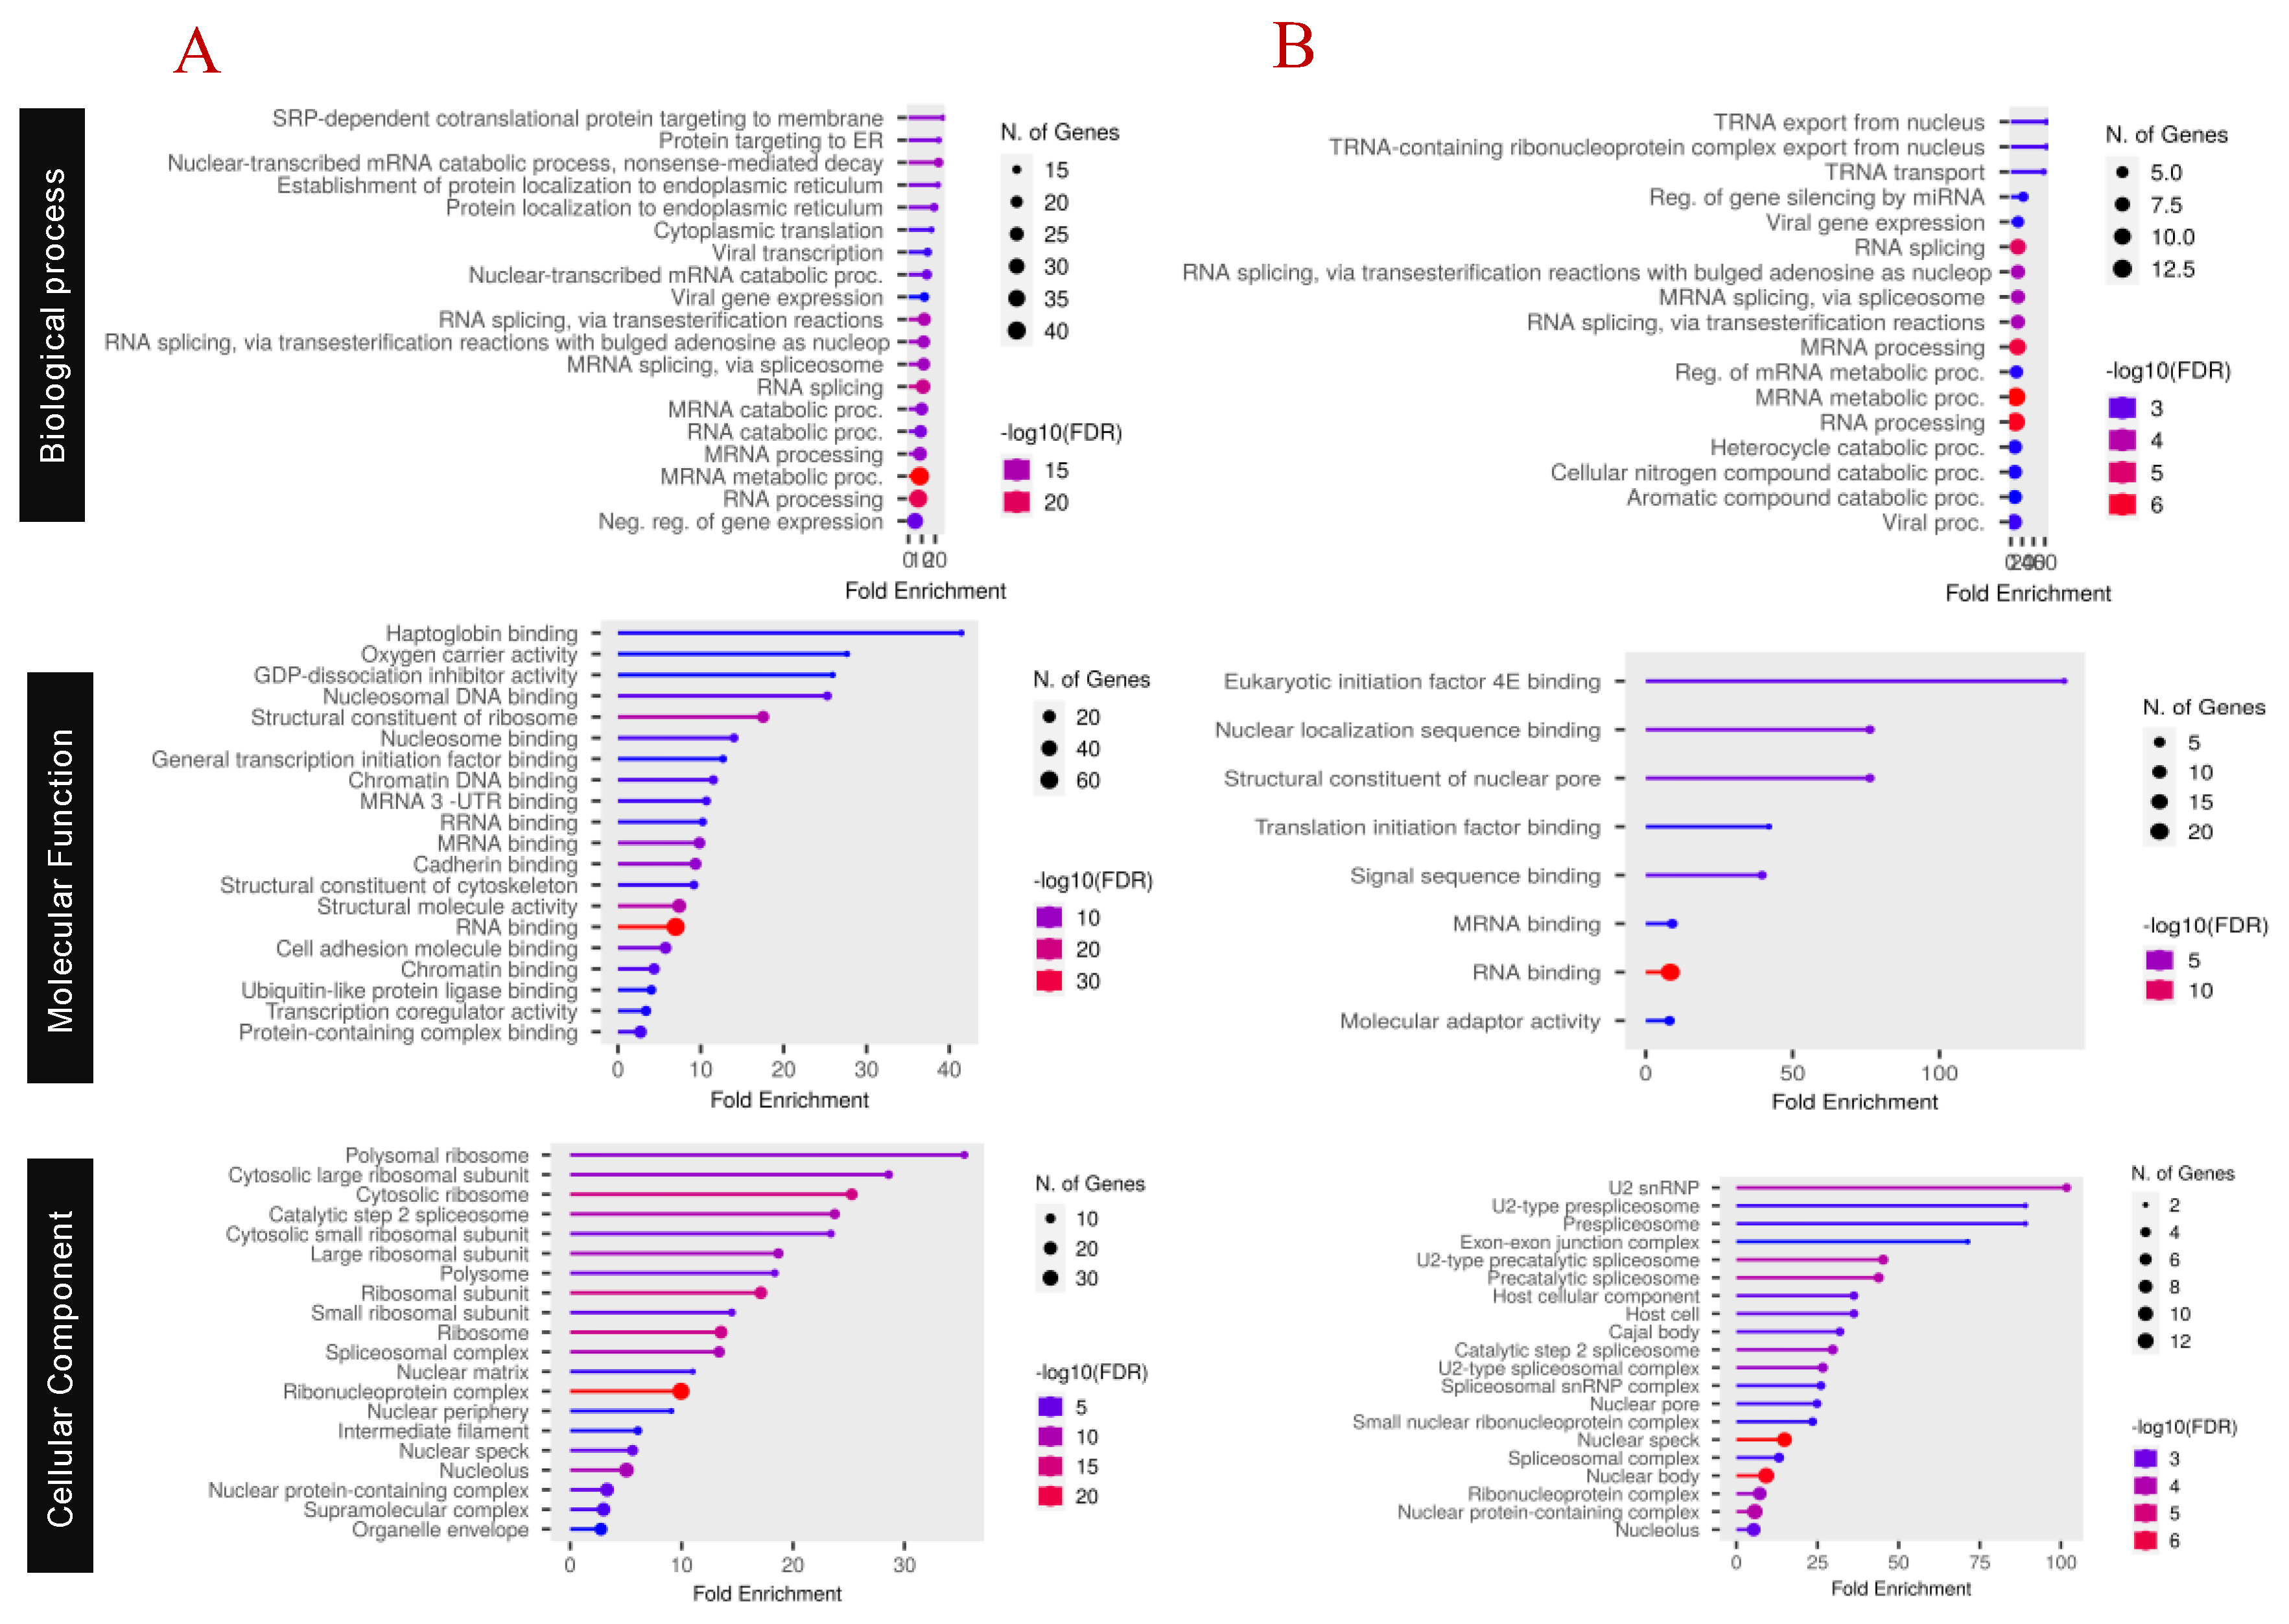
Figure 6.
Gene Ontology (GO) Classification (20 µM PA-6 vs control): This figure presents the GO classification of biological processes, molecular functions, and cellular components impacted by Treatment 2 (20 µM PA-6 administration compared to control) compared to the control. The dot plot represents fold enrichment values, with dot size indicating the number of identified proteins relative to the database. (A) Dot plot of up-regulated proteins. (B) Dot plot of down-regulated proteins.
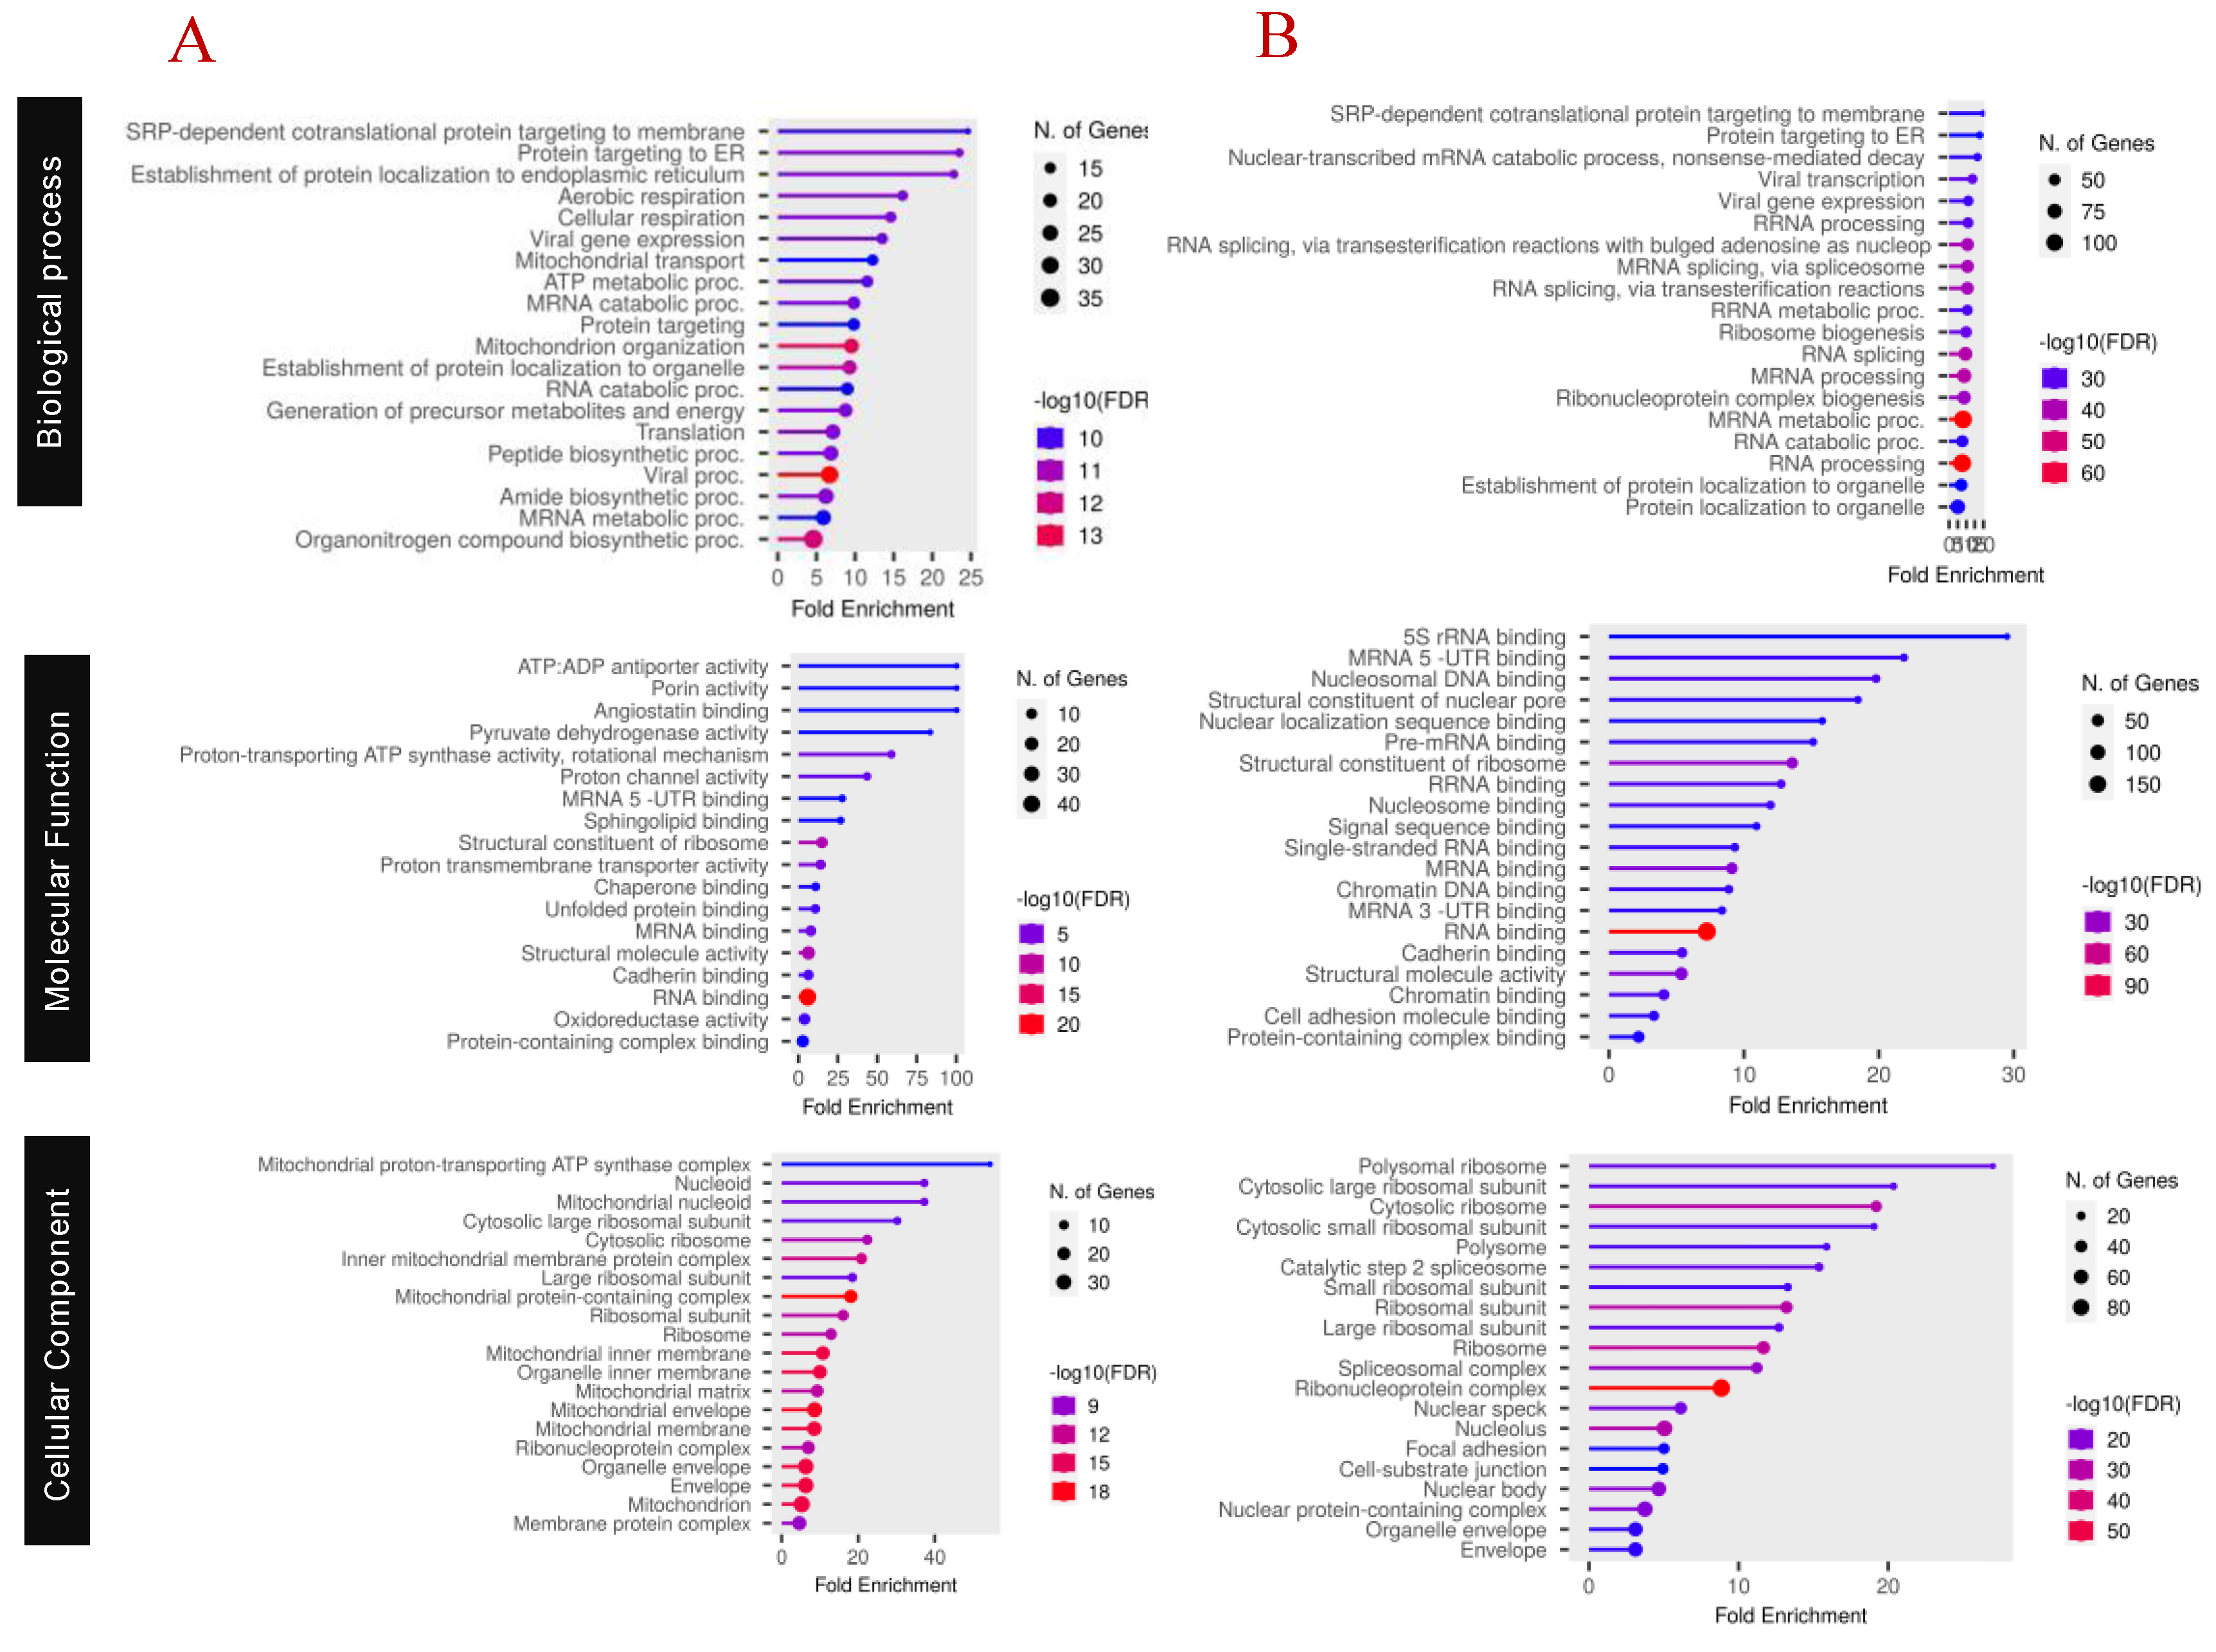

Table 1.
SwissADME PA-6 Physico-Chemical Properties.
| Parameter | Value/Prediction | Interpretation |
|---|---|---|
| Molecular Weight (MW) | ~294 g/mol | Within the optimal range for drug candidates |
| LogP (Lipophilicity) | ~2.5 | Balanced hydrophilicity/lipophilicity promotes membrane permeability and solubility |
| Hydrogen Bond Donors (HBD) | ~2 | Sufficient for specific interactions while maintaining permeability |
| Hydrogen Bond Acceptors (HBA) | ~4 | Favors interactions with biological targets without excessive polarity |
| Topological Polar Surface Area (TPSA) | ~70 Ų | Supports efficient intestinal absorption and favorable oral bioavailability |
| Rotatable Bonds | ~2 | Indicates a relatively rigid structure, which is beneficial for receptor binding |
| Gastrointestinal (GI) Absorption | High | Predicts efficient uptake upon oral administration |
| Blood–Brain Barrier (BBB) Permeability | Low | Reduces the likelihood of central nervous system side effects |
| P-glycoprotein Substrate | No | Not likely to be actively effluxed, favoring higher intracellular retention |
| Water Solubility (LogS) | ~–4.17 | Moderate solubility ensuring adequate systemic distribution |
| Cytochrome P450 Interaction | Potential inhibition of CYP2C9, CYP2C19 | May require further in vitro studies to assess metabolic stability and drug–drug interaction risk |
| Drug-likeness | Compliant with Lipinski’s and Veber’s rules | Suggests favorable oral bioavailability and overall drug candidate potential |
| Bioavailability Score | ~0.55 (predicted) | Indicates a moderate likelihood of achieving sufficient systemic exposure |
| Synthetic Accessibility | Moderate (score ~3.0) | Reflects a balance between synthetic complexity and feasibility |
Table 2.
DockThor Docking Scores of PA-6 with HNRNPM and MTA2.
| Name | Score | T. Energy | I. Energy | vdW Energy | Electrostatic Energy | Amino Acid Interaction |
|---|---|---|---|---|---|---|
| HNRNPM | -7.296 | 52.247 | -22.077 | -14.406 | -7.671 | Glu102, Arg70, Arg72 |
| MTA2 | -7.5 | 55.157 | -21.627 | -16.377 | -5.25 | Asp10 |
Table 3.
Displays specific proteins identified when comparing Treatment 1 versus Control and Treatment 2 versus Control. Proteins highlighted in green indicate upregulation, while those in red indicate downregulation.
Table 3.
Displays specific proteins identified when comparing Treatment 1 versus Control and Treatment 2 versus Control. Proteins highlighted in green indicate upregulation, while those in red indicate downregulation.
| Condition | K-means | Cluster gene count | Gene name |
|---|---|---|---|
|
Treatment 5 µM |
1 | 13 | AFG3L2, C1QBP, CYCS, KPNA2, PHB, PHB2, TIMM8B, VDAC1, VDAC2 |
| 2 | 10 | AIFM1, APOOL, ATP5A1, ATP5B, ATP5C1, ATP5H, COX5A, DLAT, HSPA9, LDHB, MDH2, MYH9, PNPT1, SHMT2, SLC25A5, SLC25A6, UQCRC1, UQCRC2 | |
| 3 | 13 | ALB, CANX, ENO1, FDXR, GANAB, HSPA5, HSPD1, LMNA, NUP93, PPIF, SEC22B, RPN1, SNAP29 | |
| 4 | 13 | EXOSC4, FAM136A, GSE1, MLLT11, MOB4, MRPL48, MRPS5, RPL12, RPL7, RPS12, RPS17, RPS7, UBA52 | |
| 5 | 10 | ERH, FUS, HNRNPM, KHDRBS1, NPM1, PLRG1, SF3A1, TFRC, VIM, XRCC6 | |
|
Treatment 20 µM |
1 | 10 | ATP50, ATP6V1F, ATP6V1G2, CCDC86, MRPL34, NDUFAF2, NDUFV3, SERPINH1, SURF6, TOR1AIP1 |
| 2 | 12 | CCDC137, CCNB1, CCNB2, H1FX, H2AFV, KRT9, MBD3, PPP2R1A, PTMA, STMN1, TPM3, TUBB | |
| 3 | 25 | BCLAF1, CLTA, DDX17, DDX5, FUBP1, HNRNPA3, HNRNPC, HNRNPF, HNRNPU, LRRC59, MPC1, NONO, PABPN1, PNN, PPP1R2, RALY, RBM14, RBMX, SART1, SFPQ, SNW1, YBX1, SRSF3, SRSF5, TRIM28 | |
| 4 | 14 | AHNAK, ARHGDIA, DDRGK1, EEF1D, EEF1E1, EFHD2, GRPEL1, KRT2, KRT8, MTDH, PRKCSH, PYCR1, RANBP1, SCAMP3 | |
| 5 | 19 | APRT, BYSL, BTF3, CWC15, EDF1, HSP90AB1, MRPL15, MRPL16, RPL19, RPL26, RPL31, RPL4, RPS10, RPS15A, RPS16, RPS26, RPS9, SERBP1, WBP11 | |
| Treatment 5 µM | 1 | 47 | AARS2, AHNAK, ANP32A, ANXA1, ARHGDIA, ARHGEF2, CAT, CCNB1, CCDC86, CCT2, CCT6A, CD2AP, CFL1, DKC1, EDF1, EEF1E1, FEN1, G3BP1, GRPEL1, HIST2H2AC, HIST2H2BE HSP90AA1, HSP90AB1, HSPB1, HSPE1, KRT8, KRT9, LMNA, MCL1, MIA3, PABPN1, PAICS, PPP1R12A, PPP2R1A, PRRC2A, SENP3, PTMA, SERPINH1, STMN1, TMSB10, TMSB4X, TPI1, TPM3, TUBA1A, TUBB, VCP, YBX3 |
| 2 | 77 | APRT, CCDC124, BTF3, CCDC137, CCNB2, CHAF1B, CHAMP1, CHMP4B, EEF1A1, EEF1D, EEF2, EMD, EXOSC3, FAU, FTSJ3, H1FX, GLTSCR2, H2AFV, HIST1H1B, HIST1H1D, HIST1H1C, HIST1H1E HMGA1, HN1, HMGN5, HP1BP3, INCENP, KIF2C, KPNB1, KRT2, LEMD2, LMNB2, MBD3, MRPL15, MRPL16, MTA2, MTF2, RANBP1, RIF1, RPF2, RPL13, RPL19, RPL24, RPL26, RPL29, RPL3, RPL31, RPL36, RPL38, RPL39, RPL4, RPL5, RPL7A, RPL7L1, RPL8, RPS10, RPS11, RPS13, RPS14, RPS15A, RPS16, RPS19, RPS19BP1, RPS21, RPS26, RPS28, RPS29, RPS3A, RPS9, SERBP1, SCAMP3, SPN, SRP14, TCOF1, TOR1AIP1, TMPO, UBA2 | |
| 3 | 50 | ARID3A, ATL2, ATXN2L, BCLAF1, BYSL, CCAR1, CEBPZ, CHD4, CHTF8, CIRBP, CLTA, DDX17, DDX18, DDX21, DDX3X, DDX5, DDX51, EXOSC10, FTH1, HDLBP, HNRNPA3, HNRNPF, HNRNPH1, HNRNPK, HNRNPU, LSR, LTV1, MPP1, NONO, NOP14, NOP2. PDCD11, POLDIP3, RABL6, RBM28, RBM3, RBMX, RSL1D1, SAMD1, SCAF11, SDAD1, SF1, SFPQ, SLTM, SRSF5, SURF6, TRIM28, ZC3H14, WBP11, ZNF207 | |
| 4 | 58 | AGPS, ALYREF, ARL6IP6, CHERP, CHTOP, CLTB, CSTF2, CWC15, EIF4H, EFHD2, FIP1L1, FUBP1, FUBP3, HNRNPA1, HNRNPA2B1, HNRNPC, IGF2R, IK, LSM14B, LSM4, MARCKSL1, MFAP1, NELFA, NUDT21, NUP133, NUP50, NUP98, PHF23, PNN, POM121C, PQBP1, PSIP1, PTBP1, RALY, RBM14, RBM17, SAFB2, SARNP, SART1, SART3, SF3B5, SLIRP, SNRPE, SNRNP40, SNW1, SRRT, SRSF2, SRSF3, SRSF6, SRSF7, SRSF9, SSBP1, STX16, TIMM9, TMEM214, TPR, YBX1, ZMAT2, | |
| 5 | 45 | AKT1S1, ATP5I, ATP5J, ATP50, ATP6V1F, ATP6V1G2, AUP1, CHCHD1, CKB, CMC1, COA4, COX4I1, COX6B1, COX6C, ETFA, DDRGK1, ETFB, HBG2, HIGD1A, IMMT, MFF, MPC1, MRPL14, MRPS23, MRPL34, MRPS31, MRPS36, MT-ATP8, MTDH, NDUFAF2, NDUFB6, NDUFS4, NDUFV3, PPP1R10, PPP1R2, PRRC2C, PRKCSH, PYCR1, PYCR2, RREB1, SON, TFAM, TIMM8A, UQCRB, ZC3H4 | |
| Treatment 20 µM | 1 | 4 | ALB, GANAB, SF3A1, TFRC |
Disclaimer/Publisher’s Note: The statements, opinions and data contained in all publications are solely those of the individual author(s) and contributor(s) and not of MDPI and/or the editor(s). MDPI and/or the editor(s) disclaim responsibility for any injury to people or property resulting from any ideas, methods, instructions or products referred to in the content. |
© 2025 by the authors. Licensee MDPI, Basel, Switzerland. This article is an open access article distributed under the terms and conditions of the Creative Commons Attribution (CC BY) license (http://creativecommons.org/licenses/by/4.0/).
Copyright: This open access article is published under a Creative Commons CC BY 4.0 license, which permit the free download, distribution, and reuse, provided that the author and preprint are cited in any reuse.


