Submitted:
08 August 2025
Posted:
13 August 2025
You are already at the latest version
Abstract
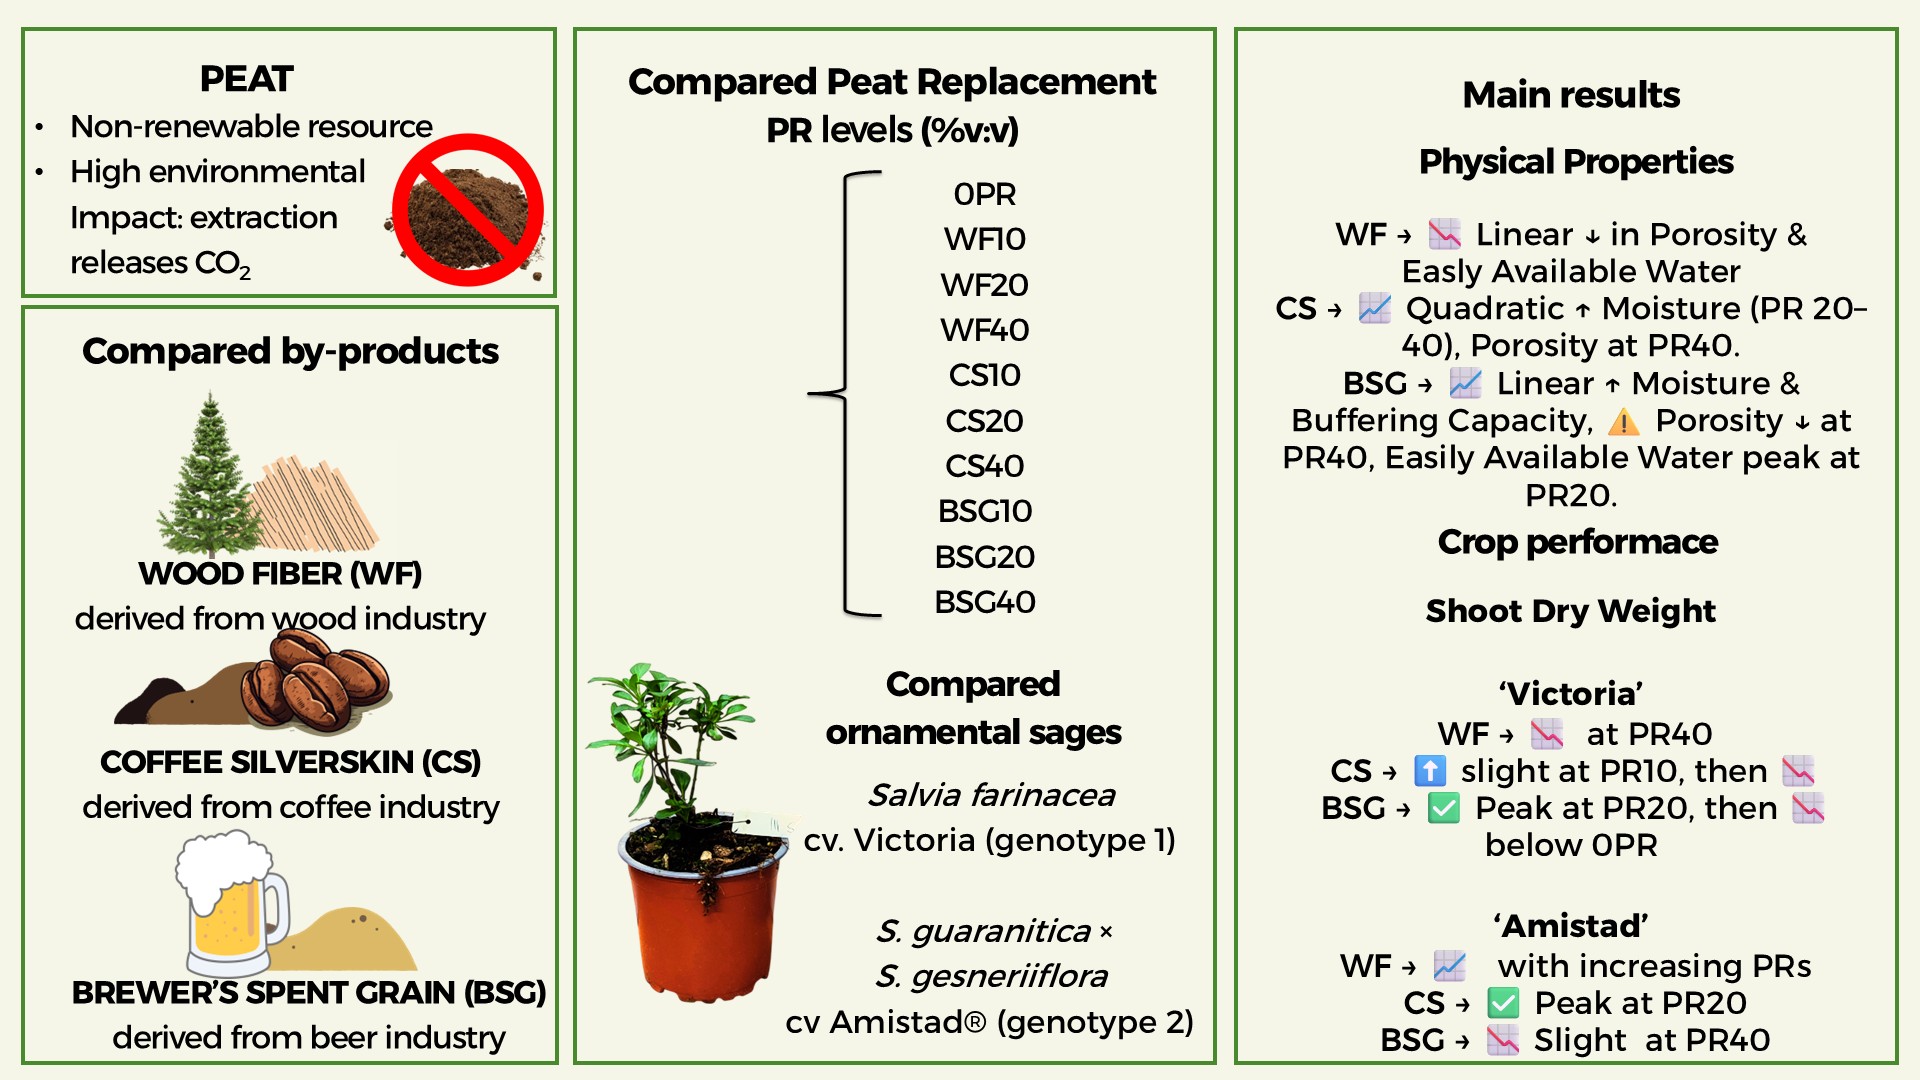
The transformation of organic by-products derived from waste into value-added resources represents a promising strategy to advance circular economy principles and bolster environmental and agricultural sustainability, especially in soilless cultivation. This study evaluates the viability of three organic by-products—wood fiber (WF), coffee silverskin (CS), and brewer's spent grains (BSG) —as partial peat replacements (PR) in horticultural substrates. Ten growing media formulations were assessed, incorporating increased doses (0–40% v/v as PR) of each alternative by-product. The effects on physical and hydraulic substrate properties, along with plant growth traits, were examined using two ornamental Salvia genotypes, ‘Victoria’ and ‘Amistad’. WF-based substrates exhibited increased porosity and diminished water retention, whereas media enriched with CS and BSG enhanced moisture availability, particularly at 20–40PR. Bulk density peaked at 40PR for both WF and BSG treatments, and at 20PR in CS-based substrates. Electrical conductivity increased in CS and BSG treatments with rising PR levels. Plant growth responses varied according to genotype and substrate composition: ‘Victoria’ exhibited greater shoot biomass and dry matter accumulation at 20PR BSG, whereas ‘Amistad’ achieved optimized growth across higher PR levels in CS and BSG growing media. Principal Component Analysis (PCA) indicated that moderate incorporation of organic by-products—especially BSG—can promote, or even improve, sage performance compared to peat-based growing media (0PR), without detriment to substrate quality.
Keywords:
brewer’s spent grain
; by-products valorization
; circular alternative
; coffee silverskin
; forestry by-product
; Lamiaceae
; potted ornamentals
; soilless cultivation
; sustainable growing medium
1. Introduction
The ornamental industry produces potted plants, growth in soilless cultivation, for their aesthetic value from a wide range of species [1], with broad agronomic practices distinguished by specific requirements in terms of substrate, which is also referred to as growing medium, being solid and porous materials of natural or synthetic origin, mineral or organic. They form the structural and functional basis for root development [2]. Schindler et al. [3] defined the growing medium as a man-made environment designed to optimize water and nutrient availability, mechanical support, and microbial interactions essential for plant growth and productivity. To fulfill these roles effectively, substrates must satisfy several key requirements. Physically, it should have a porous and stable structure to ensure adequate aeration and water-holding capacity [4,5,6]. Chemically, it must offer consistency and be free of toxic compounds [7], whereas biologically, it should support beneficial microorganisms and suppress pathogens [8]. In addition, practical attributes such as lightweight, affordability, ease of handling, and local availability are equally critical for sustainable production [9,10]. Historically, peat has served as the primary component of commercial horticultural substrates because of its superior moisture retention, structural stability, and compatibility with a wide range of crops [11,12]. Global peat extraction is estimated to be approximately 90 million m³ annually, with nearly 40 million m³ allocated to horticulture. In Europe alone, approximately 20 million tons are harvested annually [13,14]. However, growing environmental concerns, such as greenhouse gas emissions and the destruction of wetland ecosystems, have prompted regulatory action [15,16]. Countries such as the United Kingdom have announced bans on peat use in amateur gardening by 2026 and in the professional horticulture sector by 2030 [17,18]. Despite these policy efforts, the transition away from peat remains technically challenging. Commercial growers require alternative substrates that can match the performance of peat across multiple agronomic parameters without compromising crop yield or quality. In this context, one promising strategy involves the valorization of organic by-products generated by the forestry and agri-food sectors [19]. These materials, often produced in large volumes and locally available, align well with circular economy principles and offer significant potential as sustainable substrate components [20,21]. As a matter of fact, it’s expected an increase in wood fiber demand by approximately 1000% within 2050, as well as a need of roughly 65 Mm3 year-1 in new materials to cope with the growing global spread of soilless cultivations [13]. Wood fiber (WF), a domestic by-product of wood processing, is a growing material in the substrate industry, although it is usually not more than 30% (v/v) with peat [22]. As a renewable and biodegradable resource derived from products of wood manufacture, it exhibits several favorable properties for use in soilless cultivation. It has a low bulk density, good drainability and wettability, and can optimize the physical properties and reduce the weight of the growing media [7,23]. WF is a stable, pathogen-free material that could be help reduce dependence on non-renewable substrates [24], although the increasing need for biomass for energy and heat production, presents significant competition for the substrate sector in securing access to this raw material [25]. Coffee silverskin (CS), that represents 4.2% of coffee green beans' total weight, is a by-product of coffee roasting, is currently discarded as waste but exhibits several favorable properties for substrate utilization. It is lightweight, biodegradable, pathogen-free, and renewable, and may contribute functional compounds, such as antioxidants, to the growing medium [21,26]. Similarly, brewer’s spent grain (BSG), which accounts for up to 85% of brewery waste, is another abundant organic residue [27]; it consists of layers of peel, pericarp, and seeds with residual amounts of endosperm and aleurone from barley. With global production estimated at 37.2 million tons in 2021 - approximately 21–22 kg generated per 100 L of beer - BSG is microbiologically sterile post-production because of thermal processing. However, its high moisture and nutrient content make it highly perishable [28,29]. When stabilized and incorporated into substrates in small proportions (<5%), BSG may act as a biofertilizer and enhance the organic content of the medium [30]. The EU is promoting research on sustainable practices to recover high-quality resources from organic residues and by-products with the Green Deal objectives [31], Farm to Fork (F2F) Strategy [32] and the new Circular Economy Action Plan [33]. The effectiveness of any growing medium, including those incorporating organic by-products, is closely linked to its physical and hydraulic characteristics, particularly the balance between water availability and air-filled porosity. These properties are primarily influenced by the material composition, particle size distribution, and container geometry [34,35,36]. The recommended ranges for the commercial production of soilless crops are as follows: dry bulk density (BD) < 0.4 g cm-3, total porosity space (TPS) > 85%, air content (AC) 20%–30% vol, water-holding capacity (WHC) 550-700 ml L-1 20% - 30% vol and water volume at -1 kPa in the range 55–70% vol [37]. Maintaining substrates within the recommended physical property ranges [38] is expected to reduce the intensity of plant production management; however, outcomes may still vary depending on the specific cultivation practices of the growers. Assessing the similarities and differences in hydrophysical properties between forestry and beverage by-products, as well as conventional components such as peat, constitutes a crucial step in enhancing their potential as components of greenhouse growing media.
Salvia is the largest genus in the Lamiaceae family, with 1036 accepted species to date [39] widely cultivated for ornamental, medicinal, and aromatic properties [40,41] and constitutes almost one quarter of this family [42]. It is widely distributed in temperate, subtropical, and tropical regions across the globe [43]. Salvia spp. are also important ornamental plants because of their beautiful leaves, inflorescence variations, and dry and hot [44,45] or wet [46] and cold [47] hardiness. Ornamental sages are propagated asexually both in vivo [48,49] and in vitro [50]. The floriculture industry continuously strives to introduce new cultivars into the market. In this context, cultivars and interspecific hybrids among Salvia species offer the potential to exploit the extensive variability in leaf morphology, fragrance, flower color, and inflorescence architecture and also for the agronomic needs of cultivation and planting in green spaces.
Despite the great importance of the topic of partial peat replacement in growing media, in recent years, little research has investigated the species and cultivars of Salvia. Greco et al. [51] in potted S. officinalis, experimented with the use of vermicompost, compost, and solid digestate as valid peat alternatives. In S. rosmarinus, the application of 10% smoked biochar displayed a subtle stimulating effect compared to plants grown in substrates composed solely of 100% peat [52].
Many studies were focused on the role of the physico-hydraulic properties of substrates with reduced peat content on the agronomic performance of ornamental plants [53,54,55,56,57]. On the other hand, physical properties have also studied [58,59,60] to demonstrate the possibility of successfully replacing peat in the production of ornamental plants.
Building on this background, the present study evaluated the feasibility of incorporating forestry and drink industry by-products – WF, CS, and BSG – as partial peat replacement (PR) at increasing doses monitoring the growth of potted ornamental sages. The focus was on assessing their physico-hydraulic behavior and crop growth in the context of a circular, sustainable and high-performance greenhouse pot growing system.
2. Results
2.1. Physical and Hydrological Characterization

Table 1.
ANOVA results for the effects of peat replacement (PR) with wood fiber (WF), coffee silverskin (CS), and brewer's spent grain (BSG) on physical properties of the substrates assessed before cultivation. Orthogonal polynomial contrasts were employed to evaluate linear (lin) and quadratic (qua) trends. WV= Water Volume at -1 kPa; AC= Air Content at -1 kPa; SM= Substrate Moisture at -1 kPa; EAW= Easily Available Water; BC= Buffering Capacity; TAW= Total Available Water; TPS= Total Porosity Space; BD= Dry Bulk Density.
| WV | AC | SM | EAW | BC | TAW | TPS | BD | |
| Wood fiber | ||||||||
| Peat replacement (PR) | *a | ns | * | * | ns | * | *** | *** |
| PRlin | ** | ns | * | * | ns | * | *** | *** |
| PRqua | * | ns | ns | ns | ns | * | ns | ns |
| Coffee silverskin | ||||||||
| PR | * | * | *** | ** | ns | ** | *** | ** |
| PRlin | ns | ns | *** | *** | ns | *** | ns | ns |
| PRqua | ns | ns | ** | ns | ns | * | ** | ** |
| Brewer's spent grain | ||||||||
| PR | * | * | * | ** | * | *** | *** | *** |
| PRlin | ns | ns | ** | *** | * | *** | *** | *** |
| PRqua | * | ns | ns | *** | ns | *** | *** | *** |
a ns, *, **, and ***, not significant or significant at P≤ 0.05, P≤ 0.01, or P≤ 0.001, respectively.
Water volume at -1 kPa (WV) (Figure 1) was affected differently by peat replacement (PR) matrices: both wood fiber (WF) and brewer’s spent grain (BSG) substrates as peat replacement, exhibited a quadratic response; coffee silverskin (CS) did not significantly alter WV across the tested range. When WF replaces peat at 20%, as expected, the WV reaches a lower value than that of the 0PR. With BSG, at 0 and 40% PR, the WV would look the same; at 20% PR level the lowest value is reached, very similar to the one obtained with WF at 40% PR.
Substrate moisture (SM) at -1 kPa, which is a parameter close to field capacity (Figure 2) increased linearly with higher PR levels when BSG was used as the substrate for PR. In contrast, with WF, values decreased as replacement levels increased. With CS as PR, SM increased quadratically, reaching its greatest peak at doses between 20 and 40% PR.
PR generally reduced the amount of easily available water (EAW) (Figure 3), although the effect varied depending on the substrate type. With WF and CS as PR, easily available water decreased linearly as the percentage of peat replacement increased. With the BSG as PR, a quadratic response was observed, peaking at approximately 20% PR and showing a convex pattern.
The available water results (Figure 4) followed the same trend as those relating to EAW.
The buffering capacity (BC) (Figure 5) was not significantly affected when WF and CS replaced the peat. However, when using a BSG substrate as PR, the BC exhibited negative response as PR level increased.
When WF was used as the substrate for PR, the dry bulk density (BD) (Figure 6) showed a linear increase, reaching the highest value at the 40% level. In contrast, with CS and BSG substrates as PR, a quadratic response with a concave course in the CS substrate and a convex course in the BSG substrate was observed. With CS as PR, BD reached the highest value at 20%, while with BSG at 40%.
PR with wood fiber reduced the total porosity space (TPS) linearly as the PR percentage increased (Figure 7). With CS and BSG substrates as PR, this property exhibited a quadratic response, convex in the CS substrate and concave in the BSG substrate. At the 40% level, the TPS with CS as PR reached the highest value, whereas with BSG, it reached the lowest value.
2.2. Volumetric Water Content
Volumetric water content (VWC) in Figure 8 shows the behavior of the peat-based substrate at increasing percentages of WF (Figure 8a), CS (Figure 8b) and BSG (Figure 8c) as PR.
Figure 8a illustrates the VWC across varying matric suctions (0 to -10 kPa) for peat control (0PR) and wood fiber based substrates (10, 20 and 40PR). The water retention curves reveal clear and progressive shifts in hydraulic behavior as the proportion of WF increases, with significant implications for substrate water availability. At 0 kPa all substrates displayed high VWC values, with a gradual decline from 0PR (94.3%) to WF40 (92.8%). Substrates did not significantly differ for Air Content (AC) at -1 kPa, which ranged between 44.9 to 59.5%, highlighting a similar quantity of gravitational water, regardless of WF content. Differently, the Total Available Water (TAW) showed a significant decline, with the higher value (18.8%) recorded for 0PR and the lower value for WF40 (13.8%).
Figure 8b shows the water retention curves for the 0PR and CS substrates with PR of 10%, 20%, and 40% (v/v). The water retention curves show distinct changes in substrate hydrophysical behavior as CS content increases, suggesting a potential impact on water availability and substrate performance. Under saturated conditions, all substrates exhibited high VWC, with the 0PR showing the highest value (94.3%), followed by CS 40 (93.9%), CS 10 (93.1%), and CS20 (92.1%), indicating that under saturated conditions, the presence of CS did not markedly affect the total water-holding capacity (WHC). However, differences became more evident as matric suction increased. At -1 kPa, a substantial reduction in VWC was observed across all treatments. The 0PR retained 40.8% VWC, while CS 40 showed a more pronounced decline to 33.1%, highlighting reduced water retention with a higher CS level. Intermediate treatments (WF10 and WF20) exhibited moderate VWC losses (38.4 and 36.1%, respectively), consistent with their CS proportions. As tension further increased to -2 and -3 kPa, the VWC continued to decrease, with CS-based substrates consistently retaining less water than the peat control. By -5 kPa tension, the gap among treatments narrowed slightly but remained relevant. At -10 kPa, all substrates had reached the hygroscopic water range, yet differences persisted: 0PR retained the highest residual water content (22.1%), while CS40 showed the lowest (18.9%).
Figure 8c shows the water retention curves for 0PR and brewer’s spent grain-based substrates (BSG 10, 20 and 40 PR). At 0 kPa tension, all substrates demonstrated high VWC under saturated conditions: the highest value was recorded in 0PR at 94.3%, followed by BSG40 (93.9%), BSG10 (93.1%), and BSG20 (92.1%), indicating a slight initial decrease in VWC with an increasing BSG percentage. At -1 kPa tension, a sharp drop in VWC occurred across all substrates: 0PR maintained the highest value (40.8%), whereas BSG10 showed the lowest (35.1%), followed by BSG40 (42.1%) and BSG20 (45.3%). At -2 and -3 kPa tension, the decrease in VWC continued, with values consistently distributed in proportion to the CS percentage. At -2 kPa, the values were 0PR (30.1%), BSG10 (26.6%), BSG20 (36.2%), and BSG40 (35.5%). At -3 kPa, the values were 0PR (26.4%), BSG10 (23.9%), BSG20 (33.1%), and BSG40 (32.4%). At -5 kPa tension, the rate of water loss slowed down, with values of 0PR (23.5%), BSG10 (21.1%), BSG20 (29.0%), and BSG40 (30.4%). Finally, at the highest tension of -10 kPa, the differences between the substrates further narrowed, with 0PR (22.1%) maintaining the highest value and BSG10 (19.9%) the lowest. BSG20 (27.9%) and BSG40 (29.2%) exhibited significantly higher water retention.
2.2. Chemical Characteristics
Table 2 reports the ANOVA results for pH and electrical conductivity (EC) in the compared substrates. Moving on to examine some chemical characteristics of the substrates detected before cultivation, no significant effect on pH was observed following the PR with any of the substrate types. The pH values remained relatively stable across all PR levels for WF, CS, and BSG, with statistical analysis confirming no significant trends (PRns) in all cases (Figure 9).
By using WF as PR, EC initially increases slightly, reaching a peak around 10PR, before gradually declining (Figure 10). This trend is quadratic, suggesting that moderate levels of PR may briefly enhance EC, but higher levels reduce it. For CS, EC remains relatively stable at lower PRs and begins to increase more noticeably beyond 30%, following a general linear pattern. In contrast, BSG shows a strong linear increase in EC with increasing peat replacement, reaching the highest EC values at PR40 (Figure 10).
2.3. Sage’s Growth
Table 3 (cv. Victoria) and Table 4 (cv. Amistad) report the ANOVA results for growth parameters in sages at the end of the vegetative phase (January 14, 2024).
In ‘Victoria’ (Figure 11a), plant height remained relatively stable across all PR levels when WF was used as the substrate for PR. With the BSG as PR, the plan height showed a quadratic response with a slightly concave pattern. The CS substrate demonstrated similar behavior, but the quadratic trend was convex, reaching its highest height value at 20-25% PR percentages. In ‘Amistad’, the ST × PRqua interaction was not significant (Figure 11b).
In ‘Victoria’, PR generally reduced leaf number, although the effect varied by substrate type. With WF, leaf number decreased linearly as the PR percentage increased. In contrast, the CS substrate initially showed a slight increase in leaf number at PR10, followed by a clear linear decline at higher PR. The BSG substrate had the least impact, with leaf numbers remaining relatively stable across all PR levels (Figure 12a). Similar to ‘Victoria’, increasing PR in ‘Amistad’ generally reduced leaf number, with substrate-specific quadratic trends. Notably, BSG again demonstrated divergent behavior: after an initial decline at low PR levels, leaf number increased sharply to PR40, peaking at approximately 170 leaves per plant, surpassing even the 0PR (Figure 12b).
Regarding leaf area, when WF was used as the substrate for PR, it consistently increased with higher PR levels, although this effect was less pronounced than that of the other treatments. The response followed a near-linear to slightly quadratic positive trend in both genotypes, indicating that WF moderately benefited leaf area development. With a BSG substrate as PR, leaf area exhibited a quadratic response, peaking at approximately 20–30% PR in ‘Victoria’ and up to PR40 in ‘Amistad.’ The quadratic trend was convex for 'Victoria' and slightly concave for 'Amistad.’ This distinct quadratic pattern suggests an optimal PR level for maximizing leaf area in both cultivars. CS exhibited a positive trend similar to that of BSG but required lower PR levels to achieve comparable effects. In ‘Victoria’, leaf area reached its maximum at approximately PR20 before declining, whereas in ‘Amistad’ it peaked at PR30. Notably, in both cultivars, the reduction in leaf area at higher PR levels with CS underscored a consistent convex quadratic relationship (Figure 13a,b).
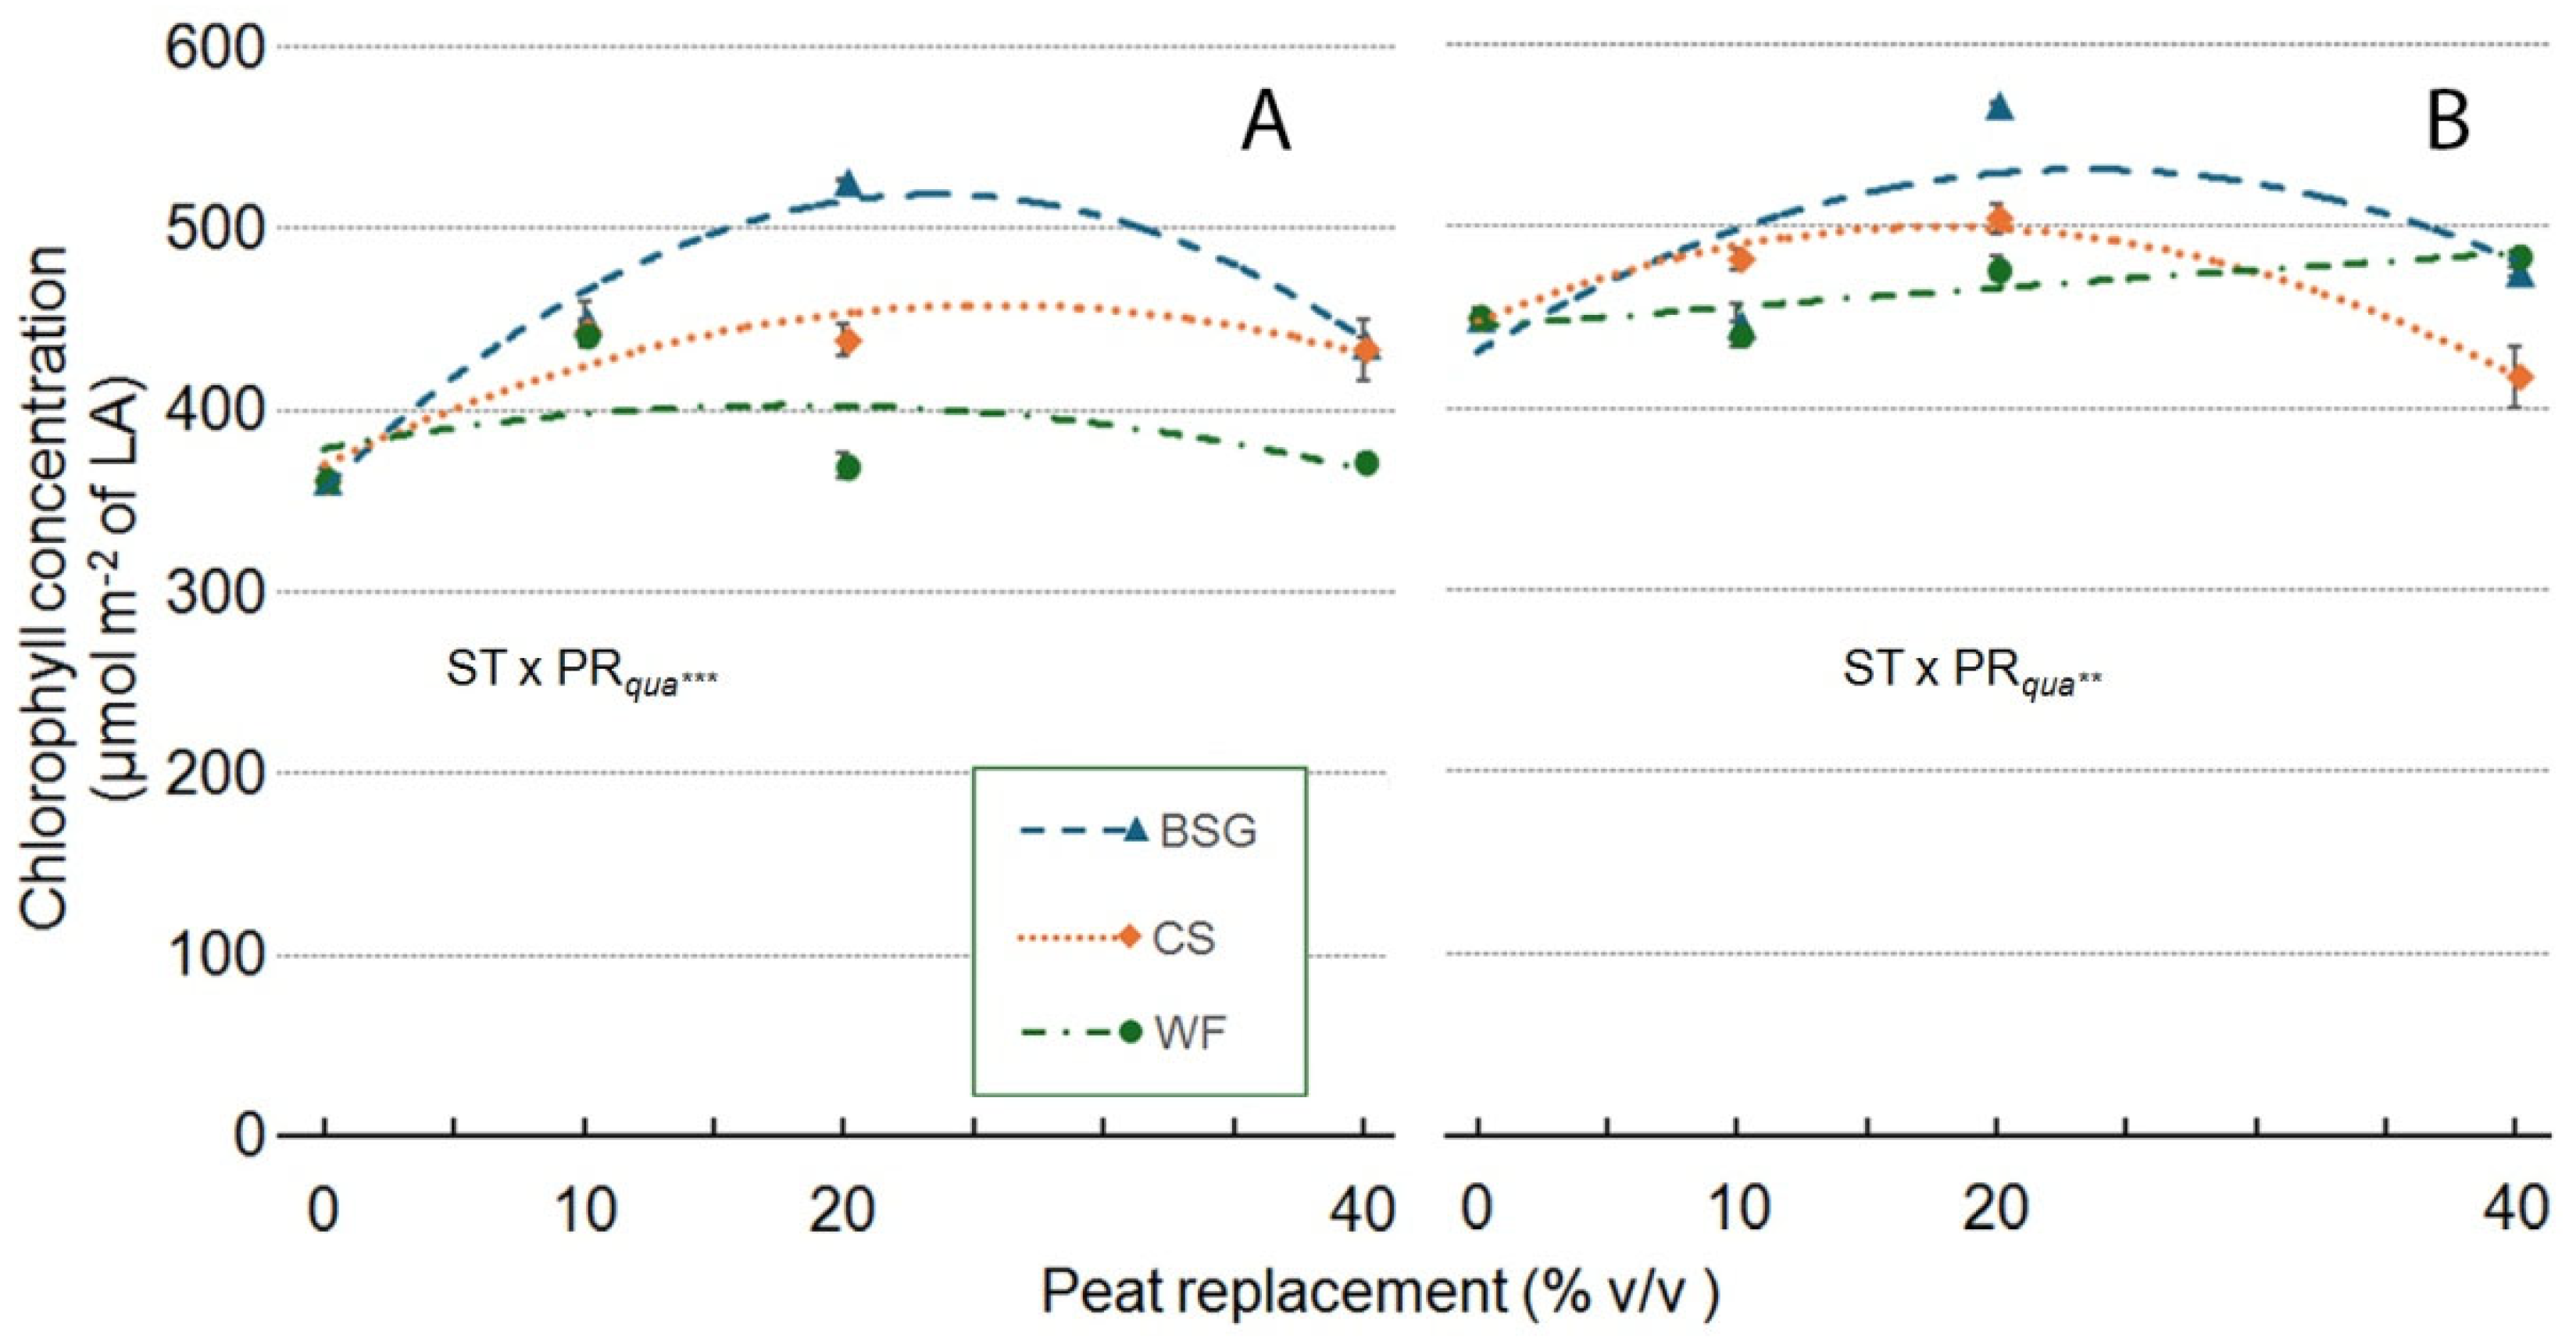
With WF as PR, ‘Victoria’ Chlorophyll Concentration (ChlC), exhibited a quadratic response, with values peaking at 20% PR before declining at higher replacement levels (Figure 14a). In ‘Amistad’, ChlC showed a slight near-linear increase as the WF proportion rose, with no observed peak (Figure 14b). With CS as PR, both genotypes reached maximum ChlC values at PR20. At PR40, the ChlC of ‘Victoria’ remained slightly above the control (0PR), while in ‘Amistad’, it dropped below control levels (Figure 16a,b). With BSG as PR, both genotypes displayed a pronounced quadratic response, with ChlC values peaking at PR20, followed by a sharp decline at higher BSG doses (Figure 14a,b).
Figure 14.
Effect of peat replacement level (PR, 0–40% v/v) with three alternative organic matrices (ST) —brewer’s spent grain (BSG), coffee silverskin (CS), and wood fiber (WF)—on Chlorophyll Concentration (ChlC) in Victoria (A) and Amistad (B) genotypes at the end of the vegetative phase (January 14, 2024). LA: leaf area. Data points represent means ± standard error (n = 3). Statistical analysis performed through ANOVA: ns, *, **, and ***, not significant or significant at P≤ 0.05, P≤ 0.01, or P≤ 0.001, respectively. Orthogonal polynomial contrasts were employed to evaluate linear (lin) and quadratic (qua) trends.
With WF substrate as PR, shoot dry weight (shoot DW) exhibited a quadratic response: in ‘Victoria’, it consistently decreased with the highest PR level (40%), whereas in ‘Amistad’, the trend was the opposite (Figure 15a,b). The CS substrate, initially, in ‘Victoria’, showed a slight increase in shoot DW at 10% PR, followed by a clear quadratic decline at higher PR levels (Figure 15a). In ‘Amistad’, shoot DW peaked at approximately 20% PR (Figure 15b). When BSG was used as the substrate for PR, shoot DW exhibited a different quadratic response: in both genotypes, 20% PR showed the highest value in ‘Victoria’, then decreased to values below the control (0PR); in ‘Amistad, shoot DW decreased slightly with 40% PR (Figure 15a,b).
Figure 15.
Effect of peat replacement level (PR, 0–40% v/v) with three alternative organic matrices (ST) —brewer’s spent grain (BSG), coffee silverskin (CS), and wood fiber (WF)—on shoot dry weight (g) in Victoria (A) and Amistad (B) genotypes at the end of the vegetative phase (January 14, 2024). Data points represent means ± standard error (n = 3). Statistical analysis performed through ANOVA: ns, *, **, and ***, not significant or significant at P≤ 0.05, P≤ 0.01, or P≤ 0.001, respectively. Orthogonal polynomial contrasts were employed to evaluate linear (lin) and quadratic (qua) trends.

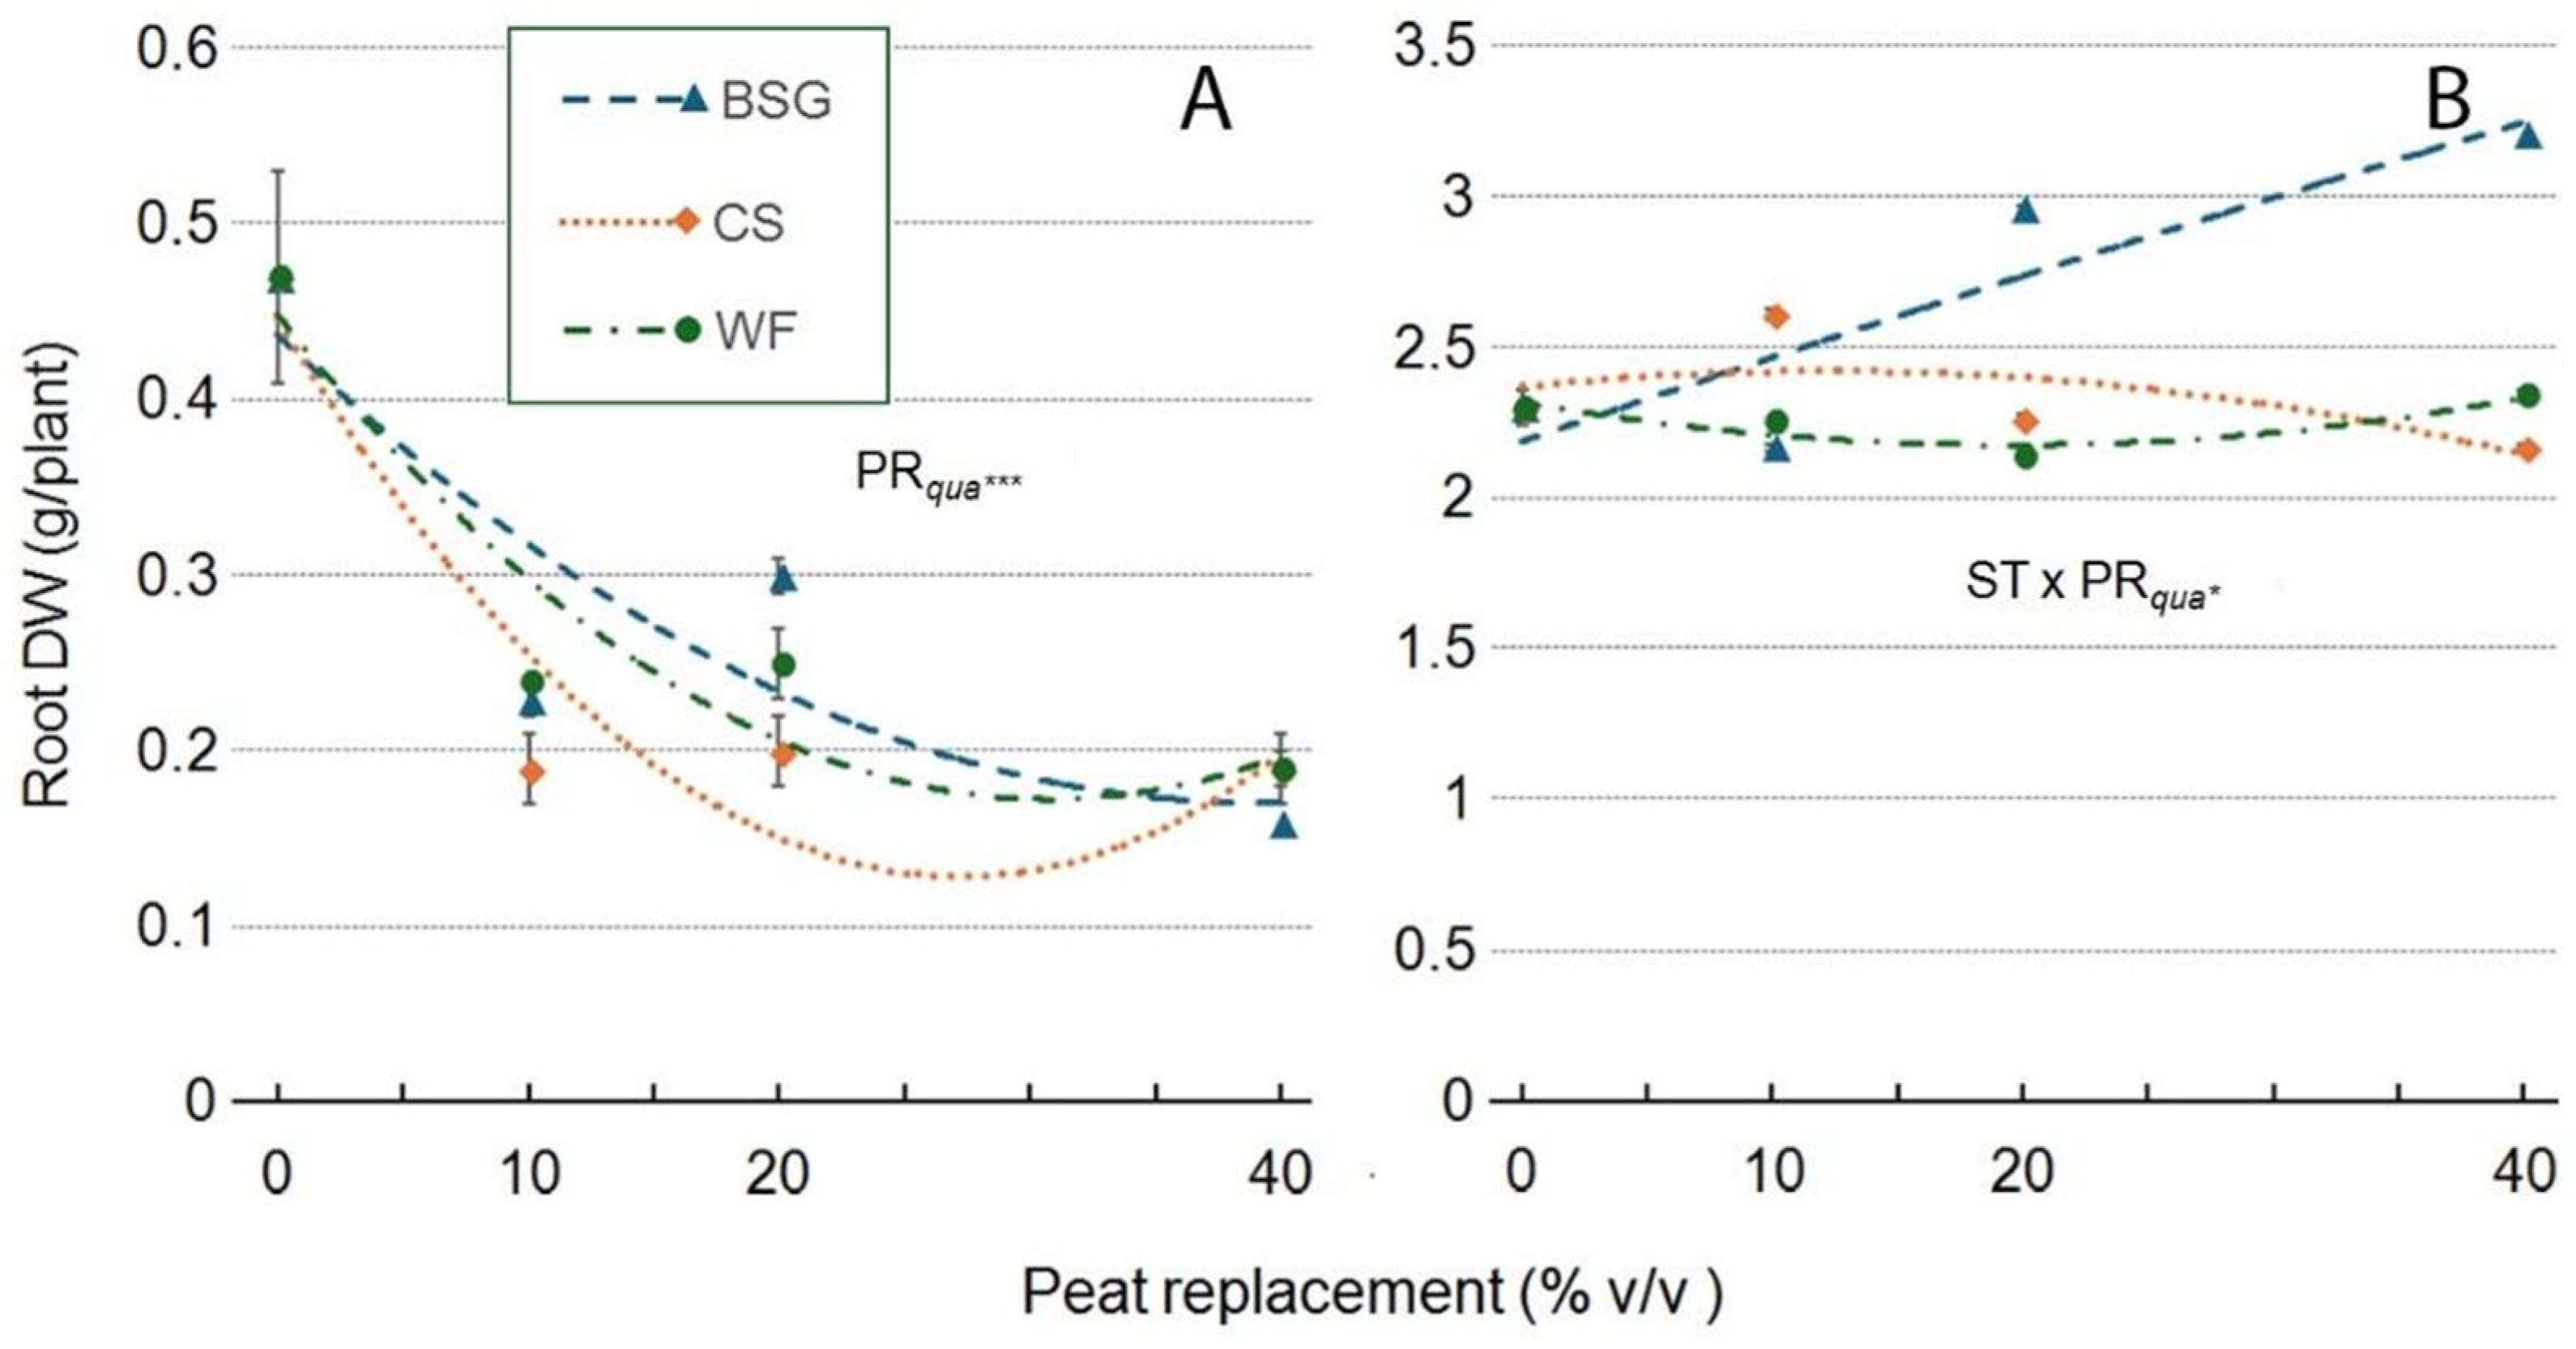
In both genotypes, root dry weight (Root DW) was significantly influenced by PR and substrate type, with notable differences between ‘Victoria’ and ‘Amistad’ (Figure 16a,b). In ‘Victoria’, root DW showed a strong and consistent quadratic decline compared with the control across all substrates as PR levels increased (Figure 16a). In ‘Amistad’, the response was substrate-dependent and varied significantly. With BSG, root DW showed a consistently positive trend, increasing with higher PR percentages and peaking at PR40. In contrast, root biomass remained relatively stable across PR levels for WF and CS, with only minor fluctuations in the latter. The significant ST × PR quadratic interaction (ST × PR qua*) suggests that ‘Amistad’ exhibits a more flexible root development response depending on the substrate used, with BSG notably enhancing root growth at higher PR levels (Figure 16b).
Figure 16.
Effect of peat replacement level (PR, 0–40% v/v) with three alternative organic matrices (ST)—brewer’s spent grain (BSG), coffee silverskin (CS), and wood fiber (WF)—on root dry weight(g) in Victoria (A) and Amistad (B) genotypes at the end of the vegetative phase (January 14, 2024). Data points represent means ± standard error (n = 3). Statistical analysis performed through ANOVA: ns, *, **, and ***, not significant or significant at P≤ 0.05, P≤ 0.01, or P≤ 0.001, respectively. Orthogonal polynomial contrasts were employed to evaluate linear (lin) and quadratic (qua) trends.
Regarding plant dry matter content (Plant DM), the ST × PR interaction was not significant in ’Victoria’ (Figure 17a,b). In ‘Amistad’, the WF substrate had a relatively stable plant DM across all PR levels (Figure 17a). In contrast, the CS substrate initially showed a clear linear decline at a 10% PR level. With BSG substrate as PR, plant DM exhibited a linear response as PR levels increased (Figure 17b).
2.4. Leachate pH and EC
Table 5 and Table 6 show the ANOVA results on the effect of Substrate type (ST) and PR on leachate pH and EC values on December 15, 2023 in ’Victoria’ and ‘Amistad’ genotypes.
In the ‘Victoria’ genotype (Figure 18a), PR with the three organic by-products generally increased the leachate pH, which showed a quadratic response for all substrates used as PR. The pH peaked with BSG as the PR40; in WF, the maximum pH peak value was recorded at PR25-30 and then decreased slightly. In CS, however, the maximum pH value was reached with 35-40PR. Similarly to the ‘Victoria’ genotype, increasing PR doses in the ‘Amistad’ genotype (Figure 18b) increased the pH level of the leachate with specific trends for each organic substrate. When WF was partially replaced by peat, the pH increased linearly with increasing PR percentage; while, when CS and BSG were used, the response was quadratic with a marked convex trend in BSG and slightly convex in CS. The maximum pH values were achieved in CS at PR40 and in BSG at PR30-35.
In the ‘Victoria’ genotype, the leachate EC value was influenced by ST, and the response was much more varied (Figure 19a). When BSG partially replaced peat, the EC of the leachate showed a consistently positive trend, increasing with higher PR percentages, reaching a peak at 40PR. In contrast, the EC values showed a quadratic response when WF and CS were used as PR. The quadratic trend was convex in CS, peaking at around 20%, and slightly concave in WF. The significant quadratic interaction ST × PR (ST × PRqua*) suggests that in the ‘Victoria’ genotype, the EC values of the leachate differ depending on the substrate used, with BSG showing higher EC levels with higher PR levels.
In the ‘Amistad’ genotype, in general, PR increased the EC values of the leachate: in CS as PR, it increased steadily with higher PR percentages until reaching its maximum at CS40. When WF and BSG replaced peat, the response was quadratic with a convex trend for both, reaching the maximum value in both WF and BSG at PR 25 (Figure 19b).
3. Discussion
3.1. Physical and Hydrological Characterization
The hydraulic properties of growing media provide precise information about their ability to provide good plant growth conditions [61,62].
3.1.1. Wood Fiber as Peat Replacement
Wood’s by-products, in the form of processed wood fractions, are tested and applied, for some time now, as promising growing media ingredients and their market has been expanded worldwide [63] due to renewability [7], reduced carbon footprint compared to peat or other materials [64]. Furthermore it has also a low production cost [65] especially for conifer by products, that show a lower phytotoxic molecule content compared to hardwood species [66]. In our results, water volume (WV) at –1 kPa, reflecting the moisture retained against minimal suction and hence indicative of easily plant-available water, exhibited a quadratic response to increasing wood fiber (WF) rates (Figure 1). This pattern is consistent with quicker drainage and higher air content (AC) [67,68,69,70] compared to peat. This behavior would appear to result from the coarser and more heterogeneous particle size distribution of WF, which accelerates drainage and reduces water retention at low tension levels [71,72]. Complementary research [54] regarding a 60:40 peat: WF blend revealed that WF exhibits hydrophilic behavior across a range of moisture contents, maintaining contact angles below 90°, unlike peat, improving rewetting dynamics under dry conditions. Substrate moisture (SM), measured at –1 kPa, declined linearly with increasing WF content (Figure 2). This contrasts with peat, which possesses superior water-holding capacity due to its high surface area and microporous structure [13]. The reduced moisture in WF-based media reflects its lower capacity for capillary water retention and is consistent with findings by Gruda [7] , who noted a faster drying rate in WF-amended substrates. Both easily available water (Figure 3) and available water (Figure 4) demonstrated a linear decline with increasing levels of wood fiber. While peat typically holds large volumes of water in the range of –1 to –10 kPa—considered optimal for plant uptake—WF was less effective in maintaining this fraction, resulting in a lower easily available water value. Fields et al. [73] found that blends containing pine wood chips or shredded pine wood exhibited steeper moisture retention curves, indicating a sharper decline in volumetric water content (WVC) as suction increased. Pure wood substrates displayed higher drainage rates and reduced retention in the -1 to -30 kPa range. These findings reinforce that wood components have lower water-holding capacity (WHC) and faster drying tendencies than peat blends. Paradelo et al. [74] and Atzori et al.[23] explain this behavior: WF substitution often leads to reduced water availability due to diminished micropore volume and lower capillary retention. According to Michiels et al. [75], an ideal substrate has less easily available water of <40vol%. The values of all WF-based substrates for nursery production were within the range of an ideal substrate, suggesting that they can be effectively integrated without severely compromising substrate functionality. Unlike other peat substitutes, such as coffee silverskin (CS) or brewer’s spent grain (BSG), WF did not significantly affect buffering capacity (BC) (Figure 5). The inherent lignocellulosic structure and minimal nutrient content of WF may contribute to its low interaction with substrate pH and nutrient fluxes, corroborating Zaccheo et al. [24]. A linear increase in dry bulk density (BD, Figure 6), accompanied by a corresponding linear decrease in total porosity, a key determinant of air–water balance in container media (Figure 7), was observed with increasing levels of WF replacement. While peat possesses a naturally spongy and lightweight structure [76], WF—although also lightweight—contains more rigid particles that may compact under load, thereby reducing pore volume [5]. Despite these changes, dry BD values remained within the acceptable horticultural range (<0.4 g·cm⁻³), indicating no significant risk of substrate compaction. The water retention profiles (Figure 8a) further illustrated that increasing WF content led to a steeper decline in volumetric water content (WVC) at increasing tensions. While the control 0PR maintained higher WVC across all tensions, the WF-based substrate (especially at 40% of peat replacement) exhibited more rapid water loss between -1 and -5 kPa tension This underscores the limited capillary continuity and weaker water-holding ability of WF, consistent with findings from Gruda and Schnitzler [68]; Wallach [2] and Muhammed et al. [36]. Eveleens et al. [77] too, when they added 40 and 50% v/v WF to peat, showed that these substrates reduce WVC by 16% v/v and increase AC by the same amount in the range of -6 to -100 cm pressure head. Our results regarding the water retention curves (Figure 8a) reflect the lower capillary water retention capacity in substrates with higher WF replacement level. WF's coarse texture and lower micropore volume limit its ability to retain water against even modest tension, consistent with prior findings [54,73,77]. The smaller differential at high tension suggests that WF substitution primarily affects water availability within the plant-easily available range (–1 to –5 kPa), while the residual water at high tension remains similar across media types. Our findings are in line with previous studies showing that high proportions of WF (>30%) significantly reduce easily available water (EAW) and total available water (TAW) due to increased macroporosity and limited fine-pore storage [7,70]. Notably, Michel et al. [54] reported that while WF improved rewetting dynamics, it did so at the cost of moisture retention in the root-active zone. Regarding chemical characteristics as pH and electrical conductivity (EC) are two important factors affecting the growing medium due to the direct effect on nutrient availability and status in the growing medium [78]. In our research pH value in WF based substrate vas n.s. (Figure 12), that agrees with Woznicki et al. [79] that reports that substrates with over 50% (v/v) WF showed a rapid pH increase.
3.1.2. Coffee Silverskin as Peat Replacement
In our study the proportional peat replacement (PR) with CS underscores a potential decline in capillary WHC due to the inclusion of CS. References reported that CS has a high content of recalcitrant lignocellulosic compounds that contribute to bulk and physical structure in substrates [80,81]. Other authors [82,83] have linked the WHC of CS alone, to the soluble fiber content. The physical behavior of substrates incorporating CS is strongly influenced by its unique particle morphology. As reported by Miler et al. [26], the flat and delicate flake-like structure of CS, in contrast to more fibrous peat or WF, contributes to increased compaction within the substrate matrix. This morphological trait hinders the optimization of the water–air balance, a key determinant of substrate performance. Although CS exhibits low BD, its limited structural resilience may reduce pore continuity and restrict gaseous exchange in the root zone. This is consistent with previous findings that link excessive substrate compaction and insufficient macroporosity to reduced oxygen availability and impaired root respiration [76,84]. Similar trends have been observed with other finely textured or plate-like organic materials, which often exhibit poor structural stability under cultivation conditions [85,86]. Consequently, substrates with high CS content may limit root zone aeration, potentially compromising plant growth and quality.
3.1.3. Brewer’s Spent Grain as Peat Replacement
To date, no studies have comprehensively characterized the physical-hydrological properties of growing media formulated with BSG, highlighting a significant gap in the current literature. In contrast, existing research on the raw material itself provides some foundational insights. For instance, Naibaho et al. [87] reported bulk density values for BSG ranging between 0.129 and 0.159 g cm⁻³, while Castro and Colpini [88] documented a consistently high moisture content, typically between 78% and 84%. This substantial water content is primarily attributed to the structural and compositional characteristics of BSG. The fibrous matrix is notably rich in cellulose, hemicellulose, and lignin—components that enhance water retention through both hydrogen bonding and capillary entrapment mechanisms. Among these, hemicellulose is particularly hydrophilic, enabling substantial water adsorption within the porous network of the BSG [89]. Furthermore, the mashing process in brewing, which partially disrupts plant cell walls, increases the porosity and specific surface area of the biomass, thereby improving its WHC [90]. In addition to structural polysaccharides, residual proteins and gelatinized starch fractions present in BSG may contribute to moisture stabilization by forming hydrated matrices that interact with water molecules [91].
3.2. Chemical Characteristic
The chemical stability and ionic activity of growing media are pivotal factors influencing plant performance in containerized horticultural systems. Among the key physicochemical parameters, pH and EC serve as critical indicators of substrate suitability, directly affecting nutrient solubility, microbial dynamics, and root development. Across all tested PR levels (10–40%), no statistically significant variation in pH was observed for WF, CS, or BSG treatments (Figure 9). This pH stability underscores the dominant BC of peat, which remains effective even when partially substituted with organic residues [92]. The lignocellulosic nature of WF and CS contributes to their low acid dissociation potential, thereby exerting minimal influence on substrate pH. Although BSG is rich in proteins and amino acids, its limited mineralization before cultivation likely delays any acidifying effects, further supporting pH consistency across treatments. In contrast, EC exhibited substrate-specific and dose-dependent variability (Figure 10), reflecting differences in soluble salt concentrations and organic matter decomposition rates. Notably, BSG treatments demonstrated a strong linear increase in EC with rising replacement levels, reaching the highest values at 40%. This trend is attributed to the elevated concentrations of organic nitrogen, phosphorus, and potassium in BSG, which undergo rapid mineralization and contribute to increased ionic activity in the substrate [93].
3.3. Principal Component Analysis (PCA) in Growth Parameters
The principal component analysis (PCA) provided an overview of the bio-morphological traits of ‘Victoria’ and ‘Amistad’ sage genotypes (Figure 20a,b and Figure 21a,b).
The PCA performed on the normalized ‘Victoria’ data revealed three principal components (PCs) with eigenvalues that explained approximately 97.6% of the total variance in the dataset, attributing 81.8% to PC1 and PC2. In the depiction of components 1 and 2 (Figure 20A), most of the variables were positively correlated with PC1, specifically leaf number (0.51) and area (0.47), chlorophyll concentration (0.50) and shoot dry weight (0.50). Root dry weight (Root DW) and plant height were negatively correlated with PC1. PC2 positively correlated with shoot dry weight (Shoot DW) and particularly root DW (0.75). Negative correlation with PC2 was detected mainly for plant height (-0.60). The PC3 (Figure 20b) showed a positive correlation mainly with plant height (0.66) and a negative correlation with leaf area (-0.44). The first two PCA components (Figure 20a) enable the distinction between mixtures with PR10 of both BSG and CS, and those with PR20 of BSG. The latter, located in the first quadrant (upper right), clustered according to shoot DW. While for BSG10 and CS10 mixtures (lower-right quadrant) clustering was driven by leaves number and area and chlorophyll concentration (ChlC). These findings, confirming the ANOVA analysis, could be related to the nutrient availability of BSG, which is rich in organic matter, proteins, nitrogen, phosphorus and micronutrients. At PR20, BSG may provide an optimal nutrient balance that enhances shoot development without causing substrate compaction or nutrient imbalance. Furthermore, moderate inclusion of BSG can improve aeration, water retention, enhance water availability, supporting shoot expansion and leaf development compared to 0PR. The ‘Victoria’ genotype may be particularly responsive to the nutrient profile or physical properties of BSG at this concentration suggesting their successfully use in the cultivation. Located on the left upper side of the PC1 component, WF20 and mainly peat displayed a high correlation with root DW, while other mixtures (left lower side) mainly improved the plant height. WF20 could create a more oxygen-rich rhizosphere, encouraging root elongation and biomass accumulation; on the other hand, BSG may release nutrients more rapidly, favouring shoot elongation and vertical growth rather than root expansion. Peat-based substrates consistently yield higher or comparable root DWs and overall plant growth, especially when compared to high-percentage WF or alternative organic amendments [94,95,96]. Furthermore, PC3 separated BSG20 for leaf area, with peat (0PR), CS20 and WF10 clustering for root DW and plant height (Figure 20b). In general our results show that in ‘Victoria’, 0PR clustered distinctly, reflecting optimal growth conditions. When included at moderate levels (10–20 PR), WF maintains structural stability and high macroporosity, supporting strong root aeration and growth [68], alignment with WF10-20 closeness to control in PCA. At higher proportions (WF40 as PR), excessive porosity may reduce water retention and nutrient availability, echoing the PCA displacement toward less favourable axes [85,86]. The flake-like, delicate morphology of CS leads to high compaction and poor air-filled pore space, despite low BD—consistent with PCA clusters for CS20 and CS40 located far from growth vectors [26,80]. High recalcitrant lignocellulose content may immobilize nitrogen and slow decomposition, further contributing to poor plant performance at higher inclusion rates [97]. With moderate hydrophilic fiber content, BSG10-20 PR occupy intermediate positions in PCA space, offering improved moisture retention without severe structural issues [89,90]. However, high BSG PR (BSG40) may lead to compaction, rapid microbial decay, and salinity buildup—explaining its divergence in PCA from positive growth traits [98].
The PCA performed on the normalized ‘Amistad’ data revealed three PCs with eigenvalues that explained approximately 75.3% of the total variance in the dataset, attributing 69.1% to PC1 and PC2. In the depiction of components 1 and 2 (Figure 21a), leaf area (0.52), ChlC (0.47), shoot (0.56) and root DWs (0.43) were positively correlated with PC1. PC2 positively correlated with plant height (0.64) and leaf number (0.59).
The PC3 (Figure 21b) positively correlated mainly with leaf number (0.61) and leaf area (0.43), while negatively correlated with leaf ChlC (-0.53) and plant height (0.39). The first two PCA components (Figure 21a) allow for the distinction of mixtures PR at 10-20 CS, and 20-40 BSG. The BSG20 and BSG40, located in the first quadrant (upper right), clustered according to root DW and ChlC. These findings could be related to nitrogen availability, thus richness in organic nitrogen and amino acids, which can stimulate root development, chlorophyll biosynthesis [99] and photosynthetic capacity [93]. In contrast for CS10 and CS20 PR (lower-right quadrant), clustering was driven by leaf area and shoot DW. This finding, confirming the ANOVA analysis, could be related to a rapid nutrient release: Melo et al. [100] confirm that a high caffeine and polyphenolic content may act as biostimulants, promoting shoot elongation and leaf expansion. Furthermore, at low PR levels, CS improves substrate structure without compromising water retention, supporting vigorous shoot development. Located on the left upper side of Component 1, WF10 showed a high correlation with plant height (0.64) and leaf number. Furthermore, PC3 separated WF20 for leaf number and WF40 for plant height. WF40 and CS40, located distantly from the 0PR, show reduced association with both shoot and root biomass, indicating potential limitations in substrate structure or nutrient availability at higher PR. In summary, in 'Amistad', the best substrates appear to be CS10 and CS20 because they increase shoot density and leaf area, although BSG20 and BSG40 appear to improve root growth and leaf color. Wood fiber at all three concentrations appears to improve some aspects of the above-ground plant, such as height and leaf number. In any case, the mixtures perform better than 0PR.
4. Materials and Methods
A greenhouse pot experiment was conducted to evaluate the physical characteristics and the agronomic performance of alternative substrates, based on organic by-products used as a partial replacement of peat using as plant test two sage cultivars characterized by different growth habitus.
4.1. Substrate Treatments
Ten substrates were used as substrate treatment. Each substrate included 15% of the whole volume of an inorganic fraction (perlite, Agrilit 3, Perlite Italiana, Italy) and an organic fraction (85% of the whole volume). The ten substrates were created by partially replacing peat in the organic fraction with alternative organic matrices. These matrices, selected from by-products of the agricultural industry, included wood fiber (WF), coffee silverskin (CS), and brewer’s spent grain (BSG). Each matrix, was used at four levels of peat replacement (0, 10, 20, and 40% v/v of the organic fraction), resulting in the treatments summarized in Table 7.
The sources of the organic matrices were: (i) peat (P, Plantaflor®, Germany); (ii) WF (Sunfibre®, Nuova Flesan S.r.l., Milano, Italy), (iii) CS (Brunocaffè roasting company, Bari, Italy) and (iv) BSG (Peroni brewery, Bari, Italy). WF derived mainly from conifers, such as pine and fir, by mechanical defibrillation of virgin wood chips; CS from a blend of C. arabica (20%) and C. robusta (80%), BSG was obtained from the production of a lager beer brewed with barley malt (70%) and maize (30%) and does not contain spent yeast.
Regarding some physical characteristics, such as the particle size or fraction, in perlite was 20-40 mm; while instead in WF a blend of 3 (10-16 mm), 25 (4-10 mm), 25 (2-4 mm), 9 (1-2 mm), and 38% (<1 mm). Regarding average particle size as diameter, in CS it was 1.5-2.0 mm and in BSG it was 3.5 mm. Perlite fraction ranged from 2 to 6 mm in size. Sdao et al. [98] analyze the organic matrices and provide values for the main chemical properties in experiments involving bedding plant species in a potted greenhouse cultivation. .
4.2. Experimental Setup
The on-field cultivation experiment was carried out from 16 September 2023 to 12 February 2024 (150 days) in an unheated and naturally lit greenhouse, covered with ethyl vinyl acetate (EVA) plastic film, located in a commercial ornamental nursery (Monopoli, Bari, Italy, 40°54′19.1′′ N, 17°18′21.4′′ E; 66 m a.s.l.). The site has a typical Mediterranean climate (climate type “Csa” of the Koeppen classification) and it is characterized by hot, dry summers and cool, wet winters. During the experimental period, the Monopoli climatic station reported average monthly temperatures ranging from 25−26 °C (max) and 18−20 °C (min) in September, declining to 12−13 °C (max) and 7−8 °C (min) by February.
Two sage cultivars (‘Victoria’ and ‘Amistad’) were grown in 1.2 L recycled plastic pots filled with the substrates described above. These two genotypes were chosen for their contrasting growth habits, with ‘Victoria’ exhibiting more compact shoot and root development and ‘Amistad’ showing a more vigorous and expansive growth. Both cultivars represent high-market value ornamental crops and were also selected for their widespread ornamental application and proven adaptability to Mediterranean climatic conditions. Table 8 shows the main botanical and ornamental characteristics and the agronomic needs for green spaces utilization of the two genotypes.
Forty-day-old young transplants (approx. 4.0 cm height), grown in small plastic pots (4×4×4 cm) filled with Sphagnum peat and obtained from rooted stem soft cutting, were used as plant starting material.
Transplanting was carried out on September 16, 2023, using 480 sage plants per genotype. Individual rooted cuttings were placed in pots equipped with four leachate outlets. Plants were spaced 30 x 30 cm apart and were arranged on growing benches in a randomized block design with three replications per treatment. Each experimental unit consisted of 16 plants, corresponding to a total of 480 plants per genotype.
Irrigation was supplied through one pressure-compensated dripper per pot, delivering 2 L h⁻¹. Raw water from the experimental farm (electrical conductivity = 0.45 – 0.65 dS m⁻¹; pH= 6.3–6.5) was used. Irrigation frequency and duration was controlled by a timer and adjusted throughout the growing period according to prevailing weather conditions. Peat was pre-enriched with 4.5kg m⁻³ calcium carbonate. For mineral nutrition, each pot received a controlled-release fertilizer (N:P:K= 16:8:12+2MgO+micronutrients, 6-month release) at a rate of 3g L⁻¹, following the manufacturer’s recommendations.
4.3. Physical and Hydrological Substrates Characterization
Before transplanting, the substrates were characterized for their main physical properties. These included WV= Water Volume at -1kPa; AC= Air Content at -1 kPa; SM= Substrate Moisture at -1 kPa; EAW= Easily Available Water; BC= Buffering Capacity; TAW= Total Available Water; TPS= Total Porosity Space; BD= Dry Bulk Density. These parameters were determined by constructing water retention curves using a tension table according to the method described by De Boodt et al. [84], and further applied by Abad et al. [86] and Noguera et al. [37] for the physical evaluation of organic soilless substrates. All analyses were conducted in triplicate under controlled laboratory conditions using stainless cylinders and porous plates.
4.4. Chemical Substrates Characterization
In this article, only the pH and electrical conductivity (EC) determinations of the peat control (0PR) substrate and each mixture obtained by WF, CS and BSG as partial replacement (PR) were determined before substrate fertilization. In the next research article (part 2), further chemical substrate characteristics, traits of the flowering and sage's mineral content will be discussed. Three replications were used to determine the EC [101] and pH [102] of the growing media, were analyzed in a water extract (substrate sample: distilled water, 1:5 v/v). Values of pH and EC were measured using a portable XS PC 7 VIO Professional multi-parameter meter (XS Instruments, Carpi, Italy).
4.5. Chemical Leachate Substrate Fraction Characterization
On December 15, 2023, to assess the health of the sage, the pH and EC of the leached substrate fraction were monitored. The leachate was collected from the pots using the pour-through method [103] one hour after irrigation. A volume of 100 mL of distilled water was poured onto the surface of each pot by hand, and the extract was allowed to drain for 10 minutes in saucers placed under each container until 50 mL of leachate was obtained. The pH and EC values were measured using a portable multiparameter meter XS PC 7 VIO Professional (XS Instruments, Carpi, Italy) and three replications were used.
4.6. Plant Growth and Biomass Measurements
At the end of the experiment, once the vegetative phase was over, five pots were randomly collected for each replication and each treatment to determine plant growth parameters via non-destructive and destructive sampling. Plant height (cm) and total leaf number (no.) were determined at first. The height of the plants was determined by direct dimensional measurement using a ruler graduated in cm, from the neck to the apex of the sages. Leaf area (cm2) was measured using a Li-Cor area meter (LI-3000, Licor, Lincoln, Nebraska, USA). Chlorophyll concentration (ChlC) was recorded with a Chlorophyll Content Meter (Apogee, North Logan, USA), taking three measurements per leaf, on six fully expanded, mature leaves. Roots were meticulously washed under running tap water, using a sieve to recover any detached fragments. Fresh biomass (roots and shoots) was subsequently oven-dried at 80 °C for 48 hours in a ventilated oven until constant weight was achieved. Dry weights (g) were recorded using a three-decimal analytical balance. Total plant dry weight (Plant DW) was calculated as the sum of individual component dry weights. Finally, plant dry matter (Plant DM) (g 100 g-1 fresh weight), was calculated by measuring the fresh weight of individual plant parts (shoots and roots) at the onset of destructive sampling, alongside their corresponding dry weights, using the appropriate percentage formula.
4.7. Statistical Analysis
All data were analyzed using ANOVA through the GLM Procedure in SAS software [104]. Mean values are presented in graphs together with their corresponding standard errors (SE). Orthogonal polynomial contrasts were employed to evaluate linear, quadratic, and cubic trends in response to peat replacement and its interaction with substrate type (ST × PR). Due to the unequal spacing of PR levels (0%, 10%, 20%, and 40%), the trends were analysed using the following contrast coefficients: linear (-7, -3, 1, 9), quadratic (7, -4, -8, 5), and cubic (3, -8, 6, -1), calculated using the NumPy library in Python. Based on theoretical relevance, only biologically meaningful contrasts (e.g., linear or quadratic trends) were reported, even when higher-order trends (e.g., cubic) were statistically significant.
The physicochemical properties of the final substrate mixtures, measured prior to plant cultivation, were analyzed separately for each organic matrix type used as PR (WF, CS, or BSG). A one-way ANOVA was performed with PR level (0%, 10%, 20%, and 40%) as the treatment (three replicates per treatment). The control (0PR) was consistent across all matrices.
Plant growth parameters were evaluated separately for the two genotypes (‘Victoria’ and ‘Amistad’) using a two-way randomized block design, with substrate type (ST) and PR level as factors (three replications per treatment). The control treatment (0PR) was shared across all substrate types.
Plant growth responses were further subjected to Principal Component Analysis (PCA) using PAST 4.03 software (http://folk.uio.no/ohammer/past) [105]. Prior to PCA, all variables were standardized using the formula [(x – mean) / standard deviation] to ensure comparability across measurements.
5. Conclusions
This study demonstrates that peat may be partially substituted with wood and drink by-products -wood fiber, coffee silverskin, and brewer's spent grain- without compromising the growth performance of ornamental sage genotypes. Differential PR rates are required depending on the specific organic matrix and plant genotype. In ‘Victoria’, the highest growth was observed at a 20PR with BSG, corresponding to favourable physical substrate characteristics. Conversely, in ‘Amistad’, BSG at 40PR enhanced root development and above-ground biomass accumulation, underscoring genotype-specific responses to substrate composition. These findings highlight that selected organic by-products from the wood and drink industries represent viable alternatives for peat replacement in sustainable ornamental horticulture. Future research should prioritize analyzing the influence of the chemical characteristics of these substrates on the mineral content of sage genotypes and to evaluate sustainability also from the point of view of eco-efficiency and profitability.
Author Contributions
Formal analysis, data curation, writing—original draft, writing—review and editing, A.E.S.; conceptualization, methodology, validation, data curation, investigation, writing—original draft, S.C., G.C., G.C.; A.E.; investigation, data curation, writing—review and editing, D.L.; conceptualization, methodology, writing—original draft and editing, supervision, project administration, funding acquisition, B.D. All authors have read and agreed to the published version of the manuscript.
Funding
This research was funded by BIOGARDEN project (MASAF, Italy)
Data Availability Statement
The dataset is available on request from the authors.
Acknowledgments
The authors are grateful to Beniamino Leoni (Department of Soil, Plants and Food Sciences, University of Bari, Italy) for his valuable support and for providing research facilities during the experiment, and to Giovanni Fanizzi (Vivai Capitanio, Monopoli, Italy) for offering the necessary infrastructure. They thank Nuova Flesan (Milano, Italy), Brunocaffè s.r.l. (Modugno, Italy) and Birra Peroni (Bari, Italy) for the supply of by-products.
Conflicts of Interest
The authors declare no conflicts of interest.
References
- Trivellini, A.; Toscano, S.; Romano, D.; Ferrante, A. LED lighting to produce high-quality ornamental plants. Plants 2023, 12, 1667. [Google Scholar] [CrossRef] [PubMed]
- Wallach, R. Physical characteristics of soilless media. In Soilless Culture, 2nd ed.; Raviv, M., Lieth, J.H., Bar-Tal, A., Eds.; Elsevier: Amsterdam, The Netherlands, 2019; pp. 33–112. [Google Scholar] [CrossRef]
- Schindler, U.; Müller, L.; Eulenstein, F. Measurement and evaluation of the hydraulic properties of horticultural substrates. Arch. Agron. Soil Sci. 2016, 62, 806–818. [Google Scholar] [CrossRef]
- Al Naddaf, O.; Livieratos, I.; Stamatakis, A.; Tsirogiannis, I.; Gizas, G.; Savvas, D. Hydraulic characteristics of composted pig manure, perlite, and mixtures of them, and their impact on cucumber grown on bags. Sci. Hortic. 2011, 129, 135–141. [Google Scholar] [CrossRef]
- Banitalebi, G.; Mosaddeghi, M.R.; Shariatmadari, H. Feasibility of agricultural residues and their biochars for plant growing media: Physical and hydraulic properties. Waste Manag. 2019, 87, 577–589. [Google Scholar] [CrossRef]
- Paradelo, R.; Basanta, R.; Barral, M.T. Water-holding capacity and plant growth in compost-based substrates modified with polyacrylamide, guar gum or bentonite. Sci. Hortic. 2019, 243, 344–349. [Google Scholar] [CrossRef]
- Gruda, N.S. Increasing sustainability of growing media constituents and stand-alone substrates in soilless culture systems. Agronomy 2019, 9, 298. [Google Scholar] [CrossRef]
- Van Gerrewey, T.; Vandecruys, M.; Ameloot, N.; Perneel, M.; Van Labeke, M.-C.; Boon, N.; Geelen, D. Microbe-plant growing media interactions modulate the effectiveness of bacterial amendments on lettuce performance inside a plant factory with artificial lighting. Agronomy 2020, 10, 1456. [Google Scholar] [CrossRef]
- Erdal, İ.; Aktaş, H. Comparison of the Perlite, Leonardite, Vermicompost and Peat Moss and Their Combinations with Cocopeat as Tomato Growing Media. J. Soil Sci. Plant Nutr. 2025, 1–16. [Google Scholar] [CrossRef]
- Balawejder, M.; Matłok, N.; Szostek, M.; Kuboń, M. The Influence of a Biopolymer Coating on Selected Surface Properties of Soilless Substrates Made from Coconut Fibre. Appl. Sci. 2025, 15, 7039. [Google Scholar] [CrossRef]
- Barrett, G.E.; Alexander, P.D.; Robinson, J.S.; Bragg, N.C. Achieving environmentally sustainable growing media for soilless plant cultivation systems—A review. Sci. Hortic. 2016, 212, 220–234. [Google Scholar] [CrossRef]
- Fesendouz, S.O.; Ebrahimzadeh, A.; Rasouli, F. Using agricultural waste as an alter-native growing medium for cultivating Cucumis sativus L. greenhouse transplants. Sci Rep 2025, 15, 14899. [Google Scholar] [CrossRef] [PubMed]
- Blok, C. , Eveleens, B., van Winkel, A., Growing media for food and quality of life in the period 2020-2050. Acta Hort. 2021, 2021., 341–356. [Google Scholar] [CrossRef]
- Hirschler, O.; Ostenburg, B. Peat extraction, trade and use in Europe: A material flow analysis. Mires Peat 2022, 28, 27. [Google Scholar] [CrossRef]
- Salimi, S.; Almuktar, S.A.; Scholz, M. Impact of climate change on wetland ecosystems: A critical review of experimental wetlands. J. Environ. Manag. 2021, 286, 112160. [Google Scholar] [CrossRef]
- Leifeld, J.; Menichetti, L. The underappreciated potential of peatlands in global climate change mitigation strategies. Nat. Commun. 2018, 9, 1071. [Google Scholar] [CrossRef] [PubMed]
- DEFRA. Ending the retail sale of peat in horticulture in England and Wales. Available online: https://consult.defra.gov.uk/soils-and-peatlands/endingtheretailsaleofpeatinhorticulture/ (accessed on 12 May 2025).
- Koseoglu, M.N.; Roberts, M. Supply Chain Dynamics of Moving from Peat-Based to Peat-Free Horticulture. Sustainability 2025, 17, 6159. [Google Scholar] [CrossRef]
- Sdao, A.E.; Gruda, N.S.; De Lucia, B. Beyond Peat: Wood Fiber and Two Novel Organic Byproducts as Growing Media—A Systematic Review. Plants 2025, 14, 1945. [Google Scholar] [CrossRef]
- Taparia, T.; Hendrix, E.; Nijhuis, E.; de Boer, W.; van der Wolf, J. Circular alternatives to peat in growing media: A microbial perspective. J. Clean. Prod. 2021, 327, 129375. [Google Scholar] [CrossRef]
- Poláková, K.; Bobková, A.; Demianová, A.; Bobko, M.; Lidiková, J.; Jurčaga, L.; Belej, Ľ.; Mesárošová, A.; Korčok, M.; Tóth, T. Quality attributes and sensory acceptance of different botanical coffee co-products. Foods 2023, 12, 2675. [Google Scholar] [CrossRef]
- Reineke, T.; Muhammed, H. H. A.; Anlauf, R.; Daum, D. Impact of thermo-hydrolytically treated wood fibers as a substrate component on the growth of petunias. Acta Hortic. 2024, 1389, 105–112. [Google Scholar] [CrossRef]
- Atzori, G.; Pane, C.; Zaccardelli, M.; Cacini, S.; Massa, D. The role of peat-free organic substrates in the sustainable management of soilless cultivations. Agronomy 2021, 11, 1236. [Google Scholar] [CrossRef]
- Zaccheo, P.; Cattivello, C.; Longo, C.; Crippa, L.; Notaristefano, P.; Orfeo, D. A comparative study on some locally available organic materials for their potential utilization in sustainable growing media blends. Acta Hortic. 2024, 1389, 123–130. [Google Scholar] [CrossRef]
- Gruda, N.S.; Hirschler, O.; Stuart, J. Peat reduction in horticulture: an overview of Europe. Acta Hortic. 2024, 1391, 545–560. [Google Scholar] [CrossRef]
- Miler, N.; Wojewódzki, P.; Woźny, A.; Rymarz, D.; Gołębiewska, A. Exploring Coffee Silverskin as a Sustainable Peat Additive in the Plant Nursery Production. Agronomy 2025, 15, 1633. [Google Scholar] [CrossRef]
- Hejna, A.; Aniśko-Michalak, J.; Skórczewska, K.; Barczewski, M.; Sulima, P.; Przyborowski, J.A.; Cieśliński, H.; Marć, M. Brewers’ Spent Grain from Different Types of Malt: A Comprehensive Evaluation of Appearance, Structure, Chemical Composition, Antimicrobial Activity, and Volatile Emissions. Molecules 2025, 30, 2809. [Google Scholar] [CrossRef]
- Paciulli, M.; Sogari, G.; Rodolfi, M.; Parenti, O.; Andreani, G.; Chiavaro, E. Fostering circular economy: Brewing by-products as innovative ingredients for cereal bar formulation. Foods 2024, 13, 2355. [Google Scholar] [CrossRef] [PubMed]
- Paksin, P.; Tangjaidee, P.; Klangpetch, W.; Unban, K.; Khumsap, T.; Klunklin, W.; Yawootti, A.; Jantanasakulwong, K.; Rachtanapun, P.; Phongthai, S. Quality Attributes, Structural Characteristics, and Functional Properties of Brewer’s Spent Grain Protein Concentrates as Affected by Alkaline and Pulsed Electric Field-Assisted Extraction. Foods 2025, 14, 1515. [Google Scholar] [CrossRef]
- Tumbure, A.; Pulver, C.; Black, L.; Walsh, L.; Prasad, M.; Leahy, J.J.; Corbett, E.; Gaffney, M.T. Bio-resource availability in Ireland: A practical review of potential replacement materials for use in horticultural growth media. Horticulturae 2025, 11, 378. [Google Scholar] [CrossRef]
- European Commission, 2019. Communication on the European Green Deal.https://eur-lex.europa.eu/legal-content/EN/TXT/?qid=1588580774040&uri=CELEX%3A52019DC0640 (accessed on June 11, 2025).
- European Commission, 2020. A Farm to Fork Strategy for a fair, healthy and environmentally-friendly food system.https://eur-lex.europa.eu/legal-content/EN/TXT/?uri=CELEX:52020DC0381(accessed on June 11, 2025).
- European Commission, 2020. A new Circular Economy Action Plan for a cleaner and more competitive Europe. 2020.https://eur-lex.europa.eu/legal-content/EN/TXT/?uri=COM:2020:98:FIN (accessed on25 June 2025).
- Caron, J.; Pepin, S.; Periard, Y. Physics of growing media in a green future. In Proceedings of the International Symposium on Growing Media and Soilless Cultivation, Brisbane, Australia, 17–21 August 2014; Acta Hortic. 2014, 1034, 309–317. [Google Scholar] [CrossRef]
- Schindler, U.; Lischeid, G.; Müller, L. Hydraulic performance of horticultural substrates—3. Impact of substrate composition and ingredients. Horticulturae 2017, 3, 7. [Google Scholar] [CrossRef]
- Muhammed, H.H.; Anlauf, R.; Daum, D. Estimation of Hydraulic Properties of Growing Media from Numerical Inversion of Mini Disk Infiltrometer Data. Hydrology 2025, 12, 100. [Google Scholar] [CrossRef]
- Noguera, P.; Abad, M.; Puchades, R.; Maquieira, A.; Noguera, V. Influence of particle size on physical and chemical properties of coconut coir dust as container medium. Commun. Soil Sci. Plant Anal. 2011, 34, 593–605. [Google Scholar] [CrossRef]
- Bilderback, T.E.; Warren, S.L.; Owen Jr, J.S.; Albano, J.P. Healthy substrates need physicals too! HortTechnology 2005, 15, 747. [Google Scholar] [CrossRef]
- Plants of the World Online (POWO). Available online: https://powo.science.kew.org/taxon/urn:lsid:ipni.org:names:30000096-2 (accessed on 28 July 2025).
- Afonso, A.F.; Pereira, O.R.; Fernandes, Â.S.F.; Calhelha, R.C.; Silva, A.M.S.; Ferreira, I.C.F.R.; Cardoso, S.M. The health-benefits and phytochemical profile of Salvia apiana and Salvia farinacea var. Victoria Blue decoctions. Antioxidants 2019, 8, 241. [Google Scholar] [CrossRef]
- De Mastro, G.; El Mahdi, J.; Ruta, C. Bioherbicidal Potential of the Essential Oils from Mediterranean Lamiaceae for Weed Control in Organic Farming. Plants 2021, 10, 818. [Google Scholar] [CrossRef] [PubMed]
- Kamatou, G.P.; Makunga, N.P.; Ramogola, W.P.; Viljoen, A.M. South African Salvia species: a review of biological activities and phytochemistry. J. Ethnopharmacol. 2008, 119, 664–672. [Google Scholar] [CrossRef]
- Sharifi-Rad, M.; Ozcelik, B.; Altın, G.; Daşkaya-Dikmen, C.; Martorell, M.; Ramirez-Alarcon, K.; Sharifi-Rad, J. Salvia spp. plants-from farm to food applications and phytopharmacotherapy. Trends Food Sci. Technol. 2018, 80, 242–263. [Google Scholar] [CrossRef]
- Lin, K.-H.; Lin, T.-Y.; Wu, C.-W.; Chang, Y.-S. Protective Effects of Salicylic Acid and Calcium Chloride on Sage Plants (Salvia officinalis L. and Salvia elegans Vahl) under High-Temperature Stress. Plants 2021, 10, 2110. [Google Scholar] [CrossRef] [PubMed]
- Papafotiou, M.; Martini, A.N.; Papanikolaou, E.; Stylias, E.G.; Kalantzis, A. Hybrids development between Greek Salvia species and their drought resistance evaluation along with Salvia fruticosa, under attapulgite-amended substrate. Agronomy 2021, 11, 2401. [Google Scholar] [CrossRef]
- Moughan, J.; McGinn, K.J.; Jones, L.; Rich, T.C.; Waters, E.; de Vere, N. Biological flora of the British Isles: Salvia pratensis. J. Ecol. 2021, 109, 4171–4190. [Google Scholar] [CrossRef]
- Mossi, A.; Cansian, R.; Paroul, N.; Toniazzo, G.; Oliveira, J.; Pierozan, M.; Serafini, L. Morphological characterisation and agronomical parameters of different species of Salvia sp. (Lamiaceae). Braz. J. Biol. 2011, 71, 121–129. [Google Scholar] [CrossRef]
- Nanos, C.; Tsoulpha, P.; Kostas, S.; Hatzilazarou, S.; Michail, I.; Anastasiadi, V.; Pipinis, E.; Gklavakis, E.; Kanellis, A.K.; Nianiou-Obeidat, I. Asexual propagation of Greek Salvia officinalis L. populations selected for ornamental use. Horticulturae 2023, 9, 847. [Google Scholar] [CrossRef]
- Scaltrito, E.; Cristiano, G.; Sdao, A.E.; Gruda, N.S.; Loconsole, D.; De Lucia, B. Influence of water spraying intervals and indole-3-butyric acid concentrations on Salvia rooted cuttings quality in a closed aeroponics system. Sci. Hortic. 2024, 337, 113452. [Google Scholar] [CrossRef]
- Gokdogan, E.Y.; Burun, B. The studies on seed germination and in vitro cultures of Salvia L. species from Turkish flora. Nat. Prod. Biotechnol. 2022, 2, 60–73. [Google Scholar] [CrossRef]
- Greco, C.; Comparetti, A.; Fascella, G.; Febo, P.; La Placa, G.; Saiano, F.; Mammano, M.M.; Orlando, S.; Laudicina, V.A. Effects of vermicompost, compost and digestate as commercial alternative peat-based substrates on qualitative parameters of Salvia officinalis. Agronomy 2021, 11, 98. [Google Scholar] [CrossRef]
- Iacomino, G.; Cozzolino, A.; Idbella, M.; Amoroso, G.; Bertoli, T.; Bonanomi, G.; Motti, R. Potential of biochar as a peat substitute in growth media for Lavandula angustifolia, Salvia rosmarinus and Fragaria × ananassa. Plants 2023, 12, 3689. [Google Scholar] [CrossRef]
- Salvador, E.D.; Balas, J. Physical characteristics of soilless growing media: basis for the development of methods to formulate substrates for ornamental plants in Brazil. In Floriculture, Ornamental and Plant Biotechnology: Advances and Topical Issues, 1st ed.; 2006; pp. 161–171.
- Michel, J.-C.; Kerloch, E. Evolution of hydraulic properties and wettability of organic growing media during cultivation according to irrigation strategies. Sci. Hortic. 2017, 217, 28–35. [Google Scholar] [CrossRef]
- Chrysargyris, A.; Antoniou, O.; Tzionis, A.; Prasad, M.; Tzortzakis, N. Alternative soilless media using olive-mill and paper waste for growing ornamental plants. Environ. Sci. Pollut. Res. 2018, 25, 35915–35927. [Google Scholar] [CrossRef]
- Grosbellet, C.; Beaudet, E.; Duclaud, E. Performances of new materials for peat substitution in horticulture. Acta Hortic. 2019, 315-322, 315–322. [Google Scholar] [CrossRef]
- Thakur, T.; Garg, A. Growth and flowering of ornamental pot plants influenced by growing media – A review. J. Orn. Hortic. 2025, 27, 95–106. Available online: https://epubs.icar.org.in/index.php/JOH/article/view/164891 (accessed on 29 July 2025).
- Awang, Y.; Shaharom, A.S.; Mohamad, R.B.; Selamat, A. Chemical and Physical Characteristics of Cocopeat-Based Media Mixtures and Their Effects on the Growth and Development of Celosia cristata. Am. J. Agric. Biol. Sci. 2009, 4, 63–71. [Google Scholar] [CrossRef]
- Di Lonardo, S.; Massa, D.; Orsenigo, S.; Zubani, L.; Rossi, G.; Fascella, G.; Cacini, S. Substitution of peat in the cultivation of two shrub species used for ecological restoration and recovery of degraded green areas. Acta Hortic. 2021, 1305, 97–102. [Google Scholar] [CrossRef]
- Di Lonardo, S.; Cacini, S.; Becucci, L.; Lenzi, A.; Orsenigo, S.; Zubani, L.; Rossi, G.; Zaccheo, P.; Massa, D. Testing new peat-free substrate mixtures for the cultivation of perennial herbaceous species: A case study on Leucanthemum vulgare Lam. Scientia Hortic. 2021, 288, 110472. [Google Scholar] [CrossRef]
- Caron, J.; Nkongolo, N.V. Assessing Gas Diffusion Coefficients in Growing Media from in situ Water Flow and Storage Measurements. Vadose Zone J. 2004, 3, 300–306. [Google Scholar] [CrossRef]
- Cannavo, P.; Michel, J.-C. Peat particle size effects on spatial root distribution, and changes on hydraulic and aeration properties. Scientia Hortic. 2013, 151, 148–154. [Google Scholar] [CrossRef]
- Mariotti, B.; Oliet, J.A.; Andivia, E.; Tsakaldimi, M.; Villar-Salvador, P.; Ivetić, V.; Cocozza, C. A global review on innovative, sustainable, and effective materials composing growing media for forest seedling production. Curr. For. Rep. 2023, 9, 413–428. [Google Scholar] [CrossRef]
- Carlile, B.; Coules, A. Towards sustainability in growing media. Acta Hortic. 2013, 1013, 341–349. [Google Scholar] [CrossRef]
- Schmilewski, G. Growing media constituents used in the EU in 2013. Acta Hortic. 2017, 1168, 85–92. [Google Scholar] [CrossRef]
- Jackson, B.E. The Role of Wood Substrates in Controlled Environment Vegetable and Fruit Production Systems. Available online: https://www.producegrower.com/article/the-role-of-wood-substrates-in-controlled-environment-vegetable-and-fruit-production-systems/ (accessed on 1 July 2025).
- Lemaire, F.; Dartigues, A.; Riviere, L.M.; Charpentier, S. Cultures en pots et Conteneurs: Principes Agronomiques et Applications, 1st ed.; INRA: Paris, France, 1989; ISBN 2-7380-0157-2. [Google Scholar]
- Gruda, N.; Schnitzler, W.H. Suitability of wood fiber substrate for production of vegetable transplants: I. Physical properties of wood fiber substrates. Sci. Hortic. 2004, 100, 309–322. [Google Scholar] [CrossRef]
- Domeño, I.; Irigoyen, I.; Muro, J. New Wood Fibre Substrates Characterization and Evaluation in Hydroponic Tomato Culture. Eur. J. Hortic. Sci. 2010, 75, 89. [Google Scholar] [CrossRef]
- Anlauf, R.; Muhammed, H.H.A., Reineke. Water retention properties of wood fiber based growing media and their impact on irrigation strategy. Acta Hortic 2024, 1389, 227–236. [Google Scholar] [CrossRef]
- Schindler, U.; Müller, L.; Eulenstein, F. Measurement and evaluation of the hydraulic properties of horticultural substrates. Arch. Agron. Soil Sci. 2016, 62, 806–818. [Google Scholar] [CrossRef]
- Caron, J., Parent, L. E., Elrick, D. E., Naasz, R., Carter, M. R., & Gregorich, E. G. Physical properties of organic soils and growing media: Water and air storage and flow dynamics. Soil Sampling and Methods of Analysis, 2nd ed.; Carter, MR, Gregorich, EG, Eds. 2008. 885-912.
- Fields, J.S.; Fonteno, W.C.; Jackson, B.E.; Heitman, J.L.; Owen, J.S. Hydrophysical properties, moisture retention, and drainage profiles of wood and traditional components for greenhouse substrates. HortScience 2014, 49, 827–832. [Google Scholar] [CrossRef]
- Paradelo, R.; Basanta, R.; Barral, M.T. Water-holding capacity and plant growth in compost-based substrates modified with polyacrylamide, guar gum or bentonite. Sci. Hortic. 2019, 243, 344–349. [Google Scholar] [CrossRef]
- Michiels, P.; Hartmann, R.; Coussens, C. Physical properties of peat substrates in an ebb/flood irrigation system. Acta Hortic. 1993, 342, 205–220. [Google Scholar] [CrossRef]
- Raviv, M.; Lieth, J.H.; Bar-Tal, A. Soilless Culture: Theory and Practice; Elsevier: Amsterdam, The Netherlands, 2019. [Google Scholar]
- Eveleens, B.; van Winkel, A.; Blok, C. Wood fiber in pot plant culture; peat replacement up to 50% in volume? Acta Hortic. 2021, 1317, 165–174. [Google Scholar] [CrossRef]
- Arancon, N.Q.; Pant, A.; Radovich, T.; Hue, N.V.; Potter, J.K.; Converse, C.E. Seed germination and seedling growth of tomato and lettuce as affected by vermicompost water extracts (teas). HortScience 2012, 47, 1722–1728. [Google Scholar] [CrossRef]
- Woznicki, T. L.; Sønsteby, A.; Aurdal, S. M.; Kusnierek, K.; Haraldsen, T. K. Optimizing Peat and Wood Fiber Blends: Impacts of Liming and Fertilization on Growth of Petunia (Petunia x hybrida Vilm.) and Basil (Ocimum basilicum L.). Horticulturae 2024, 10. [Google Scholar] [CrossRef]
- Ballesteros, L.F.; Teixeira, J.A.; Mussatto, S.I. Chemical, functional, and structural properties of spent coffee grounds and coffee silverskin. Food Bioprocess Technol. 2014, 7, 3493–3503. [Google Scholar] [CrossRef]
- Campos-Vega, R.; Loarca-Piña, G.; Vergara-Castañeda, H.A.; Oomah, B.D. Spent coffee grounds: A review on current research and future prospects. Trends Food Sci. Technol. 2015, 45, 24–36. [Google Scholar] [CrossRef]
- Pourfarzad, A.; Mahdavian-Mehr, H.; Sedaghat, N. Coffee silverskin as a source of dietary fiber in bread-making: Optimization of chemical treatment using response surface methodology. LWT-Food Sci. Technol. 2013, 50, 599–606. [Google Scholar] [CrossRef]
- Martuscelli, M.; Esposito, L.; Di Mattia, C.D.; Ricci, A.; Mastrocola, D. Characterization of coffee silver skin as potential food-safe ingredient. Foods 2021, 10, 1367. [Google Scholar] [CrossRef]
- De Boodt, M.; Verdonck, O.; Cappaert, I. Method for measuring the water release curve of organic substrates. In Acta Hortic. 1974, 37, 2054–2063. [Google Scholar] [CrossRef]
- Verdonck, O.; De Vleeschauwer, D.; De Boodt, M. Physical properties of plant substrates and their relation with horticultural practice. Acta Hortic. 1981, 126, 163–173. [Google Scholar] [CrossRef]
- Abad, M.; Noguera, P.; Burés, S. National inventory of organic wastes for use as growing media for ornamental potted plant production: Case study in Spain. Bioresour. Technol. 2001, 77, 197–200. [Google Scholar] [CrossRef]
- Naibaho, J.; Korzeniowska, M. The Variability of Physico-Chemical Properties of Brewery Spent Grain from 8 Different Breweries. Heliyon 2021, 7, e06329. [Google Scholar] [CrossRef] [PubMed]
- Castro, L.E.N.; Colpini, L.M.S. All-Around Characterization of Brewers’ Spent Grain. Eur. Food Res. Technol. 2021, 247, 3013–3021. Available online: https://link.springer.com/article/10.1007%2Fs00217-021-03860-5 (accessed on 4 June 2025). [CrossRef]
- Mussatto, S.I.; Dragone, G.; Roberto, I.C. Brewers' spent grain: Generation, characteristics and potential applications. J. Cereal Sci. 2006. [Google Scholar] [CrossRef]
- Xiros, C.; Christakopoulos, P. Biotechnological potential of brewers spent grain and its recent applications. Waste Biomass Valor. 2012. [Google Scholar] [CrossRef]
- Beldman, G.; Hennekam, J.; Voragen, A.G. Enzymatic hydrolysis of beer brewers' spent grain and the influence of pretreatments. Biotechnol. Bioeng. 1987, 30, 668–671. [Google Scholar] [CrossRef]
- Hauck, D.; Lohr, D.; Meinken, E.; Schmidhalter, U. Plant availability of secondary phosphates depending on pH in a peat-based growing medium. Acta Hortic. 2021, 1305, 437–442. [Google Scholar] [CrossRef]
- Cacace, C.; Cocozza, C.; Traversa, A.; Coda, R.; Rizzello, C.G.; Pontonio, E.; De Mastro, F.; Brunetti, G.; Verni, M. Potential of Native and Bioprocessed Brewers' Spent Grains as Organic Soil Amendments. Front. Sustain. Food Syst. 2022, 6, 1010890. [Google Scholar] [CrossRef]
- Kyriacou, M.; El-Nakhel, C.; Pannico, A.; Graziani, G.; Soteriou, G.; Giordano, M.; Palladino, M.; Ritieni, A.; De Pascale, S.; Rouphael, Y. Phenolic Constitution, Phytochemical and Macronutrient Content in Three Species of Microgreens as Modulated by Natural Fiber and Synthetic Substrates. Antioxidants 2020, 9. [Google Scholar] [CrossRef]
- Zawadzińska, A.; Salachna, P.; Nowak, J. S.; Kowalczyk, W. Response of Interspecific Geraniums to Waste Wood Fiber Substrates and Additional Fertilization. Agriculture 2021, 11, 119. [Google Scholar] [CrossRef]
- Dickson, R.W.; Helms, K.M.; Jackson, B.E.; Machesney, L.M.; Lee, J.A. Evaluation of Peat Blended with Pine Wood Components for Effects on Substrate Physical Properties, Nitrogen Immobilization, and Growth of Petunia (Petunia ×hybrida Vilm.-Andr.). HortScience 2022, 57, 304–311. [Google Scholar] [CrossRef]
- Iriondo-DeHond, A.; Uranga, J.A.; del Castillo, M.D.; Abalo, R. Effects of Coffee and Its Components on the Gastrointestinal Tract and the Brain–Gut Axis. Nutrients 2021, 13, 88. [Google Scholar] [CrossRef]
- Sdao, A.E.; Mondelli, D.; Piscitelli, L.; Scaltrito, E.; Leoni, B.; Cristiano, G.; De Lucia, B. Morpho-physiological response of bedding plants quality to unconventional agro-industrial organic matrices to peat replacing: preliminary outcomes. Acta Hortic 2025, 1417, 125–132. [Google Scholar] [CrossRef]
- Yang, H.; Yang, J.; Lv, Y.; He, J. SPAD Values and Nitrogen Nutrition Index for the Evaluation of Rice Nitrogen Status. Plant Prod. Sci. 2014, 17, 81–92. [Google Scholar] [CrossRef]
- Melo, J.; et al. Chemical Characterization of Coffee Husks, a By-Product of Coffea arabica Production. Foods 2021, 10, 2706. [Google Scholar] [CrossRef] [PubMed]
- European Standard 13038, Determination of electrical conductivity, in Soil Improvers and Growing Media. European Committee for Standardization, Brussels. 1999.
- European Standard 13037. 1999., Determination of pH, in Soil Improvers and Growing Media. European Committee for Standardization, Brussels.
- Cavins, T.; Whipker, B.; Fonteno, W. PourThru: A Method for Monitoring Nutrition in the Greenhouse. Acta Hortic. 2008, 779, 289–298. [Google Scholar] [CrossRef]
- SAS Institute Inc. SAS/STAT® User’s Guide, Version 8; SAS Institute Inc.: Cary, NC, USA, 1999. [Google Scholar]
- Hammer, O.; Harper, D.A.T.; Ryan, P.D. PAST: Paleontological Statistics Software Package for Education and Data Analysis. Palaeontol. Electron. 2001, 4, 9 p. [Google Scholar] [CrossRef]
Figure 1.
Effect of peat replacement level (PR, 0–40% v/v) with three by-product materials—wood fiber (WF), coffee silverskin (CS), and brewer's spent grain (BSG)—on water volume at -1 kPa. Data points represent means ± standard error (n = 3). Statistical analysis performed through ANOVA: ns, *, **, and ***, not significant or significant at P≤ 0.05, P≤ 0.01, or P≤ 0.001, respectively. Orthogonal polynomial contrasts were employed to evaluate linear (lin) and quadratic (qua) trends.
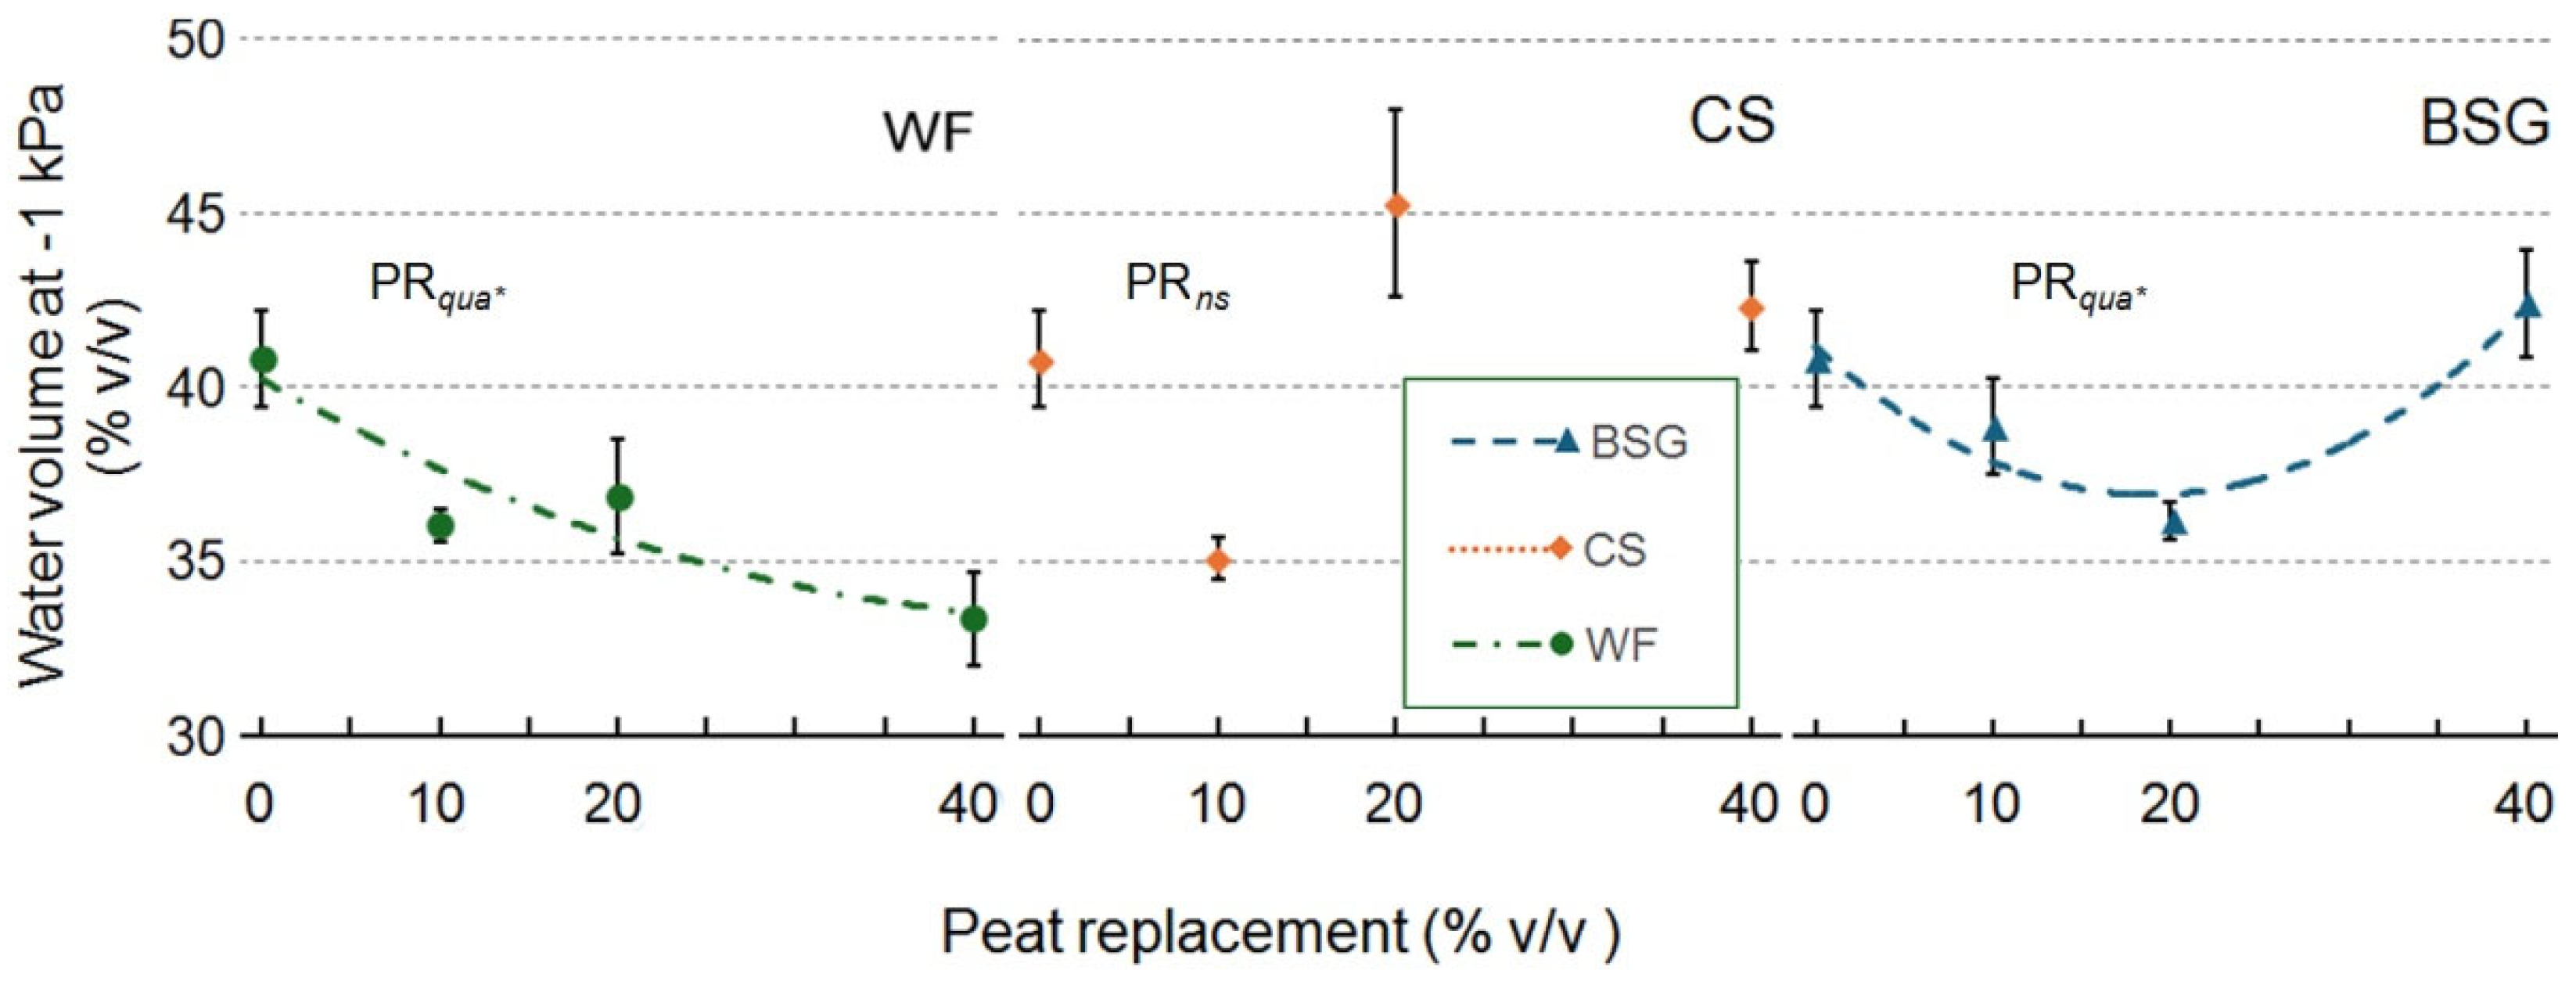
Figure 2.
Effect of peat replacement level (PR, 0–40% v/v) with three by-product materials—wood fiber (WF), coffee silverskin (CS), and brewer's spent grain (BSG)—on substrate moisture at -1 kPa. Data points represent means ± standard error (n = 3). Statistical analysis performed through ANOVA: ns, *, **, and ***, not significant or significant at P≤ 0.05, P≤ 0.01, or P≤ 0.001, respectively. Orthogonal polynomial contrasts were employed to evaluate linear (lin) and quadratic (qua) trends.
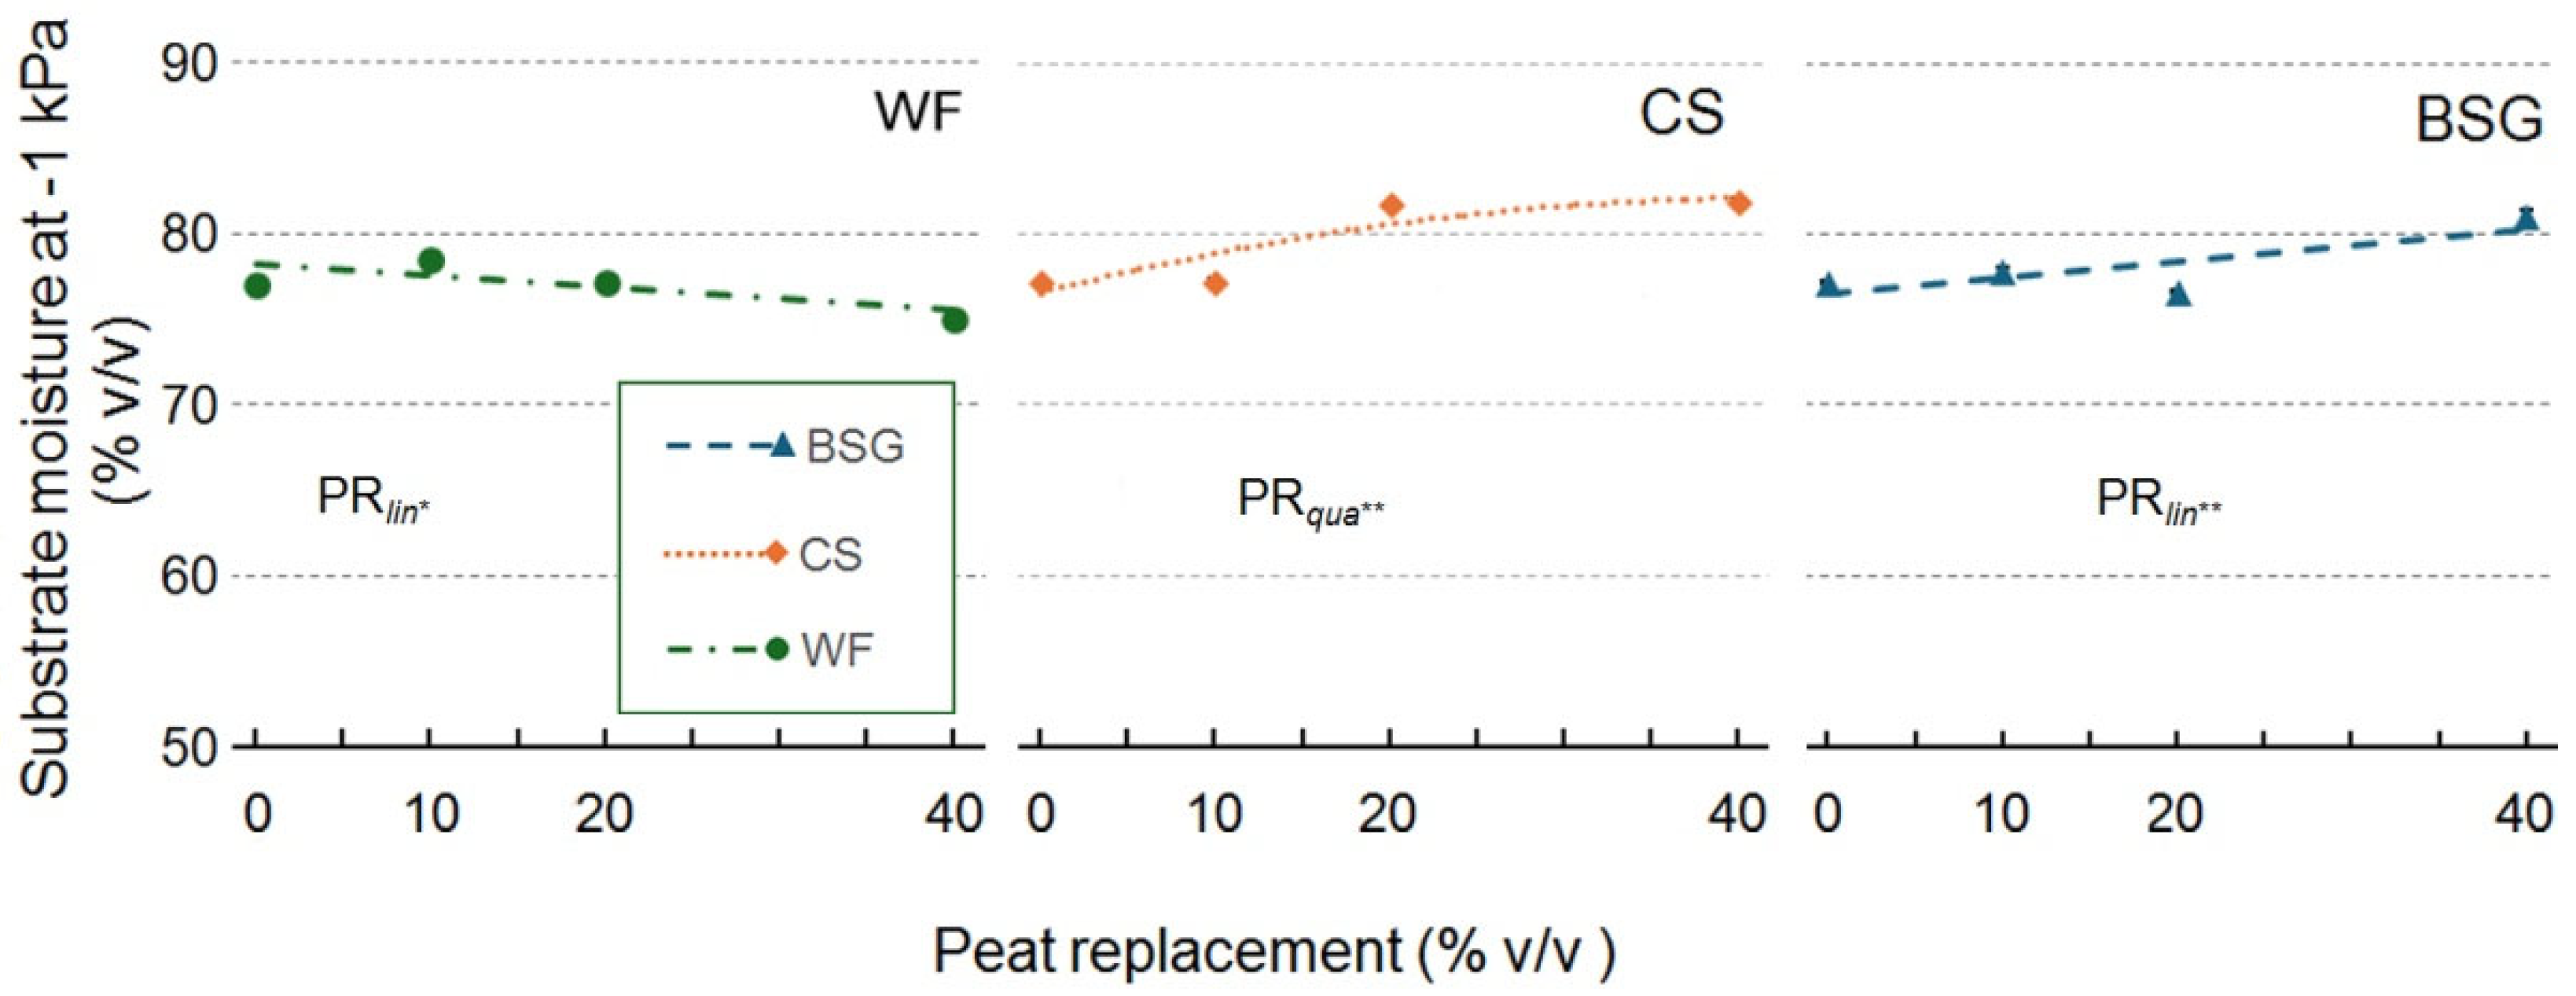
Figure 3.
Effect of peat replacement level (PR, 0–40% v/v) with three by-product materials—wood fiber (WF), coffee silverskin (CS), and brewer's spent grain (BSG)—on easily available water. Data points represent means ± standard error (n = 3). Statistical analysis performed through ANOVA: ns, *, **, and ***, not significant or significant at P≤ 0.05, P≤ 0.01, or P≤ 0.001, respectively. Orthogonal polynomial contrasts were employed to evaluate linear (lin) and quadratic (qua) trends.
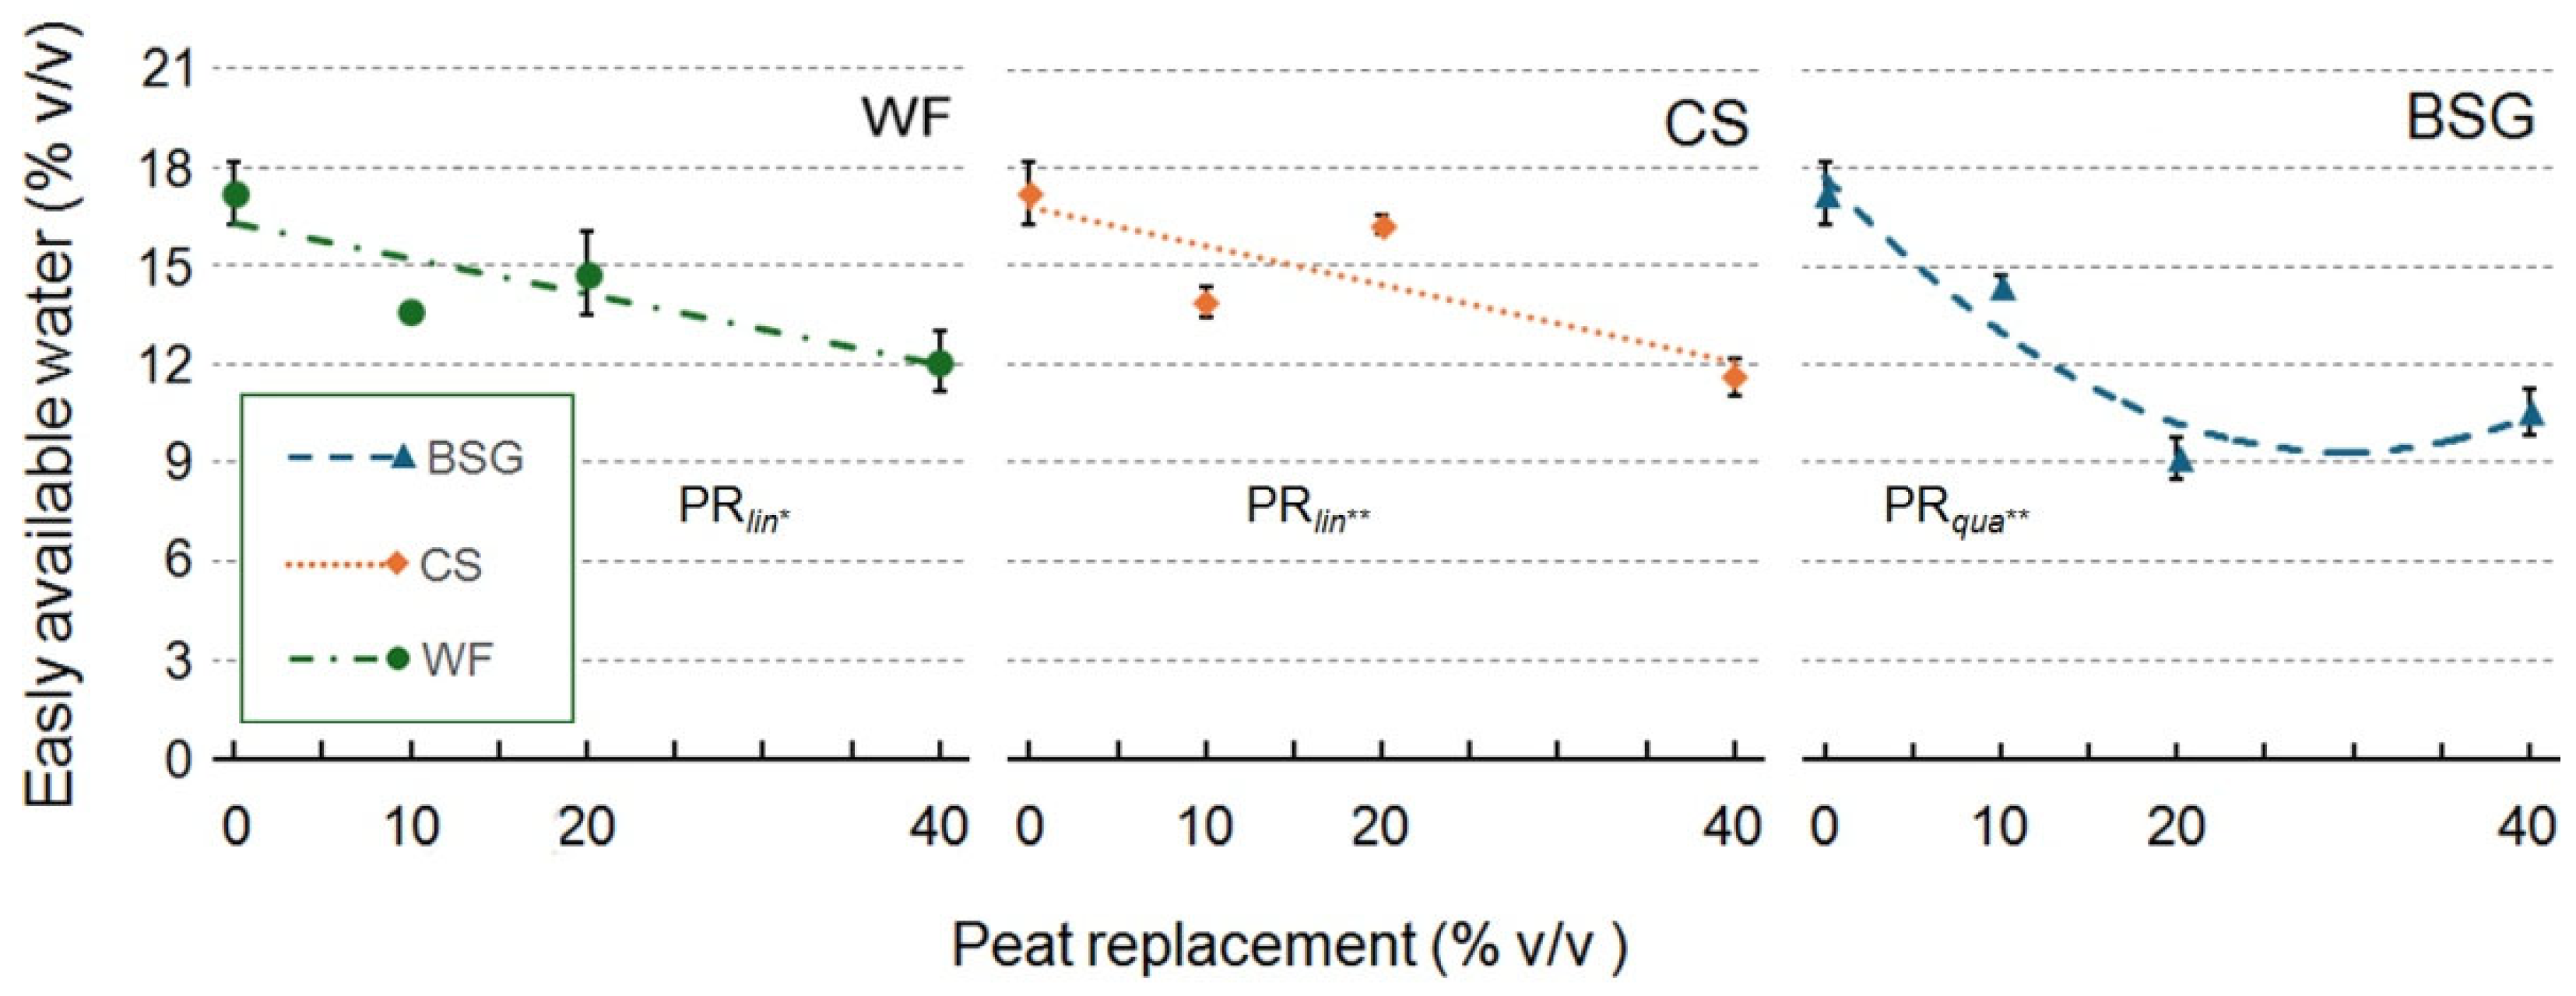
Figure 4.
Effect of peat replacement level (PR, 0–40% v/v) with three by-product materials—wood fiber (WF), coffee silverskin (CS), and brewer's spent grain (BSG)—on available water. Data points represent means ± standard error (n = 3). Statistical analysis performed through ANOVA: ns, *, **, and ***, not significant or significant at P≤ 0.05, P≤ 0.01, or P≤ 0.001, respectively. Orthogonal polynomial contrasts were employed to evaluate linear (lin) and quadratic (qua) trends.
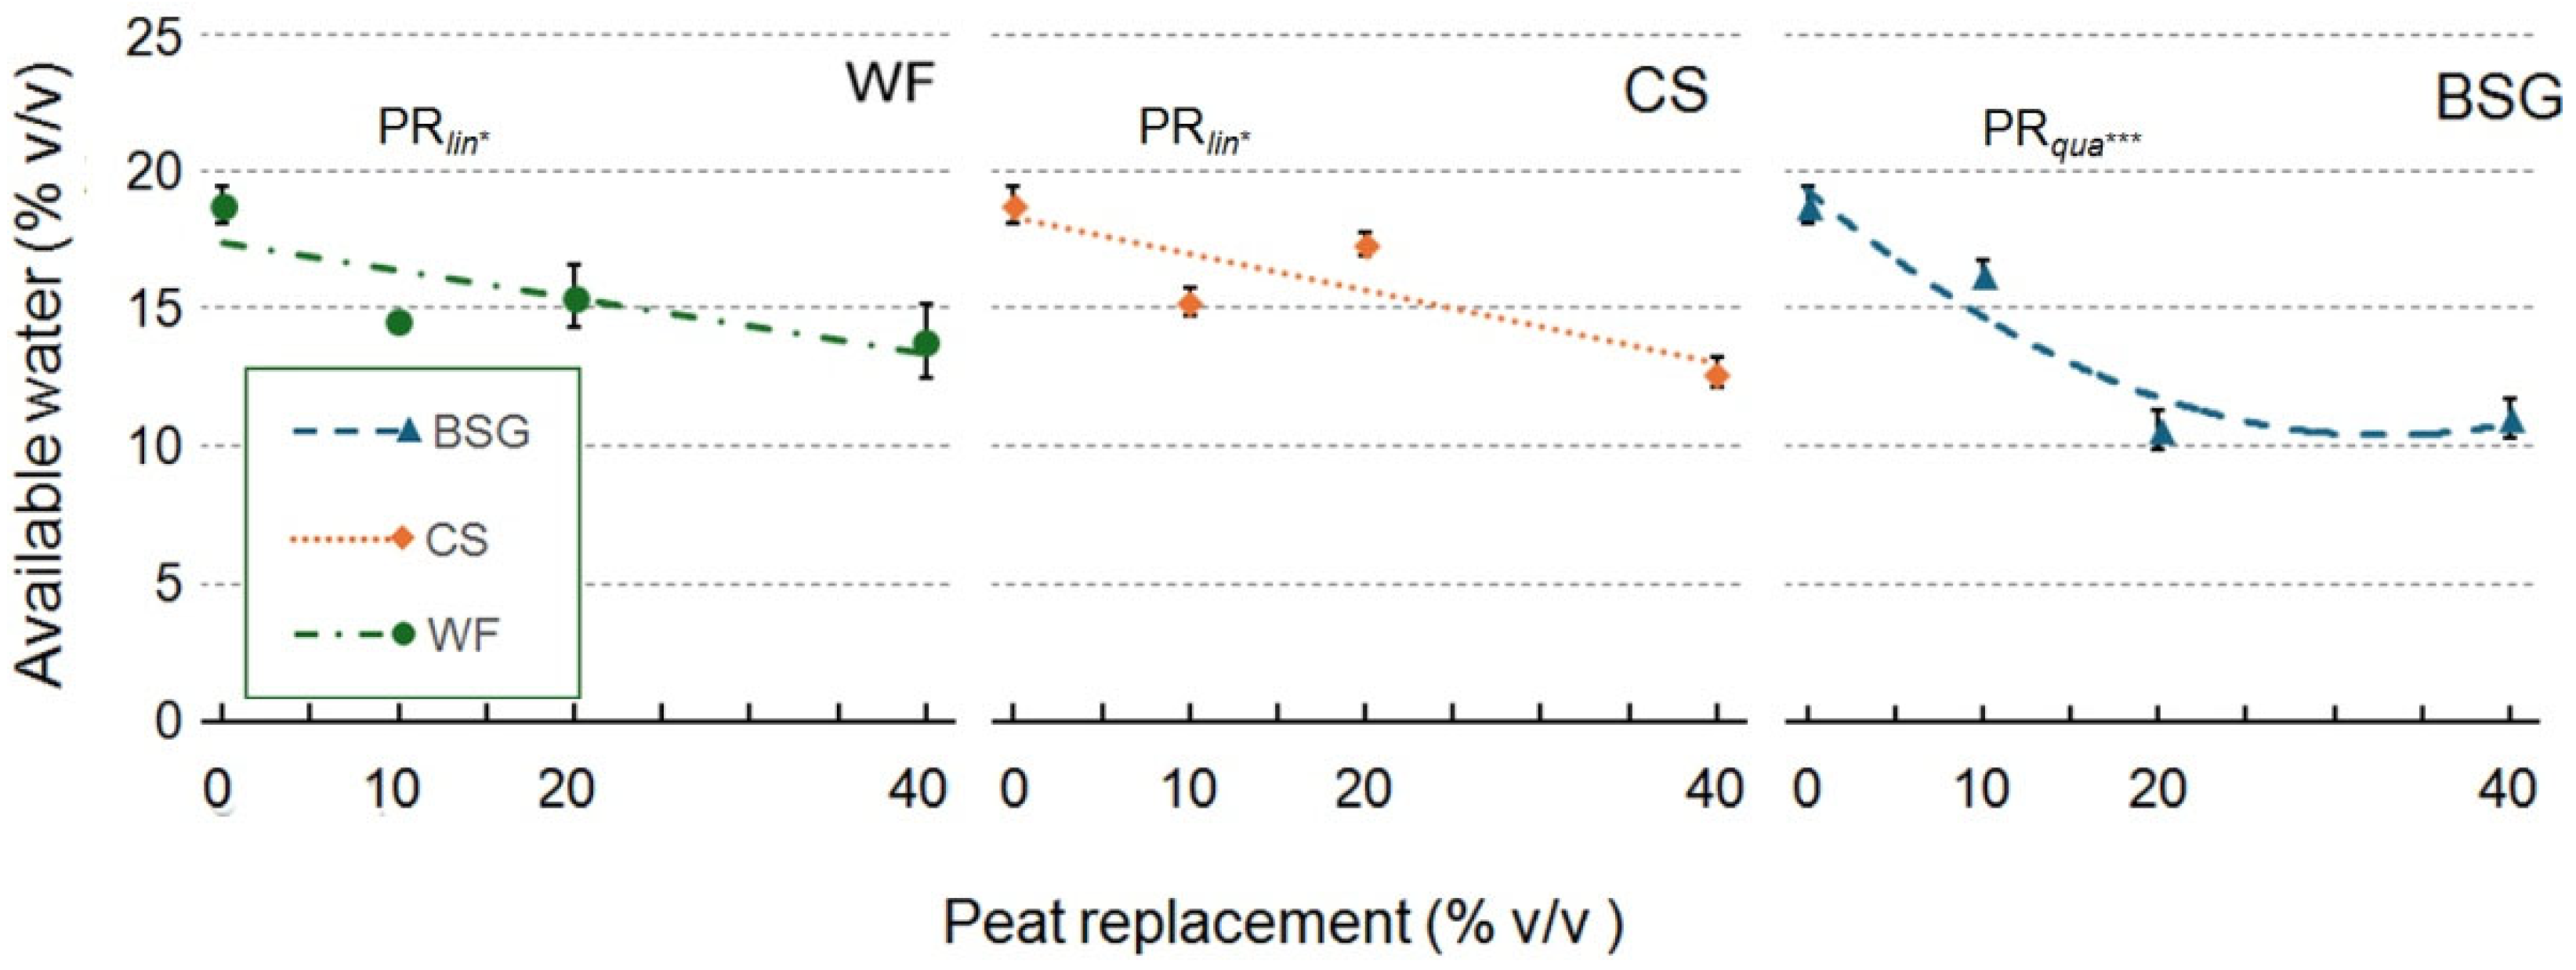
Figure 5.
Effect of peat replacement level (PR, 0–40% v/v) with three by-product materials—wood fiber (WF), coffee silverskin (CS), and brewer's spent grain (BSG)—on buffering capacity. Data points represent means ± standard error (n = 3). Statistical analysis performed through ANOVA: ns, *, **, and ***, not significant or significant at P≤ 0.05, P≤ 0.01, or P≤ 0.001, respectively. Orthogonal polynomial contrasts were employed to evaluate linear (lin) and quadratic (qua) trends.
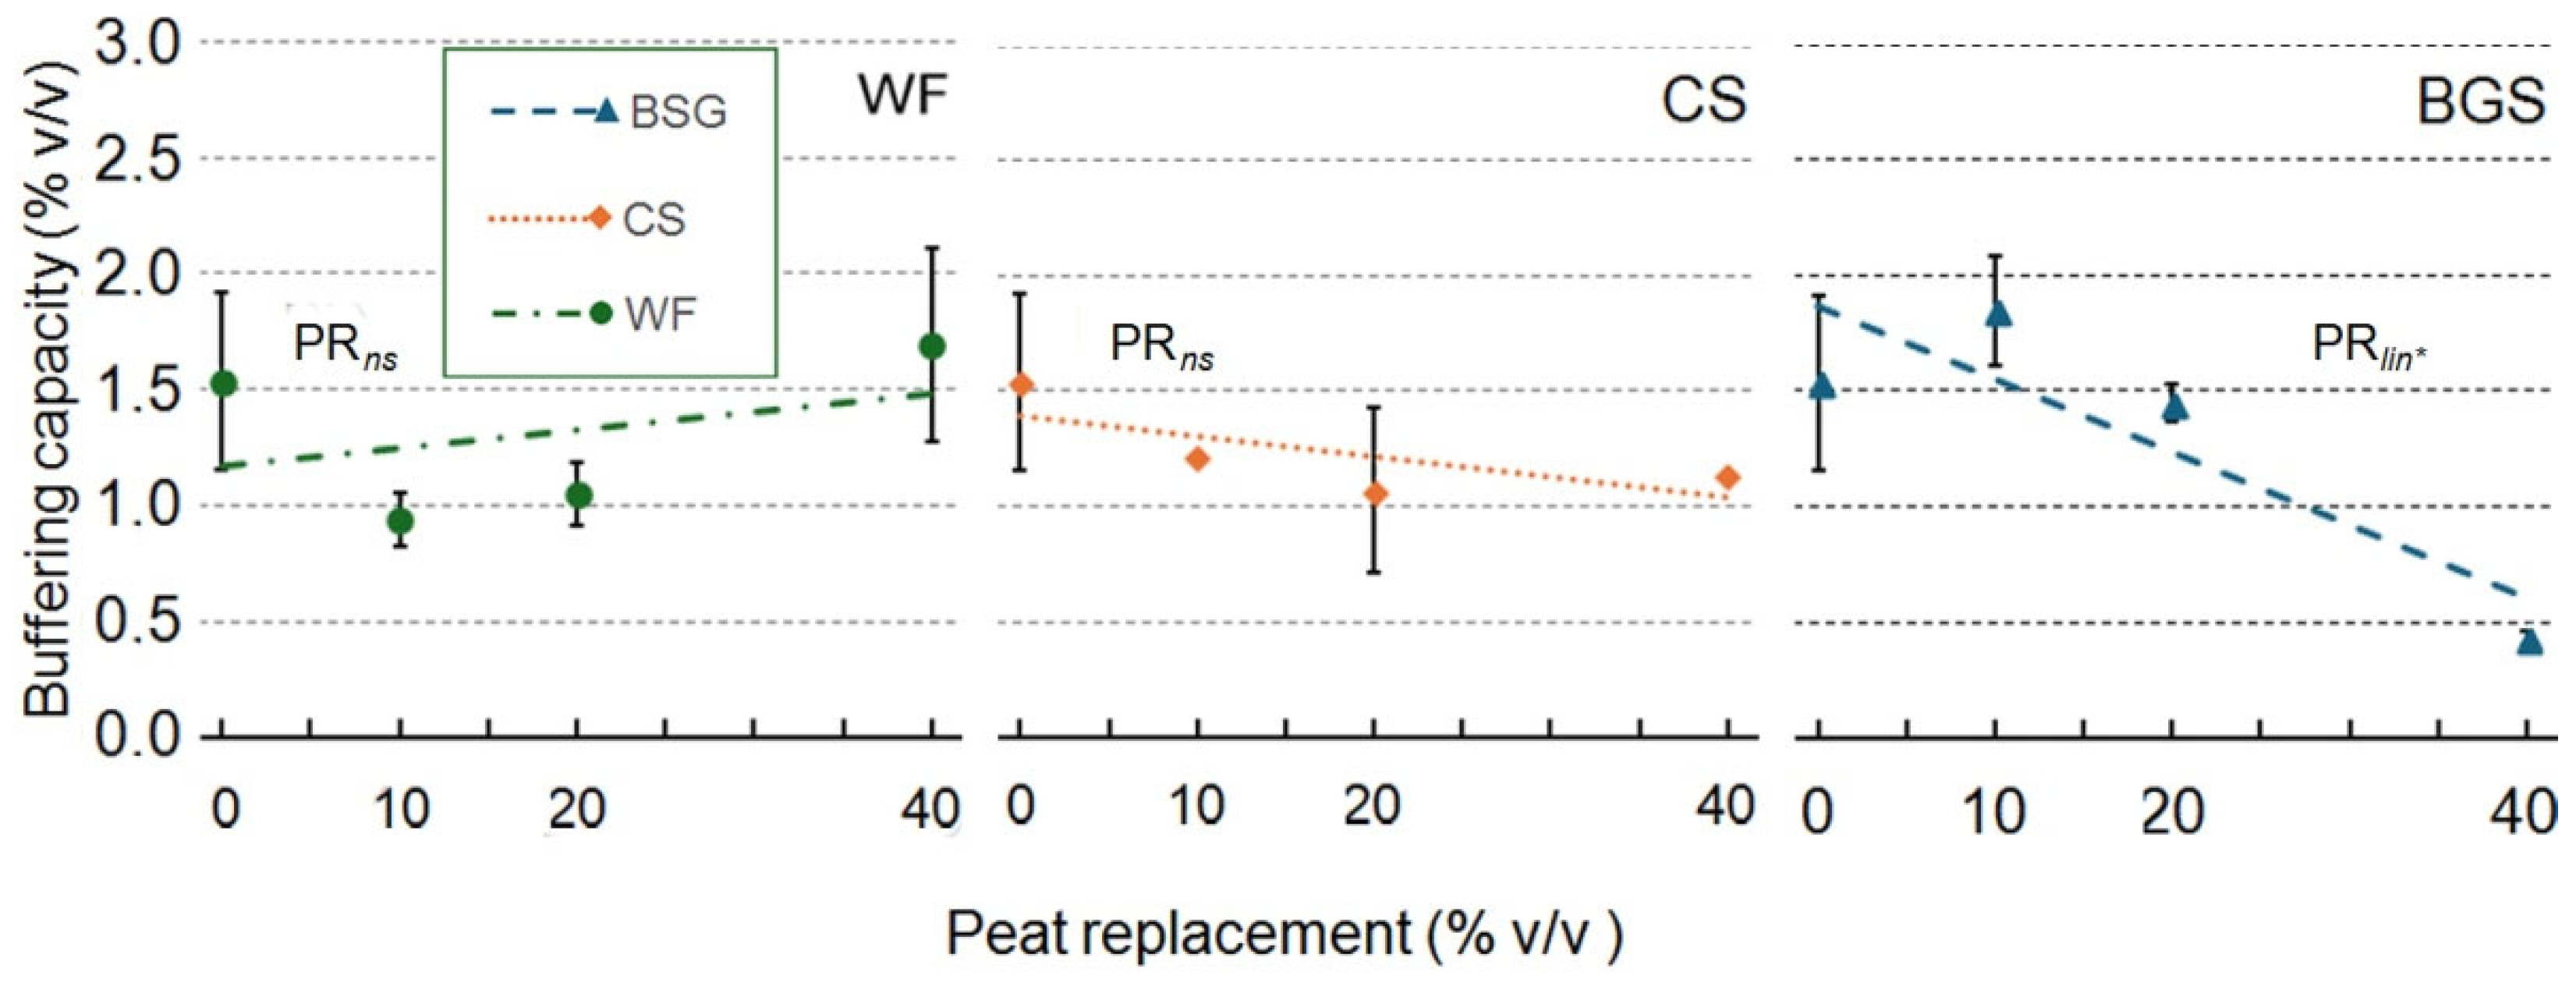
Figure 6.
Effect of peat replacement level (PR, 0–40% v/v) with three by-product materials—wood fiber (WF), coffee silverskin (CS), and brewer's spent grain (BSG)—on bulk density. Data points represent means ± standard error (n = 3). Statistical analysis performed through ANOVA: ns, *, **, and ***, not significant or significant at P≤ 0.05, P≤ 0.01, or P≤ 0.001, respectively. Orthogonal polynomial contrasts were employed to evaluate linear (lin) and quadratic (qua) trends.
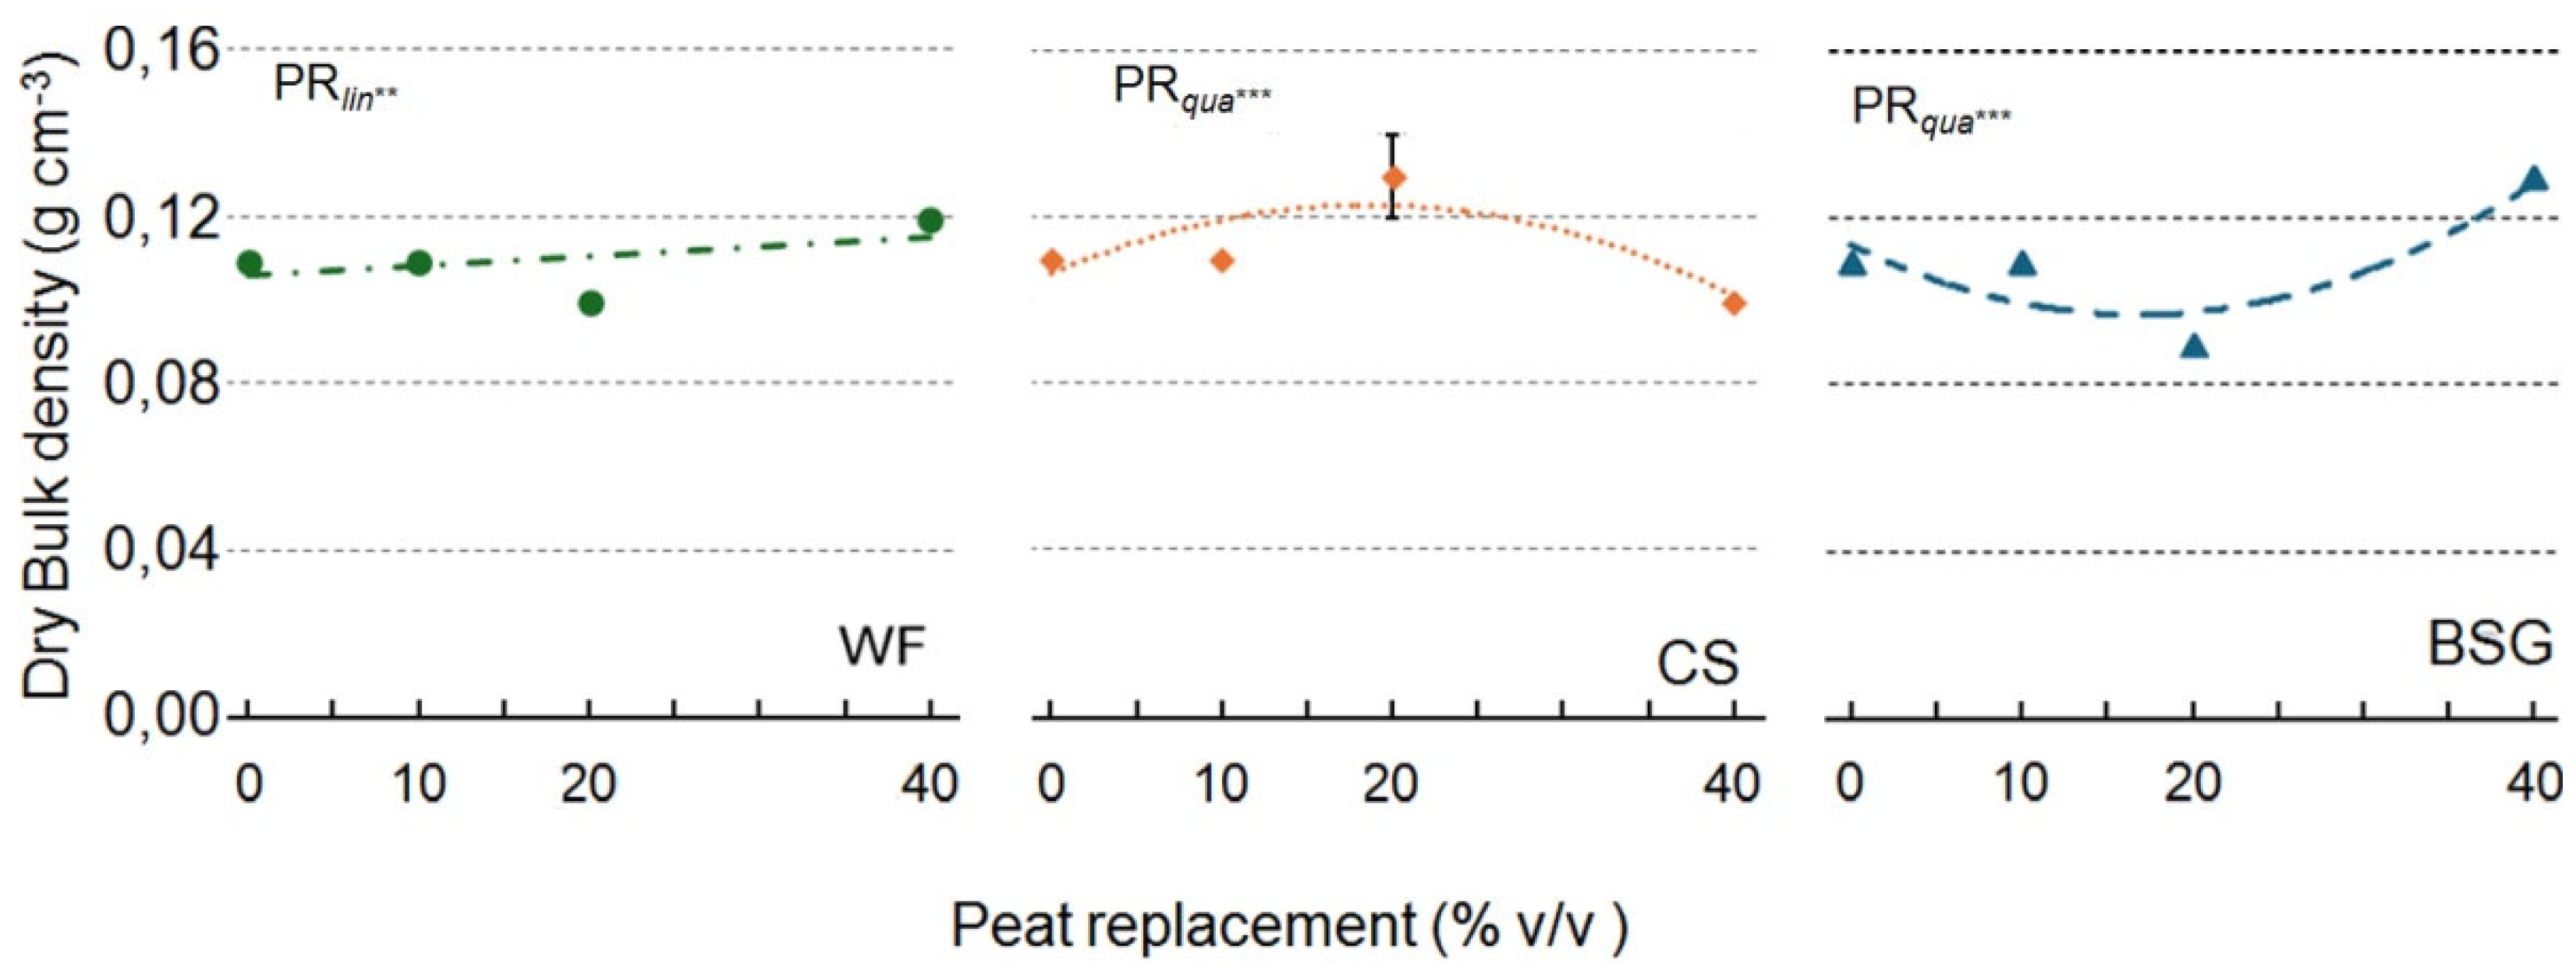
Figure 7.
Effect of peat replacement level (PR, 0–40% v/v) with three by-product materials—wood fiber (WF), coffee silverskin (CS), and brewer's spent grain (BSG)—on total porosity. Data points represent means ± standard error (n = 3). Statistical analysis performed through ANOVA: ns, *, **, and ***, not significant or significant at P≤ 0.05, P≤ 0.01, or P≤ 0.001, respectively. Orthogonal polynomial contrasts were employed to evaluate linear (lin) and quadratic (qua) trends.
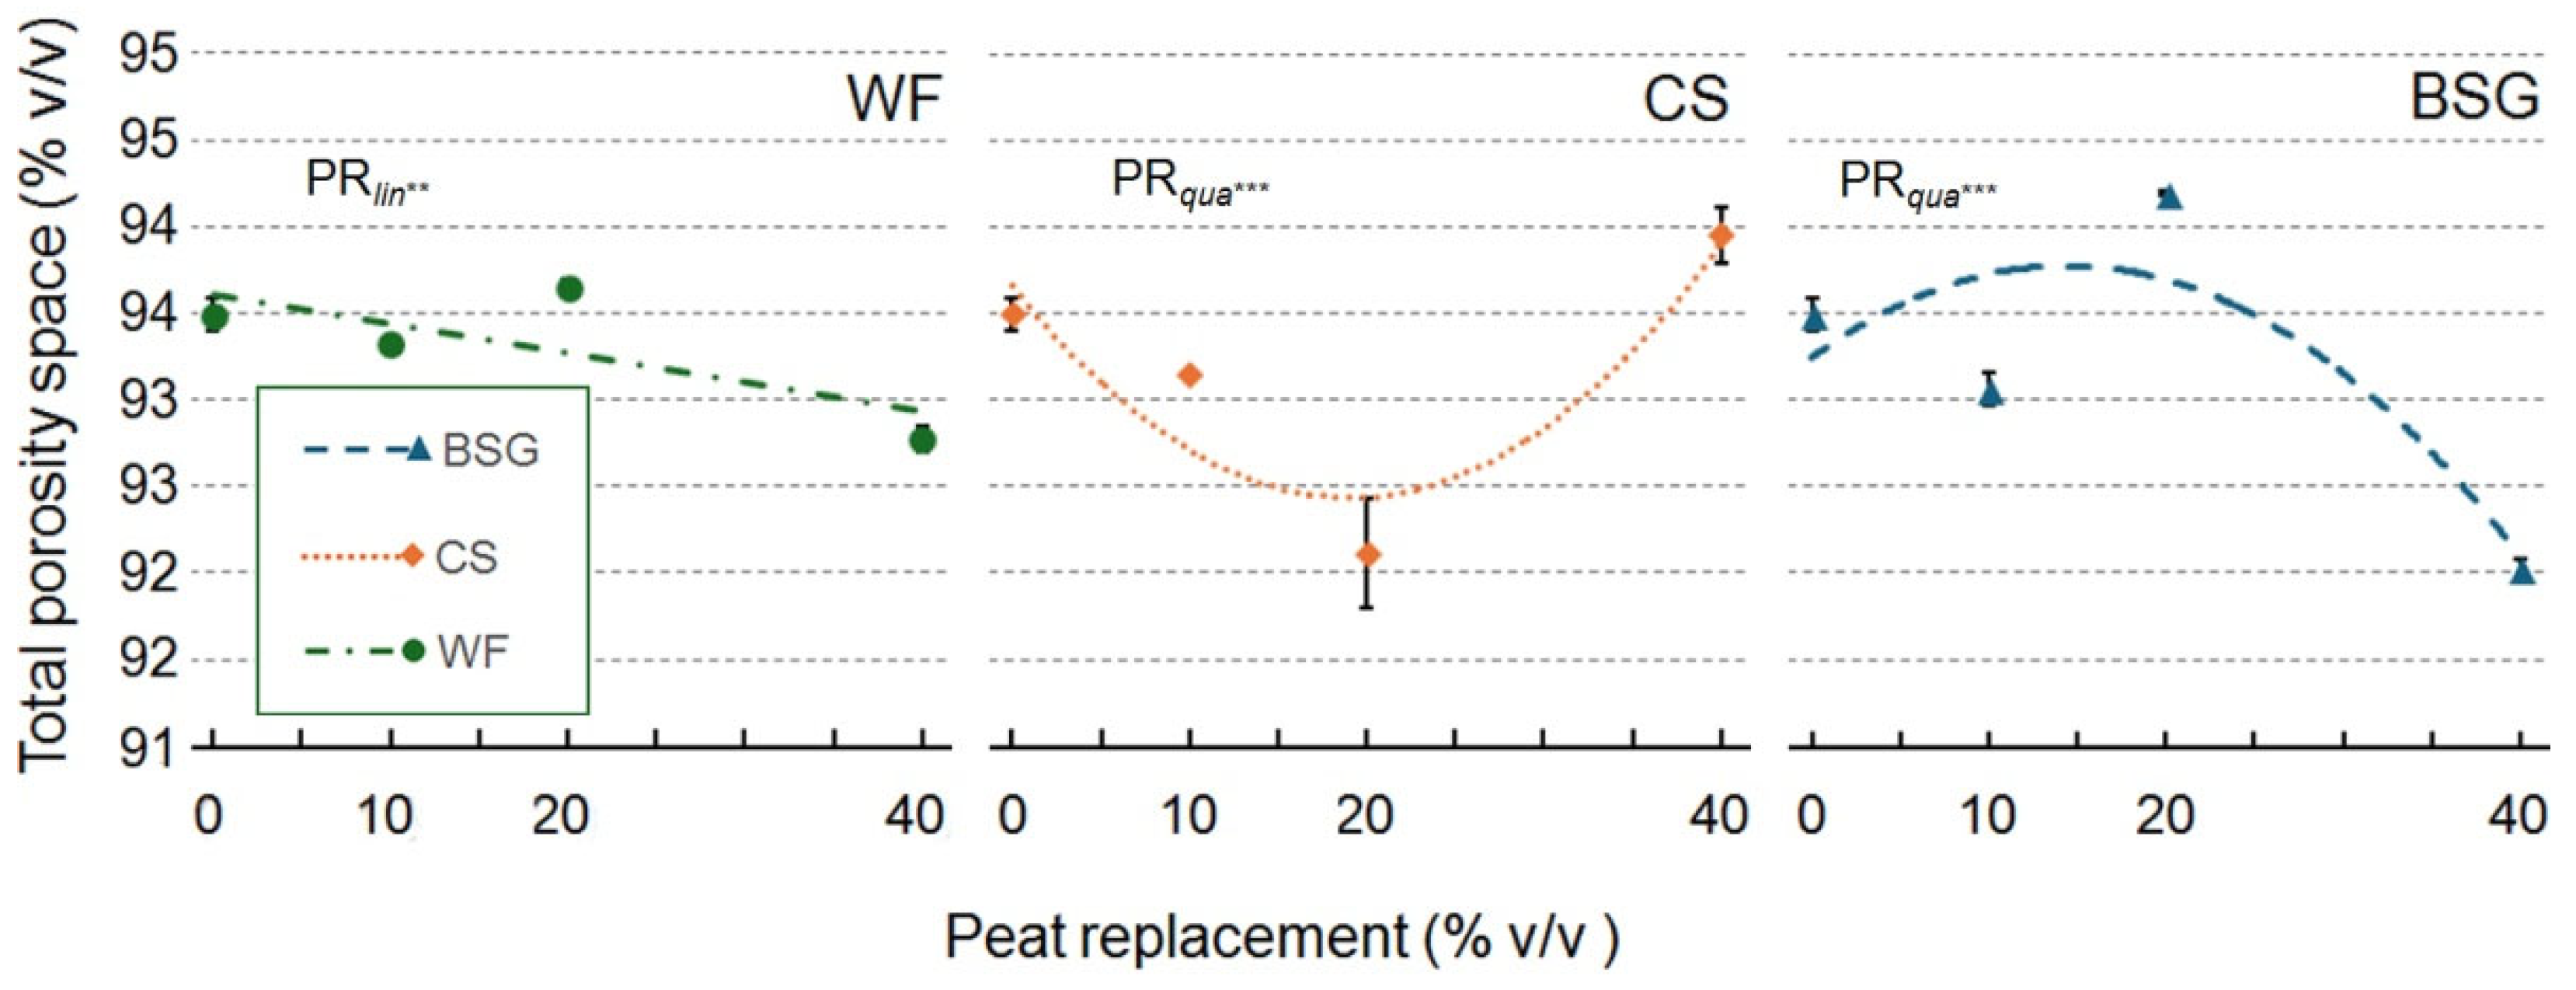
Figure 8.
Effect of partial peat replacement (PR at 0, 10, 20 and 40% levels v/v) with wood fiber (WF, A), coffee silverskin (CS, B) and brewer’s spent grain (BSG, C) on water retention curve. Each water retention curve was determined on the base of 3 replicates.
Figure 8.
Effect of partial peat replacement (PR at 0, 10, 20 and 40% levels v/v) with wood fiber (WF, A), coffee silverskin (CS, B) and brewer’s spent grain (BSG, C) on water retention curve. Each water retention curve was determined on the base of 3 replicates.
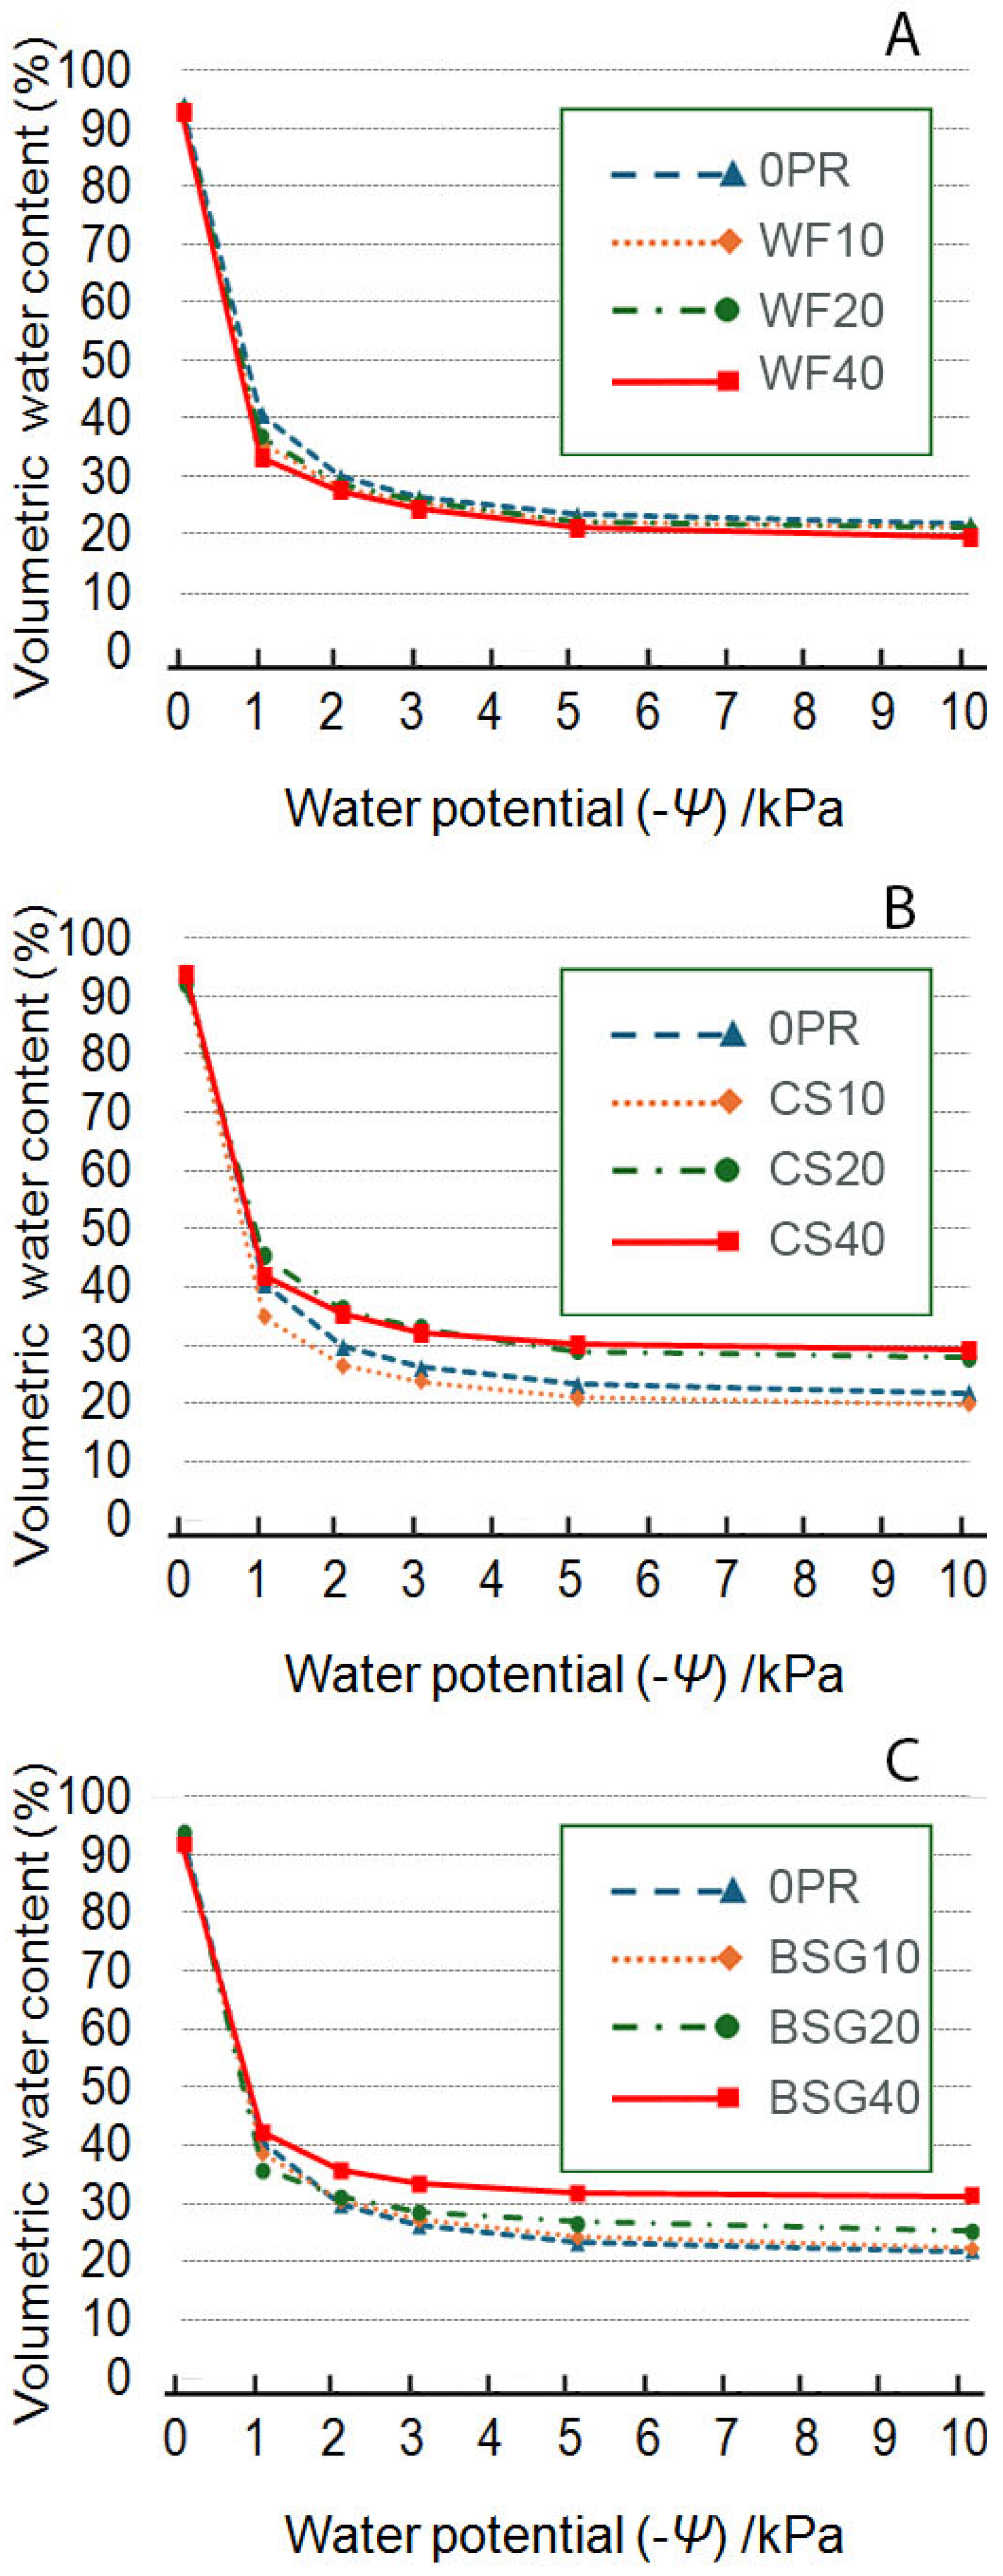
Figure 9.
Effect of peat replacement level (PR, 0–40% v/v) with three by-product materials—wood fiber (WF), coffee silverskin (CS), and brewer's spent grain (BSG)—on pH of the final substrate mixture. Data points represent means ± standard error (n = 3). Statistical analysis performed through ANOVA: ns, *, **, and ***, not significant or significant at P≤ 0.05, P≤ 0.01, or P≤ 0.001, respectively. Orthogonal polynomial contrasts were employed to evaluate linear (lin) and quadratic (qua) trends.
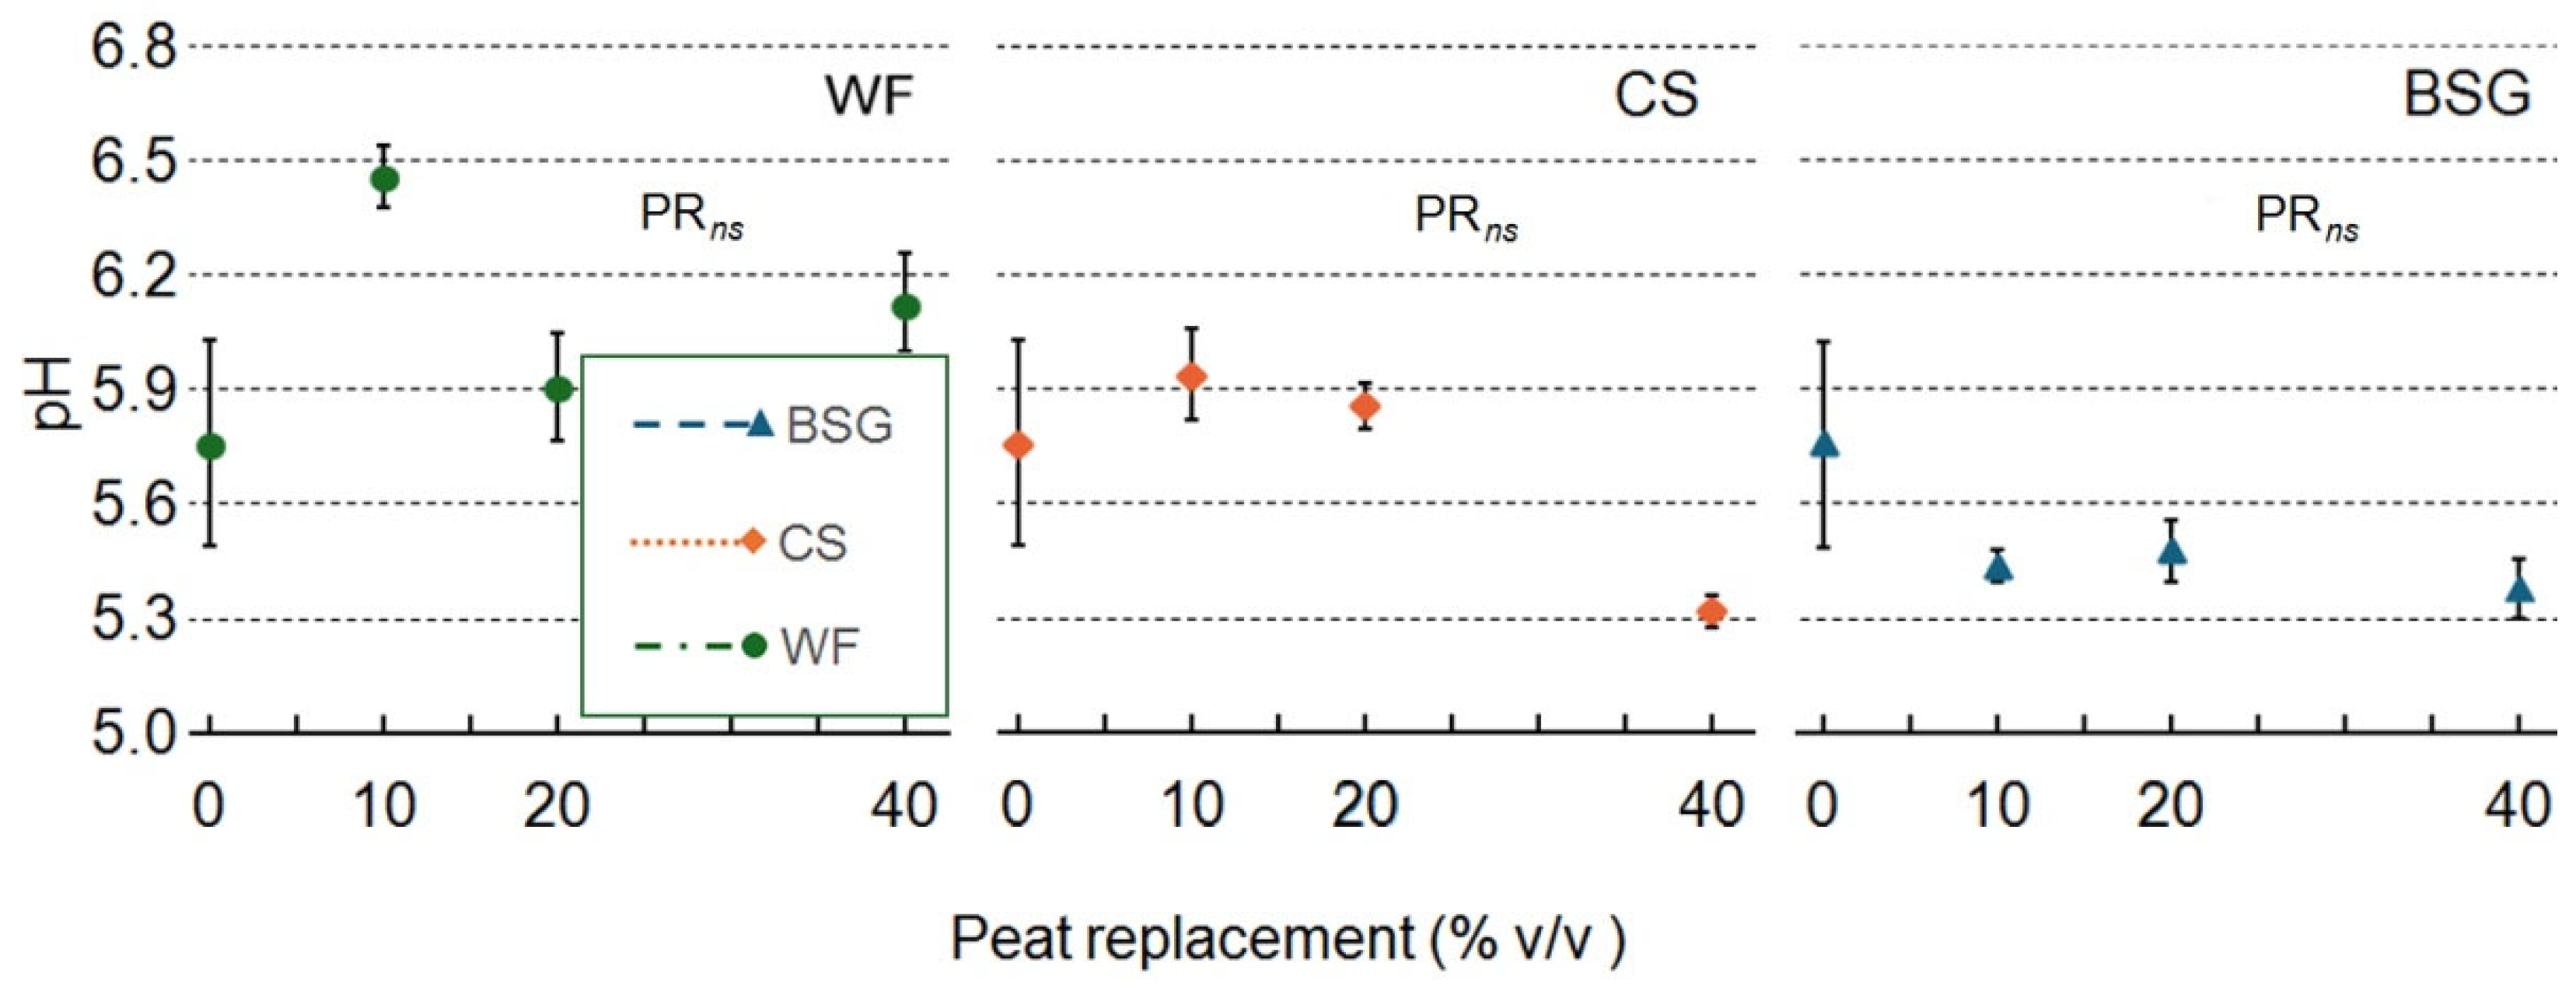
Figure 10.
Effect of peat replacement level (PR, 0–40% v/v) with three by-product materials—wood fiber (WF), coffee silverskin (CS), and brewer's spent grain (BSG)—on electrical conductivity (EC) of the final substrate mixture. Data points represent means ± standard error (n = 3). Statistical analysis performed through ANOVA: ns, *, **, and ***, not significant or significant at P≤ 0.05, P≤ 0.01, or P≤ 0.001, respectively. Orthogonal polynomial contrasts were employed to evaluate linear (lin) and quadratic (qua) trends.
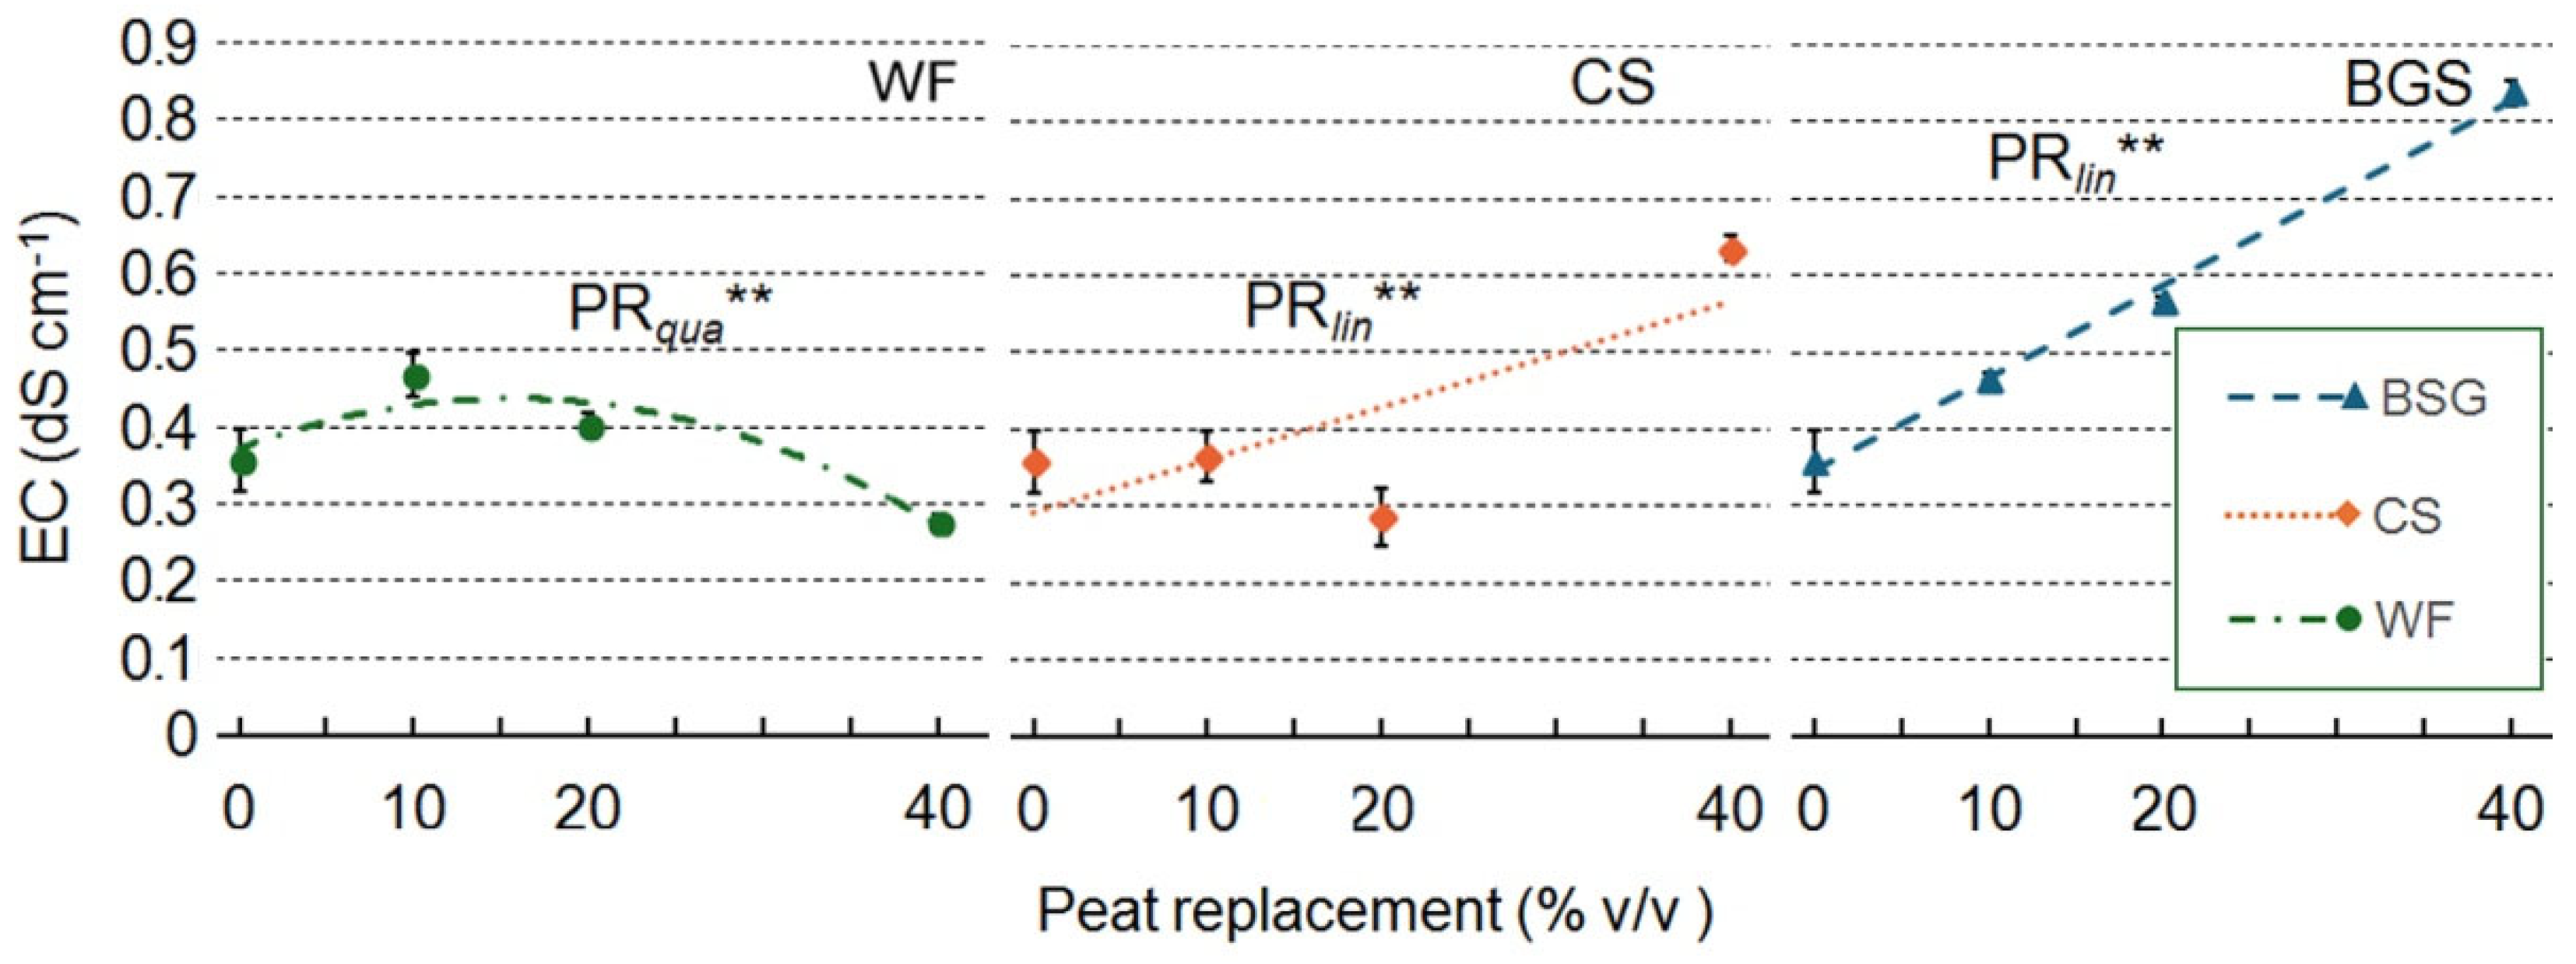
Figure 11.
Effect of peat replacement level (PR, 0–40% v/v) with three organic materials (ST)—brewer’s spent grain (BSG), coffee silverskin (CS), and wood fiber (WF)—on plant height (cm) in Victoria (A) and Amistad (B) genotypes at the end of the vegetative phase (January 14, 2024). Data points represent means ± standard error (n = 3). Statistical analysis performed through ANOVA: ns, *, **, and ***, not significant or significant at P≤ 0.05, P≤ 0.01, or P≤ 0.001, respectively. Orthogonal polynomial contrasts were employed to evaluate linear (lin) and quadratic (qua) trends.
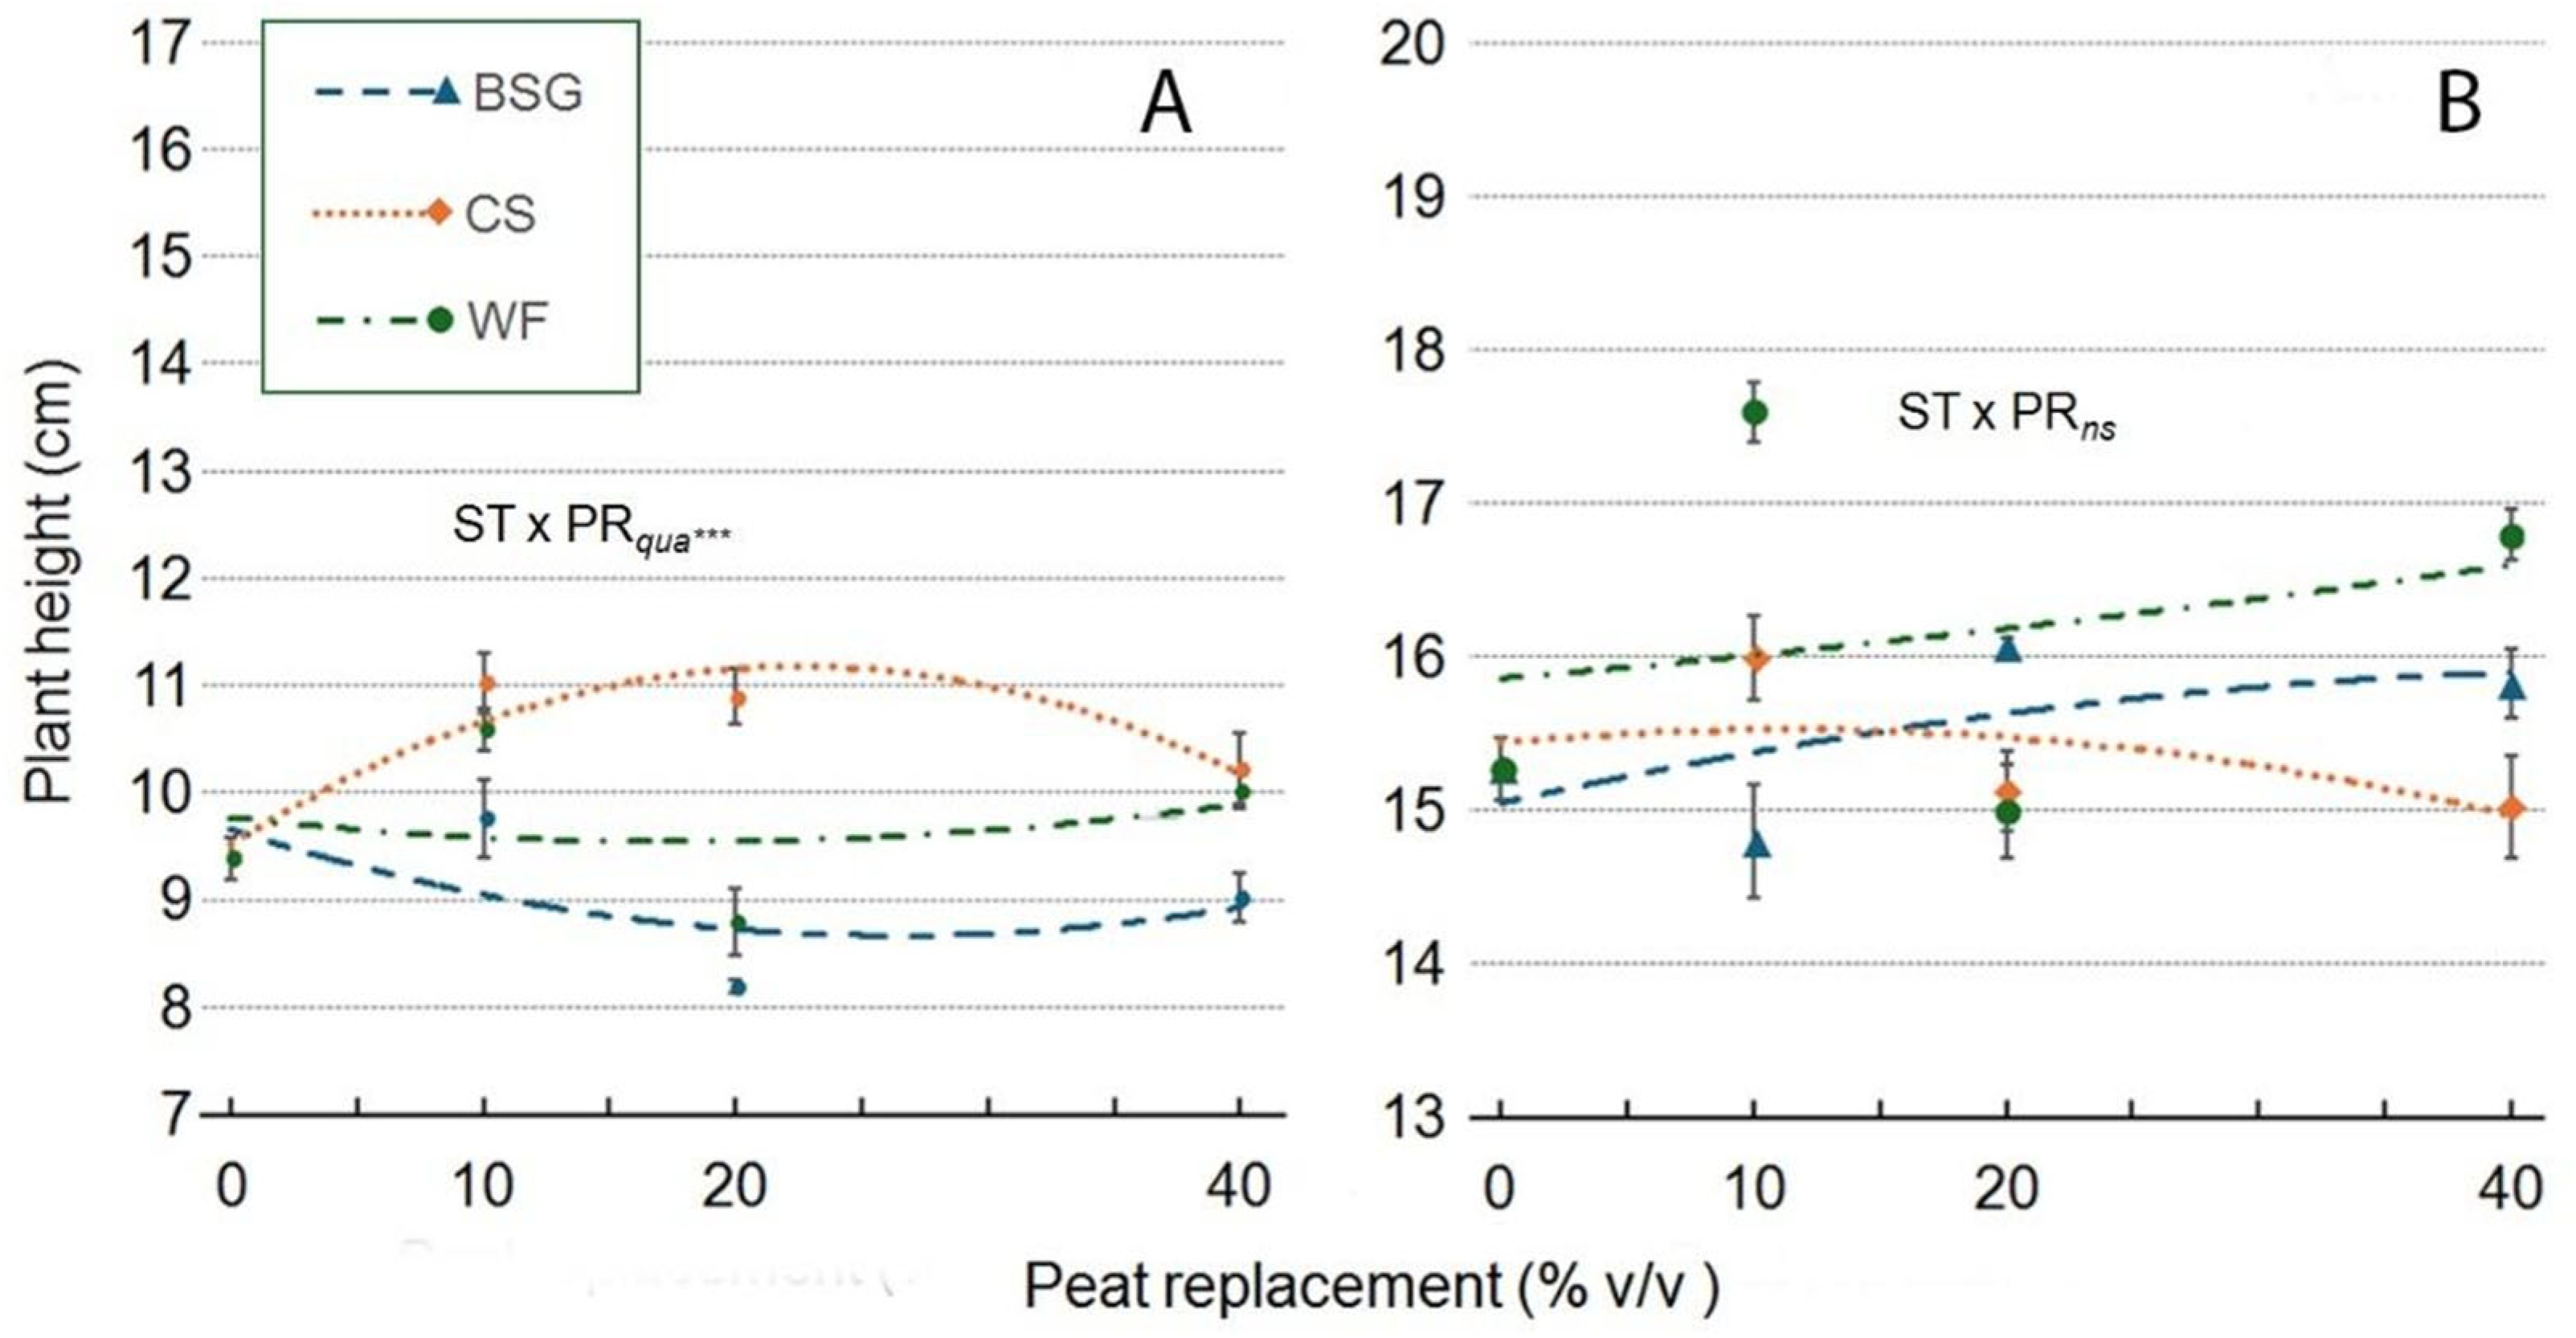
Figure 12.
Effect of peat replacement level (PR, 0–40% v/v) with three alternative organic matrices (ST)—brewer’s spent grain (BSG), coffee silverskin (CS), and wood fiber (WF)—on leaves (no.: number) in Victoria (A) and Amistad (B) genotypes at the end of the vegetative phase (January 14, 2024). Data points represent means ± standard error (n = 3). Statistical analysis performed through ANOVA: ns, *, **, and ***, not significant or significant at P≤ 0.05, P≤ 0.01, or P≤ 0.001, respectively. Orthogonal polynomial contrasts were employed to evaluate linear (lin) and quadratic (qua) trends.
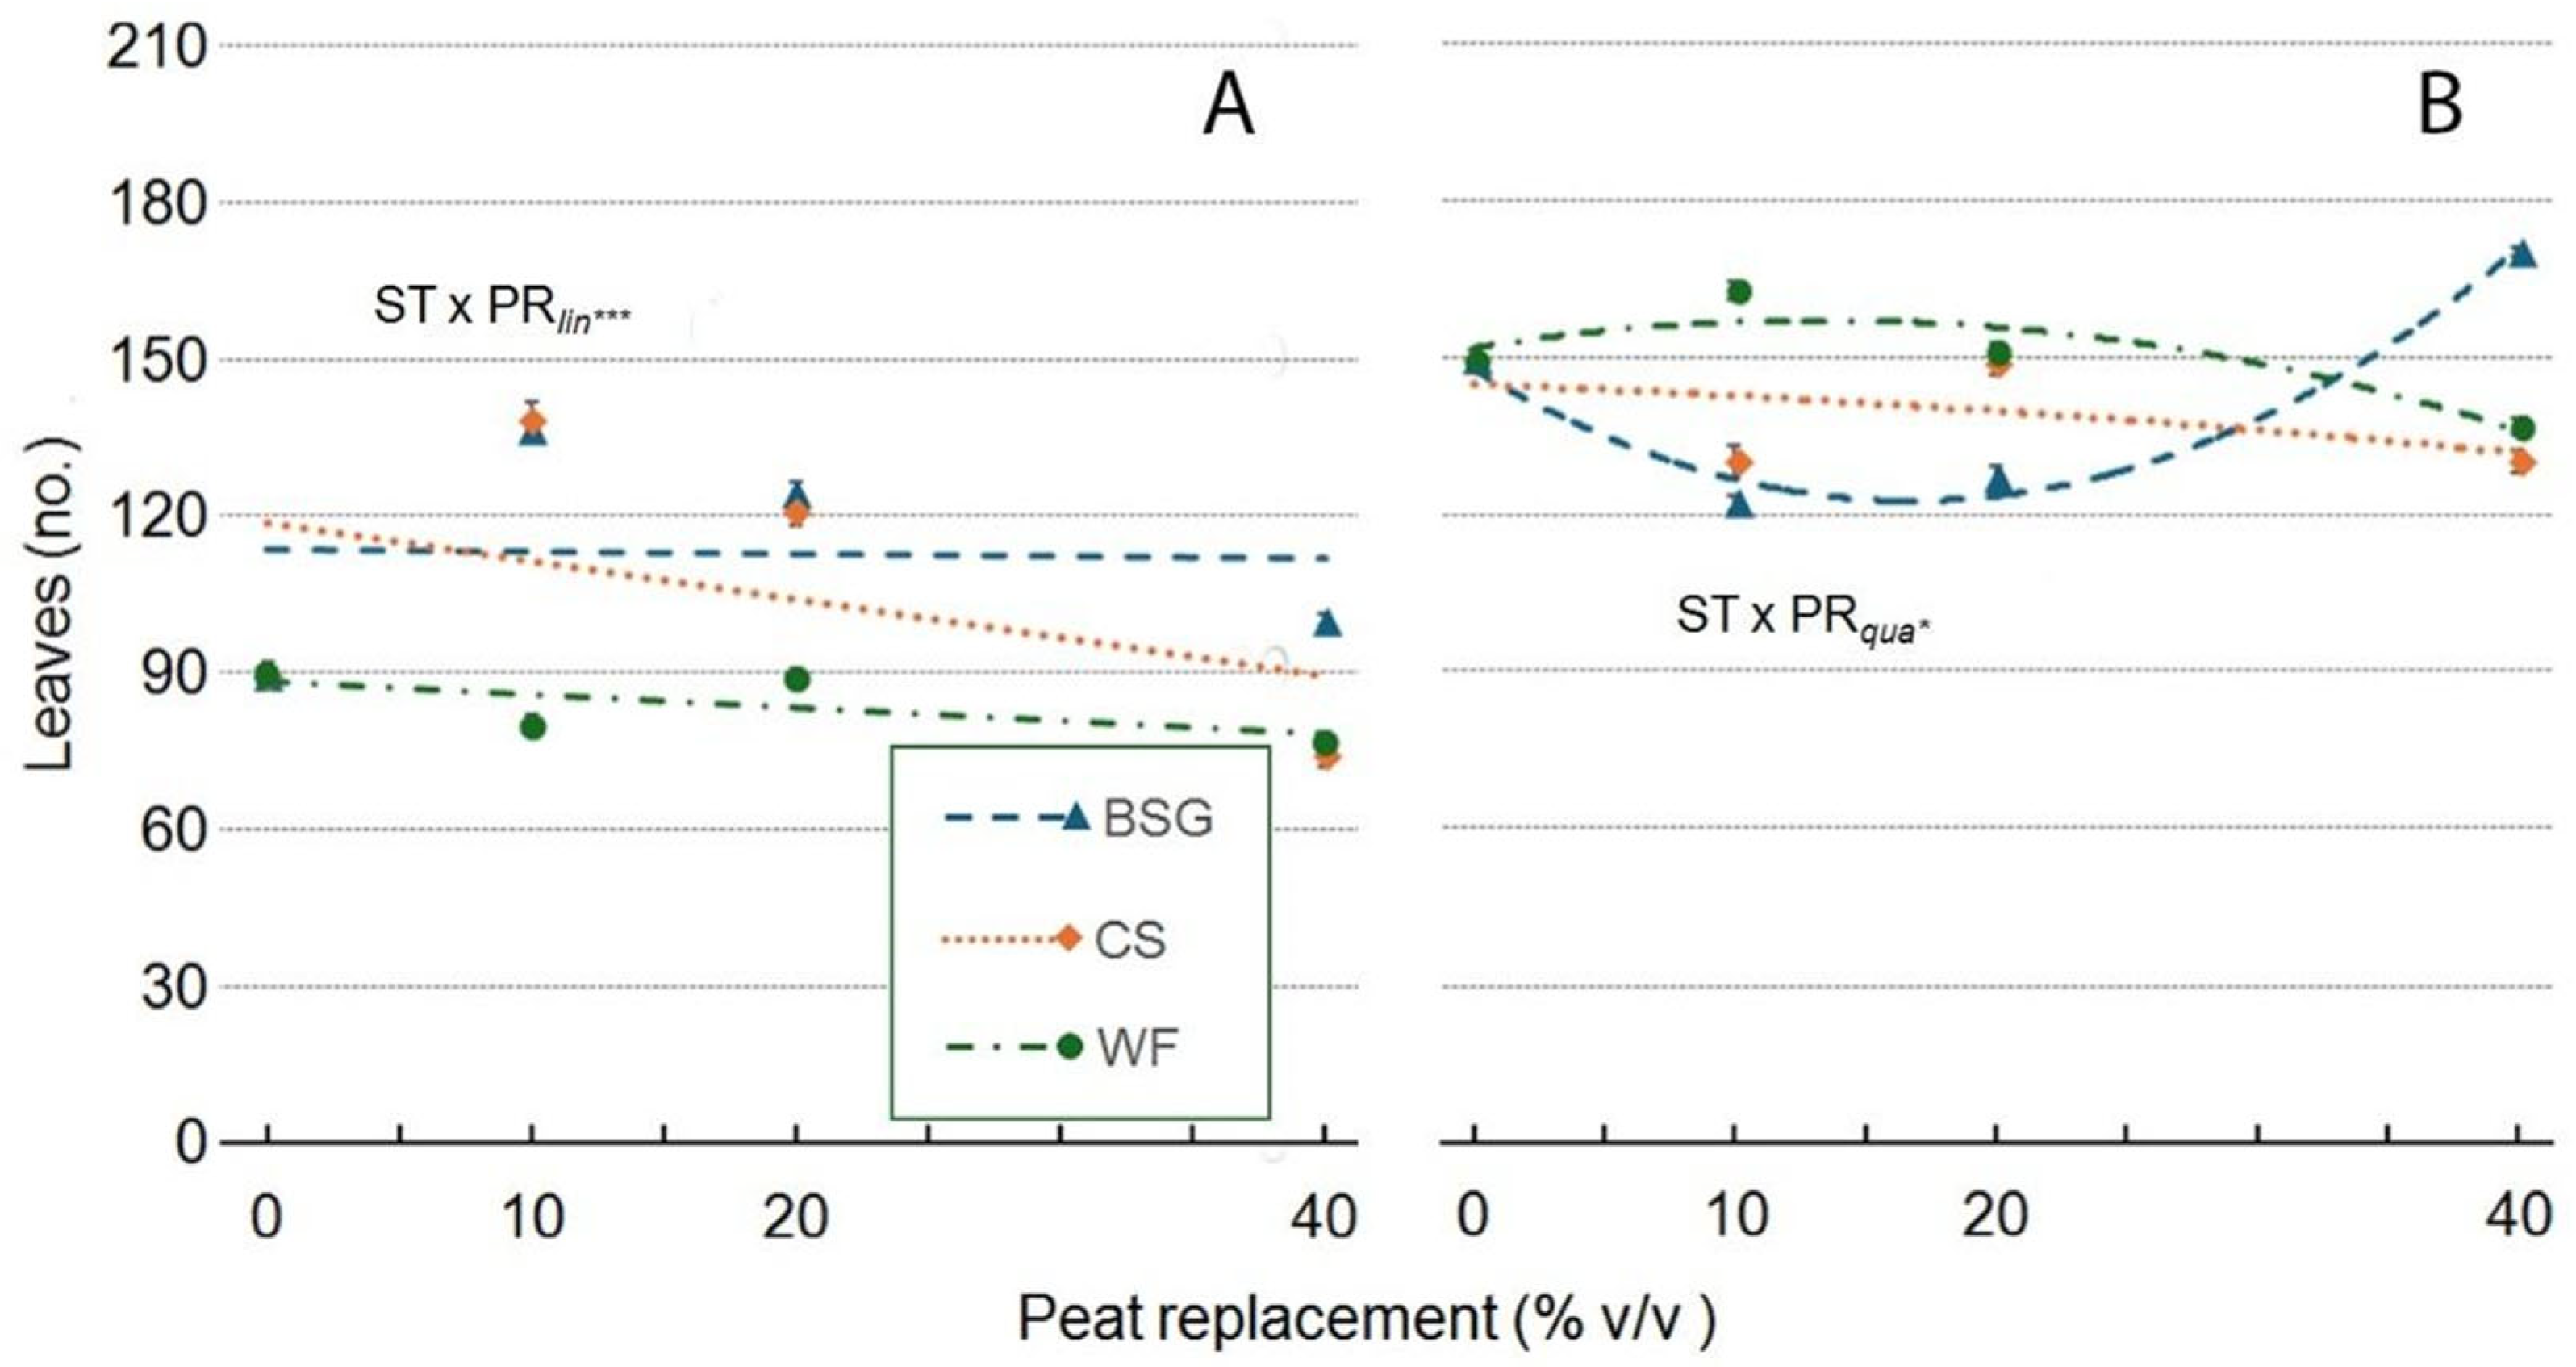
Figure 13.
Effect of peat replacement level (PR, 0–40% v/v) with three alternative organic matrices (ST)—brewer’s spent grain (BSG), coffee silverskin (CS), and wood fiber (WF)—on leaf area (cm2) in Victoria (A) and Amistad (B) genotypes at the end of the vegetative phase (January 14, 2024). Data points represent means ± standard error (n = 3). Statistical analysis performed through ANOVA: ns, *, **, and ***, not significant or significant at P≤ 0.05, P≤ 0.01, or P≤ 0.001, respectively. Orthogonal polynomial contrasts were employed to evaluate linear (lin) and quadratic (qua) trends.
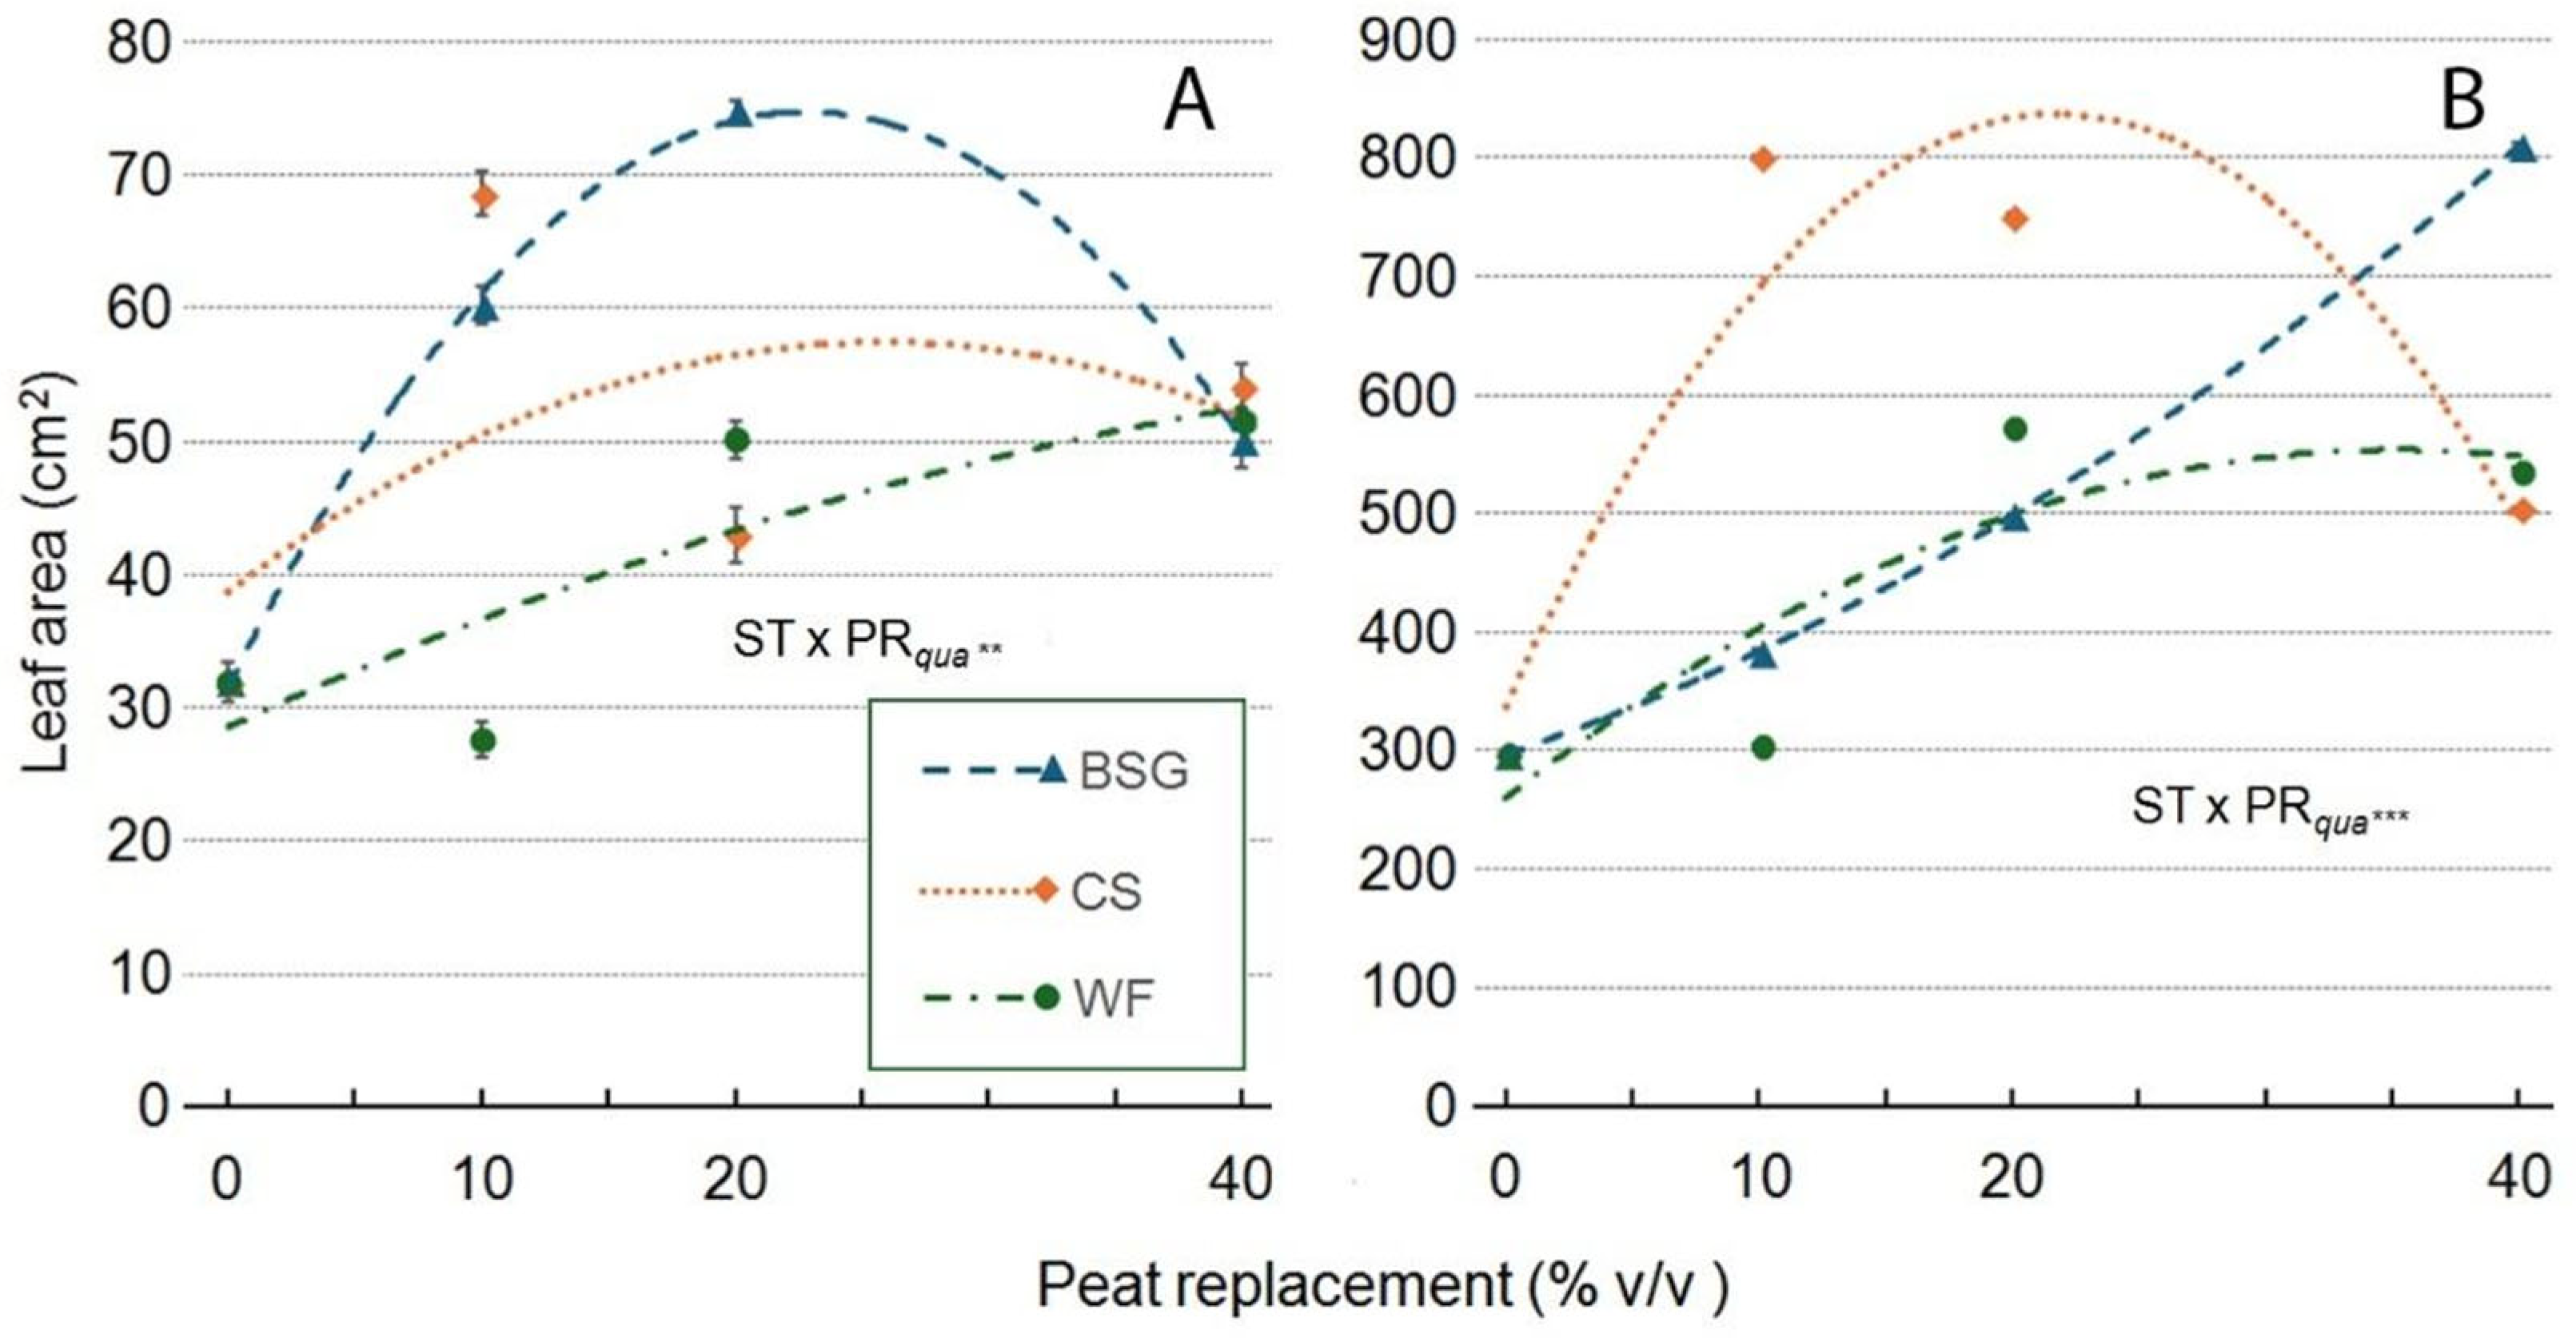
Figure 17.
Effect of peat replacement level (PR, 0–40% v/v) with three alternative organic matrices (ST)—brewer’s spent grain (BSG), coffee silverskin (CS), and wood fiber (WF)—on plant dry matter content (g 100 g-1 FW) in Victoria (A) and Amistad (B) genotypes at the end of the vegetative phase (January 14, 2024). Data points represent means ± standard error (n = 3). Statistical analysis performed through ANOVA: ns, *, **, and ***, not significant or significant at P≤ 0.05, P≤ 0.01, or P≤ 0.001, respectively. Orthogonal polynomial contrasts were employed to evaluate linear (lin) and quadratic (qua) trends.
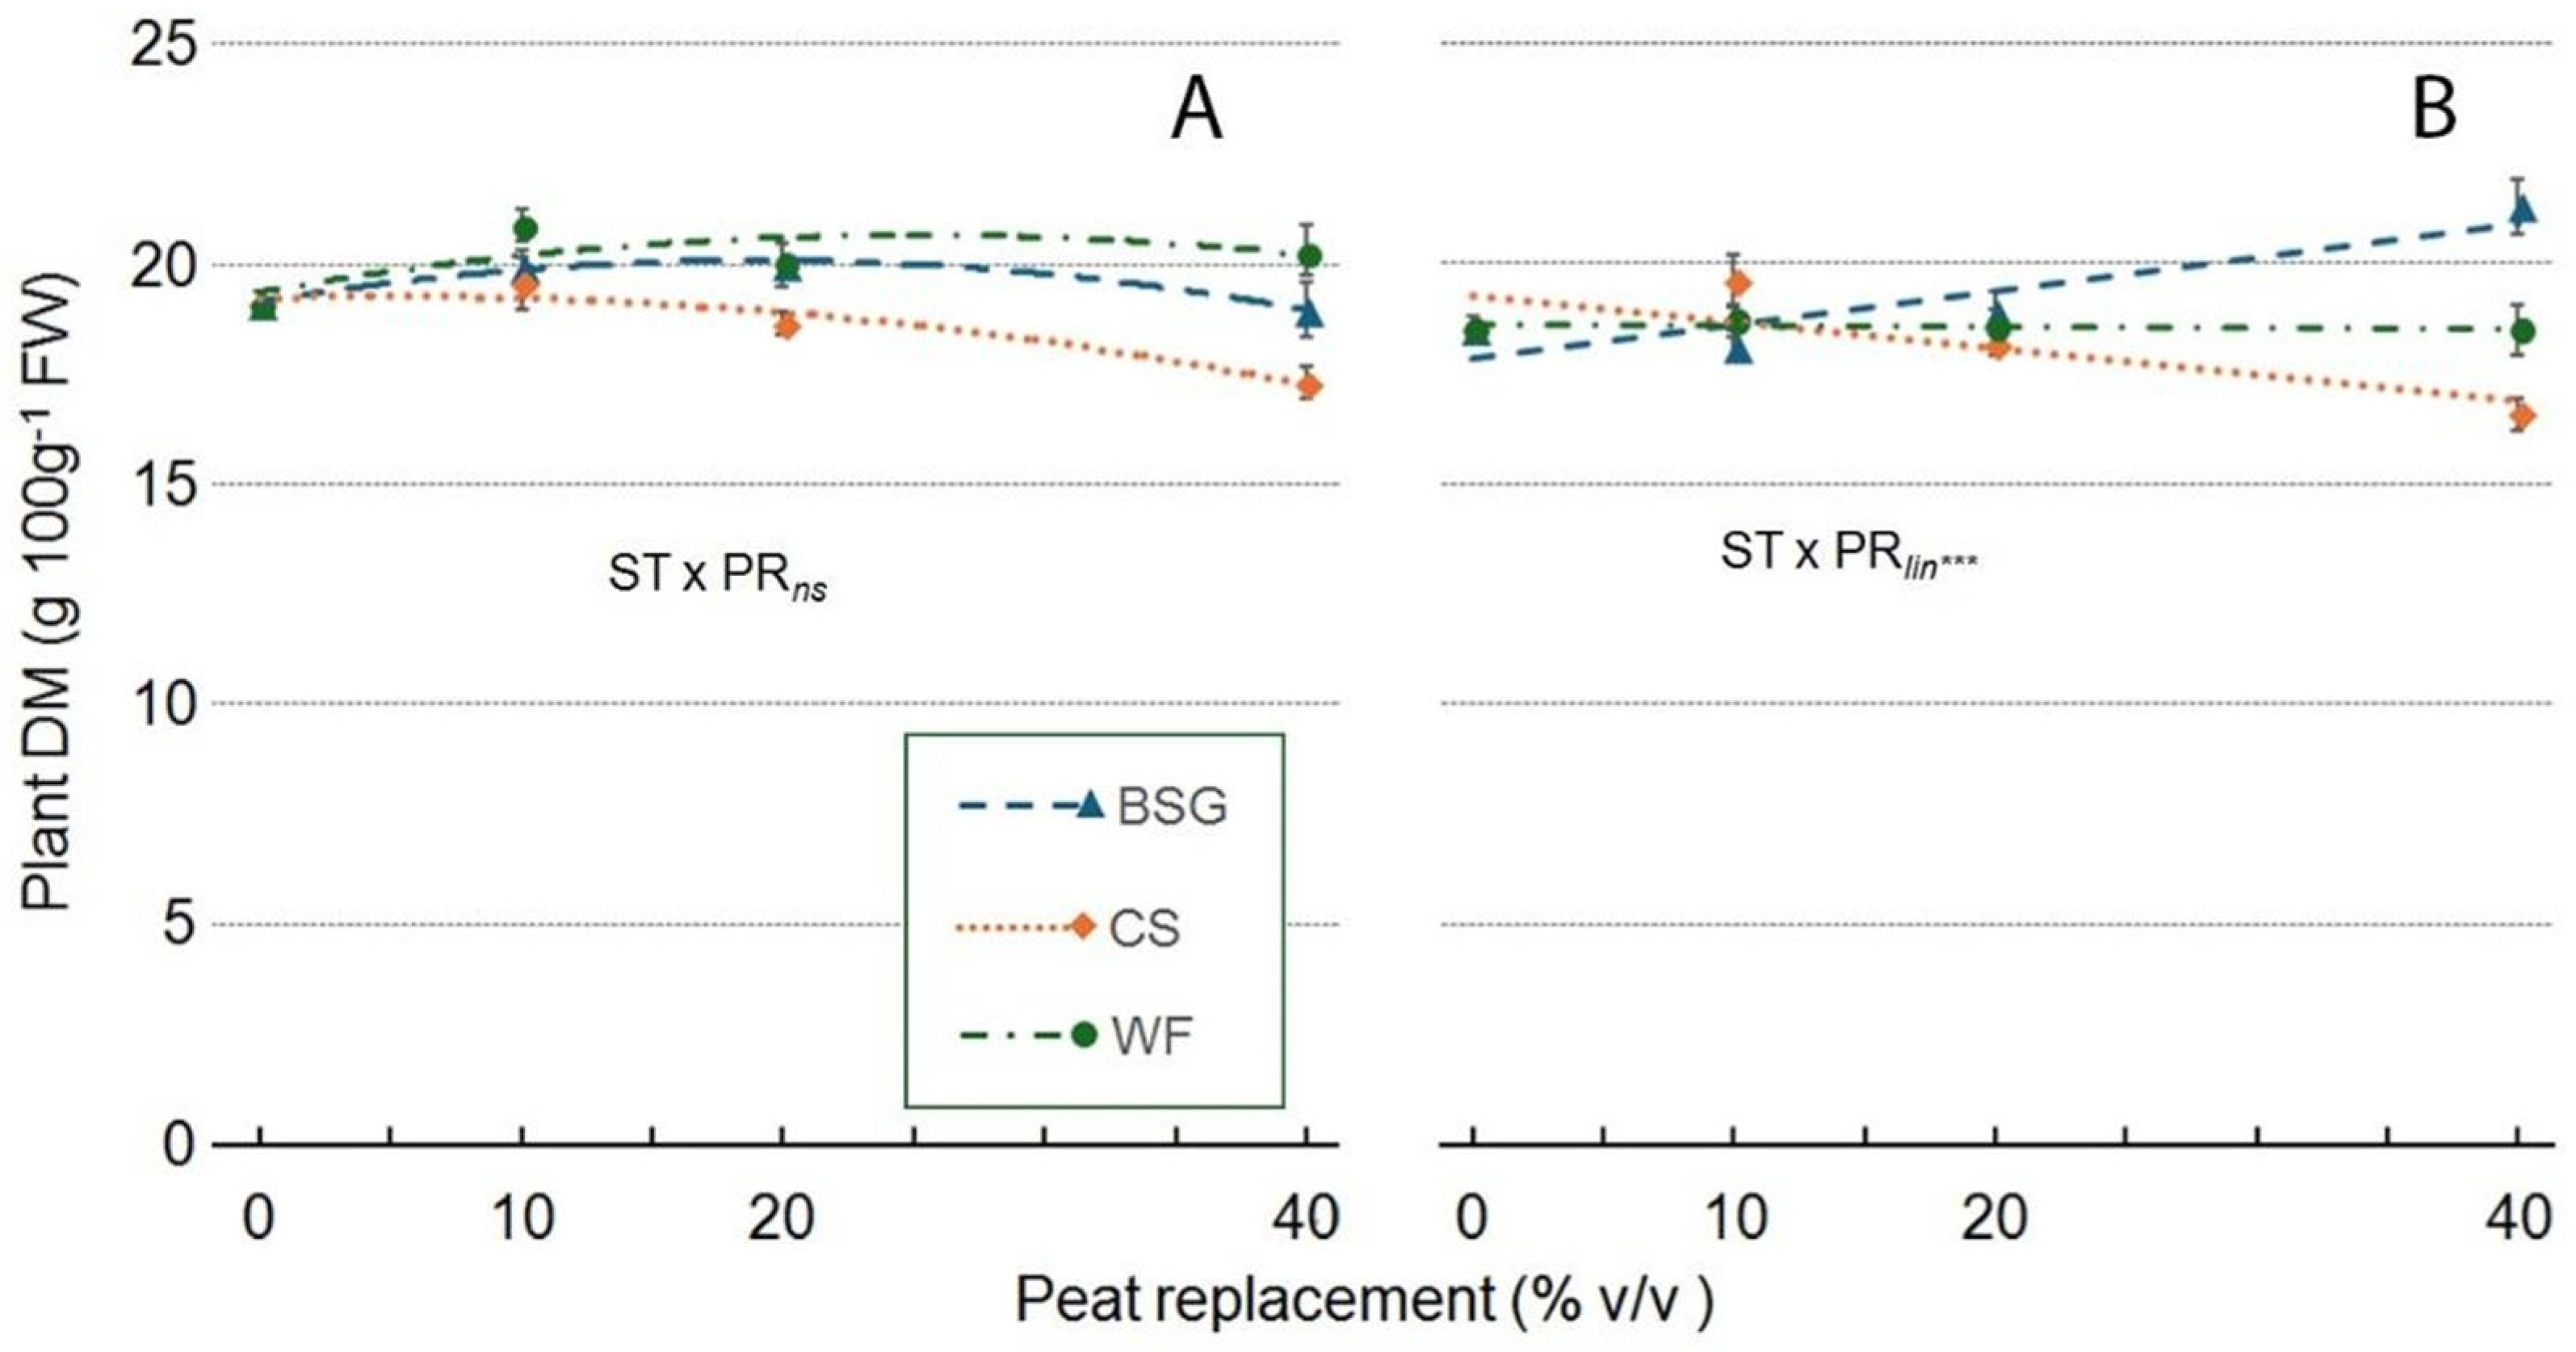
Figure 18.
Effect of peat replacement level (PR, 0–40% v/v) with three alternative organic matrices (ST)—brewer’s spent grain (BSG), coffee silverskin (CS), and wood fiber (WF)—on leachate pH values in ‘Victoria’ (A) and ‘Amistad’ (B) genotypes. (Data collected on December 15, 2023). Data points represent means ± standard error (n = 3). Statistical analysis performed through ANOVA: ns, *, **, and ***, not significant or significant at P≤ 0.05, P≤ 0.01, or P≤ 0.001, respectively. Orthogonal polynomial contrasts were employed to evaluate linear (lin) and quadratic (qua) trends.
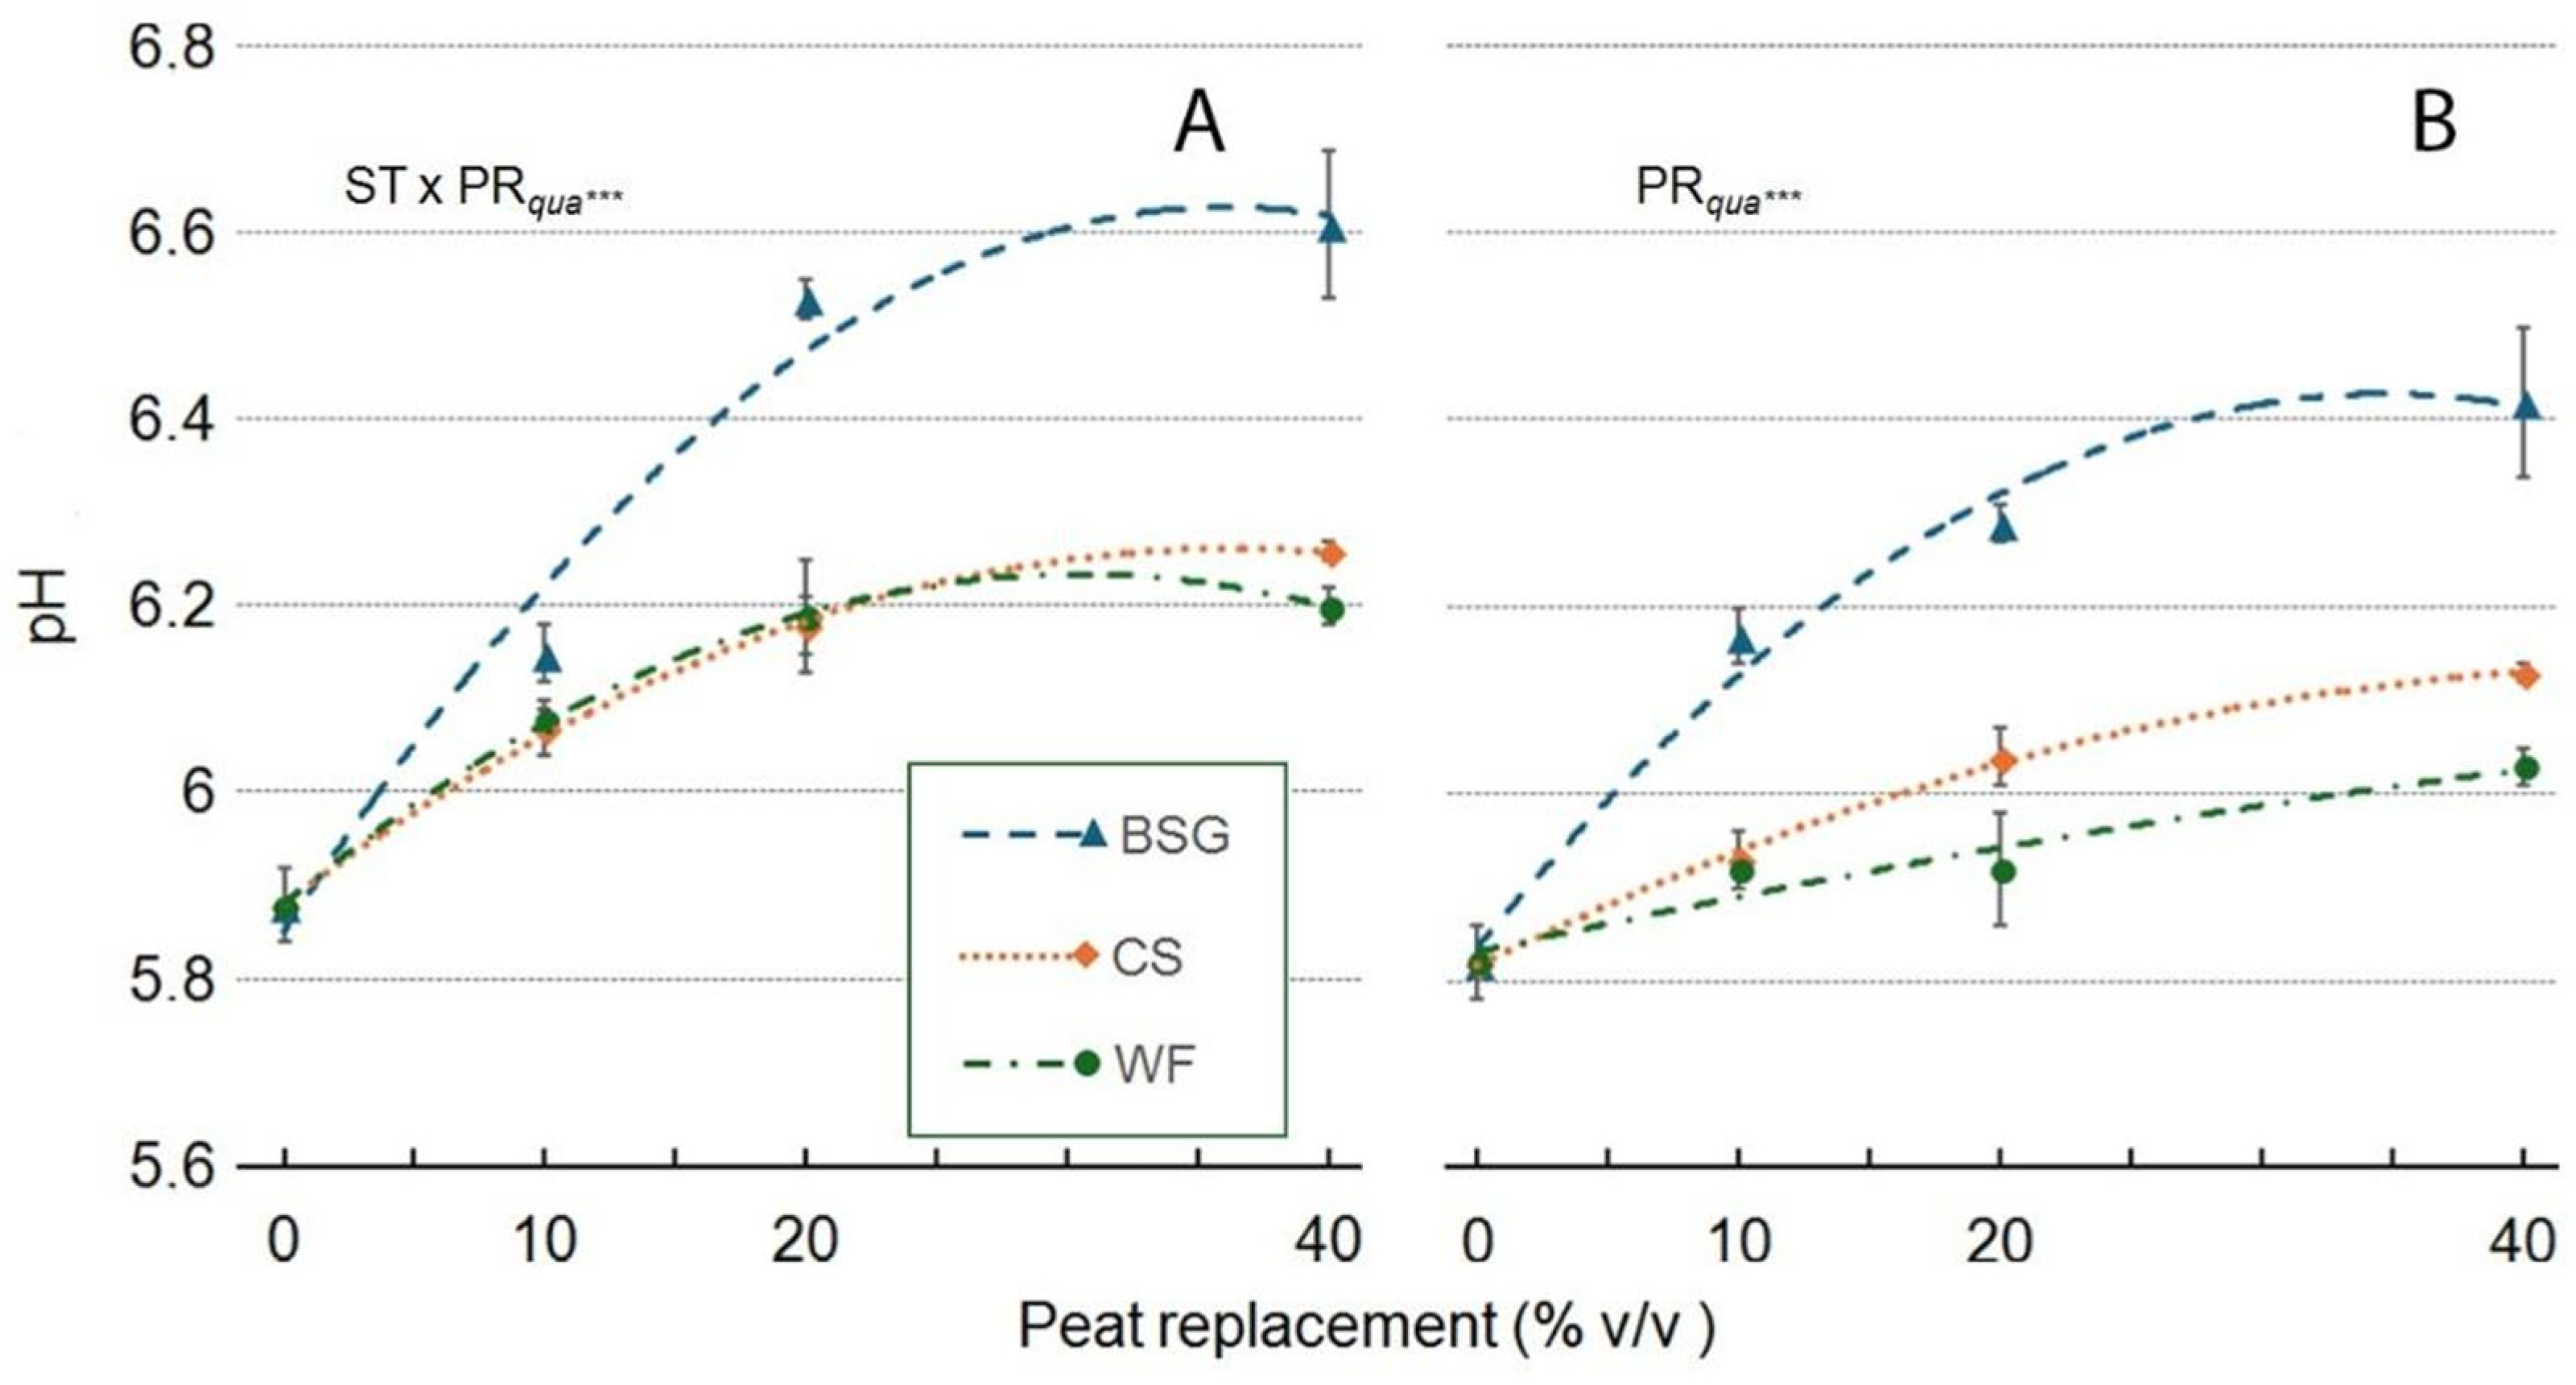
Figure 19.
Effect of peat replacement level (PR, 0–40% v/v) with three alternative organic matrices (ST)—brewer’s spent grain (BSG), coffee silverskin (CS), and wood fiber (WF)—on leachate EC values in ‘Victoria’ (A) and ‘Amistad’ (B) genotypes. (Data collected on December 15, 2023). Data points represent means ± standard error (n = 3). Statistical analysis performed through ANOVA: ns, *, **, and ***, not significant or significant at P≤ 0.05, P≤ 0.01, or P≤ 0.001, respectively. Orthogonal polynomial contrasts were employed to evaluate linear (lin) and quadratic (qua) trends.
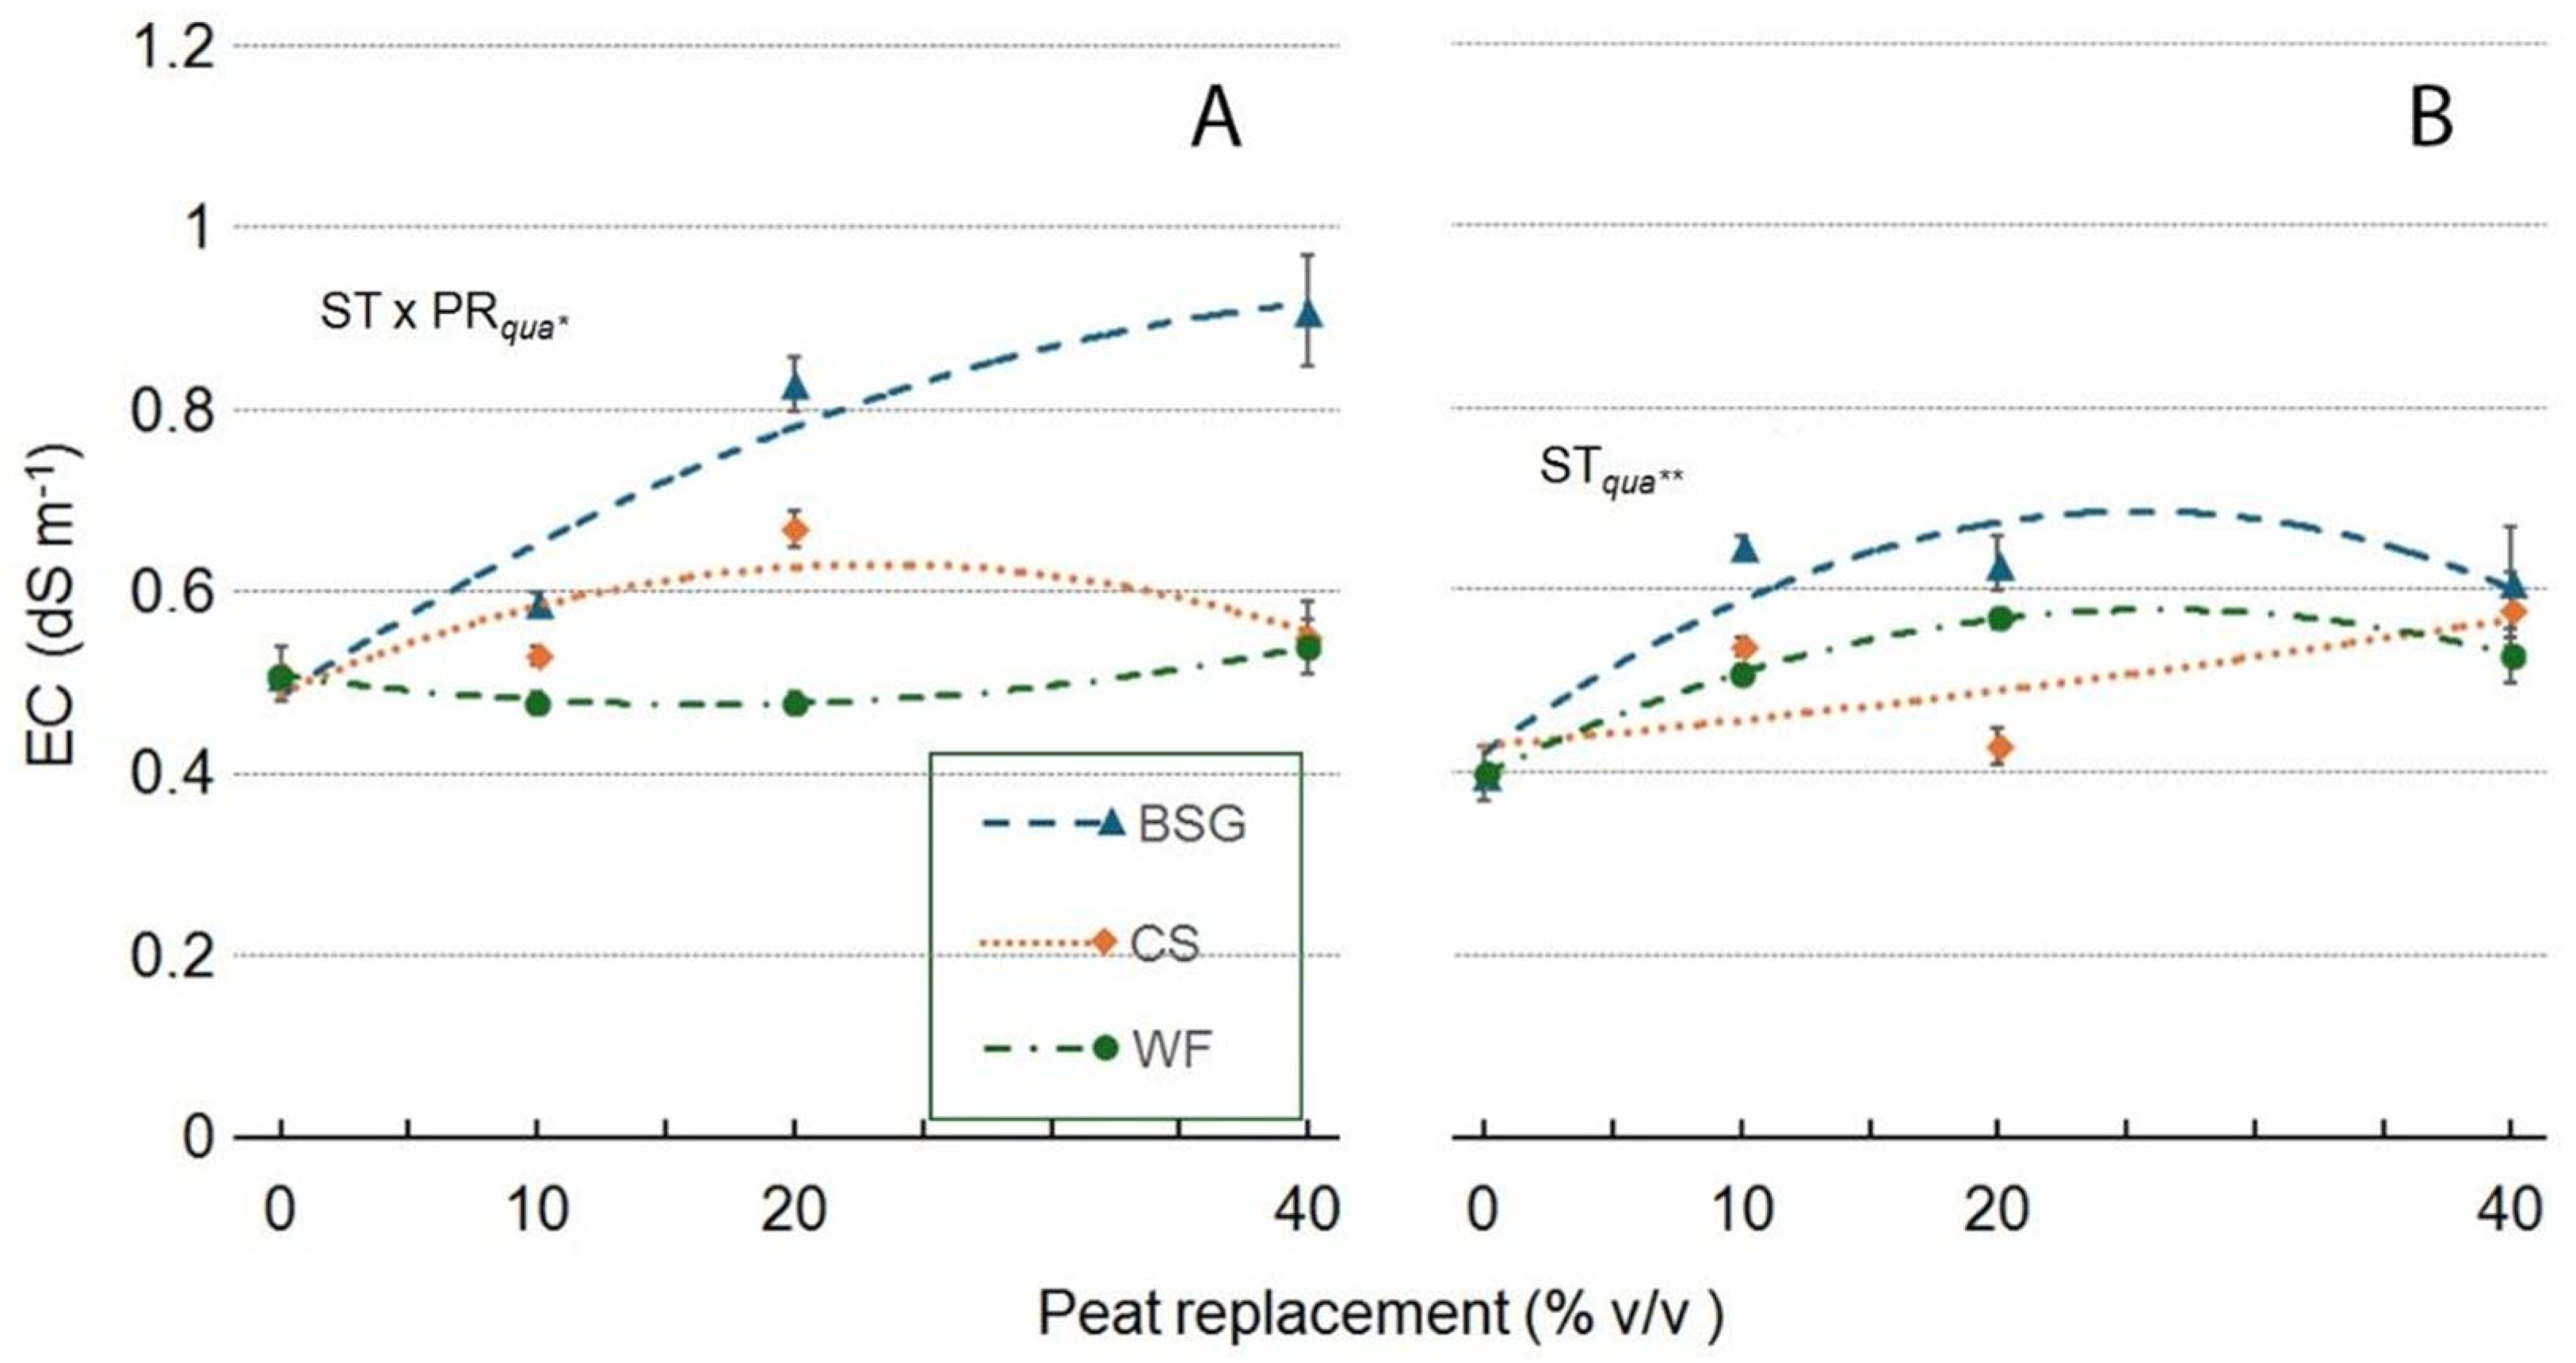
Figure 20.
Principal component analysis (PCA) biplot of the PC1 vs. PC2 (A) and PC1 vs. PC3 (B) principal components, illustrating the relationships between growth parameters and peat replacement treatments in the ‘Victoria’ genotype. The analysis includes shoot dry weight (Shoot DW), root dry weight (Root DW), leaf area, leaf number, plant height, and chlorophyll concentration (ChlC). Substrate treatments are denoted as follows: Peat (0% replacement, control), wood fiber (WF10, WF20, WF40 for 10%, 20%, and 40% peat replacement, respectively), coffee silverskin (CS10, CS20, CS40 peat replacement), and brewer’s spent grain (BSG10, BSG20, BSG40 peat replacement).
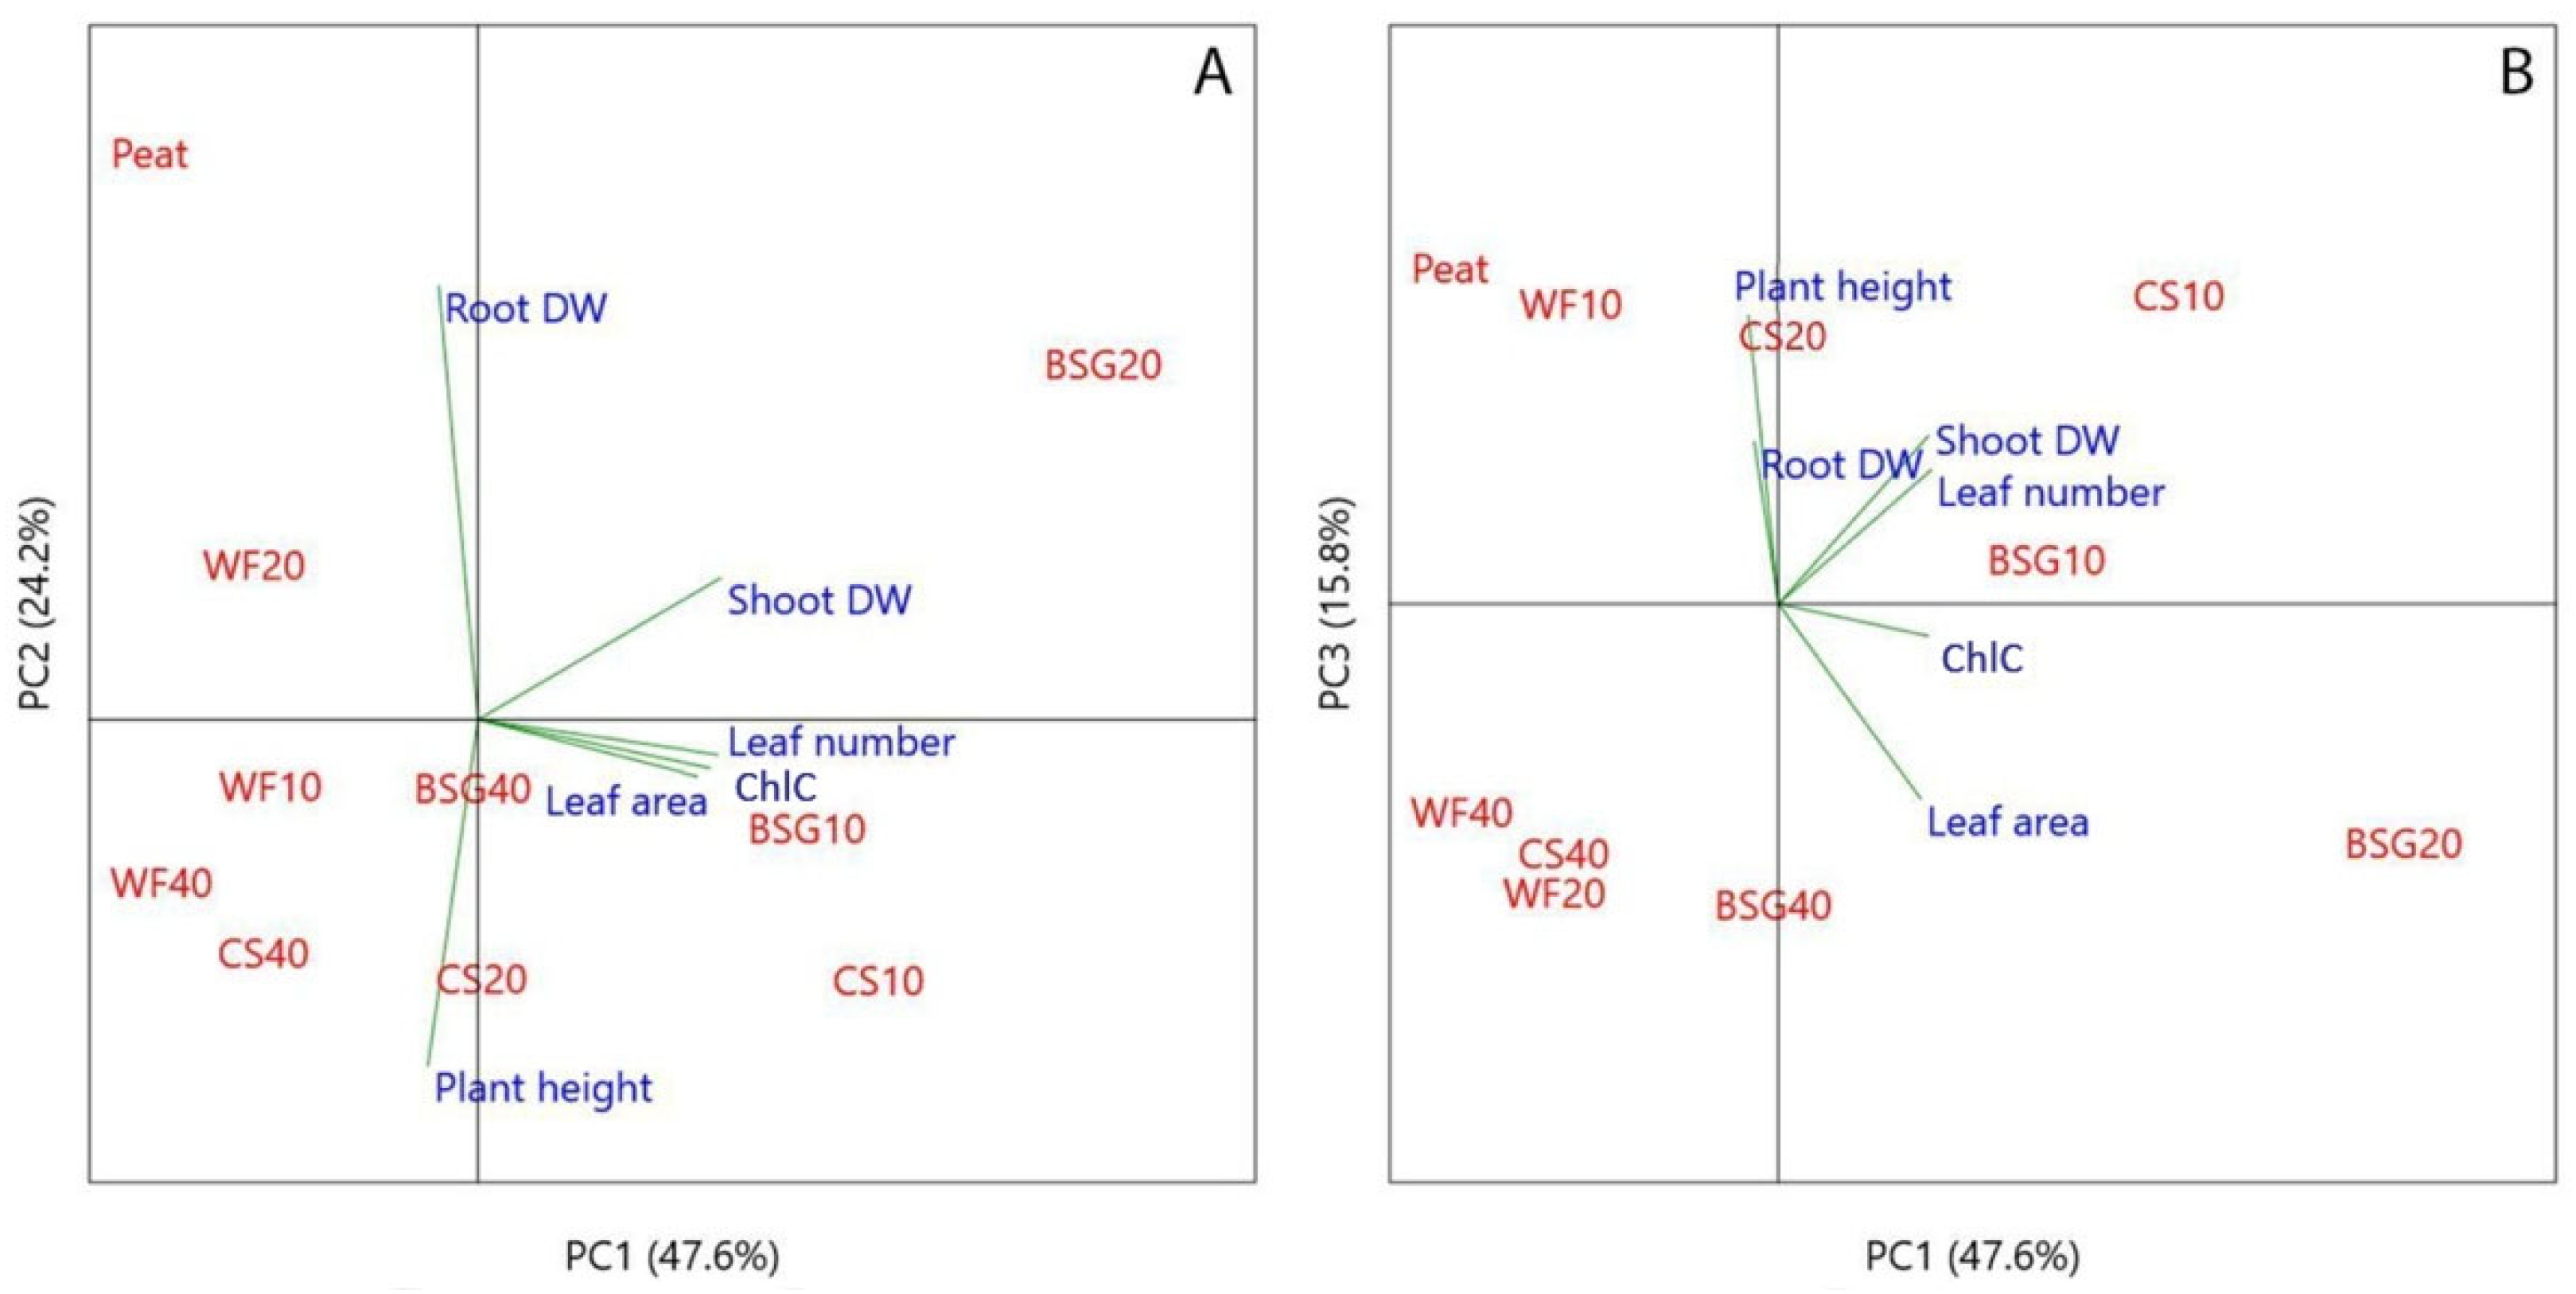
Figure 21.
Principal component analysis (PCA) biplot of the PC1 vs. PC2 (A) and PC1 vs. PC3 (B) principal components, illustrating the relationships between growth parameters and peat replacement treatments in the ‘Amistad’ genotype. The analysis includes shoot dry weight (Shoot DW), root dry weight (Root DW), leaf area, leaf number, plant height, and chlorophyll concentration (ChlC). Substrate treatments are denoted as follows: Peat (0% replacement, control), wood fiber (WF10, WF20, WF40 for 10%, 20%, and 40% replacement, respectively), coffee silverskin (CS10, CS20, CS40), and brewer’s spent grain (BSG10, BSG20, BSG40).
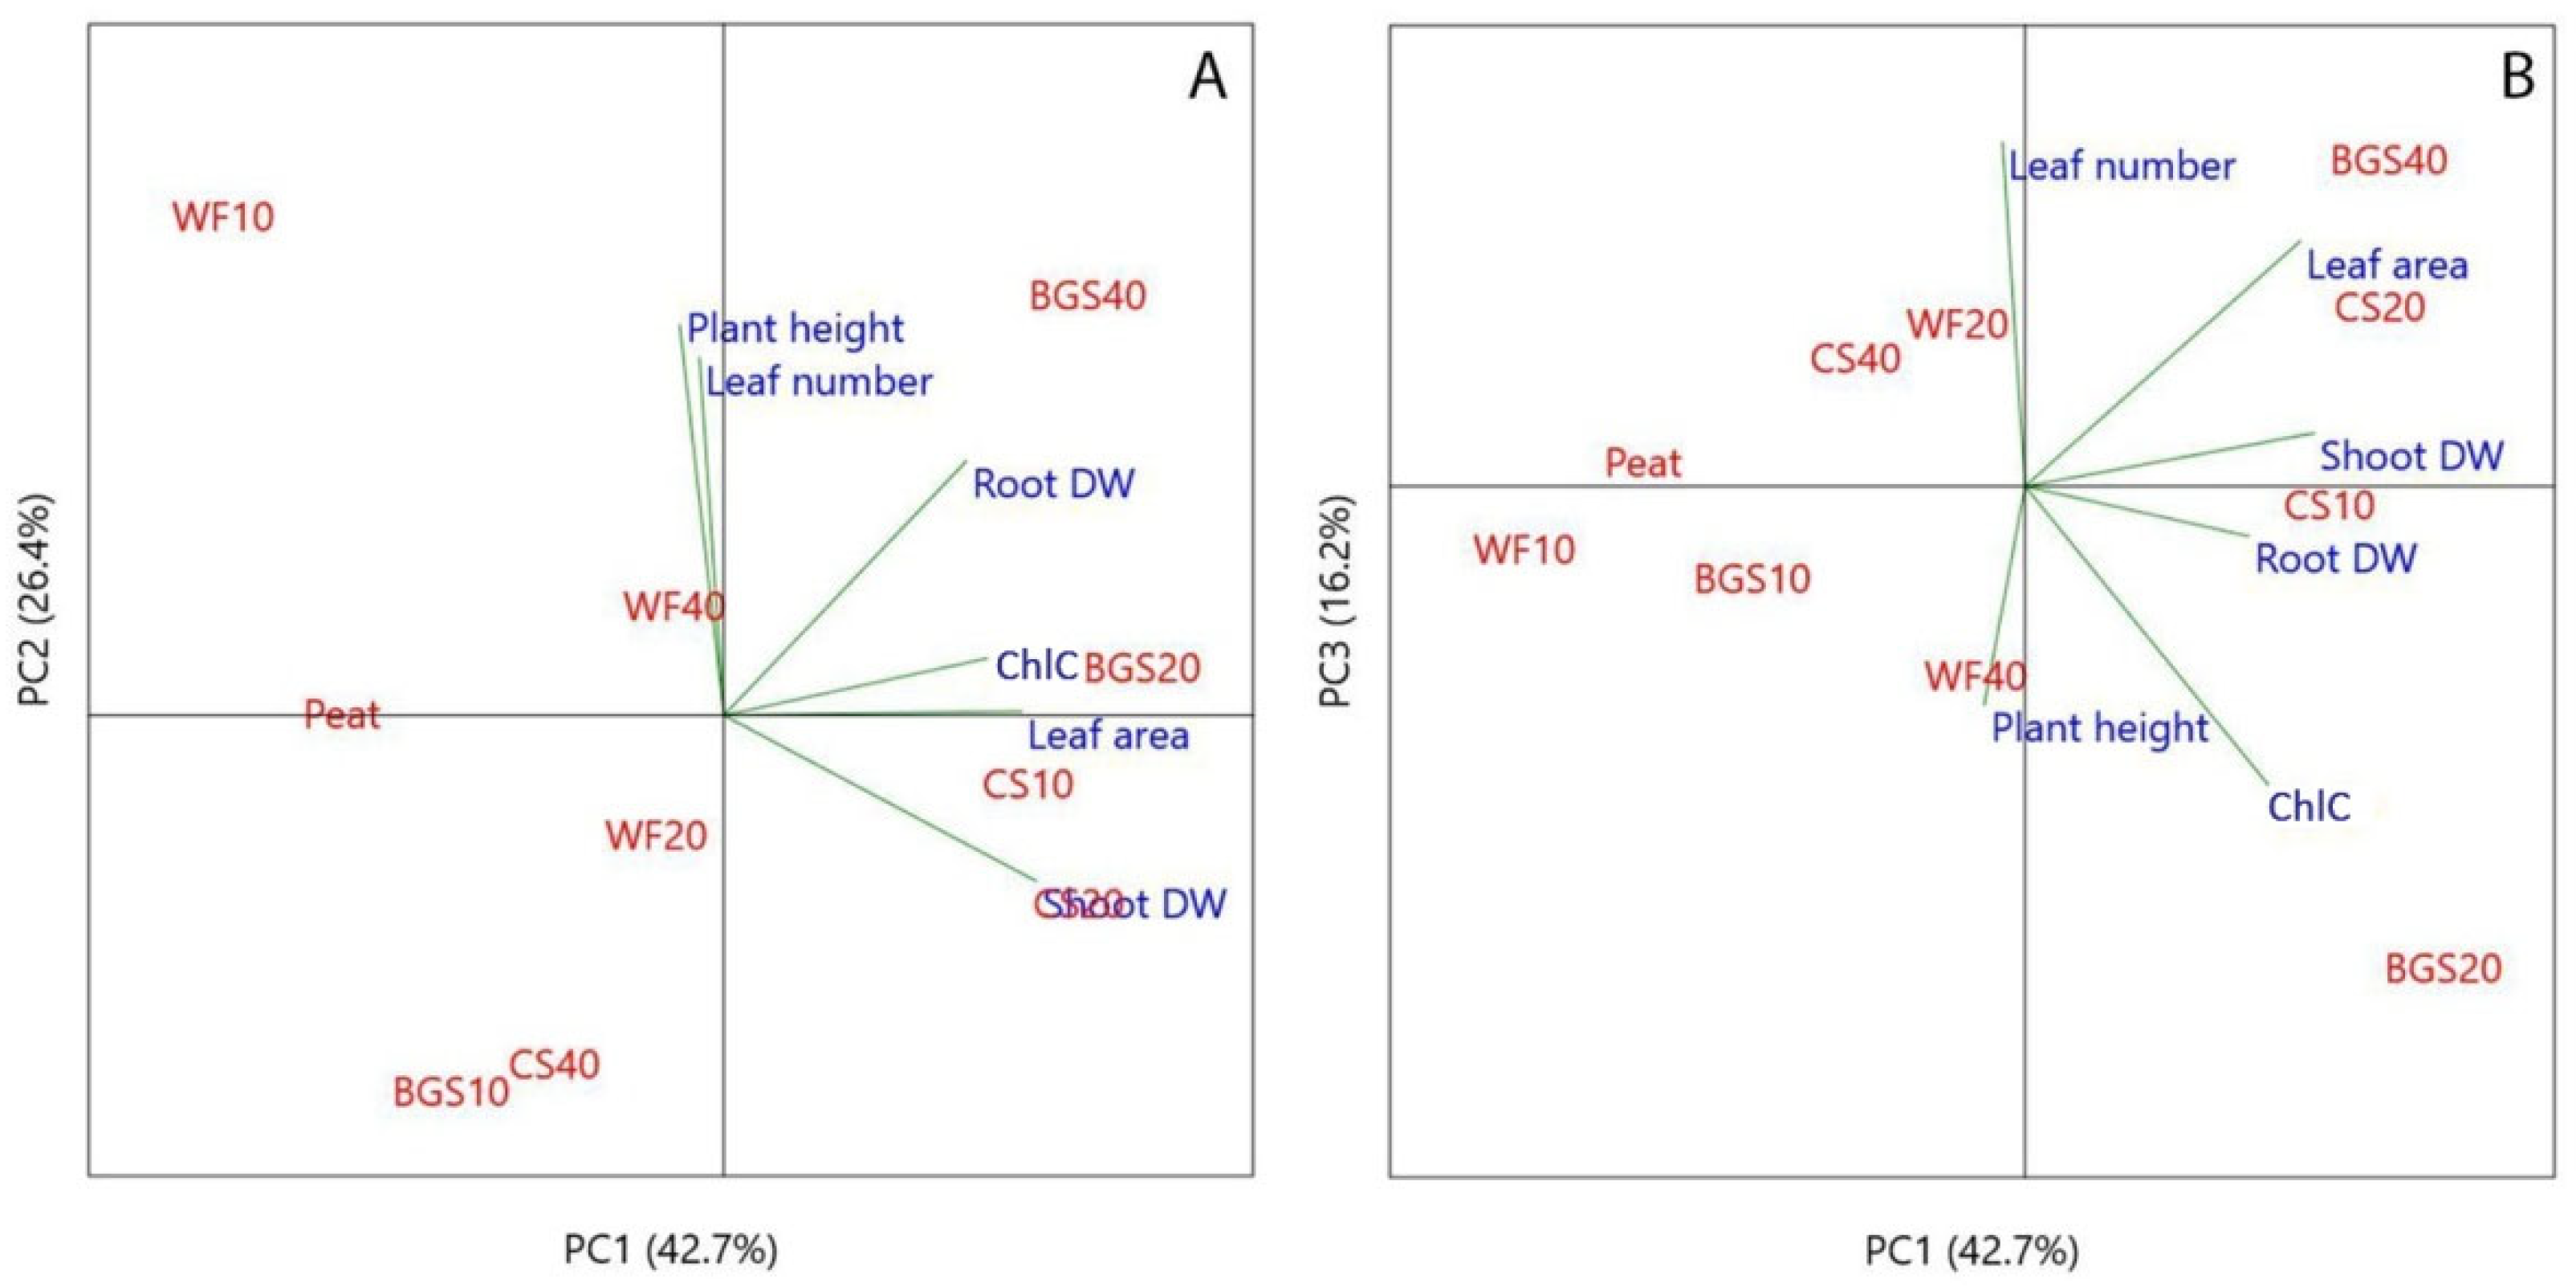
Table 2.
ANOVA results for the effects of peat replacement (PR) with wood fiber (WF), coffee silverskin (CS), and brewer's spent grain (BSG) on chemical properties, pH and EC (electrical conductivity) of the substrates assessed before cultivation. Orthogonal polynomial contrasts were employed to evaluate linear (lin) and quadratic (qua) trends.
| Treatment | pH | EC |
| Wood fiber | ||
| PR | ns | *** |
| PRlin | ns | ** |
| PRqua | ns | ** |
| Coffee silverskin | ||
| PR | ns | ** |
| PRlin | ns | ** |
| PRqua | ns | ** |
| Brewer's spent grain | ||
| PR | ns | *** |
| PRlin | ns | *** |
| PR qua | ns | ns |
a ns, *, **, and ***, not significant or significant at P≤ 0.05, P≤ 0.01, or P≤ 0.001, respectively.
Table 3.
ANOVA results showing the effect of Substrate Type (ST) and Peat Replacement (PR) on the main growth parameters in ‘Victoria’ genotype at the end of the vegetative phase (January 14, 2024). DW: Dry Weight, DM: Dry Matter, no.: number; ChlC: Chlorophyll Concentration; LA: leaf area. Orthogonal polynomial contrasts were employed to evaluate linear (lin) and quadratic (qua) trends.
| Treatment | Plant height (cm) | Leaves (no./plant) | Leaf area (cm2/plant) |
ChlC (µmol m-2 LA) |
Shoot DW (g/plant) | Root DW (g/plant) |
Plant DM (g 100 g-1 FW) |
| Substrate Type (ST) | ***a | *** | *** | *** | *** | ns | *** |
| Peat replacement (PR) | *** | *** | *** | *** | *** | *** | ** |
| PRlin | ns | *** | *** | *** | *** | *** | ns |
| PRqua | ns | *** | *** | *** | * | *** | ns |
| ST x PR | *** | *** | *** | *** | *** | ns | ns |
| ST*PRlin | ns | *** | *** | *** | *** | ns | ns |
| ST*PRqua | *** | ns | *** | *** | *** | ns | ns |
a ns, *, **, and ***, not significant or significant at P ≤ 0.05, P ≤ 0.01, or P ≤ 0.001, respectively.
Table 4.
ANOVA results showing the effect of Substrate Type (ST) and Peat Replacement (PR) on plant growth parameters in ‘Amistad’ genotype at the end of the vegetative phase (January 14, 2024). DW: Dry Weight, DM: Dry Matter, no.: number; ChlC: Chlorophyll Concentration LA: leaf area. Orthogonal polynomial contrasts were employed to evaluate linear (lin) and quadratic (qua) trends.
| Treatment | Plant height (cm) | Leaves (no./plant) | Leaf area (cm2/plant) |
ChlC (µmol m-2 LA) |
Shoot DW (g/plant) | Root DW (g/plant) |
Plant DM (g 100 g-1 FW) |
| Substrate type (ST) | nsa | * | *** | *** | *** | *** | * |
| Peat Replacement (PR) | ns | ns | *** | *** | *** | * | ns |
| PRlin | ns | ns | *** | * | *** | ** | ns |
| PRqua | ns | * | *** | *** | *** | ns | ns |
| ST x PR | * | *** | *** | *** | *** | *** | *** |
| ST x PRlin | ns | *** | *** | *** | ns | *** | *** |
| ST x PRqua | ns | * | *** | ** | ** | * | ns |
a ns, *, **, and ***, not significant or significant at P ≤ 0.05, P ≤ 0.01, or P ≤ 0.001, respectively.
Table 5.
ANOVA results showing the effect of Substrate type (ST) and peat replacement (PR) on leachate pH and EC (electrical conductivity) values in ‘Victoria’ genotype. (Data collected on December 15, 2023). Orthogonal polynomial contrasts were employed to evaluate linear (lin) and quadratic (qua) trends.
| Victoria | pH | EC (dS m-1) |
| Substrate type (ST) | ***a | *** |
| Peat replacement (PR) | *** | *** |
| PRlin | *** | *** |
| PRqua | *** | *** |
| ST x PR | *** | *** |
| ST*PRlin | *** | *** |
| ST*PRqua | *** | * |
a ns, *, **, and ***, not significant or significant at P ≤ 0.05, P ≤ 0.01, or P ≤ 0.001, respectively.
Table 6.
ANOVA results showing the effect of Substrate type (ST) and peat replacement (PR) on leachate pH and EC (electrical conductivity) values in ‘Amistad’ genotype. (Data collected on December 15, 2023). Orthogonal polynomial contrasts were employed to evaluate linear (lin) and quadratic (qua) trends.
| Amistad | pH | EC (dS m-1) |
| Substrate type (ST) | ***a | ns |
| Peat replacement (PR) | *** | ** |
| PRlin | *** | ** |
| PRqua | *** | ** |
| ST x PR | ns | ns |
| ST x PR lin | ns | ns |
| ST x PR qua | ns | ns |
a ns, *, **, and ***, not significant or significant at P ≤ 0.05, P ≤ 0.01, or P ≤ 0.001, respectively.
Table 7.
Substrate treatments used in the trial. The mixtures were formulated using peat as the primary organic component, with increasing levels of peat replacement (ranging from 0% to 40%) by alternative organic matrices: wood fiber (WF), coffee silverskin (CS), and brewer’s spent grain (BSG).
Table 7.
Substrate treatments used in the trial. The mixtures were formulated using peat as the primary organic component, with increasing levels of peat replacement (ranging from 0% to 40%) by alternative organic matrices: wood fiber (WF), coffee silverskin (CS), and brewer’s spent grain (BSG).
| Substrate treatment code | Peat | Peat replacement | Matrices used as peat replacement |
| (% v/v of the organic fraction of the substrate) | |||
| 0PR | 100 | 0 | None |
| WF10 | 90 | 10 | Wood fiber |
| WF20 | 80 | 20 | |
| WF40 | 60 | 40 | |
| CS10 | 90 | 10 | Coffee silverskin |
| CS20 | 80 | 20 | |
| CS40 | 60 | 40 | |
| BSG10 | 90 | 10 | Brewer’s spent grain |
| BSG20 | 80 | 20 | |
| BSG40 | 60 | 40 | |
Table 8.
Botanical and ornamental characteristics in cv. Victoria and Amistad®.
| Features | cv. Victoria | cv. Amistad® |
| Common Name |
Victoria Blue sage | Amistad sage, Friendship sage |
| Life Cycle | Perennial (often grown as annual in colder regions) | Perennial (often grown as annual in colder regions) |
| Height (cm) | 30–60 | 100–150 |
| Growth Habit | Compact | Upright, tall, bushy |
| Leaves | Narrow, lance-shaped, mid-green | Ovate, aromatic, serrated edges, dark green |
| Inflorescence | Dense, upright spikes of small tubular flowers | Spikes of tubular flowers |
| Inflorescence Color |
Intense blue-violet | Deep purple with near-black calyces |
| Bloom Period | Spring- Winter | Spring - Late Fall |
| Propagation | Seeds or stem cuttings | Primarily by cuttings (sterile hybrid) |
Disclaimer/Publisher’s Note: The statements, opinions and data contained in all publications are solely those of the individual author(s) and contributor(s) and not of MDPI and/or the editor(s). MDPI and/or the editor(s) disclaim responsibility for any injury to people or property resulting from any ideas, methods, instructions or products referred to in the content. |
© 2025 by the authors. Licensee MDPI, Basel, Switzerland. This article is an open access article distributed under the terms and conditions of the Creative Commons Attribution (CC BY) license (http://creativecommons.org/licenses/by/4.0/).
Copyright: This open access article is published under a Creative Commons CC BY 4.0 license, which permit the free download, distribution, and reuse, provided that the author and preprint are cited in any reuse.


