
Submitted:
08 August 2025
Posted:
11 August 2025
You are already at the latest version
Abstract
American Staffordshire Terriers (AST) with a c.296G>A variant in ARSG develop progres-sive ataxia, cerebellar atrophy, and neuronal accumulation of autofluorescent storage ma-terial. Human subjects with ARSG variants exhibit hearing loss and rod-cone dystrophy without apparent neurological involvement and arsg knock-out mice exhibit progressive ataxia, lysosomal storage and photoreceptor loss. A study was undertaken to determine whether ASTs homozygous for the c.296G>A variant exhibit retinal dysfunction con-sistent with human subjects and mice with ARSG variants. Owners of 8 of 11 affected ASTs reported observing late-onset visual impairment in their dogs. Affected dogs that were exhibiting signs of ataxia had attenuated electroretinogram (ERG) amplitudes indic-ative of rod and cone photoreceptor dysfunction, while ERG responses were not attenuat-ed in a younger dog that had not yet shown signs of ataxia or visual impairment. Auto-fluorescent inclusions were observed in the retinal pigment epithelium and retinal gan-glion cell layer of two affected dogs that were euthanized due to neurological disease pro-gression. These results indicate that while the disease phenotype varies between humans, mice and dogs with ARSG variants, progressive photoreceptor dysfunction is a consistent feature in all 3 species.
Keywords:
canine
; electroretinogram
; Usher type IV
; arylsulfatase G
; lysosomal storage disorder
; retinal pigment epithelium
1. Introduction
American Staffordshire terriers (AST) homozygous for a c.296G>A substitution (p.R99H) in the ARSG gene and arsg knockout mice display reduced arylsulfatase G (ARSG) enzyme activity and develop a late-onset neurodegenerative condition clinically characterized primarily by slowly progressive ataxia [1,2]. ARSG-deficient ASTs and mice exhibit cerebellar atrophy, loss of Purkinje cells and accumulation of autofluorescent and periodic acid–Schiff positive storage material in Purkinje cells and other cells in the brain [1,2]. It was proposed that the AST disorder be classified as a form of neuronal ceroid lipofuscinosis (NCL), a group of rare inherited lysosomal storage disorders characterized by intracellular accumulation of autofluorescent storage material and progressive neurodegeneration [1]. arsg knockout mice were found to have significant accumulation of glycosaminoglycans and the wildtype ARSG protein was shown to function as a lysosomal sulfatase, consistent with an alternative classification of the ARSG disorders as mucopolysaccharidoses (MPS) [2]. Retinal degeneration is a common feature of many lysosomal storage disorders, including most forms of NCL and MPS [3,4,5,6,7,8,9]. In a previous study, visual impairment was not noted in affected ASTs and no retinal pathology was observed [1]; however, in ARSG-deficient mice there was an early, progressive loss of photoreceptors [10].
Usher syndrome is a group of autosomal recessive diseases characterized by sensorineural hearing loss and rod-cone dystrophy. Mutations in genes with roles in inner ear hair cell development and photoreceptor maintenance underlie classic Usher syndrome; however, cases of atypical Usher syndrome have also been described with mutations in genes with less clear associations with these functions [11,12]. There have been 31 reported cases of atypical Usher syndrome associated with ARSG variants [13]. Most of these patients display hearing loss and rod-cone dystrophy. In contrast to ASTs and mice with ARSG mutations, human patients generally do not exhibit other neurological involvement, with the exception of two patients reported to have mild cerebellar atrophy without ataxia [13,14]. Interestingly, one patient was recently reported to have the same homozygous p.R99H variant as affected ASTs and another to have one copy of the p.R99H variant, the other being a splice variant predicted to lead to a premature stop codon [13]. Neither patient exhibited any systemic neurologic signs as of age 74 (homozygous patient) and age 55 (heterozygous patient). The homozygous p.R99H patient reported night blindness and photophobia starting in his early 40s and progressive hearing loss starting in his 50s. At the age of 55, the heterozygous p.R99H patient had rod-cone dystrophy with nondetectable scotopic and residual photopic responses and denied hearing loss.
Because visual impairment and retinal degeneration are associated with ARSG variants in mice and human subjects, a study was undertaken to determine whether retinal function was also affected in dogs homozygous for the ARSG disease variant.
2. Materials and Methods
2.1. Animals
Retinal function was assessed in three American Staffordshire Terriers (ASTs) homozygous for the ARSG c.296G>A risk allele that exhibited neurological signs and three ASTs homozygous for the ARSG reference allele that were neurologically normal (Table 1), as well as one younger presymptomatic dog that was homozygous for the ASRG risk allele. Eyes were obtained from two additional ASTs homozygous for the ARSG risk allele who did not undergo assessment of retinal function and who were euthanized due to progressive ataxia. In addition, owners of a total of 11 ASTs homozygous for the risk allele and 18 ASTs homozygous or heterozygous for the reference allele at least 6 years of age completed a questionnaire that included questions about potential neurological signs and visually-mediated behavior.
All of the ASTs that were homozygous for the ARSG risk variant that were 6 years or older exhibited late onset progressive ataxia whereas one that was 4 years old at the time of assessment did not exhibit this disease sign. Owners of dogs homozygous for the ARSG reference allele reported no neurologic signs. Six ASTs were examined at the University of Missouri Veterinary Health Center by a board-certified veterinary ophthalmologist for ophthalmologic exam, retinal imaging and electroretinography; dog ARSG-2 was examined by a board-certified veterinary ophthalmologist outside of the University of Missouri using the same protocol as the dogs examined in-house and results were sent to us. Experiments were performed in accordance with the ARVO Statement for the use of Animals in Ophthalmic and Vision Research and protocols were approved by the University of Missouri Animal Care and Use Committee.
2.2. Genotyping
The ARSG genotypes were determined by the Canine Genetics Laboratory at the University of Missouri College of Veterinary Medicine using an allelic discrimination assay. A Custom TaqMan SNP Genotyping Assay (Applied Biosystems) was designed for genotyping individual dogs for the ARSG variant. The PCR primer sequences were 5′-GGCCTCCCTGCTCACC-3′ and 5′- GAGGTGACCGCAAAGTTGTG-3′. The competing probe sequences were 5′-VIC- TGGGCCTCCGCAACG-NFQ-3′ (reference allele) and 5′-FAM- TGGGCCTCCACAACG-NFQ-3′ (variant allele). The amplifications were conducted in 20 µL volumes with a TaqMan Genotyping Master Mix (Applied Biosystems, Waltham, MA, USA) and included an initial denaturation at 95°C for 10 min, followed by 40 cycles of denaturation at 95°C for 15 s, primer annealing at 60°C for 1 min, and a final extension at 60°C for 30 s on a StepOnePlus Real-Time PCR system (Applied Biosystems).
2.3. Questionnaire
All owners filled out a standardized neurologic disease questionnaire on which they were asked to describe behaviors and physical activities as normal, or mildly, moderately or severely abnormal. Questions included: difficulty in movement or coordination, ability to see during the day and ability to see at night in dim light. These questionnaires were completed by the owners of the 4 affected and 3 control ASTs who underwent ophthalmic examinations, as well as by owners of 8 additional dogs homozygous for the ARSG risk variant (5 male, 3 female; 3-8 years of age) for which we were unable to obtain standardized ophthalmic examinations or ERGs, and by owners of 18 dogs that were homozygous or heterozygous for the reference ARSG allele.
2.4. Ophthalmic Examinations
Dogs in the study were screened prior to inclusion in the study to ensure no confounding ophthalmic abnormalities and received a complete ophthalmologic examination by a board-certified veterinary ophthalmologist (JOK) using slit-lamp biomicroscopy (SL 19; Kowa Company Ltd, Tokyo, Japan) of the adnexal and anterior segment as well as indirect ophthalmoscopy (Keeler Vantage; Keeler Instruments In., Broomall, PA, USA; 28 D condensing lens; Volk Mentor, OH, USA) of the posterior segment (retina and optic nerve head). Assessments were performed at the ages indicated in Table 1.
2.5. Electroretinography
Electroretinography was performed in one eye to assess scotopic and photopic retinal responses [15]. Pupils were dilated with one drop of 1% tropicamide ophthalmic solution. Subdermal ground and reference needle electrodes were inserted under the skin over the rostral aspect of the occipital protuberance and halfway between the lateral canthus of the left eye and the base of the left ear, respectively. ERG-Jet contact lens electrodes were placed on the cornea with methylcellulose. Recordings were performed in the dark with a full-field flash HMsERG unit following the ‘Dog Diagnostic Protocol’ recommended by the European College of Veterinary Medicine [16]. Pure rod responses were elicited with five sets of ten 10.2 log photons/cm2/s (10 mcd/m2) flashes repeated over a 20-minute period of dark-adaptation (scotopic dim flashes). Mixed rod and cone responses were elicited with four 12.65 photons/cm2/s (3 cd/m2) flashes (scotopic bright flash) and four 13.2 log photons/cm2/s (10 cd/m2) flashes (scotopic high-intensity flash). Dome lights were then turned on (13.65 log photons/cm2/s, 30 cd/m2) and dogs were light adapted for 10 minutes. Pure cone responses were elicited with 12.65 log photons/cm2/s (3 cd/m2) flashes (photopic single flash) and a 3 cd/m2, 30 Hz flicker (photopic flicker). The average response of each set of flashes was used for analysis.
2.6. Statistical Analyses
ERG amplitudes were compared between affected and control dogs using two-tailed Student’s t-test following Shapiro-Wilk and Brown-Forsythe tests to check normality and equal variance. Holm-Šídák multiple comparison correction was applied. Because the study was underpowered with only 3 dogs per group, both raw and multiplicity adjusted p-values are reported for all tests performed. Analyses were performed in SigmaPlot (Systat Software Inc., San Jose, CA). Graphs were made in R with ggplot [17]. Data are reported in the text as mean ± standard deviation.
2.7. Fluorescence Microscopy
ASTs homozygous for the ARSG risk allele were euthanized at 6.25 and approximately 7 years of age due to progressive ataxia. These dogs did not undergo standardized electroretinography but were reported by the owners to exhibit moderate and severe visual impairment respectively. An eye was enucleated from each dog at the time of euthanasia, the cornea was removed, and the remainder of the eye was immersed in a solution consisting of 3.5% paraformaldehyde, 0.05% glutaraldehyde, 120 mM sodium cacodylate, and 1 mM CaCl2 at pH 7.4. After incubation in this solution for 5 days, an approximately 1 square cm region of the eyecup adjacent to the optic nerve was dissected from the eye, incubated sequentially in 10% and 20% sucrose, embedded in Tissue Tek medium, and frozen on a block of dry ice. Cross sections of the tissue were cut at a thickness of 8 mm with a cryostat and mounted on Super Frost slides in 170 mM sodium cacodylate. Images of the sections were obtained with a Zeiss Axiophot microscope using epi-illumination from a Prior Lemen light source, a 400 to 440 nm bandpass excitation filter, an FT 460 dichromatic beam splitter, and a 515 nm long-pass emission filter. Images were acquired with an Olympus DP 72 digital camera.
3. Results
In addition to progressive ataxia, owners of dogs homozygous for the ARSG risk variant reported a number of other behavioral signs with onset that coincided with the onset of ataxia and that also progressed over a period of 4 or more years. Among these signs were decreased interest in food, anxiety, aggressiveness toward other dogs and people, increased sensitivity to loud sounds, tremors including head bobbing, decreased tolerance to grooming or bathing, compulsive circling and other compulsive behaviors, and a roached back posture. In an 8-year-old dog the ataxia had become so severe that the dog was no longer able to stand or ambulate without assistance (Video S1). Owners of the majority of the affected dogs also reported visual impairment under either bright or dim lighting conditions or both in their affected dogs (Table 2). Photopic visually mediated behavior was reported by owners as normal in 7/11 dogs and mildly altered in 4/11. Scotopic visually mediated behavior was reported as normal in 3/11, mildly altered in 3/11, moderately altered in 4/11 and severely altered in 1/11. The latter dog was reported to have developed such severe visual impairment under dim light conditions as the disease progressed that the dog would not enter a dark room until a light was turned on. No signs of visual impairment were reported by owners of any of the dogs homozygous or heterozygous for the reference ARSG allele.
Owners of the three symptomatic ASTs that underwent ophthalmological examinations reported moderate to severe ataxia. Visual impairment was noted by the owners in 2 of the 3 dogs (Table 1). The owner of ARSG-1 had not perceived any apparent signs of visual impairment in either scotopic or photopic conditions as of 8 years of age. The owner of ARSG-2 indicated that this dog had mildly impaired photopic and moderately impaired scotopic vision, noting that he had difficulty perceiving stationary objects at night, was more nervous walking up steps in darker conditions, and walked into stationary objects. Dog ARSG-3 was described by the owner to have mildly impaired photopic and scotopic vision starting around 4 years of age.
A dim flash was presented after 20 minutes of dark adaptation to elicit a pure rod response. The amplitude of the b-wave elicited by the scotopic dim flash was reduced in affected ASTs compared to controls (ARSG: 140.7±32.8µV, Control: 280.5±43.7µV; Figure 1). Scotopic bright and high-intensity flashes elicit a mixed rod-cone response. Scotopic a-wave amplitudes elicited by these flashes were also considerably reduced in affected ASTs (Bright – ARSG: 95.0±16.0µV, Control: 205.6±19.4µV; High-Intensity – ARSG: 134.9±25.1µV, Control: 265.9±41.8µV; Figure 2A and Figure 3A) while the b-wave amplitudes were somewhat low but within the range of healthy controls (Bright – ARSG: 264.3±29.1µV, Control: 375.5±107.1µV; High-Intensity – ARSG: 299.7±29.3µV, Control: 415.5±107.6µV; Figure 2B and Figure 3B). Scotopic b:a-wave ratios were not reduced and were in fact somewhat increased in affected ASTs (Bright – ARSG: 2.80±0.19, Control: 1.82±0.47; High-Intensity – ARSG: 2.25±0.25, Control: 1.55±0.28; Figure 2C and Figure 3C). Attenuated scotopic a-waves and normal to increased b:a-wave ratios are indicative of rod photoceptor dysfunction in affected ASTs.
Photopic stimuli were presented after a 10-minute period of light adaptation to elicit a pure cone response. Photopic single flash a-wave amplitudes were lower in affected ASTs compared to controls (ARSG: 9.8±4.3µV, Control: 19.9±2.8µV; Figure 4A) while b-wave amplitudes were not consistently reduced (ARSG: 51.9±27.9µV, Control: 99.2±19.7µV; Figure 4B). The photopic b:a-wave ratio was comparable in affected and control ASTs (ARSG: 5.16±0.65, Control: 5.03±0.90; Figure 4C). Photopic flicker b-wave amplitudes were lower in affected ASTs compared to controls (ARSG: 57.1±36.9µV, Control: 128.8±14.8µV; Figure 5). Reduced photopic a-waves and normal b:a-wave ratios are indicative of cone photoceptor dysfunction in affected ASTs.
While there are pronounced differences in amplitude between affected and control ASTs, the study was underpowered to detect statistically significant changes (power of ~15% to detect a 25% difference) and we report both raw and multiplicity corrected p-values for all comparisons performed in Table S1.
Dog ARSG-4, who was 4 years of age at the time of assessment, did not exhibit neurological clinical signs and his ERG amplitudes showed no evidence of retinal dysfunction (Table 3).
There were no significant differences in a- or b-wave implicit times between affected and control ASTs (Table S2 and Figure S3).
Figure 1.
Scotopic dim flash b-wave amplitudes in 3 affected and 3 control ASTs. Error bars show standard error of the mean; individual datapoints are shown as dots.
Figure 1.
Scotopic dim flash b-wave amplitudes in 3 affected and 3 control ASTs. Error bars show standard error of the mean; individual datapoints are shown as dots.
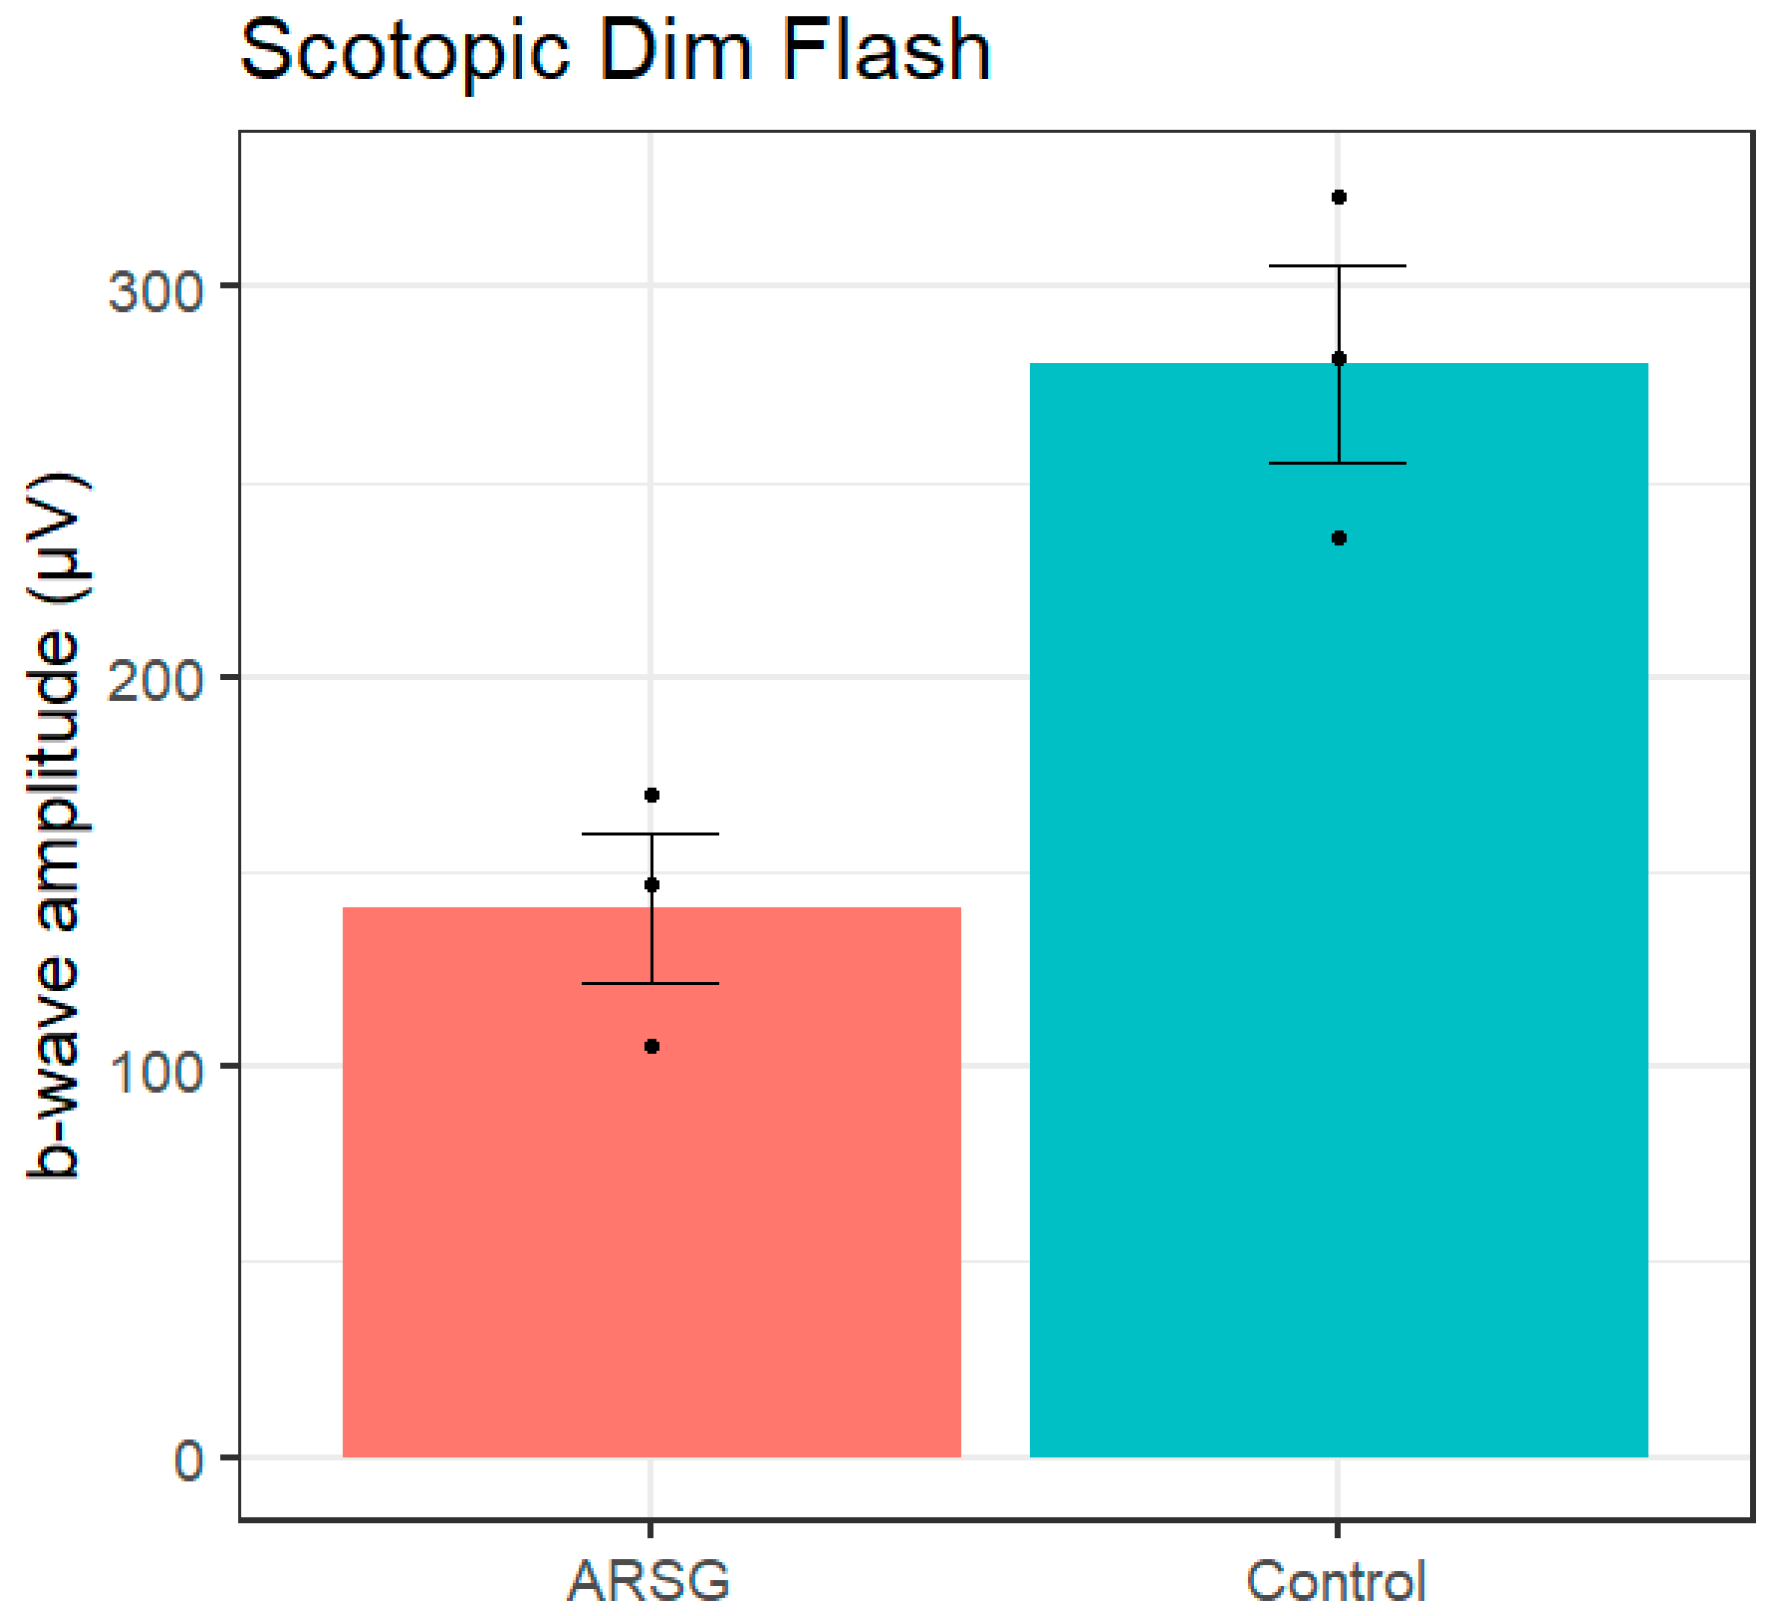
Figure 2.
Scotopic bright flash a-wave amplitudes (a), b-wave amplitudes (b), and b:a-wave ratios (c) in 3 affected and 3 control ASTs. Error bars show standard error of the mean; individual datapoints are shown as dots.
Figure 2.
Scotopic bright flash a-wave amplitudes (a), b-wave amplitudes (b), and b:a-wave ratios (c) in 3 affected and 3 control ASTs. Error bars show standard error of the mean; individual datapoints are shown as dots.
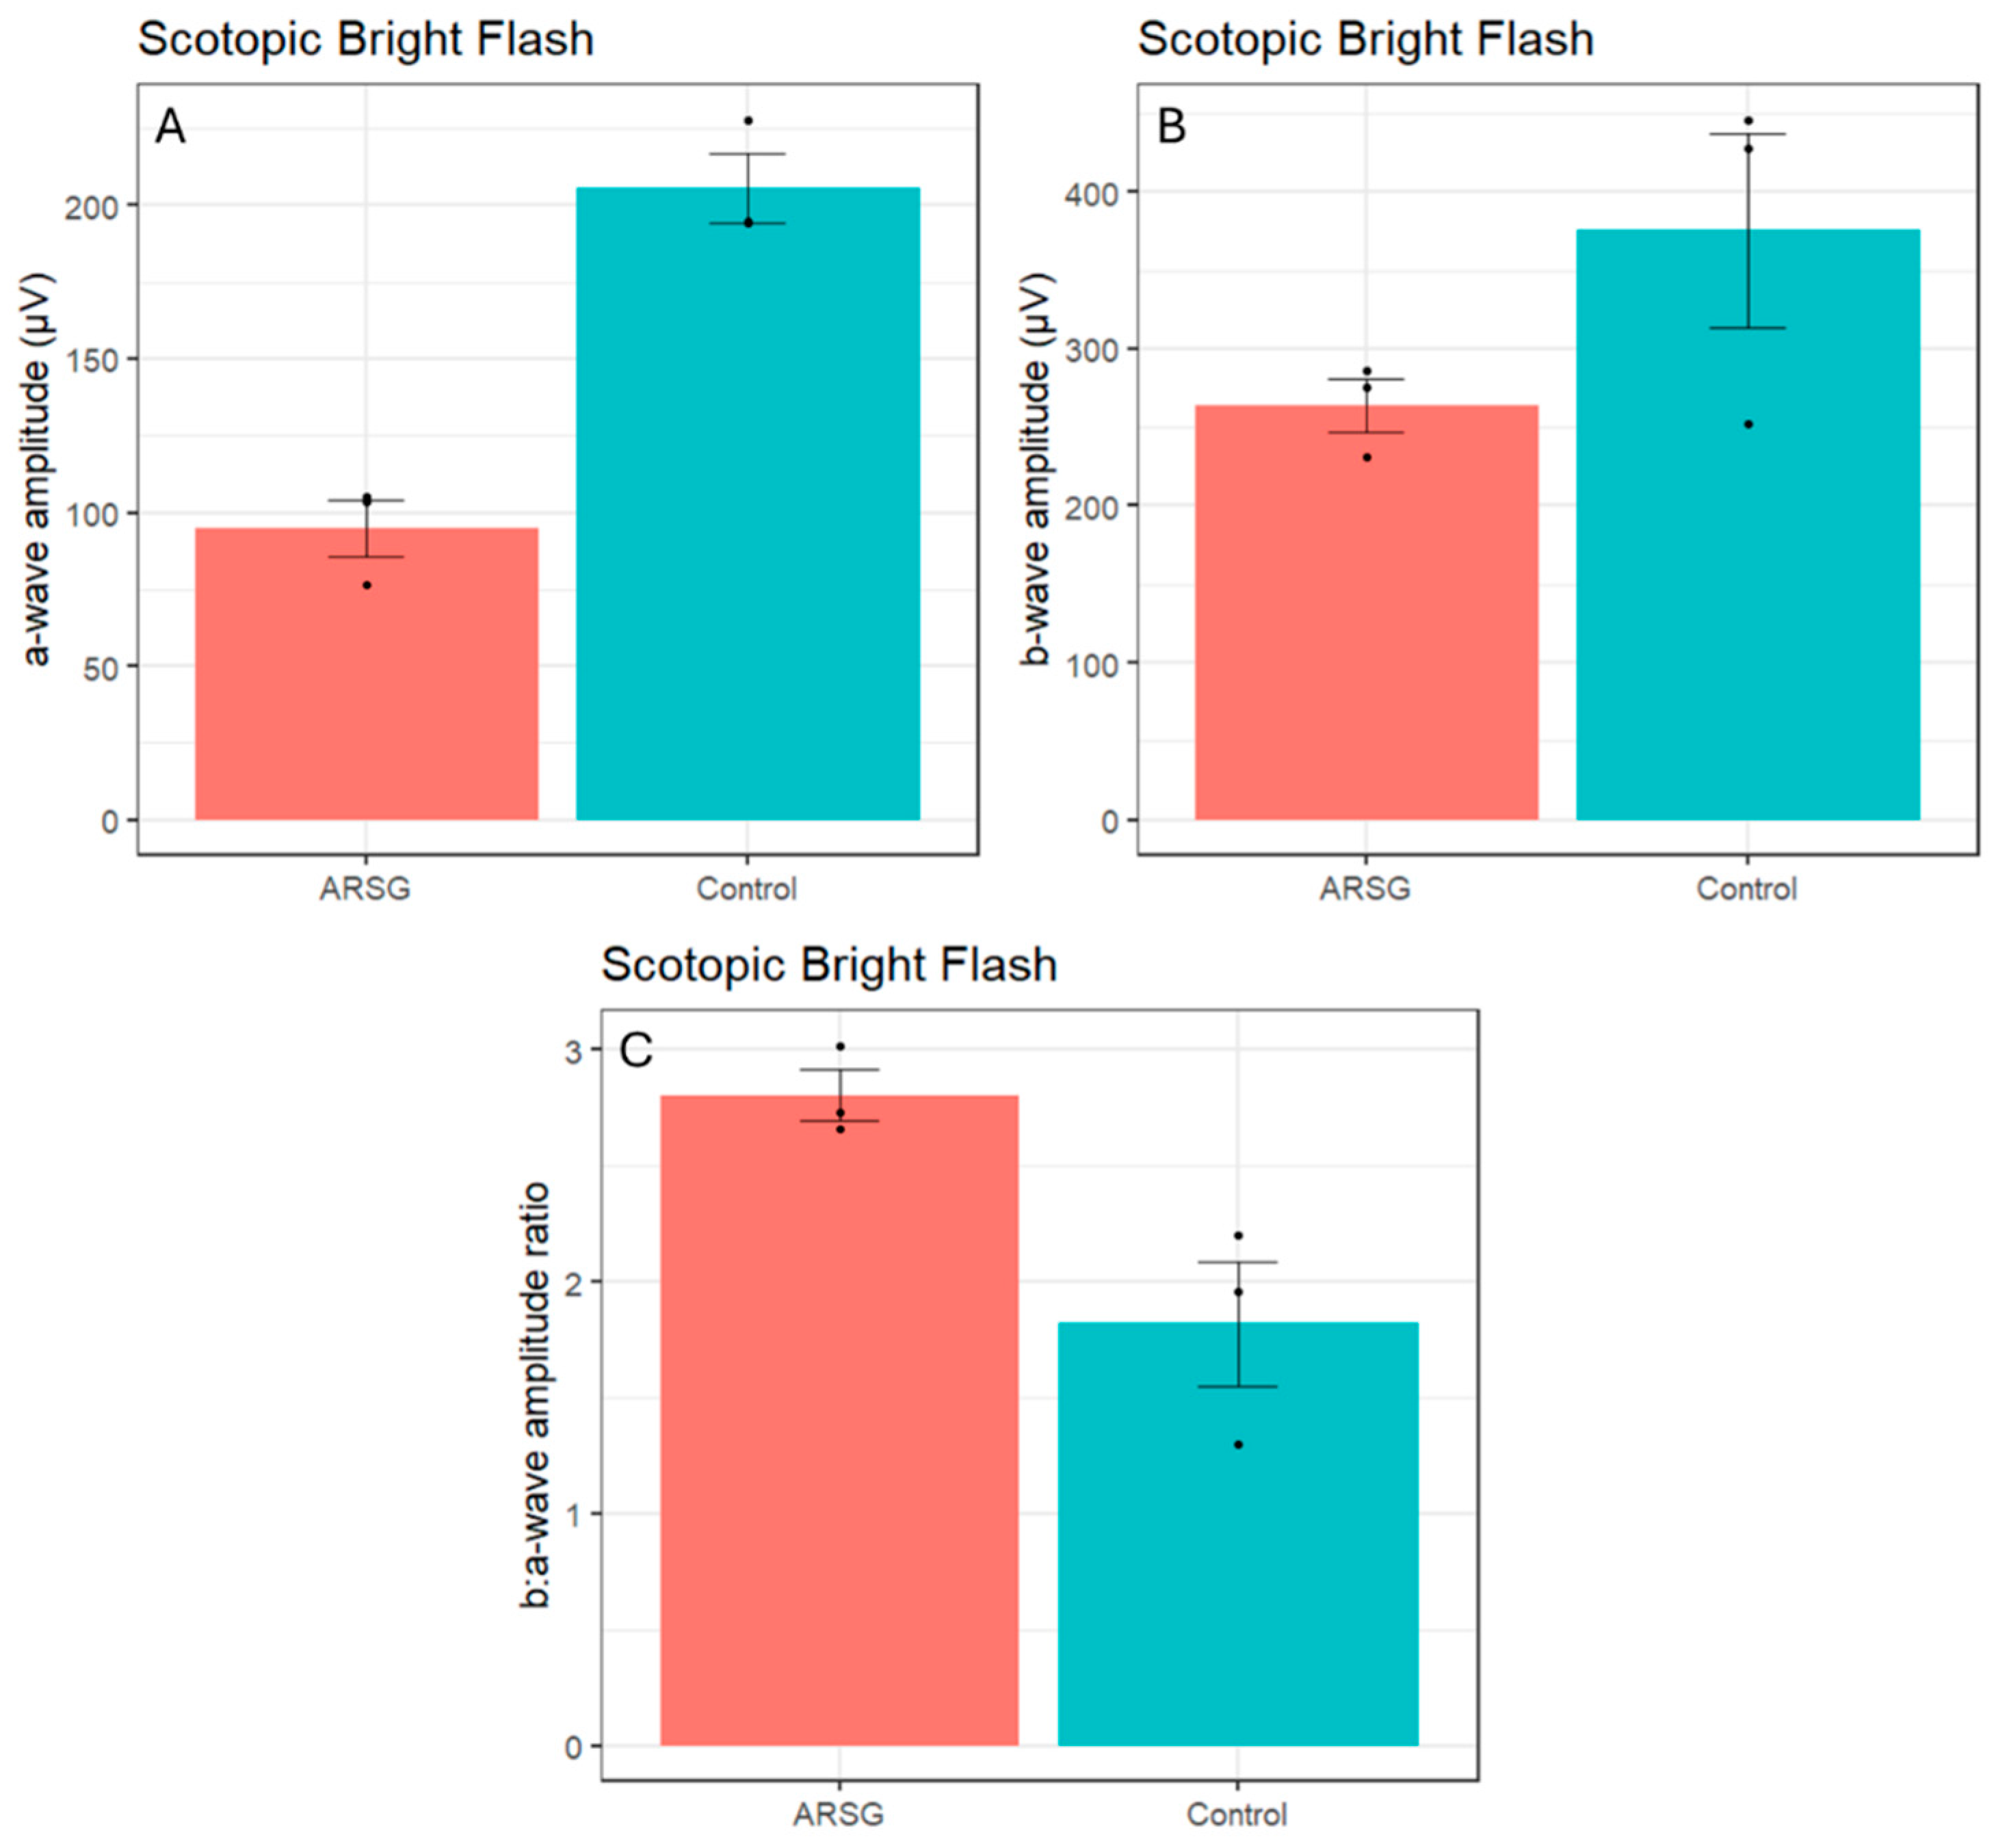
Figure 3.
Scotopic high-intensity flash a-wave amplitudes (a), b-wave amplitudes (b), and b:a-wave ratios (c) in 3 affected and 3 control ASTs. Error bars show standard error of the mean; individual datapoints are shown as dots.
Figure 3.
Scotopic high-intensity flash a-wave amplitudes (a), b-wave amplitudes (b), and b:a-wave ratios (c) in 3 affected and 3 control ASTs. Error bars show standard error of the mean; individual datapoints are shown as dots.
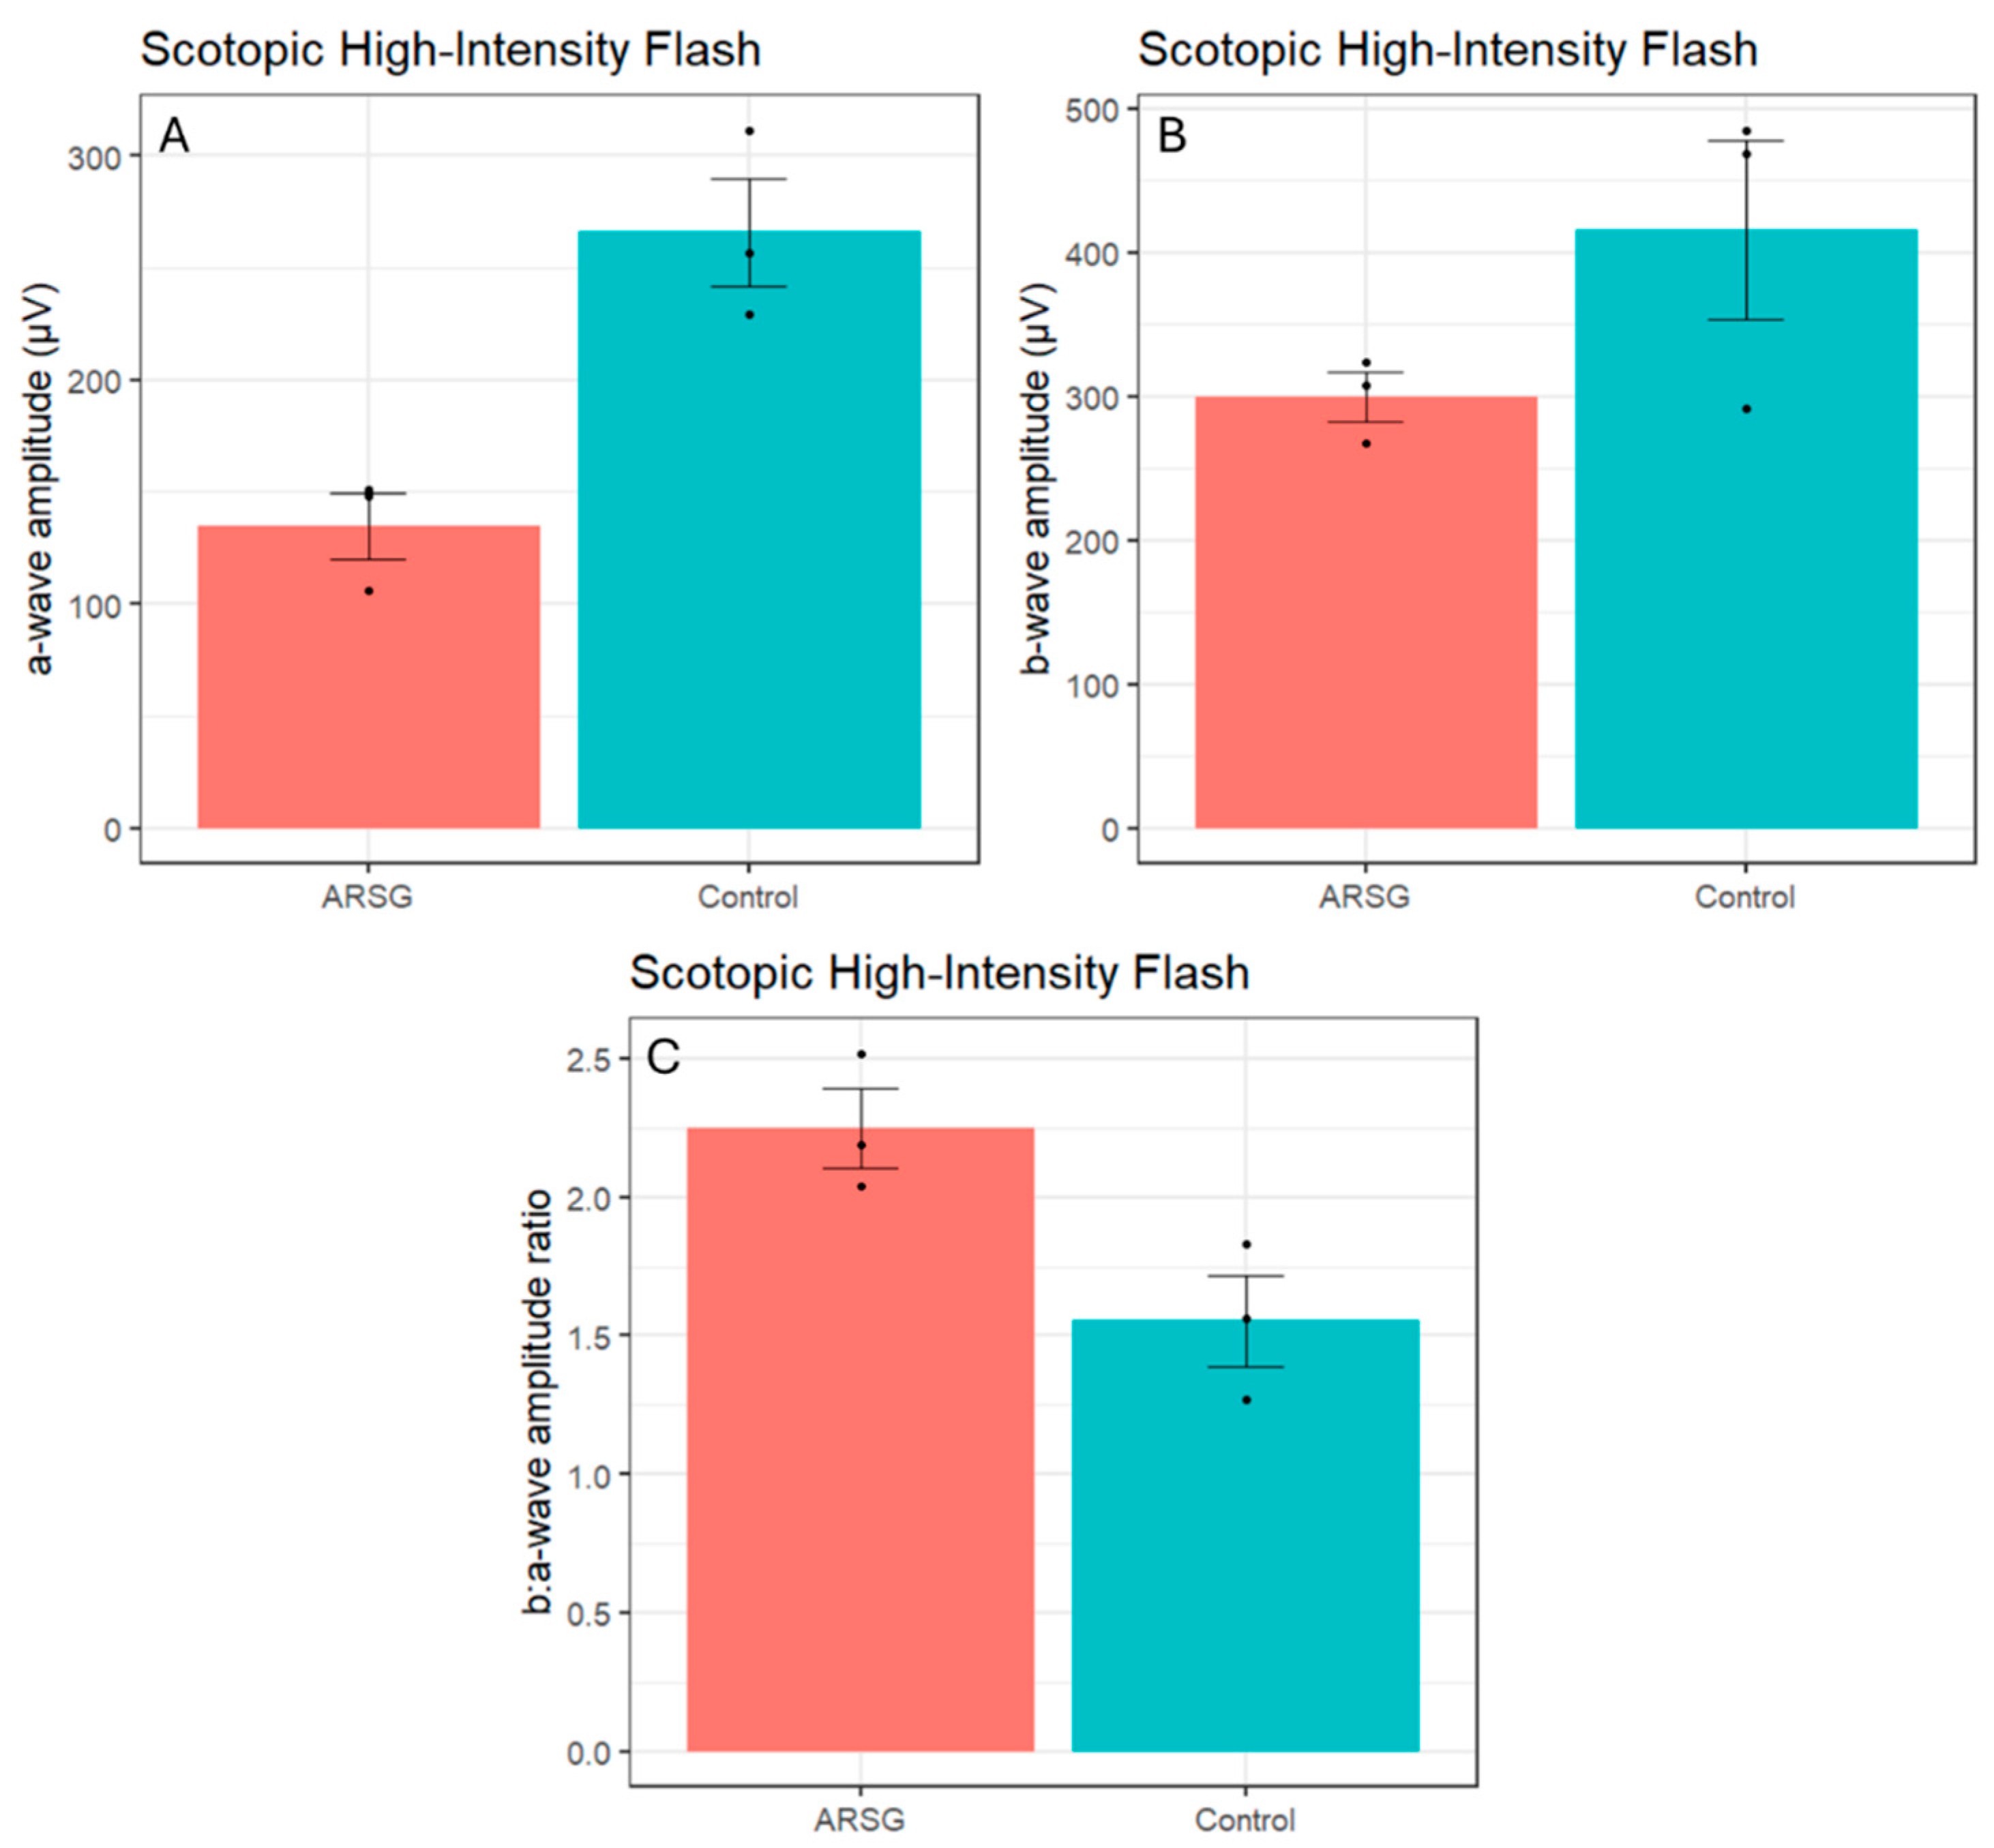
Figure 4.
Photopic single flash a-wave amplitudes (a), b-wave amplitudes (b), and b:a-wave ratios (c) in 3 affected and 3 control ASTs. Error bars show standard error of the mean; individual datapoints are shown as dots.
Figure 4.
Photopic single flash a-wave amplitudes (a), b-wave amplitudes (b), and b:a-wave ratios (c) in 3 affected and 3 control ASTs. Error bars show standard error of the mean; individual datapoints are shown as dots.
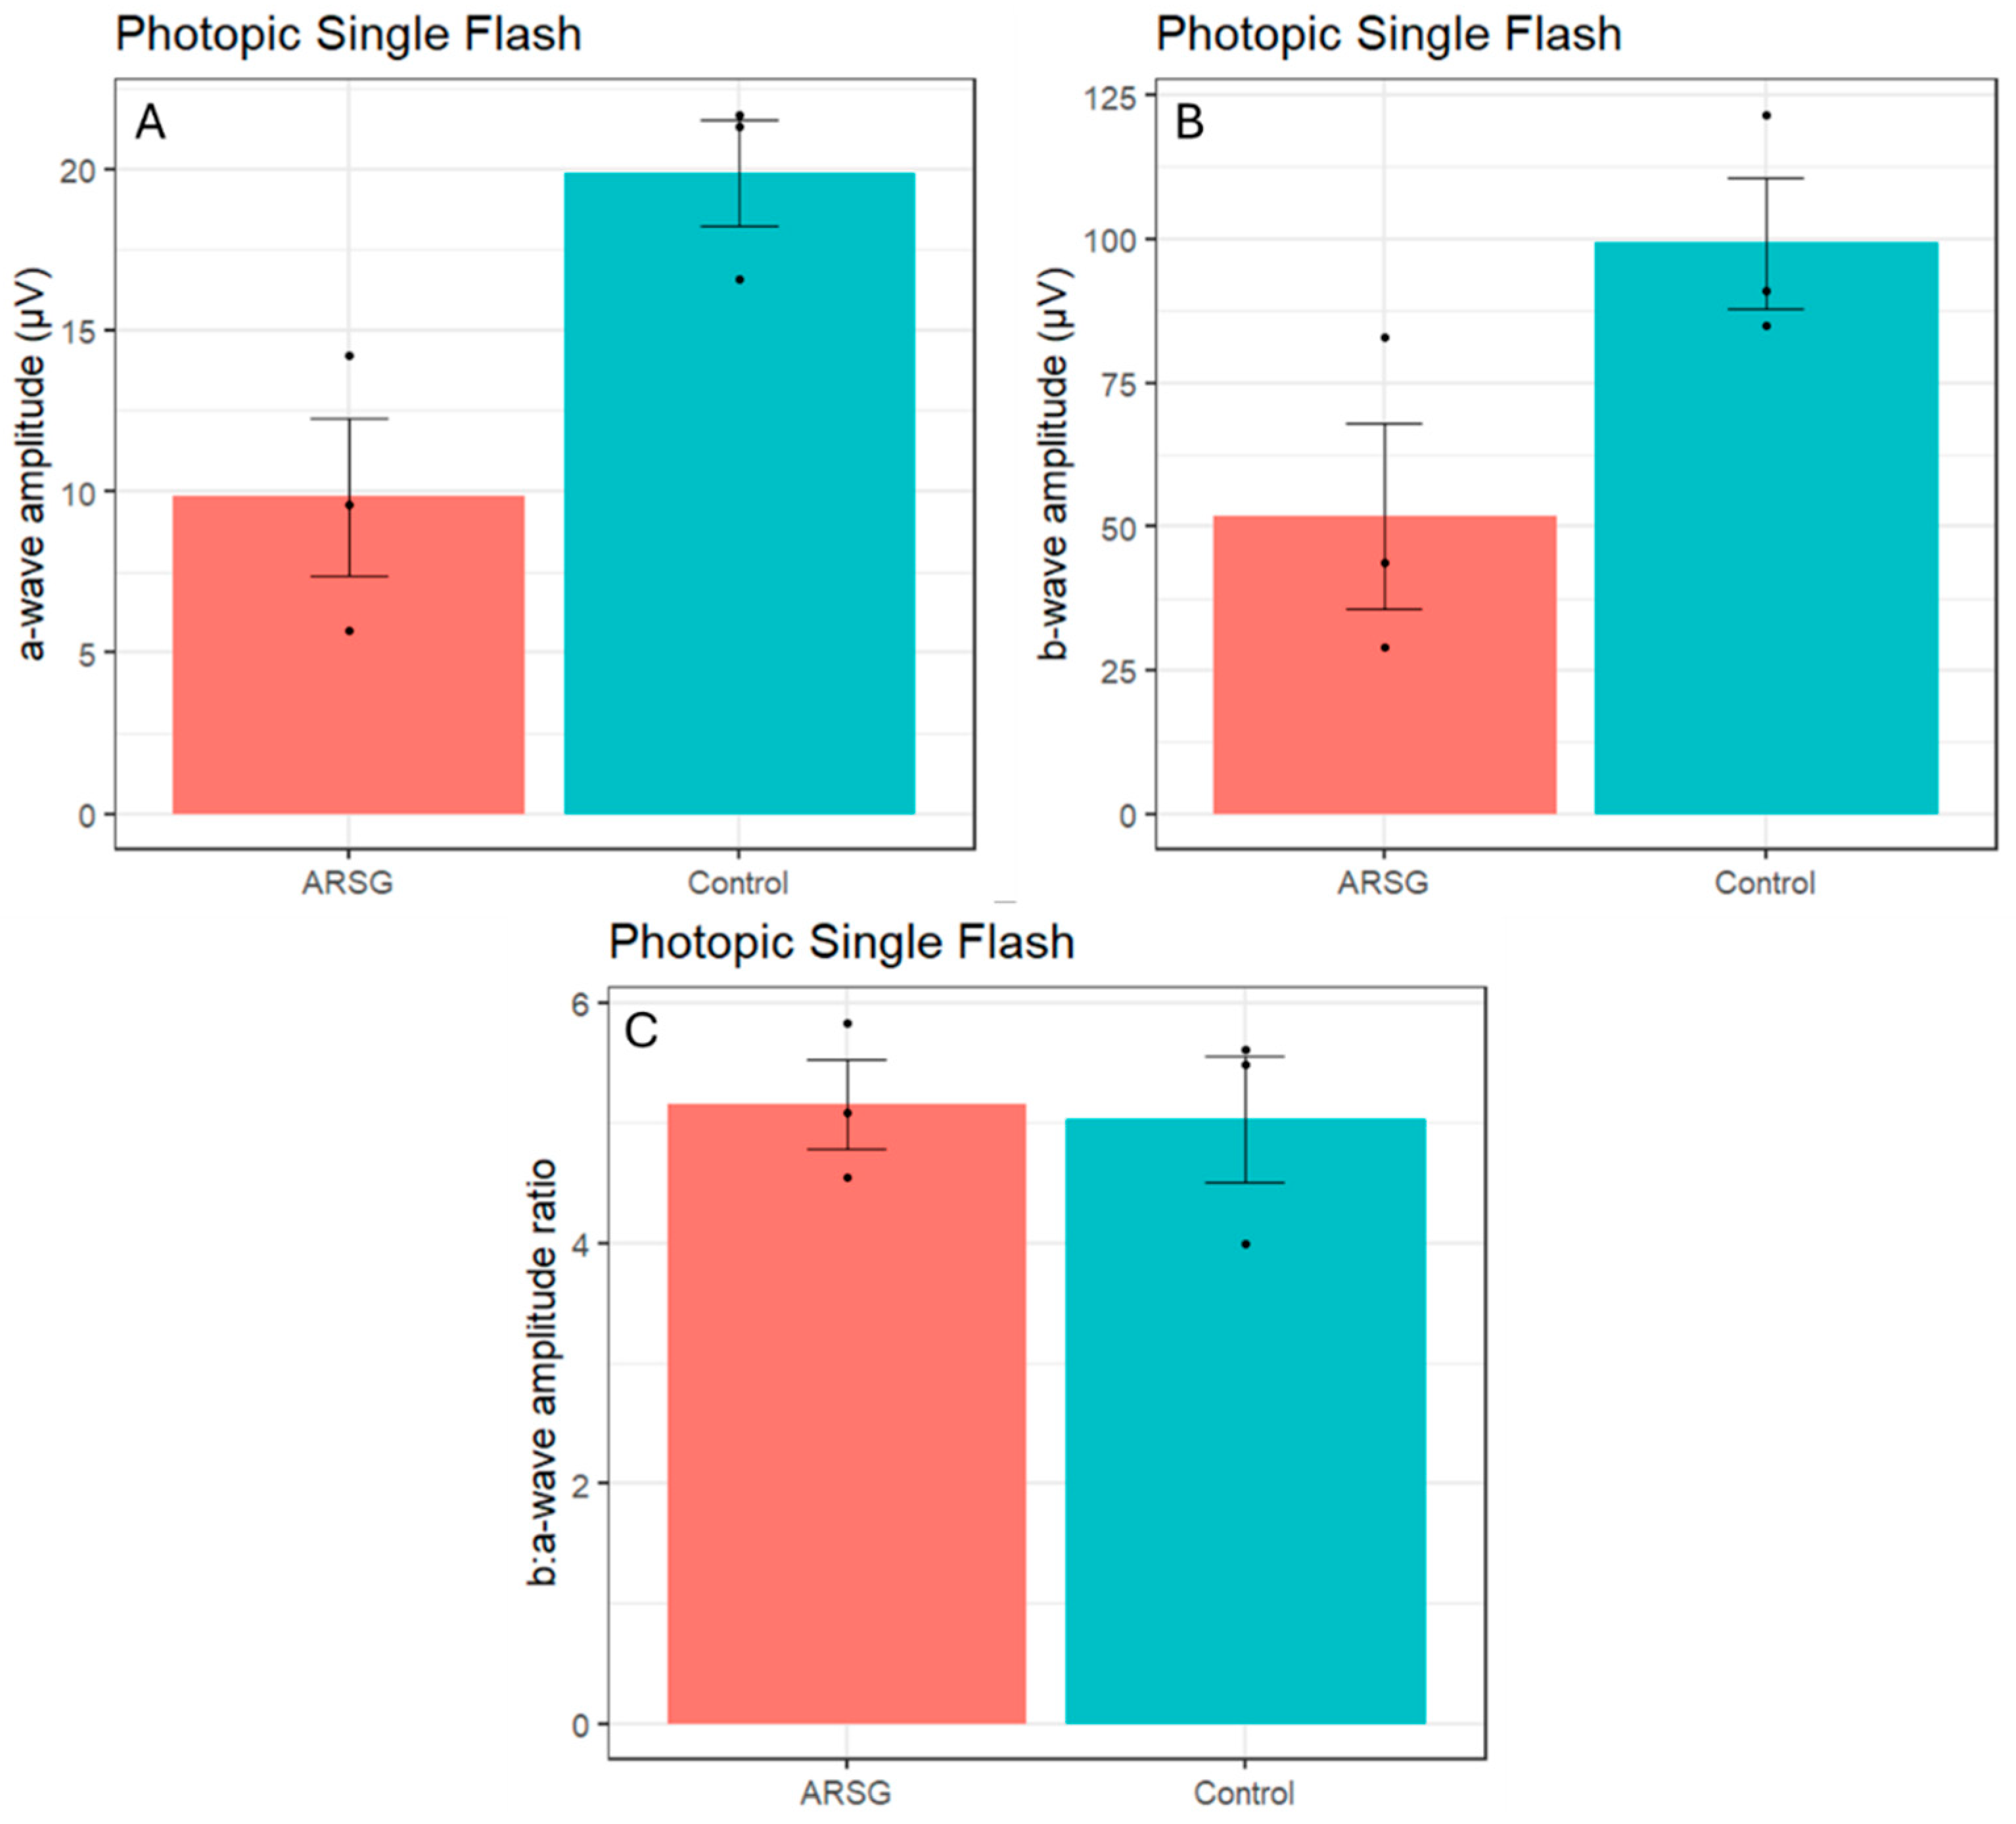
Figure 5.
Photopic flicker b-wave amplitudes in 3 affected and 3 control ASTs. Error bars show standard error of the mean; individual datapoints are shown as dots.
Figure 5.
Photopic flicker b-wave amplitudes in 3 affected and 3 control ASTs. Error bars show standard error of the mean; individual datapoints are shown as dots.
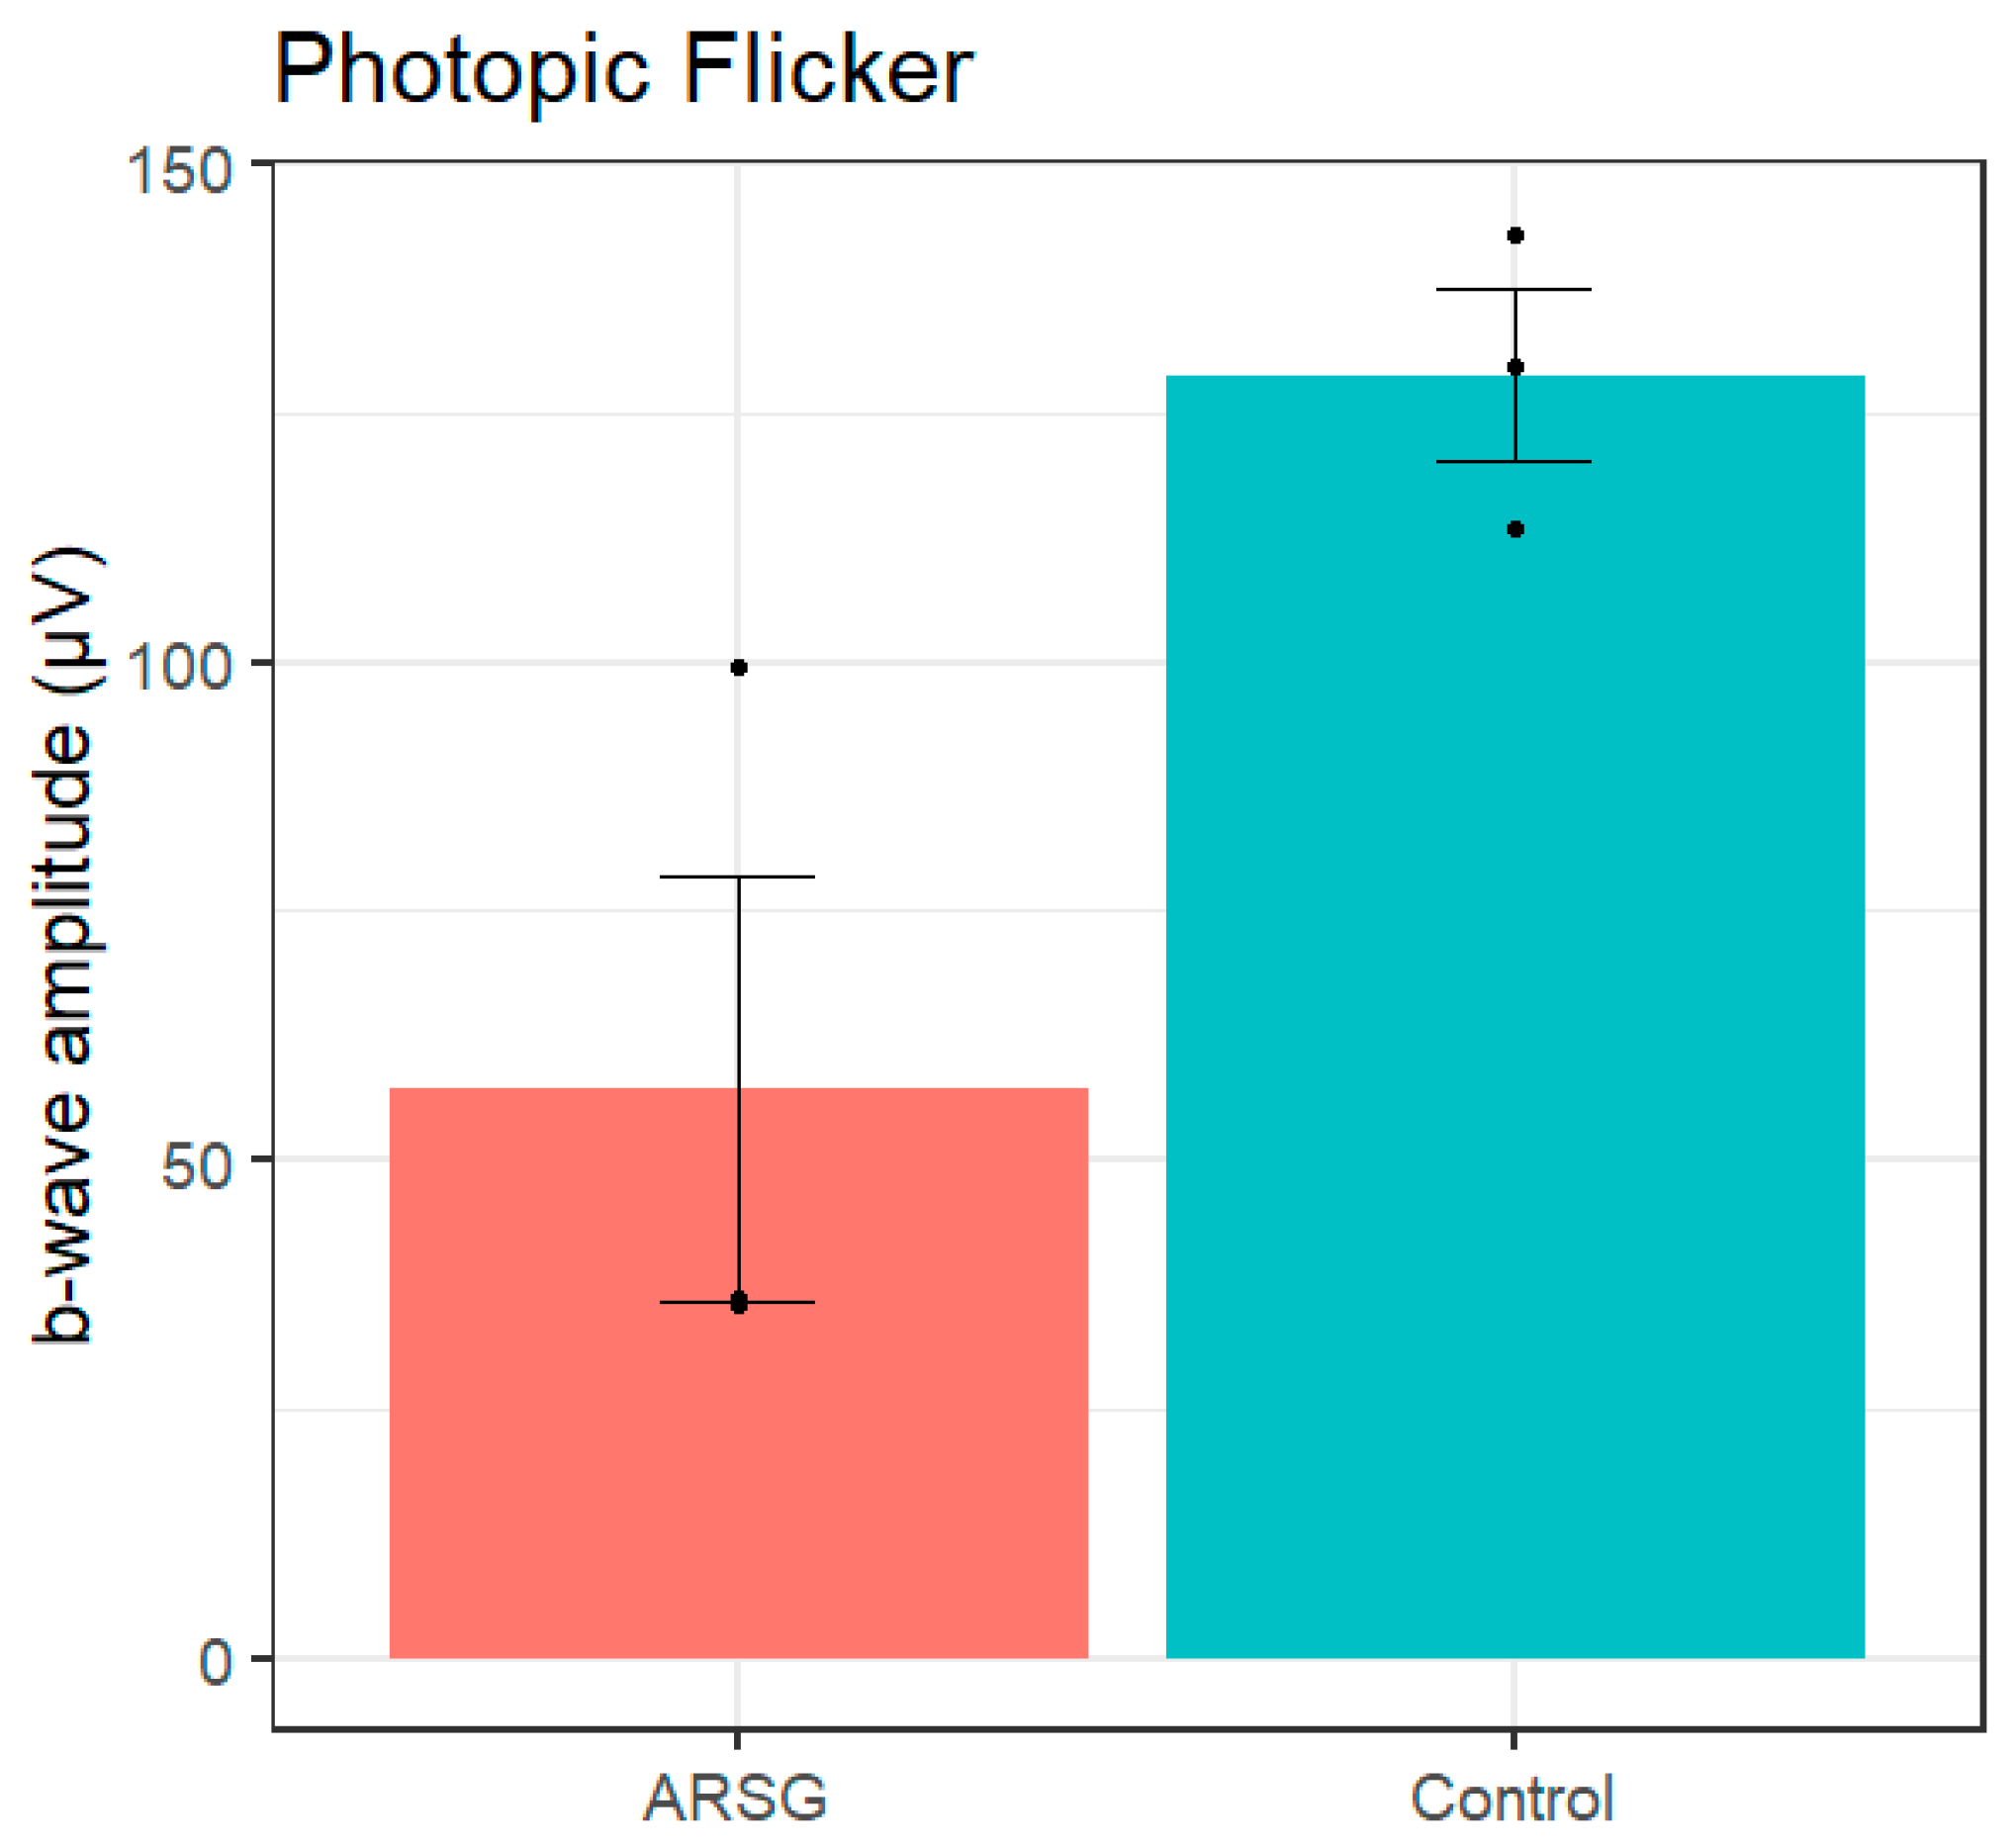
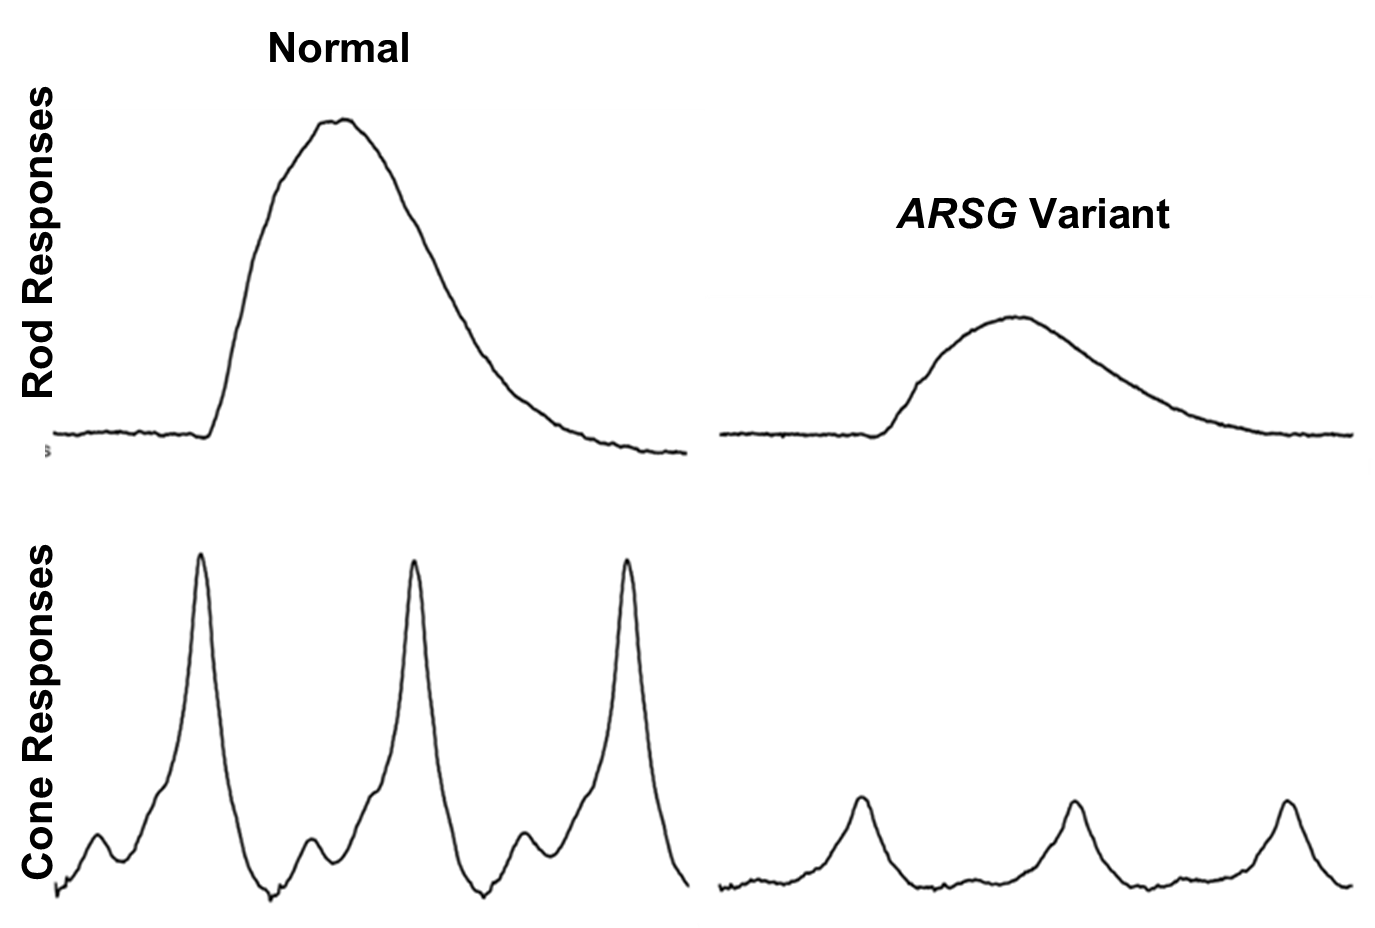
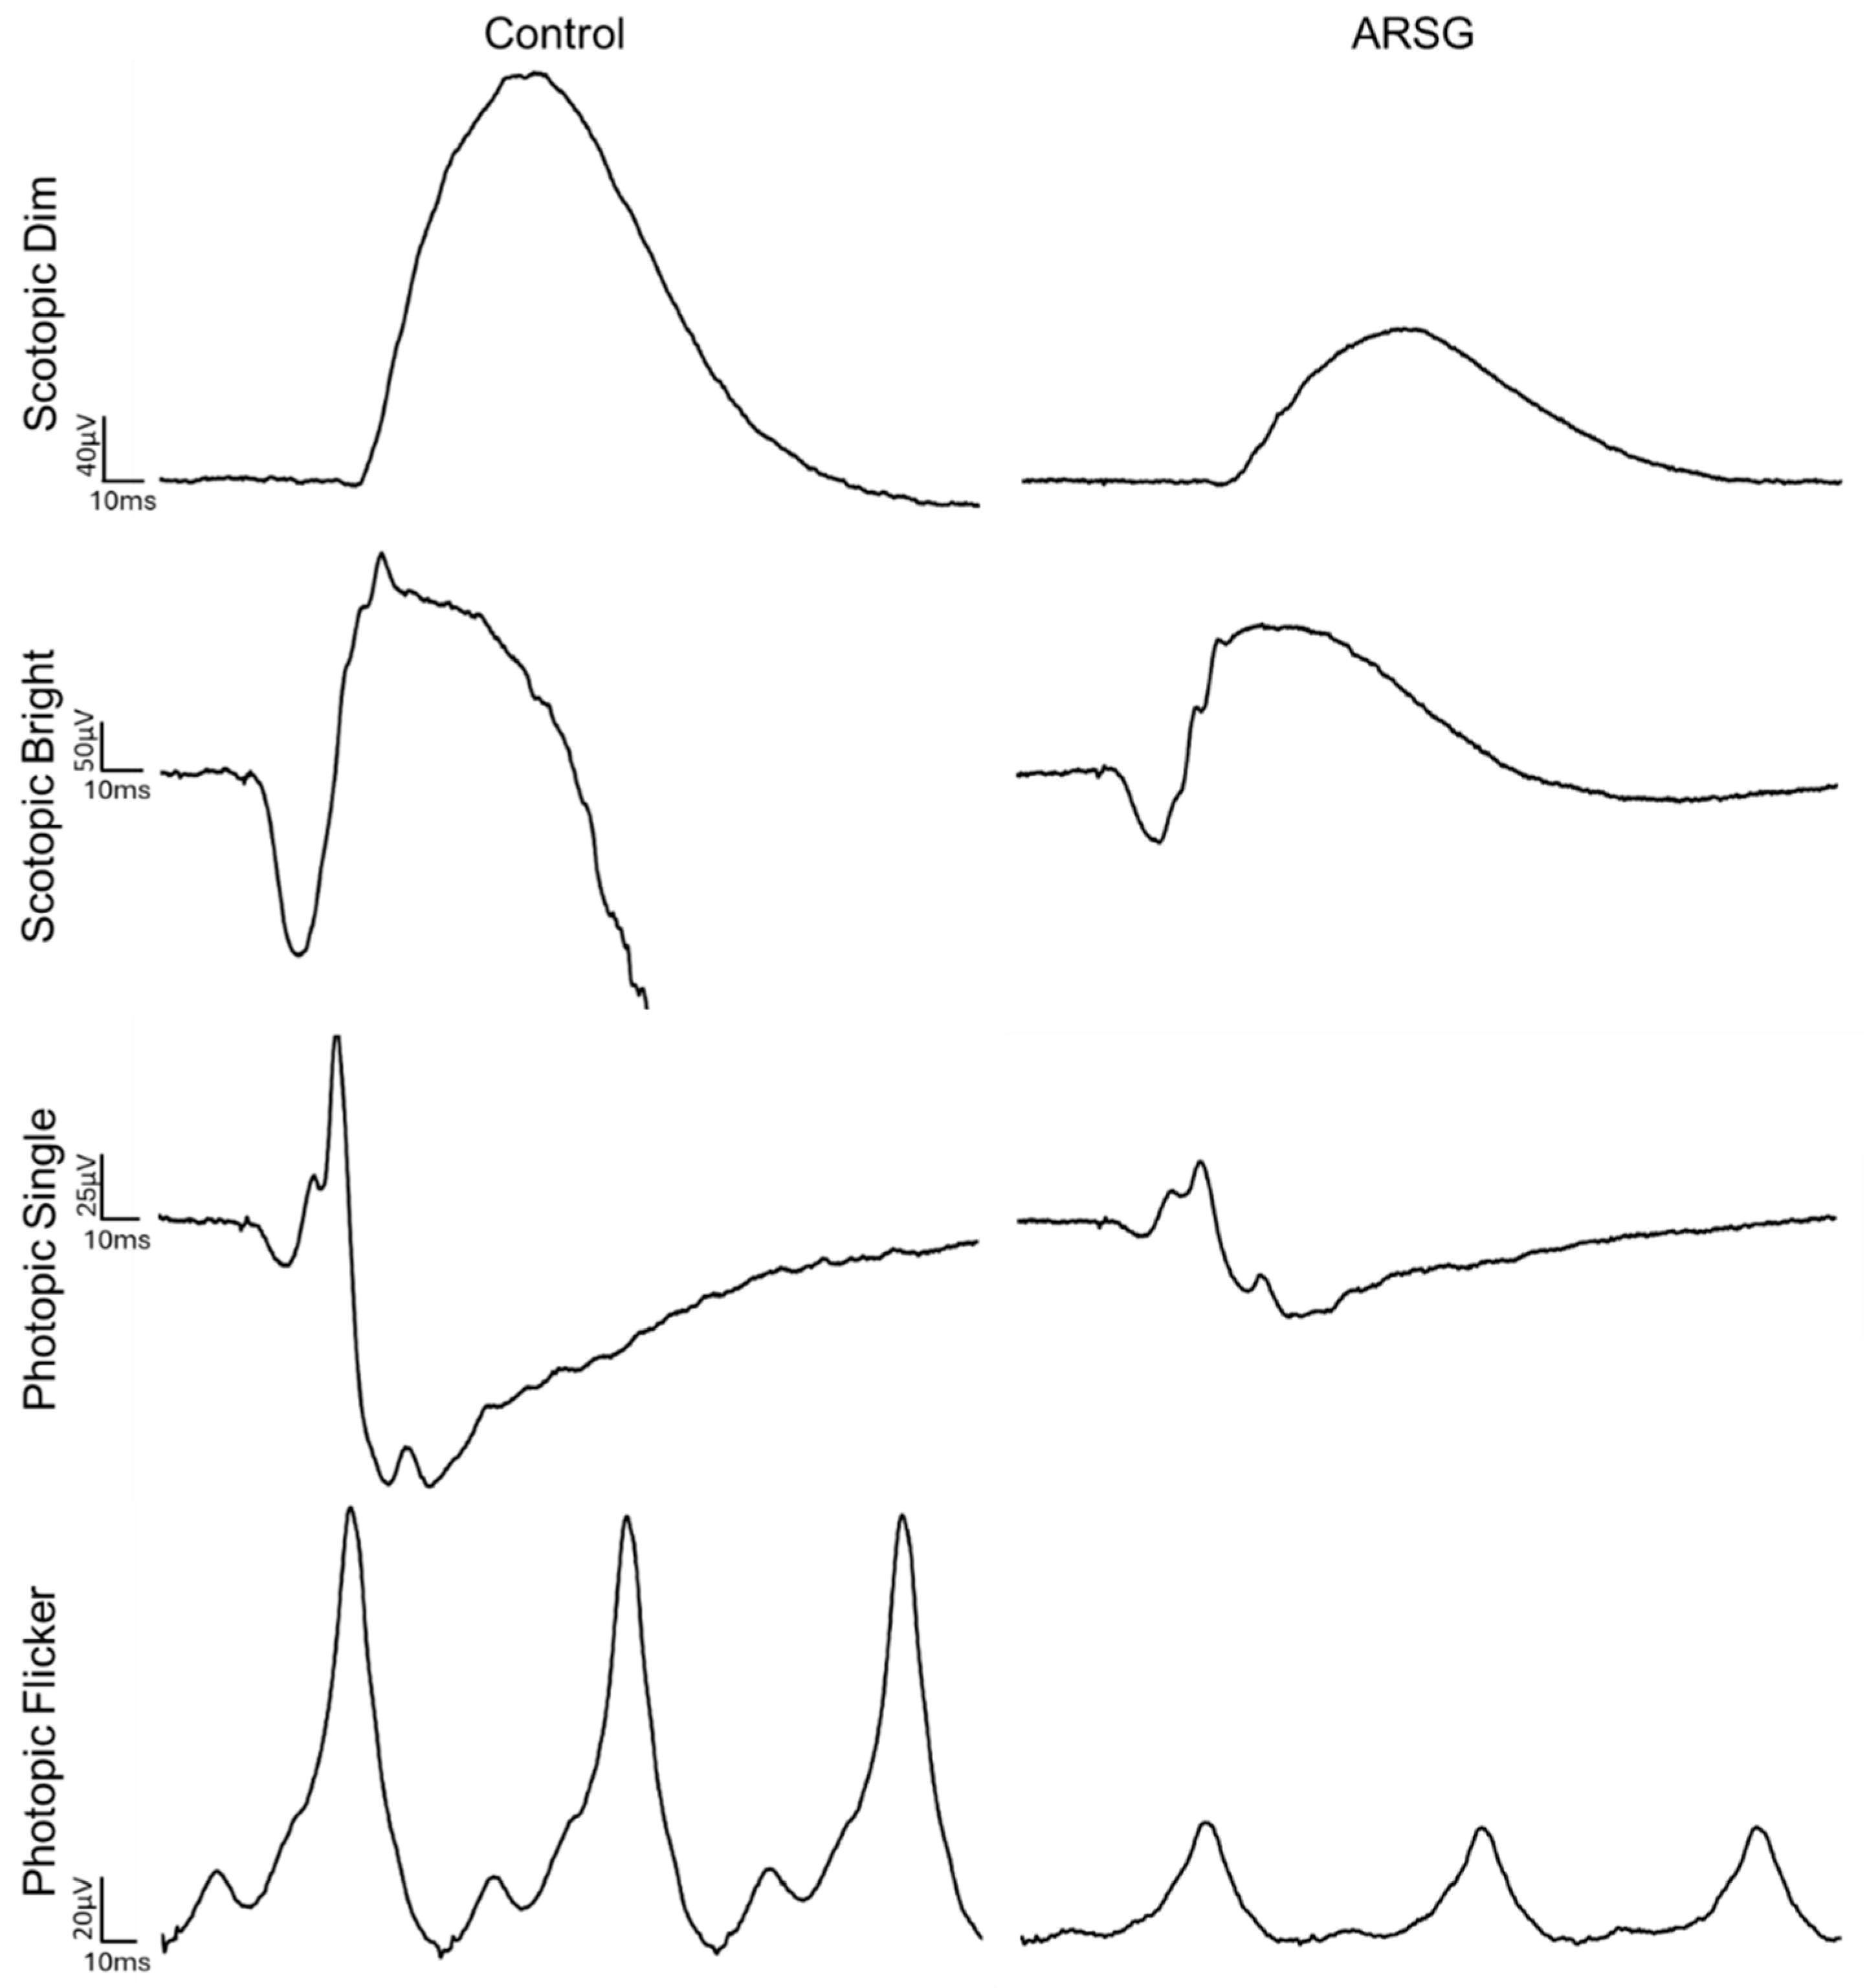
Figure 6.
Example traces from dog Control-1 and dog ARSG-1.
Unstained cryostat sections of the retinas from two affected dogs were examined with fluorescence microscopy. Inclusion bodies with autofluorescence properties typical of the NCLs were observed in the ganglion cell layers of the retinas and in the retinal pigment epithelium (RPE) of both dogs (Figure 7). In both retinal layers, the inclusions were not uniformly distributed but occurred in clusters. The inclusions in the ganglion cell layer were not in the perinuclear zones of the ganglion cells, but in either the ganglion cell axons or Müller cell processes. None of these inclusions were present in the photoreceptor cell layer of the retina.
4. Discussion
Although the sample size in this study was small, the data show that ASTs with the c.296G>A ARSG variant exhibit retinal dysfunction and visual impairment consistent with reports of rod-cone dystrophy in human Usher patients with ARSG mutations and photoceptor degeneration in arsg knockout mice. Reduced a-waves and normal b:a-wave ratios localize the site of dysfunction to the photoceptors, with both rods and cones being affected. This is consistent with impaired photopic and scotopic visually mediated behavior reported by owners of dogs homozygous for the ARSG risk variant. Moderate visual deficits in dogs often go unrecognized by owners because dogs with such deficits can still navigate well in familiar surroundings, and progressively severe ataxia may make it difficult to recognize impaired visually mediated behavior in this disease (see Video S1). In the original report of the ARSG-related disorder in ASTs, it was stated that neither owners nor veterinarians reported visual impairment in any of the affected dogs that were evaluated [1]. That is in contrast to the present study in which 8 of 11 dogs homozygous for the risk variant were reported by their owners to have exhibited visual impairment. The basis for this apparent discrepancy is not evident, although there was no indication in the previous report that the owners and veterinarians were asked to comment specifically on visually mediated behavior. It is likely that visual impairment was overlooked by owners and veterinarians in the original group of dogs due to focus on the more obvious signs of ataxia. Visual impairment in dogs cannot be ruled out without performing objective assessments,
In the dogs that were evaluated for the current study, there were no consistent abnormalities in the fundic appearances, but there were consistent disease-related decreases in ERG amplitudes. These findings indicate the importance of ERG assessments in evaluating retinal function in dogs. To accurately assess retinal function, it is important to employ standardized ERG methodology so that patient responses can be compared to normal responses obtained from healthy dogs using the same protocols and instrumentation. The standardized ERG protocol utilized in this study was first adopted by the European Conference on Veterinary Visual Electrophysiology in 2000 and updated in 2012 [16], but many veterinary ophthalmologists utilize a much more limited protocol that will only detect pronounced abnormalities in retinal function. Our findings illustrate the importance of systematic in-depth ERG assessment in dogs in which potential retinal functional impairment is suspected.
Because longitudinal ERG data were not obtained, this study did not indicate whether retinal dysfunction is progressive, as is the case in human Usher patients, but the finding that a young presymptomatic dog did not exhibit retinal dysfunction suggests that this is likely. At 4 years of age, dog ARSG-4 showed no clinical signs of disease, and the ERG showed no indication of retinal dysfunction. In a survey of 138 ASTs, onset of neurological signs was first observed in some dogs as late as 8 to 9 years of age [1]. Follow-up diagnostics to determine whether ataxia and retinal dysfunction develop later in life for dog ARSG-4 would be informative. Longitudinal studies would be necessary to document the age of onset and rate of progression of retinal dysfunction in this disease. However, based on owner reports, impairment of visually mediated behavior was progressively worse over time, suggesting that underlying retinal dysfunction was progressive, similar to the progressively worsening neurological signs associated with cerebellar atrophy. The late onset and slow progression of signs may be related to a gradual accumulation of lysosomal storage material.
The owners of the affected dogs did not report signs of hearing impairment in their animals that occur in human subjects with ARSG mutations, but objective assessment of hearing was not performed. Affected dogs were reported to be hypersensitive to loud noises, which may be indicative of hearing impairment. Objective assessments of hearing in dogs can be performed using brainstem auditory evoked response testing. Such testing may detect hearing impairments in affected ASTs, particularly late in the disease progression. Such studies would determine whether the canine disorder also recapitulates this feature of human ARSG-related Usher syndrome.
The mechanism by which the defect in ARSG results in impaired retinal function remains to be elucidated. However, the finding that the RPE of affected dogs accumulated autofluorescent storage bodies suggests that disease-related RPE pathology may alter the RPE-photoreceptor cell interactions that are necessary for maintaining normal photoreceptor cell functions. ARSG is a lysosomal enzyme essential for the degradation of heparan sulfate, and heparan sulfate proteoglycans are present in the interphotoreceptor matrix [20]. In healthy eyes, photoreceptor outer segment tip fragments and the associated interphotoreceptor matrix are phagocytosed by the RPE, and the resulting phagolysosomes are rapidly degraded by lysosomal enzymes [21]. Impaired ARSG enzyme activity likely results in the accumulation of undegraded heparan sulfate proteoglycans and secondary accumulation of photoreceptor outer segment components in the RPE phagolysosomes. Accumulation of this storage material may impair RPE functions including photoreceptor outer segment turnover and delivery of the visual pigment 11-cis retinal to the retina that are necessary for normal photoreceptor cell function [22,23,24]. The accumulation of autofluorescent storage bodies in the retinal ganglion cell layer suggests that glycosaminoglycan turnover also occurs normally in ganglion cells and/or Müller cells, but it is not known whether lysosomal storage body accumulation in these cells results in cell pathology.
The data presented here suggest that despite variation in the phenotypes between human subjects, mice and dogs with ARSG-related disorders, photoreceptor dysfunction is a consistent feature associated with ARSG variants in all 3 species in which these have been described. For both human and canine patients with late onset visual deficits, variants in ARSG should be considered as potential causes.
Supplementary Materials
The following supporting information can be downloaded at the website of this paper posted on Preprints.org, Table S1: Statistical comparison of ERG amplitudes; Table S2: Summary of implicit times; Figure S1: ERG implicit times in 3 affected and 3 control ASTs; Video S1.
Author Contributions
Conceptualization, G.R.K. and M.L.K.; methodology, G.R.K., S.L.M., J.O., and G.B.; validation, G.R.K. and G.B.; formal analysis, G.R.K. and J.O.; investigation, G.R.K., S.L.M., J.O., and M.L.K.; resources, M.L.K..; data curation, G.B.; writing—original draft preparation, G.R.K. and M.:.K.; writing—review and editing, G.R.K., S.L.M., J.O., G.B., and M.L.K.; visualization, G.R.K. and M.L.K.; supervision, M.L.K.; project administration, M.L.K.; funding acquisition, M.L.K. All authors have read and agreed to the published version of the manuscript.
Funding
This work was funded by donations from the Orthopedic Foundation for Animals to the University of Missouri Canine Genetics Laboratory.
Institutional Review Board Statement
The animal study protocol was approved by the Animal Care and Use Committee of the University of Missouri (protocol number 44562, approved 8 January, 2025).
Data Availability Statement
The raw data supporting the conclusions of this article will be made available by the authors on request.
Acknowledgments
The authors are extremely grateful to Dr. Jennifer Hyman for performing the ERG on dog ARSG-2 as well as to the owners who enrolled their dogs in this study and their veterinarians for their cooperation.
Conflicts of Interest
The authors declare no conflicts of interest. The funders had no role in the design of the study; in the collection, analyses, or interpretation of data; in the writing of the manuscript; or in the decision to publish the results.
Abbreviations
The following abbreviations are used in this manuscript:
| AST | American Staffordshire Terrier |
| ARSG | Arylsulfatase G |
| NCL | Neuronal Ceroid Lipofuscinosis |
| MPS | Mucopolysaccharidoses |
| ERG | Electroretinography |
References
- Abitbol, M.; Thibaud, J.L.; Olby, N.J.; Hitte, C.; Puech, J.P.; Maurer, M.; Pilot-Storck, F.; Hedan, B.; Dreano, S.; Brahimi, S.; et al. A Canine Arylsulfatase G (ARSG) Mutation Leading to a Sulfatase Deficiency Is Associated with Neuronal Ceroid Lipofuscinosis. Proc Natl Acad Sci U S A 2010, 107, 14775–14780. [Google Scholar] [CrossRef]
- Kowalewski, B.; Lamanna, W.C.; Lawrence, R.; Damme, M.; Stroobants, S.; Padva, M.; Kalus, I.; Frese, M.-A.; Lübke, T.; Lüllmann-Rauch, R.; et al. Arylsulfatase G Inactivation Causes Loss of Heparan Sulfate 3- O -Sulfatase Activity and Mucopolysaccharidosis in Mice. Proceedings of the National Academy of Sciences 2012, 109, 10310–10315. [Google Scholar] [CrossRef]
- Teär Fahnehjelm, K.; Olsson, M.; Chen, E.; Hengstler, J.; Naess, K.; Winiarski, J. Children with Mucopolysaccharidosis Risk Progressive Visual Dysfunction despite Haematopoietic Stem Cell Transplants. Acta Paediatrica, International Journal of Paediatrics 2018, 107, 1995–2003. [Google Scholar] [CrossRef] [PubMed]
- Intartaglia, D.; Giamundo, G.; Marrocco, E.; Maffia, V.; Salierno, F.G.; Nusco, E.; Fraldi, A.; Conte, I.; Sorrentino, N.C. Retinal Degeneration in MPS-IIIA Mouse Model. Front Cell Dev Biol 2020, 8, 1–12. [Google Scholar] [CrossRef]
- Magalhães, A.; Cunha, A.M.; Vilares-Morgado, R.; Leão-Teles, E.; Rodrigues, E.; Falcão, M.; Carneiro, Â.; Breda, J.; Falcão-Reis, F. Macular Changes in a Mucopolysaccharidosis Type I Patient with Earlier Systemic Therapies. Case Rep Ophthalmol Med 2021, 2021, 1–7. [Google Scholar] [CrossRef] [PubMed]
- Summers, C.G.; Ashworth, J.L. Ocular Manifestations as Key Features for Diagnosing Mucopolysaccharidoses. Rheumatology 2011, 50, 34–40. [Google Scholar] [CrossRef]
- Ludwig, J.; Sawant, O.B.; Wood, J.; Singamsetty, S.; Pan, X.; Bonilha, V.L.; Rao, S.; Pshezhetsky, A. V. Histological Characterization of Retinal Degeneration in Mucopolysaccharidosis Type IIIC. Exp Eye Res 2023, 229, 1–9. [Google Scholar] [CrossRef]
- Tse, D.Y.; Lotfi, P.; Simons, D.L.; Sardiello, M.; Wu, S.M. Electrophysiological and Histological Characterization of Rod-Cone Retinal Degeneration and Microglia Activation in a Mouse Model of Mucopolysaccharidosis Type IIIB. Sci Rep 2015, 5, 1–15. [Google Scholar] [CrossRef]
- The Neuronal Ceroid Lipofuscinoses (Batten Disease); Mole, S.E., Williams, R.E., Goebel, H.H., Eds.; 2nd ed.; Oxford University Press: Oxford, 2011.
- Kruszewski, K.; Lüllmann-Rauch, R.; Dierks, T.; Bartsch, U.; Damme, M. Degeneration of Photoreceptor Cells in Arylsulfatase G-Deficient Mice. Invest Ophthalmol Vis Sci 2016, 57, 1120–1131. [Google Scholar] [CrossRef] [PubMed]
- Mathur, P.; Yang, J. Usher Syndrome: Hearing Loss, Retinal Degeneration and Associated Abnormalities. Biochim Biophys Acta Mol Basis Dis 2015, 1852, 406–420. [Google Scholar] [CrossRef]
- Delmaghani, S.; El-Amraoui, A. The Genetic and Phenotypic Landscapes of Usher Syndrome: From Disease Mechanisms to a New Classification. Hum Genet 2022, 141, 709–735. [Google Scholar] [CrossRef]
- Bauwens, M.; De Man, V.; Audo, I.; Balikova, I.; Zein, W.M.; Smirnov, V.; Held, S.; Vermeer, S.; Loos, E.; Jacob, J.; et al. Expanding the Genetic Landscape of Usher Syndrome Type IV Caused by Pathogenic ARSG Variants. Clin Genet 2024, 1–12. [Google Scholar] [CrossRef]
- Vendhan, K.E.; Harshitha, S.; Kumar, A.; Gautam, A.; Kannan, R.R. Novel Pathognomonic Variant of Atypical Type IV Usher Syndrome with Retinitis Pigmentosa- A Case Report. Journal of Clinical and Diagnostic Research 2022, 16, 10–12. [Google Scholar] [CrossRef]
- Whiting, R.E.H.; Narfström, K.; Yao, G.; Pearce, J.W.; Coates, J.R.; Castaner, L.J.; Katz, M.L. Pupillary Light Reflex Deficits in a Canine Model of Late Infantile Neuronal Ceroid Lipofuscinosis. Exp Eye Res 2013, 116, 402–410. [Google Scholar] [CrossRef]
- Ekesten, B.; Komáromy, A.M.; Ofri, R.; Petersen-Jones, S.M.; Narfström, K. Guidelines for Clinical Electroretinography in the Dog: 2012 Update. Documenta Ophthalmologica 2013, 127, 79–87. [Google Scholar] [CrossRef] [PubMed]
- Wickham, H. Ggplot2: Elegant Graphics for Data Analysis 2016.
- Kick, G.R.; Meiman, E.J.; Sabol, J.C.; Whiting, R.E.H.; Ota-Kuroki, J.; Castaner, L.J.; Jensen, C.A.; Katz, M.L. Visual System Pathology in a Canine Model of CLN5 Neuronal Ceroid Lipofuscinosis. Exp Eye Res 2021, 108686. [Google Scholar] [CrossRef]
- Veterinary Ophthalmology; Gelatt, K.N., Gilger, B.C., Kern, T.J., Eds.; 5th Ed.; John Wiley & Sons, Inc.: Ames, IA, 2013.
- Ishikawa, M.; Sawada, Y.; Yoshitomi, T. Structure and Function of the Interphotoreceptor Matrix Surrounding Retinal Photoreceptor Cells. Exp Eye Res 2015, 133, 3–18. [Google Scholar] [CrossRef]
- Strauss, O. The Retinal Pigment Epithelium in Visual Function. Physiol Rev 2005, 85, 845–881. [Google Scholar] [CrossRef]
- Liu, J.; Itagaki, Y.; Ben-Shabat, S.; Nakanishi, K.; Sparrow, J.R. The Biosynthesis of A2E, a Fluorophore of Aging Retina, Involves the Formation of the Precursor, A2-PE, in the Photoreceptor Outer Segment Membrane. Journal of Biological Chemistry 2000, 275, 29354–29360. [Google Scholar] [CrossRef] [PubMed]
- Boulton, M.; Dayhaw-Barker, P. The Role of the Retinal Pigment Epithelium: Topographical Variation and Ageing Changes. Eye 2001, 15, 384–389. [Google Scholar] [CrossRef]
- Katz, M.L.; Redmond, M.T. Effect of Rpe65 Knockout on Accumulation of Lipofuscin Fluorophores in the Retinal Pigment Epithelium. Invest Ophthalmol Vis Sci 2001, 42, 3023–3030. [Google Scholar] [PubMed]
Figure 7.
Fluorescence micrographs of unstained cryostat sections of a retina from a 6.25-year-old AST who was euthanized due to progression of ataxia associated with homozygosity of the ARSG risk variant. (a) The inner retina including the ganglion cell layer adjacent to the vitreous (v). (b) The outer retina including the retinal pigment epithelium (rpe) and choroid (ch). Autofluorescent inclusion bodies (arrows) occurred primarily in the ganglion cell layer, but not in the ganglion cell bodies (g), and in the rpe. Bar in (a) indicates magnification of both micrographs.
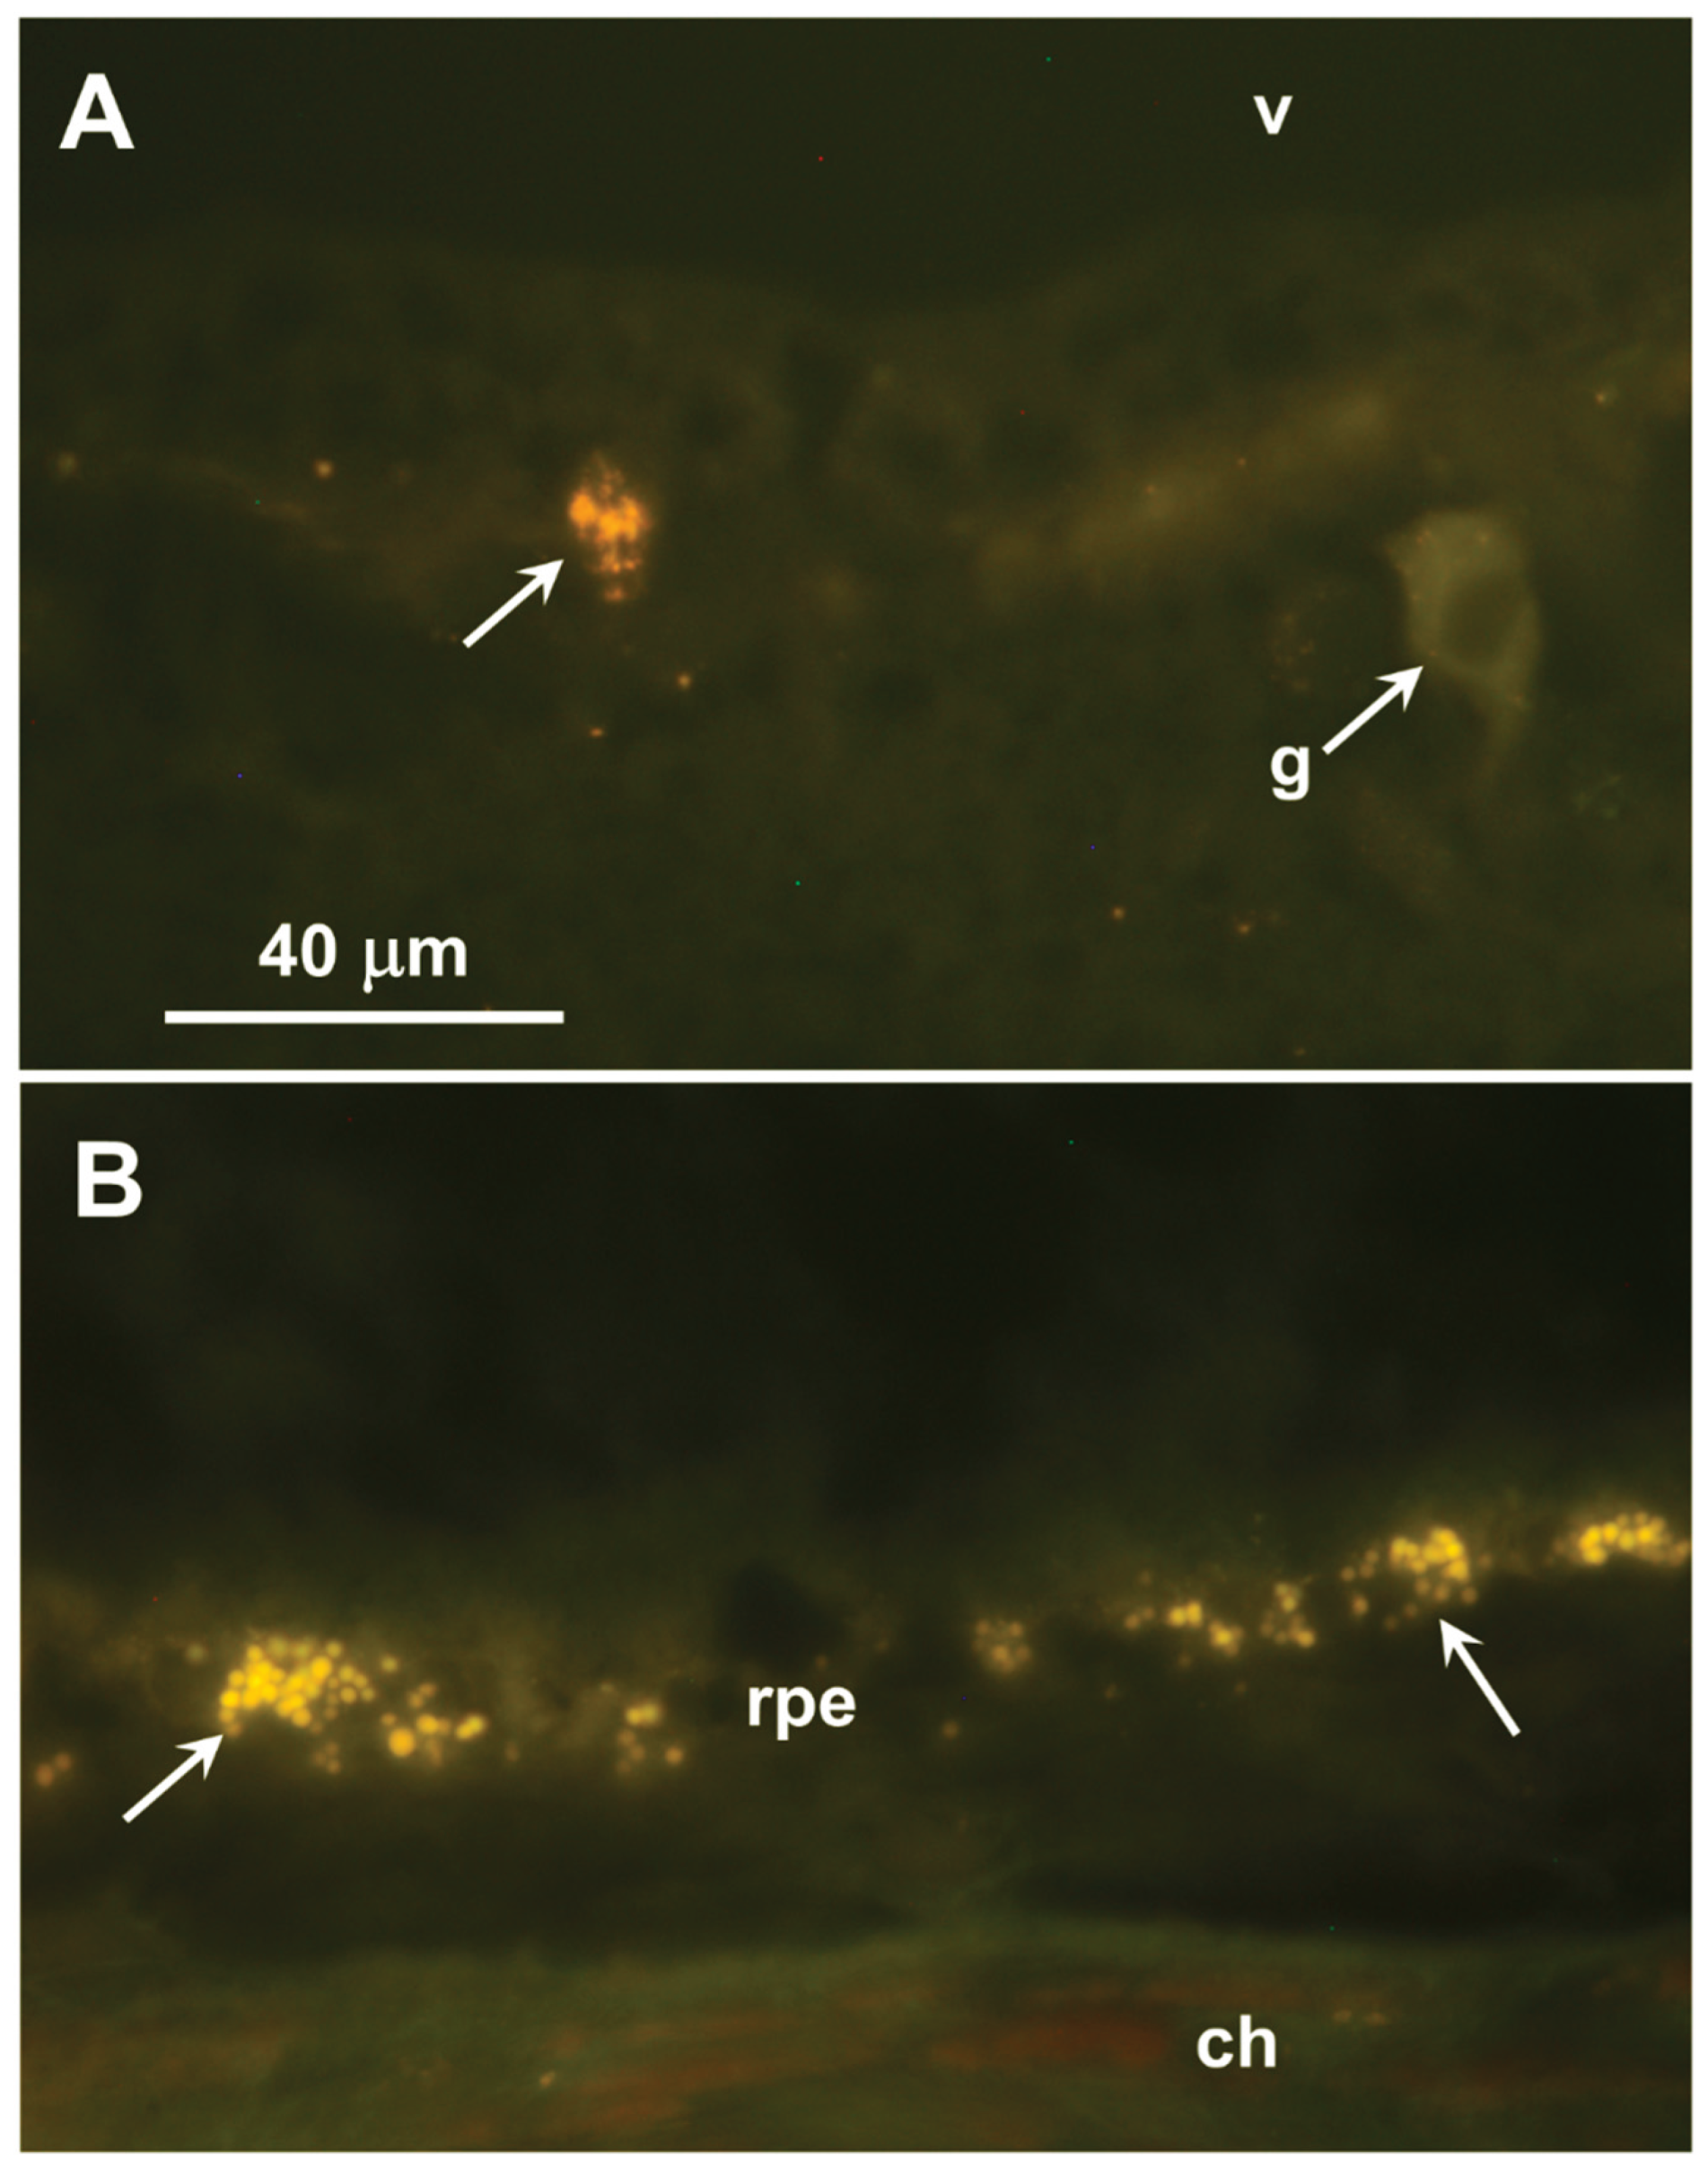

Table 1.
Summary of dogs that underwent ophthalmic examinations.
| ID | Age at Assessment (Years) |
Sex | Ataxia | Scotopic Vision* | Photopic Vision* | |
|---|---|---|---|---|---|---|
| Homozygous for ARSG c.296G>A allele | ARSG-1 | 8 | F | Severe | Normal | Normal |
| ARSG-2 | 8 | M | Moderate | Moderately impaired | Mildly impaired | |
| ARSG-3 | 6 | F | Moderate | Mildly impaired | Mildly impaired | |
| ARSG-4 | 4 | M | No | Normal | Normal | |
| Homozygous for WT ARSG allele | Control-1 | 7 | M | No | Normal | Normal |
| Control-2 | 2 | F | No | Normal | Normal | |
| Control-3 | 8 | M | No | Normal | Normal |
*As reported by owner.
Table 2.
Summary of owner-reported vision in 11 affected ASTs.
| Sex | Age at Questionnaire |
Photopic Vision* | Scotopic Vision* |
|---|---|---|---|
| F1 | 8 | Normal | Normal |
| M | 3.3 | Mild | Moderate |
| M | 4 | Normal | Normal |
| M | 7.7 | Normal | Mild |
| M | 3+ | Normal | Mild |
| F | 4.2 | Normal | Normal |
| M2 | 8 | Mild | Moderate |
| F3 | 5.7 | Mild | Mild |
| M | 6.5 | Mild | Moderate |
| F | ~6 | Normal | Severe |
| F | 5.1 | Normal | Moderate |
*As reported by owner. 1ARSG-1, 2ARSG-2, 3ARSG-3.
Table 3.
ERG results from dog ARSG-4, a 4-year-old AST homozygous for the c.296G>A allele who exhibited no neurological signs at the time of data collection.
Table 3.
ERG results from dog ARSG-4, a 4-year-old AST homozygous for the c.296G>A allele who exhibited no neurological signs at the time of data collection.
| Scotopic Dim Flash | b-wave | 422.8 µV |
| Scotopic Bright Flash | a-wave | 324.1 µV |
| b-wave | 648.4 µV | |
| b:a | 2.00 | |
| Scotopic High-Intensity Flash | a-wave | 400.1 µV |
| b-wave | 690 µV | |
| b:a | 1.72 | |
| Photopic Single Flash | a-wave | 22.2 µV |
| b-wave | 162.3 µV | |
| b:a | 7.31 | |
| Photopic Flicker | b-wave | 167.5 µV |
Disclaimer/Publisher’s Note: The statements, opinions and data contained in all publications are solely those of the individual author(s) and contributor(s) and not of MDPI and/or the editor(s). MDPI and/or the editor(s) disclaim responsibility for any injury to people or property resulting from any ideas, methods, instructions or products referred to in the content. |
© 2025 by the authors. Licensee MDPI, Basel, Switzerland. This article is an open access article distributed under the terms and conditions of the Creative Commons Attribution (CC BY) license (http://creativecommons.org/licenses/by/4.0/).
Copyright: This open access article is published under a Creative Commons CC BY 4.0 license, which permit the free download, distribution, and reuse, provided that the author and preprint are cited in any reuse.


