
Submitted:
08 August 2025
Posted:
11 August 2025
You are already at the latest version
Abstract
Antimicrobial resistance (AMR) represents a serious problem affecting human, animal and ecosystem health. This study evaluated the potential role of white storks as AMR dispersers between two locations frequently used for foraging and resting. Through a whole year, 346 samples (318 feces/ 28 water) were collected in two landfills (225 fecal samples) and two wetlands (93 fecal/ 28 water samples) with a previous tracking that confirmed continuous storks movements between foraging (landfill) and nighttime roosting (wetlands) locations. All samples were seeded in selective media with antibiotics for the isolation of antibiotic resistant bacteria. A total of 313 isolates from 35 different bacterial species were obtained, with an AMR prevalence of 43.1% in fecal samples from landfills, 7.5% in fecal samples from wetlands and 21.4% in water from wetlands. Multidrug resistant bacteria were only found in fecal samples (19.6% landfills/ 4.3% wetlands) and Extended-spectrum beta-lactamase producing-bacteria was found exclusively in fecal samples from landfills with a marked presence during the fall migration stork’s migration period. Despite subtle circumstantial evidence of dispersion between one landfill and its paired wetland and a possible link with migratory movements, the marked differences in prevalence and resistance phenotypes found in each location did not allow establishing a clear dispersal activity by storks.
Keywords:
antimicrobial resistance
; wild birds
; AMR dispersion
; antibiotic resistant bacteria
; ESBL-producing Enterobacterales
1. Introduction
Antimicrobial resistance (AMR) is a major threat for human health globally [1]. In recent years, much attention has been paid to wild birds, in which there is extensive evidence of AMR carriage [2,3,4,5,6]. Many avian species have been shown to excrete clinically relevant bacteria like extended-spectrum beta-lactamase (ESBL) producing Enterobacterales [2,7,8]. These antimicrobial resistant bacteria (ARB) are considered by WHO as critical pathogens with high priority [9], due to their ability to develop multidrug-resistance mechanisms that greatly limit therapeutic options [10].
In addition, the migratory behavior of many wild birds turns AMR carriage into a possible dispersion with entailing spread over long distances, between continents and even reaching very remote locations like the Arctic [3,5,6,11]. This potential for dispersal has been already exemplified in migratory species like the arctic tern (Sterna paradisaea) or seagulls [12,13]. The latter also share a preference for heavily anthropized environments with white storks (Ciconia ciconia), increasing the chances of acquiring ARB and mobile genetic elements [14,15,16]. White storks are long-distance migratory birds that connect the European and African continents throughout their annual cycle [17]. Spain is located on one of the main migratory routes and its wetlands are important stopover sites, concentrating a large number of individuals from northern Europe that join the local population before crossing the Strait of Gibraltar for wintering in sub-Saharan Africa. Also it receives thousands of birds from this continent during their return to their breeding sites in Europe [17,18].
Locally, storks have been shown to connect several different habitats, making use of landfills, rice fields and agricultural lands among others to feed [18]. The use of landfills by storks as predictable sources of food has increased over the last years [19], causing even a modification in their migratory patterns and reproductive behavior [20,21]. Foraging in landfills has shown a greater exposure not only to heavy metals, organic pollutants or plastics [19,22], but also to ARB and microorganisms with great zoonotic potential and relevance for public health [16,23,24]. Furthermore, from dusk to dawn, storks usually rest in wetlands from where they move to feeding areas like landfills [18]. Added to their migratory nature, this continuous movement between environments with such different degrees of anthropization puts storks in the spotlight with a potential capacity for the dispersion of AMR.
This study aims to assess the dispersal capacity of the white stork, based on the premise that if storks are AMR dispersers, we should find the same ARB in stork feces at the landfill and wetland resting sites and, in the water, where the storks spend their night. Having a greater knowledge of the role that wild birds such as storks may play in the dispersion of AMR is essential to be able to face this great challenge from a One Health approach.
2. Materials and Methods
2.1. Study Sites
Two wetlands with a different gradient of anthropogenic pressure and two landfills were chosen for sample collection (Figure 1). Both wetlands were located in Ciudad Real province (Castilla de La-Mancha; central Spain) and represent a nighttime roost for the storks, where these birds stay from sunset to sunrise after spending the day feeding in landfills nearby [17,18]. Tablas de Daimiel National Park (W1; 39°08'51.1"N 3°41'54.9"W), is a riverside wetland linked to Guadiana and Cigüela rivers. Previous GPS tracking has shown regular movements of storks between this wetland and a landfill located at 32 km flight distance, in Almagro (L1; (38°51'09.9"N 3°40'51.9"W) [17]. The Laguna de La Veguilla (W2; 39°24'56.6"N 3°16'15.9"W) is one of the three shallow lakes that make up Las Lagunas de Alcázar and receives water from the industrial wastewater treatment plant located nearby. This wetland is located close to Alcázar de San Juan town, at only 4 km to the nearest landfill (L2, 39°26'04.6"N 3°13'31.9"W).
2.2. Sampling
2.2.1. Sampling Period
Sampling took place throughout one year, from September 2020 to September 2021, comprising the main periods of stork migratory movements: fall migration migration and wintering. Due to the drought that displaced the storks from their usual resting places and prevented the recovery for analysis of water samples (Supplementary Figure S1) in July and august 2021, samples from mid-July to August 2021 were collected from landfills but were excluded from this study. These samples were used by Martínez-Álvarez et al. [24] to detect carbapenemase- and ESBL-producing Enterobacterales. Sampling was also interrupted during the breeding period, from April to June as during this time storks are spatially bound to their nests and are not using the wetlands for resting and, depending on the colony/individuals feed to a lesser extent on landfills [17,25].
2.2.2. Sampling at Wetlands (Water Samples and Fecal-W Samples)
Water sampling was carried out at dawn, after locating a shallow area where the storks were resting (Supplementary Figure S1) and estimating the number of individuals present there. In this sense, 1.5 liters of water were collected in sterile containers and kept refrigerated at no more than 24 hours, until arrival at the Health Sciences Institute (official laboratory of the Autonomic Government of Castilla La-Mancha), where it was processed immediately. Once water was collected, fecal sampling close to wetland (fecal-W) was carried out. Only freshly deposited droppings were taken into AMIES transport medium without charcoal (Deltalab, Barcelona, Spain), with sterile cotton tip swabs, touching the center of the fecal sample and gently rotating the swab to avoid contamination with surroundings (Supplementary Figure S1). The remaining sample was stored in a zip-lock bag to avoid double sampling. A total of 28 water samples and 93 fecal-W samples were collected from wetlands for this study.
2.2.3. Sampling at Landfills (fecal-L Samples)
Sampling in landfills was carried out in a similar way. We first located a monophyletic flock of resting storks and approached the area after estimating the number of individuals and collected fresh droppings as described above. Any sample not clearly identified as stork dropping or showing signs of freshness (shiny and soft) was discarded. Fecal-L samples were collected and stored as mentioned before for wetlands, recovering a total of 225 samples for this study.
All fecal samples from both types of locations (wetlands and landfills) were immediately kept refrigerated in the field until arrival at the laboratory, where they were frozen at -80 ºC until further processing.
2.3. Bacterial Isolation from Fecal Samples
Swabs from fecal samples were submerged in 3 ml of 0.9% saline solution during 30 minutes at room temperature. For Enterobacterales and other gram-negative bacteria isolation, a loopful of the resultant solution was seeded over MacConkey Agar (MCA) plates with the addition of 2µg/ml of cefotaxime. After incubation at 37 ºC for 24 hours, 2 colonies of each morphology were streaked over MCA without antibiotics for purification and incubated again under the same previous conditions.
For enterococci isolation, a loopful of incubated saline solution was seeded in Slanetz-Bartley Agar (S-BA) with 4µg/ml of vancomycin and incubated at 37 ºC during 48 hours. For Pseudomonas spp isolation, 100 µL of the resulting saline suspension was inoculated in 2 ml of brain hearth infusion (BHI) broth for enrichment and incubated at 37 ºC for 24 hours. A loopful of the incubated BHI was seeded over Cetrimide Agar (CA) with 1 µg/ml of imipenem and incubated at 37 ºC/24 hours.
Two colonies of each morphology growing in their specific media were selected and streaked over BHI agar and incubated at 37 ºC for 24 hours, after which 2-4 colonies of each culture were collected into BHI with 10% glycerol and kept frozen at -80 ºC until further processing.
2.4. Bacterial Isolation from Water Samples
100 ml of the water sample was filtered through a membrane with a pore size of 0.45 µm, and membranes were placed onto specific agar plates for every group of bacteria analyzed. Coliform chromogenic agar plates were used for Enterobacterales and other gram-negative bacteria recovery, with an incubation period of 24 hours at 36 ºC ± 2 ºC, while S-BA and CA were used for enterococci and Pseudomonas spp. growth respectively, both incubated during 44 ± 4 h at 36 ºC ± 2 ºC. To perform a similar screening to that previously described with the fecal samples (see 2.3.), all selected colonies were re-seeded in their specific media supplemented with antibiotics (cefotaxime, vancomycin or imipenem), with the same concentrations as previously described. Only colonies that grew in these media were purified in BHI agar and stored in BHI with 10% glycerol under the same conditions described above and kept together with the rest of the colonies obtained from fecal samples for identification and further processing.
2.5. Identification, Antimicrobial Susceptibility Testing and Detection of Resistance Genes by PCR
All selected colonies from the primary screening were identified by MALDI-TOF mass spectrometry (MALDI Biotyper®, Bruker) and phenotypically characterized, except for those considered non-relevant or intrinsically resistant. Antimicrobial susceptibility was carried out by disc-diffusion method, following methodology and breakpoints of the Clinical Laboratory Standard Institute (CLSI) [26], excepting some antibiotics whose breakpoints were read under EUCAST criteria [27]. All antibiotics tested are summarized in Table 1.
2.6. Statistical Analysis
Due to the disparity in sample size and the structure of the results obtained, it was decided to perform statistical models only with the two most robust variables, which were AMR (isolate with any acquired resistance phenotype) and MDR (isolate with resistance to 3 or more antibiotic families). Initially, an attempt was made to fit a generalized linear mixed model (GLMM) with a random effect to capture the variability between specific locations (L1/L2 and W1/W2), but the variance associated with this effect was close to zero and the model presented singularity problems. Therefore, to evaluate the factors associated with the presence of AMR/MDR, we decided to simplify the model to a generalized linear model (GLM) with a logit link function. The response variable was the presence or absence of AMR/MDR, and predictor variables included sample type (water/feces), location (landfill/wetland), and phenological periods (wintering/fall migration).
The association between other categorical variables (Table 2), chosen for their clinical interest (such as prevalence of extended-spectrum beta-lactamase-producing bacteria and their distribution through phenological periods) were compared using the chi-square test. The exact p-value from Fisher’s exact test was reported when more than 20% of the expected frequencies fell below 5. Results with a p value of less than 0.05 were considered statistically significant and those with a p value less than 0.1 were considered a trend. Statistical analyses were performed in Statistical Package for Social Sciences (SPSS) Version 29 (IBM, California, USA) and data was visualized with R 4.2.2 (R Core Team, 2022) using the R packages ‘ggplot2’ (3.4.2), ‘viridis’ (0.6.5) and ‘viridisLite’ (0.4.2).
3. Results
3.1. Recovery of Enterobacterales, Enterococci and Pseudomonas spp. and the Presence of Phenotypic Resistant Patterns
Using the selective antibiotic containing media, we analyzed 346 samples and obtained a total of 313 isolates, representing 35 bacterial species belonging to 11 different families and 17 different genera. From the water samples, 13 different species belonging to 6 families and 9 genera were isolated. The Enterobacteriaceae family was the most representative, with Escherichia coli as the most frequently isolated species in 25% of the samples (7 isolates recovered of 28 samples), followed by Enterobacter cloacae in 7.1% (2/28). The other two families isolated with a high prevalence in water were Aeromonadaceae (absent in fecal samples) and Pseudomonadaceae, both in 10.7% of the samples (3/28). The prevalence of Enterococcus was low in water samples, with only one isolation of E. faecalis (3.6%).
In fecal-W samples, the bacterial diversity was the lowest of all type of samples, with only 6 species from 3 families (Enterococcaceae, Enterobacteriaceae and Yersiniaceae) and 4 different genera. Enterococci were the most prevalent isolates, with E. gallinarum present in 6.5% of samples (6/93) and E. faecium in 4.3% (4/93). Of the remaining isolates, only E. coli was present with a relevant prevalence in 4.3% of samples, recovered in the cefotaxime-supplemented agar media (4/93).
Fecal-L samples presented a much higher bacterial diversity than the rest of the samples, with 29 species belonging to 9 different families and 14 genera, with a greater representation of Enterobacterales. In fecal-L samples, E. coli was the most frequent isolate per sample (35.6%, 80/225), followed by E. gallinarum (30.2%, 68/225) and E. faecalis (21.3%, 48/225). Other families and genera absent in wetlands (water and feces) were also frequently recovered, such as the Morganellaceae family (4%, 9/225), the Citrobacter genus (5.3%, 12/225), and species of interest such as Klebsiella pneumoniae (2.2%, 5/225). The complete list of bacterial species found in the different types of samples and locations, including their prevalences, can be found in the supplementary material ( Figure S2). It is important to indicate that antibiotic-supplemented media were used for the recovery of these isolates.
After identification and susceptibility testing, 197 non-repetitive isolates were selected for this study. These isolates were classified into three broad categories to facilitate comparative studies: genus Enterococcus as the only representatives of Gram-positive bacteria (n = 37), genus Pseudomonas (n = 7), and the third category that contained mainly Enterobacterales (150 of the 153 isolates) and genus Aeromonas, and from now on will be simplified as Enterobacterales group. Of these selected isolates, 18 were recovered from water samples (7 W1 and 11 W2) and 179 from feces (7 W1, 3 W2, 47 L1 and 122 L2). From the 346 samples, 141 isolates recovered in 110 samples showed AMR (31.8% of samples) while 51 isolates from 48 samples showed MDR (13.9%), with landfill samples contributing with most of the total prevalence of both AMR and MDR (n = 97, 28% and n= 44, 12.7% respectively) (Table 3).
Enterobacterales were the group with most AMR isolates (n = 109), notably resistance phenotypes to 3CG (n = 46), ESBL-producers (n = 18) and resistance to fluoroquinolones (n = 32) (Table 3). Regarding enterococci, 31 and 13 isolates showed AMR and MDR phenotypes, respectively. Of the 7 Pseudomonas spp. isolates obtained, only one P. monteilii from L1 showed AMR, with a resistance pattern to ticarcillin and cefepime. Resistance phenotypes of all isolates detected are detailed in Supplementary Figure S3, Figure S4 and Figure S5.
3.2. Recovery of Enterobacterales, Enterococci and Pseudomonas spp. and Strain Phenotypic Resistance Patterns Present in Each Location
3.2.1. Wetland 1 (W1)
In water samples from W1 (n = 15), 9 different bacterial species were found, five of which belong to the Enterobacteriaceae family, two to Aeromonadaceae and two to Pseudomonaceae. All species were isolated in one or two samples each (6.7-13.3%). In fecal-W samples from W1 (n = 35), only 3 bacterial species were found: E. coli and E. faecium, both at the same frequency (8.6%, 3/35), in addition to Serratia ureilytica (2.9%, 1/35) (Suppl. Fig. S1). In W1 related samples, the overall prevalence of samples with AMR isolates was 16%, consisting of 20% of water samples versus 14.3% of fecal samples. Only three water samples (20%) were found with AMR Enterobacterales and one sample (6.7%) with Enterobacterales with resistance to 3GC. Only fecal-W samples showed MDR isolates, with a prevalence of 8.6%.
In the case of fecal-W samples, AMR/MDR enterococci were found in 8.6% and 2.8% of samples respectively. The two samples with AMR Enterobacterales were also MDR (5.7%), presenting a prevalence of fecal-W samples with Enterobacterales with resistance to quinolones of 5.7%, and resistance to 3GC of 2.8%. ESBL-producing Enterobacterales were not found in any type of sample. Regarding the changes throughout phenological periods, water samples showed a trend to a higher prevalence of AMR/AMR Enterobacterales in the wintering period (χ2 = 4.286, d.f. = 1, p < 0.1). No statistically significant differences were observed in the fecal-W samples (Figure 2).
3.2.2. Wetland 2 (W2)
In water samples from W2 (n = 13), seven bacterial species from five different families were found, with E. coli being the most frequently isolated (46.2%, 6/13) while the rest of the species were only found in one sample each (7.7%). In the fecal-W samples from W2 (n = 58), five bacterial species were obtained, the vast majority being Enterococcus with E. gallinarum in 10.3% of the samples (6/58). E. coli, Klebsiella oxytoca, as well as Enterococcus faecium and Enterococcus casseliflavus were all isolated in one sample each (1.7%) (Suppl. Fig. S1). Water samples recorded a higher prevalence of AMR isolates (23.1%) than the fecal-W samples (3.4%), although only in fecal-W ones we encountered some samples with MDR isolates (1.7%). As in W1, only AMR Enterobacterales were found in the water samples (23.1%) and only one sample contained a phenotype for resistance to 3GC in Enterobacterales (7.7%). For fecal-W samples, prevalences were very low, with one sample positive for AMR Enterococcus that was also MDR (1.7%) and one sample with AMR Enterobacterales (1.7%) that did not show any of the three main resistance phenotypes included in the analysis. Regarding the phenological periods, no significant differences were observed for any of the variables analyzed in either water or fecal-W samples (Figure 2).
3.2.3. Landfill 1 (L1)
In L1 (n = 76), the most frequently isolated family was Enterococcaceae, with five different Enterococcus species, the most prevalent being E. gallinarum (36.8%, 28/76), E. faecalis (28.9%, 22/76), E. faecium (9.2%, 7/76) and E. mundtii (6.6%, 5/76). E. coli was the other relevant bacterial species, isolated in 22.4% of the samples (17/76), and the rest of the bacterial species were recovered in one to three samples each (1.3-3.9%) (Suppl. Fig. S1). In this location, 42.1% of samples presented some isolate with AMR and 28.9% that were also MDR. In the case of enterococci, 21% of the samples presented some enterococci with an AMR phenotype and 9.2% that were also MDR. The prevalence of samples in which we detected some AMR Enterobacterales was similar to that of enterococci (26.3%) but many of these samples were also MDR (19.7%). Regarding the main resistance phenotypes in Enterobacterales, resistance to fluoroquinolones (ciprofloxacin) was the most frequent, encountered in 17.1% of the samples, followed by resistance to 3GC (13.2%) and ESBL-producing Enterobacterales (10.5%).
Regarding the differences between the fall migration and wintering period, L1 clearly showed a higher prevalence for most AMR phenotype bacteria in fall migration: AMR (χ2 = 10.445, d.f. = 1, p < 0.001), MDR (χ2 = 11.181, d.f. = 1, p < 0.001), MDR Enterobacterales (χ2 = 6.886, d.f. = 1, p < 0.05), 3rd gen cephalosporine resistant Enterobacterales (χ2 = 8.837, d.f. = 1, p < 0.05), fluoroquinolone resistant Enterobacterales (χ2 = 5.018, d.f. = 1, p < 0.05) and ESBL-producing Enterobacterales (χ2 = 6.862, d.f. = 1, p < 0.05). However, AMR from both Enterobacterales and Enterococcus only showed a tendency to be more prevalent in fall migration (χ2 = 3.749, d.f. = 1, p < 0.1 y χ2 = 2.799, d.f. = 1, p < 0.1 respectively) while MDR Enterococcus was the only variable with no significant differences between periods. (Figure 2).
3.2.4. Landfill 2 (L2)
In L2, E. coli was the most frequently isolated species in 42.3% of the samples (63/149), although Enterococcus was also present with high frequency, especially E. gallinarum (26.8%, 40/149), and E. faecalis (17.4%, 26/149), in addition to E. casseliflavus (1.3%, 2/149), which is absent in other types of samples. Other species obtained with some frequency were Hafnia alvei (4.7%, 7/149), Citrobacter freundii (4%, 6/149), Klebsiella oxytoca (3.4%, 5/149) and Citrobacter braakii (2.7%, 4/149). The remaining species were isolated in one to three samples each (0.7-2%) (Suppl. Fig. S1).
The prevalence of samples with any AMR phenotype was similar to landfill L1 (43.6%), although the MDR rate was lower (14.8%). For enterococci, the prevalence of samples with AMR and MDR enterococci was 7.4% and 2.7% respectively, while for Enterobacterales it was 38.3% for AMR and 12.8% for MDR. In the main resistance phenotypes in Enterobacterales, the pattern changes slightly with respect to L1, with the most prevalent being resistance to 3GC (19.5%) followed by resistance to fluoroquinolones (10.7%) and ESBL-producing Enterobaterales (6.7%). Regarding the phenological periods, L2 was more variable, with significantly higher prevalence in wintering for AMR (χ2 = 4.392, d.f. = 1, p < 0.05) and a trend for AMR Enterobacterales (χ2 = 3.541, d.f. = 1, p < 0.1), to be also more prevalent in wintering. Only ESBL-producing Enterobacterales were significantly more prevalent in samples collected in the fall migration period (χ2 = 10.594, d.f. = 1, p < 0.01).
3.3. Comparative Analysis of E. coli Isolates
From the total of samples, 114 E. coli isolates were recovered in 91 samples (32.9% of samples), of which 70 isolates presented some resistance phenotype (61.4 % of total E. coli) (Supplementary Fig. S2). Fecal-L samples from both landfills presented significantly higher prevalences than fecal-W samples for AMR/MDR E. coli (χ2 = 23.996, d.f. = 1, p < 0.001 and χ2 = 9.565, d.f. = 1, p < 0.01 respectively) as well as all the specific resistances analyzed: resistance to 3GC (χ2 = 12.229, d.f. = 1, p < 0.001), to ampicillin (χ2 = 19.047, d.f. = 1, p < 0.001), to monobactam (χ2 = 7.890, d.f. = 1, p < 0.01), to fluoroquinolones (χ2 = 6.800, d.f. = 1, p < 0.01), to sulfonamides (χ2 = 8.357, d.f. = 1, p < 0.01), to tetracyclines (χ2 = 9.780, d.f. = 1, p < 0.01) and to aminoglycosides (χ2 = 5.060, d.f. = 1, p < 0.05). No statistical differences in the prevalences of resistant E. coli was observed between landfills nor between fecal-W samples. Comparing E. coli isolated in water samples between wetlands, those isolates resistant to ampicillin showed a trend to a significantly higher prevalence in W2 than in W1 (χ2 = 3.877, d.f. = 1, p < 0.1).
Regarding the two phenological periods, in L1 significantly higher prevalences in fall migration period were observed for MDR E. coli (χ2 = 4.152, d.f. = 1, p < 0.05), ESBL-producing E. coli (χ2 = 4.999, d.f. = 1, p < 0.05) and E. coli resistant to 3GC (χ2 = 6.862, d.f. = 1, p < 0.05). The landfill L2 presented one significantly higher prevalence in fall migration for ESBL-producing E. coli (χ2 = 12.898, d.f. = 1, p < 0.01), with a tendency for resistance to monobactam, also higher in fall migration (χ2 = 3.362, d.f. = 1, p < 0.1). In both wetlands, no significant differences were found between phenological periods for any type of sample nor any of the variables analyzed.
3.4. Antibiotic Resistance Rate in E. coli Isolates
Of the 70 E. coli isolates with resistant phenotype, 15 were phenotypic ESBL carriers. The highest antibiotic resistance rates were to ampicillin (n = 46, 65.7%), cefotaxime (n = 33, 47.1%) and tetracycline (n = 31, 44.3%) (Table 4). Most E. coli with phenotypic ESBL were positive to blaCTX-M carriage (93.3%, 14/15).
3.5. Distribution of Antibiotic Resistances in E. coli Classified by Locations and Phenological Periods
The distribution of the number of resistances to different antibiotic families was very uneven between locations (landfills-wetlands) and phenological period (fall migration-wintering). In general, around 50% of the E. coli isolates showed between none to one resistances to some antibiotic family. In landfills, isolates with resistance to up to eight different antibiotic families were detected, with a range of four to eight in 30% of the isolates and approximately 50% of MDR. In wetlands, around 60% of the isolates showed a range of none to one resistances, with a maximum of five different resistances per isolate and less than 20% of the isolates presenting MDR. Between fall migration and wintering, in both periods isolates were detected with a maximum of 8 different resistances, but the fall migration period concentrated a range of five to eight in 50% of its isolates, while in winter more than 60% of the isolates remained in the range of none to one resistance (Figure 3).
3.6. Factors Affecting the Probability of Acquiring AMR/MDR
The statistical model showed that bacteria isolated from water samples, all from wetlands, have a higher probability of presenting AMR compared to those isolated from fecal-W samples in the same environment (coefficient = -1.5921, p < 0.01). In addition, fecal-L samples from landfills have a significantly higher probability of AMR compared to those from wetlands (coefficient = 2.2311, p < 0.001). Phenological periods did not have a significant effect on the probability of AMR, being excluded from the model for a better fit (Figure 4)
Regarding the probability of presenting MDR, fecal-L samples from landfills have a significantly higher probability than wetland samples (coefficient = 2.0899, p < 0.001). Similarly, samples collected during the fall migration period are more likely to present MDR than those from wintering periods (coefficient = 1.1026, p < 0.001). In this case, the type of sample did not have a significant effect on the probability of acquiring MDR in wetlands (Figure 4).
3.7. Comparative Study of Enterobacterales by Paired Wetlands and Landfills
Using the previous GPS data [17], we compared the locations matched by the spatial ecology of the storks (L1-W1/ L2-W2), focusing on changes in prevalence observed in the two phenological periods. Due to the small number of samples with resistant enterococci isolated in wetlands, for this comparison only the data obtained in Enterobacterales were used.
3.7.1. L1 vs W1
As previously mentioned (see 3.2.), L1 showed significant differences in the prevalence of resistant phenotypes in general, with a marked increase during the fall migration period (Figure 2). Although results from W1 did not reveal any significant difference between phenological periods, a slight increase or decrease in prevalences was observed. When comparing the changes in resistant phenotype prevalence between L1 and W1 fecal samples, certain similarities could be seen in all resistance phenotypes studied for Enterobacterales, with the highest prevalence always occurring in the fall migration period for both locations, showing a decrease in prevalence during wintering in the case of the landfill and an absence of positive results during wintering for the wetland. However, while resistant phenotype prevalence in stork feces from the different locations followed a similar trend, this was not matched by the water samples, in many of which resistant phenotypes were absent, and prevalence of the few isolates with resistant phenotypes was highest during wintering (Figure 5).
3.7.2. L2 vs W2
A nearly absolute absence of isolates obtained in W2 fecal samples made it impossible to establish any comparison between L2 and W2 fecal samples. In addition, the prevalences in L2 for both phenological periods were very similar in the case of most of the resistance phenotypes (Figure 5). In L2, Enterobacterales with resistance to fluoroquinolones, phenicol and monobactams showed a clear change in prevalences according to wintering or fall migration periods, but no isolates were obtained in W2 fecal nor water samples for these resistance phenotypes. In the case of resistance to tetracyclines, the prevalence in water samples resulted in an opposite trend to L2. There was a certain similarity for resistance to 3GC, sulfonamides and penicillins, with an increasing prevalence coinciding in both samples in the same phenological period, but in L2 the prevalences for these three phenotypes between wintering and fall migration are so similar that it weakened this comparison.
3.8. Comparative Study of Antibiotic Resistance Rates in E. coli Isolates Between Paired Wetlands and Landfills
As described when comparing Enterobacterales, fecal samples from L1 and W1 both showed an increase in prevalences in the fall migration period. Prevalences of resistance to all antibiotics were higher in L1 in the fall migration period, decreasing or absent in samples collected during wintering. For W1 fecal samples, E. coli resistant to several antibiotics were found in the fall migration period while no results were obtained in wintering. In water samples results were only obtained for resistance to gentamicin in wintering, that contrasted with higher prevalences in fall migration period for fecal samples from both locations (Figure 6).
When comparing L2 with W2, a complete absence of resistant E. coli was observed for W2 fecal samples. In L2, prevalence of resistances to several antibiotics increased in the fall migration period and decreased in wintering, although some resistances showed the opposite trend (tetracycline, amoxicillin-clavulanate and trimethoprim/sulfamethoxazole). Between fecal-L in L2 and W2 water samples, the same similarities occurred in resistance to ampicillin, cefotaxime and cefoxitin, where samples from both locations showed an increased prevalence in fall migration and a decrease or absence in wintering (Figure 6).
4. Discussion
In this study we test the hypothesis of the role of white storks as ARB dispersers through the comparison of resistant phenotypes in fecal samples deposited by the assumed same stork population in landfills and wetlands, and in the water of their resting areas. A total of 313 isolates were obtained from 346 samples (28 water, 318 fecal samples) collected throughout important phenological periods in the white storks’ ecology. The results revealed significant differences in contents of ARB, MDR and ESBL-producing Enterobacteria between landfill and wetland collected feces and water collected at stork resting locations, thus not supporting a significant role of storks in AMR spread.
While numerous studies have tested wild bird samples, both feces and swabs locally for ARB [3,14,29], few to no studies have examined samples from a population continuously over time. In addition while several studies have tested and tagged birds with GPS transmitters evidencing the potential distance of spread [5,13], few have analyzed samples from these locations and those that have not been able to confirm dispersion [5].
The statistical models applied in this study suggested that both sample type and location play an important role in the probability of AMR, although in our study their effects are not directly comparable because the initial screening methodology to obtain the bacterial isolates differed slightly between water and fecal samples. Landfills were the location with the highest probability to find AMR/MDR in white stork feces. This was to be expected since several authors have described high prevalences of excretion of AMR/MDR in storks and other wild birds foraging at landfills [14,15,16,23]. Also the probability of finding AMR isolates in wetlands was greater in water than in fecal samples, and the obtained isolates in water differed from those in fecal samples in their resistance phenotypes, their prevalence in the two phenological periods, and, in the case of E. coli isolates the number of different families of antibiotics to which they showed resistance.
The prevalence of MDR varied with stork phenology, with the highest prevalence in samples collected during fall migration. In this period there is a progressive arrival of storks from northern Europe, as both landfills are an important stop-over for the Western European flyway, which brings together thousands of storks as a prior step to moving further south and crossing the Strait of Gibraltar for wintering in Africa [17,18]. Specifically, this is reflected as between 2011 and 2013 our group carried out regular censuses and ring lectures every ten days during two years in L1 and L2 by Hernández and Höfle [30]. This showed that a change in population occurred that started at the end of June approximately, with an increase in sightings of storks from northern Europe (mainly Germany) through ring reading. L1 registered a much more marked increase (> 2500 storks) and maintained a much larger population than L2 during several months, which could explain why in our study L1 was the location with the greatest difference in the results between wintering and fall migration.
When comparing the temporal variations of AMR/MDR prevalences between the landfill and the corresponding wetland used by the storks, a higher similarity was observed between L1 and W1 than between L2 and W2. The differences in prevalences of the phenotypes analyzed were much more significant and higher in L1 during the fall migration period, tan in W1 in the same period. However none of these variations are reflected in the water samples despite collection precisely at the storks’ resting area, thus not providing any evidence of a potential dispersion from the landfill to the wetland based on the results obtained. A possible limitation of this study is the different methodology for the primary screening for the isolation of strains between water samples and fecal samples, since the waters were initially cultured in media without antibiotics, which could imply an involuntary primary selection of a greater number of non-resistant strains. In any case, the prevalence of AMR in fecal-W samples was much lower than in fecal-L, so for the comparative purposes of this study these differences in methodology do not seem to have conditioned the main conclusions obtained from our results.
We analyzed the E. coli isolates obtained in detail, finding statistically significant differences between wetlands and landfills for all the phenotypes studied. Furthermore, the number of resistances to different families of antibiotics marks a clear difference between wetland and landfill origin isolates, with a greater number of MDR isolates in landfills but also a greater diversity of resistance mechanisms per isolate compared to E. coli isolated from wetlands. All these results suggest that the E. coli excreted by storks in landfills is not related to those excreted in the wetlands or those found in water. A potential albeit not very likely explanation for this difference in results may stem from a specialized behavior that some individuals have shown in a specific ecosystem such as rice fields as a foraging strategy [31]. In this study, we sampled the storks as a group and cannot associate our samples with individual storks. Although we were confirming the movement between wetlands and landfills by GPS tracking data and ring lectures, we cannot rule out that fecal samples from storks collected at wetlands could be from storks that are not using the landfills to forage. Nevertheless no rice fields or wet meadows exist in our study area making foraging strategies other than the landfills in the sampled storks not very likely.
Finally, one of the most important findings was the detection of ESBL-producing E. coli/K. pneumoniae, most of them carrying the blaCTX-M gen, since these bacteria are considered a major threat to public health and are included as a critical group on the WHO list of priority pathogens [9]. Most ESBL-producing isolates (14/18) were recovered during the fall migration period and only from samples collected at landfills. The results of this study are in line with those obtained in a previous study in which we only analyzed landfill fecal samples in the early fall migration period (July-August) and found a very high prevalence of ESBL-producing bacteria (33.3%) [24]. The prevalence of ESBLs found in our study for the later fall migration period (13.1%), is significantly lower than the one detected by Martínez-Álvarez et al. [24], although significantly higher than that for the wintering period (1.9%). This suggests a relation of the peak of ESBL detections with the arrival of juvenile/migratory storks previously mentioned [30].
These findings on ESBL-producing Enterobacterales could point towards a possible role of storks as dispersers of clinically relevant bacteria through their migratory route. Tracking of stork nestlings from Germany has shown how these individuals fly from north to south passing through hot spots such as landfills located in Catalonia or Madrid, with the capacity to concentrate an enormous amount of waste [32]. However, no water or fecal samples taken in wetlands during the same period of the above-mentioned study retrieved any ESBL-producing bacteria. A possible explanation could be that these migrant storks do not rest in the wetlands used in the study or even that they stay in the landfill all the time, since some migrant storks specialize more in landfill-foraging than residents [31]. Another explanation may be that during the summer months in our study years, a severe drought dropped the water level in the wetlands drastically, displacing some storks to other resting places.
In addition to the aforementioned drought, another limitation detected in this study was obtaining enough fecal samples in wetlands. On some occasions, the storks were found in places that were difficult to access, besides some samples were very diluted or soaked, reducing the number of optimal samples to collect, which caused an inequality in sample size between landfills and wetlands.
Nevertheless, in this study storks have proven utility as indicators of sources of ESBL-producing Enterobacterales at a certain point in time. The peak prevalence found for ESBL-producing isolates could also indicate a certain degree of dispersion, since it coincides in time with the arrival of massive numbers of storks to these locations, although the source of these highly marked and time restricted prevalences may be due to other causes that have not been elucidated. Although there are some evidences of AMR dispersion between L1 and its corresponding W1, with similar variations throughout the year, transmission between landfills and wetlands has not been confirmed. The data obtained does not evidence any influence of stork activity on the prevalence of AMR nor any specific resistance phenotypes of bacteria studied in water, between the stork’s excretion in wetlands and the water surrounding roosting storks. In future studies it would be necessary to take environmental samples from landfills simultaneously with fecal samples. In this way, it would be possible to elucidate whether these bacteria are acquired in the landfill itself or if they are carried by the storks in their GI track and excreted at the sampling site, since other authors have experimentally proven ARB carriage and excretion over time in other avian species [33,34]. Likewise, it would be interesting to be able to carry out several samplings over the years to observe if the increase in prevalence was an isolated finding or if it occurs every year coinciding with migratory movements. Finally genome based in addition to culturomics approaches as carried out by Martínez-Álvarez et al. [24] may help to further elucidate potential of storks for resistance mechanism dispersal.
5. Conclusions
The results obtained in this study do not support an evident antibiotic resistance dispersal activity of storks. Nevertheless our data hints faintly at dispersion between one of the landfills and its paired wetland, and reveals a significant increase in the detection of ESBL-producing Enterobacterales in samples collected during fall migration that could reflect arrival of migrating storks in our study area. Further long-term studies based on comparative analysis of sequences of mobile genetic elements that carry resistance mechanisms are necessary to better understand the role that these birds can play as AMR dispersers, as well as their usefulness as AMR sentinels.
Supplementary Materials
The following supporting information can be downloaded at: Preprints.org, Figure S1: White storks resting at dawn in an area of shallow water in W1 (top left) and the drought affecting the same wetland (bottom left). Fecal sampling in wetlands (right); Figure S2: Proportion (in %) of different bacterial species recovered in water samples from wetlands (a) stork-fecal samples from wetlands (b) and stork-fecal samples from landfills (c), divided by their specific location; Figure S3: Heat map showing antibiotic susceptibility (white) and resistance (black) of Gram-negative isolates (except Pseudomonas spp.) recovered from stork-fecal and water samples, classified by location; Figure S4: Heat map showing antibiotic susceptibility (white) and resistance (black) of all Enterococcus strains recovered from stork-fecal and water samples, classified by location. Figure S5: Heat map showing antibiotic susceptibility (white) and resistance (black) of all Pseudomonas spp. strains recovered from stork-fecal and water samples, classified by location.
Author Contributions
Conceptualization, C.T. and U.H.; methodology, T.C., S.M., Y.M., A.S., J.C.M. and J.M.F.; formal analysis, T.C. and U.H.; investigation, T.C., S.M., U.H., C.T. and A.S.; resources, C.T. and U.H.; data curation, T.C., C.T. and U.H.; writing—original draft preparation, T.C., C.T. and U.H.; writing—review and editing, T.C., S.M., Y.M., A.S., J.C.M., J.M.F, C.T. and U.H.; visualization, T.C. and U.H.; supervision, C.T. and U.H.; project administration, U.H.; funding acquisition, U.H. All authors have read and agreed to the published version of the manuscript.
Funding
This research was funded by project SBPLY/19/180501/000325 of the regional government of Castilla – La Mancha by the European Union’s funds for regional development (FEDER).
Informed Consent Statement
Not applicable.
Data Availability Statement
Data are reported in the manuscript. Data will be made available upon request.
Acknowledgments
We are grateful to José Manuel Hernández (Birdlife Spain certified birdringer) for his immense knowledge of all spatial ecology of storks in South-central Spain. We are also thankful to Tablas de Daimiel National Park and Residuos Sólidos Urbanos de Castilla La Mancha (RSU) for allowing the access to their premises.
Conflicts of Interest
The authors declare no conflicts of interest.
Abbreviations
The following abbreviations are used in this manuscript:
| ARB | Antimicrobial resistant bacteria |
| AMP | Ampicillin |
| AMC | Amoxicillin/clavulanate |
| AMK | Amikacin |
| AMR | Antimicrobial resistance |
| ATM | Aztreonam |
| BHI | Brain hearth infusion |
| CA | Cetrimide agar |
| CAZ | Ceftazidime |
| CHL | Chloramphenicol |
| CLSI | Clinical Laboratory Standard Institute |
| CIP | Ciprofloxacin |
| CTX | Cefotaxime |
| ERY | Erythromycin |
| ESBL | Extended-spectrum beta-lactamase |
| EUCAST | European Committee on Antimicrobial Susceptibility Testing |
| FEP | Cefepime |
| FOX | Cefoxitin |
| GEN | Gentamicin |
| GLM | Generalized linear model |
| GLMM | Generalized linear mixed model |
| GPS | Global positioning system |
| L | Landfill |
| LNZ | Linezolid |
| MCA | MacConkey Agar |
| MDR | Multi-drug resistance |
| PCR | Polymerase Chain Reaction |
| PRL | Piperacillin-tazobactam |
| S-BA | Slanetz-Bartley Agar |
| STR | Streptomycin |
| SXT | Trimethoprim/sulfamethoxazole |
| TET | Tetracycline |
| TIC | Ticarcillin |
| TOB | Tobramycin |
| VAN | Vancomycin |
| W | Wetland |
| WHO | World Health Organization |
| 3CG | Third generation cephalosporine |
References
- WHO. Antimicrobial resistance. Available online: https://www.who.int/news-room/fact-sheets/detail/antimicrobial-resistance (accessed on 7 October, 2024).
- Wang, J.; Ma, Z.B.; Zeng, Z.L.; Yang, X.W.; Huang, Y.; Liu, J.H. The role of wildlife (wild birds) in the global transmission of antimicrobial resistance genes. Zool. Res. 2017, 38, 55–80. [Google Scholar] [CrossRef]
- Lin, Y.; Dong, X.; Sun, R.; Wu, J.; Tian, L.; Rao, D.; Zhang, L.; Yang, K. Migratory birds-one major source of environmental antibiotic resistance around Qinghai Lake, China. Sci. Total Environ. 2020, 739, 139758. [Google Scholar] [CrossRef] [PubMed]
- Zhao, H.; Sun, R.; Yu, P.; Alvarez, P.J.J. High levels of antibiotic resistance genes and opportunistic pathogenic bacteria indicators in urban wild bird feces. Environ. Pollut. 2020, 266 Pt 2, 115200. [Google Scholar] [CrossRef] [PubMed]
- Ahlstrom, C.A.; Woksepp, H.; Sandegren, L.; Mohsin, M.; Hasan, B.; Muzyka, D.; Hernandez, J.; Aguirre, F.; Tok, A.; Söderman, J.; Olsen, B.; Ramey, A.M.; Bonnedahl, J. Genomically diverse carbapenem resistant Enterobacteriaceae from wild birds provide insight into global patterns of spatiotemporal dissemination. Sci. Total Environ. 2022, 824, 153632. [Google Scholar] [CrossRef] [PubMed]
- Li, X.; Mowlaboccus, S.; Jackson, B.; Cai, C.; Coombs, G.W. Antimicrobial resistance among clinically significant bacteria in wildlife: An overlooked one health concern. Int. J. Antimicrob. Agents 2024, 64, 107251. [Google Scholar] [CrossRef]
- Palmeira, J.D.; Cunha, M.V.; Carvalho, J.; Ferreira, H.; Fonseca, C.; Torres, R.T. Emergence and spread of cephalosporinases in wildlife: a review. Animals 2021, 11, 1765. [Google Scholar] [CrossRef]
- Suarez-Yana, T.; Salgado-Caxito, M.; Hayer, J.; Rojas-Sereno, Z.E.; Pino-Hurtado, M.S.; Campaña-Burguet, A.; Caparrós, C.; Torres, C.; Benavides, J.A. ESBL-producing Escherichia coli prevalence and sharing across seabirds of central Chile. Sci. Total Environ. 2024, 951, 175475. [Google Scholar] [CrossRef]
- WHO Bacterial Priority Pathogens List, 2024: bacterial pathogens of public health importance to guide research, development and strategies to prevent and control antimicrobial resistance. Geneva: World Health Organization; 2024. Licence: CC BY-NC-SA 3.0 IGO. Available online: https://iris.who.int/bitstream/handle/10665/376776/9789240093461-eng.pdf (accessed on day month year).
- Peirano, G.; Pitout, J.D.D. Extended-Spectrum β-Lactamase-Producing Enterobacteriaceae: Update on Molecular Epidemiology and Treatment Options. Drugs 2019, 79, 1529–1541. [Google Scholar] [CrossRef]
- Arnold, K.E.; Williams, N.J.; Bennett, M. 'Disperse abroad in the land': the role of wildlife in the dissemination of antimicrobial resistance. Biol. Lett. 2016, 12, 20160137. [Google Scholar] [CrossRef]
- Ahlstrom, C.A.; Bonnedahl, J.; Woksepp, H.; Hernandez, J.; Olsen, B.; Ramey, A.M. Acquisition and dissemination of cephalosporin-resistant E. coli in migratory birds sampled at an Alaska landfill as inferred through genomic analysis. Sci. Rep. 2018, 8, 7361. [Google Scholar] [CrossRef]
- Akhil Prakash, E.; Hromádková, T.; Jabir, T.; Vipindas, P.V.; Krishnan, K.P.; Mohamed Hatha, A.A.; Briedis, M. Dissemination of multidrug resistant bacteria to the polar environment - Role of the longest migratory bird Arctic tern (Sterna paradisaea). Sci. Total Environ. 2022, 815, 152727. [Google Scholar] [CrossRef]
- Jarma, D.; Sánchez, M.I.; Green, A.J.; Peralta-Sánchez, J.M.; Hortas, F.; Sánchez-Melsió, A.; Borrego, C.M. Faecal microbiota and antibiotic resistance genes in migratory waterbirds with contrasting habitat use. Sci. Total Environ. 2021, 783, 146872. [Google Scholar] [CrossRef] [PubMed]
- Jarma, D.; Sacristán-Soriano, O.; Borrego, C.M.; Hortas, F.; Peralta-Sánchez, J.M.; Balcázar, J.L.; Green, A.J.; Alonso, E.; Sánchez-Melsió, A.; Sánchez, M.I. Variability of faecal microbiota and antibiotic resistance genes in flocks of migratory gulls and comparison with the surrounding environment. Environ. Pollut. 2024, 359, 124563. [Google Scholar] [CrossRef] [PubMed]
- Sacristán-Soriano, O.; Jarma, D.; Sánchez, M.I.; Romero, N.; Alonso, E.; Green, A.J.; Sànchez-Melsió, A.; Hortas, F.; Balcázar, J. L.; Peralta-Sánchez, J.M.; Borrego, C.M. Winged resistance: Storks and gulls increase carriage of antibiotic resistance by shifting from paddy fields to landfills. Sci. Total Environ. 2024, 914, 169946. [Google Scholar] [CrossRef] [PubMed]
- Bécares, J.; Blas, J.; López-López, P.; Schulz, H.; Torres-Medina, F.; Flack, A.; Enggist, P.; Höfle, U.; Bermejo, A.; de la Puente, J. Migración y ecología espacial de la cigüeña blanca en España. Monografía no: 5 del programa Migra. SEO/BirdLife 2019. [Google Scholar] [CrossRef]
- López-Calderón, C.; Martín-Vélez, V.; Blas, J.; Höfle, U.; Sánchez, M.I.; Flack, A.; Fiedler, W.; Wikelski, M.; Green, A.J. White stork movements reveal the ecological connectivity between landfills and different habitats. Mov. Ecol. 2023, 11, 1–13. [Google Scholar] [CrossRef]
- Plaza, P.I.; Lambertucci, S.A. How are garbage dumps impacting vertebrate demography, health, and conservation? Global Ecol. Cons. 2017, 12, 9–20. [Google Scholar] [CrossRef]
- Molina, B.; Del Moral, J.C. La cigüeña blanca en España. VI Censo internacional. SEO/BirdLife. Madrid, 2005. Available online at: https://www.seo.org/wp-content/uploads/2012/04/4_ciguena_blanca1.pdf (Accesed on 4 November, 2025).
- López-García, A.; Aguirre, J.I. White Storks nest at high densities near landfills changing stork nesting distributions in the last 4 decades in Central Spain. Ornithological Applications 2023, 125, duad009. [Google Scholar] [CrossRef]
- de la Casa-Resino, I.; Hernández-Moreno, D.; Castellano, A.; Pérez-López, M.; Soler, F. Chlorinated pollutants in blood of White stork nestlings (Ciconia ciconia) in different colonies in Spain. Chemosphere 2015, 118, 367–372. [Google Scholar] [CrossRef]
- Höfle, U.; Gonzalez-Lopez, J.; Camacho, M.C.; Solà-Ginés, M.; Moreno-Mingorance, A.; Manuel Hernández, J.; De La Puente, J.; Pineda-Pampliega, J.; Aguirre, J.I.; Torres-Medina, F.; Ramis, A.; Majó, N.; Blas, J.; Migura-García, L. Foraging at solid urban waste disposal sites as risk factor for cephalosporin and colistin resistant Escherichia coli carriage in white storks (Ciconia ciconia). Front. Microbiol. 2020, 11, 1397. [Google Scholar] [CrossRef]
- Martínez-Álvarez, S.; Höfle, U.; Châtre, P.; Alonso, C.A.; Asencio-Egea, M.A.; François, P.; Cardona-Cabrera, T.; Zarazaga, M.; Madec, J.; Haenni, M.; Torres, C. One Health bottom-up analysis of the dissemination pathways concerning critical priority carbapenemase- and ESBL-producing Enterobacterales from storks and beyond. J. Antimicrob. Chemother. 2025, 80, 68–78. [Google Scholar] [CrossRef]
- Gilbert, N.I.; Correia, R.A.; Silva, J.P.; Pacheco, C.; Catry, I.; Atkinson, P.W.; Gill, J.A.; Franco, A.M. Are white storks addicted to junk food? Impacts of landfill use on the movement and behaviour of resident white storks (Ciconia ciconia) from a partially migratory population. Mov. Ecol. 2016, 15, 4:7. [Google Scholar] [CrossRef]
- Clinical and Laboratory Standards Institute (CLSI). Performance Standards for Antimicrobial Susceptibility Testing. 32nd ed. CLSI Supplement M100-Ed32. National Committee for Clinical Laboratory Standards, USA, 2022.
- The European Committee on Antimicrobial Susceptibility Testing. 2022. Breakpoint tables for interpretation of MICs and zone diameters. Version 12.0, 2022. http://www.eucast.org.
- Batchelor, M.; Hopkins, K.; Threlfall, E.J.; Clifton-Hadley, F.A.; Stallwood, A.D.; Davies, R.H.; Liebana, E. blaCTX-M genes in clinical Salmonella isolates recovered from humans in England and Wales from 1992 to 2003. Antimicrob. Agents. Chemother. 2005, 49. [Google Scholar] [CrossRef]
- Martín-Vélez, V.; Montalvo, T.; Giralt, D.; Ramírez, F.; Giménez, J.; Morral-Puigmal, C.; Planell, R.; Sabate, S.; Bota, G.; Navarro, J. Evil and allies: opportunistic gulls as both spreaders and sentinels of antibiotic-resistant bacteria in human-transformed landscapes. J. App. Ecol. 2024, 61, 2809–2821. [Google Scholar] [CrossRef]
- Hernández, J.M.; Höfle, U. Use of South-Central Spanish landfill sites by central european White storks Ciconia ciconia based upon regular ring lectures: migration, wintering and juvenile dispersal. In: Proceedings 1st International White stork conference, Zielona Góra, Poland, p. 23 (4-6 September 2014).
- Sanz-Aguilar, A.; Jovani, R.; Melián, C.J.; Pradel, R.; Tella, J.L. Multi-event capture–recapture analysis reveals individual foraging specialization in a generalist species. Ecol. 2015, 96, 1650–1660. [Google Scholar] [CrossRef]
- Cheng, Y.; Fiedler, W.; Wikelski, M.; Flack, A. “Closer-to-home” strategy benefits juvenile survival in a long-distance migratory bird. Ecol. Evol. 2019, 9, 8945–52. [Google Scholar] [CrossRef] [PubMed]
- Sandegren, L.; Stedt, J.; Lustig, U.; Bonnedahl, J.; Andersson, D.I.; Järhult, J.D. 2018. Long-term carriage and rapid transmission of extended spectrum beta-lactamase-producing E. coli within a flock of Mallards in the absence of antibiotic selection. Environ Microbiol. Rep. 2018, 10, 576–582. [Google Scholar] [CrossRef] [PubMed]
- Franklin, A.B.; Ramey, A.M.; Bentler, K.T.; Barrett, N.L.; McCurdy, L.M.; Ahlstrom, C.A.; Bonnedahl, J.; Shriner, S.A.; Chandler, J.C. Gulls as sources of environmental contamination by colistin-resistant bacteria. Sci. Rep. 2020, 10, 4408. [Google Scholar] [CrossRef]
Figure 1.
Map showing the four sampling sites in Castilla-La Mancha (South central Spain).
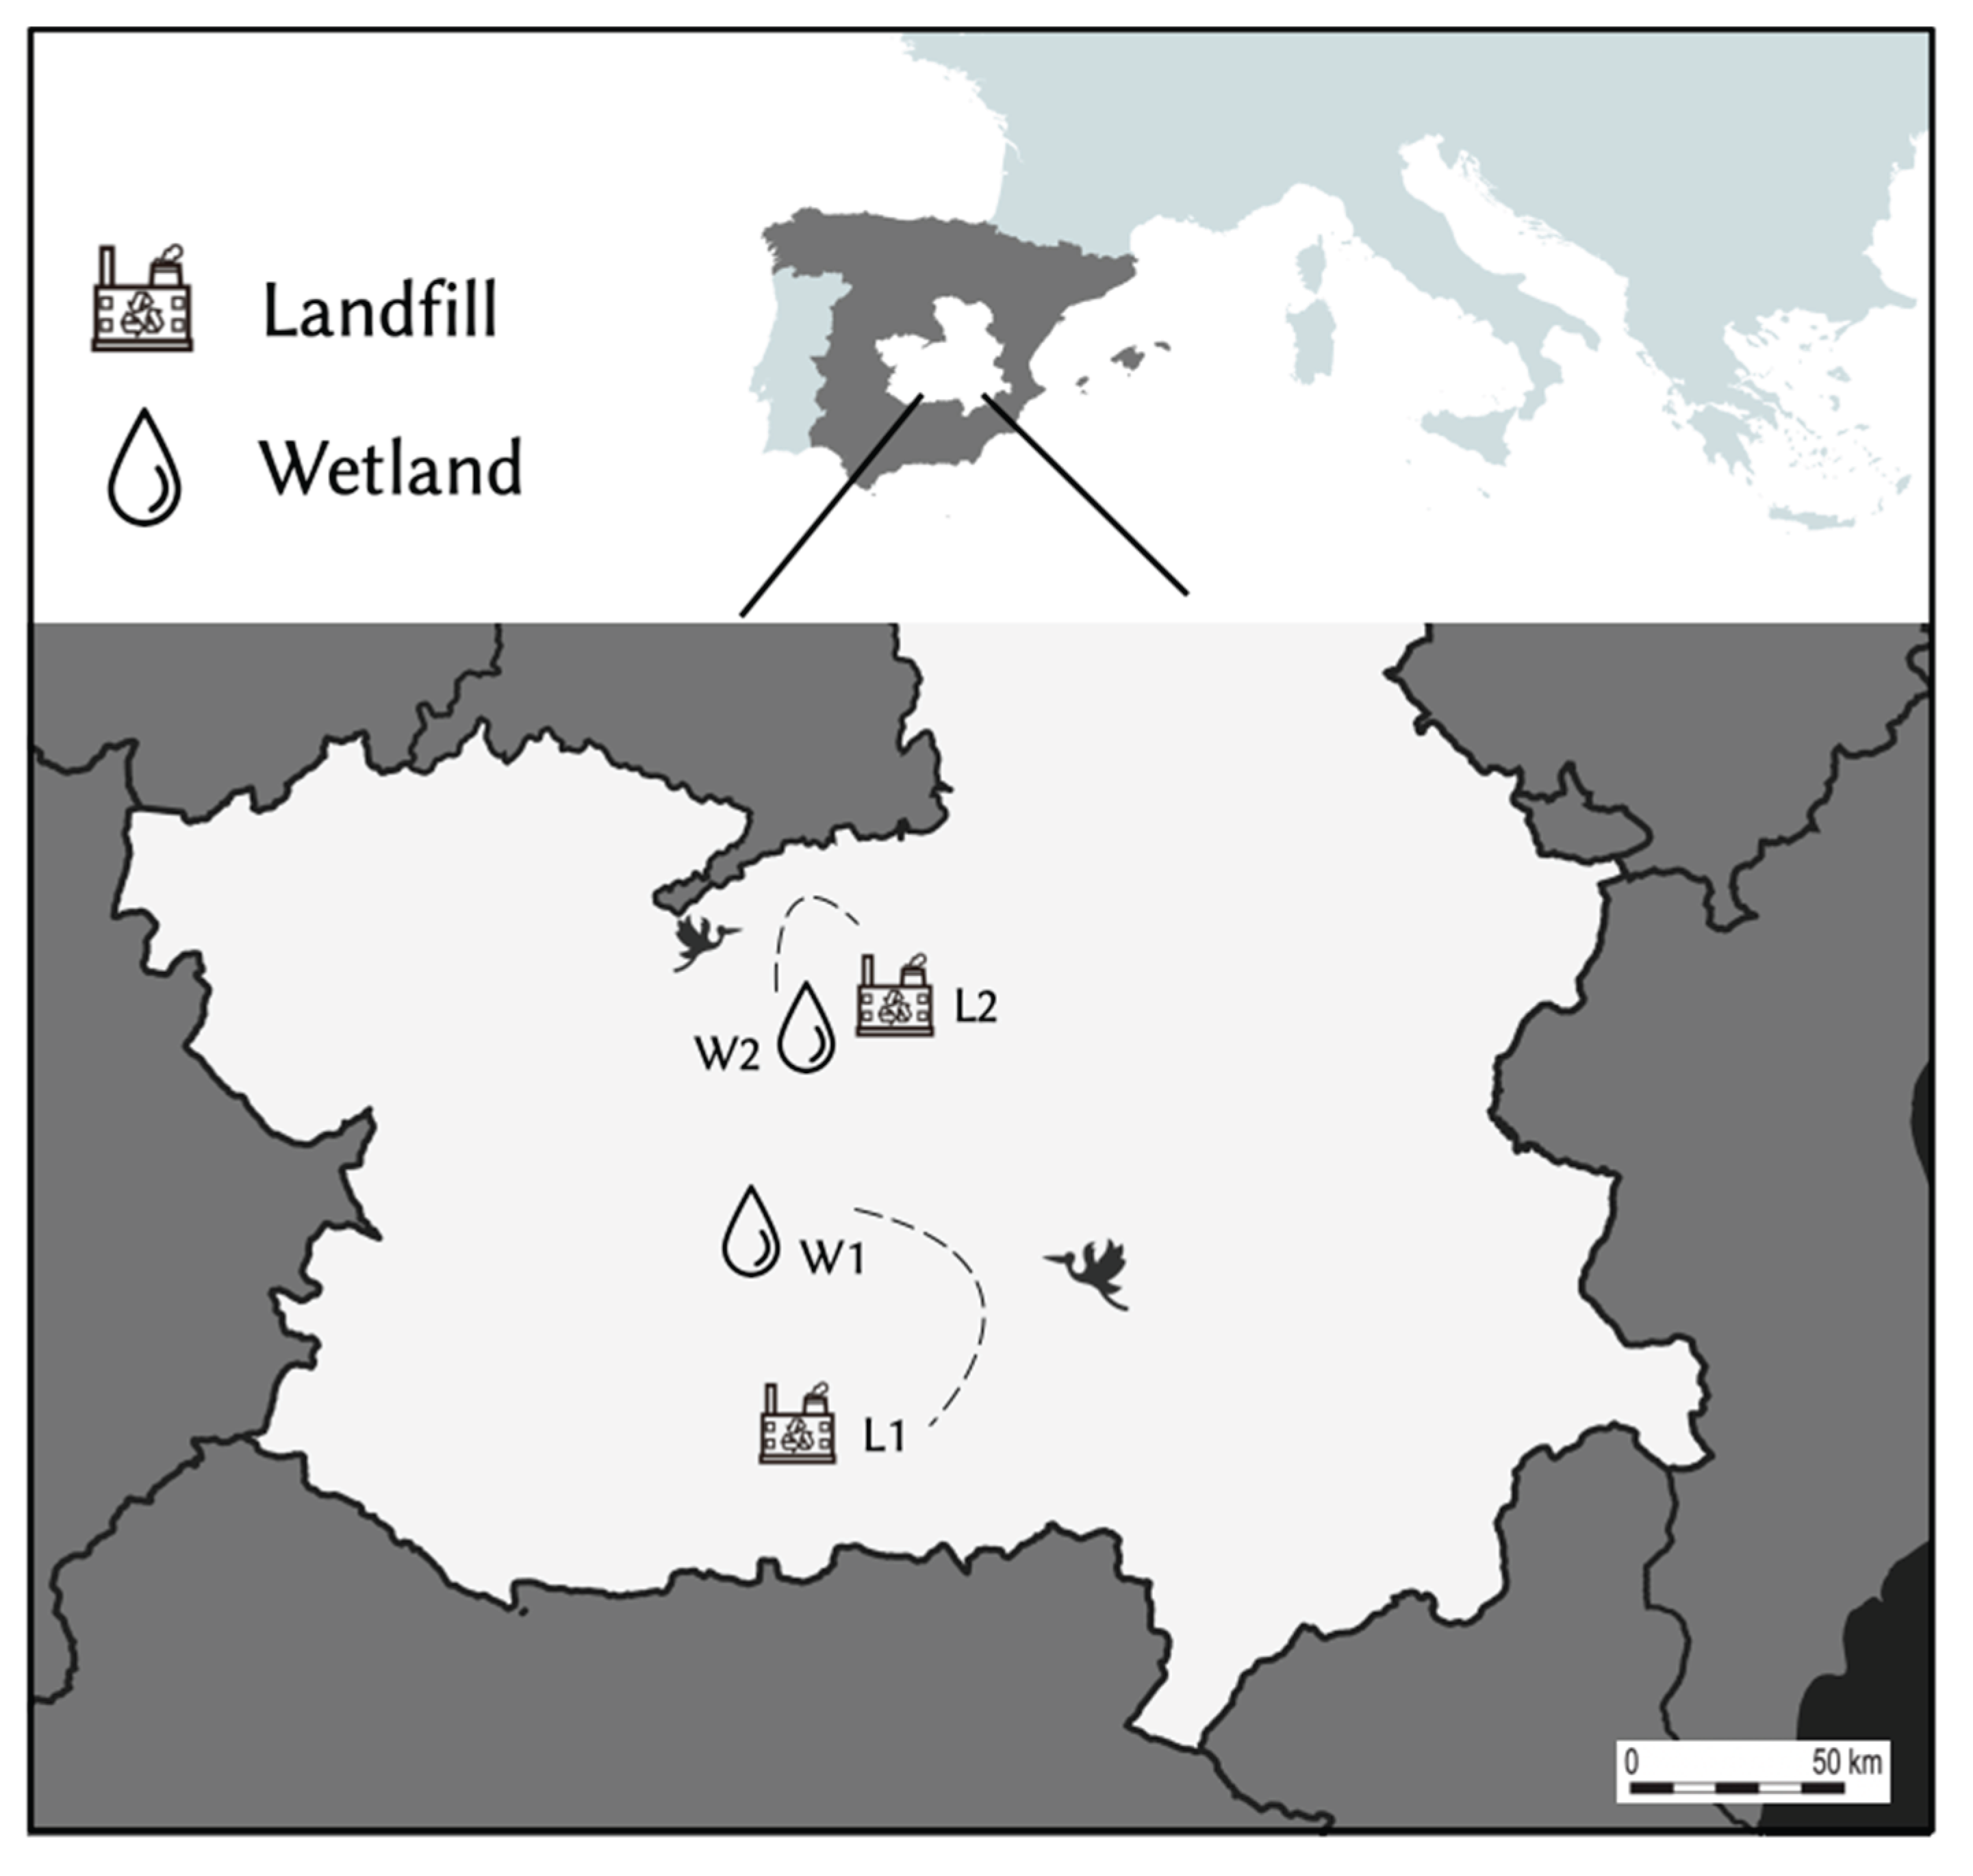
Figure 2.
Proportion (%) of samples with isolates showing resistance phenotypes in fecal and water samples from landfills and wetlands, separated by phenological periods. * indicates statistically significant differences between phenological periods from the same specific location. Resistance phenotypes analyzed: a) AMR; b) AMR Enterococcus; c) AMR Enterobacterales; d) MDR; e) MDR Enterococcus; f) MDR Enterobacterales; g) third-generation cephalosporin resistant Enterobacterales; h) fluoroquinolone resistant Enterobacterales and i) ESBL-producing Enterobacterales.
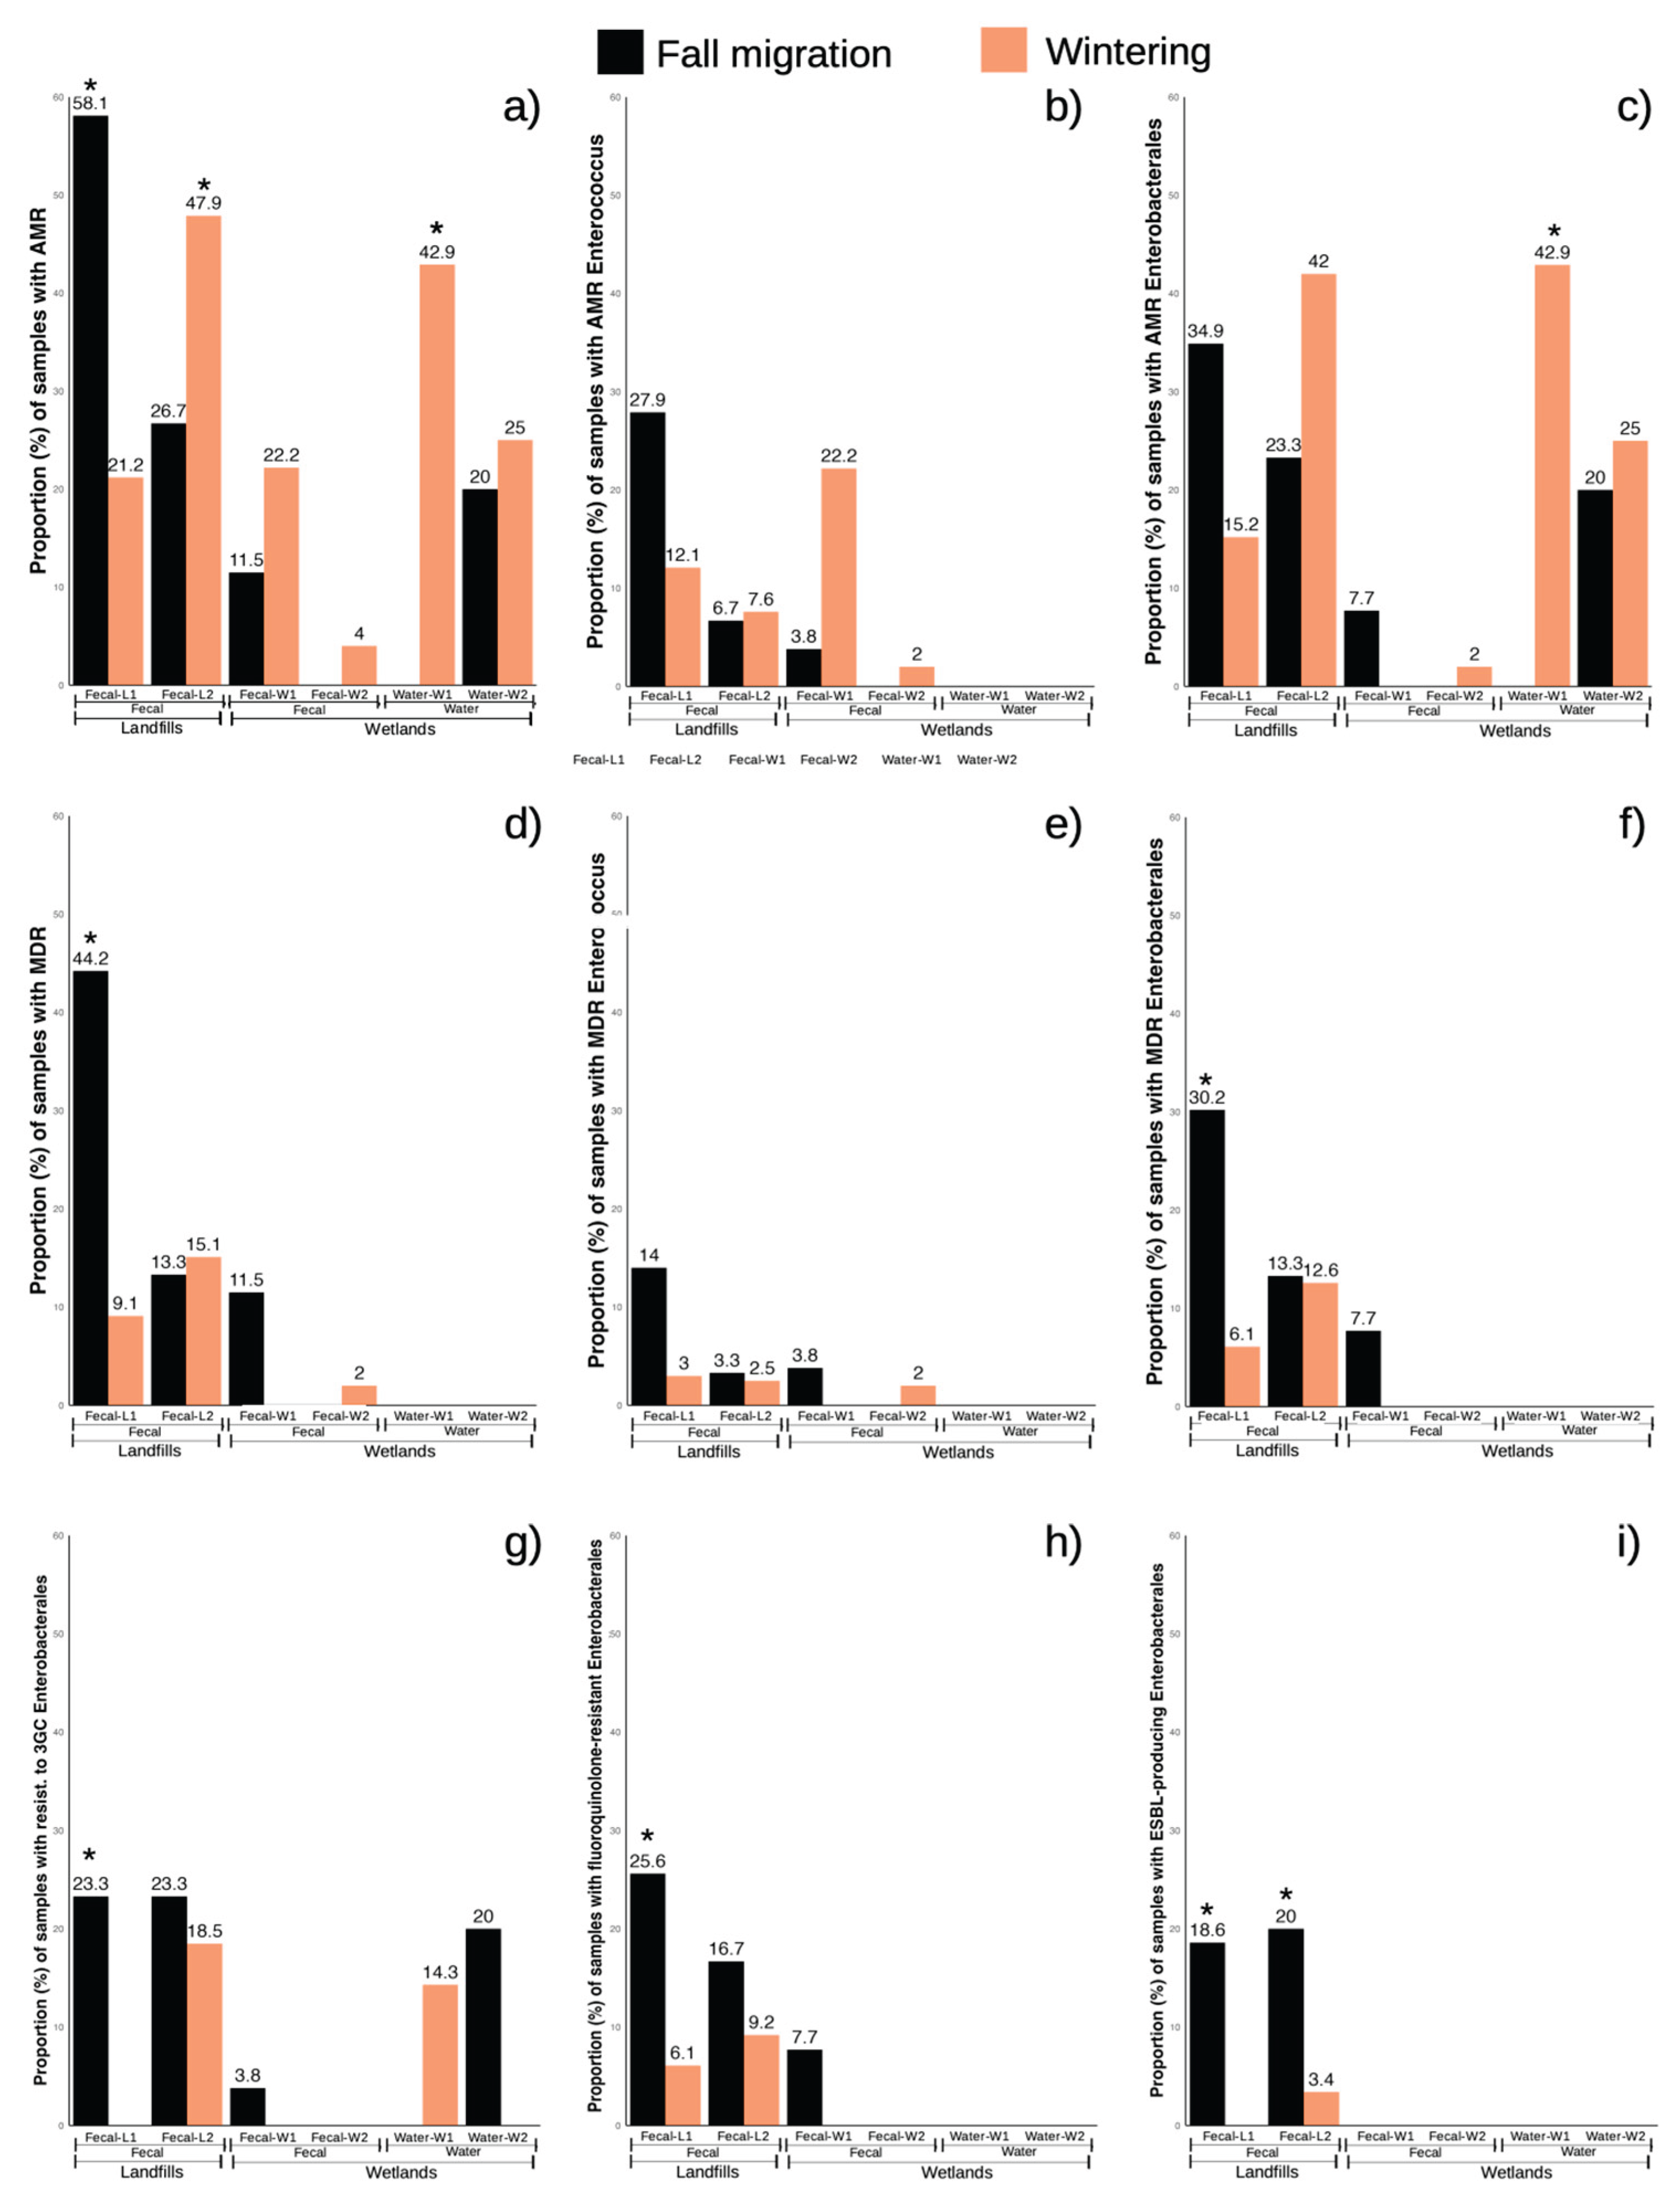
Figure 3.
Distribution of the number of resistances to different families of antibiotics per E. coli isolates recovered from stork feces and water samples, classified by location and phenological period.
Figure 3.
Distribution of the number of resistances to different families of antibiotics per E. coli isolates recovered from stork feces and water samples, classified by location and phenological period.
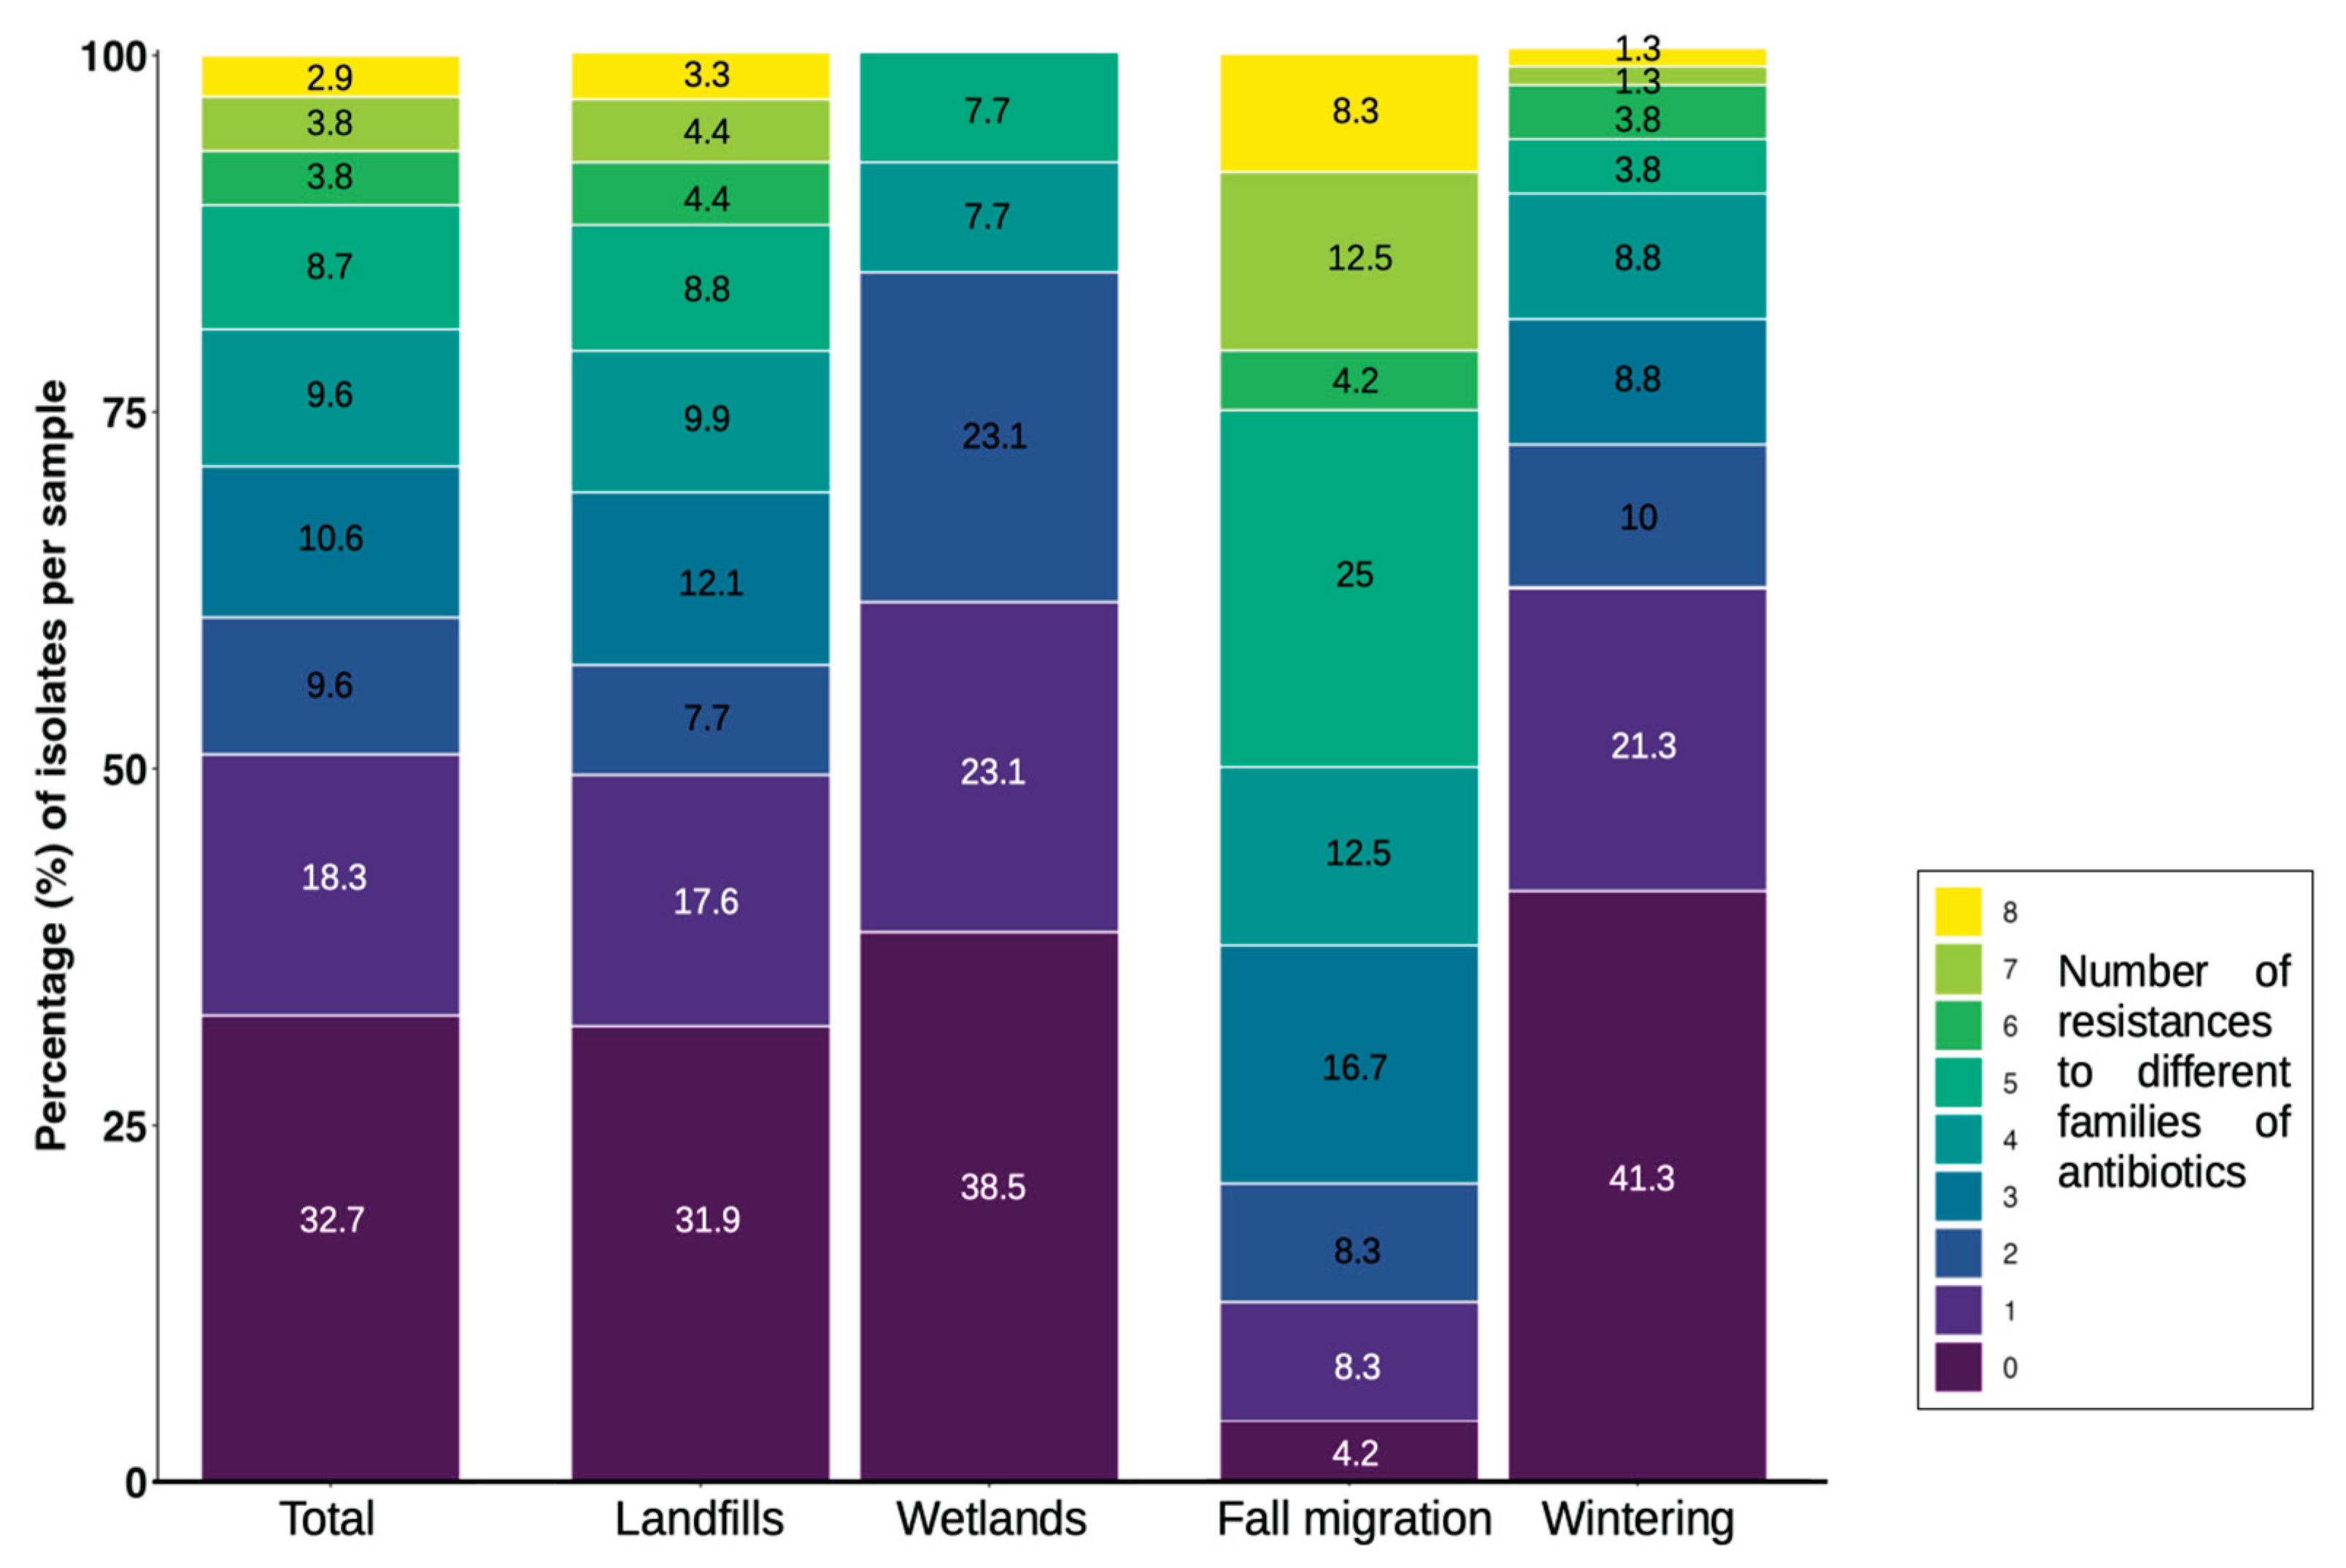
Figure 4.
Results of generalized linear model (GLM) for factors influencing AMR/MDR carriage in stork-feces and water samples collected in landfills and wetlands in Spain. Predicted probabilities are shown for AMR (a) and MDR (b).
Figure 4.
Results of generalized linear model (GLM) for factors influencing AMR/MDR carriage in stork-feces and water samples collected in landfills and wetlands in Spain. Predicted probabilities are shown for AMR (a) and MDR (b).
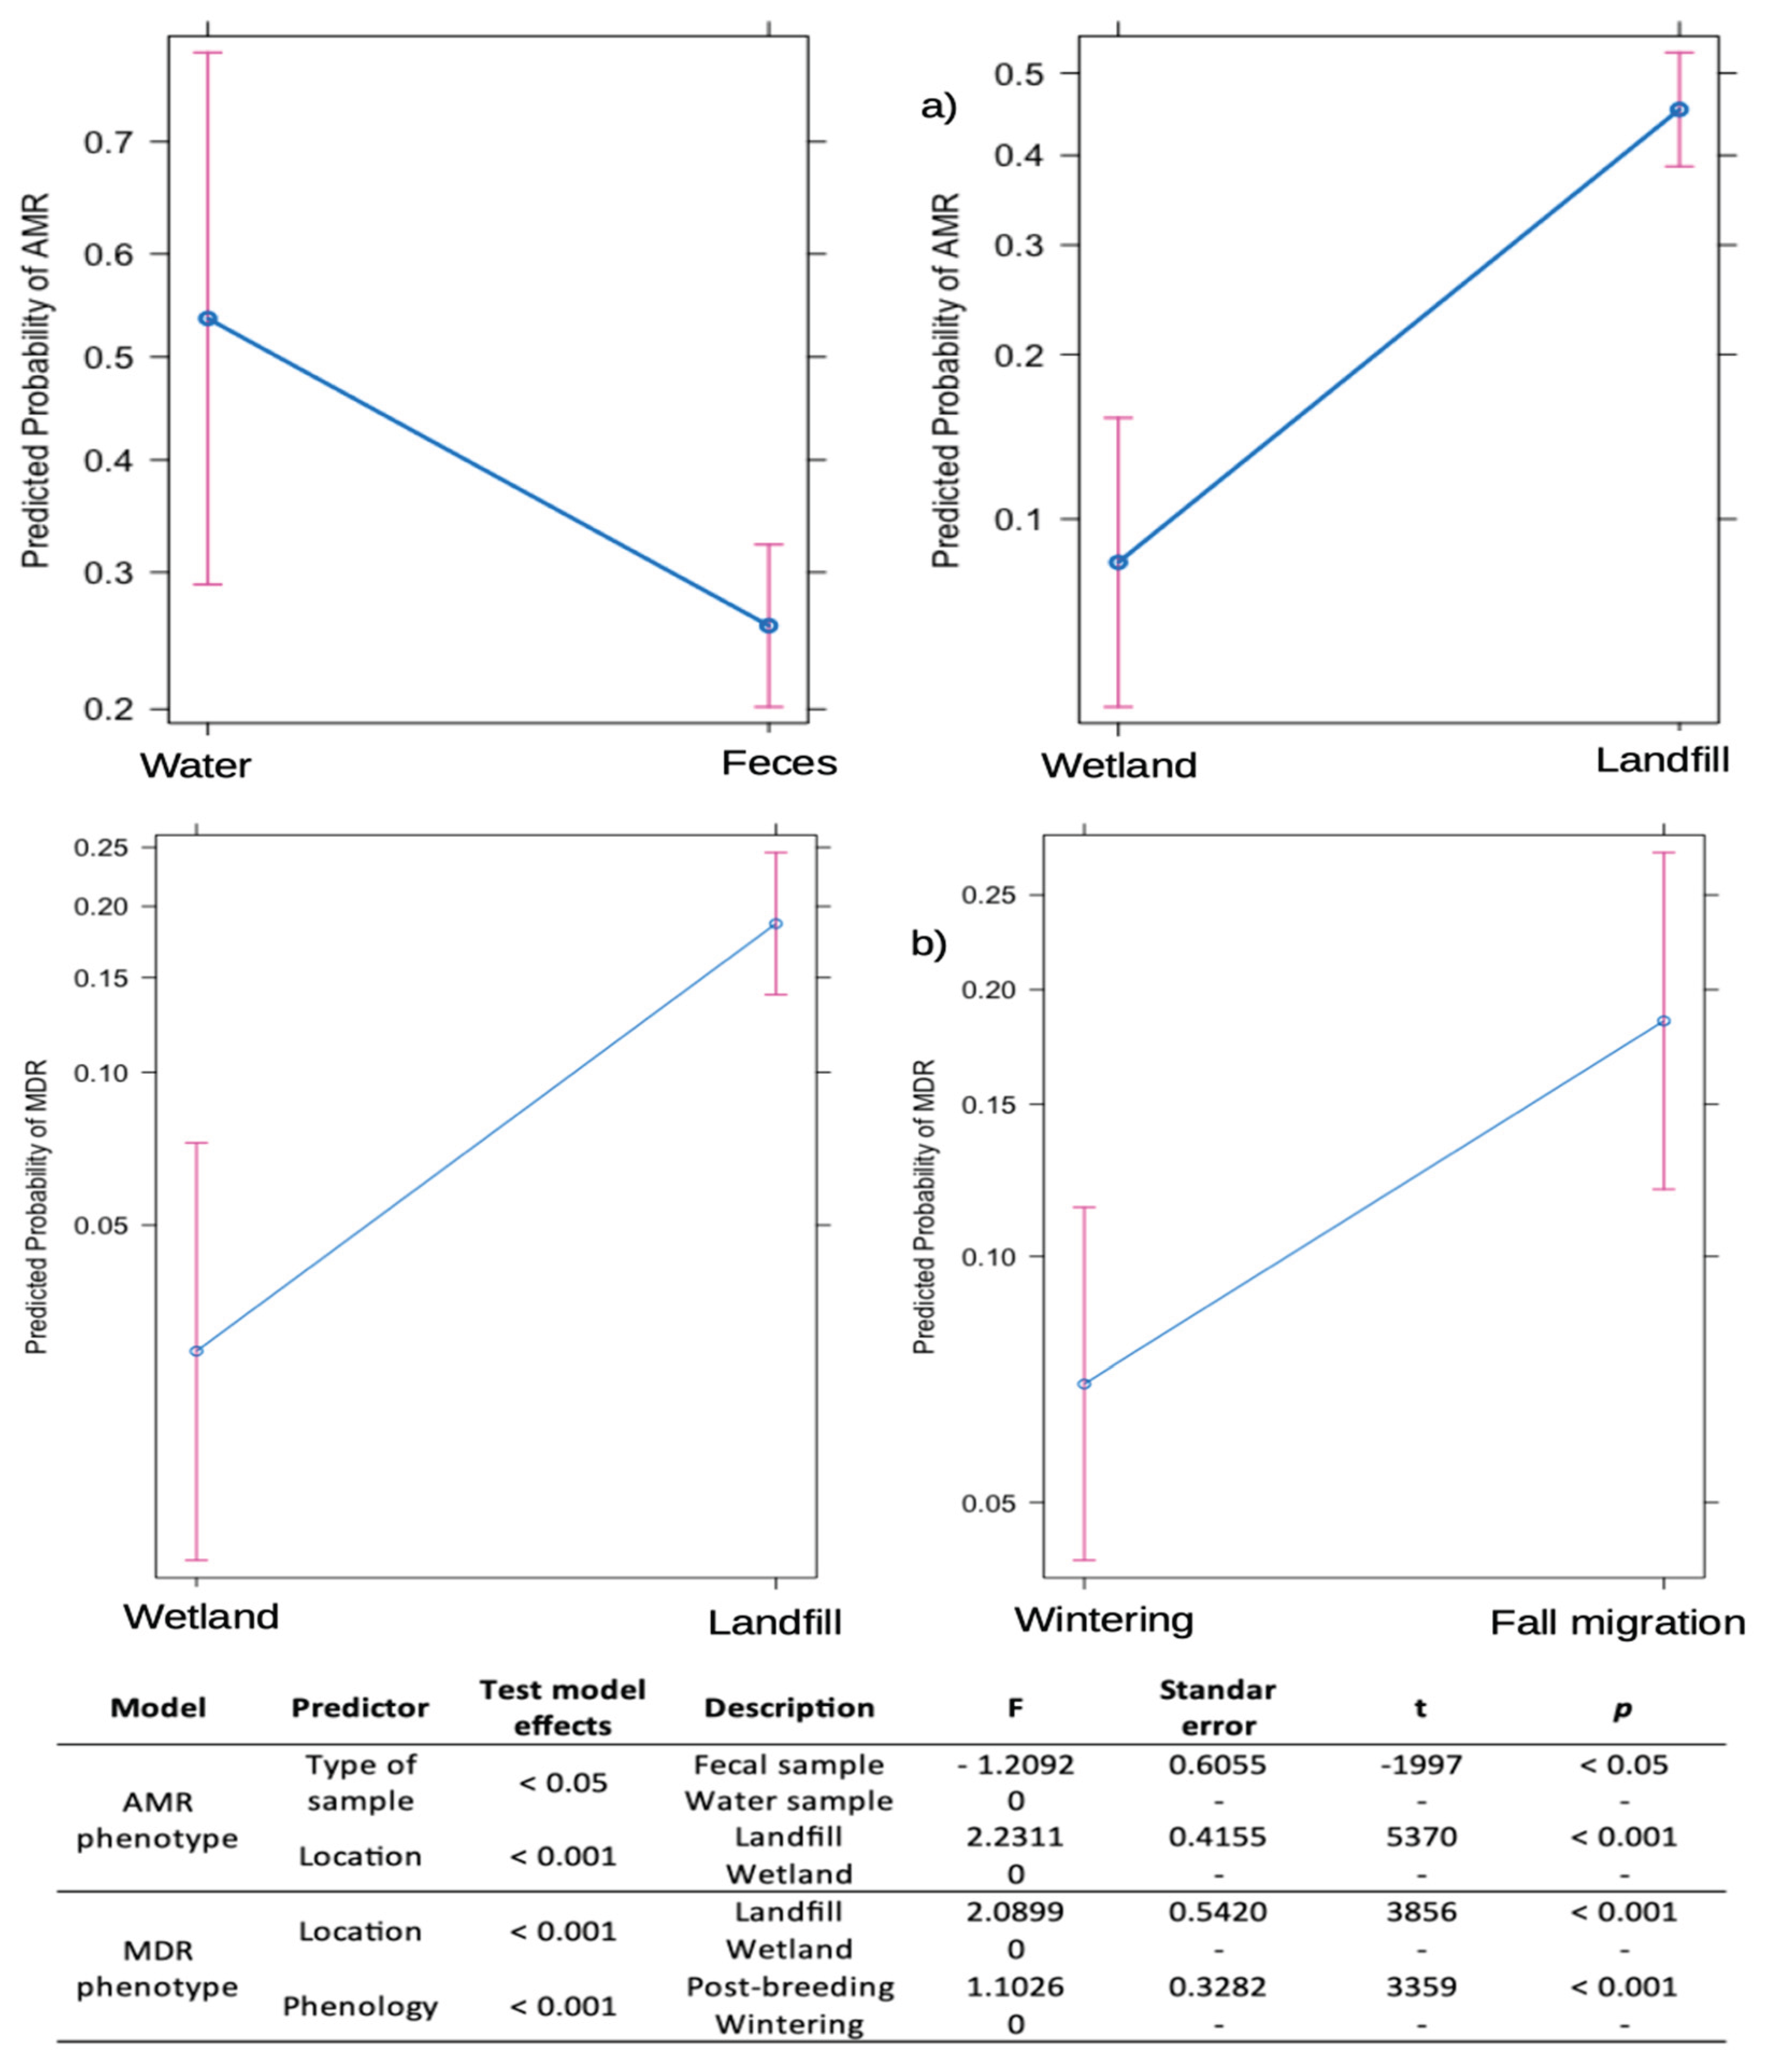
Figure 5.
Proportion (%) of samples with Enterobacterales showing resistance phenotypes in fecal and water samples from landfills and wetlands, separated by phenological periods. Analyzed antibiotic resistance phenotypes to: a) 3GC; b) fluoroquinolones; c) tetracyclines; d) phenicol; e) aminoglycosides; f) sulfonamides; g) penicillin and h) monobactam.
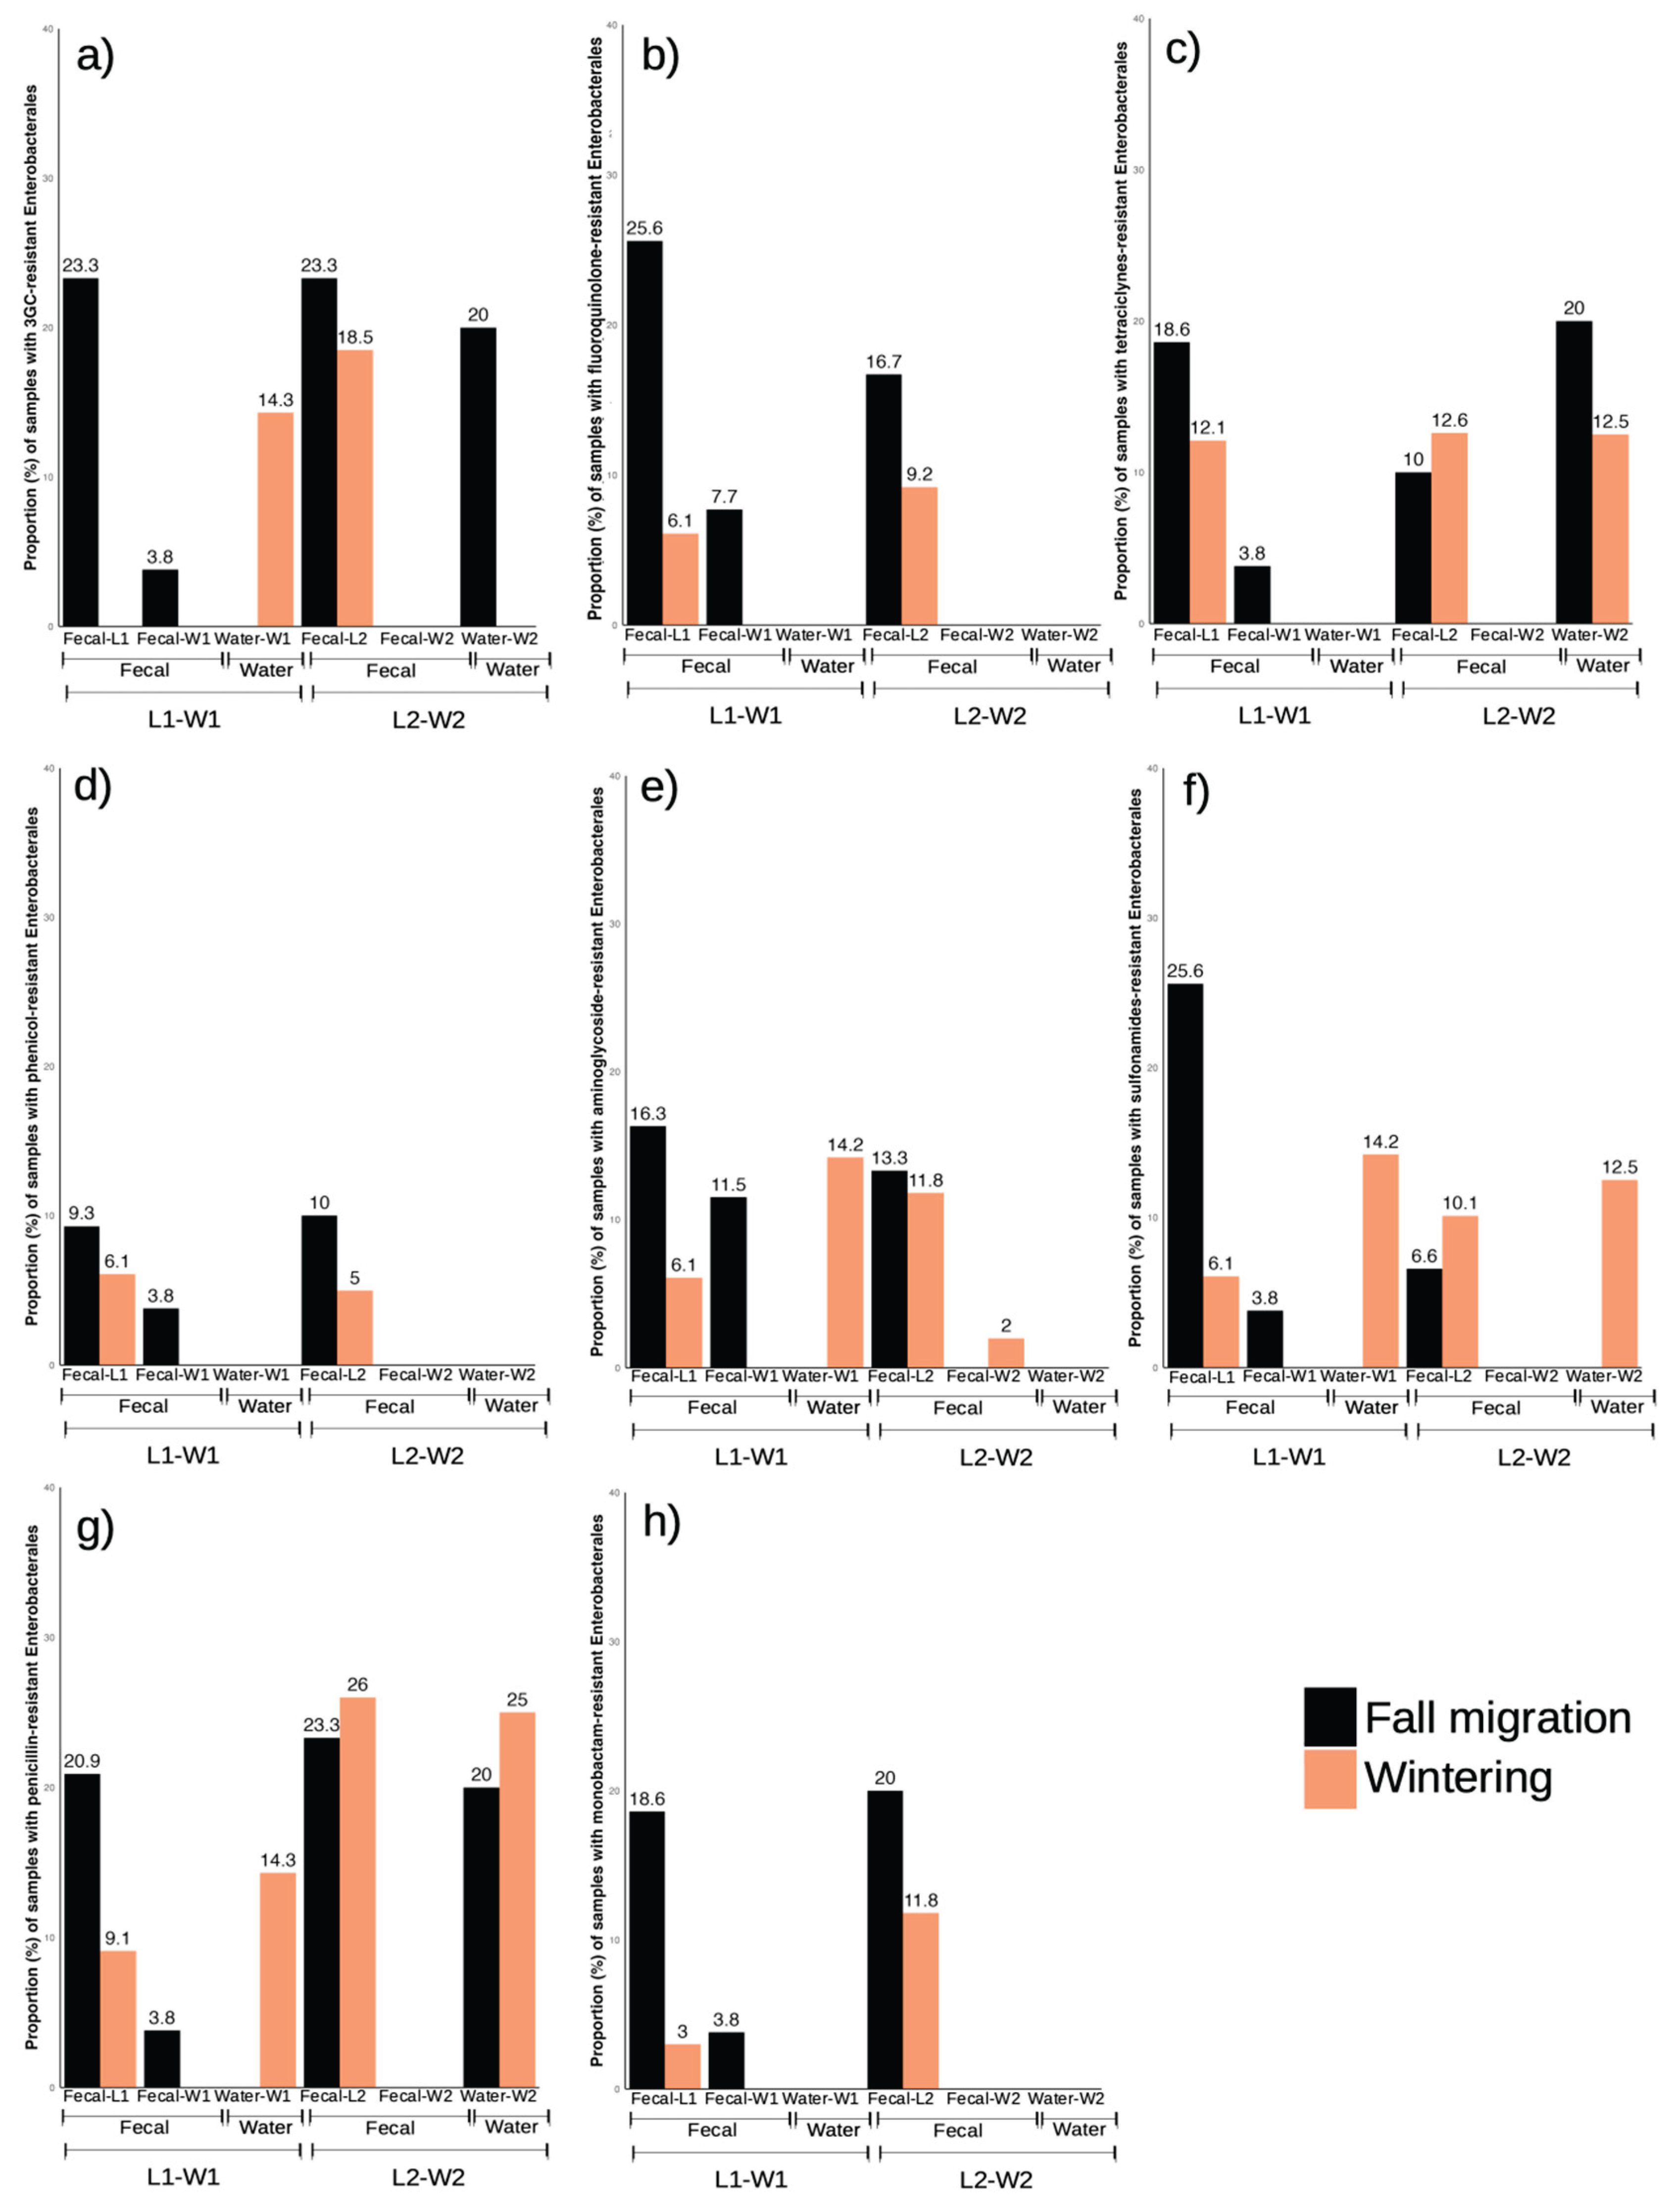
Figure 6.
Proportion (in %) of E. coli isolates per sample showing resistance to the antibiotics tested, divided by isolates obtained in L1-W1 (top), and in L2-W2 (bottom).
Figure 6.
Proportion (in %) of E. coli isolates per sample showing resistance to the antibiotics tested, divided by isolates obtained in L1-W1 (top), and in L2-W2 (bottom).
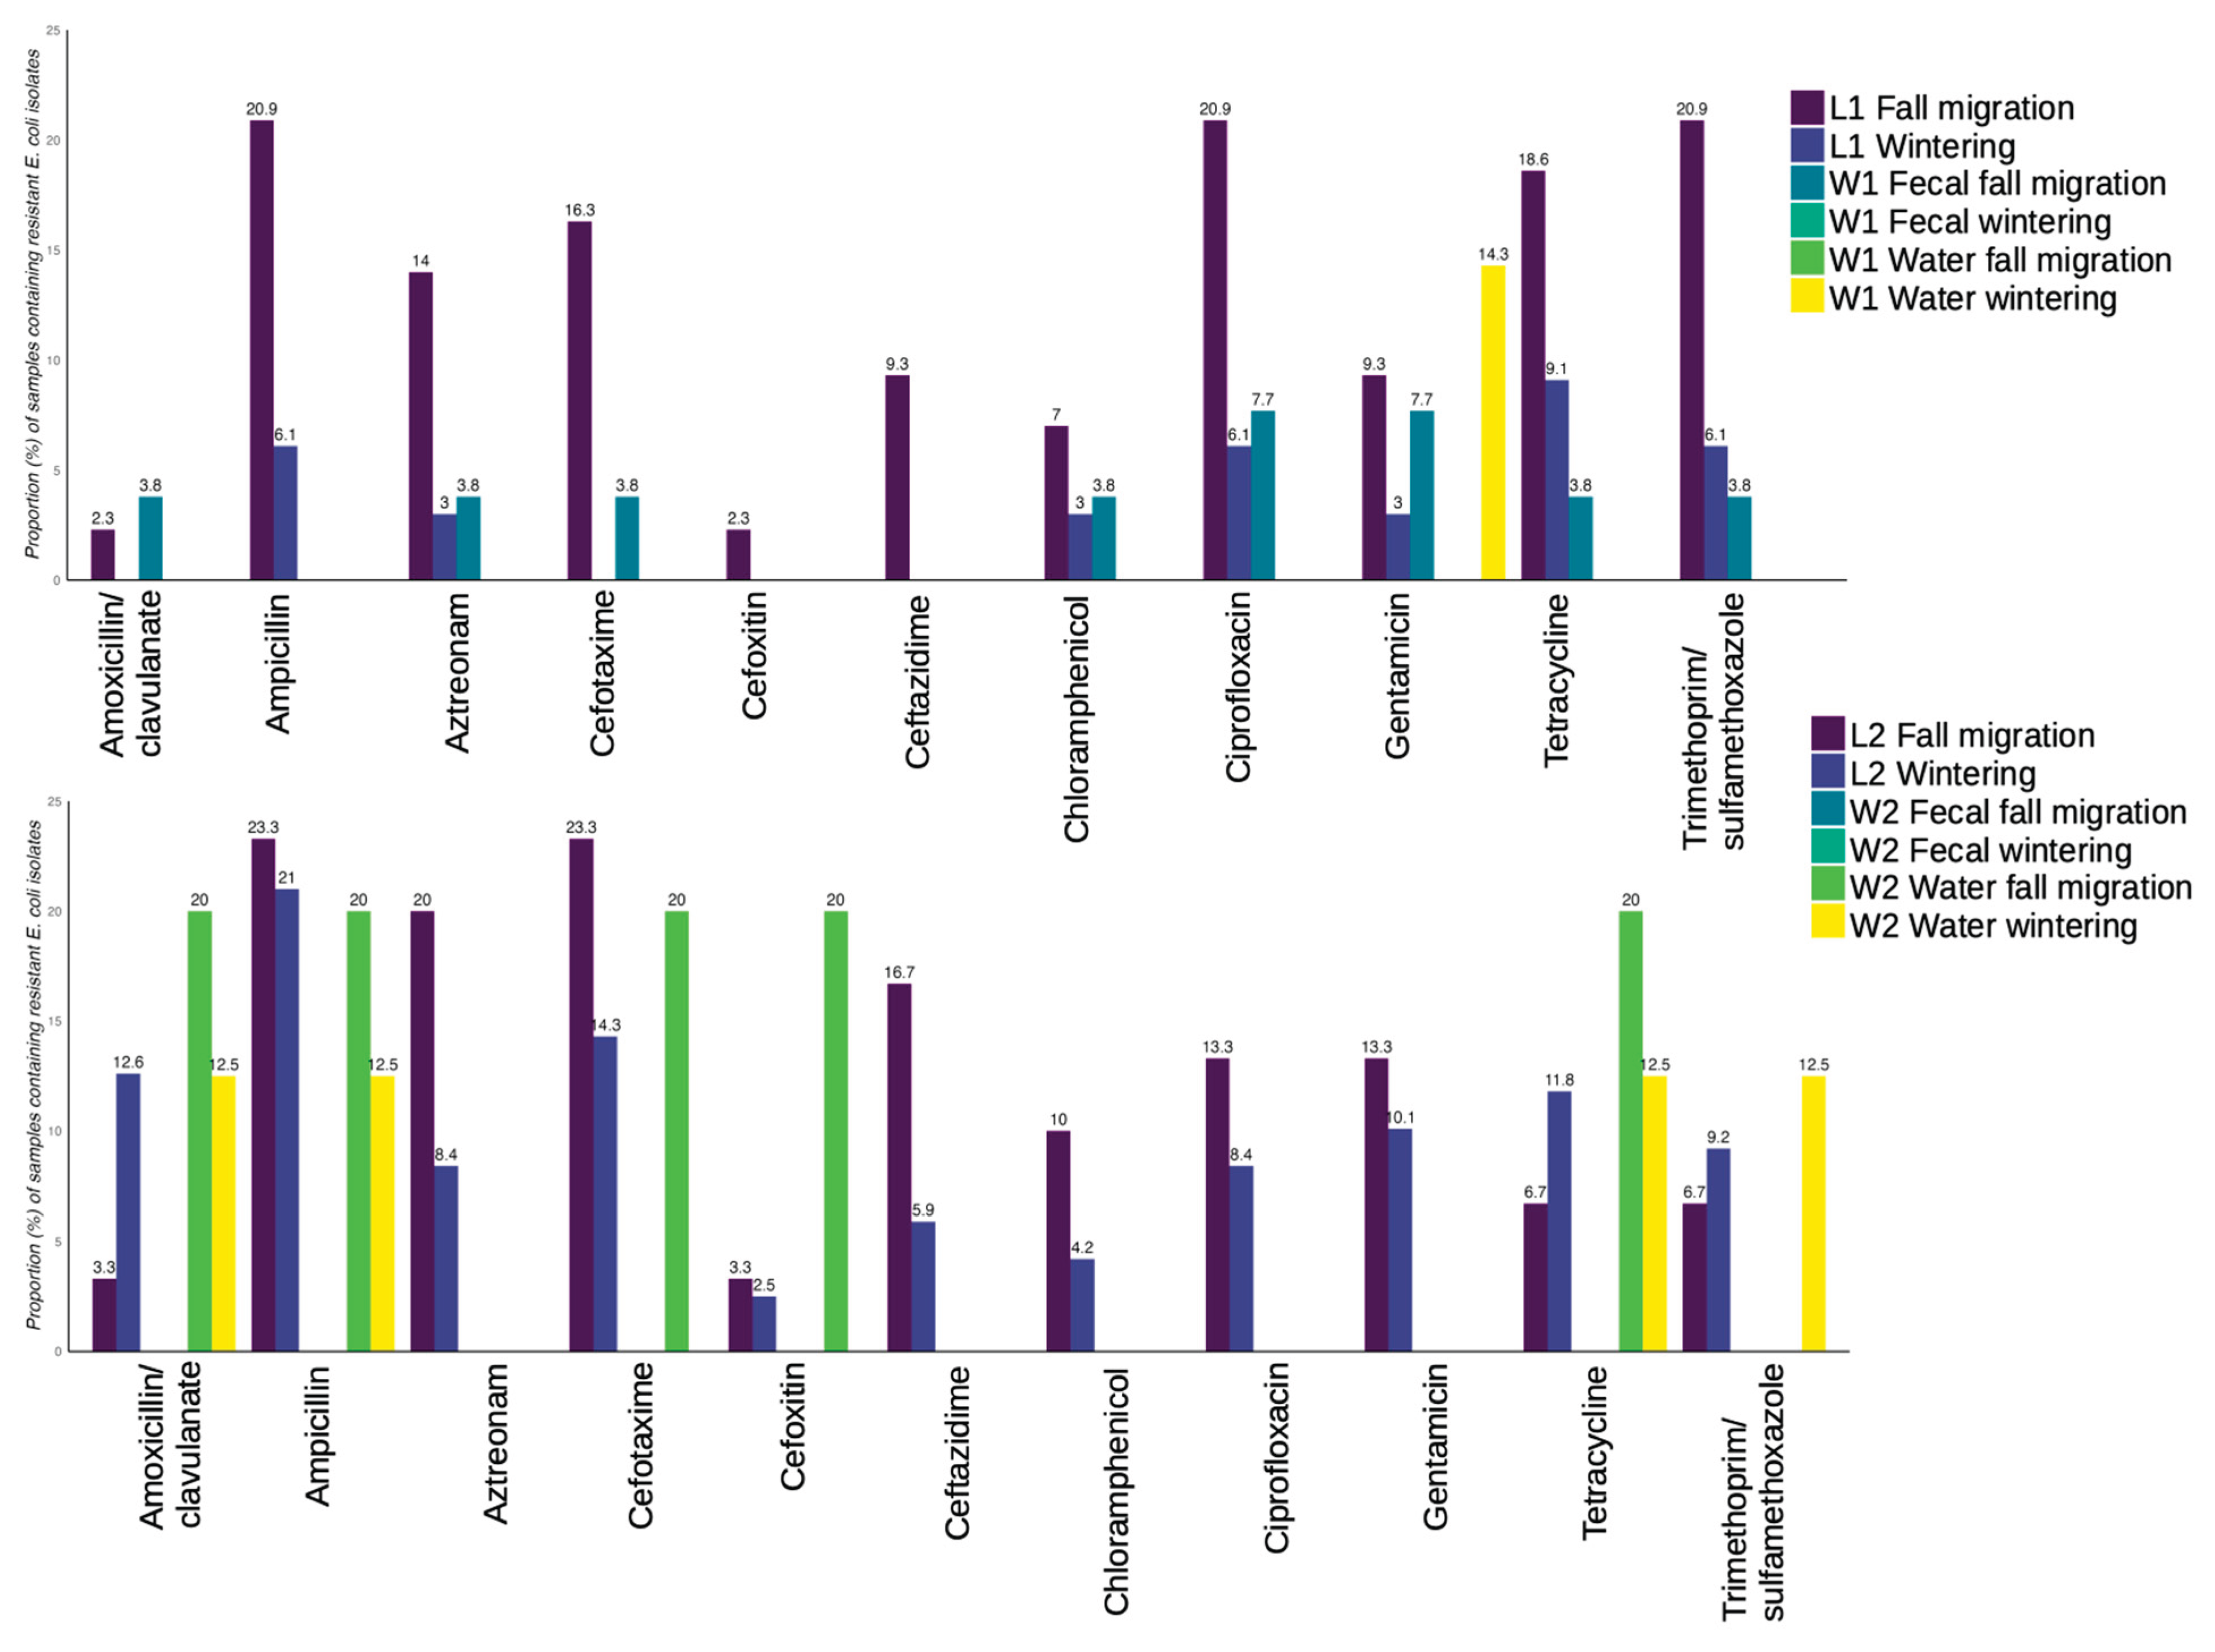

Table 1.
Antibiotics included for susceptibility testing by disc-diffusion method, antibiotic concentrations are expressed in µg/disk.
Table 1.
Antibiotics included for susceptibility testing by disc-diffusion method, antibiotic concentrations are expressed in µg/disk.
| Bacterial group | Antibiotics tested |
|---|---|
| Enterobacterales and Aeromonas |
Ampicillin (AMP 30), amoxicillin/clavulanate (AMC 30), ceftazidime (CAZ 30), cefotaxime (CTX 30), cefoxitin (FOX 30), aztreonam (ATM 30), ciprofloxacin (CIP 5), gentamicin (GEN 10), chloramphenicol (CHL 30), trimethoprim/sulfamethoxazole (SXT 25), and tetracycline (TET 30). |
| Enterococci | Vancomycin (VAN 30), ampicillin (AMP 10), erythromycin (ERY 15), tetracycline (TET 30), ciprofloxacin (CIP 5), gentamicin (GEN 120), streptomycin (STR 300), linezolid (LNZ 10) and chloramphenicol (CHL 30). |
| Pseudomonas | Ticarcillin (TIC 75)*, piperacillin (PRL 30)*, piperacillin-tazobactam (TZP 110, ceftazidime (CAZ 30), cefepime (FEP 30), aztreonam (ATM 30), gentamicin (GEN 30), tobramycin (TOB 10), amikacin (AMK 30), ciprofloxacin (CIP 5). |
* Zone diameter breakpoints were read following EUCAST standards.
Table 2.
Categorical variables analyzed by the chi-square test.
| AMR Enterococcus: enterococci with any resistant phenotype |
|---|
| MDR Enterococcus: enterococci resistant to 3 o more different families of antibiotics |
| AMR Enterobacterales: Enterobacterales and Aeromonas spp, with any resistant phenotype |
| MDR Enterobacterales: Enterobacterales and Aeromonas spp. resistant to 3 or more different families of antibiotics |
| Resistance to 3rd generation cephalosporins (3GC) Enterobacterales |
| Resistance to fluoroquinolones Enterobacterales |
| ESBL-producing Enterobacterales: E. coli and Klebsiella spp. with phenotypic ESBL |
Table 3.
Distribution of isolates recovered in stork-fecal and water samples with different characteristics of interest, classified by locations and phenological periods. Each datapoint specifies Nº of samples containing isolates with AMR/MDR characteristics/prevalence in % from total samples (non-repetitive isolates). n = samples collected for each datapoint.
| Wetland (n= 121) | Landfill (n=225) | |||||||||||
|---|---|---|---|---|---|---|---|---|---|---|---|---|
| W1 (n=50) | W2 (n=71) | L1 (n=76) | L2 (n=149) | |||||||||
| Water (n=15) | Feces (n=35) | Water (n=13) | Feces (n=58) | |||||||||
| Fall (n=8) | Wint. (n=7) | Fall (n=26) | Wint. (n=9) | Fall (n=5) | Wint. (n=8) | Fall (n=8) | Wint. (n=50) | Fall (n=43) | Wint. (n=33) | Fall (n=30) | Wint. (n=119) | |
| AMR | n.d. | 3/42.9 (4) | 3/11.5 (4) | 2/22.2 (2) | 1/20 (2) |
2/25 (2) | 0 | 2/4 (2) |
25/58.1 (31) | 7/21.2 (11) | 8/26.7 (10) | 57/47.9 (73) |
| 8/16 (10) | 5/7 (6) | 32/42.1 (42) | 65/43.6 (83) | |||||||||
| 14/11.6 (17) | 97/43.1 (125) | |||||||||||
| MDR | n.d | n.d | 3/11.5 (3) | n.d | n.d | n.d | n.d | 1/ 2 (1) |
19/44.2 (19) | 3/9.1 (4) | 4/13.3 (5) |
18/15.1 (19) |
| 3/6 (3) | 1/1.4 (1) | 22/28.9 (23) | 22/14.8 (24) | |||||||||
| 4/3.3 (4) | 44/19.6 (47) | |||||||||||
| AMR Enterococcus | n.d | n.d | 1/ 3.8 (1) | 2/22.2 (2) | n.d | n.d | n.d | 1/ 2 (1) |
12/27.9 (12) | 4/12.1 (4) | 2/6.7 (2) |
9/7.6 (9) |
| 3/6 (3) | 1/1.4 (1) | 16/21.1 (16) | 11/7.4 (11) | |||||||||
| 4/3.3 (4) | 27/12 (27) | |||||||||||
| MDR Enterococcus | n.d | n.d | 1/ 3.8 (1) | n.d | n.d | n.d | n.d | 1/ 2 (1) |
6/14 (6) | 1/ 3 (1) |
1/ 3.3 (1) |
3 /2.5 (3) |
| 1/ 2 (1) | 1/1.4 (1) | 7/9.2 (7) | 4/2.7 (4) | |||||||||
| 2/1.7 (2) | 11/4.9 (11) | |||||||||||
| AMR Enterobact. | n.d. | 3/42.9 (4) | 2/7.7 (3) | n.d | 1/20 (2) | 2/25 (2) | n.d | 1/ 2 (1) |
15/34.9 (18) | 5/15.2 (7) | 7/23.3 (8) | 50/42 (64) |
| 5/10 (7) | 4/5.6 (5) | 20/26.3 (25) | 57/38.3 (72) | |||||||||
| 10/8.3 (13) | 77/34.2 (97) | |||||||||||
| MDR Enterobact. | n.d | n.d | 2/7.7 (2) | n.d | n.d | n.d | n.d | n.d | 13/30.2 (13) | 2/ 6.1 (3) | 4/13.3 (4) | 15/12.6 (16) |
| 2/4 (2) | 0 | 15/19.7 (16) | 19/12.8 (20) | |||||||||
| 2/1.7 (2) | 34/15.1 (36) | |||||||||||
| Resit. 3GC Enterobact | n.d | 1/14.3 (1) | 1/ 3.8 (1) | n.d | 1/20 (1) | n.d | n.d | n.d | 10/23.3 (10) | 0 | 7/23.3 (8) |
22/18.5 (25) |
| 2/4 (2) | 1/1.4 (1) | 10/13.2 (10) | 29/19.5 (33) | |||||||||
| 3/2.5 (3) | 39/17.3 (43) | |||||||||||
| Resist. fluoroquinolon Enterobact. | n.d | n.d | 2/7.7 (2) | n.d | n.d | n.d | n.d | n.d | 11/25.6 (11) | 2/ 6.1 (3) | 5/16.7 (5) |
11/9.2 (11) |
| 2/4 (2) | 0 | 13/17.1 (14) | 16/10.7 (16) | |||||||||
| 2/1.7 (2) | 29/12.9 (30) | |||||||||||
| ESBL Enterobact. | n.d | n.d | n.d | n.d | n.d | n.d | n.d | n.d | 8/18.6 (8) | n.d | 6/20 (6) |
4/3.4 (4) |
| 0 | 0 | 8/10.5 (8) | 10/6.7 (10) | |||||||||
| 0 | 18/8 (18) | |||||||||||
n.d.: not detected.
Table 4.
Resistance rates to all antibiotics tested in E. coli isolated from stork-fecal and water samples.
Table 4.
Resistance rates to all antibiotics tested in E. coli isolated from stork-fecal and water samples.
| Resistance to | Total E. coli (n= 70) | ESBL-E. coli (n=15)/ non ESBL-E. coli (n=55) | ||
|---|---|---|---|---|
| n | % | n | % | |
| Ampicillin | 46 | 65.7 | 15/31 | 100/56.4 |
| Amoxicillin-clavulanate | 20 | 28.6 | 2/18 | 13.3/32.7 |
| Ceftazidime | 16 | 22.9 | 9/7 | 60/12.7 |
| Cefotaxime | 33 | 47.1 | 14/19 | 93.3/34.5 |
| Cefoxitin | 6 | 8.6 | 1/5 | 6.7/9.1 |
| Imipenem | 0 | 0 | 0/0 | 0.0/0.0 |
| Aztreonam | 24 | 34.3 | 11/13 | 73.3/23.6 |
| Ciprofloxacin | 28 | 40 | 11/17 | 73.3/30.9 |
| Trimethoprim/sulfamethoxazole | 26 | 37.1 | 7/19 | 46.7/34.5 |
| Gentamicin | 27 | 38.6 | 8/19 | 53.3/34.5 |
| Chloramphenicol | 14 | 20 | 5/9 | 33.3/16.4 |
| Tetracycline | 31 | 44.3 | 7/24 | 46.7/43.6 |
Disclaimer/Publisher’s Note: The statements, opinions and data contained in all publications are solely those of the individual author(s) and contributor(s) and not of MDPI and/or the editor(s). MDPI and/or the editor(s) disclaim responsibility for any injury to people or property resulting from any ideas, methods, instructions or products referred to in the content. |
© 2025 by the authors. Licensee MDPI, Basel, Switzerland. This article is an open access article distributed under the terms and conditions of the Creative Commons Attribution (CC BY) license (http://creativecommons.org/licenses/by/4.0/).
Copyright: This open access article is published under a Creative Commons CC BY 4.0 license, which permit the free download, distribution, and reuse, provided that the author and preprint are cited in any reuse.


