1. Introduction
Experiments involving aerosols, whether conducted in controlled chambers or in field studies, require the integration of various real-time measurement methods to characterize aerosol properties. Among the key parameters commonly measured is the aerosol mass concentration.
A wide range of instruments for aerosol concentration measurements is commercially available and employs diverse technologies. However, scientific-grade equipment is often prohibitively expensive, limiting the feasibility of widespread environmental monitoring and creating a gap in the availability of affordable, simple, and accurate real-time measurement tools for various types of aerosols.
In recent years, there has been a significant rise in the use of low-cost particulate matter sensors (LCPMS) for monitoring airborne particulate matter (PM) concentrations. Their operation is based on measuring the intensity of scattered light as particles pass through a sensing volume. An airstream carries aerosol particles into a light beam, where the particles scatter the incident radiation. A portion of the scattered light is detected by a photodiode placed at a fixed angle, typically 90° or 120°, relative to the beam axis. It is generally assumed that only a single particle is detected at a time, which sets an upper limit on the measurable particle concentration.
Since the signal generated is proportional to the detected light intensity, and thus to the particle size, analyzing the number and amplitude of detection events allows estimation of particle number and particle mass concentrations. These analog signals are then amplified, digitized, and converted into size or mass bins through a pre-calibrated response curve [
1].
Low-cost sensors enable real-time measurement of particulate matter concentrations at low cost and with high spatial coverage [
2]. However, their accuracy is strongly influenced by several factors: particle characteristics (size, chemical composition, density, and refractive index), as well as environmental conditions (temperature, humidity, etc.) [
3]. As a result, reliable operation of these sensors requires calibration procedures tailored to the specific experimental or environmental context.
Various studies have investigated methods for calibrating LCPMS. A commonly used approach involves collocating the sensor with a professional-grade reference monitor for a defined period and comparing outputs [
4]. Light-scattering instruments such as nephelometers have also been explored for this purpose [
5]. These instruments offer high precision and have a well-defined theoretical basis for converting scattered light into mass concentration.
However, nephelometers are expensive, delicate, and generally restricted to laboratory or regulatory use. They typically operate at a fixed or limited set of scattering angles and are sensitive to humidity, making them less suitable for low-cost, low-maintenance field deployments.
Other calibration strategies rely on controlled laboratory environments [
6] or statistical, physical, or meteorological models. However, these approaches often involve assumptions about the measurement medium and may be prone to systematic errors.
Thus, the challenge of calibrating low-cost sensors calls for a method that is efficient, independent, cost-effective, and does not require access to professional reference stations or high-end instruments.
In this study, we propose an alternative optical calibration method using a visibility sensor. A visibility sensor measures forward-scattered light at a defined angular range and operates at a fixed wavelength. The method proposed here is based on calibrating the visibility sensor against aerosol mass concentration, and subsequently using it to calibrate LCPMS.
Using a visibility sensor for calibrating LCPMS enables a practical and scalable field calibration approach. These sensors are relatively low-cost and widely deployed in the transportation and aviation sectors. They operate continuously and offer robust performance. Therefore, this approach provides an accessible path for calibrating sensor networks in community monitoring projects or in remote areas lacking access to professional reference infrastructure. It contributes to the broader transition from theoretical research to scalable, sensor-based air quality monitoring.
2. Materials and Methods
2.1. Theoretical Background: Optical Monitoring of Aerosol Concentration
The physical basis for optical aerosol sensing relies on the attenuation of electromagnetic radiation as it propagates through a medium containing suspended particles. This attenuation, described by the mass extinction coefficient (MEC), αₑₓₜ, depends on the particle size distribution, the complex refractive index, and the wavelength of the probing light.
The Beer-Lambert Law [
7] describes the exponential decay in light intensity as a function of path length through the medium. It relates the incident light intensity (
I₀) to the transmitted intensity (
I) after passing through a path of length
L, containing a particle concentration
c, as follows:
. (1)
When the particle radius
r is on the same order of magnitude as the incident-light wavelength
λ, both scattering and absorption contribute significantly to the overall extinction. This regime is accurately described by Mie theory [
8], which provides analytical solutions for the scattering of electromagnetic waves by spherical particles.
Mie theory defines two components of the scattered electric field amplitude: parallel polarization (S1(θ)) and perpendicular polarization (S2(θ)), relative to the plane of polarization of the incident wave. These amplitudes are given by:
(2)
where an and bn are the Mie scattering coefficients, which depend on the size parameter and the complex refractive index m of the aerosol material. πn and τn are angle-dependent functions derived from associated Legendre polynomials and describe the angular scattering pattern. The angular distribution of scattered intensity is described by the scattering phase function, which captures how scattering strength varies with scattering angle. The total scattered intensity, considering both polarizations, is given by:
. (3)
MEC represents the aerosol attenuation per unit mass and is calculated using [
9]:
, (4)
where
is the extinction efficiency factor, here computed based on [
10],
n(r) is the particle size distribution function, and
is the particle density.
MEC is a key parameter that characterizes the optical attenuation properties of an aerosol-laden medium.
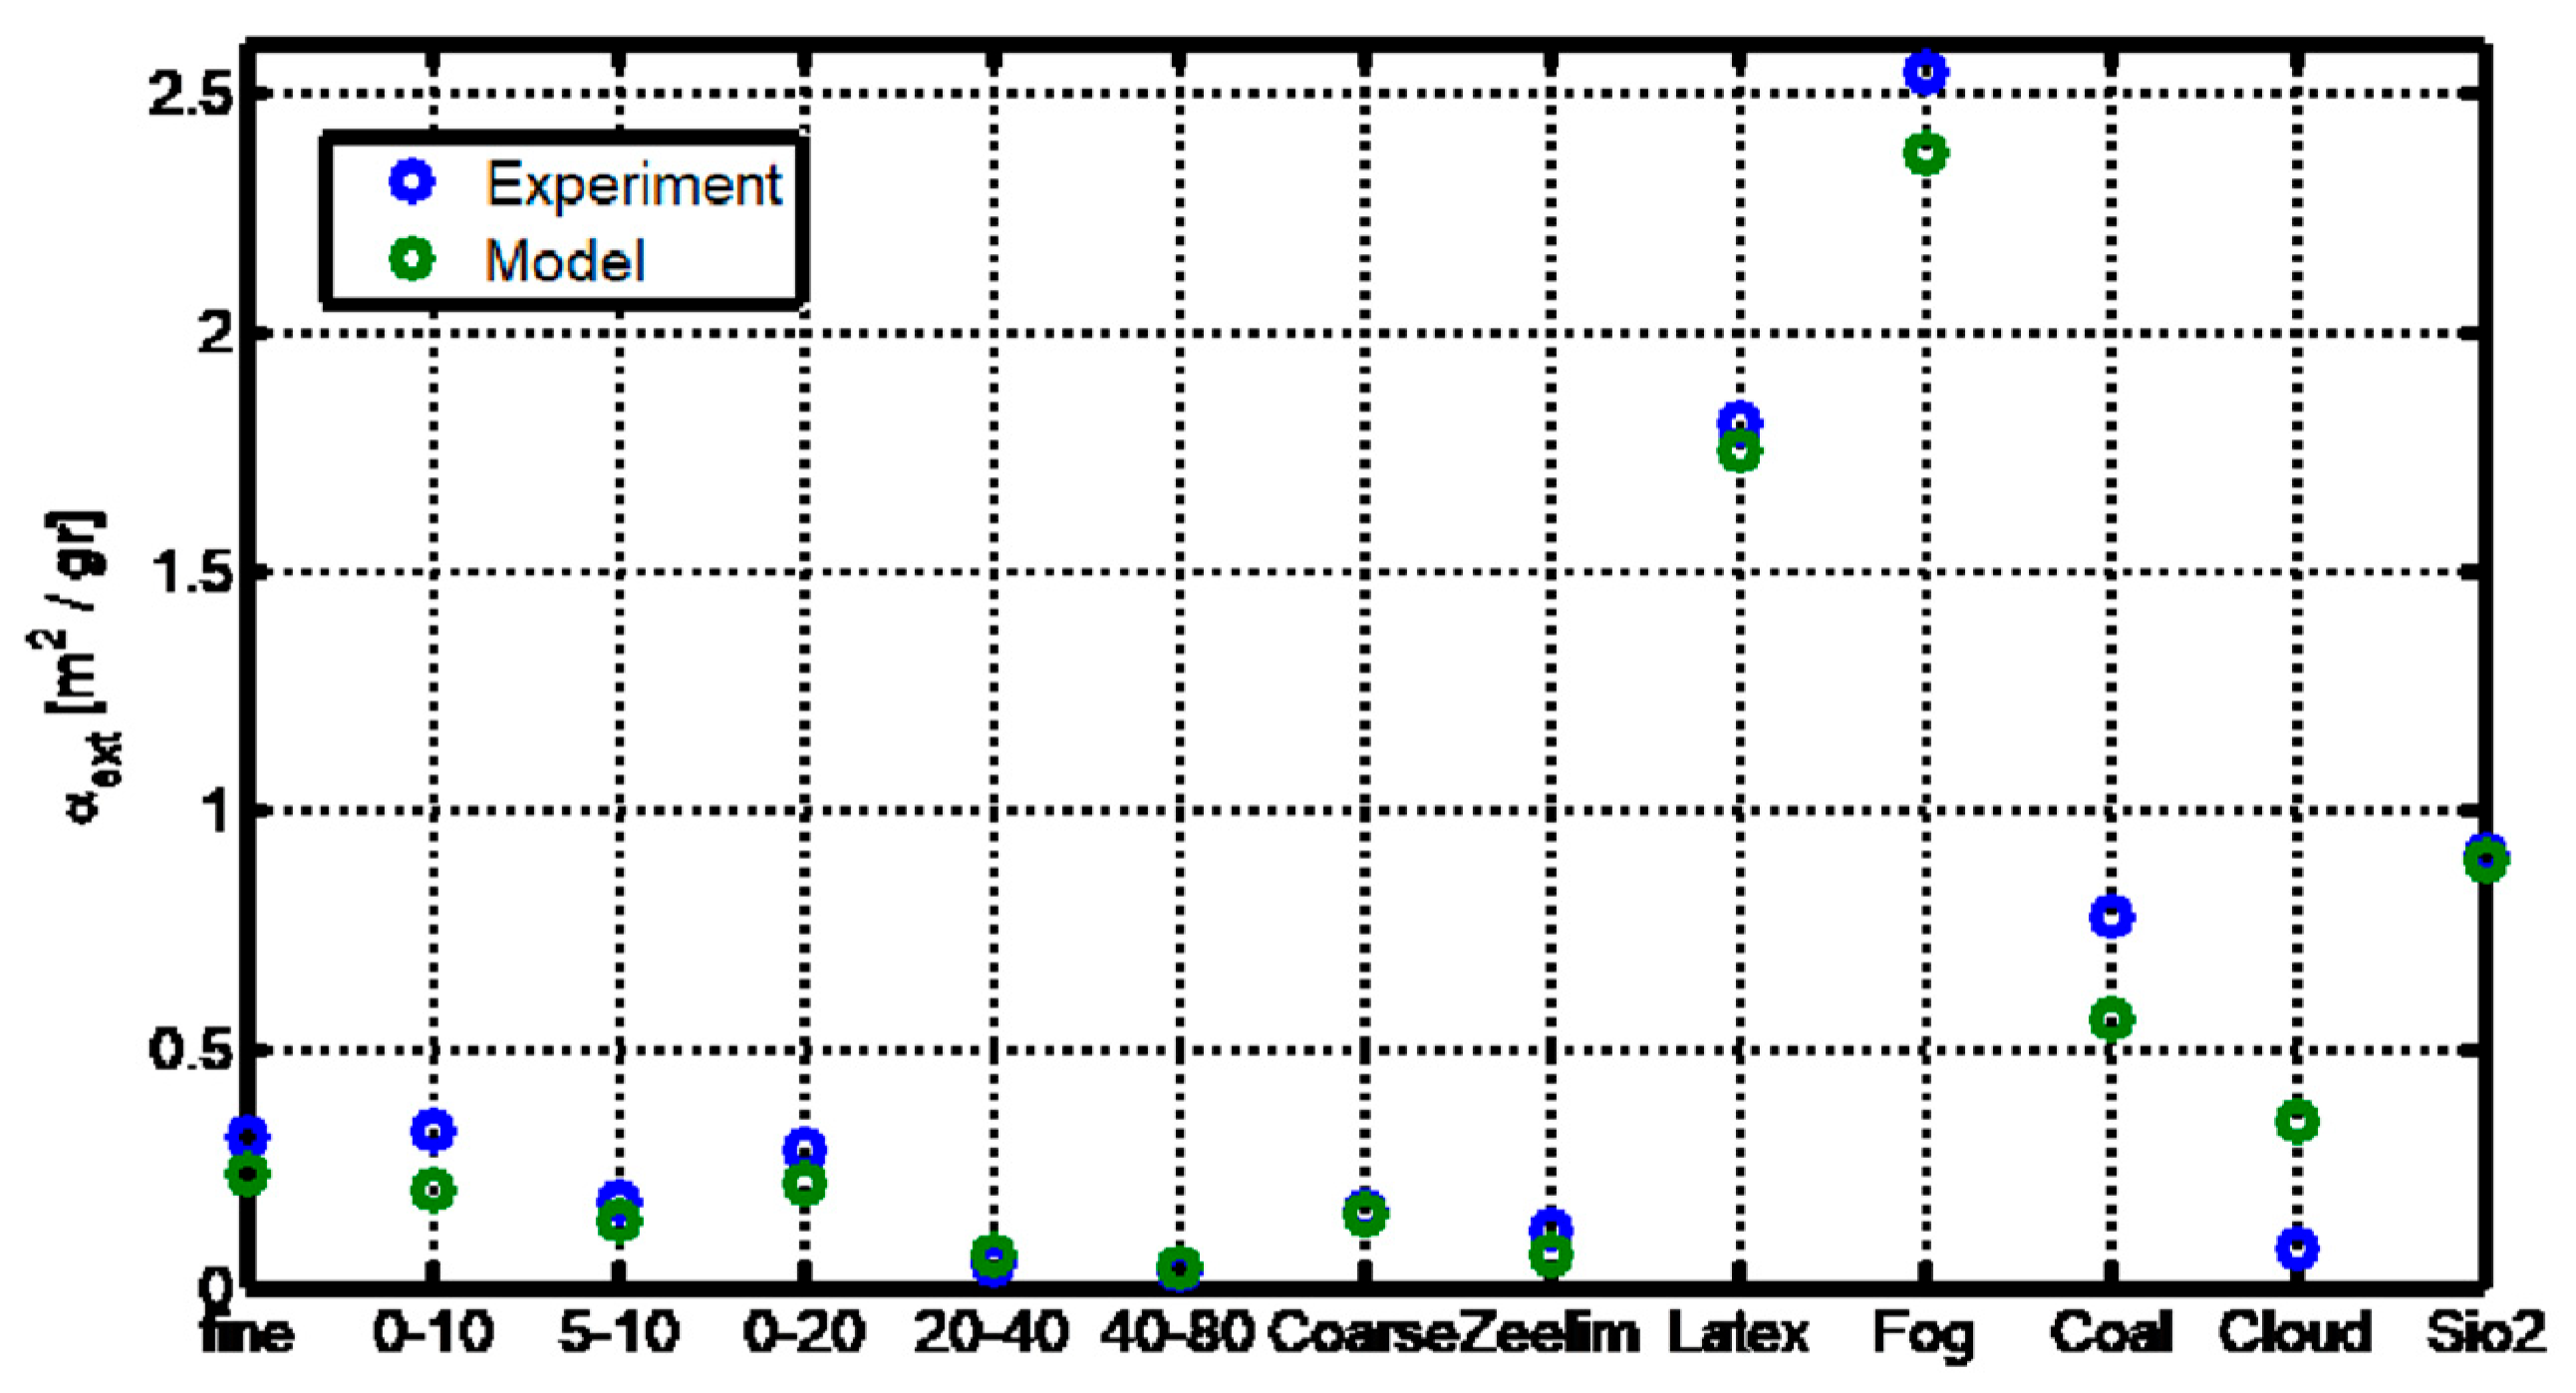
Figure 1 presents the calculated values of MEC for various aerosol types, including Arizona Road Dust (with different manufacturer-provided size distributions), Natural desert dust (collected in Zeelim, Israel), Fog machine aerosol, Water cloud droplets, Carbon particles, Latex microspheres, and Silica powder particles. MECs are shown as a comparison between two calculation methods:
Direct computation from the measured particle size distributions using Equation (4). For each aerosol type, MEC was calculated by applying the appropriate density and the complex refractive index in the visible spectrum, as reported in the literature.
Estimation based on visibility range measurements, as detailed later in the Methods section.
The results presented in
Figure 1 demonstrate good agreement between both approaches, supporting the validity of using visibility-derived extinction measurements for calibration purposes. Moreover, the data highlight that different aerosol types are characterized by distinctly different values of MEC, reflecting variations in particle properties such as size distribution and chemical composition.
The Meteorological Optical Range (MOR) provides an estimate of the density of an atmospheric medium using the Koschmieder equation [
11]:
. (5)
This equation establishes a direct relationship between the medium’s concentration and the visibility range, mediated by MEC, and are both wavelength-dependent. Consequently, by measuring MEC using a visibility sensor and weighing the total aerosol mass, it is possible to calibrate an optical sensor to accurately determine the desired aerosol concentration.
In order to assess the applicability of optical sampling for characterizing various aerosol materials, the scattering intensity was calculated for each of the substances listed in
Table 1, based on Equation (3). This analysis aims to evaluate the sensitivity of LCPMS or a visibility sensor to different aerosol types.
Figure 2 presents the calculated scattering intensity as a function of particle size, based on Equation (3), for two wavelengths representative of low-cost particulate matter sensors and visibility sensors.
As illustrated in
Figure 2, the scattered intensity exhibits a systematic dependence on particle size, indicating that LCPMS, which detect individual scattering events, can infer both particle size (via signal amplitude) and number concentration over a broad range of materials. Notably, the similarity between the results for the two wavelengths suggests that comparable sensing performance can be achieved using either radiation source.
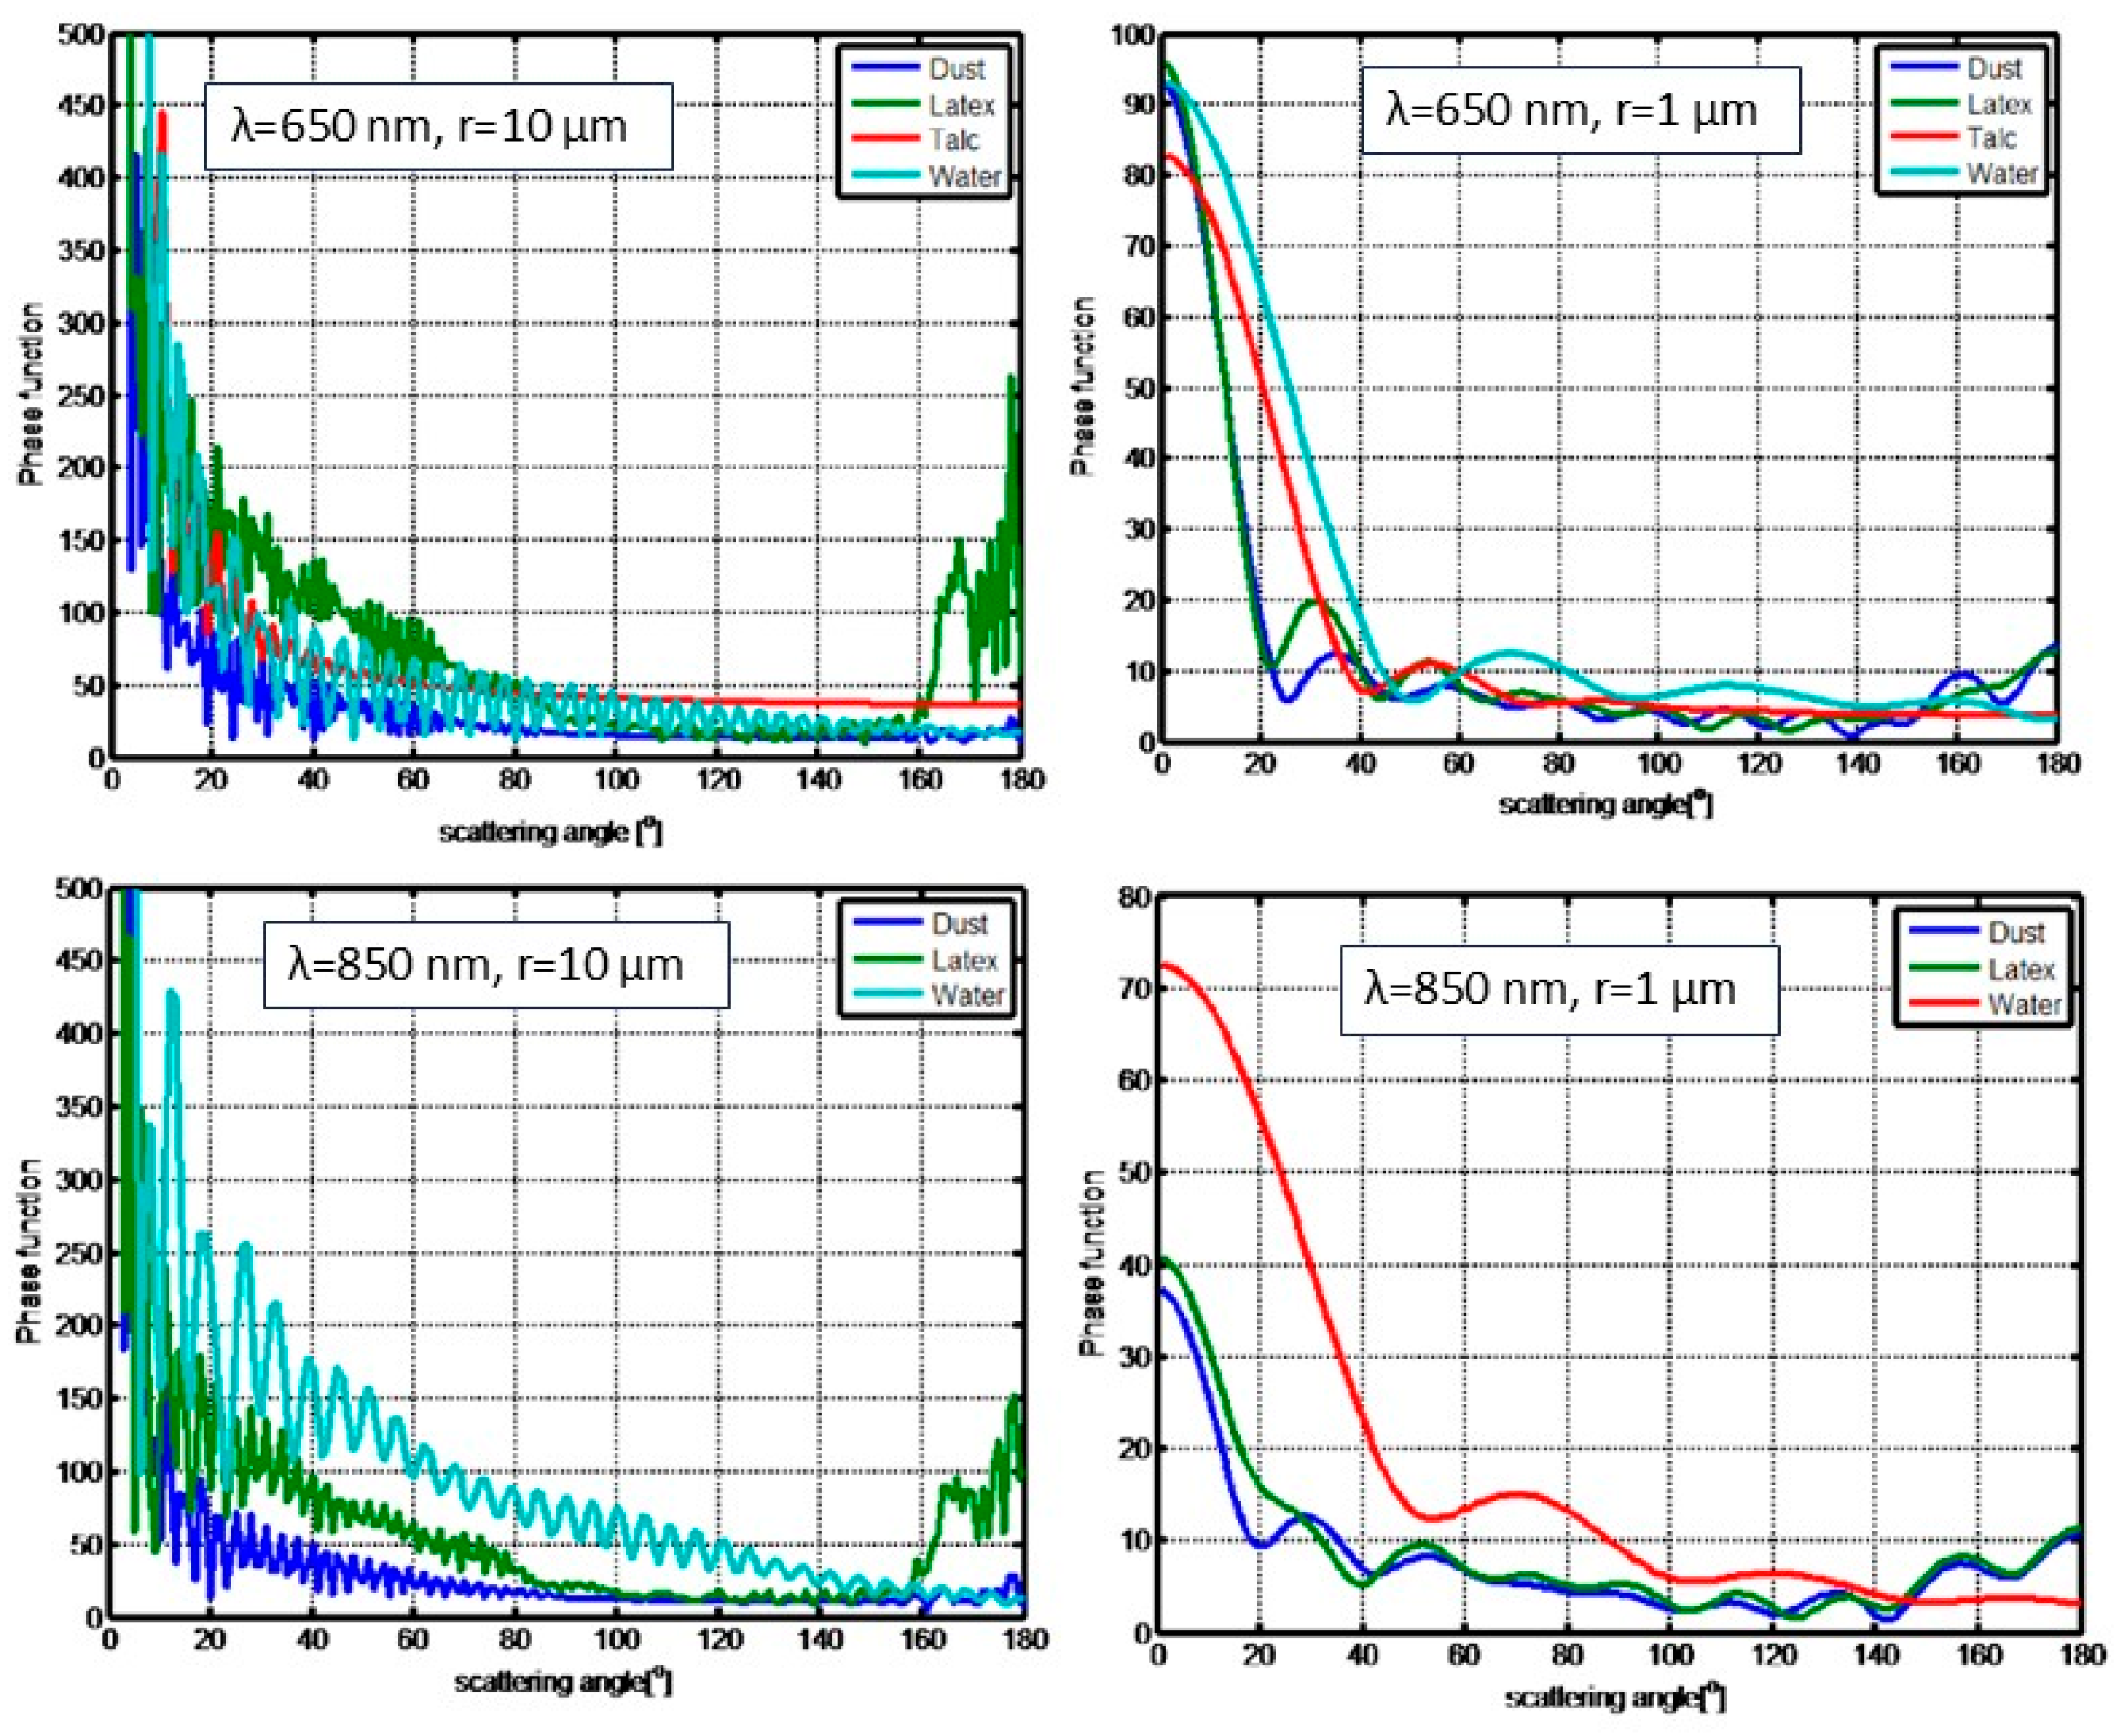
To assess differences between visibility sensors and LCPMS, the scattering phase function was computed for two particle sizes, multiple materials, and both wavelengths. The resulting comparison is shown in
Figure 3.
Figure 3 demonstrates that at small (forward) scattering angles, the scattering intensity exhibits substantial material-dependent variation for both particle sizes. As the scattering angle increases, the overall intensity declines and inter-material differences diminish. These differences are more pronounced at 850 nm than at 650 nm. Since LCPMS operate at visible wavelengths and non-forward angles, their measurements exhibit limited sensitivity to material composition. As a result, such sensors can be used as generalized detectors and calibrated using a universal, material-independent scaling factor.
Low-cost sensors are typically factory-calibrated using standard aerosol types, with their output correlated to that of reference-grade instruments [
18]. This calibration is usually performed within predefined particle size categories, effectively anchoring the sensor response to the MEC of the calibration aerosol. Consequently, when deployed in environments containing aerosols with different optical properties, deviations in sensor output may occur. To mitigate artifacts stemming from variations in particle size distribution-particularly when comparing across aerosol types, calibration in this study is based solely on the PM₁₀ channel, which integrates over the full particle size range.
Figure 3 also highlights that visibility sensors, operating at near-infrared wavelengths and detecting forward-scattered light, are more sensitive to aerosol composition. These instruments are typically calibrated under the assumption of water-based aerosols such as fog or rain. However, field studies report output deviations of up to 10–20% when exposed to natural aerosols with different optical characteristics [
19]. Therefore, accurate application of visibility sensors requires initial calibration tailored to the aerosol type under investigation. Once calibrated, the visibility sensor can serve as a robust reference for calibrating LCPMS in similar environments.
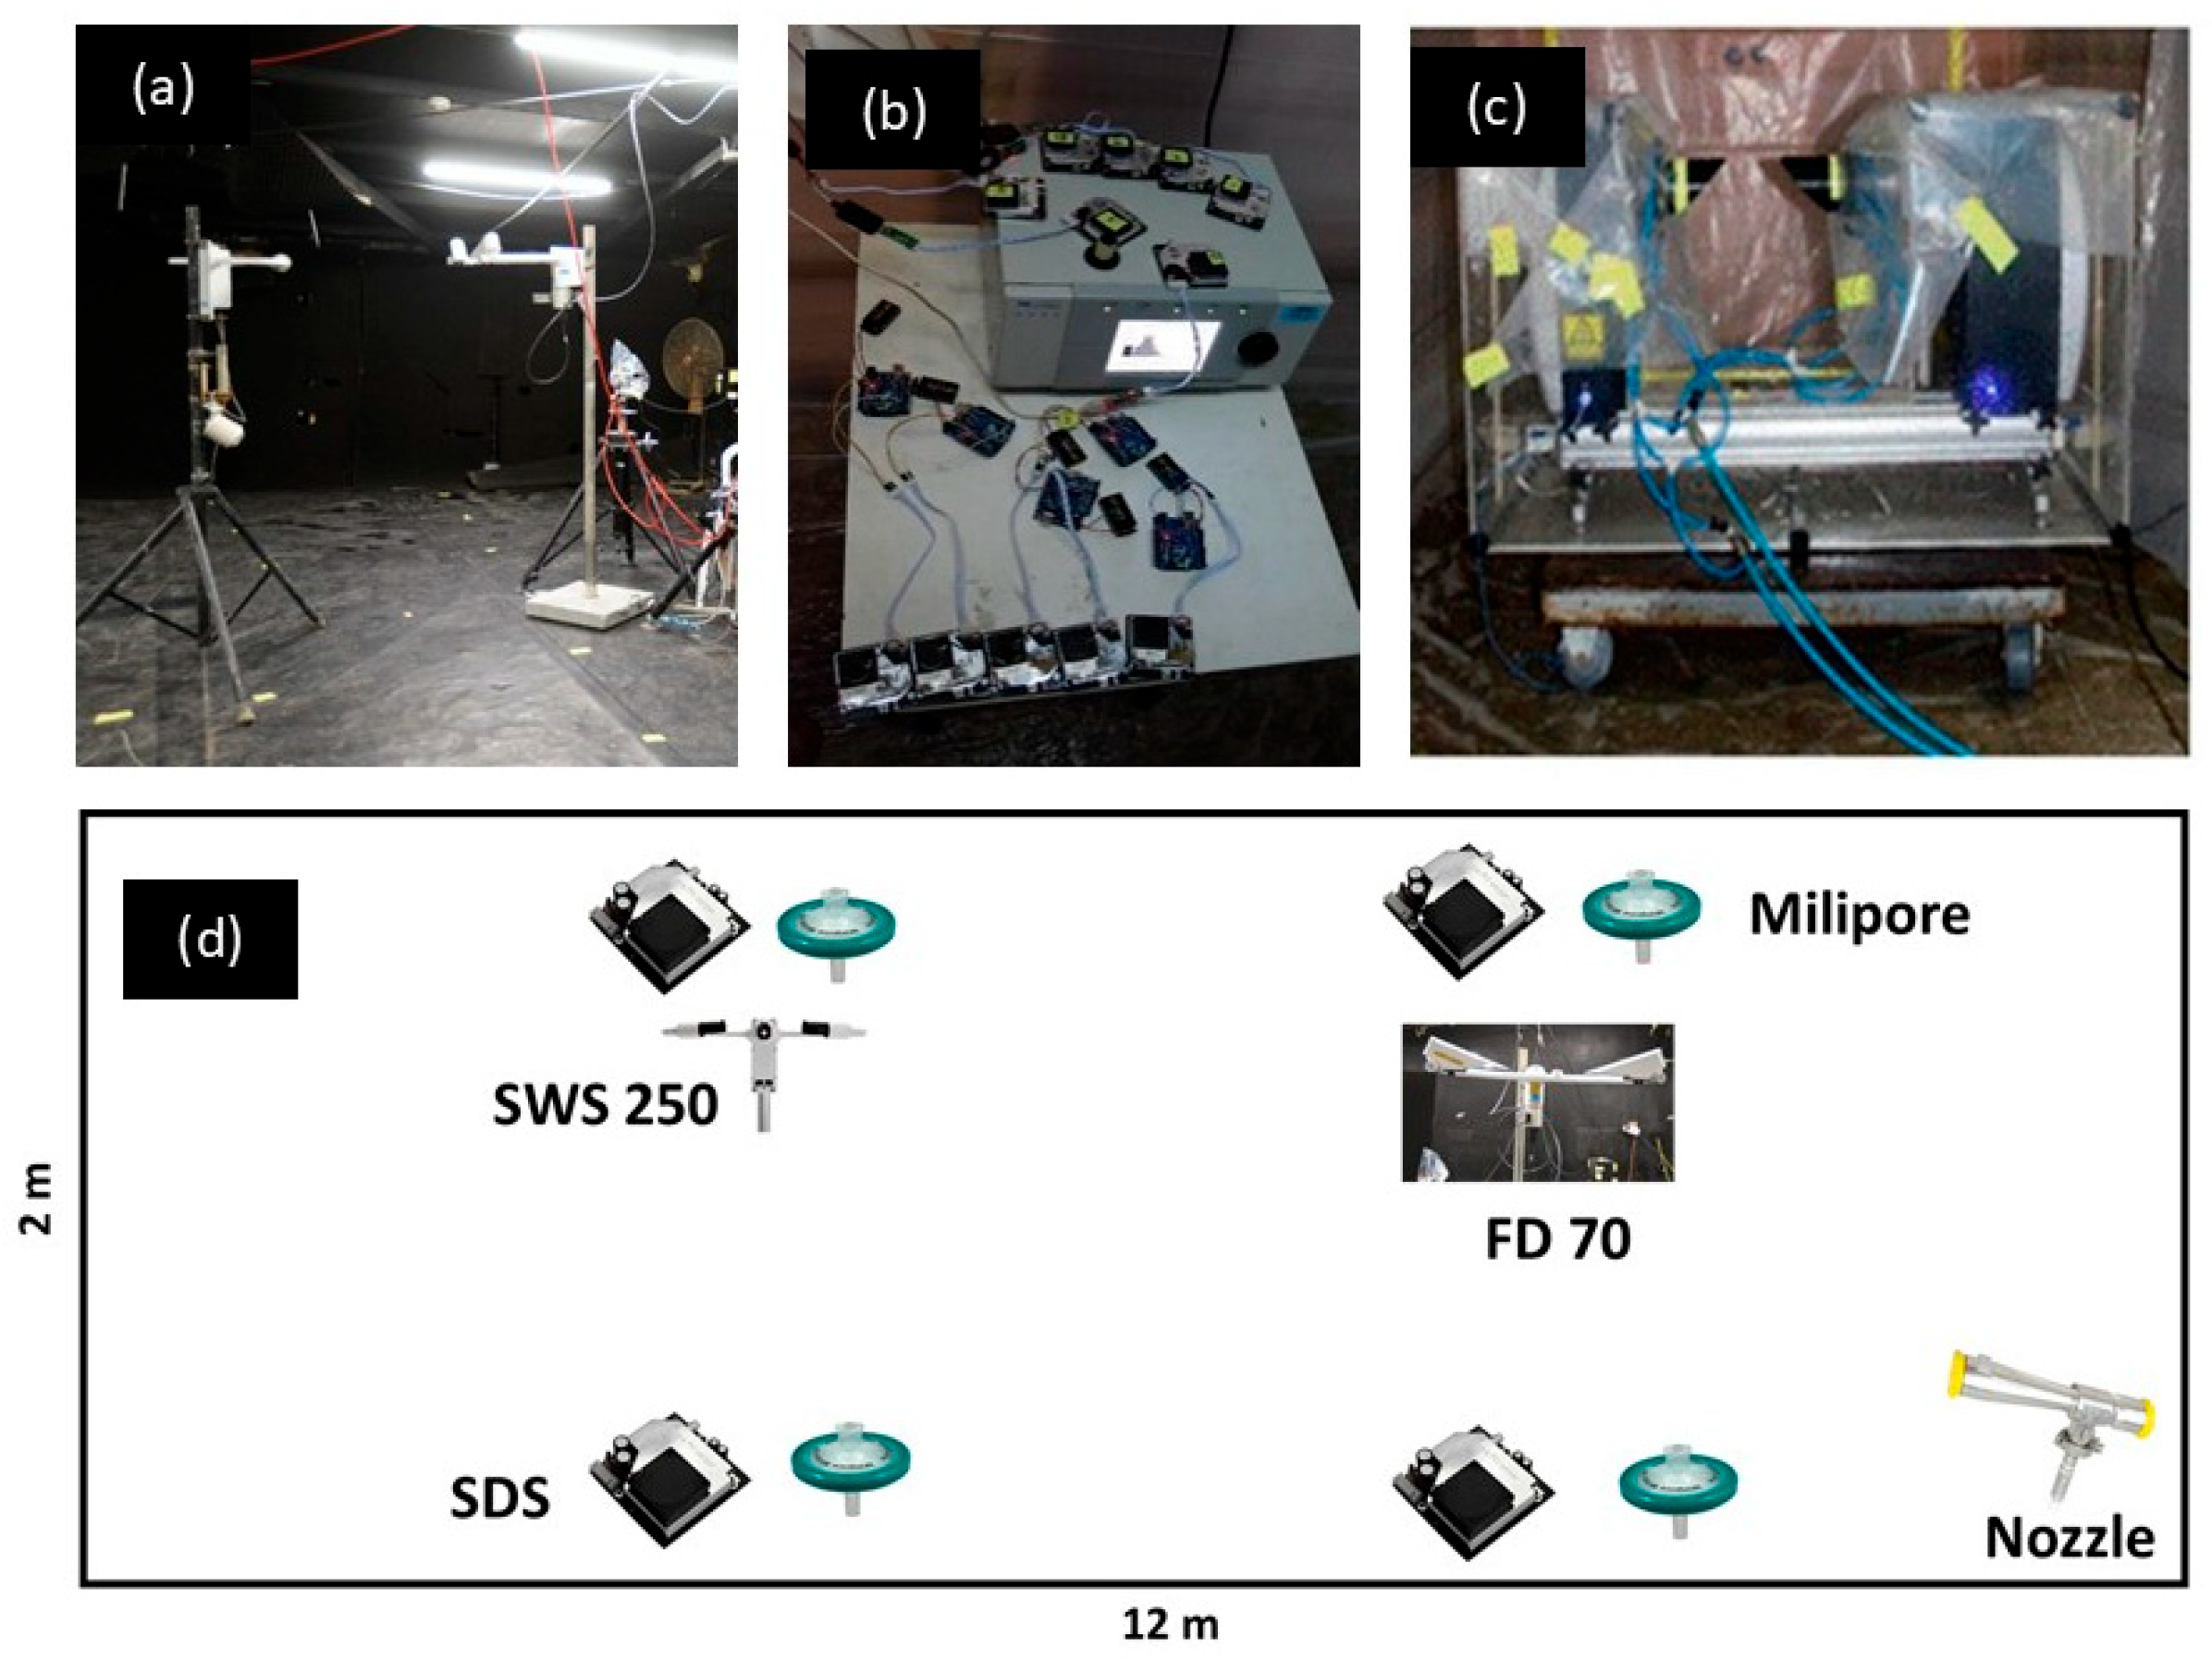
2.2. Experimental Set-Up
All experiments were conducted in a sealed aerosol chamber;
Figure 4 presents its layout. The low-cost optical sensors used were SDS011 units by Nova Fitness [
20], which employ a 650 nm laser source. These commercial devices were integrated into a sensor network (Figure 4) and deployed at multiple positions within the chamber. The sensors measure particulate matter concentrations in size fractions PM
2.5 and PM
10, with an upper detection limit of 2 mg/m³.
Two visibility sensors were employed: the SWS250 (Biral, UK) and the FD70 (Vaisala, Finland), operating at 880 nm and 850 nm, respectively. The FD70 offers enhanced temporal resolution and a low visibility detection threshold down to 3 m [
21], making it particularly suitable for controlled chamber experiments
In selected trials, aerosol particle size distributions were measured using a Spraytec laser diffraction system (Malvern Instruments, UK). Gravimetric measurements of total particulate matter concentration were obtained via Millipore air samplers. These systems use a suction pump to draw air through a filter, which captures airborne particles. The filters were weighed immediately after sampling using analytical balances, allowing accurate calculation of airborne mass concentration.
2.3. Calibration Method
The relationship between particulate matter concentration and meteorological optical range is governed by Equation (5). Establishing this relationship experimentally requires determination of the MEC for the aerosol under investigation.
While MEC can be computed using Equation (4), as shown in Figure 1, this approach demands precise measurements of particle size distribution and accurate refractive index data across relevant wavelengths. As an alternative, MEC can be estimated empirically via gravimetric sampling combined with visibility sensor data. The strong agreement between the calculated and measured MEC values (Figure 1) supports the validity of this simplified calibration strategy.
Calibration was performed inside a sealed aerosol chamber under well-mixed conditions. As a representative case, we consider an experiment using a proline solution—an established plant stress marker [
22]. The solution was atomized through a spray nozzle, and subsequent droplet evaporation yielded airborne particles with diameters ranging from 1 to 10 μm. These particles remained suspended for extended durations, enabling stable and repeatable measurements.
Figure 5 depicts the experimental process, as recorded by a visibility sensor placed within the chamber. Initial atomization reduced visibility due to the high concentration of droplets and suspended particles. Following evaporation, only dry aerosol particles remained. Chamber mixing was then performed to ensure homogeneity, as indicated by the stabilization of the visibility signal. During this steady-state period (marked by a shaded region in Figure 5), aerosol samples were collected using Millipore filters.
MEC was subsequently derived from Equation (5), using the average visibility measured during the sampling window and the corresponding gravimetrically determined average mass concentration.
It is important to recognize that both visibility and MEC are wavelength-dependent, whereas mass concentration is not. For a given aerosol type, MEC determination is a one-time calibration. In repeated experiments where conditions remain constant, specifically, material type, particle size distribution, and humidity- visibility measurements can be directly converted to particulate mass concentration using Equation (5), with the extinction coefficient obtained from the initial calibration. However, any change in dispersion conditions or environmental parameters that affects particle size distribution necessitates recalculation of MEC.
Extension of the calibration to LCPMS involves simultaneous measurements with a visibility sensor. The implementation and validation of this calibration procedure are presented in the following section.
3. Results
This section presents the calibration of SDS011 sensors using concurrent measurements from a visibility sensor.
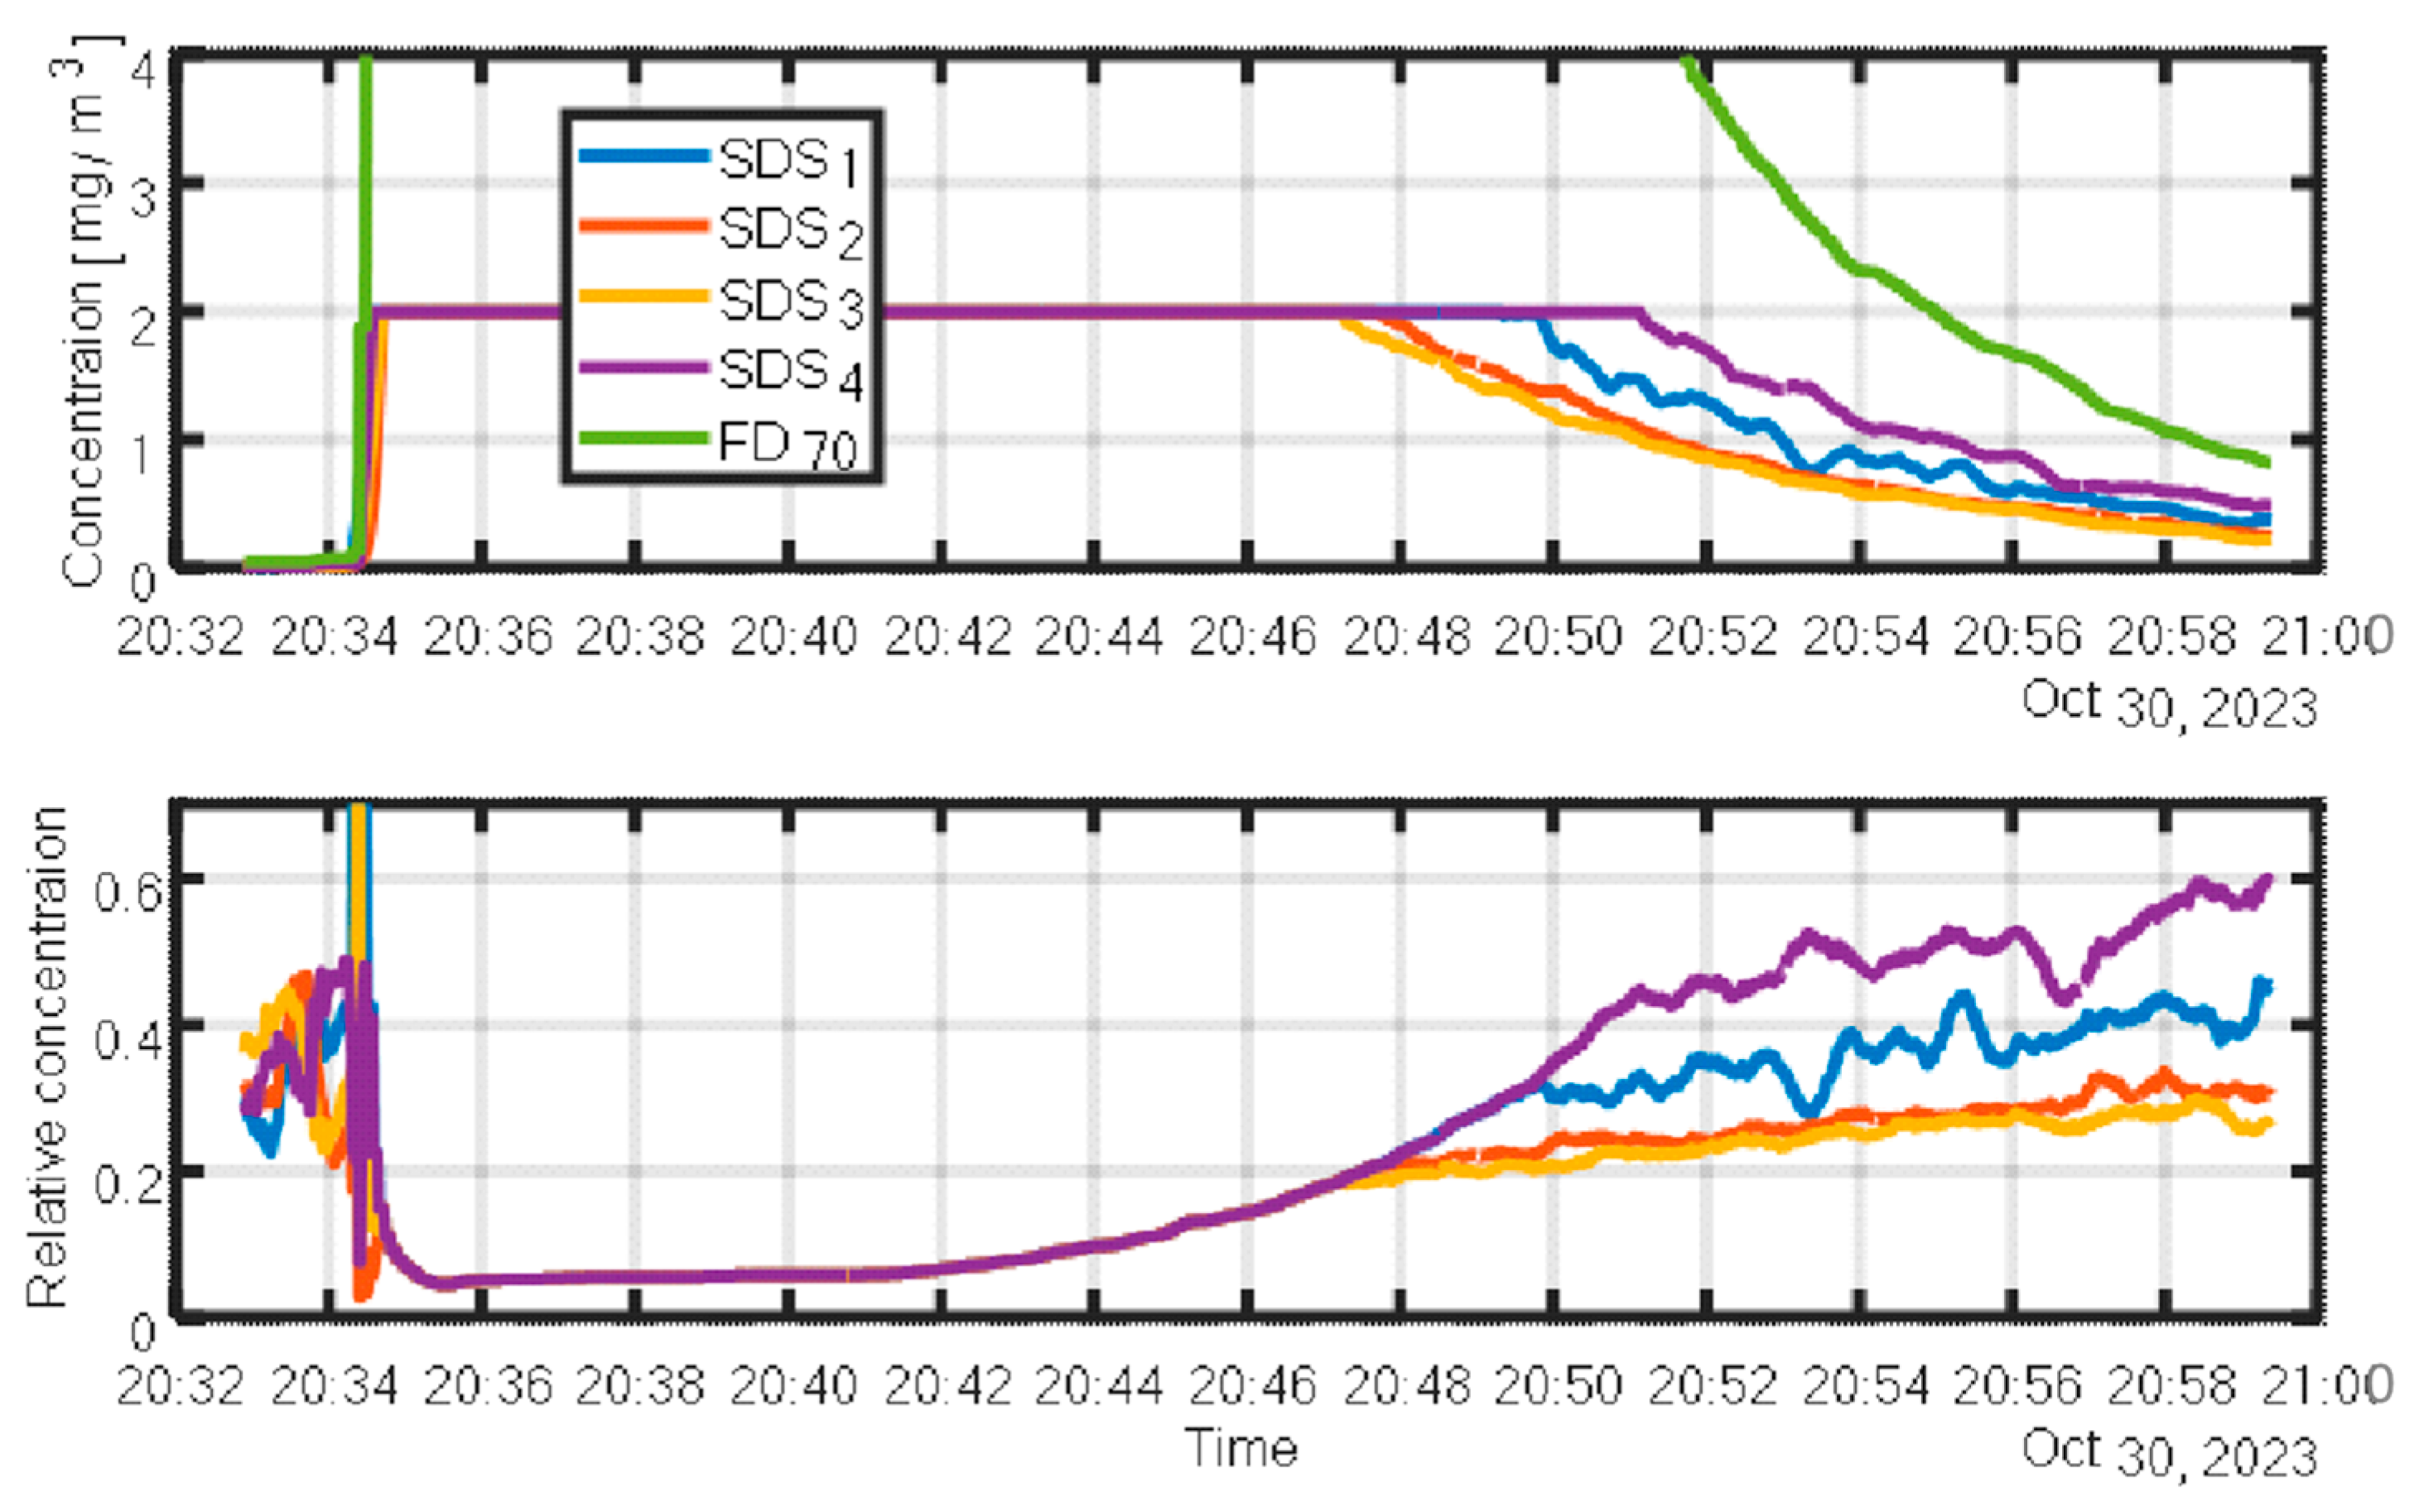
The upper panel of Figure 6 displays the raw signals from an array of four SDS011 sensors placed within the aerosol chamber, alongside the concentration inferred from the visibility sensor. Visibility-based concentration was calculated using Equation (5) with a MEC of 1.2 m² g⁻¹, determined from the average gravimetric (Millipore) measurement.
For calibration, the lower panel of
Figure 6 shows the SDS011 readings normalized relative to the visibility-derived concentration. The mean normalization factor was 0.4, with a standard deviation of 0.1, attributed to spatial concentration variability within the chamber. The low variance indicates a high degree of spatial homogeneity.
Multiplying the normalization factor by the MEC used in the visibility calculation yields an effective MEC for the SDS011 sensors of approximately 3 m² g⁻¹. This value reflects differences in the optical properties and operating wavelengths of the two sensor types.
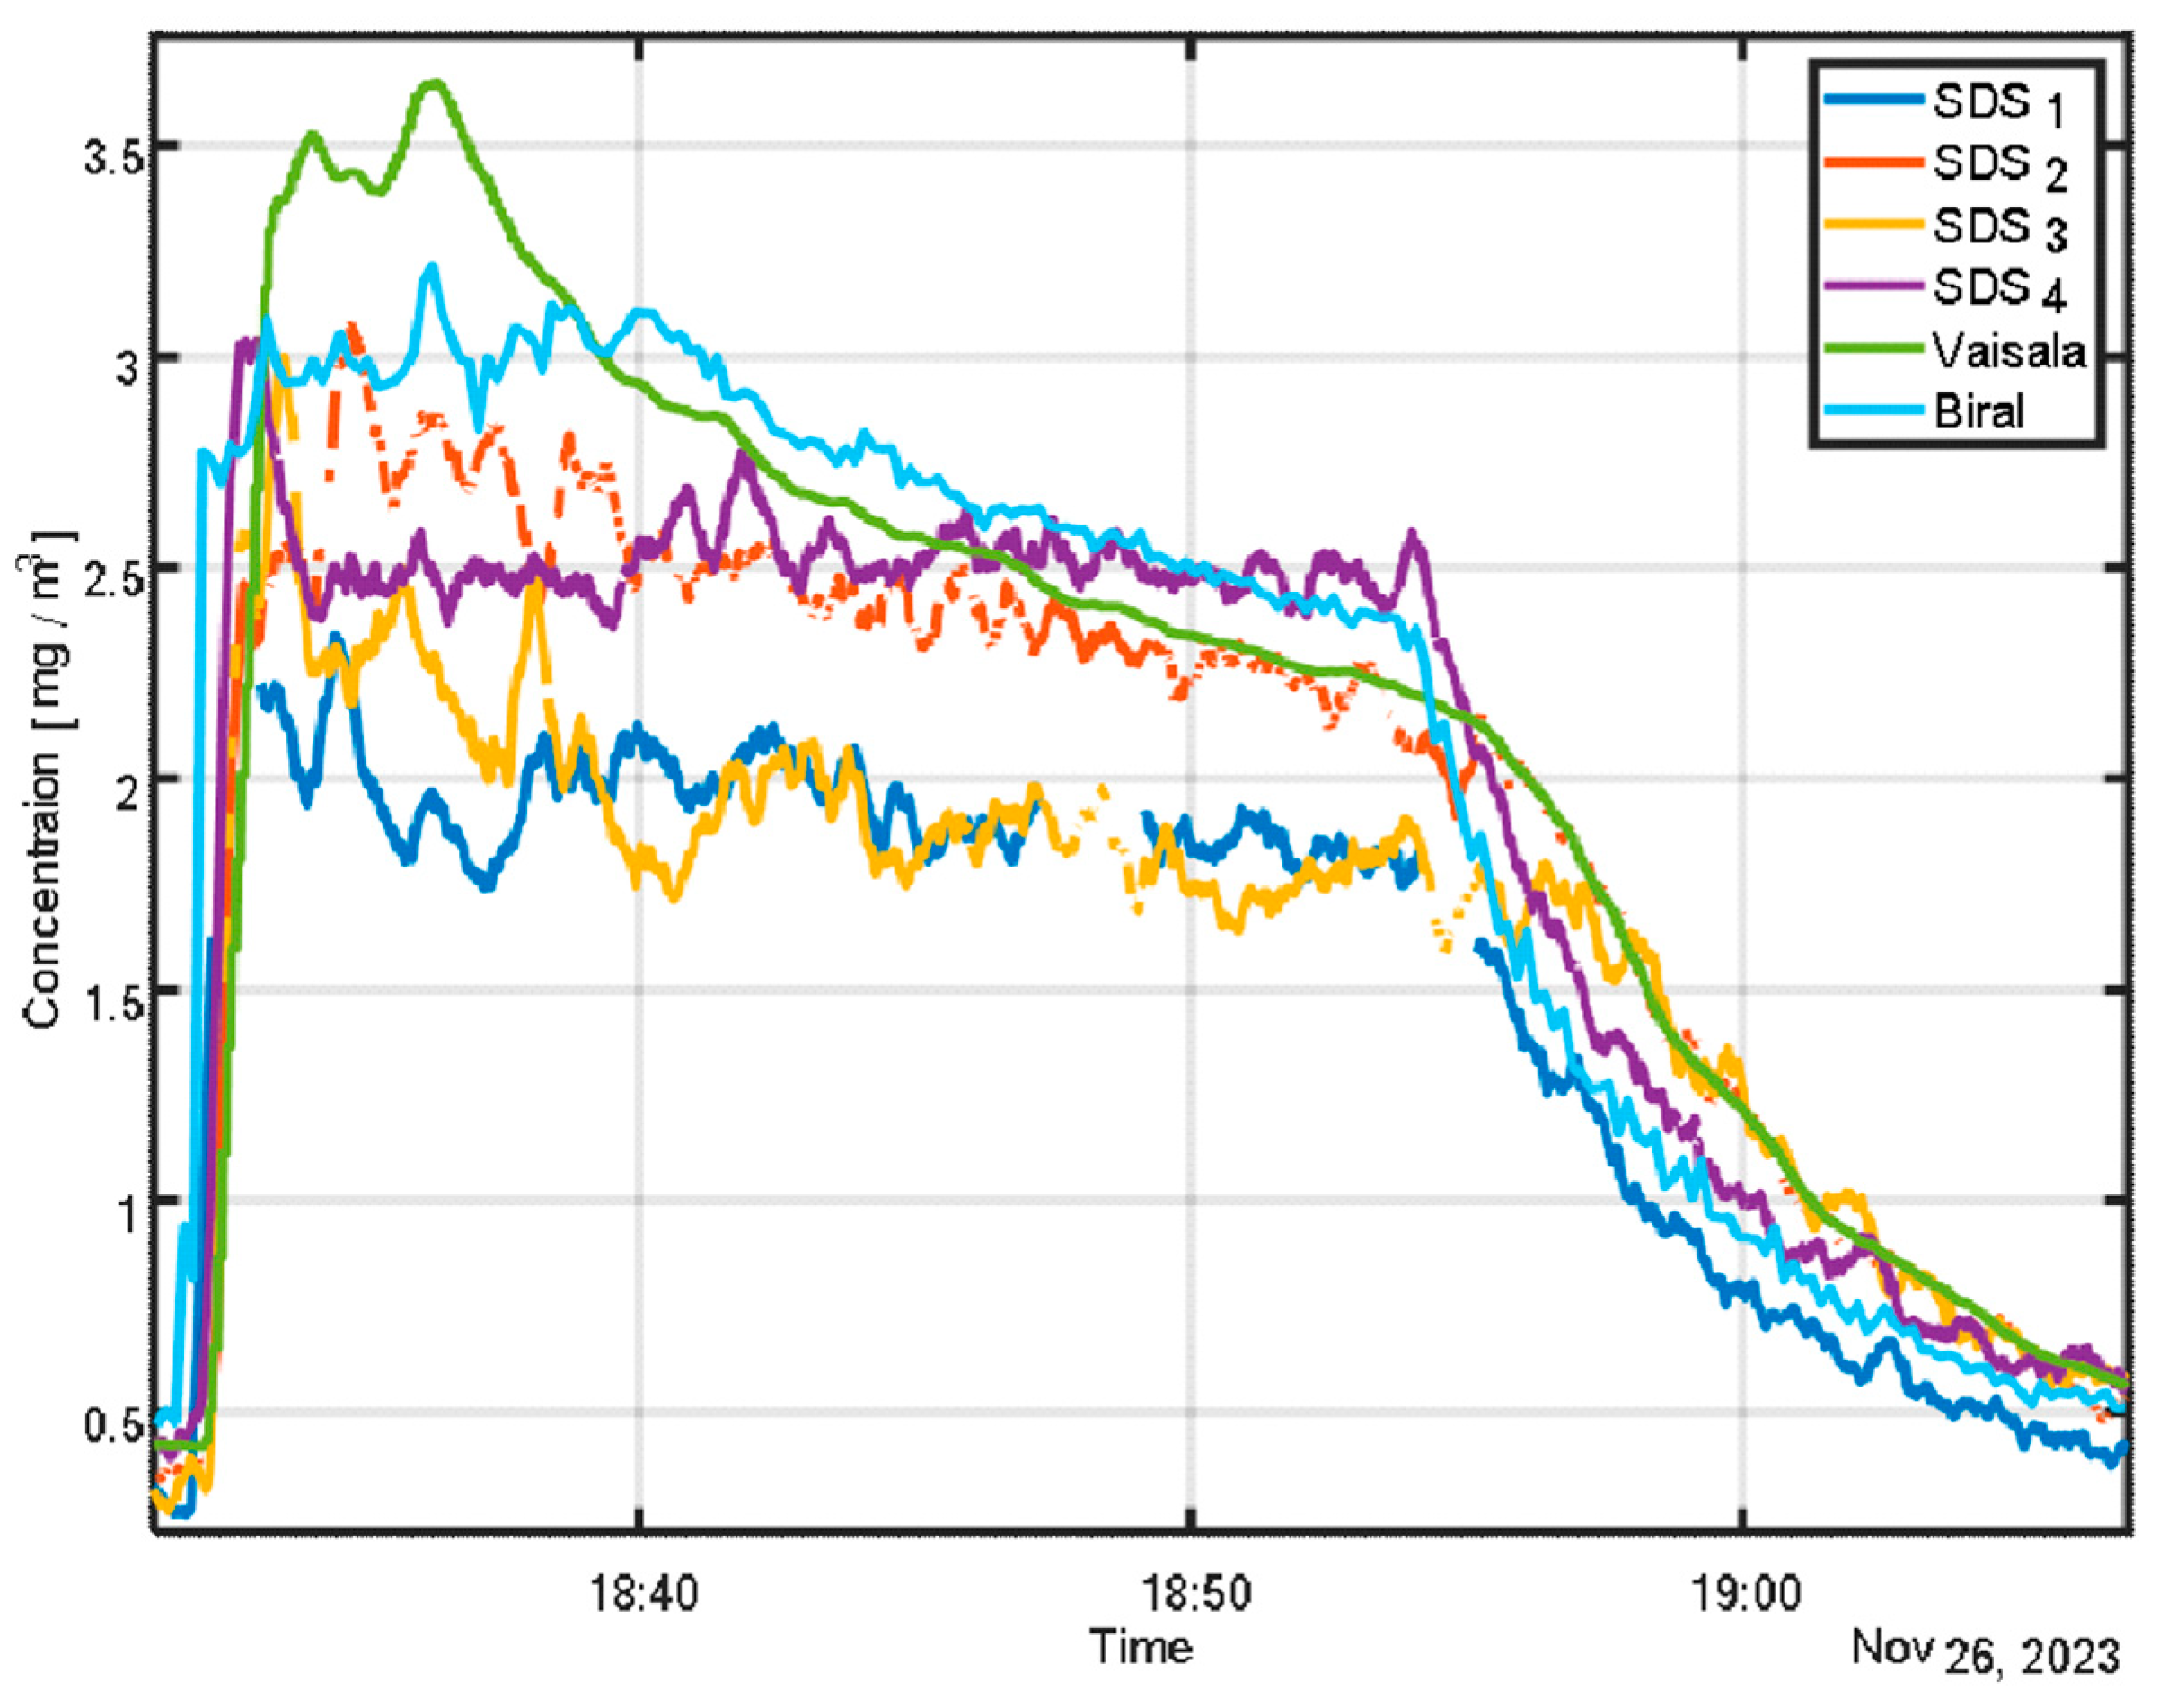
When experimental conditions are held constant, the calibration ratio remains stable and can be used to deploy a sensor network that accurately represents the chamber’s aerosol distribution with high spatial resolution, as illustrated in
Figure 7.
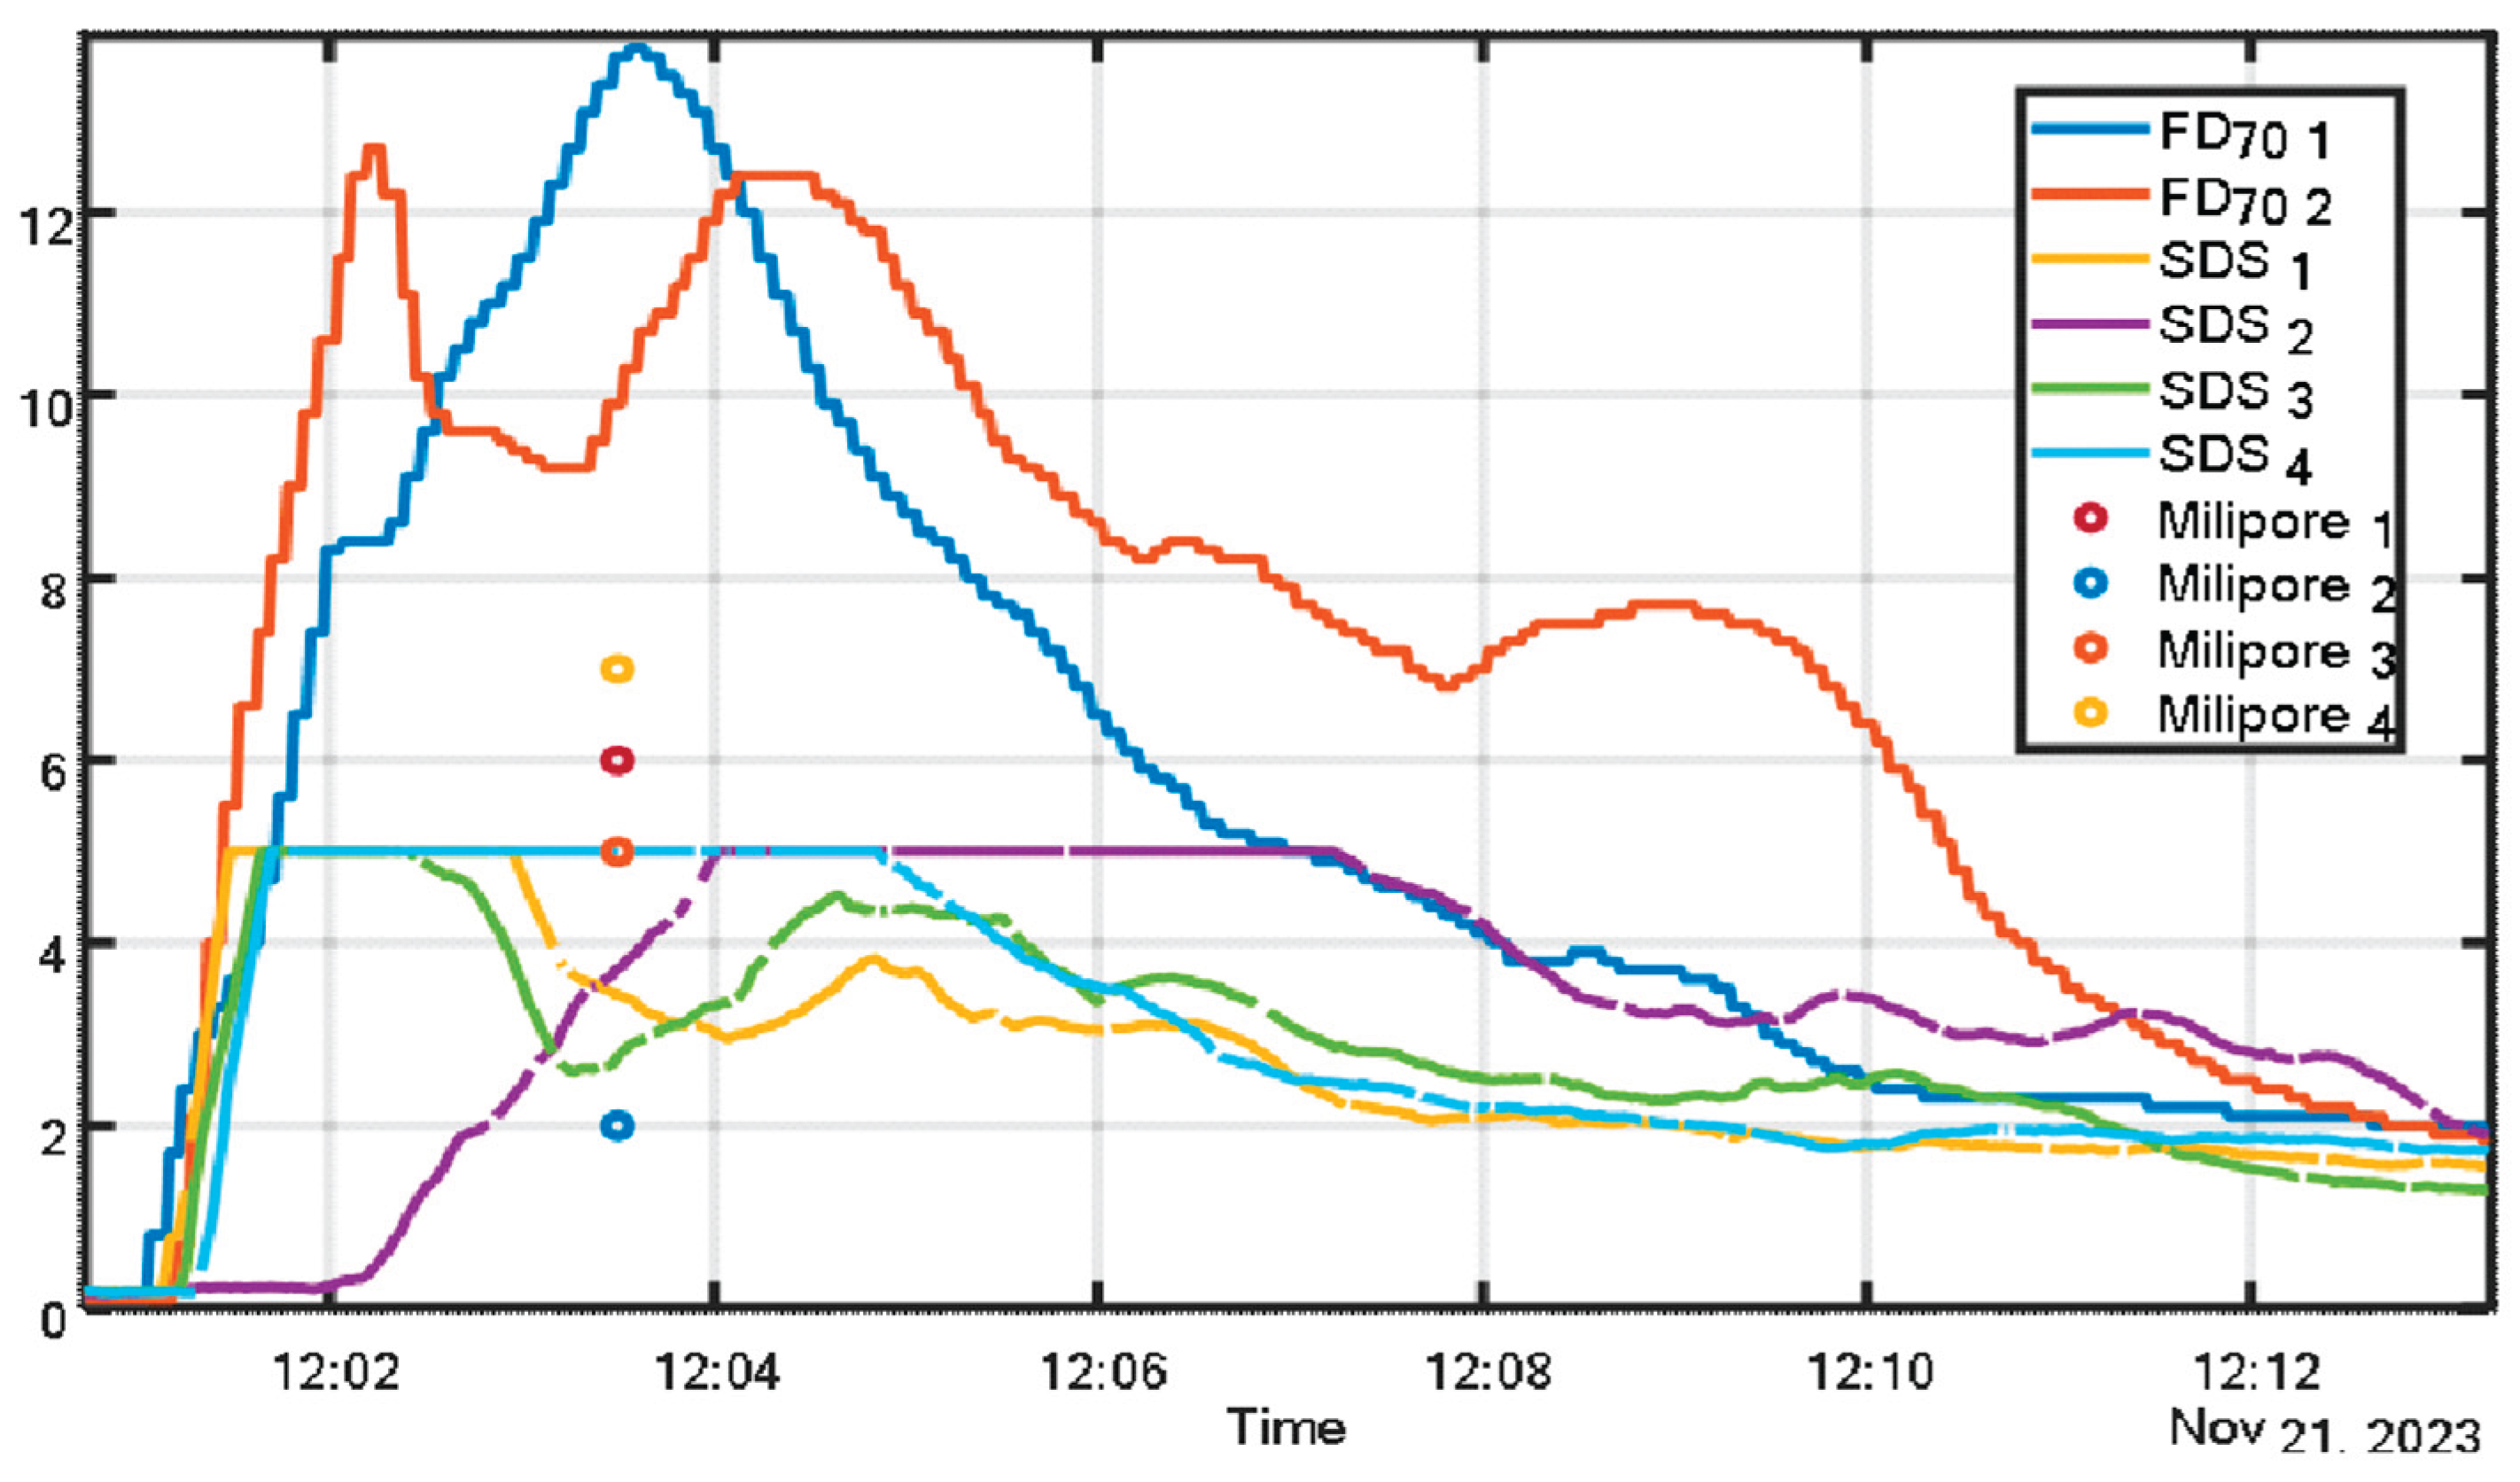
Figure 8 illustrates the benefits of calibrating optical sensors using visibility-based measurements, as opposed to relying solely on gravimetric sampling. The experiment involved three co-located instruments: visibility sensor, SDS011 sensor, and Millipore gravimetric sampler, arranged side by side (see Figure 4).
By calibrating the visibility and SDS011 sensors against the gravimetric reference, continuous real-time monitoring of particulate concentration becomes feasible, assuming a stable particle size distribution during the measurement period. The figure also underscores the limitations of the SDS011 sensor, particularly its reduced upper detection limit relative to the visibility sensor.
4. Discussion
This study demonstrates the feasibility of calibrating low-cost optical sensors, such as the SDS011, for particulate matter concentration measurements using a visibility sensor as reference. Controlled experiments in sealed aerosol chambers enabled linking sensor outputs to actual mass concentrations by determining the MEC through parallel gravimetric sampling with Millipore filters.
A key finding is that the experimentally derived MEC allows accurate and consistent conversion of sensor readings to mass concentrations, provided that aerosol properties and environmental conditions remain stable. Notably, a substantial discrepancy was observed between factory-calibrated sensor responses and actual aerosol behavior, potentially leading to significant over- or underestimation during real-world operation. This discrepancy, evident in Figure 1, reflects the high sensitivity of MEC to aerosol composition- particularly particle size, density, and refractive index, emphasizing the need for aerosol-specific calibration.
This study did not explore the impact of environmental fluctuations such as humidity and temperature on sensor performance. As all experiments were conducted under stable conditions in enclosed chambers, these effects remain unquantified. Future work should examine the robustness of the calibration procedure under variable environmental conditions.
The primary advantage of the proposed approach lies in its simplicity and practicality. Visibility sensors, already deployed at many meteorological stations, offer continuous and reliable optical measurements based on the same physical principles as low-cost sensors. This makes them ideal for establishing affordable calibration frameworks and dense monitoring networks, particularly in remote or resource-constrained settings.
Nonetheless, several limitations must be considered. First, the SDS011 exhibits a limited dynamic range, as confirmed by saturation effects in high-concentration chamber tests. Second, the visibility sensor itself requires an initial calibration, typically based on gravimetric methods. Lastly, any changes in aerosol properties or environmental parameters may alter MEC, necessitating recalibration for accurate long-term deployment.
5. Conclusions
This study presents a practical and effective method for calibrating low-cost particulate matter sensors using visibility-based optical measurements. By leveraging the physical relationship between light extinction and aerosol concentration, as captured by the mass extinction coefficient (MEC), the proposed approach enables accurate translation of raw sensor data into mass concentration values.
Experiments conducted in a controlled aerosol chamber demonstrate that the MEC can be reliably determined through concurrent gravimetric and visibility measurements. Once established for a given aerosol type under stable environmental conditions, the MEC allows both visibility sensors and SDS011 sensors to provide real-time, calibrated particulate matter readings. The consistency of the normalization factor across multiple SDS units highlights the potential for deploying dense sensor arrays with high spatial resolution.
The results also reveal that manufacturer calibrations of low-cost sensors may deviate significantly from actual aerosol behavior, due to variations in particle size, composition, and optical properties. This underscores the need for application-specific calibration procedures.
The proposed method offers a scalable alternative to traditional calibration approaches, requiring only a one-time gravimetric reference to establish the MEC. It is particularly well-suited for field deployments in resource-limited environments, where visibility sensors are already available and continuous monitoring is desired.
However, limitations remain. Sensor response may be affected by environmental variables such as humidity and temperature, which were not varied in the present study. Additionally, any significant change in aerosol characteristics necessitates recalibration. Future work should explore these dependencies and extend the approach to diverse real-world conditions.
6. Patents
There are not patents resulting from the work reported in this manuscript.
Funding
This research received no external funding.
Institutional Review Board Statement
the study did not require ethical approval.
Data Availability Statement
The raw data supporting the conclusions of this article will be made available by the authors on request.
Acknowledgments
I would like to thank Tamir Tzadok, Dr. Batya Parizer, Sharon Cohen, Nadav Gilad, Amnon Sharon, Guy Cohen, Alexey Mendelson, and Noam Ashush, from the Environmental Physics Department in IIBR, for their help in conducting the aerosol chamber experiments. During the preparation of this manuscript, the author used GPT-40 for the purposes of text editing. The authors have reviewed and edited the output and take full responsibility for the content of this publication
Conflicts of Interest
“The authors declare no conflicts of interest.”
Abbreviations
The following abbreviations are used in this manuscript:
| LCPMS |
Low-Cost Particulate Matter Sensors |
| PM |
Particulate Matter |
| MEC |
Mass Extinction Coefficient |
| MOR |
Meteorological Optical Range |
References
- Morpurgo, A.; Pedersini, F.; Reina, A. A Low-Cost Instrument for Environmental Particulate Analysis Based on Optical Scattering. In Proceedings of the 2012 IEEE International Instrumentation and Measurement Technology Conference; Graz, Austria, 13–16 May 2012; pp. 2646–2650. [Google Scholar]
- Alfano, B.; Cancellara, M.; De Gennaro, G.; Di Gilio, A.; Finzi, G.; Reche, C.; Rivas, I. A Review of Low-Cost Particulate Matter Sensors from the Developers’ Perspectives. Sensors 2020, 20, 6819. [Google Scholar] [CrossRef] [PubMed]
- Si, M.; Gao, J.; Zhang, H.; Gao, J.; Wang, Y.; Sun, Y.; Wang, H. Evaluation and Calibration of a Low-Cost Particle Sensor in Ambient Conditions Using Machine-Learning Methods. Atmos. Meas. Tech. 2020, 13, 1693–1707. [Google Scholar] [CrossRef]
- Feinberg, S.N.; Williams, R.; Hagler, G.S.W.; Rickard, J.; Brown, R.; Garver, D.; Harshfield, G.; Stauffer, P.; Mattson, E.; Judge, R. Examining Spatiotemporal Variability of Urban Particulate Matter and Application of High-Time Resolution Data from a Network of Low-Cost Air Pollution Sensors. Atmos. Environ. 2019, 213, 579–584. [Google Scholar] [CrossRef] [PubMed]
- Anderson, T.L.; Ogren, J.A. Determining Aerosol Radiative Properties Using the TSI 3563 Integrating Nephelometer. Aerosol Sci. Technol. 1998, 29, 57–69. [Google Scholar] [CrossRef]
- Venkatraman Jagatha, J.; Muthu, B.S.; Usha, G.; Ramya, R.; Soundarajan, M. Calibration Method for Particulate Matter Low-Cost Sensors Used in Ambient Air Quality Monitoring and Research. Sensors 2021, 21, 3960. [Google Scholar] [CrossRef] [PubMed]
- Lambert, J.H. Photometria sive de Mensura et Gradibus Luminis, Colorum et Umbrae; Klett: Augsburg, Germany, 1760. [Google Scholar]
- Bohren, C.F.; Huffman, D.R. Absorption and Scattering of Light by Small Particles; Wiley: New York, NY, USA, 1998. [Google Scholar]
- Ronen, A.; Agassi, E.; Yaron, O. Sensing with Polarized Lidar in Degraded Visibility Conditions Due to Fog and Low Clouds. Sensors 2021, 21, 2510. [Google Scholar] [CrossRef] [PubMed]
- Mätzler, C. Matlab Functions for Mie Scattering and Absorption; Research Report, No. 2002-08; University of Bern, 2002.
- Jarraud, M. Guide to Meteorological Instruments and Methods of Observation (WMO-No. 8); World Meteorological Organization: Geneva, Switzerland, 2008. [Google Scholar]
- d’Almeida, G.A.; Koepke, P.; Shettle, E.P. Atmospheric Aerosols: Global Climatology and Radiative Characteristics; A. Deepak Publishing: Hampton, VA, USA, 1991. [Google Scholar]
- Powder Technology Inc. Material Safety Data Sheet: Arizona Test Dust. Available online: https://www.powdertechnologyinc.com (accessed on 15 July 2025).
- Sultanova, N.; Kasarova, S.; Nikolov, I. Dispersion Properties of Optical Polymers. Acta Phys. Pol. A 2009, 116, 585–587. [Google Scholar] [CrossRef]
- Pugh, T.L.; Heller, W. Density of Polystyrene and Polyvinyltoluene Latex Particles. J. Colloid Sci. 1957, 12, 173–180. [Google Scholar] [CrossRef]
- Saman, G.; Hancock, E.R. Estimating Complex Refractive Index Using Ellipsometry. In Image Analysis and Processing – ICIAP 2013; Petrosino, A., Ed.; Lecture Notes in Computer Science; Springer: Berlin/Heidelberg, Germany, 2013; Volume 8156. [Google Scholar]
- Talc Mineral Data. Available online: https://webmineral.com/data/Talc.shtml (accessed on 29 July 2025).
- He, M.; Kuerbanjiang, N.; Dhaniyala, S. Performance Characteristics of the Low-Cost Plantower PMS Optical Sensor. Aerosol Sci. Technol. 2020, 54, 232–241. [Google Scholar] [CrossRef]
- Van der Meulen, J.P. Visibility Measuring Instruments: Difference between Scatterometers and Transmissometers. Proceedings of SPIE 1992, 331, 1–10. [Google Scholar]
- Nova Fitness. SDS011 Datasheet. Available online: https://cdn-reichelt.de/documents/datenblatt/X200/SDS011-DATASHEET.pdf (accessed on 28 July 2025).
- Vaisala. FD70 Forward Scatter Visibility Sensor. Available online: https://www.vaisala.com/en/products/weather-environmental-sensors/forward-scatter-fd70 (accessed on 29 July 2025).
- Hayat, S.; Hayat, Q.; Alyemeni, M.N.; Wani, A.S.; Pichtel, J.; Ahmad, A. Role of Proline under Changing Environments: A Review. Plant Signal. Behav. 2012, 7, 1456–1466. [Google Scholar] [CrossRef] [PubMed]
|
Disclaimer/Publisher’s Note: The statements, opinions and data contained in all publications are solely those of the individual author(s) and contributor(s) and not of MDPI and/or the editor(s). MDPI and/or the editor(s) disclaim responsibility for any injury to people or property resulting from any ideas, methods, instructions or products referred to in the content. |
© 2025 by the author. Licensee MDPI, Basel, Switzerland. This article is an open access article distributed under the terms and conditions of the Creative Commons Attribution (CC BY) license (https://creativecommons.org/licenses/by/4.0/).