
Submitted:
04 August 2025
Posted:
06 August 2025
You are already at the latest version
Abstract
This study addresses the multi-objective optimization of an electric racing vehicle’s performance by identifying the optimal combination of battery type, pilot weight, and power mode to maximize travel time and distance while minimizing energy consumption. A sequential methodology integrating Response Surface Methodology (RSM) and the Desirability Function Approach (DFA) was applied using a 2×3×3 factorial experimental design. Performance data were collected through a custom Arduino-based acquisition system and analyzed using first- and second-order models. Results showed that the configuration comprising the smallest battery (1.0), the lowest weight (66 kg), and the lowest power mode (N5) produced the best overall performance, with a maximum operational time of 1.12 h, a travel distance of 24.63 km, and an energy efficiency of 2.90 km/Ah. The statistical models demonstrated strong explanatory power, with adjusted R² values above 0.83 and global p-values below 0.01. Both individual response optimization and global desirability analysis converged on the same optimal settings, validating the robustness of the methodology. The findings offer a replicable framework for optimizing high-efficiency electric vehicles and contribute to the broader development of sustainable transportation technologies.
Keywords:
multiobjective optimization
; power at maximum distance
; Lithium-ion batteries
; electric vehicles
; peak power distance
; minimizing energy consumption/time
; sustainable transportation
1. Introduction
Nowadays, many automotive companies are actively working to reduce their environmental impact by developing eco-friendly vehicles and advancing innovative technologies to achieve greater energy efficiency. Within this context, international initiatives such as the Shell Eco-Marathon play a key role by promoting the design and construction of high-efficiency prototypes and pushing the boundaries of sustainable transportation through research, engineering, and performance optimization. [1].
Simultaneously, the Faculty of Engineering at the Pascual Bravo University Institution has developed notable expertise in the design and construction of prototype race cars. This process typically involves three key stages: concept creation, engineering design development, and physical construction and testing. These stages are essential to ensure that the vehicle meets performance, safety, and energy efficiency requirements before participating in competitive events. The faculty team has recently engineered and assembled several electric race cars, achieving outstanding results in local competitions.
The National Electric Drive Vehicle Competition is an annual national event in which university student teams design, build, and test their own electric vehicles with the goal of achieving the highest possible energy efficiency. which showcases vehicles designed to resemble everyday passenger cars while prioritizing sophisticated energy efficiency strategies. As shown in Figure 2, our battery-electric Urban Concept vehicle participated in the third edition of this competition, held in Medellín, Colombia. The team, representing the Pascual Bravo University Institution, earned top honors in the national competition by demonstrating outstanding performance in technical innovation, efficiency, and sustainable engineering practices [2].
Electric vehicles (EVs), such as these race cars, typically rely on a combination of lithium-ion (Li-ion) batteries, brushless DC (BLDC) motor controllers, and battery management systems (BMS). Li-ion batteries are favored due to their high energy density, lack of memory effect, long lifespan, and flexible charging and discharging capabilities [3,4]. However, despite these advantages, EV competitions must address critical challenges such as fluctuating power demands, the weight and type of battery used, and the thermal behavior of the overall energy system during racing conditions [5].
The comparison of battery types, power settings, and total weight in electric prototype race cars is essential for optimizing overall performance and energy efficiency. Numerous studies have explored these factors to improve vehicle design and operation. For instance, one study analyzed five lithium-ion battery cells for electric racing vehicles, focusing on voltage, current, thermal behavior, and cooling. Their findings highlight how battery selection affects energy output, stability, and temperature control under demanding conditions [5]. Another research emphasized that reducing battery system weight using lightweight materials and efficient cooling improves energy efficiency and vehicle performance in electric race cars [6]. Additionally, regenerative braking was explored as a method to increase energy efficiency in electric racing prototypes, showing an average increase in available energy and traveled distance when applying regenerative braking techniques [7].
These findings collectively underscore the critical role of battery selection, vehicle weight reduction, and energy optimization in enhancing the performance of electric prototype race cars. However, current literature lacks a comprehensive comparative analysis that simultaneously considers multiple battery configurations, weight levels, and power settings [8,9,10,11]. To address this gap, Response Surface Methodology (RSM) can be employed as a robust statistical technique for modeling and optimizing complex systems. RSM is widely applied across various disciplines—including engineering [12], chemistry [13], and environmental sciences [14]—to improve processes, refine formulations [15], and enhance product quality [16]. By systematically exploring the interactions between multiple variables, RSM enables the identification of optimal operational conditions.
In addition, the Desirability Function Approach (DFA) serves as a valuable alternative or complement to RSM, particularly in multi-objective optimization scenarios. DFA transforms each response variable into a dimensionless desirability value ranging from 0 (completely undesirable) to 1 (fully desirable), and then aggregates these values to identify solutions that balance competing objectives. This makes DFA especially effective for decision-making when trade-offs between performance metrics—such as energy consumption and speed—must be managed simultaneously [17,18].
This project proposes an approach to compare trials using various entry factors at multiple levels: batteries (2), weights (3), and powers (3). The goal is to identify the optimal configuration for a multiparameter optimization that maximizes time and distance while minimizing consumption.
To validate the proposed approach and assess the impact of key input factors on vehicle performance, a structured experimental procedure was designed and implemented. The following section outlines the methodology adopted for this study, detailing the experimental design, the instrumentation and data acquisition systems employed, and the processes used for data cleaning and preparation. Additionally, advanced statistical tools—namely Response Surface Methodology (RSM) and the Desirability Function Approach (DFA) were applied to model the interactions between variables and to identify optimal configurations across multiple objectives. The results derived from this methodology are presented and discussed in the subsequent section, followed by concluding remarks that highlight the key findings and implications of this work.
2. Materials and Methods
This study aims to optimize the performance of an electric racing vehicle by maximizing time and distance while minimizing energy consumption through a multiparameter approach. A sequential RSM optimization strategy, guided by the steepest descent/ascent algorithm, was implemented across five stages: experimental design, data acquisition and Instrumentation, data collection, data cleaning, and RSM and DFA analysis, as illustrated in Figure 1.
Figure 1.
Stages in the experimental design process used to conduct tests and collect data for analysis. Source: Author’s own elaboration.
Figure 1.
Stages in the experimental design process used to conduct tests and collect data for analysis. Source: Author’s own elaboration.

2.1. Experimental Design
The experiments were conducted in six steps, adhering to the methodology outlined by [19], as follows.
Step 1. Problem identification
Electric vehicles (EVs) are becoming increasingly popular as the global transition away from fossil fuels accelerates, supported by declining technology costs and government incentives. In this context, establishing a performance baseline is essential to evaluate enhancements that improve efficiency and contribute to the shift toward sustainable energy. Within electric vehicle competitions, the primary objective is to determine the optimal operating conditions—considering variations in battery type, power settings, and vehicle weight—that minimize energy consumption while maximizing efficiency. The ultimate goal is to extend the distance the vehicle can travel on a single full battery charge under competitive conditions.
Step 2. Selection of the response variables and the entrance the factors
Three input variables were selected for this experiment. The first variable, battery type (), corresponds to a battery pack delivering a nominal voltage of 48 volts and a capacity of 480 Wh. This pack is composed of Samsung 18650 lithium-ion cells, each rated at 3.5 V and 2500 mAh, arranged in a mixed configuration of four cells in parallel and thirteen of these parallel groups connected in series. This design optimizes energy storage and discharge performance while adhering to the physical constraints of the vehicle.
The second variable, weight (), was varied by maintaining a constant pilot weight of 66 kg and adding ballast weights of 10 kg and 20 kg. This allowed for the evaluation of how total vehicle mass affects performance metrics such as energy efficiency and travel speed.
The third variable, power mode (), represents the motor controller’s output current limitation, which is adjustable through the vehicle’s LCD interface. The selected power levels—N5 (400 W), N7 (500 W), and N9 (600 W)—correspond to specific maximum output current values, as described in [20]. These settings were chosen to simulate different driving conditions and analyze their impact on battery performance.
Simultaneously, three response variables were recorded. Time () refers to the total duration, in hours, that the vehicle remained in motion during each test. Power consumption () quantifies the energy expended under the specific combinations of weight, battery, and power mode. Finally, distance () measures the total distance traveled, expressed in kilometers.
Step 3. Selection of the Experimental Design
Response Surface Methodology (RSM) was selected to evaluate and optimize the performance of the electric vehicle. RSM comprises a set of mathematical and statistical techniques designed to model and improve a response variable influenced by multiple input factors. One of its key advantages lies in its ability to efficiently explore and model complex interactions among variables using second-order polynomial equations.
RSM enables the identification of optimal operating conditions by focusing on regions near local optima, thus avoiding the need for exhaustive experimental runs and reducing time and resource consumption. The resulting models not only offer predictive capability but also facilitate interpretation, providing insights into the relative influence of each factor. This approach supports data-driven decisions aimed at refining the design and enhancing system performance.
Step 4. Conducting the experiment.
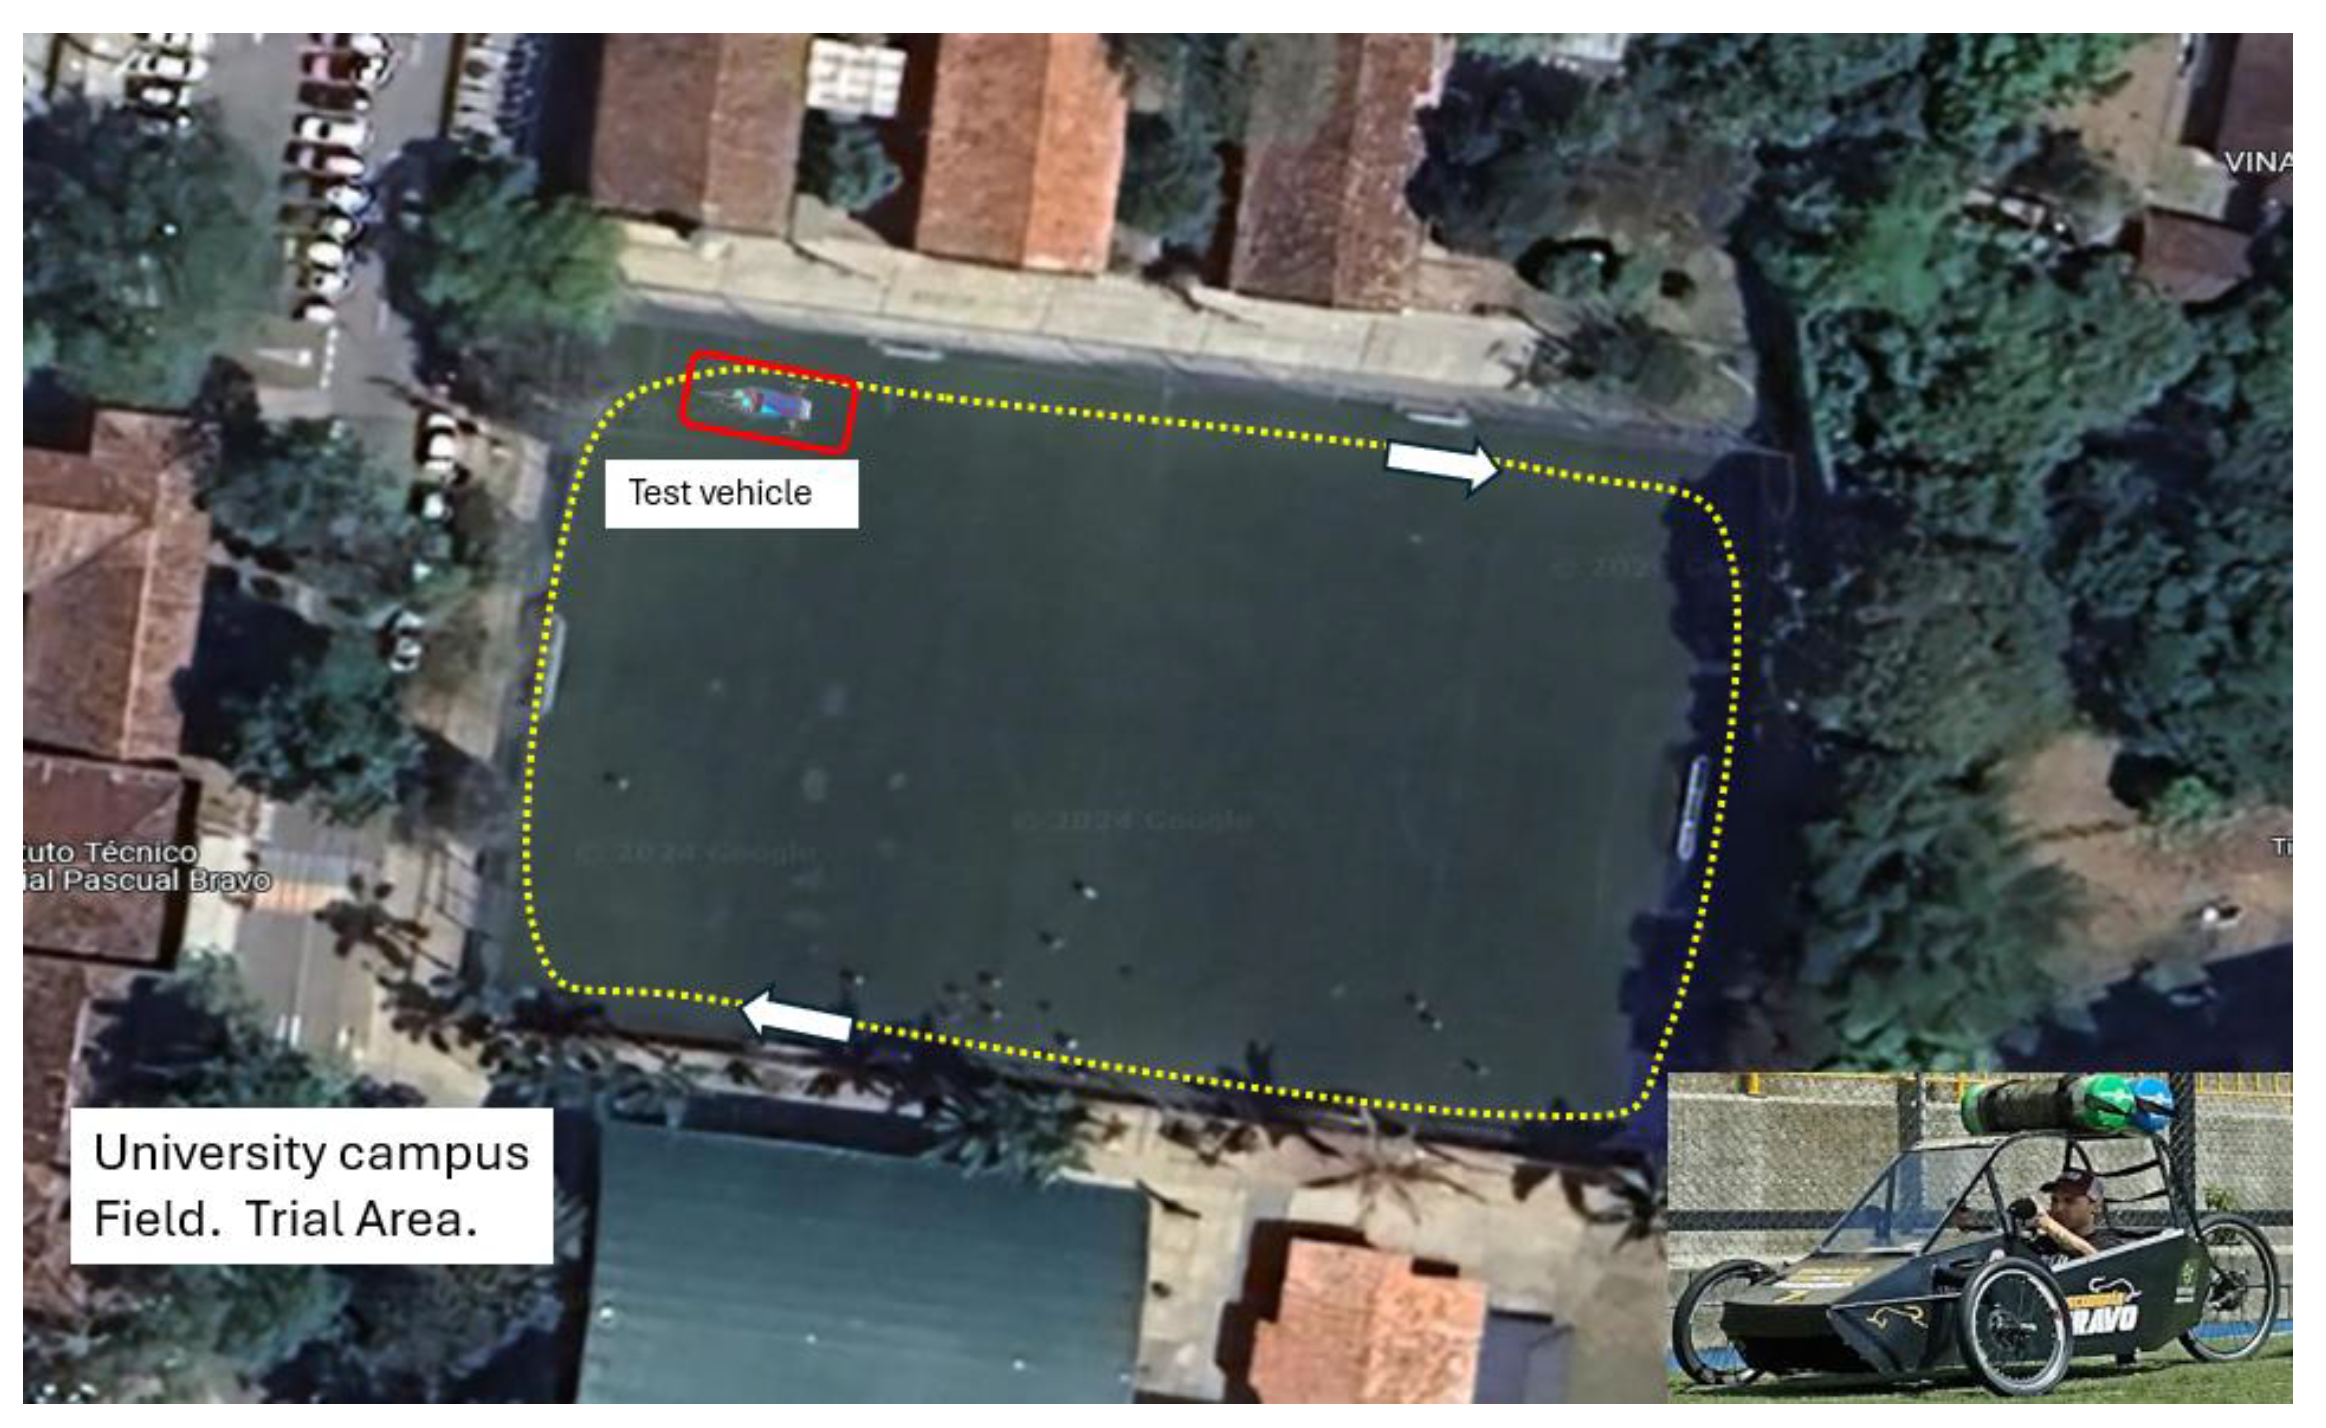
The experiment consisted of 12 randomized runs, covering all combinations of the selected factors, as detailed in the results section. Each run was performed by driving the electric vehicle on the test track illustrated in Figure 2, continuing operation until the battery was fully discharged. The circuit has a total length of 0.241 km, with a surface friction coefficient ranging from 0.5 to 0.7, representing moderate variability in traction conditions.
Figure 2.
Track for vehicle performance testing. Source: Author’s own elaboration
Step 5. Statistical and technical analysis of the data Through a statistical analysis based on a 2x3x3 factorial design and data analysis using response surface methodology, we explored various combinations of batteries, weight, and power. This approach allowed us to identify the optimal operating conditions to maximize time and distance while minimizing consumption. The resulting values, aimed at maximizing electric vehicle efficiency, were derived directly from this detailed analysis. A confidence level of 90% () was established for the study.
Step 6. Conclusions and recommendations To ensure the reliability and effectiveness of the proofs, the vehicle was subjected to a range of operating conditions. The resulting data were evaluated against the previously outlined objectives, allowing for an accurate assessment of the feasibility and coherence of the adopted approach.
All the mathematical and statistical calculations were carried out using RStudio Desktop 4.3.3.
2.2. Data Acquisition and Instrumentation
Several sensors and electronic components were utilized in the project, including the Arduino MEGA 2560 microcontroller, the ACS712 current sensor, the A3144 magnetic Hall effect sensor, LEDs, resistors, and a soldered breadboard. The car’s battery was connected to the Arduino through a current sensor and a voltage divider. A Hall effect magnetic sensor was also attached to measure speed, and an SD card module was connected to log the data. These elements were employed as depicted in the Figure 3.
Figure 3.
low-cost Arduino-Based Data Acquisition (DAQ) prototype.
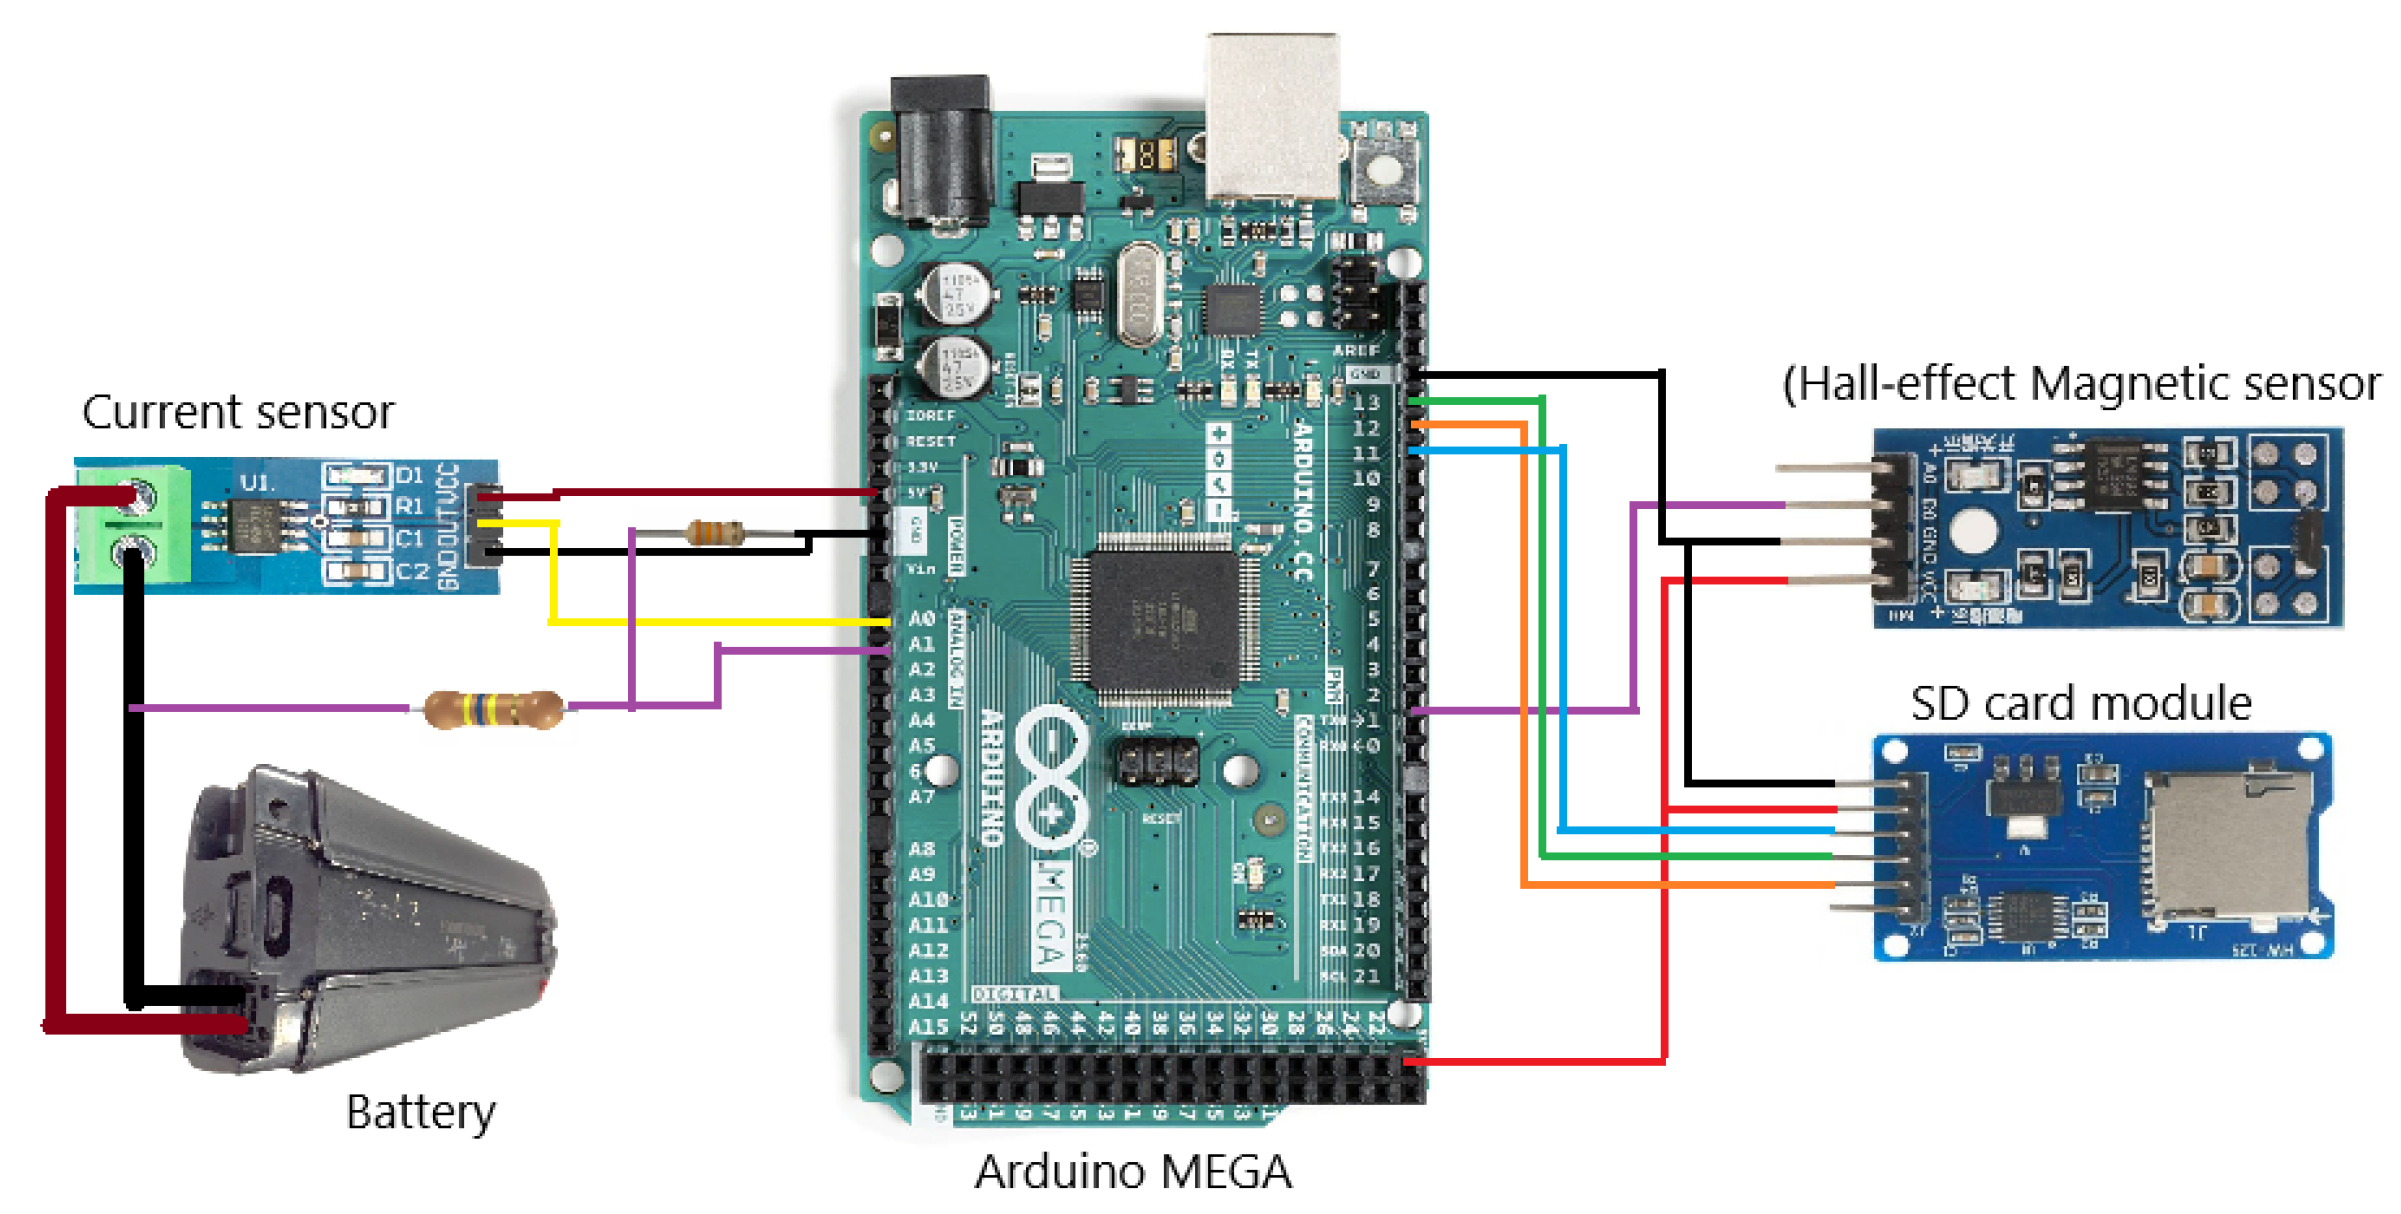
The Arduino MEGA features 54 digital I/O pins (15 for PWM), 16 analog inputs with 10-bit resolution, a 16 MHz quartz crystal, 4 UARTs, a power jack, USB connection, ICSP header, and a reset button. It connects to a computer via USB or can be powered by an ADC adapter or battery. Programming is done through the Arduino IDE via USB, with a bootloader allowing code uploads to the ATmega328 without an external hardware programmer.
The Arduino-Based Low-Cost Data Acquisition (DAQ) prototype was designed and implemented with several key requirements in mind. The prototype is particularly suited for use in academic settings, especially within engineering university programs. The cost-effective components make it accessible to both students and educational institutions. After evaluating various programs, open-source software was selected for its flexibility and usability. The Arduino Integrated Development Environment (IDE) provides the necessary tools for programming specific setups, further enhancing the prototype’s functionality and ease of use [21].
The ACS712 current sensor was used to calculate DC current using the following equation 1:
In this setup, the ADC voltage is calculated using the formula:
. The offset voltage is 2.5 volts, and the sensitivity varies based on the sensor: 66 mV/A for a 30 A sensor, 100 mV/A for a 20 A sensor, or 185 mV/A for a 5 A sensor. Two A3144 magnetic Hall effect sensors are utilized to calculate the distance, as shown in Equation 2, and to determine the speed, as indicated in Equation (1)
2.3. Data Collection
The objective of this methodology is to apply Montgomery’s Design of Experiments (DOE) method to systematically evaluate the performance of a vehicle under various conditions. This structured approach is intended to optimize key parameters, ensuring the repeatability and reliability of the results.
The trials will take place on a synthetic grass field measuring 52 meters by 30 meters. The circuit for the vehicle will be formed within a 3-meter-wide lane between the perimeter fence and the inner side of the field, which will be marked with orange safety cones for guidance. To minimize environmental variability, all tests will be conducted between 12:00 and 12:30 PM.
For the experiment, the vehicle will be equipped with a data acquisition system, powered by two 48V 10Ah Li-ion batteries—one designated for the primary test and the other as a backup in case of any issues. The batteries will be charged using a charger capable of delivering a peak current of 2 amps per hour, with an automatic disconnect feature to prevent overheating due to overcharging. Before each trial, the microSD card in the data acquisition system will be formatted to ensure accurate data recording and prevent data loss or overwriting.
To simulate different weight conditions during the trials, sandbags will be used. These will be added to the vehicle along with the driver’s weight, as required by the experimental design.
In this study, the primary factors that will be varied include the battery voltage, vehicle weight (comprising the driver’s weight and additional sandbags), and the power level setting on the vehicle. These factors are selected as they are believed to significantly influence the vehicle’s performance, measured in terms of speed, acceleration, and energy consumption.
A factorial design, specifically a design where k represents the number of factors, will be employed to explore the effects and interactions between these variables. The order of the trials will be randomized to mitigate the influence of any uncontrolled factors, and each condition will be replicated at least three times to ensure the statistical reliability of the results.
Each day’s experimental run will be planned the day before, following the DOE schedule. This preparation includes verifying the status of the batteries and ensuring that the required sandbags are ready for use. On the day of the experiment, the vehicle will be transported to the test site, where it will undergo a thorough mechanical and visual inspection. The driver, who will remain consistent throughout the trials to maintain uniform driving conditions, will then enter the vehicle, and the appropriate weights will be added.
With the data acquisition system activated, the vehicle will be put through a series of tests according to the pre-determined experimental conditions. After each run, the collected data will be securely stored for further analysis.
The data collected from the trials will be processed using statistical software to evaluate the impact of each factor and their interactions on the vehicle’s performance. An Analysis of Variance (ANOVA) will be conducted to determine the statistical significance of the results. If necessary, response surface methodology (RSM) will be employed to refine the experimental outcomes and identify the optimal combination of factors that enhance vehicle performance.
By following this comprehensive methodology based on Montgomery’s Design of Experiments, the study aims to produce reliable and actionable insights into the key factors affecting vehicle performance. This systematic approach will not only guide future improvements but also ensure that the testing process is repeatable and the results are valid, contributing to the overall success of the experimental trials.
2.4. Data Cleaning
Data cleaning was a critical step to ensure the accuracy and reliability of the experimental data used in response surface methodology (RSM) analysis. The raw data obtained from each test run of the electric vehicle Furtivo II were initially inspected to validate the completeness and consistency of key parameters, including voltage, current, speed, distance, and time. Inconsistent or missing values were identified and, where necessary, the tests were repeated under the same experimental conditions to preserve data integrity.
Outliers caused by measurement errors or unexpected disturbances during the tests were addressed using statistical techniques such as Z-scores and the interquartile range (IQR). Any data point significantly deviating from expected trends was flagged and evaluated. Trials with substantial anomalies were rerun to ensure the robustness of the data set.
Following validation, several performance metrics were calculated. Total energy consumption was calculated in ampere hours (Ah) by integrating the current over time and in kilowatt hours (kWh) by integrating the product of voltage and current. The distance traveled was converted to kilometers and the average power and average speed were derived to support the analysis of vehicle performance. These variables derived, total time, total distance and efficiency expressed as km / Ah and km / kWh, were used as response variables in the optimization models.
To enable comparative analysis across all test conditions, the data was standardized and synchronized. Codification was applied to the input factors (battery type, pilot weight, and driving mode) according to the central composite design framework. A final validation step confirmed the consistency of the cleaned data set with the experimental logbooks before proceeding with the fitting of first- and second-order RSM models and the search for optimal operating conditions.
2.5. RSM and DFA Analysis
The process of determining the optimal operating conditions for the vehicle starts with the experimental design outlined in Section 2.1. Following this, Response Surface Methodology (RSM) models are fitted and validated using analysis of variance (ANOVA). Subsequently, surface and contour plots are generated to visualize the response surfaces for each variable. Each response is individually optimized using either a steepest descent (for minimization) or ascent (for maximization) algorithm to identify the optimal performance zone. To pinpoint global optima, contour plots from the response surfaces are overlaid, integrating individual contours into a unified visualization.
The modeling process involves estimating a polynomial of first order or higher, typically using the ordinary least squares method. This approach is used to develop a second-order model on a response surface represented by the equation 4 and the experimental design is shown in Table 1.
where:
- : are the response variables Time, Consumption and Distance,
- : are the factors Battery, Weight and Power,
- : is the intercept,
- : is the effect of each factor over every response variable ,
-
is the effect of the interaction between and and,is the error therm.

Table 1.
Variables and levels for the experimental design
| Variable | Level values | ||
|---|---|---|---|
| Low (-1) | High (+1) | Central point (0) | |
| Battery | 1 | 2 | |
| Weight | 66 | 86 | 76 |
| Mode | 5 | 9 | 7 |
3. Results and Discussion
3.1. Data Acquisition and Instrumentation
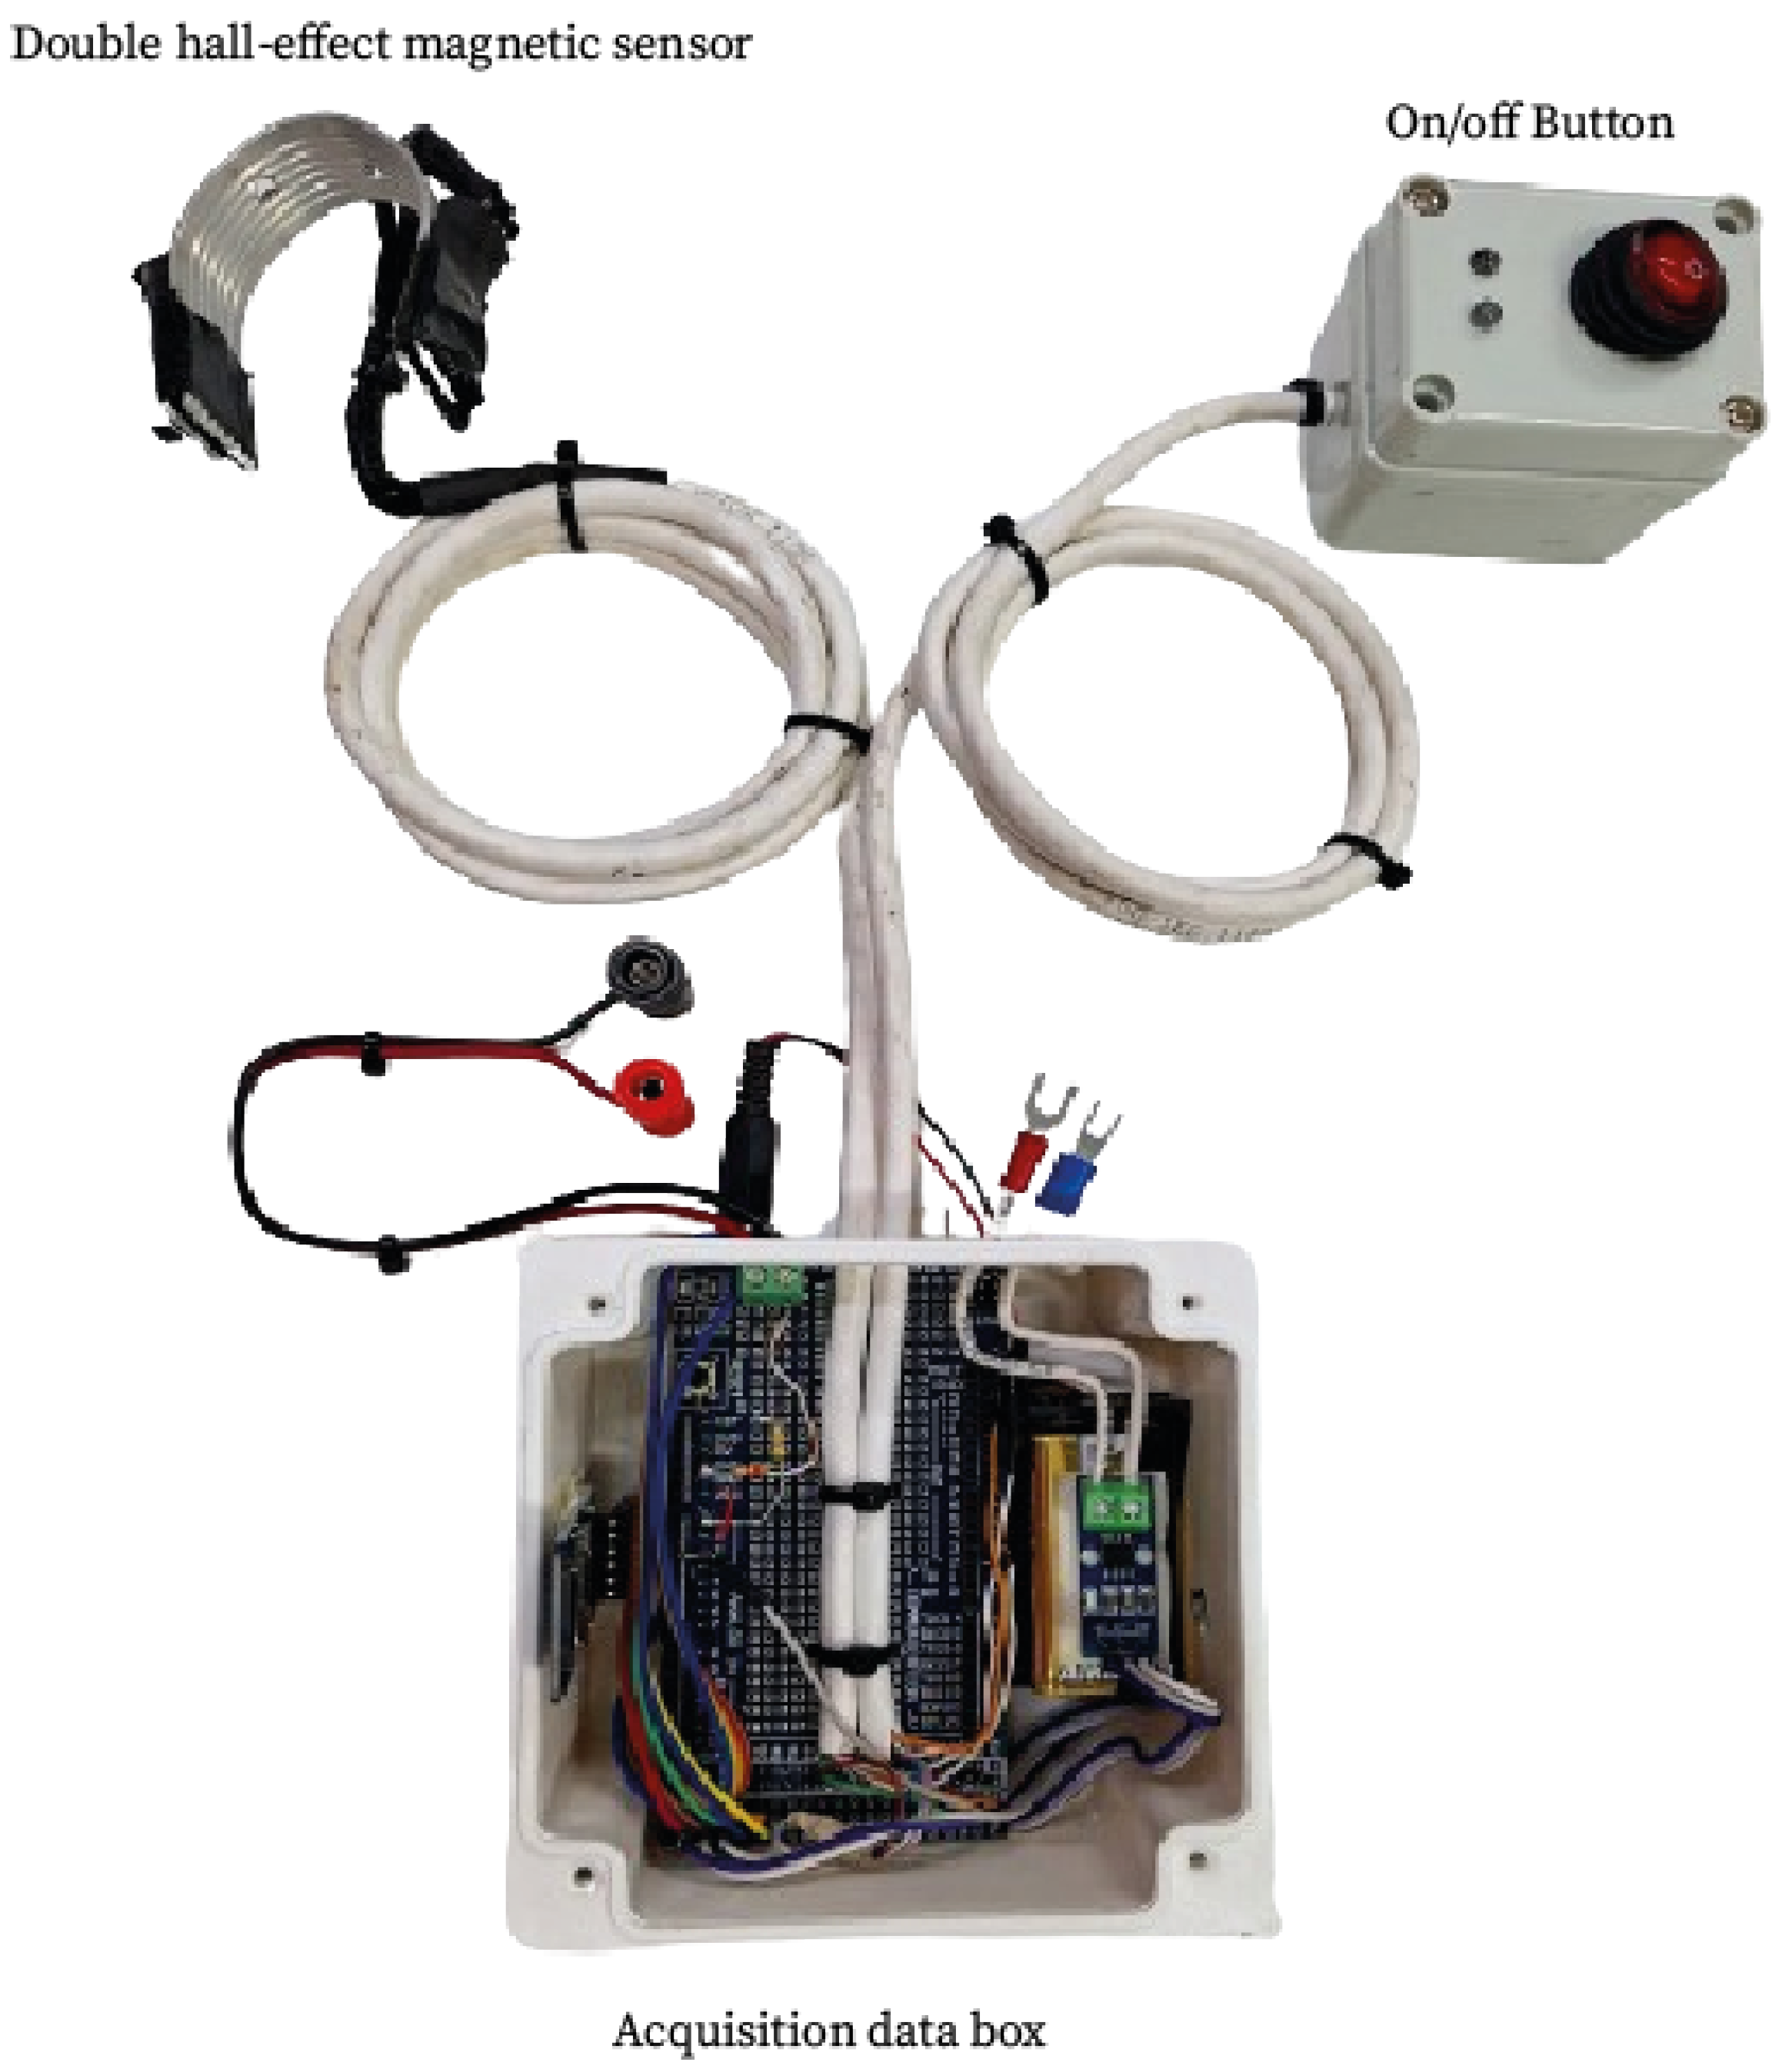
The acquisition and recording of data were carried out with a system designed to endure various tests and weather conditions. Two Hall effect sensors were installed on a horseshoe-type support connected to one of the front tires. An on/off system was implemented to control the acquisition device, and a protective box was used to isolate the Arduino and the current sensor from external elements. The device is powered by a 9-volt battery, as are the sensors, to prevent any additional consumption that could affect the system’s efficiency.
In the analog input A0, a resistor array is installed to create a voltage divider, reducing the input voltage from 100 volts to 5 volts, as the board can only read external voltages up to 5 volts. Consequently, when the system receives a voltage greater than 5 volts, the divider reduces this voltage to a proportional value suitable for the input. The analog input A2 is connected to the ACS712 current module, which measures the current passing through a serial array. Digital pin 2 monitors the number of interrupts that occur in the HIGH state of the pin. This setup is used to measure the revolutions per minute of the wheel. Similarly, digital pin 3 is used to measure the displacement of the wheel that drives the vehicle’s traction. Pin 8 serves as a visual indicator for the status of the micro SD memory, with the blue LED lighting up (HIGH) when the memory is recording and turning off (LOW) when recording stops. Digital pin 9 is used as a visual indicator to show that the data acquisition board is connected.as shown in Figure 4.
Figure 4.
low-cost Arduino-Based Data Acquisition (DAQ) prototype.
The data is stored in a micro SD reader module, with variables such as voltage, current, power, revolutions per minute, vehicle speed in km/h, distance traveled in meters and kilometers, and the time stamp recorded for efficiency analysis. Distance and speed data were calculated using the sampling time and Hall effect sensor, while consumption data were derived from current and voltage measurements.
These tests were performed by students under the supervision of a teacher, following a pre-established experimental design. The DAQ design demonstrated reliability when compared to a commercial controller system, acquiring the same variables with consistent accuracy,
3.2. Data Collection
For the development of the test, a synthetic grass field measuring 52 m by 30 m was used as the track. The field was marked with orange safety cones, and the circuit used was the 3 m lane formed between the perimeter fence of the field and its inner side. Efforts were made to conduct all tests between 12:00 and 12:30 in the afternoon. The experimental run scheduled for that day was established the day before, taking into account the experimental design developed for the tests.
Some conditions for the test were prepared the day before, including the inspection of the two 48V 10Ah Li-ion batteries, one required for the selected test the following day and the other as a backup in case the initial test encountered issues. The condition of the 9V battery used to power the data acquisition system was also verified. If any of the batteries showed a voltage different from the optimal nominal value for the test, it was charged.
The battery charger for the tests provides a peak current of 2 amps per hour and is capable of assessing the total remaining charge and disconnecting when necessary to prevent overheating due to overcharging.
The microSD card for data acquisition should preferably be formatted before each test to ensure that data is saved correctly before each run, preventing data loss or overwriting. The microSD card is left installed in the device.
On the day of the experimental run, the vehicle was transported from its storage location, where it was kept in conditions avoiding high humidity and dust, to the field. Once there, the vehicle was placed in the middle of the “oval,” and a general mechanical and visual inspection of the steering, brakes, Hall effect sensors, and tire pressure was performed. To ensure uniformity in the development of each test, the same driver was used so that their driving skills and flaws would be consistent across all runs. As three different weights were required, the first weight corresponded to the driver’s own weight, while weights 2 and 3 were supplemented by adding one or two sandbags of the missing weight inside the vehicle. Therefore, the sandbags of the appropriate weight had to be ready before starting the experimental run for that day. After the inspection, the driver entered the vehicle and waited for the batteries to be connected in their respective compartments. It was checked that both were switched to the ON position, the microSD card was inserted, and it was verified that the two mushroom-type switches in series with the power were in the NC (normally closed) position. The SW900 information screen was then turned on, and once it was on, the setup was accessed to program the power level to be used. After exiting the setup, the programming was ready, and the brakes were engaged, and an attempt to accelerate was made to verify that the brake sensors were active and the vehicle did not attempt to move. This procedure was repeated by alternating each brake individually. If everything was correct, the vehicle should not try to move from its starting point and would be ready to start. Finally, the data acquisition module was activated by a switch with two LED lights located within the driver’s reach, who would ensure that both the power LED and the microSD card status LED were illuminated.
3.3. Data Cleaning
The initial step in the cleaning process involved consolidating the raw experimental outputs from each trial into a unified dataset. Each record was labeled with an identifier corresponding to its respective test (EXPERIMENT) to preserve traceability across conditions. A filtering process was then applied to remove any rows with missing values in critical variables such as battery type, pilot weight, power mode, elapsed time, distance traveled, and energy consumption. This ensured a complete and analyzable structure for each experimental run. Additionally, appropriate data types were assigned to all variables based on their nature (categorical or numerical), and consistency checks were implemented to detect out-of-range values or acquisition errors originating from the vehicle’s telemetry system.
Once the dataset was structured and validated, specific calculations were performed to derive the core performance metrics. These included the total duration of each test expressed in hours (total_time_hours), the cumulative distance covered in kilometers (total_distance_km), and the total energy consumed in kilowatt-hours (energy_consumed_kwh).
In addition, two further metrics were calculated to characterize battery usage and efficiency. The energy consumed in ampere-hours (energy_consumed_ah) was obtained as the sum of the instantaneous current multiplied by the corresponding time interval and divided by 3600, to convert seconds into hours:
The energy efficiency in kilometers per ampere-hour (efficiency_km_per_ah) was then computed as:
Analogously, the energy consumed in kilowatt-hours was calculated based on the instantaneous power readings and used to derive the efficiency in kilometers per kilowatt-hour (efficiency_km_per_kwh). These derived metrics allowed for a more detailed evaluation of the vehicle’s energy behavior under different test conditions and were instrumental in enabling accurate comparison and subsequent optimization within the multi-factorial experimental design.
3.4. RSM and DFA Analysis
The previously described experimental methodology was implemented using response surface methodology (RSM), following a structured approach. Initially, the factors influencing the response variables were identified, and the corresponding experiments were conducted. In the subsequent stage, the optimal values for each response variable were determined. A tailored RSM design was developed to maximize operational time (), distance traveled (), and energy efficiency in kilometers per ampere-hour (: km/Ah), using the steepest ascent technique. The consolidated data presented in Table 2 summarize the outcomes obtained for each combination of factors and include additional performance indicators such as mean power and energy consumed in ampere-hours (Ah), enabling a more comprehensive analysis of the vehicle’s behavior under varying experimental conditions.
Notably, the experiment recorded a maximum operational time of 1.12 hours, a maximum distance of 24.63 km, and a peak efficiency of 2.82 km/Ah, all achieved under the conditions of Trial E5. Likewise, the minimum energy consumption was recorded at 6.98 Ah in Trial E1. Additionally, to validate the optimal points identified through RSM, the desirability function approach was applied as a complementary technique. This allowed for the simultaneous evaluation of multiple objectives, reinforcing the reliability of the proposed solution and ensuring a balanced optimization between performance, autonomy, and energy efficiency of the electric racing vehicle.
Table 2.
Data collected
| Experiment | Battery | Weight (Kg) |
Mode | Time (h) |
Mean Power (W) |
Distance (km) |
Mean Speed (km/h) |
Energy Consumed (Ah) |
Efficiency (km/Ah) |
|---|---|---|---|---|---|---|---|---|---|
| E1 | 2 | 76 | 9 | 0.61 | 568.49 | 13.91 | 22.92 | 6.98 | 1.99 |
| E2 | 2 | 76 | 9 | 0.72 | 529.76 | 16.14 | 22.42 | 8.60 | 1.88 |
| E3 | 2 | 76 | 7 | 0.78 | 462.83 | 17.56 | 22.54 | 8.17 | 2.15 |
| E4 | 1 | 76 | 7 | 0.71 | 528.16 | 17.62 | 22.44 | 9.33 | 1.89 |
| E5 | 1 | 66 | 5 | 1.12 | 361.69 | 24.63 | 22.09 | 8.73 | 2.82 |
| E6 | 1 | 66 | 7 | 0.79 | 449.95 | 19.81 | 25.01 | 7.57 | 2.62 |
| E7 | 1 | 76 | 5 | 0.99 | 363.49 | 21.34 | 21.58 | 7.88 | 2.70 |
| E8 | 1 | 86 | 5 | 0.94 | 402.57 | 20.41 | 21.76 | 8.19 | 2.49 |
| E9 | 1 | 86 | 9 | 0.72 | 544.83 | 16.48 | 22.74 | 8.75 | 1.88 |
| E10 | 2 | 66 | 5 | 1.08 | 356.25 | 23.45 | 21.65 | 8.44 | 2.78 |
| E11 | 2 | 86 | 9 | 0.86 | 495.86 | 18.37 | 21.48 | 9.69 | 1.90 |
| E12 | 2 | 66 | 7 | 0.90 | 422.77 | 21.09 | 23.40 | 8.34 | 2.53 |
| Mean | 0.86 | 457.22 | 19.23 | 22.50 | 8.39 | 2.302 |
To perform the response surface analysis, the input variables were codified using the standard transformation , which centers and scales each factor around its midpoint. Specifically, battery type () was coded as , pilot weight () as , and power mode () as . This transformation ensures that all input factors are scaled to a comparable range and centered around zero, facilitating the fitting of second-order polynomial models. The codified dataset, used as input for the response surface modeling process, is summarized in Table 3.
Table 3.
Data codified
| Experiment | x1 | x2 | x3 | y1 | y2 | y3 |
|---|---|---|---|---|---|---|
| E1 | 1 | 0.08 | 1 | 0.61 | 13.91 | 6.98 |
| E2 | 1 | 0.08 | 1 | 0.72 | 16.14 | 8.60 |
| E3 | 1 | 0.08 | 0 | 0.78 | 17.56 | 8.17 |
| E4 | -1 | 0.08 | 0 | 0.71 | 17.62 | 9.33 |
| E5 | -1 | -0.92 | -1 | 1.12 | 24.63 | 8.73 |
| E6 | -1 | -0.92 | 1 | 0.79 | 19.81 | 7.57 |
| E7 | -1 | 0.08 | -1 | 0.99 | 21.34 | 7.88 |
| E8 | -1 | 1.08 | -1 | 0.94 | 20.41 | 8.19 |
| E9 | -1 | 1.08 | 1 | 0.72 | 16.48 | 8.75 |
| E10 | 1 | -0.92 | -1 | 1.08 | 23.45 | 8.44 |
| E11 | 1 | 1.08 | 1 | 0.86 | 18.37 | 9.69 |
| E12 | 1 | -0.92 | 0 | 0.90 | 21.09 | 8.34 |
This article introduces a method for identifying the optimal configuration for multiparameter optimization, aiming to maximize time, distance, and energy efficiency. The approach is based on a 2×3×3 factorial design involving three factors: Battery (), Weight (), and Power Mode (), and employs response surface methodology (RSM) to model the system’s behavior.
The factor Mode () was found to be statistically significant for the response variable total_time_hours, with a p-value below the 0.01 threshold. While Weight () was not significant on its own, its interaction with Mode () showed a significant effect ().
After evaluating four candidate models—first-order (FO), first-order with two-way interactions (FO + TWI), full second-order (SO), and a combined model with principal and quadratic effects on selected factors (FO + PQ(, ))—the FO + TWI model was selected as the optimal specification for the response variable total_time_hours. This model balances statistical accuracy with numerical stability and interpretability, avoiding issues of coefficient aliasing present in the full second-order model.
The decision is supported by the model’s statistical performance: an adjusted of 0.842 and a global p-value of 0.0098 indicate strong explanatory power. Furthermore, the power mode () was statistically significant (), and the interaction between weight and mode () was also significant (). These findings validate the inclusion of interaction terms in the model, supporting its use in response surface optimization and canonical analysis.
Table 4.
Estimated coefficients and model fit statistics for the selected model (FO + TWI) for total_time_hours
Table 4.
Estimated coefficients and model fit statistics for the selected model (FO + TWI) for total_time_hours
| Term | Estimate | Std. Error | p-value |
|---|---|---|---|
| Intercept | 0.8062 | 0.0287 | <0.001 *** |
| 0.0137 | 0.0219 | 0.5582 | |
| 0.0030 | 0.0325 | 0.9302 | |
| -0.1837 | 0.0309 | 0.0019 ** | |
| -0.0242 | 0.0379 | 0.5514 | |
| 0.0489 | 0.0386 | 0.2608 | |
| 0.1316 | 0.0390 | 0.0198 * | |
| Model statistics: | |||
| Multiple R-squared | 0.9282 | ||
| Adjusted R-squared | 0.8420 | ||
| F-statistic (df = 6, 5) | 10.77 | ||
| Model p-value | 0.0098 | ||
Note: Significance codes: ***, ** , *
Following the comparative evaluation of four candidate models for the response variable total_distance_km, the model combining first-order effects with quadratic terms for pilot weight and power mode (FO + PQ(, )) was selected as the most appropriate specification. While the full second-order model exhibited a slightly higher adjusted (0.8951), it suffered from aliasing issues that precluded reliable canonical analysis and optimal path tracing. In contrast, the FO + PQ model offered a robust balance between statistical accuracy and model simplicity, achieving an adjusted of 0.8346 and a global p-value of 0.0043.
Crucially, the quadratic effect of pilot weight () was statistically significant (), confirming the presence of nonlinearity in the response surface. The inclusion of curvature improves the model’s ability to capture relevant behavioral patterns of the system, without overfitting or compromising interpretability. These findings support the selection of the FO + PQ model for analyzing the factors that influence the vehicle’s travel distance, and for optimizing performance within the response surface methodology (RSM) framework.
Table 5.
Estimated coefficients and model fit statistics for the selected model (FO + PQ(, )) for total_distance_km
Table 5.
Estimated coefficients and model fit statistics for the selected model (FO + PQ(, )) for total_distance_km
| Term | Estimate | Std. Error | p-value |
|---|---|---|---|
| Intercept | 17.4903 | 0.7748 | <0.001 *** |
| 0.1303 | 0.4364 | 0.7754 | |
| -1.3822 | 0.6306 | 0.0709 . | |
| -2.5223 | 0.5868 | 0.0051 ** | |
| 2.2512 | 0.7774 | 0.0275 * | |
| 0.6693 | 0.8853 | 0.4783 | |
| Model statistics: | |||
| Multiple R-squared | 0.9098 | ||
| Adjusted R-squared | 0.8346 | ||
| F-statistic (df = 5, 6) | 12.1 | ||
| Model p-value | 0.0043 | ||
Note: Significance codes: *** , ** , * , .
For the response variable , corresponding to the vehicle’s energy efficiency measured in kilometers per ampere-hour (km/Ah), four candidate models were evaluated: the first-order (FO), the first-order with two-way interactions (FO + TWI), the full second-order (SO), and a reduced second-order model including principal effects and quadratic terms for selected factors (FO + PQ(, )). Although the full SO model showed a high unadjusted (0.9349), it suffered from multicollinearity and aliasing issues, limiting its applicability for canonical analysis and numerical optimization.
After evaluating performance and interpretability, the FO + PQ(, ) model was selected as the most appropriate specification for modeling , as shown in Table 6. This model attained the highest adjusted (0.8553) among all valid specifications, with a statistically significant overall fit (). Notably, both the Weight () and Power Mode () factors had significant effects ( and , respectively), reinforcing the relevance of these variables. The inclusion of curvature through quadratic terms improved model accuracy without introducing singularities, enabling a valid canonical analysis and identification of a stationary point. This makes the FO + PQ(, ) model particularly suitable for optimizing vehicle energy efficiency under the response surface methodology (RSM) framework.
Table 6.
Estimated coefficients and model fit statistics for the selected FO + PQ(, ) model for efficiency_km_per_ah
Table 6.
Estimated coefficients and model fit statistics for the selected FO + PQ(, ) model for efficiency_km_per_ah
| Term | Estimate | Std. Error | p-value |
|---|---|---|---|
| Intercept | 2.1302 | 0.0897 | <0.001 |
| -0.0052 | 0.0506 | 0.9211 | |
| -0.2329 | 0.0730 | 0.0189 * | |
| -0.2938 | 0.0680 | 0.0050 ** | |
| 0.1626 | 0.0900 | 0.1210 | |
| 0.1178 | 0.1025 | 0.2942 | |
| Model statistics: | |||
| Multiple R-squared | 0.9211 | ||
| Adjusted R-squared | 0.8553 | ||
| F-statistic (df = 5, 6) | 14.00 | ||
| Model p-value | 0.0029 | ||
Note: Significance codes: *** , ** , *
The ANOVA results, summarized in Table 7, were used to validate the statistical significance and predictive capacity of the selected models for each response variable. For operational time (total_time_hours), the first-order model with two-way interactions (FO + TWI) provided the best trade-off between model complexity and interpretability, showing statistically significant main effects, a high adjusted of 0.842, and a global model p-value of 0.0098.
In contrast, for distance traveled (total_distance_km) and energy efficiency (efficiency_km_per_ah), the models that combined first-order terms with quadratic effects in weight and power mode (FO + PQ()) were selected. These models captured relevant nonlinearities without coefficient aliasing, enabling the application of canonical analysis. Both models showed strong explanatory power, with adjusted values of 0.8346 and 0.8553, respectively, and global p-values below 0.005. The significance of the quadratic term in the distance model () further validated the presence of curvature in the response surface.
Table 7.
ANOVA for the selected models for each response variable
| Effect | Df (Time) | F (Time) | Df (Distance) | F (Distance) | Df (Efficiency) | F (Efficiency) |
|---|---|---|---|---|---|---|
| FO(, , ) | 3 | 17.09 | 3 | 16.86 | 3 | 21.55 |
| TWI(, , ) | 3 | 4.45 | — | — | — | — |
| PQ(, ) | — | — | 2 | 4.95 | 2 | 2.69 |
| Residuals | 5 | — | 6 | — | 6 | — |
| p-value (FO) | 0.0046 ** | 0.0025 ** | 0.0013 ** | |||
| p-value (TWI) | 0.0709 . | — | — | |||
| p-value (PQ) | — | 0.0536 . | 0.1465 |
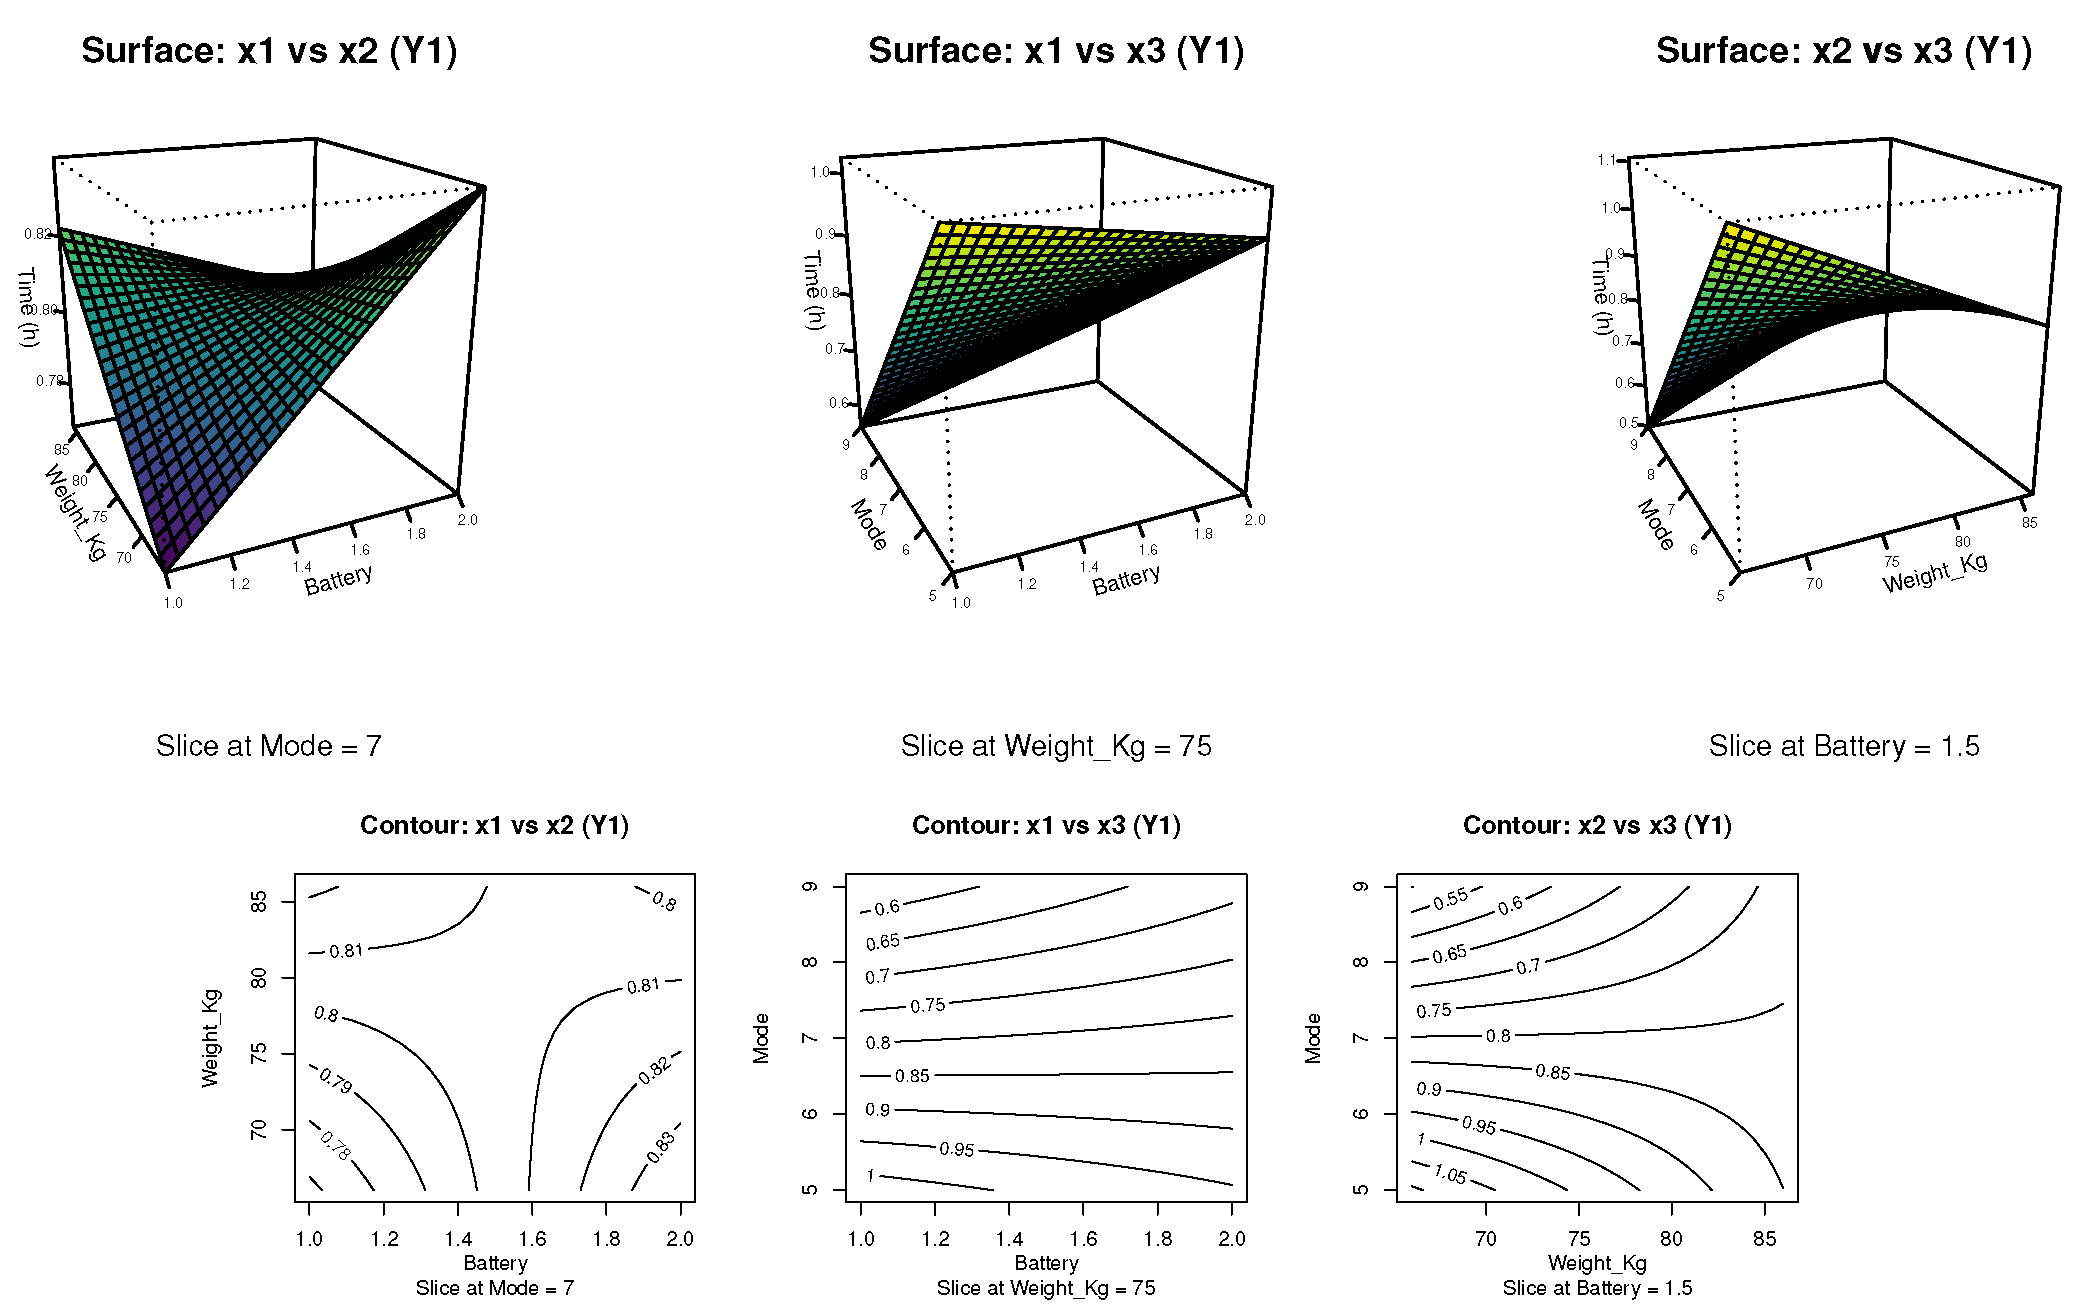
Figure 5 presents the two-dimensional (2D) contour plots and three-dimensional (3D) surface graphs derived from the selected FO + TWI model for the response variable (operational time). These visualizations illustrate how combinations of battery type (), pilot weight (), and power mode () influence vehicle endurance. The 2D contour plots reveal several trends: at a fixed power mode (N7), operational time increases modestly as pilot weight decreases, particularly with intermediate battery types; at a constant weight of 75 kg, operational time declines with increasing power mode, showing a clear advantage in favor of low-power configurations (e.g., N5); and, when holding the battery constant at a midrange value (), longer operational times are concentrated in the low-weight, low-power region, suggesting an interaction effect between and .
The 3D response surfaces confirm these patterns by highlighting a clearly defined optimal zone: maximum operational time is achieved when the pilot weight is minimized (66 kg) and the power mode is set to N5. Among the three factors, the power mode () exerts the most substantial influence on the response, as evidenced by the steeper gradients along that axis. The effect of pilot weight, although less pronounced, remains consistent with the direction of maximum ascent identified in the RSM optimization. Additionally, the overall smooth and gently curved surfaces indicate the absence of significant second-order effects, supporting the adequacy of the FO + TWI model in capturing the response behavior without requiring quadratic terms. These graphical insights not only validate the statistical model but also offer practical guidance for configuring the vehicle to extend its operational autonomy under energy-conserving conditions.
Figure 5.
Response surface and contour plots for the response variable (operational time), based on the FO + TWI model. Source: Author’s own elaboration
Figure 5.
Response surface and contour plots for the response variable (operational time), based on the FO + TWI model. Source: Author’s own elaboration
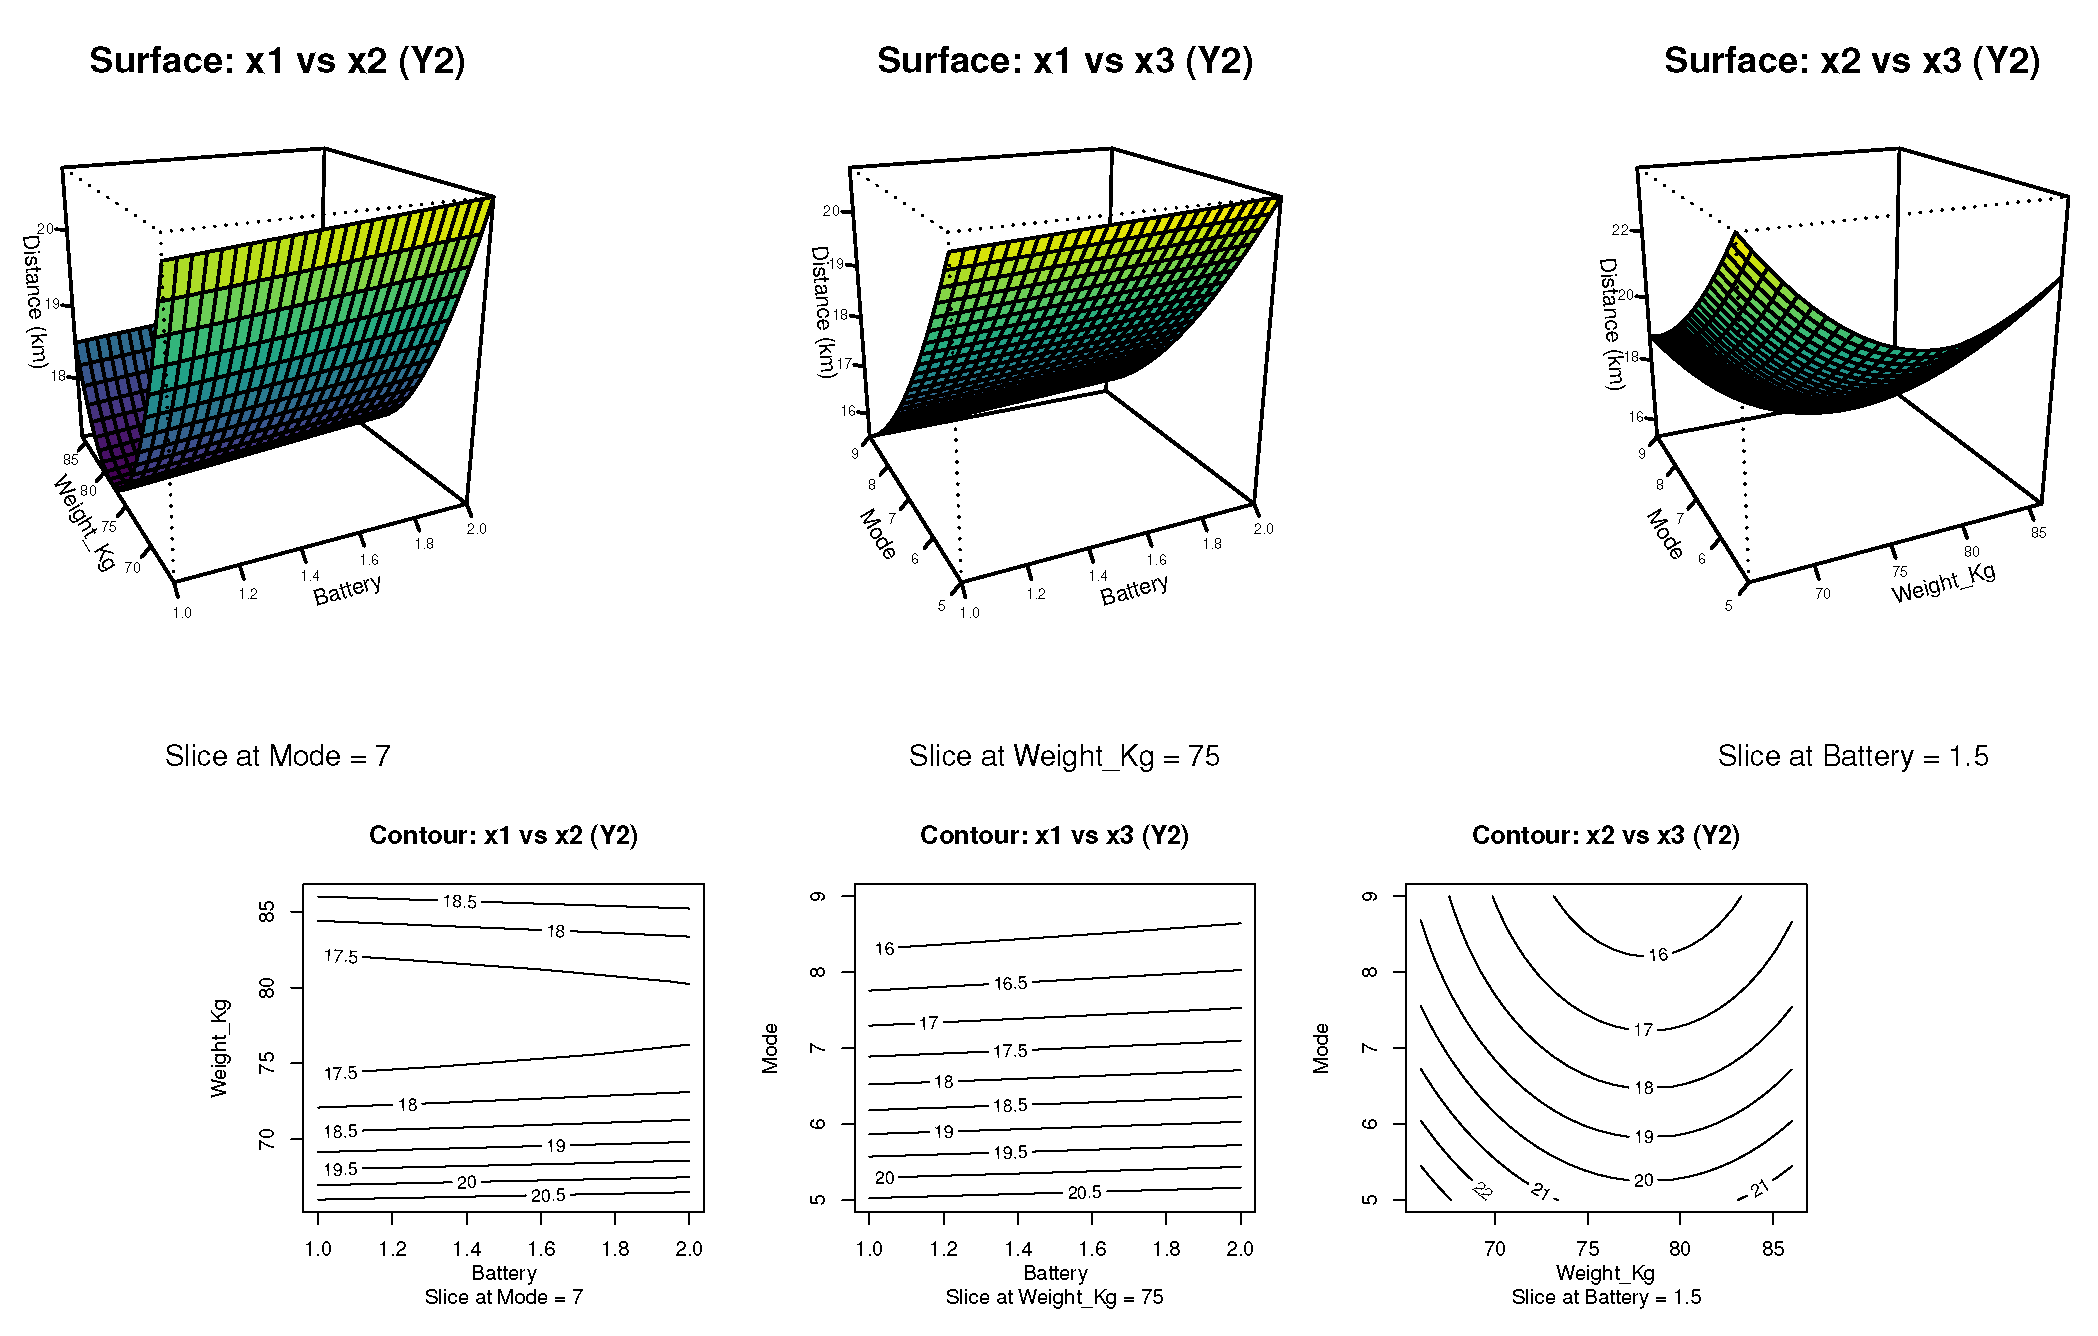
The graphical analysis presented in Figure 6 corresponds to the response surface and contour plots derived from the selected FO + PQ() model for the variable (distance traveled). In the contour plots, it is evident that maximum distances are achieved at low pilot weights and low power modes (N5), with intermediate to high battery types. Specifically, in the vs projection, operational modes held constant at N7 reveal increased distances with lighter pilots and higher-capacity batteries. The vs plot, with fixed weight (75 kg), confirms that increased power mode reduces travel range. The vs plot clearly shows a curved interaction, justifying the inclusion of quadratic terms.
The 3D surface plots reaffirm the trends observed in the contours and highlight the non-linear nature of the response. Particularly, the curved surface along the and axes illustrates a quadratic interaction that impacts the distance outcome. The optimal zone is confirmed to be located in the region combining a light pilot (66 kg), low power mode (N5), and a battery type close to 2.0. These visual insights validate the model selection and guide decision-making for maximizing distance performance in electric vehicle operation.
Figure 6.
Response surface and contour plots for the response variable (distance traveled), based on the FO + PQ() model. Source: Author’s own elaboration
Figure 6.
Response surface and contour plots for the response variable (distance traveled), based on the FO + PQ() model. Source: Author’s own elaboration
The figures present the 2D contour and 3D surface plots for the response variable , which represents the energy efficiency of the electric vehicle in km/Ah. These plots were generated based on the selected FO + PQ() model and allow for the visualization of interactions among battery type (), pilot weight (), and power mode ().
The contour plots reveal that maximum efficiency is achieved with lower pilot weights (66 kg) and conservative power settings (mode 5). The surface plots reinforce this finding by displaying increasing efficiency gradients in those regions. These visualizations support the use of this model to identify optimal zones for energy-saving operation strategies in electric vehicles.
Figure 7.
Response surface and contour plots for the variable (energy efficiency), based on the FO + PQ() model. Source: Author’s own elaboration
Figure 7.
Response surface and contour plots for the variable (energy efficiency), based on the FO + PQ() model. Source: Author’s own elaboration
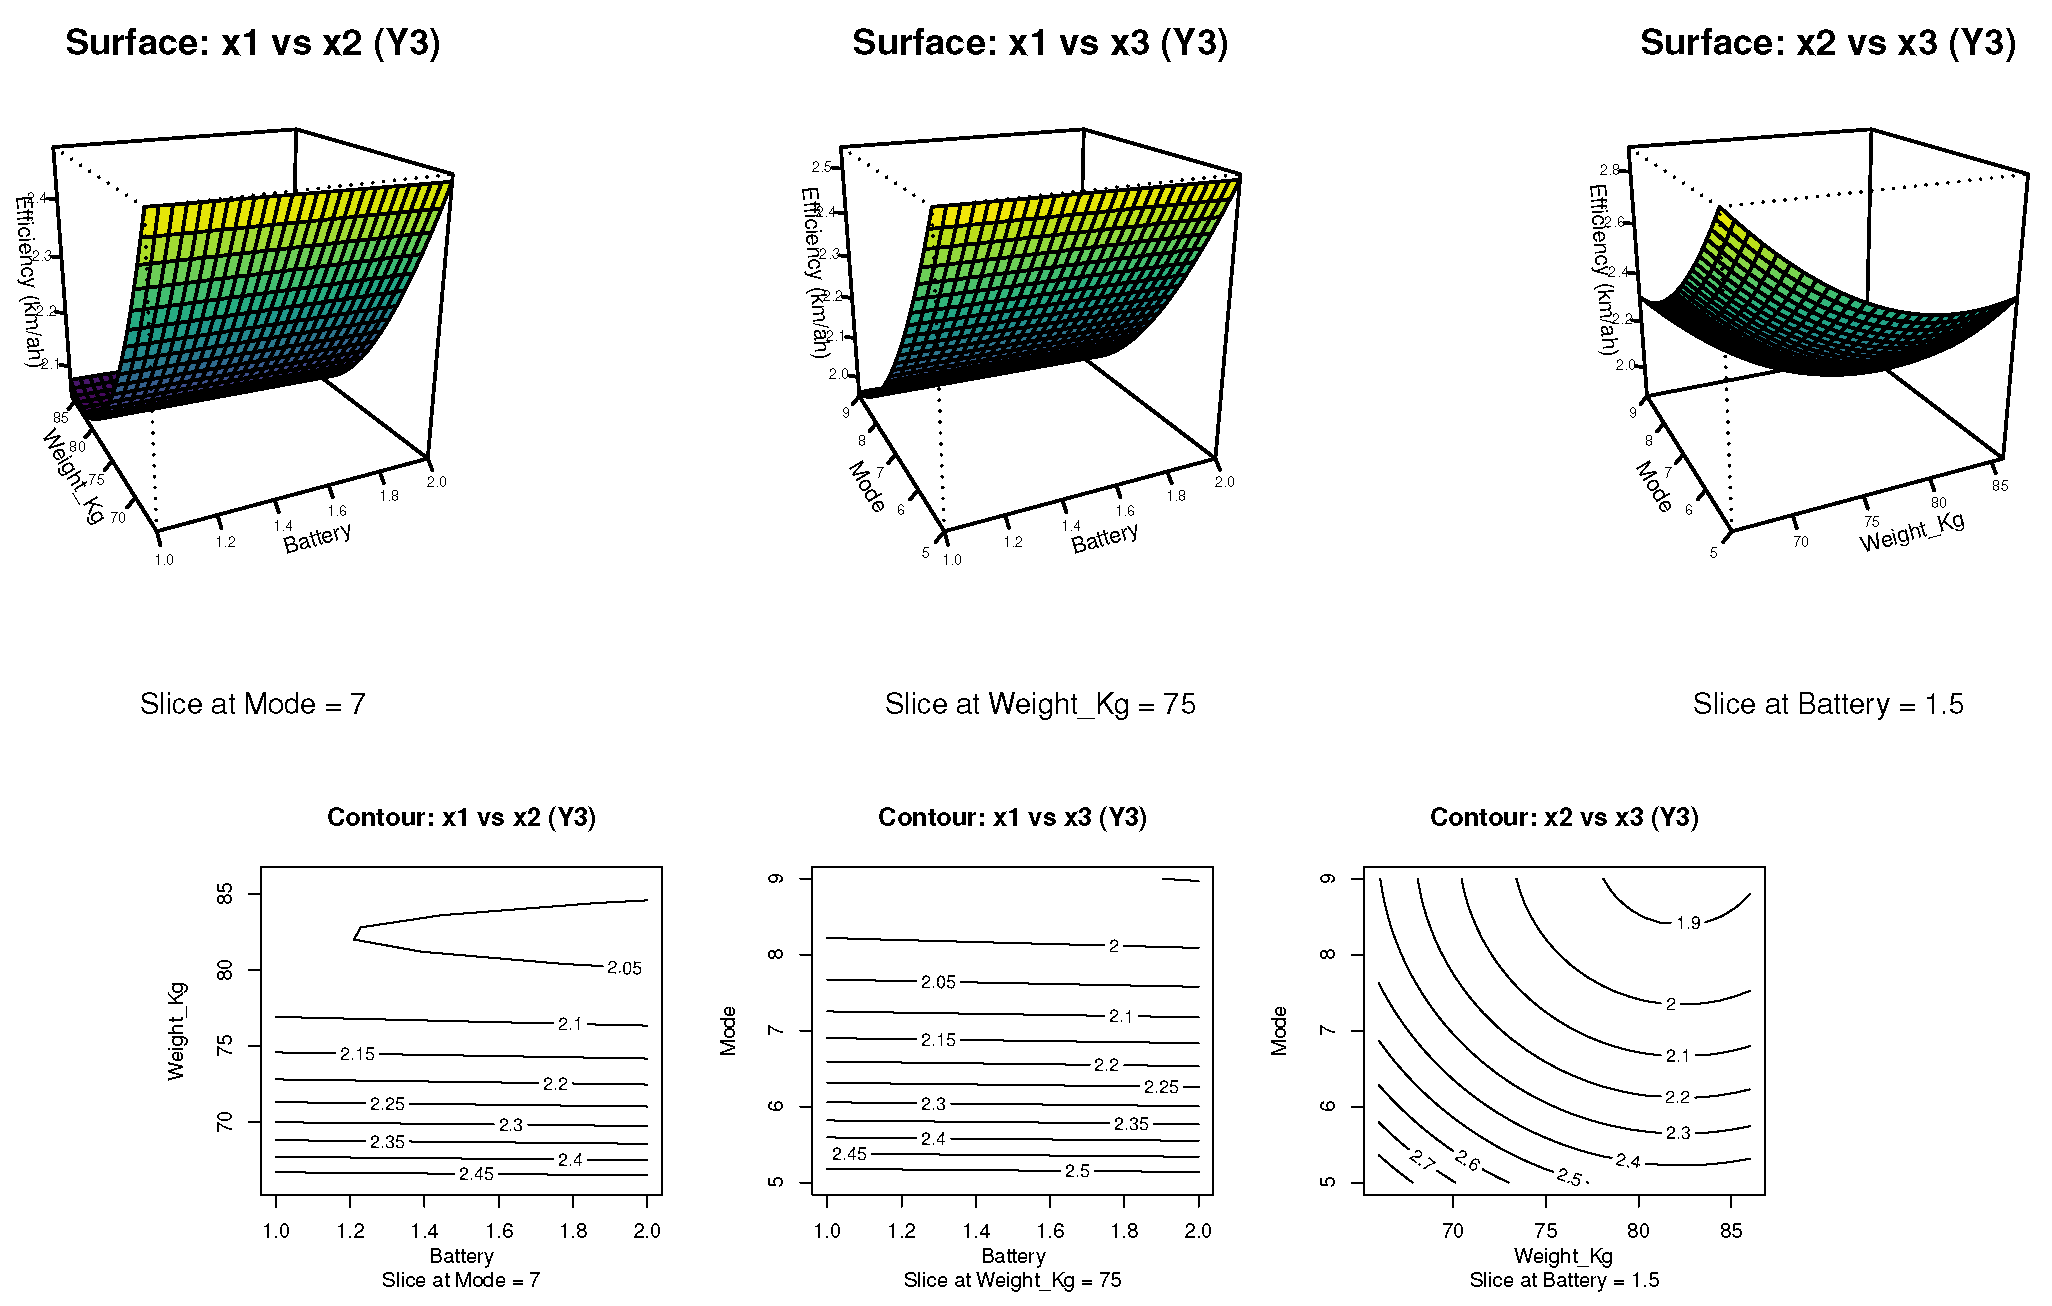
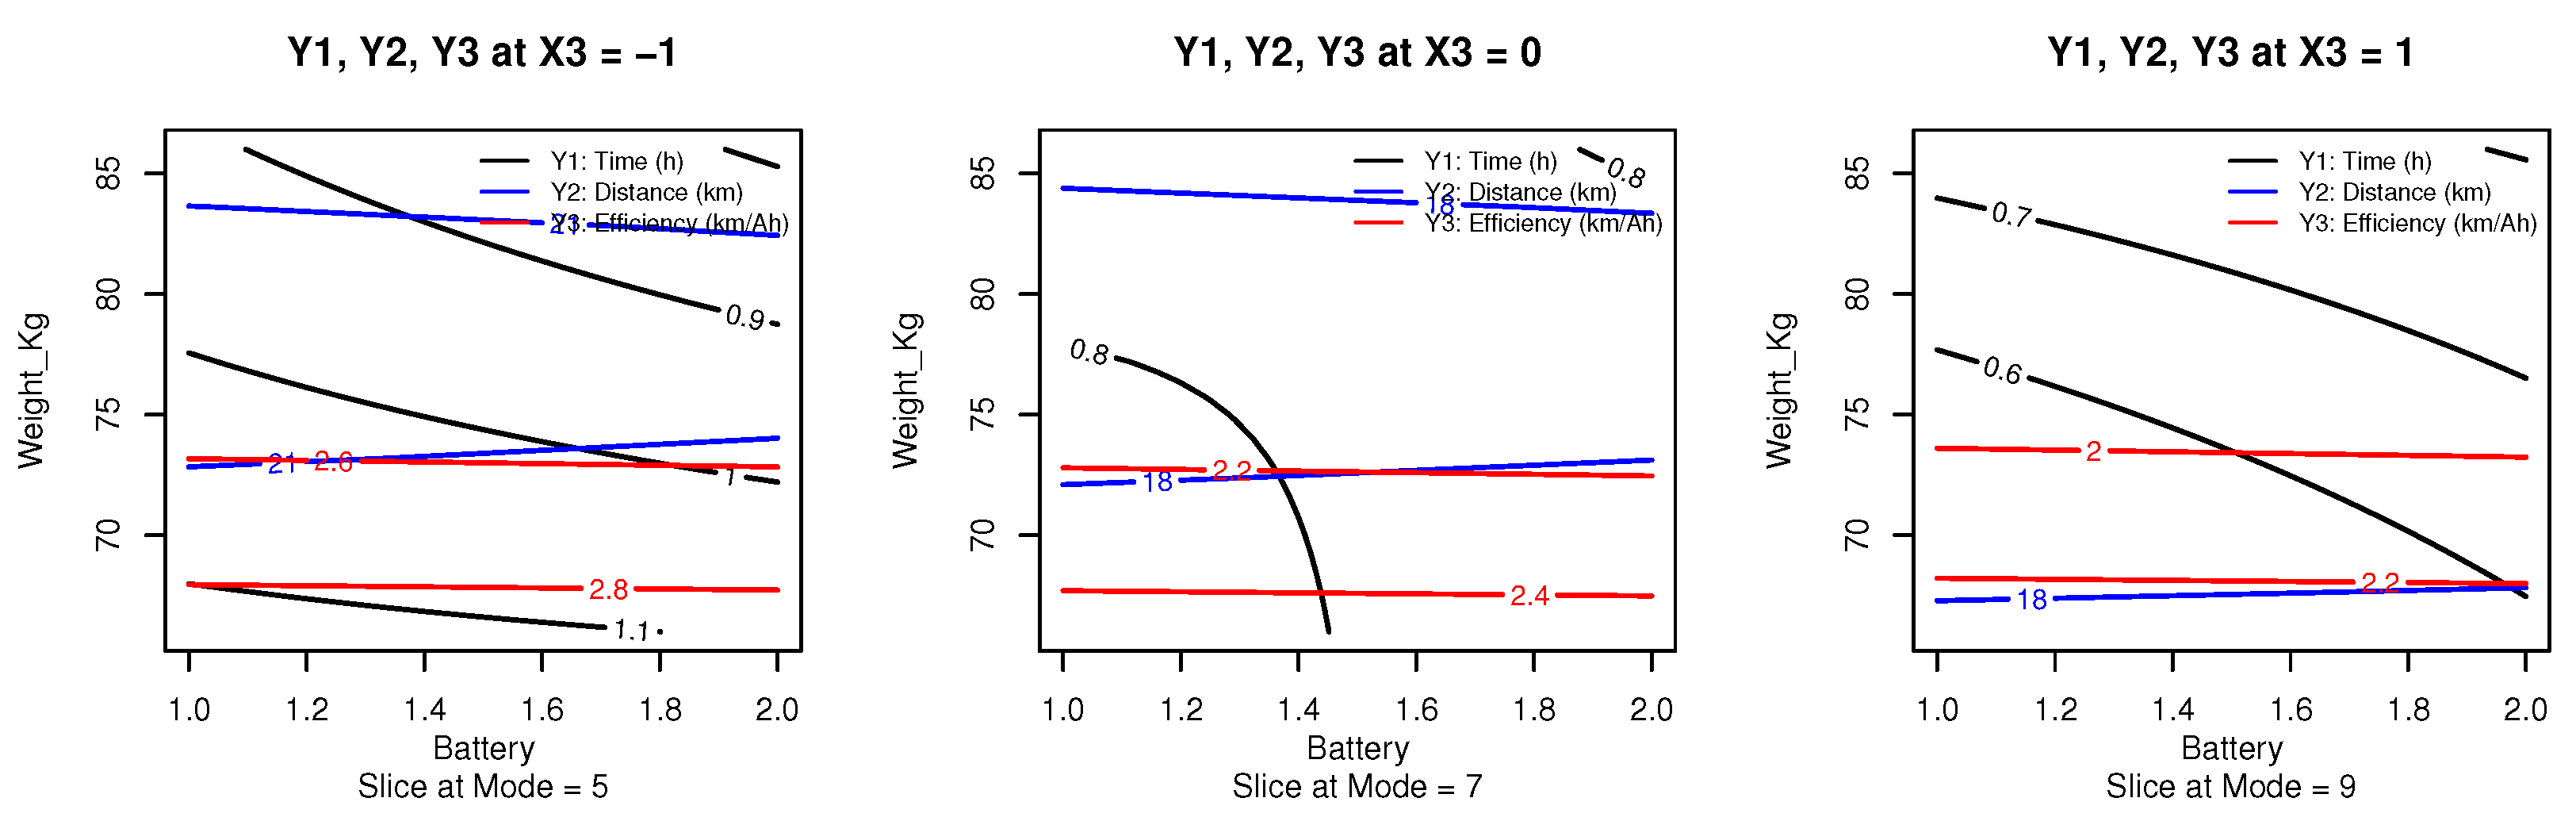
Figure 8 illustrates the simultaneous contour plots for the three response variables: operational time (), total distance traveled (), and energy efficiency (), as functions of battery type () and pilot weight (). The plots are stratified by three fixed levels of the power mode factor (), corresponding to coded values of , 0, and 1, which translate to real settings of N5, N7, and N9, respectively. This multi-response graphical optimization approach enables the identification of regions in the experimental domain where the performance of all three responses is jointly favorable.
To construct these plots, predictions were generated from the fitted RSM models for each response, and contour lines were overlaid within the same coordinate space using distinct colors: black for , blue for , and red for . The graphical superposition reveals that the most desirable operating region—where all three responses reach high levels—is located near the lower bounds of pilot weight and battery capacity, particularly when operating in mode N5. These findings reinforce the optimization results obtained via canonical path analysis and desirability function maximization, validating mode N5 as the most energy-efficient and autonomous configuration under lightweight operating conditions.
Figure 8.
Superimposed contour plots for the response variables (operational time), (travel distance), and (energy efficiency), at three fixed levels of power mode . Source: Author’s own elaboration.
Figure 8.
Superimposed contour plots for the response variables (operational time), (travel distance), and (energy efficiency), at three fixed levels of power mode . Source: Author’s own elaboration.
In addition to the contour superposition method used for graphical multi-response optimization, individual optimizations were carried out for each response variable by evaluating the fitted RSM models over a fine grid of experimental conditions. This approach allowed for the identification of the optimal settings of the control factors—battery type (), pilot weight (), and power mode ()—that maximize each response individually within the defined experimental region.
For operational time (), the optimal condition was found at the lowest tested values of battery capacity (1.0), pilot weight (66 kg), and power mode (N5), yielding a maximum estimated value of 1.129 hours. Similarly, the optimal travel distance () was achieved under the same lightweight and low-power conditions, but with the highest tested battery capacity (2.0), resulting in a maximum estimated distance of 24.446 km. In the case of energy efficiency (), the optimal configuration coincided with that of , at minimum battery size (1.0), minimum pilot weight (66 kg), and low power mode (N5), yielding a predicted value of 2.942 km/Ah. These individual optimization results support the suitability of lightweight configurations and conservative power settings for maximizing both autonomy and energy performance in electric vehicles.
Finally, a multi-response optimization was performed using the desirability function approach, which allows for the simultaneous maximization of all response variables by transforming them into a common scale of desirability ranging from 0 (completely undesirable) to 1 (fully desirable). Individual desirability functions were defined for each response variable, aiming to maximize operational time () with a target of 1.2 hours, total distance () with a target of 24 km, and energy efficiency () with a target of 2.8 km/Ah. The global desirability was computed as the geometric mean of the three individual desirabilities across all experimental combinations.
The optimal solution identified through this method corresponds to the configuration with codified factor levels , , and , which in the original units translates to a battery size of 1.0, a pilot weight of approximately 66 kg, and power mode N5. In this setting, the predicted values were hours, km, and km/Ah, resulting in a high overall desirability score of 0.945. This result confirms the consistency of the previous optimization methods, reinforcing the suitability of low-weight and low-power configurations for maximizing the electric vehicle’s performance across multiple criteria.
The integrated analysis of optimization strategies, including contour-based visual exploration, individual RSM model predictions, and composite desirability evaluation, provided a comprehensive and convergent understanding of optimal operating conditions for maximizing electric vehicle performance.
In individual optimization of each response variable, the three models independently identified the lowest pilot weight (66 kg) and the lowest power mode (N5) as the ideal conditions to maximize operational time (), total distance traveled () and energy efficiency (). However, differences emerged in the battery configuration: while the smallest battery type (1.0) yielded the best results for and , the longest distance () was achieved with a higher capacity battery (2.0). This indicates a trade-off between energy efficiency and storage capacity, where larger batteries favor extended range but may compromise efficiency and lightweight dynamics.
The contour superposition method, visually represented in the comparative plots, revealed a common favorable region in the design space—low values of battery (1.0–1.2), weight (66–70 kg), and power mode (N5). This region visually aligns with the numerically derived optima, confirming the validity of the response surface methodology (RSM) in identifying multiobjective trade-offs. The overlay of response surfaces also demonstrated that, despite differing optimal battery choices in some objectives, a feasible zone of convergence exists where all three responses perform satisfactorily.
Lastly, the composite desirability optimization further confirmed this convergence. The best compromise solution was found at (Battery = 1.0), (Weight = 66 kg), and (Mode = 5), with predicted values of 1.121 hours for , 23.71 km for , and 2.90 km/Ah for . This combination yielded a high overall desirability score of 0.945, reinforcing its status as the optimal balance between endurance, range, and energy efficiency.
All three methods - individual optimization, graphical contour intersection and desirability function - coincide in identifying the low pilot weight and low power mode as universally favorable. While the optimal battery varied slightly (battery type 1.0 for and ; type 2.0 for ), the desirability function favored the lighter configuration, aligning with the goal of energy-efficient operation. This alignment across methods highlights the robustness and reliability of the proposed modeling framework for informing sustainable electric vehicle design decisions.
3.5. Discussion
The optimization and modeling approach presented in this study integrates both graphical and numerical strategies to determine the optimal operational conditions for a pilot-controlled electric vehicle, combining experimental data with statistical modeling. The combination of individual response surface models (RSM), graphical contour superposition, and a global desirability function provided a robust framework for multicriteria decision-making across endurance, distance, and energy efficiency.
This study employed a systematic Response Surface Methodology (RSM) and Desirability Function Approach (DFA) to optimize the performance of an electric racing vehicle, focusing on maximizing output while minimizing energy consumption. Our findings provide valuable insights into the complex interplay among battery type, vehicle mass, and power mode selection in optimizing electric racing vehicle performance. For EV performance, this combined approach enables a thorough evaluation, ensuring that selected solutions—such as those prioritizing low vehicle weight and conservative energy use to maximize endurance, range, and energy efficiency are consistently identified across different analytical perspectives, including individual optimization, graphical contour intersection, and the overall desirability function [22]. This consistent identification across methodologies reinforces the robustness and reliability of the proposed modeling framework for sustainable EV design decisions [23].
The experimental results demonstrated that the combination of the lowest battery capacity (1.0), minimum pilot weight (66 kg), and lowest power mode (N5) yielded the highest overall performance in terms of operational time, distance traveled, and energy efficiency. This configuration was confirmed by both individual optimization of each response variable and a global desirability score of 0.945. These results suggest that, under controlled experimental conditions, lightweight configurations combined with conservative power settings significantly enhance the energy efficiency and overall endurance of electric racing vehicles. This optimal point provides a clear guideline for configuring race vehicles aimed at maximizing autonomy without compromising measurable distance or consumption metrics.
The optimization of electric racing vehicles for endurance and energy efficiency involves addressing several key areas across vehicle architecture, powertrain control, energy storage, and thermal management. In the powertrain, Continuously Variable Transmissions (CVT) have been shown to outperform fixed-gear transmissions (FGT) in lap time, despite increased mass and potential efficiency losses, by keeping electric motors operating within optimal efficiency zones [24,25]. Motor sizing is also critical; in-wheel motor double-axle (IWM-DA) configurations offer superior acceleration, while single-axle (IWM-SA) designs balance performance and control [25,26]. Switched Reluctance Motors (SRM) are gaining interest due to their high torque density and robust design, with control strategies focused on minimizing torque ripple [23,27]. For induction motors, loss-minimizing algorithms that optimize the d-axis stator current reduce energy losses during operation [28].
Battery and energy management strategies are equally important. Vehicles using CVTs benefit from larger-capacity batteries [25], while improvements in electrode structure—such as optimizing thickness and porosity—can increase lithium-ion battery energy density by over 50% [29]. Efficient thermal management, employing systems like air cooling, liquid cooling, phase-change materials, or Peltier devices, is essential to ensure performance and extend battery life [30,31]. Charging optimization strategies based on telemetry data and RSM can significantly reduce recharge times while controlling thermal rise [32]. Finally, vehicle mass reduction continues to be a priority for optimizing performance, as supported by findings on mass-energy correlations in electric racing [33,34].
From individual optimization of each response variable, it was evident that the configuration that yields the maximum operational time (), the distance traveled () and the energy efficiency () consistently involved the use of a light battery (Battery type 1.0), the lowest pilot weight (66 kg), and the lowest power mode (Mode 5). An exception occurred in the distance optimization, where the highest value was achieved using a Battery type 2.0. This discrepancy suggests a trade-off between energy efficiency and energy capacity, confirming that while lighter batteries enhance efficiency and duration, greater range may benefit from increased stored energy.
The graphical method using contour plot superposition (Figure 8) supported these findings, visually revealing a convergence region where all three objectives perform optimally under similar low-level factor settings. This graphical consistency with the numerical optimizations strengthens the argument for using RSM and contour plots as complementary tools for validating and refining vehicle performance models during early stage design and calibration.
Furthermore, the application of the global desirability function yielded an optimal configuration identical to the one predicted by individual analyzes: Battery type 1.0, Weight 66 kg, and Mode 5. The predicted performance at this configuration was 1.121 hours of operation, 23.71 km of total distance, and 2.90 km/Ah in energy efficiency, with a global desirability score of 0.945. This reinforces the consistency and reliability of the methodology employed.
These findings are consistent with recent studies in the field of electric vehicle performance optimization. For instance, in the work of [35], the mechanical and structural configuration of an electric competition vehicle was explored, highlighting the importance of weight and structural optimization to improve vehicle behavior under dynamic and static loading conditions. Additionally, the study by [32] emphasized the integration of telemetry in real-time to refine battery performance prediction, revealing the significance of battery selection and control strategy for racing scenarios. Similarly, the application of machine learning for telemetry-based efficiency optimization, as demonstrated in the work by [34], underlines the growing relevance of predictive modeling to support electric vehicle design and usage decisions.
The proposed methodology provides a replicable and data-driven framework for optimizing electric vehicle performance through experimental modeling and statistical analysis. It bridges design, operation, and data-based decision-making, aligning with emerging trends in sustainable, intelligent, and competitive electric mobility development.
Key Findings and Model Performance
The experimental data, analyzed through a 2x3x3 factorial design, revealed significant relationships between the chosen input factors and the vehicle’s performance metrics. Notably, the power mode () emerged as the most statistically significant factor influencing operational time (), with a p-value below . This underscores the critical role of power management in extending vehicle endurance. The interaction between weight and power mode () was also significant () for operational time, suggesting that the impact of vehicle weight on endurance is modulated by the selected power setting.
For total distance traveled () and energy efficiency (), models incorporating quadratic terms for pilot weight () and power mode () provided the best fit. This indicates that the relationship between these factors and the response variables is non-linear, highlighting the need for more sophisticated models to capture the curvature in performance. This aligns with findings in other engineering applications of RSM where non-linear effects are common [12]. The adjusted values of for distance and for efficiency demonstrate a strong explanatory power of these models, further supported by global p-values below . The statistical significance of the quadratic term for pilot weight () in the distance model () specifically points to a diminishing return or an optimal point for weight in relation to distance covered. Similarly, both weight () and power mode () were highly significant for energy efficiency () ( and , respectively), reinforcing their importance in achieving optimal energy use. These results are consistent with previous research emphasizing the impact of weight reduction on energy efficiency in electric race cars [6].
The selection of the “First-Order with Two-Way Interactions (FO + TWI)” model for operational time and “First-Order with Principal and Quadratic Effects (FO + PQ)” for distance and efficiency was a deliberate choice to balance statistical accuracy with model interpretability and numerical stability. While full second-order models might show slightly higher unadjusted values, issues like coefficient aliasing can hinder reliable canonical analysis and optimization, as observed in our preliminary evaluations. Our chosen models allowed for robust analysis and visualization of the response surfaces, providing clear insights into the optimal operating conditions.
—
Implications of Optimization Results
The individual optimization of each response variable consistently identified low pilot weight (66 kg) and low power mode (N5) as crucial for maximizing vehicle performance. This suggests that for competitive events focused on endurance and efficiency, minimizing the total mass and operating at conservative power settings are paramount. This aligns with general engineering principles where reduced mass leads to lower energy requirements for acceleration and maintaining speed, and lower power settings inherently consume less energy [6].
Interestingly, a divergence was observed regarding the optimal battery type. While the smallest tested battery type (1.0) was optimal for maximizing operational time and energy efficiency, the longest travel distance was achieved with a higher-capacity battery (2.0). This highlights a critical trade-off between energy efficiency and total energy storage capacity. A smaller, lighter battery contributes to overall vehicle efficiency, as less energy is expended to move its own weight. However, a larger battery, despite being heavier, provides more total energy, which can translate to greater range if the vehicle can still operate efficiently enough to utilize that extra capacity. This implies that the specific design goals of an electric vehicle—be it pure efficiency, maximum range, or a balance—will dictate the optimal battery choice. These findings complement earlier studies that explored battery selection and its impact on energy output and control [5].
The superimposed contour plots visually confirmed these insights, identifying a common favorable region in the design space characterized by low battery (1.0–1.2), low weight (66–70 kg), and low power mode (N5). This visual convergence strengthens the reliability of our numerical optimization results. The ability to visually identify these multi-objective sweet spots is a significant advantage of RSM, offering intuitive guidance for designers.
The composite desirability optimization [17,18] further reinforced these findings. The optimal compromise solution—achieving a high overall desirability score of —was found with battery type 1.0, pilot weight of approximately 66 kg, and power mode N5. This robust agreement across individual optimization, graphical analysis, and desirability function confirms that prioritizing low weight and conservative power usage are the most impactful strategies for enhancing the overall performance of the electric racing vehicle in terms of endurance, range, and energy efficiency.
—
Methodological Contributions and Limitations
Our study successfully implemented a comprehensive methodology integrating Montgomery’s Design of Experiments [19] with RSM and DFA, providing a structured approach for optimizing complex vehicle performance. The development and validation of a low-cost Arduino-based data acquisition (DAQ) prototype also represents a significant methodological contribution, particularly for academic and resource-constrained environments. This system demonstrated reliability comparable to commercial controllers [21], making advanced data collection accessible for educational and research purposes.
However, the study also has limitations. The experiments were conducted on a specific synthetic grass track with moderate surface friction. The vehicle’s performance might differ on other terrains (e.g., asphalt, dirt) or under varying environmental conditions (e.g., temperature, humidity, wind), which were not varied in this study. While our constant pilot and controlled test times aimed to minimize variability, external factors could still subtly influence results. Future research could explore the robustness of these optimal settings across a wider range of environmental and track conditions. Additionally, the scope of battery types was limited to two specific configurations. Expanding the range of battery chemistries and capacities could reveal further insights into the energy storage vs. efficiency trade-off, considering the critical challenges identified in EV competitions such as thermal behavior and battery weight [5].
—
Future Work
Building on these findings, future research could focus on dynamic optimization strategies that adapt power modes and potentially even “virtual” weight adjustments (e.g., through load distribution) in real-time based on competition conditions. Investigating the thermal behavior of the battery system under optimal conditions [4,5], as briefly mentioned in the introduction, would also be a critical next step to ensure long-term reliability and safety, especially given the triangular battery arrangement. Furthermore, exploring the application of machine learning techniques to predict performance based on sensor data and environmental factors could lead to even more adaptive and efficient control systems for these high-efficiency prototypes. The potential for regenerative braking to further enhance energy efficiency, as highlighted in existing literature [7], also warrants deeper investigation in future studies.
—
This discussion highlights the practical implications of our findings for designing and operating high-efficiency electric vehicles, particularly in competitive contexts like the National Electric Drive Vehicle Competition [2]. The robust optimization framework developed provides a clear pathway for enhancing vehicle performance, contributing to the broader goal of sustainable transportation, as championed by initiatives like the Shell Eco-Marathon [1]. “`
4. Conclusions
The Response Surface Methodology (RSM) applied in the experimental design enabled the identification of optimal operating configurations for the electric vehicle, maximizing time and distance while minimizing energy consumption. The optimal configuration was achieved with a pilot weight of 75 kg and power mode N5 (500).
The appropriate selection of batteries, power modes, and weight significantly impacts the performance of electric vehicles. The article demonstrates that an intermediate weight configuration (76 kg) and a moderate power level (N9) can be more efficient in minimizing energy consumption.
The use of factorial experimental design, combined with RSM, provides a powerful tool to evaluate multiple factors influencing the performance of electric vehicles. The combination of statistical analysis and visualization through contour plots made it possible to clearly identify the interactions between factors and their effects on the response variables.
The findings of the study are applicable to optimizing electric vehicles in competitive environments and prototype development. The approach used is robust and can be replicated in other studies seeking to improve the efficiency and performance of electric vehicles in various contexts.
It would be interesting to explore the application of this methodology to different types of batteries and traction configurations to validate the results and extend the model to other contexts of electric vehicles. Additionally, studying the impact of environmental factors such as temperature and track conditions could provide a more comprehensive view of vehicle performance.
Author Contributions
Conceptualization, A.F.V.-S. and I.N.G.-M.; methodology, A.F.V.-S., I.N.G.-M., A.F.R.-M., A.P.-G. and J.D.V.-G.; formal analysis, A.F.V.-S., I.N.G.-M., A.F.R.-M., J.D.V.-G. and A.P.-G.; investigation, A.F.V.-S., I.N.G.-M., A.F.R.-M., J.D.V.-G. and A.P.-G.; data curation, A.F.V.-S., S.A.E.-M. and I.N.G.-M.; original draft preparation, A.F.V.-S., I.N.G.-M. and A.P.-G.; writing—review and editing, A.F.V.-S.; supervision, A.F.V.-S., I.N.G.-M., A.F.R.-M., S.A.E.-M., J.D.V.-G. and A.P.-G. All authors have read and agreed to the published version of the manuscript.
Funding
This research received no external funding.
Informed Consent Statement
Not applicable.
Data Availability Statement
The dataset generated and analyzed during the current study is available from the corresponding author on reasonable request.
Acknowledgments
The authors would like to thank the University IUPB for allowing us to carry out the experiments within the framework of the institutional project “Escudería Bravo”.
Conflicts of Interest
The authors declare no conflict of interest.
References
- Shell. Shell Eco-marathon Partners | Energy Efficiency Competitions | Shell Eco-marathon. https://www.shellecomarathon.com/, 2025. Accessed: 2025-07-10.
- REDTTU. ETITC y la IU Pascual Bravo dominaron la III Competencia Nacional de Vehículos Eléctricos. https://www.redttu.edu.co/es/etitc-y-iu-pascual-bravo-dominaron-la-iii-competencia-nacional-de-vehiculos-electricos/, 2025. Accessed: 2025-07-10.
- Khan, F.N.U.; Rasul, M.G.; Sayem, A.; Mandal, N. Maximizing energy density of lithium-ion batteries for electric vehicles: A critical review. Energy Reports 2023, 9, 11–21, Proceedings of 2022 7th International Conference on Renewable Energy and Conservation. [Google Scholar] [CrossRef]
- Lan, C.; Xu, J.; Qiao, Y.; Ma, Y. Thermal management for high power lithium-ion battery by minichannel aluminum tubes. Applied Thermal Engineering 2016, 101, 284–292. [Google Scholar] [CrossRef]
- Sehil, K.; Alamri, B.; Alqarni, M.; Sallama, A.; Darwish, M. Empirical Analysis of High Voltage Battery Pack Cells for Electric Racing Vehicles. Energies 2021, 14. [Google Scholar] [CrossRef]
- Stabile, P.; Ballo, F.; Mastinu, G.; Gobbi, M. An Ultra-Efficient Lightweight Electric Vehicle—Power Demand Analysis to Enable Lightweight Construction. Energies 2021, 14. [Google Scholar] [CrossRef]
- Rego, N.; Castro, R. Regenerative Braking Applied to a Student Team’s Electric Racing Motorcycle Prototype: A Theoretical Study. Applied Sciences 2023, 13. [Google Scholar] [CrossRef]
- Garud, K.S.; Tai, L.D.; Hwang, S.G.; Nguyen, N.H.; Lee, M.Y. A review of advanced cooling strategies for battery thermal management systems in electric vehicles. Symmetry 2023, 15, 1322. [Google Scholar] [CrossRef]
- Chan, C.K.; Chung, C.H.; Raman, J. Optimizing Thermal Management System in Electric Vehicle Battery Packs for Sustainable Transportation. Sustainability 2023, 15, 11822. [Google Scholar] [CrossRef]
- Fu, P.; Zhao, L.; Wang, X.; Sun, J.; Xin, Z. A review of cooling technologies in lithium-ion power battery thermal management systems for new energy vehicles. Processes 2023, 11, 3450. [Google Scholar] [CrossRef]
- Togun, H.; Basem, A.; Mohammed, H.I.; Sadeq, A.M.; Biswas, N.; Abdulrazzaq, T.; Hasan, H.A.; Homod, R.Z.; Talebizadehsardari, P.; et al. A comprehensive review of battery thermal management systems for electric vehicles: Enhancing performance, sustainability, and future trends. International Journal of Hydrogen Energy 2025, 97, 1077–1107. [Google Scholar] [CrossRef]
- Uslu, S. Optimization of diesel engine operating parameters fueled with palm oil-diesel blend: Comparative evaluation between response surface methodology (RSM) and artificial neural network (ANN). Fuel 2020, 276, 117990. [Google Scholar] [CrossRef]
- Silva, A.F.; Neves, P.; Rocha, S.M.; Silva, C.M.; Valente, A.A. Optimization of continuous-flow heterogeneous catalytic oligomerization of 1-butene by design of experiments and response surface methodology. Fuel 2020, 259, 116256. [Google Scholar] [CrossRef]
- Vega-Garzon, L.P.; Gomez-Miranda, I.N.; Peñuela, G.A. Benzophenone-3 ultrasound degradation in a multifrequency reactor: Response surface methodology approach. Ultrasonics Sonochemistry 2018, 43, 201–207. [Google Scholar] [CrossRef] [PubMed]
- Anfar, Z.; Ahsaine, H.A.; Zbair, M.; Amedlous, A.; Fakir, A.A.E.; Jada, A.; Alem, N.E. Recent trends on numerical investigations of response surface methodology for pollutants adsorption onto activated carbon materials: A review. Critical Reviews in Environmental Science and Technology 2020, 50, 1043–1084. [Google Scholar] [CrossRef]
- Panwar, V.; Kumar Sharma, D.; Pradeep Kumar, K.; Jain, A.; Thakar, C. Experimental investigations and optimization of surface roughness in turning of en 36 alloy steel using response surface methodology and genetic algorithm. Materials Today: Proceedings 2021, 46, 6474–6481. [Google Scholar] [CrossRef]
- Gamero-Salinas, J.; López-Fidalgo, J. Response Surface Methodology coupled with desirability functions for multi-objective optimization: minimizing indoor overheating hours and maximizing useful daylight illuminance. arXiv 2024. [Google Scholar] [CrossRef]
- Bartz-Beielstein, T. Multi-Objective Optimization and Hyperparameter Tuning With Desirability Functions. arXiv 2025. [Google Scholar] [CrossRef]
- Montgomery, D.C.; et al. Design and Analysis of Experiments; Vol. 2, Design and Analysis of Experiments, Wiley Online Library, 2007.
- de bicicletas Madrid, T. Convertir bicicleta en electrica, 2024. Accessed on july 22, 2024.
- Uppal, M.; Gupta, D.; Goyal, N.; Imoize, A.L.; Kumar, A.; Ojo, S.; Pani, S.K.; Kim, Y.; Choi, J. A Real-Time Data Monitoring Framework for Predictive Maintenance Based on the Internet of Things. Complexity 2023, 2023, 9991029. [Google Scholar] [CrossRef]
- Jeong, I.J.; Kim, K.J. An interactive desirability function method to multiresponse optimization. European Journal of Operational Research 2009, 195, 412–426. [Google Scholar] [CrossRef]
- Siddique, F.; Singh, B.; Shastri, S. RSM Assisted MOGA for SRM EV Drive Control Factors Optimization. IEEE Transactions on Industry Applications 2024, 60, 3200–3209. [Google Scholar] [CrossRef]
- Borsboom, O.; Fahdzyana, C.A.; Salazar, M. Time-optimal Control Strategies for Electric Race Cars with Different Transmission Technologies. In Proceedings of the 2020 IEEE Vehicle Power and Propulsion Conference (VPPC). IEEE; 2020; pp. 1–5. [Google Scholar] [CrossRef]
- Borsboom, O.; Fahdzyana, C.A.; Hofman, T.; Salazar, M. A Convex Optimization Framework for Minimum Lap Time Design and Control of Electric Race Cars. IEEE Transactions on Vehicular Technology 2021, 70, 8478–8489. [Google Scholar] [CrossRef]
- Othaganont, P.; Assadian, F.; Auger, D.J. Multi-objective optimisation for battery electric vehicle powertrain topologies. Proceedings of the Institution of Mechanical Engineers, Part D: Journal of Automobile Engineering 2017, 231, 1046–1065. [Google Scholar] [CrossRef]
- Cheri, J.; Sundaramoorthy, P. Pioneering Sustainable Transportation: SRM Motor Optimization for Enhanced Electric Vehicle Dynamics. In Proceedings of the 2024 10th International Conference on Electrical Energy Systems (ICEES); 2024; pp. 1–6. [Google Scholar] [CrossRef]
- Akhtar, M.J.; Behera, R.K.; Al Hosani, K.; Muduli, U.R. Enhanced Electric Vehicle Powertrain Efficiency with Optimized Loss-Minimizing Control. In Proceedings of the 2024 IEEE 4th International Conference on Sustainable Energy and Future Electric Transportation (SEFET); 2024; pp. 1–6. [Google Scholar] [CrossRef]
- Kim, J.S.; Lee, D.C.; Lee, J.J.; Kim, C.W. Optimization for maximum specific energy density of a lithium-ion battery using progressive quadratic response surface method and design of experiments. Scientific reports 2020, 10, 15586. [Google Scholar] [CrossRef]
- Xia, Q.; Wang, Z.; Ren, Y.; Yang, D.; Sun, B.; Feng, Q.; Qian, C. Performance reliability analysis and optimization of lithium-ion battery packs based on multiphysics simulation and response surface methodology. Journal of Power Sources 2021, 490, 229567. [Google Scholar] [CrossRef]
- Sabarimuthu, M.; Radha, J.; Gomathy, S.; Eswaran, R.; Kaushik, A.U.; Koushika, S. Integrated Battery Management and Thermal Control System for Lithium-Ion Battery Pack in Electric Vehicle. In Proceedings of the 2024 2nd International Conference on Self Sustainable Artificial Intelligence Systems (ICSSAS); 2024; pp. 1685–1690. [Google Scholar] [CrossRef]
- Villa-Salazar, A.F.; Gomez-Miranda, I.N.; Romero-Maya, A.F.; Velásquez-Gómez, J.D.; Lemmel-Vélez, K. Optimizing Electric Racing Car Performance through Telemetry-Integrated Battery Charging: A Response Surface Analysis Approach. World Electric Vehicle Journal 2024, 15. [Google Scholar] [CrossRef]
- Pusztai, Z.; Kőrös, P.; Szauter, F.; Friedler, F. Vehicle Model-Based Driving Strategy Optimization for Lightweight Vehicle. Energies 2022, 15. [Google Scholar] [CrossRef]
- Rao, A.; Gupta, H.; Singh, P.; Mittal, S.; Singh, U.; Vishwakarma, D.K. Optimizing Electric Vehicle Efficiency with Real-Time Telemetry using Machine Learning. In Proceedings of the 2024 10th International Conference on Mechatronics and Robotics Engineering (ICMRE); 2024; pp. 213–219. [Google Scholar] [CrossRef]
- Villa Salazar, A.F.; Gonzalez Montoya, E.; Romero Maya, A. Diseño del chasis de un vehículo eléctrico para la II Competencia Nacional de Vehículos de Tracción Eléctrica. Revista CINTEX 2022, 27, 16–31. [Google Scholar] [CrossRef]
Disclaimer/Publisher’s Note: The statements, opinions and data contained in all publications are solely those of the individual author(s) and contributor(s) and not of MDPI and/or the editor(s). MDPI and/or the editor(s) disclaim responsibility for any injury to people or property resulting from any ideas, methods, instructions or products referred to in the content. |
© 2025 by the authors. Licensee MDPI, Basel, Switzerland. This article is an open access article distributed under the terms and conditions of the Creative Commons Attribution (CC BY) license (https://creativecommons.org/licenses/by/4.0/).
Copyright: This open access article is published under a Creative Commons CC BY 4.0 license, which permit the free download, distribution, and reuse, provided that the author and preprint are cited in any reuse.


