
Submitted:
22 July 2025
Posted:
23 July 2025
You are already at the latest version
Abstract
This work presents the complete design and construction of a high-efficiency electric powertrain developed for a Shell Eco-Marathon Urban Concept vehicle. The system integrates a 1500 W, 48 V brushless DC motor, a modular two-stage chain drive, and a custom 12S8P lithium-ion battery pack. Mechanical components are supported by CNC-machined mounts and adjustable tensioning systems, while electrical subsystems include a DC-DC converter and provisions for a custom motor controller. To validate the system's performance, a Simulink-based vehicle dynamics model was developed, incorporating a PID-controlled drive cycle, battery state-of-charge tracking, and drivetrain load modelling. Results indicate energy consumption of only 20.95 Wh per lap under competition conditions, demonstrating high efficiency and compliance with technical regulations. The hardware is documented with detailed build instructions, CAD models, and a full bill of materials to support reproducibility. This contribution provides a validated, low-cost, and replicable electric powertrain for ultra-efficient vehicle platforms. The system adhered to Shell Eco-marathon voltage and packaging regulations, balancing weight, manufacturability, and cost. The findings validate the feasibility of a lightweight, cost-effective powertrain for competition and real-world low-speed electric vehicles. The paper concludes with design insights, simulation validation, and recommendations for future optimisation and control strategy development.
Keywords:
electric vehicle
; powertrain design
; shell eco-marathon
; BLDC motor
; Simulink
; energy efficiency
; drivetrain
; battery pack
1. Introduction
The transition toward electric mobility is accelerating globally, driven by a need to reduce greenhouse gas emissions, improve urban air quality, and reduce dependence on fossil fuels.
The Shell Eco-marathon competition provides a platform for academic teams to explore innovations in vehicle design under strict regulatory and performance constraints. This study focuses on the Urban Concept category, which emulates real-world driving conditions such as stop-and-go traffic and packaging constraints like passenger cars.
Despite increasing interest, detailed documentation of EV powertrain solutions that are both cost-effective and performance-validated remains limited. This project addresses that gap by delivering a fully documented electric drivetrain that integrates motor, transmission, battery, and control systems within competition constraints.
According to the International Energy Agency (IEA), electric vehicles (EVs) are expected to account for over 30% of global vehicle sales by 2030 (IEA, 2024). In this context, there is increasing pressure on engineers and designers to develop powertrains that are not only energy-efficient and reliable but also lightweight, cost-effective, and practical for real-world, low-speed applications such as micro-EVs and delivery vehicles.
The Shell Eco-marathon offers a unique platform to address these design challenges in an academic setting. In particular, the Urban Concept category replicates road-going vehicle constraints requiring four wheels, enclosed bodywork, luggage space, and a stop-and-go driving cycle (Shell Eco-marathon, 2025). The Urban Concept category of this competition simulates real-world vehicle constraints such as four-wheel drive, enclosed bodywork, and stop-and-go operation. This environment enables research that is academically rigorous and industrially relevant.
Within this environment, student teams are encouraged to balance innovation, safety, and manufacturability. The BA Momentum team from Coventry University undertook the development of an open-source, electric Urban Concept vehicle with critical design constraints: a 48 V voltage cap, a total budget of £13,500, and a tightly packaged lightweight chassis. These parameters mirror trade-offs seen in commercial micro-mobility solutions.
Research Gap and Motivation
While past research has addressed EV component selection and lightweight body design (Cichoński et al., 2014; Maria Maia Marques Líbano Monteiro et al., 2021); few studies offer an integrated drivetrain solution combining rigorous selection methodology, simulation-driven validation, and practical packaging for constrained environments. Moreover, there is a lack of detailed documentation on low-voltage drivetrain architectures optimized for both energy efficiency and manufacturability within academic projects.
Designing a high-efficiency electric powertrain for Shell Eco-marathon Urban Concept vehicles requires a system engineering approach that spans motor selection, drivetrain configuration, battery optimisation, and simulation-driven validation. Literature in this area highlights the engineering challenges and evolving best practices in developing low-voltage, lightweight electric vehicles under cost and regulatory constraints.
Motor selection is one of the most critical factors influencing drivetrain performance as shown in Figure 1. Brushless DC (BLDC) motors are commonly adopted due to their high efficiency (>90%), compact form factor, and simple control requirements (Bhatt, Mehar and Sahajwani, 2018). In a comparative study by Monteiro et al. (2021), five motor types brushed DC, induction, reluctance, BLDC, and PMSM were evaluated using multi-criteria analysis. (Maria Maia Marques Líbano Monteiro et al., 2021) conducted a comprehensive evaluation of motor types and concluded that BLDC motors provide an optimal balance between efficiency, cost, and reliability for student-built competition vehicles as shown in Figure 1 below. The five motor types evaluated were brushed DC motors, induction motors, reluctance motors, BLDC motors, and PMSMs. Based on key criteria including efficiency, power density, control complexity, cost, and maintenance requirements, BLDC motors achieved the highest overall score. However, the study also indicated that if cost is not a limiting factor, Permanent Magnet Synchronous Motors (PMSMs) can outperform BLDC motors, making them the preferred option for applications prioritizing maximum performance.
Recent developments have introduced axial flux motors with higher power density and thermal efficiency (Shao et al., 2021; Hao et al., 2022). However, their integration into student prototypes remains limited due to cost and manufacturing complexity. Permanent Magnet Synchronous Motors (PMSMs) are also gaining traction, offering smoother torque profiles and better performance under variable loads, particularly in multi-speed or urban stop-and-go conditions (Simon Fekadeamlak Gebremariam and Tebeje Tesfaw Wondie, 2023).
Motor layout and powertrain configuration also significantly impact vehicle performance. While multi-motor systems like quad in-wheel motors enable advanced control and regenerative braking (Taha and Aydin, 2022), they introduce substantial challenges in terms of weight, complexity, and unsprung mass (Deepak et al., 2023). Most academic and competition-based designs favour single or dual-motor setups, which are easier to implement and maintain. Centralized motor configurations remain the most practical for student teams, offering an efficient compromise between system simplicity and energy efficiency (Łebkowski, 2017).
In-wheel motor technology was studied extensively by Jneid and Harth (2023). In an in-wheel motor drivetrain, electric motor is installed inside the wheel and drives the wheel directly without the need of driveshaft, differential or transmission, which results in high efficiency due to the lack of mechanical losses from these components. The absence of these components also reduces weight and frees up more space for passengers and batteries, which increases the practicality of the vehicle. With individual motors controlling each driving wheel, performance can be enhanced through precise torque control. However, the drawback of this motor configuration is the unsprung mass it adds up to, since the motors are installed inside the wheels, which increases the driven element mass, hence the overall inertia of the vehicle. In addition, the simpler mechanical layout of the drivetrain means that it requires a more complex electronic control system.
Drivetrain design choices, particularly the type of mechanical transmission, play a central role in overall energy efficiency. Examples of drivetrain designs from other Shell Eco-marathon teams were studied in this section.
A team from the Silesian University of Technology in Poland conducted a comparative study (Cichoński et al., 2014) on drivetrain designs on their Urban Concept vehicle using MATLAB software. Two designs were involved in the study.
- High-speed BLDC motor with belt transmission.
- Low-speed BLDC in-wheel motor.
By running the drivetrains from the speed of 0 to 30 km/h at constant torque of 4 Nm and 9 Nm, it was found that the in-wheel motor design performed better in efficiency throughout the measuring range in both scenarios.
Gear drives provide the highest efficiency approximately by 99.9% but are less suitable for rapid prototyping due to fabrication constraints (Hatletveit and Aasland, 2018). Chain drives, widely used in Shell Eco-marathon vehicles, offer mechanical efficiency of around 98% and allow for easy modification of gear ratios (Smit et al., 2023). Adaptive chain tensioning, as investigated by (Dai et al., 2022), can further enhance drivetrain efficiency under variable loads. Hybrid transmission designs, such as those combining belt and gear stages, are emerging as viable alternatives for micro-mobility applications (Jacoby et al., 2015). Spicer et al. (2001a) experimentally demonstrated that doubling sprocket ratios increased chain efficiency by 2–5%, and quadrupling chain tension improved it by 18%. Meanwhile, belt systems showed 34.6% higher frictional losses compared to chain drives under equivalent preload (Friction Facts, 2012).
Multi-stage transmissions offer a promising middle ground. The PETRONAS University of Technology team addressed chain breakage issues by introducing a hybrid drivetrain with a belt stage for high-torque loads followed by a chain stage for moderate-speed transmission (Haron, 2011). Their design reduced strain on the chain and allowed better durability under dynamic loads. Dai et al. (2022) also demonstrated how adaptive chain tensioning can further improve drivetrain efficiency under variable loading. It was mentioned that the vehicle equipped with chain drive system from previous year suffered from chain breakage, as the chain was connected directly to the engine output shaft and transmission, and the direct load from the engine exceeded the load capacity of the chain. To address the issue, the team designed a two-stage transmission – the first stage being a belt system which had the ability to sustain the high rotation speed and torque directly from the engine, whereas the second stage being a chain system that was more reliable at lower rotation speed and torque. A diagram of their design was given in Figure 2.
In a study by Spicer et al. (2001), frictional losses in a bicycle chain drive were analysed through experimentally measuring its efficiency. It was found that chain drive efficiency increased with tooth ratio and chain tension, results from their experiments showed a 2-5% increase in efficiency when doubling the sprocket ratio, whilst quadrupling the chain tension raised efficiency by 18%. The maximum efficiency recorded was 98.6%. Even though the belt was less efficient than the chain in low load application because of the high pretension required in belt, it was found that belt could have less frictional losses if the pretension remained under 40lbf.
Battery selection and modelling are equally crucial. Lithium-ion cells, such as the Molicel P28A, are widely chosen for their high discharge rates and energy density. (Zhang et al., 2018) and (Patil et al., 2020) emphasize that accurate modelling of state-of-charge (SoC), internal resistance, and thermal effects is essential for predicting battery behaviour and range. Thermal modelling, although often excluded from student projects due to complexity, can significantly improve the fidelity of energy simulations. Battery management system (BMS) design, safety tray construction, and compliance with voltage limits (<60V) are also key design considerations in competition settings (Tu et al., 2024).
Simulation frameworks—especially those built in MATLAB/Simulink enable rapid development and performance validation of electric powertrain systems. (Wang et al., 2023) presented a multi-domain simulation model incorporating motor control, battery depletion, and dynamic load estimation. Studies such as (Tashen et al., 2024) show that simplified but well-calibrated simulation models can predict real-world performance to within 5% accuracy. (Khorrami, Krishnamurthy and Melkote, 2003) also highlight the value of including nonlinear motor behaviour and regenerative braking in control system simulations to improve response and energy management.
In summary, recent literature supports the use of BLDC motors, chain-driven single-motor configurations, and modular lithium-ion battery systems for Shell Eco-marathon vehicles and related applications. The emphasis on system integration, modular simulation, and component-level validation reflects a maturing field that balances academic rigor with real-world constraints. While more advanced technologies—such as axial flux motors, adaptive transmissions, or real-time thermal modelling show promise, they remain out of reach for many student-led teams due to budget and complexity. The current study builds on these findings, implementing a validated, cost-effective drivetrain architecture optimized for Shell Eco-marathon constraints. Its methodology grounded in recent research and supported by simulation offers a transferable framework for future developments in low-speed electric mobility, including last-mile delivery vehicles and urban micro-EVs.
2. Aim and Contributions
This paper aims to design and validate a high-efficiency electric drivetrain for a Shell Eco-marathon Urban Concept vehicle, using a system engineering approach. The key contributions are:
- A novel drivetrain architecture using a 48V, 1500W Brushless DC (BLDC) motor coupled with a two-stage chain transmission and open differential, optimized for compactness and reliability under budget and packaging constraints.
- Simulink-based dynamic modelling that estimates energy consumption, torque profiles, and battery state-of-charge under a realistic Shell Eco-marathon drive cycle.
- Structured engineering methodology, including Pugh matrix evaluation for component selection and gear ratio optimization.
- Component-level design innovation, including a modular sprocket system, battery safety tray compliant with competition rules, and differential mounting scheme.
- Real-world relevance, as the methods and components are applicable to low-speed electric mobility platforms such as campus shuttles, delivery carts, and urban micro-EVs.
By addressing a documented gap in simulation-integrated, competition-constrained EV design, this work provides a transferable framework for future Shell Eco-marathon teams and lightweight EV developers.
3. Powertrain Design
This section presents the full design process of the Shell Eco-marathon Urban Concept vehicle’s electric powertrain, covering initial vehicle calculation, system architecture, component selection, drivetrain configuration, and gear ratio optimisation. The focus is on efficiency, reproducibility, and compliance with competition rules.
3.1. Initial Vehicle Calculations
Traction Force Calculation
Since it was still the early stage of design for most of the sub-teams, traction force was calculated based on assumptions as shown in Table 1, such as maximum allowable vehicle mass (225 kg) and maximum frontal area (1.3 m x 1.3 m). Typical values of rolling and drag coefficients were obtained from literatures (Hucho and Sovran, 1993; Arghir, Ilie and Leu, 2013). Wheel diameter was taken from last year’s design as the decision on wheel size was out of scope of the Unsprang team project this year. The duration and distance of the 2025 race had not been announced by the time this project was conducted; hence the average speed was referenced from the race of previous years, which was around 25km/h.
Average speed of the vehicle is calculated as:
By dividing the average speed by acceleration time, the acceleration of the vehicle is:
The traction force consisted of three components; acceleration, rolling and drag force. Climbing force was ignored in this calculation as the elevation of the circuit was minimal and the net gradient of each lap would be zero.
The torque, power and energy needed for the vehicle to accelerate and maintain average speed throughout the duration were calculated as follows. The energy consumption could then be calculated by dividing energy by the distance of the race.
From this, the required battery rating was calculated. A 10% cutoff in battery discharge was employed to ensure the health of battery.
All data calculated are presented as a summary in Table 2
3.2. Design Overview
3.2.1. High-Level Architecture
The electric powertrain developed for the Shell Eco-marathon Urban Concept vehicle comprises four key components, designed to maximize efficiency, reliability, and maintainability within strict regulatory and budgetary constraints:
- Brushless DC (BLDC) Motor: A 1500 W, 48 V BLDC motor was chosen due to its high efficiency (~85%), strong power-to-weight ratio (5.5 kg), and low maintenance requirements. Mounted centrally, it delivers consistent propulsion and integrates seamlessly with the chassis design.
- Two-Stage Chain Drive Transmission: This modular system enables a high gear ratio (12:1) and a medium gear ratio (8:1) using compact sprockets, ideal for varied speed targets (e.g., 25 km/h and 40 km/h). It efficiently transfers power from the motor to the rear axle while minimizing mechanical losses and addressing spatial constraints within the chassis.
- Battery Pack: A custom 12S8P lithium-ion battery pack, built from Molicel P28A 18650 cells, serves as the energy source. It delivers a nominal 43.2 V and approximately 967 Wh—within the Shell Eco-marathon’s regulatory limit of 1000 Wh and 60 V.
- Motor Controller + DC-DC Converter: A programmable controller governs motor torque based on PID-calculated torque demand, while a Victron DC-DC converter powers auxiliary systems. Integrated current, voltage, and SoC monitoring ensures safe and efficient energy management throughout the drive cycle.
This architecture offers a robust combination of high performance, modularity, and cost-effectiveness, tailored for ultra-efficient vehicle competitions and real-world micro-mobility applications.
This configuration was validated using a MATLAB Simulink simulation framework. Results confirmed energy consumption of just 20.95 Wh per lap, with high fidelity speed tracking and effective torque response across the Shell Eco-marathon drive cycle.
3.2.2. Block Diagram of the Full Powertrain System
The goal of the simulation was to model the energy consumption and driving performance of an electric powertrain vehicle using a 48V 1500W Brushless DC motor rated at 4.78 Nm, 3000 rpm, and 39A peak current, paired with a designed battery pack from last year’s powertrain team with the Molicel P28A 18650 lithium-ion cells. The model was created entirely using basic Simulink blocks as shown in Figure 3.
The simulation structure follows a modular architecture:
- Drive Cycle Source: A 293-second drive cycle map with the vehicle’s target speed over time based on the Shell Eco-marathon track.
- Speed Control Loop: A PID controller compares reference and actual speed to generate the torque demand.
- Electric Drive Unit (EDU): Converts voltage and torque input into shaft speed and current drawing based on the motor’s performance characteristics.
- Battery Model: Simulates the voltage and state of charge (SoC) dynamics using input current and internal resistance logic.
- Vehicle Dynamics Block: Transfer motor torque into forward motion, factoring in simplified drivetrain losses and rolling resistance.
- Distance and State of charge (SoC) Tracking: Total distance traveled and SoC are calculated over time.
- This approach will allow estimation of how long the vehicle can run and how far it can travel on a full battery, under the idealized drive cycle.
Material selection was based on efficiency. The selected motor was a 48 V, 1500 W brushless DC motor capable of delivering 4.78 Nm at 3000 rpm, with a current draw of up to 39A. The power source consisted of Molicel P28A 18650 lithium-ion cells, selected for their high discharge rate (up to 35A) and stable voltage underload. A simple 12 series 8 parallel battery model was used, estimating voltage and state of charge (SoC) from the current drawn using the energy balance equations.
The simulation also includes the safety requirements by ensuring that the discharge current and voltage remained inside the Shell Eco-marathon 2025 Official Rules.
3.3. Motor and Transmission Selection
3.3.1. Motor Selection Justification
In the Figure 4, the selected 1500W, 48V Brushless DC (BLDC) motor offers a compelling balance of efficiency, power density, and control simplicity. As highlighted in Monteiro et al. (2021), BLDC motors outperform induction, brushed DC, and reluctance motors across multiple criteria: efficiency (>90%), weight, size, and maintenance. The chosen motor achieves 85% rated efficiency and a compact 5.5 kg weight, suiting the space-constrained and low-speed demands of the Urban Concept platform. Unlike PMSMs, which offer slightly better performance but at a higher cost and complexity, the BLDC motor aligns with both technical and financial constraints of the project.
Its technical specifications were listed below:
- Rated power = 1500 W
- Rated voltage = 48 V
- Rated current = 39.06 A
- Rated torque = 4.78 Nm
- Rated speed = 3000 rpm
- Efficiency = 85%
The speed and torque of the motor when operating at its maximum efficiency point are 2991rpm and 2.91 Nm. While at its maximum torque point, the speed and torque are 2944rpm and 5.15Nm as shown in Table 3
3.3.2. Gear Ratio Calculation
Considering that the vehicle should be able to run at its highest efficiency at two different speeds: 25 km/h for the Super mileage challenge and 40km/h for the Shell Eco-marathon regional championship, two gear ratios were needed to achieve that.
The equation below showed the relationship between gear ratio, speed, and torque. It was seen that gear ratio (represented by the ratio between the diameter d of driven and driving gears) was positively proportional to torque (T) and inversely proportional to speed (n). Therefore, when gear ratio was raised, torque increased and speed decreased.
Based on the motor speed and torque during different motor operations listed in Table 4, the resulting speed and torque at the wheels at different gear ratio was calculated. It was found that gear ratio of 12 and 8 allowed the motor to operate most efficiently when cruising at 25 km/h and 40 km/h, respectively.
Drivetrain layout Torque and power transmission from motor to wheels was considered in this section. Three common types of drivetrains were being compared: gear, chain and belt as shown in Figure 5.
The pugh matrix in Table 5 was done based on six criteria, most of them were the same as those in the motor layout pugh matrix in the previous section, except for the cost which was now considered slightly lower because its importance was less significant when the cost differences among the options were small. A new criteria ‘maintenance/replacement’ indicated the ease of maintaining and replacing the components in the drivetrain, especially when switching gear ratio was required during the race event. As a result, this factor was given high priority with a score of 6.
Gear and chain drive were scored close in the pugh matrix analysis. The individual criteria score in efficiency, reliability and compact of gear drive were the highest among the options, because gears are driving each other directly which eliminated the losses or potential failure in the median component like chain or belt. However, its weight and cost, and the complexity in maintenance or replacement were all the highest among the options, which made it a few scores lower than chain drive overall. On the other hand, chain drive performed moderately in all the criteria, and was the easiest in maintenance and replacement, resulting in it scoring the highest overall. Based on the result, the team finally decided on adapting chain drive in the vehicle.
3.3.3. Comparative Decision Matrix (Pugh Chart)
As stated in the Shell Eco-marathon rule, a maximum of two motors were allowed to be employed in the vehicle. The team has proposed three potential motor layouts as shown in Figure 6: single motor with transmission, independent dual-motor, dual-wheel-motor. Single motor configuration was commonly adapted in internal combustion vehicles with a single power supply from the engine, power was transmitted to the wheels through transmission and differential. Independent dual motors utilized the benefit of multiplying torque through gears ratio while enhanced the control of wheels through driving wheels independently, hence there was no need of differential in this configuration. Dual in-wheel motors were an advanced technology; the motors were assembled inside the wheel hub and drove the wheels directly without transmission to achieve the ultimate control of wheels.
Motor(s) with a total rating of 1500 W would be suitable for producing the required power, i.e., incorporating a 1500 W motor in a single-motor layout or two 750 W motors in a dual-motor layout. For comparison, the cost and weight of the motors of the mentioned ratings from Brushless were taken as an example. From the Table 6, the estimated cost and weight of the motors alone in a dual-motor configuration would be £545.5 and 9 kg, compared to £334.29 and 5.5 kg for a single-motor configuration. In-wheel motors were believed to be more expensive than conventional electric motors due to the complex integration parts and high torque output.
The pugh matrix in Table 7 analyzed the suitability of the three motor layouts based on eight criteria weightings from 1 to 10 as shown. Considering that the vehicle would be built for the Shell Eco-marathon application, efficiency and lightweight were weighed the most with a 10 and 9 respectively, while vehicle performance and riding comfort were weighed the least of three because the demand in handling and long-distance driving was low. Other criteria such as reliability, size, control complexity and cost were weighed either 6 or 7. Control complexity was weighed high in this case because the members in the team were not specialized in electrical related areas and were unconfident in designing a complex motor controller.
Single motor and dual in-wheel motor configurations had similar scores. Dual in-wheel motor configuration performed the best in efficiency and lightweight, as well as being the most compact due to the lack of transmission which spares more space for practical usage. However, single motor configuration, due to its simplicity, outperformed the in-wheel motor configuration in aspects like reliability, cost, and control complexity, making it the team’s final decision.
The single-motor configuration was selected for its superior cost-efficiency, simplicity, and ease of integration with the mechanical layout. While dual and in-wheel setups offered certain advantages, their added weight, control complexity, and cost disqualified them under current project goals. This methodical selection process ensured the powertrain achieves top performance while staying compliant with Shell Eco-marathon technical regulations and within budget.
3.4. Battery Pack Design
3.4.1. Cell Layout
To power the Shell Eco-marathon Urban Concept vehicle within the strict competition constraints, the team designed a custom lithium-ion battery pack using Molicel P28A 18650 cells. The adopted layout is a 12S8P configuration, meaning twelve cells in series and eight in parallel, for a total of ninety-six cells. The battery pack designed last year consisted of 96 Molicel P28A cells in the layout of 12S8P as shown in Error! Reference source not found.. Specification of the design was listed in Table 8.
The team had validated their battery design through Simulink simulation. The motor they had chosen was a 3 kW 48 V motor from Golden Motor company. The results showed that the vehicle equipped with this battery pack could travel 20.862 km before charge depletion, which was equivalent to over 41 minutes travelling time if the vehicle were to maintain at a speed of 30 km/h. The total cost and mass of the battery pack was around £860 and 8.5 kg, respectively. The team also decided on other accessories such as battery management system and charger. The Molicel P28A cells were chosen due to their high discharge rate (up to 35A), stable voltage characteristics, and competitive energy density. Each cell provides a nominal voltage of 3.6 V and a capacity of 2.8 Ah. Configured in a 12S8P arrangement as shown in Figure 7, this pack delivers a nominal voltage of 43.2 V and a total capacity of 22.4 Ah, resulting in a usable energy of approximately 967.68 W h, which is just below the Shell Eco-marathon regulatory limit of 1000 W h.
3.4.2. Electrical Specifications
The battery pack was constructed using 96 Molicel P28A lithium-ion cells, arranged in a 12S8P configuration. This setup delivers a nominal voltage and energy capacity that aligns with the Shell Eco-marathon competition rules.
Key Specifications:
Configuration: 12 cells in series × 8 in parallel (12S8P)
Total number of cells: 96
Nominal voltage: 43.2 V
Total energy capacity: 967.68 W h
These values were derived from the known parameters of individual Molicel P28A cells, each rated at 3.6 V and 2.8 Ah. The 12S arrangement results in a total voltage of 43.2 V (12 × 3.6 V), while the 8P parallel grouping produces a total capacity of 22.4 Ah, resulting in a final energy capacity of 967.68 Wh.
During simulation, the system demonstrated:
Energy consumed per lap: 20.95 W h
Final SoC after 1 lap: 97.77%
Final terminal voltage after 1 lap: 47.72 V
The battery voltage and current profiles over time confirmed that the system remains within safe operational limits throughout the Shell Eco-marathon drive cycle. The current peaks (e.g., 20.066 A) were well within the discharge capability of the P28A cells (rated up to 35 A per cell), validating the design’s suitability for the targeted duty cycle.
Additionally, the battery subsystem modelled in Simulink integrated state-of-charge (SoC) tracking, internal resistance, and open-circuit voltage (OCV) estimation using lookup tables. This approach provided a realistic and dynamic representation of battery behavior underload.
Compliance with Shell Eco-marathon Rules
The design of the battery pack and electrical system complies with the Shell Eco-marathon 2025. These rules define critical constraints for voltage, energy capacity, placement, and safety systems, all of which were adhered to in the final design.
Voltage and Capacity Limits
The system voltage is limited to 60 V, and the battery energy capacity must not exceed 1000 Wh. The selected battery pack (12S8P Molicel P28A cells) delivers a nominal voltage of 43.2 V and total energy of 967.68 Wh.
Battery Chemistry and Configuration
Only one lithium-based battery is allowed in the vehicle. The team's design uses a single lithium-ion pack built from 96 Molicel P28A cells.
The battery must be:
Enclosed within a solid metal containment tray or placed in a battery charging bag. Installed behind the bulkhead and outside the driver compartment. Battery Management System (BMS) Requirements
The official rules also require that the BMS must:
Be tailored to battery chemistry.
Control and protect the battery, including:
Cell balancing
Overvoltage protection during charging
Over-discharge and over-current protection
Be physically integrated into the battery package and powered directly by the battery.
The team's design includes a BMS that meets these criteria, ensuring compliance with competition safety and functionality standards.
3.5. Structural Integration
The structural integration of the powertrain components including the motor, drivetrain, and battery pack was developed to ensure a compact, manufacturable, and serviceable system that meets Shell Eco-marathon rules and packaging constraints of the Urban Concept chassis.
CAD Models and Chassis Constraints
An initial concept design was constructed based on all the decisions made in the previous sections. From the schematic diagram in Figure 8, the powertrain consisted of a single motor that drives the rear wheels through a single-stage chain drive and a differential.
The size of sprocket is defined by the number of teeth, and to achieve a certain gear ratio, the number of teeth of the larger sprocket (on the axle) should be the product of gear ratio and the number of teeth of the smaller sprocket (on the motor). Hence, when deciding on sprocket size, the smaller sprocket should be as small as possible to avoid the larger sprocket from taking up larger amount of space.
Considering that the gear ratio of 12 was quite large, the smallest sprocket size of 10-teeth was chosen for the small sprocket at the motor. The size of other sprockets is listed in Table 9.
Extensive CAD modelling was performed using CATIA to simulate the full assembly of the drivetrain and battery system within the vehicle’s rear chassis. As shown in Figure 9, the powertrain layout was validated in 3D to ensure compatibility with space limitations and mounting surfaces. A list of parts is shown in Table 10.
During the initial design, the use of a large 120-tooth sprocket as shown in Figure 10 led to interference with the chassis structure.
4. Build Instructions
This section describes the assembly process of the key mechanical components of the electric powertrain: the motor mount, two-stage chain drive, and rear differential. The design prioritizes modularity, ease of maintenance, and efficient power transmission in compliance with Shell Eco-marathon constraints.
4.1. Mechanical Assembly Procedure
4.1.1. Motor Mount Installation
The motor mount was designed and manufactured to secure the 1500W BLDC motor onto the chassis. The motor mount was designed as a rigid structure with slotted holes for chain tension adjustment without full disassembly as shown in Figure 11. This ensures both adjustability and robustness under operational loads.
The central transmission system uses a modular bracket system as shown in Figure 12, with mounts for sprockets and the intermediate shaft. This approach allows efficient assembly of the two-stage chain drive and accommodates sprocket changes for gear ratio tuning.
The battery tray was detailed in Figure 13, featuring a containment lip and top enclosure to secure the battery pack during motion. The tray design ensures the battery remains protected and restrained, while allowing access for maintenance and inspection.
Although exploded CAD models are shown, engineering drawings with dimensions, tolerances, and material specifications will be included in a future version or provided as a downloadable supplement to support full replicability.
4.1.2. Two-Stage Chain Drive Setup
A two-stage chain drive configuration was adopted as shown in Figure 14, allowing for large overall gear ratios while keeping individual sprockets compact enough to fit within the vehicle geometry. The new powertrain design adapted a two-stage chain drive linked through a pin between sprocket B and C.
The benefit of a two-stage chain drive is the possibility of achieving high gear ratio with the use of smaller sized sprockets, as the overall gear ratio is the multiplication between the gear ratio of the two sets of chain drives. The size of the sprockets is listed in
Table 11, they are chosen in a way that only sprocket B must be changed when switching between the two-gear ratio. The choice of changing sprocket B instead of sprocket D is made considering the complexity of disassembling the axle to replace sprocket D. Only one sprocket (B) needs to be changed to switch between the two designed gear ratios of 12:1 and 8:1, improving modularity during setup or tuning. Standard 428 roller chains were selected due to their high tensile strength (17.8 k N) and widespread use in motorcycle applications, ensuring robustness and availability. The battery tray was positioned outside the driver’s compartment and behind the bulkhead, in accordance with Shell Eco-marathon regulations, and aligned with space available at the rear of the vehicle.
While Error! Reference source not found. presents a preliminary single-stage sprocket sizing concept, the final drivetrain design implemented in the vehicle is a two-stage chain drive, as shown in Table 11 and validated by the CAD models in Figure 11, Figure 12, and Figure 13. This configuration allows achieving large gear ratios while accommodating spatial constraints, and it improves modularity and serviceability during gear ratio changes.
4.1.3. Differential Installation
The initial differential choice was the Formula Student limited slip differential from Drexler Automotive as shown in Figure 15, a company that supplies high-performance vehicle limited slip differentials for motorsports. The Formula Student differential weighs 4.7 kg and is compact in size, but the only concern is the price since the differential alone costs £1500-1900, and it could go up to £3000 for the whole assembly of the differential system.
The alternative is an open differential from Peerless Gear as shown in Error! Reference source not found.. The differential is designed for light weight utility vehicles and go-karts, which is suitable for the Shell Eco-marathon application. It has a more reasonable price of £300, and a weight of 5.5 kg which is less than 1 kg heavier than the Formula Student differential. Considering that vehicle handling is not the focus of the design, and the cost differences between the two options, the team decided to adapt the Peerless differential over the Formula Student differential as shown in Figure 16.
Technical specifications of Peerless Gear differential:
- Output torque: 305 Nm.
- Weight on differential: 272.3 kg
The differential part itself is an OTS peerless 110, which is a universal chain drive differential and axle system that is used in go karts/light utility vehicles/go karts. The use of an OTS part was preferable and would save time on designing the whole assembly. The axles supplied have eight 5/16 imperial bolts spread out on a PCD, this allows us to fit our own sprocket to the assembly. The two 25mm diameter steel axles that come with the differential are too long in length as the total distance between the axles is 1000mm when it requires to be 490mm. Therefore, these axles would need to be shortened for them to fit in with our assembly. The axles themselves fit into bearing housings, which have two slotted holes, these can be bolted down onto mounts that will come up from the chassis rails. The design of these components fell within the remit of the chassis team, although in Figure 17, you can see the area in which it requires a mount.
The axles have a 5mm keyway slot on each side, which allows for the half shaft mounts to be fitted to the end of the axles as shown in Figure 18. The half-shaft mounts are planned to be manufactured from aluminum and will require an interference fit to stop them from moving axially in relation to the axles. As an interference fit requires high tolerance and a square profile is required in the center of these mounts, wire EDM lends itself to the manufacture of this internal profile. The external profile (turned diameters and mounting holes) can be manufactured by more standard methods such as manual or CNC machining. In terms of assembly, everything within the half shafts would have to be assembled and then the two half shafts would have to fit on the end by heating them up, placing them over the ends of the axle, and allowing them to cool down.
4.1.4. Modularity, Manufacturability, and Reliability
Several decisions were made to enhance modularity and manufacturability:
Chain tensioning is achieved using the adjustable motor mount slots and the idler pulley system shown in Figure 19, reducing the likelihood of slack-induced failure.
Where possible, off-the-shelf (OTS) parts were selected to reduce costs, improve ease of replacement, and ensure compatibility with available tools and materials. This structural integration approach offers high reliability, efficient space use, and ease of maintenance, all essential for competition success and compliance with Shell Eco-marathon engineering guidelines.
Electrical Subsystem Assembly
4.1.5. Battery Pack Wiring, BMS, and DC-DC Converter Installation
To comply with Shell Eco-marathon 2025 safety regulations, a Battery Management System (BMS) was integrated inside the battery enclosure. The BMS provides cell balancing, undervoltage and overcurrent protection, and automatically isolates the battery under fault conditions.
Shell Eco-marathon official rules
Vehicle design:
- The vehicle must weigh a maximum of 225 kg, with the driver weighing a minimum of 70 kg.
- The voltage of the system should be 60 V or below.
- Battery pack design:
- Maximum battery capacity is 1000Wh.
- Only one lithium-based battery is allowed.
- Must be equipped with a solid metal containment tray underneath or be enclosed within a battery charging bag.
- Must be fixed outside the driver’s compartment behind the bulkhead.
- The charger must be either purchased with the battery or purpose-built specifically suited to the battery.
Battery management system (BMS) design:
- Must be tailored to chemistry to control and protect the battery.
- Must provide cell balancing and overvoltage protection during off-track charging.
- Must automatically isolate the battery (with an additional requirement of providing cell level over-discharge and over-current as part of the on-vehicle system).
- Must be in the physical battery package and be powered directly by the battery.
- Drivetrain design:
- A maximum of two electric motors can be equipped in the drivetrain.
- Electric motors can be either purchased and modified or purpose-built.
- Motor control must be purpose-built.
The battery pack detailed in Figure 20 is mounted in a 3 mm-thick aluminum containment tray to meet structural and fire safety guidelines. It is attached to the chassis using four M6 hex bolts, reinforced by plastic 3D-printed straps, and enclosed with a vacuum-formed plastic lid for secure and accessible maintenance.
The battery tray itself is made from a 3mm aluminum plate, which is planning to be water jet cut. Water jet cutting is a suitable technique for this type of design as it is a large flat workpiece with features that are all in one plane. The battery pack itself can then be bolted down to the plate using four hex head M6 bolts with plastic 3D printed straps that can sit over the top of the pack. It is important for the top strap and where feasible components are made of plastic, in case of shortage of damaged cells. The plastic lid is manufactured using vacuum forming, the mold for the vacuum forming can be made using 3D printing. There are clips on either side for the lid, which are used to make the cover easily removable in case it needs to be accessed easily by engineers on race day.
A Victron Orion-Tr 48/12-9A DC-DC converter steps down the 48 V battery supply to 12 V for auxiliary systems. With a compact footprint (100 × 113 × 47 mm) and 0.42 kg weight, it supports PWM-adjusted output and achieves 87% efficiency, making it suitable for driving lighting and electronics.
To ensure a stable voltage supply for other low-voltage electrical components within the system, such as VCU, sensors, lighting systems, windscreen wiper, a DC-DC converter is required to step down the 48 V battery voltage to 12 V, which is a standard voltage for most of the auxiliary components in a vehicle system. The team selected an isolated 48V to 12 V DC-DC converters from Victron Energy for the vehicle, as shown in Figure 21.
A DC-DC converter plays a key role in electric vehicle powertrain where it can be designed as unidirectional or bidirectional. In this case, a unidirectional DC-DC converter is mandatory as it requires a “Step-Down” (buck) function, as high battery voltage does not suit the other electrical loads (sensors, lights, windscreen wiper, control units, etc.). However, sometimes converting the 48V to 12V needs to be adjustable because some carloads may require outputs in the 12.5V to 15.5V range or other loads can require higher voltage, such as power steering system (Donaldson, 2025).
In this case, a DC-DC has been chosen due to its specifications of adjustable output voltage according to the PWM duty cycle (can be also used as a battery charger), unlimited number of units can be connected in parallel, and the output current is reduced at high ambient temperatures. The DC-DC step down converter has 87% higher efficiency and excess energy is not wasted as heat, but it is efficiently stored and transferred using the inductor and capacitor. It has the advantage of being compact and lightweight (100 x 113 x 47 mm / 0.42kg) (Victron Energy, 2025).
4.1.6. Motor Controller Wiring Diagram
The custom-built motor controller uses:
- MOSFET-based power switching
- Potentiometer-based throttle input
- Inputs from the BMS include battery voltage, motor temperature, and current sensing.
- External signals from the brake switch, ignition key, and cooling fan control
As illustrated in Figure 22 of the report, the controller connects to the motor via U/V/W three-phase outputs. It receives 48 V power input from the battery and 12 V auxiliary input from the DC-DC converter. The controller also routes a PWM signal to the cooling fan, allowing thermal management based on load and ambient conditions. All signal wiring is low-voltage, while power wiring uses 10 AWG silicone-insulated copper cables, chosen for their high current capacity and flexibility during installation.
Motor controllers are devices designed to control the electric motor (start, stop and speed). They can be manually operated or programmed to work automatically; they can also be manually designed or bought off the shelf ready to be installed. The most common functions are starting and stopping the motor, selecting the rotational speed, and regulating or limiting the torque.
The DC motor controller that is primarily used to control the speed and torque of urban concept electric vehicles. As mentioned above, the H.V. is the side of the battery that feeds the motor (48 V) and the L.V. is the 12 V step down, that feeds the motor controller and other low-power usage electronics. The motor controller must be built-in-house and most of the parts are available and cheap to purchase, such as MOSFET (Metal-Oxide-Semiconductor Field-Effect Transistor) transistors (voltage-controlled), potentiometer (variable resistor to control the voltage supplied to the motor), resistors (protecting the transistor and potentiometer), wires and breadboard (connecting the components). It can be considered using MOSFET transistors because they are more energy efficient as it requires minimal current to maintain the device’s state at the gate, rather than NPN transistors. The NPN transistors are a type of bipolar junction transistors (BJTs) that use current flow through the base terminal. In simple words, they require the current flow from base to the emitter (IndMALL, 2025).
4.1.7. Connection Schematics for Reverse Gear Logic
To meet customer requirements for maneuverability on campus, a reverse drive mode was implemented. A manual toggle switch on the dashboard sends a signal to the controller’s reverse enable input pin, which is software-configured to only allow actuation when the vehicle is stationary. This avoids mechanical complexity and satisfies competition safety expectations. A requirement to limit the system voltage to 48 V or below was given, to allow safe charging of the vehicle within the university area. The vehicle will also be likely to be driven around the university; hence a reverse gear is needed. The total budget for building the vehicle is £13,500.
5. Operating Instructions
5.1. Power System Initialization
Battery Charging, Voltage Check, and Fuse Configuration
Before powering the vehicle, ensure that the custom-built battery pack is charged using a charger specifically tailored to the Molicel P28A lithium-ion cells, in accordance with Shell Eco-marathon rules. The charger must either be supplied with the battery or purpose-built for its chemistry. The nominal voltage of the pack is 43.2 V, staying well within the 60 V limit specified by the competition. Prior to startup, verify the battery voltage using a multimeter across the main terminals. Charging should only proceed if all cell voltages are within safe thresholds monitored by the Battery Management System (BMS). Fuse ratings are not explicitly specified, but overcurrent protection must be implemented via the BMS. Ensure that protective devices are rated appropriately for the peak current draw of 39 A and check continuity across circuits before applying power.
5.2. Drive System Operation
5.2.1. Motor Control via Throttle
Motor control is managed through a PID-based feedback loop implemented in the Simulink model. The driver input from the throttle determines the torque demand, which is processed in real time to maintain the desired velocity with minimal overshoot. The vehicle followed the drive cycle with minimal overshoot, maintaining control throughout as shown in Figure 23.
The Electric Drive Unit (EDU) block, illustrated in Figure 24, interprets the torque signal and delivers electrical current to the 1500 W BLDC motor. This system was simplified for simulation using a fixed operating point, but its logic supports stable throttle-to-motor control for smooth acceleration.
5.2.2. Stop/Go Cycle Behaviors and Safe Shutdown
The Shell Eco-Marathon Urban Concept category requires a stop-and-go profile during competition. This is simulated using a drive cycle that includes acceleration, cruising, and stopping phases. The vehicle is optimized to operate at 25 km/h and 40 km/h using gear ratios of 12 and 8 respectively as shown in Table 4. For safe shutdown, first release the throttle fully to bring the vehicle to a stop. Then isolate power using the system kill switch described in the electronics layout. Although does not specify wait times, a brief cooldown period is advisable to allow heat dissipation, particularly after extended operation.
5.3. Safety Measures
Thermal Considerations
BLDC motor characteristics highlight that the absence of brushes and rotor winding reduces internal heat generation. This contributes to the motor’s high efficiency and reliability under low-speed, low-load conditions typical of Shell Eco-marathon use. However, continuous operation at peak power may still cause heating. The system does not use forced cooling, so passive air ventilation around the motor and controller must remain unobstructed. Operators should monitor casing temperature, particularly in warm environments.
Electrical Isolation, BMS Alerts, and Mechanical Tolerances
The BMS is responsible for electrical protection. It must detect and respond to:
- Overvoltage during charging
- Over-discharge during operation
- Over-current conditions
- Cell imbalance
The BMS is physically integrated into the battery pack and powered by it, ensuring autonomously cutoff in case of fault. Mechanically, the drivetrain includes a two-stage chain system, and chain reliability is supported by proper tension and alignment. Chain slack must be inspected before each run to avoid derailment or loss of efficiency.
Wear on sprockets and alignment of the intermediate shaft should be checked visually. The team selected a high-strength 428 chain to improve durability beyond what is required under normal load, reducing maintenance risks. The 428-roller chain, commonly used in motorcycle applications, was chosen for the drivetrain. According to BS 228:1994, the tensile strength of a 428-roller chain is 17.8kN, which is more than capable of sustaining the force from the motor (British Standards Association, 1994). As chains can be a typical failure point, going for a chain that is more durable than required can supply more reliability.
6. Validation
The simulation confirmed that the powertrain met the efficiency objective of 20.95Wh per lap while satisfying all dynamic and electrical performance criteria. These outcomes validate:
- The effectiveness of the drivetrain architecture and gearing strategy.
- The reliability of the motor-battery pairing under varying load conditions.
- The control system’s capability to manage velocity targets with precision.
This validation process provides additional assurance of model fidelity, rule compliance, and overall readiness for Shell Eco-marathon competition deployment.
6.1. Model Overview
Description of Vehicle Model Blocks
The simulation model was developed in MATLAB/Simulink to evaluate the electric powertrain's energy efficiency and control performance. The vehicle system was divided into key functional blocks:
Electric Drive Unit (EDU): This block replicates the behavior of the 48 V, 1500 W Brushless DC motor. It receives torque demand from the PID controller and simulates the resulting rotational speed and current drawing based on motor characteristics as shown in Figure 25.
To construct a realistic drive cycle map, acceleration values were estimated based on track geometry, elevation changes, and cornering. By analyzing the track map and elevation, sections with uphill slopes were added acceleration to account for the increased load, while downhill sections used a controlled deceleration to reflect the motor braking (no coasting). Cornering speeds were assumed to be based on typical safe speeds for tight or complex turns. Transitions between different speed sections were modelled using the same acceleration or deceleration, calculated from the difference in target speeds and estimated lengths, ensuring a smooth and realistic speed across the track.
The input to the system was a Drive Cycle Source, representing one full competition lap of stop and go. This represents the Shell Eco-marathon track and was used as reference speed. This reference signal was continuously compared to the vehicle’s actual speed to determine the speed difference. To reduce this difference and achieve stable vehicle control, a PID Controller was used. The output of the PID controller was converted as a torque demand signal. This output was then transferred into the Electric Drive Unit (EDU) block, which converts this signal into electrical current and RPM. Initially, we intended to use a 2D Lookup table to accurately capture the motor’s nonlinear behavior based on input torque and speed. However, due to insufficient data on the full torque-speed-voltage map, we had to simplify the EDU block and use a fixed operating point instead. This meant using constant values for efficiency and torque constant based on the rated specifications of the motor (48V, 1500W, 4.78 Nm at 3000 rpm).
Equations for torque and current at the point of maximum efficiency:
Battery Subsystem: The battery block simulates voltage, current, and SoC over time using internal resistance and discharge modelling. It is based on a 12S8P configuration of Molicel P28A cells, designed to remain within Shell Eco-marathon limits as shown in Figure 26.
The battery block used the Molicel P28A 18650 lithium-ion cell and tracked State of Charge (SoC) by keeping track of how much current flows in or out of the battery over time. When the battery supplies power (discharging), the SoC goes down. When it is charged, the SoC goes up. The SoC was calculated by integrating the negative current over time, scaled by the total capacity of the battery in ampere-hours (Ah). This integration assumes 100% efficiency, meaning all the current going in or out changes the charge level directly and no losses were made.
Equation used for SoC as follows:
As shown in the Simulink diagram, SoC is fed into two lookup tables:
- f.
- Open-Circuit Voltage (OCV) which provides a voltage estimate based on SoC.
- g.
- Internal Resistance (Rint) which provides resistance variation across SoC.
These values are used to calculate the terminal voltage of the battery using Ohm’s Law. The internal voltage drop (Vr) is calculated as:
Then, the terminal voltage is shown as:
This structure enables a more dynamic and realistic voltage output as the battery discharges, with both resistances rise and OCV drop considered. The model does not include any thermal effects or aging but offers a good balance between accuracy and computational simplicity for range estimation purposes.
Vehicle Dynamics Block: This component models longitudinal motion using input torque, factoring in rolling resistance and aerodynamic drag. It outputs vehicle speed and distance travel, linking electrical and mechanical subsystems as shown in Figure 27.
The output torque from the EDU was then passed to the Gearbox and Tire block, where it was converted into a tractive force (Ft) using the wheel radius of (r) 0.28575 m and gear ratio of twelve. The forward motion of the vehicle was simulated using a Vehicle Dynamics block that applied Newton is second law, calculating the acceleration and velocity from the net force.
Equation used as follows:
To calculate distance, the vehicle speed was passed through an integrator block. The signal created was multiplied by a factor (1/1000) to give the total distance travelled in kilometers. These blocks were implemented modularly to enable independent testing and ensure fidelity before full system integration.
Inputs: Drive Cycle, Terrain, Motor Specifications
Drive Cycle: The simulation uses a custom-developed 293-second drive cycle with varying target speeds, simulating start-stop motion, and moderate acceleration phases typical of Shell Eco-marathon events.
Terrain Considerations: The elevation effects were simplified into acceleration profiles within the drive cycle itself. Additional slope data was encoded into the speed reference trajectory to simulate increased load during uphill segments and controlled deceleration downhill.
Motor Specifications: The model uses a 48 V; 1500 W; BLDC motor rated at 4.78 Nm and 3000 rpm. The EDU block was developed using mathematical equations representative of this motor's speed-torque-current behavior.
6.2. Simulation Results
As recorded in Table 12, the vehicle consumed 20.95Wh of energy per lap. This value was computed by integrating instantaneous power draw across the duration of the lap and normalizing it by lap distance. The figure demonstrates that the system meets the Shell Eco-marathon’s stringent energy consumption criteria.
Figure 28 shows that the battery SoC dropped from 100% to approximately 97.77% during one lap. The steady slope of the curve reflects stable current drawing and validates the energy consumption result. This outcome confirms that the drivetrain is well within the 1000 Wh battery energy limit and allows for multiple laps without recharging.
As illustrated in Figure 29, the actual vehicle speed closely follows the reference profile. This demonstrates the effectiveness of the PID controller in delivering smooth and accurate tracking of the target velocity, including during transition phases such as acceleration and braking.
Validation: Match to Expected Efficiency
The results presented in this study are based solely on simulation. Experimental validation (e.g., power measurements, range tests, efficiency verification) has not yet been conducted. As such, real-world performance may vary due to factors not captured in the model, including drivetrain losses, weather effects, and thermal behavior. Uncertainty analysis and physical testing are recommended as the next steps.
The achieved energy consumption of 20.95 W h per lap matches the design team's expected target, confirming the drivetrain’s efficiency and the accuracy of the simulation framework. Additionally, voltage and current remained within the safe operating range of the battery cells, and discharge levels complied with Shell Eco-marathon electrical constraints.
7. Discussion
Simulation results confirm that the developed electric powertrain is well-suited for the Shell Eco-marathon competition. The model completed a 45.78 km drive cycle consuming only 20.95 W h, corresponding to an energy consumption of 45.8 W h/km. This exceptionally low figure reflects a highly optimized drivetrain and control system, designed for low-speed, low-load operation.
The PID controller ensured accurate velocity tracking with minimal overshoot, maintaining close adherence to the target speed profile. The battery model, based on SoC-dependent open-circuit voltage and internal resistance lookup tables, exhibited realistic dynamic behavior. Voltage rises during low current demand were consistent with lithium-ion characteristics. Only 2.23% of the battery’s usable capacity was consumed over one lap, with SoC decreasing from 100% to 97.77%.
The powertrain achieved efficiency levels over 250 times greater than typical road-going EVs, which consume 11,000–18,000Wh/100 km (U.S. Environmental Protection Agency, 2022). This performance stems from a lightweight design, reduced rolling resistance, and operation at low average speeds.
Key system components included a 48 V, 1500 W BLDC motor and a two-stage chain transmission, selected through a Pugh matrix. The drivetrain offered high gear ratios (8:1 and 12:1) while maintaining compactness and mechanical efficiency. These ratios allowed operation near the motor's peak efficiency points at both 25 km/h and 40 km/ representative of super mileage and Eco-marathon targets.
The design complies fully with Shell Eco-marathon 2025 regulations. System voltage remained within the 60 V limit, and the 12S8P Molicel P28A battery pack provided 967.68Wh—under the 1000Wh cap. Safety measures included a compliant BMS, a metal-enclosed battery located behind the driver bulkhead, and protections against overvoltage and overcurrent.
Limitations and Future Work
While the simulation demonstrates impressive performance, several limitations must be addressed:
- Simplified component models: Nonlinear motor dynamics, regenerative braking, and thermal effects were excluded, limiting prediction accuracy under extended or variable conditions.
- No thermal/mechanical durability modelling: Effects of torque-induced stress, vibration, and heat buildup on drivetrain components were not simulated.
- Idealized drive cycle: The 293-second profile does not reflect real-world variability such as weather conditions or driver behavior.
- Drivetrain wear not modelled: Chain degradation, slippage, and tension loss over time were not captured.
- Motor Model Limitation and Future Improvement: The current simulation model uses a fixed operating point for the motor, derived from rated torque and speed values, rather than a full torque-speed-efficiency map. This simplification was made due to the unavailability of detailed manufacturer performance curves for the selected BLDC motor. However, this approach may lead to inaccuracies in representing motor behavior under dynamic load or varying RPM conditions. Future versions of the model should incorporate manufacturer-supplied or experimentally derived 2D torque-speed maps via lookup tables to more accurately simulate efficiency, current draw, and thermal load across the operating range.
Future iterations should integrate detailed thermal and mechanical modelling, regenerative braking strategies, and hardware-in-the-loop testing to improve the predictive validity of the simulation and ensure real-world robustness.
8. Conclusions
This study presented the design, simulation, and partial implementation of a high-efficiency electric powertrain for a Shell Eco-marathon Urban Concept vehicle. The system was developed through a rigorous engineering methodology, combining data-driven component selection, CAD-based integration, and dynamic performance validation via MATLAB/Simulink.
A 1500 W, 48 V brushless DC motor was selected for its balance of efficiency, weight, and cost. The drivetrain utilized a two-stage chain drive with interchangeable gear ratios (12:1 and 8:1), enabling optimal motor performance at target speeds of 25 km/h and 40 km/h. The battery pack, based on a 12S8P Molicel P28A lithium-ion configuration, was designed to meet competition constraints and demonstrated sufficient range and performance during simulation.
The Simulink model incorporated control logic, drivetrain dynamics, and battery SoC behavior, verifying that the vehicle can complete over 45 km per charge with energy consumption of just 20.95 W h per lap. Mechanical integration of the drivetrain components was achieved using a modular design strategy with attention to manufacturability and serviceability. While the motor control was not finalized, a foundation was laid for its development.
The total powertrain mass was contained within 35 kg, representing only 12% of the vehicle’s maximum weight allowance, and the total cost remained within the overall budget. All major subsystems were validated through either simulation or physical design documentation.
To further enhance the project’s replicability, future iterations will include detailed 2D engineering drawings for all custom-fabricated components, allowing teams to reproduce the powertrain without needing to reverse-engineer from renders.
The project successfully demonstrated scalable and efficient electric powertrain architecture suitable for Shell Eco-marathon constraints and real-world low-speed applications. Future work will focus on completing the motor controller, conducting physical testing, and further optimizing energy management strategies. The methodologies, component choices, and validation framework established here can serve as a foundation for subsequent development in ultra-efficient electric vehicle design.
Supplementary Materials
The following supporting information can be downloaded at the website of this paper posted on Preprints.org.
Author Contributions
K.H.; major contribution: conceptualization; methodology; data curation; writing—original draft preparation; writing—review and editing, S.P.; major contribution: conceptualization; methodology; visualization; supervision; project administration; resources, A.D.C. critique of assumptions and limitations; J.J., L.S.H., S.S. and R.Y.; major contribution: methodology; software; validation; formal analysis; investigation. All authors read and approved.
Funding
The authors declare no specific funding was received for this study.
Data Availability Statement
Data and materials are available upon reasonable request.
Acknowledgments
The authors would like to thank Coventry University and staff of the Faculty of Engineering for their support and access to laboratory equipment.
Conflicts of Interest
The authors declare no conflicts of interest.
| Name | Type | Description |
| CAD | Cad File (Catia V5) | The full CAD Modelling assembly design of the drivetrain and battery system |
| Ev model withdrive cycle | Simulink Model (.slx) | Eco shell marathon 2025 prototype electric vehicle Simulink model. |
| 6053MAA_Innovation_Group_Industrial_Report | Word document (.docx) | Automotive product innovation industrial report |
| BoM_EV_Powertrain | Excel Worksheet (.xlsx) | Bill of material powertrain design |
| Efficiency-Oriented_Drive_Cycle_Map_NEW | Excel Worksheet (.xlsx) | Efficiency-oriented drive cycle map data (Time-speed) |
References
- Arghir, M., Ilie, A. and Leu, V. (2013) ACTA TECHNICA NAPOCENSIS STUDY OF ROLLING RESISTANCE MECHANISM, Series: Applied Mathematics and Mechanics.
- Bhatt, N., Mehar, H. and Sahajwani, M. (2018) Electrical Motors for Electric Vehicle-A Comparative Study. http://ssrn.com.
- British Standards Association (1994) ISO-606-1994 Specification for short-pitch transmission precision roller chains and chain wheels. British Standards Association.
- Childs, P.R.N. (2018) Mechanical Design Engineering Handbook (Second Edition). Elsevier Science & Technology. [CrossRef]
- Cichoński, K. et al. (2014) Cichoński and other, The Comparative Study of Drivetrain of High-Performance Electric Vehicle, DIAGNOSTYKA.
- Dai, K. et al. (2022) ‘Modelling and Adaptive Tension Control of Chain Transmission System with Variable Stiffness and Random Load’, IEEE Transactions on Industrial Electronics, 69(8), pp. 8335–8345. [CrossRef]
- Deepak, K. et al. (2023) ‘In-Wheel Motor Drive Systems for Electric Vehicles: State of the Art, Challenges, and Future Trends’, Energies. MDPI. [CrossRef]
- Donaldson, P. (2025) DC-DC converters, Retrieved from E-mobility Engineering. https://www.emobility-engineering.com/dc-dc-converters/ (Accessed: 7 June 2025).
- Friction Facts (2012) ‘Gates Carbon Belt Drive efficiency vs traditional single - Friction Facts’.
- Hao, Z. et al. (2022) ‘A Review of Axial-Flux Permanent-Magnet Motors: Topological Structures, Design, Optimization and Control Techniques’, Machines. MDPI. [CrossRef]
- Haron, M.F. Bin (2011) ENGINE SELECTION AND DESIGN OF POWERTRAIN FOR SIMPLE VEHICLE FOR OPTIMUM FUEL CONSUMPTION.
- Hatletveit, S.R. and Aasland, K.E. (2018) Development of an Energy Efficient Powertrain for a Shell Eco-Marathon Vehicle.
- Hucho, W. and Sovran, G. (1993) ‘Aerodynamics of Road Vehicles’, Annual Review of Fluid Mechanics, 25(1), pp. 485–537. [CrossRef]
- IEA (2024) World Energy Outlook 2024. www.iea.org/terms.
- IndMALL (2025) Is MOSFET PNP or NPN? , Retrieved from Challaturu IndMALL Automation. https://www.indmall.in/faq/is-mosfet-pnp-or-npn/#:~:text=This%20distinction%20allows%20MOSFETs%20to,switching%20and%20amplification%20in%20circuits (Accessed: 7 June 2025).
- Jacoby, C.L. et al. (2015) ‘Design of a Clutchless Hybrid Transmission for a High-Performance Vehicle’, in. ASME International. [CrossRef]
- Jneid, M.S. and Harth, P. (2023) ‘Blended Regenerative Anti-Lock Braking System and Electronic Wedge Brake Coordinate Control Ensuring Maximal Energy Recovery and Stability of All-Wheel-Motor-Drive Electric Vehicles’, Journal of Transportation Technologies, 13(03), pp. 465–495. [CrossRef]
- Khorrami, F., Krishnamurthy, P. and Melkote, H. (2003) Modeling and Adaptive Nonlinear Control of Electric Motors. Berlin, Heidelberg: Springer Berlin Heidelberg. [CrossRef]
- Łebkowski, A. (2017) ‘LIGHT ELECTRIC VEHICLE POWERTRAIN ANALYSIS’, Scientific Journal of Silesian University of Technology. Series Transport, 94, pp. 123–137. [CrossRef]
- Maria Maia Marques Líbano Monteiro, A. et al. (2021) Development of the Powertrain System for a Shell Eco-marathon Fuel Cell Electric Vehicle Mechanical Engineering Examination Committee.
- Patil, M.S. et al. (2020) ‘Investigation on thermal performance of water-cooled Li-ion pouch cell and pack at high discharge rate with U-turn type microchannel cold plate’, International Journal of Heat and Mass Transfer, 155, p. 119728. [CrossRef]
- Shao, L. et al. (2021) ‘Design and Construction of Axial-Flux Permanent Magnet Motors for Electric Propulsion Applications-A Review’, IEEE Access. Institute of Electrical and Electronics Engineers Inc., pp. 158998–159017. [CrossRef]
- Shell Eco-marathon (2025) Shell Eco-marathon Team. https://www.shellecomarathon.com/2025-programme/regional-europe-and-africa.html (Accessed: 19 May 2025).
- Simon Fekadeamlak Gebremariam and Tebeje Tesfaw Wondie (2023) ‘Comparative analysis of electric motor drives employed for propulsion purpose of Battery Electric Vehicle (BEV) systems’, International Journal of Science and Research Archive, 10(2), pp. 1097–1112. [CrossRef]
- Smit, A. et al. (2023) ‘Power loss of the chain drive in a race tandem bicycle’, Sports Engineering, 26(1). [CrossRef]
- Spicer, J.B. et al. (2001a) ‘Effects of Frictional Loss on Bicycle Chain Drive Efficiency’, Journal of Mechanical Design, 123(4), pp. 598–605. [CrossRef]
- Spicer, J.B. et al. (2001b) ‘Effects of Frictional Loss on Bicycle Chain Drive Efficiency’, Journal of Mechanical Design, 123(4), pp. 598–605. [CrossRef]
- Taha, Z. and Aydin, K. (2022) ‘Comparative Analysis of Single, Double and Quad Electric Vehicle Powertrain Systems’, International Journal of Automotive Science and Technology, 6(4), pp. 324–330. [CrossRef]
- Tashen, T. et al. (2024) Design and development of electric vehicle for Shell Eco-marathon Design and development of electric vehicle for Shell Eco-marathon Kazakh-British technical university. https://www.researchgate.net/publication/386212048.
- Tu, C.-C. et al. (2024) ‘Industry perspective on power electronics for electric vehicles’, Nature Reviews Electrical Engineering, 1(7), pp. 435–452. [CrossRef]
- U.S. Environmental Protection Agency (2022) Compare side-by-side fuel economy. https://www.fueleconomy.gov/feg/Find.do (Accessed: 10 June 2025).
- Victron Energy (2025) Orion-Tr DC-DC converters isolated, Retrieved from Victron Energy Blue Power. https://www.sunshinesolar.co.uk/media/ecom/prodpdf/Datasheet-Orion-Tr-DC-DC-converters-isolated-100-250-400W-EN.pdf (Accessed: 7 June 2025).
- Wang, Q. et al. (2023) ‘A Battery Capacity Estimation Framework Combining Hybrid Deep Neural Network and Regional Capacity Calculation Based on Real-World Operating Data’, IEEE Transactions on Industrial Electronics, 70(8), pp. 8499–8508. [CrossRef]
- Zhang, R. et al. (2018) ‘State of the art of lithium-ion battery SOC estimation for electrical vehicles’, Energies. MDPI AG. [CrossRef]
Figure 1.
Electric motor selection (Maria Maia Marques Líbano Monteiro et al., 2021).
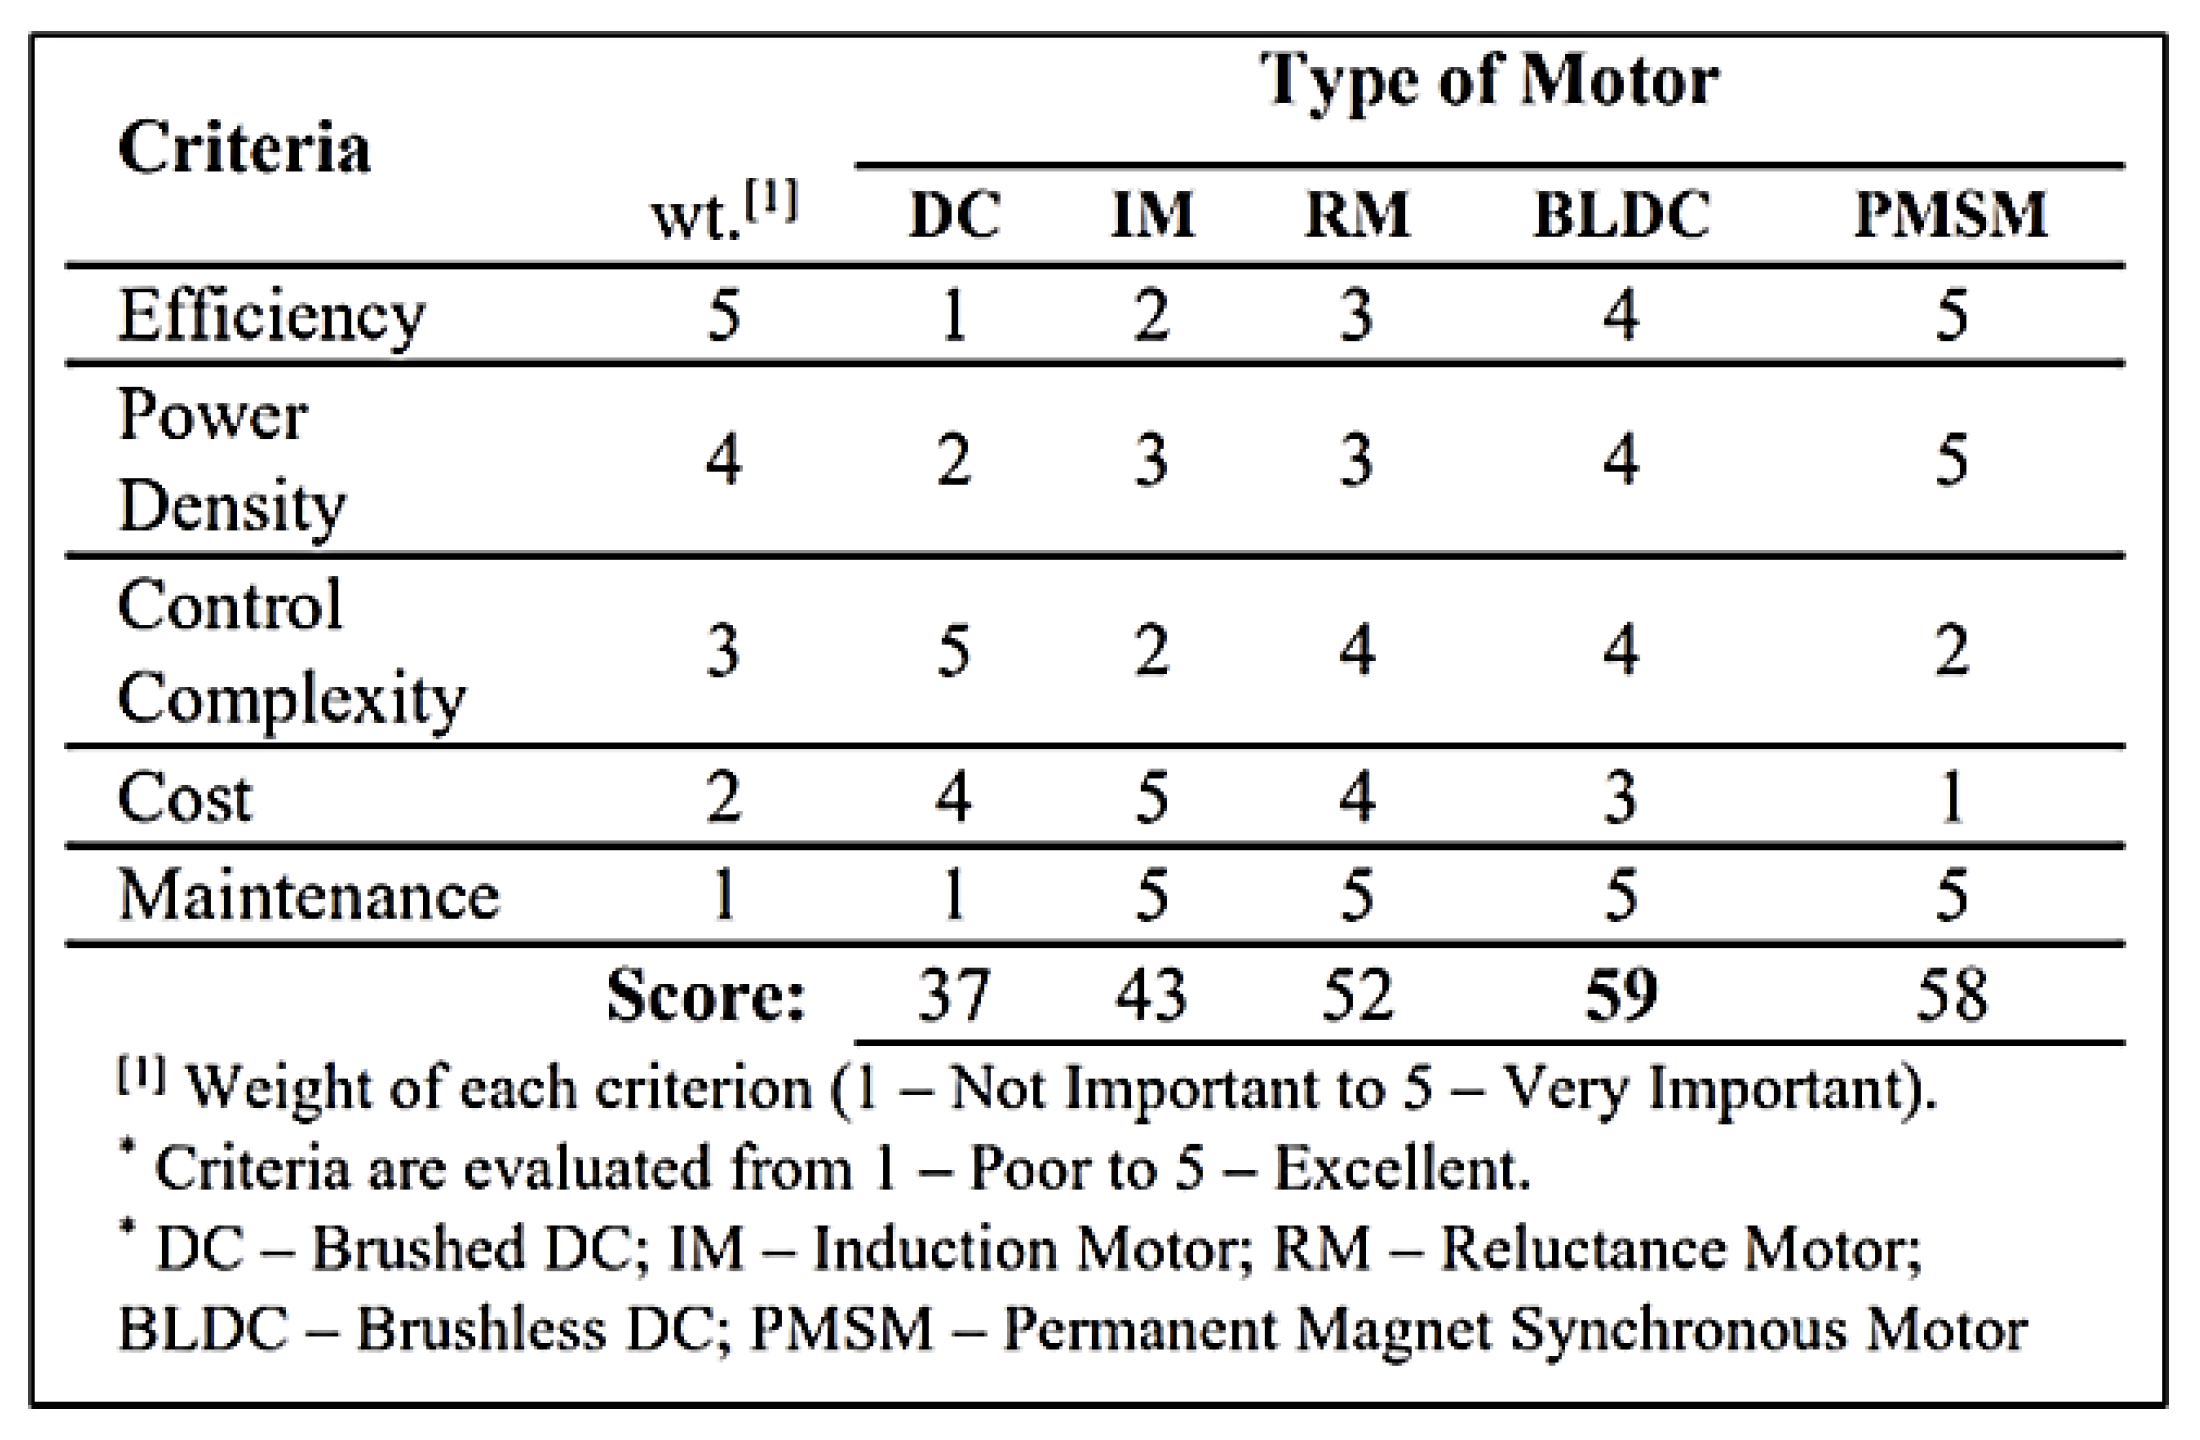
Figure 2.
Two stage transmission designed at PETRONAS university of technology. (Haron, 2011).
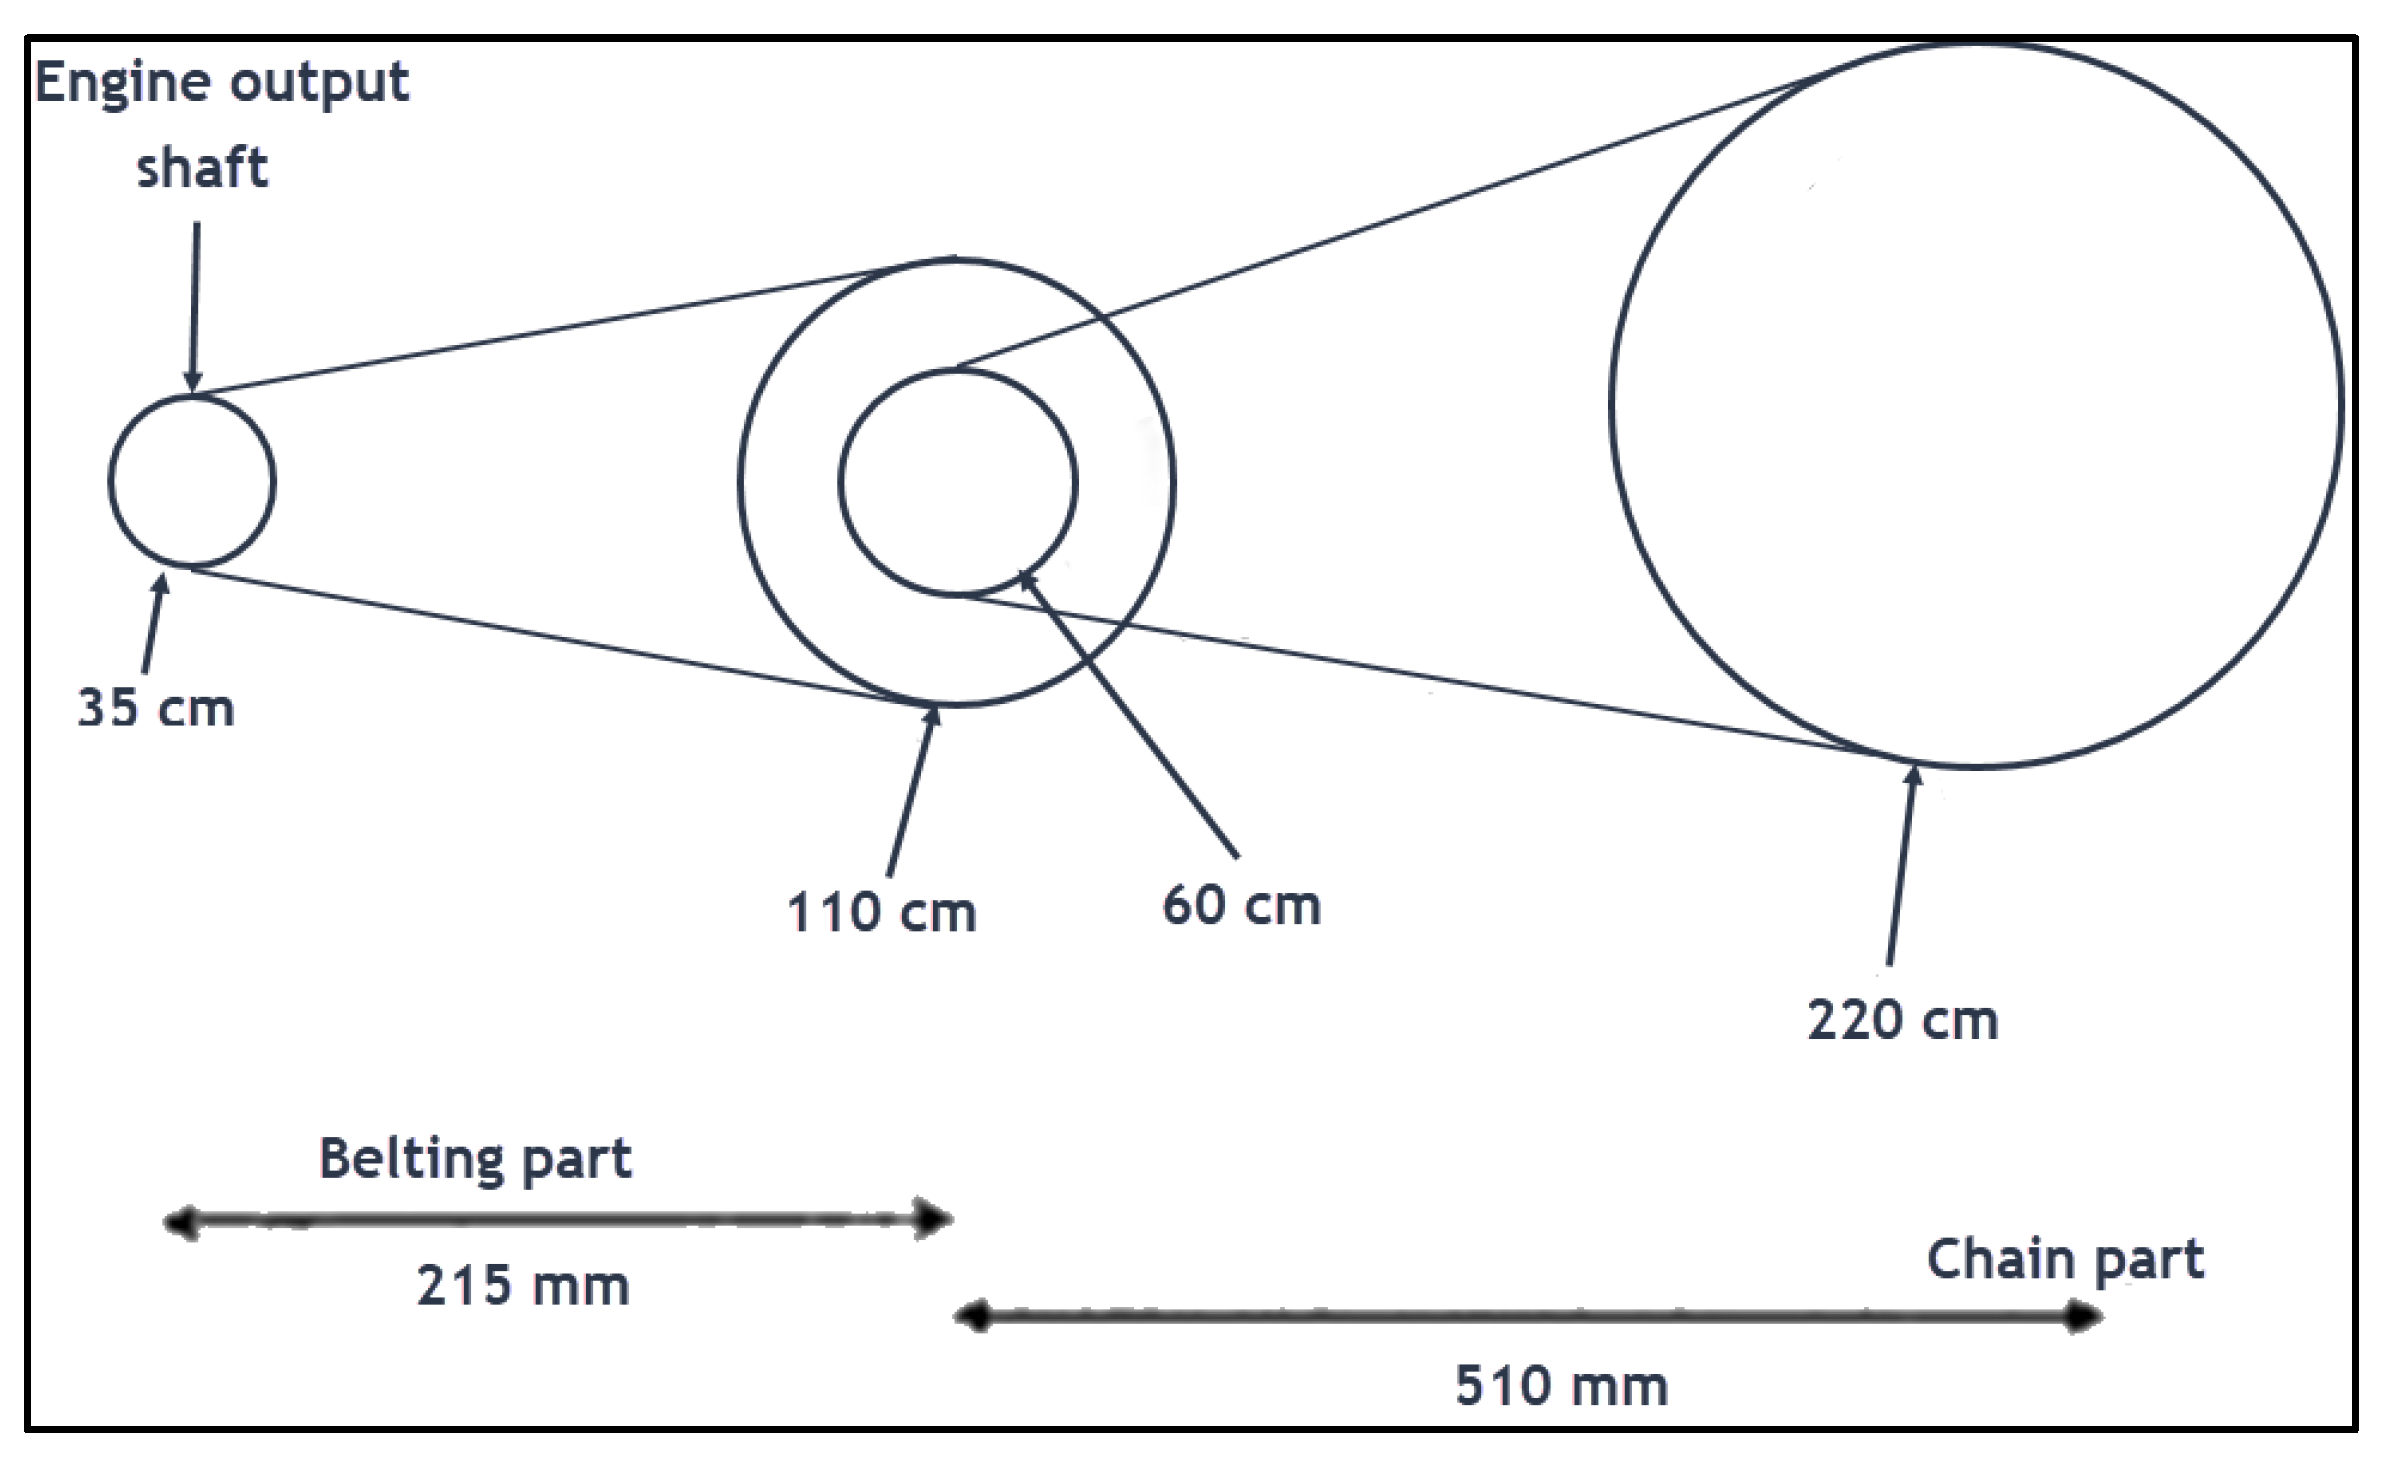
Figure 3.
Eco shell marathon 2025 prototype electric vehicle Simulink model.
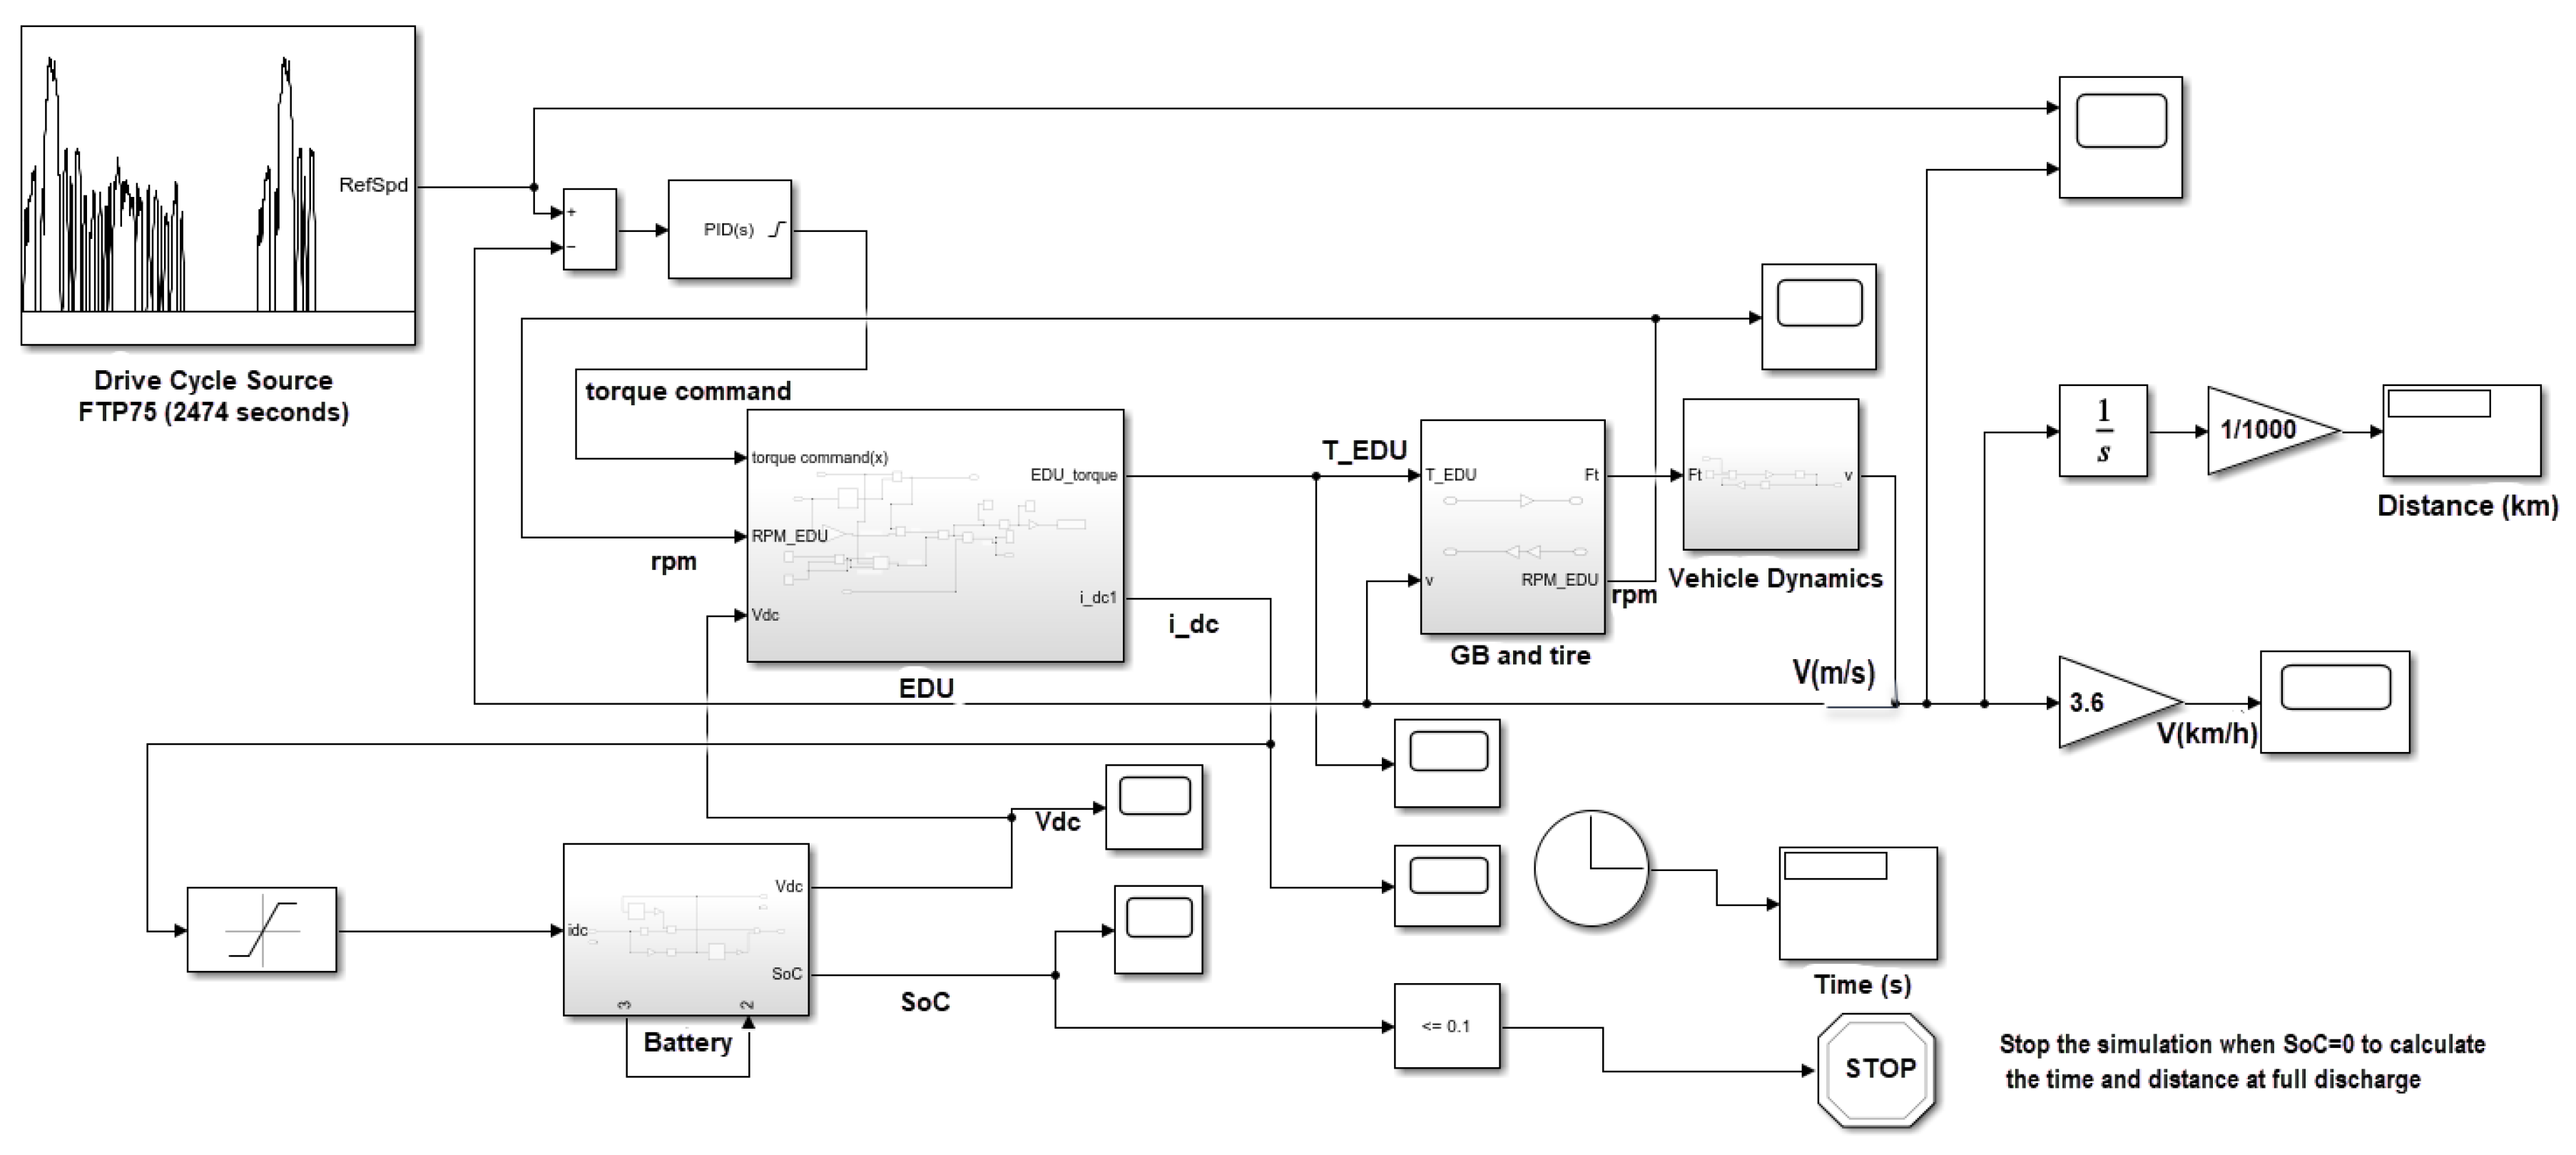
Figure 4.
Selected motor 3D view.
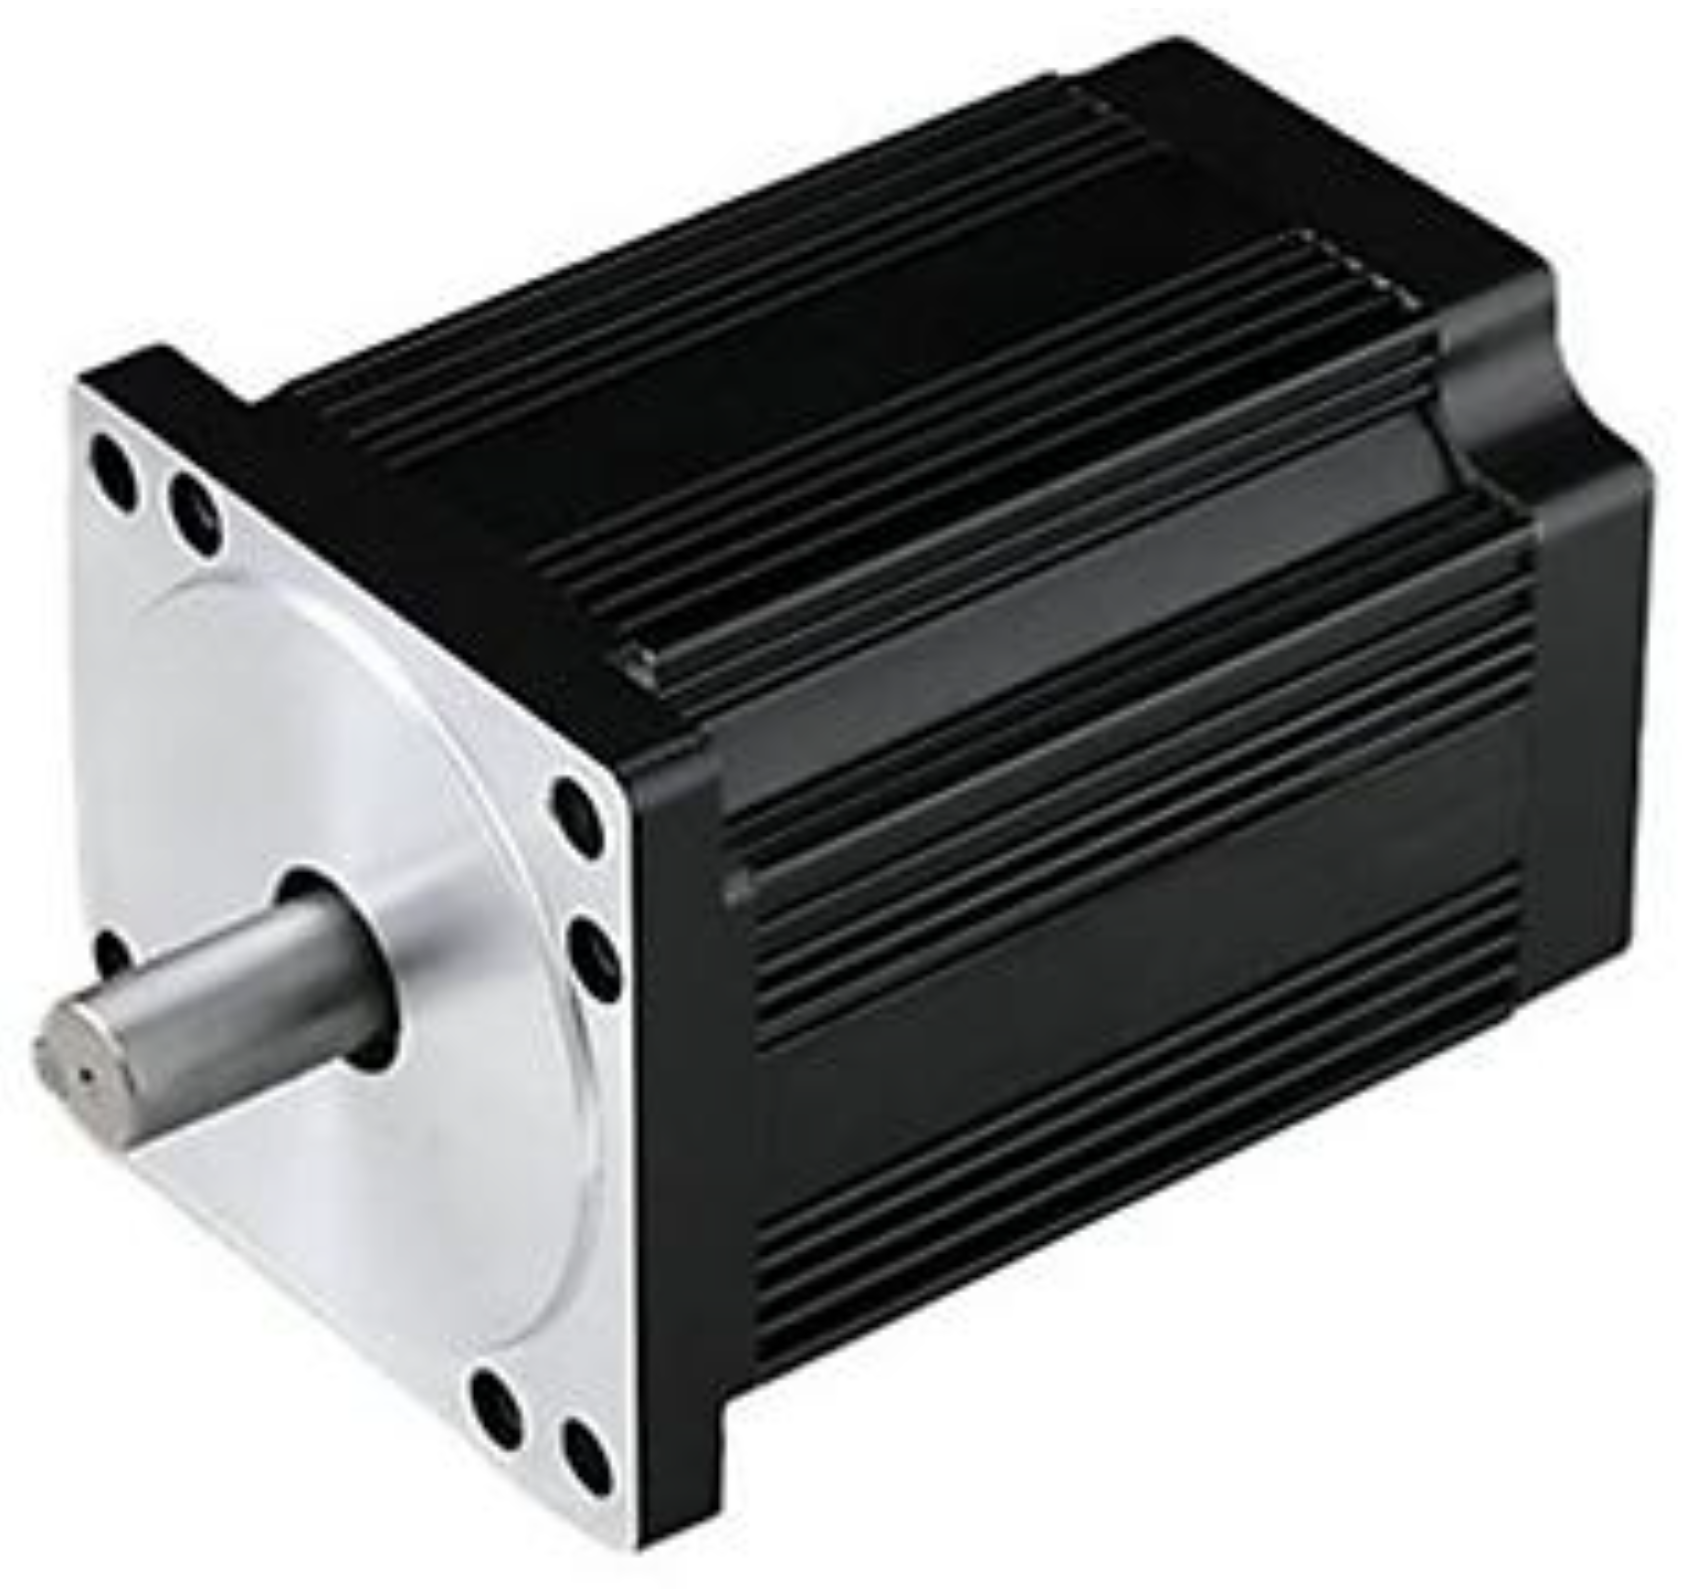
Figure 5.
several types of drivetrain layout (Childs, 2018).
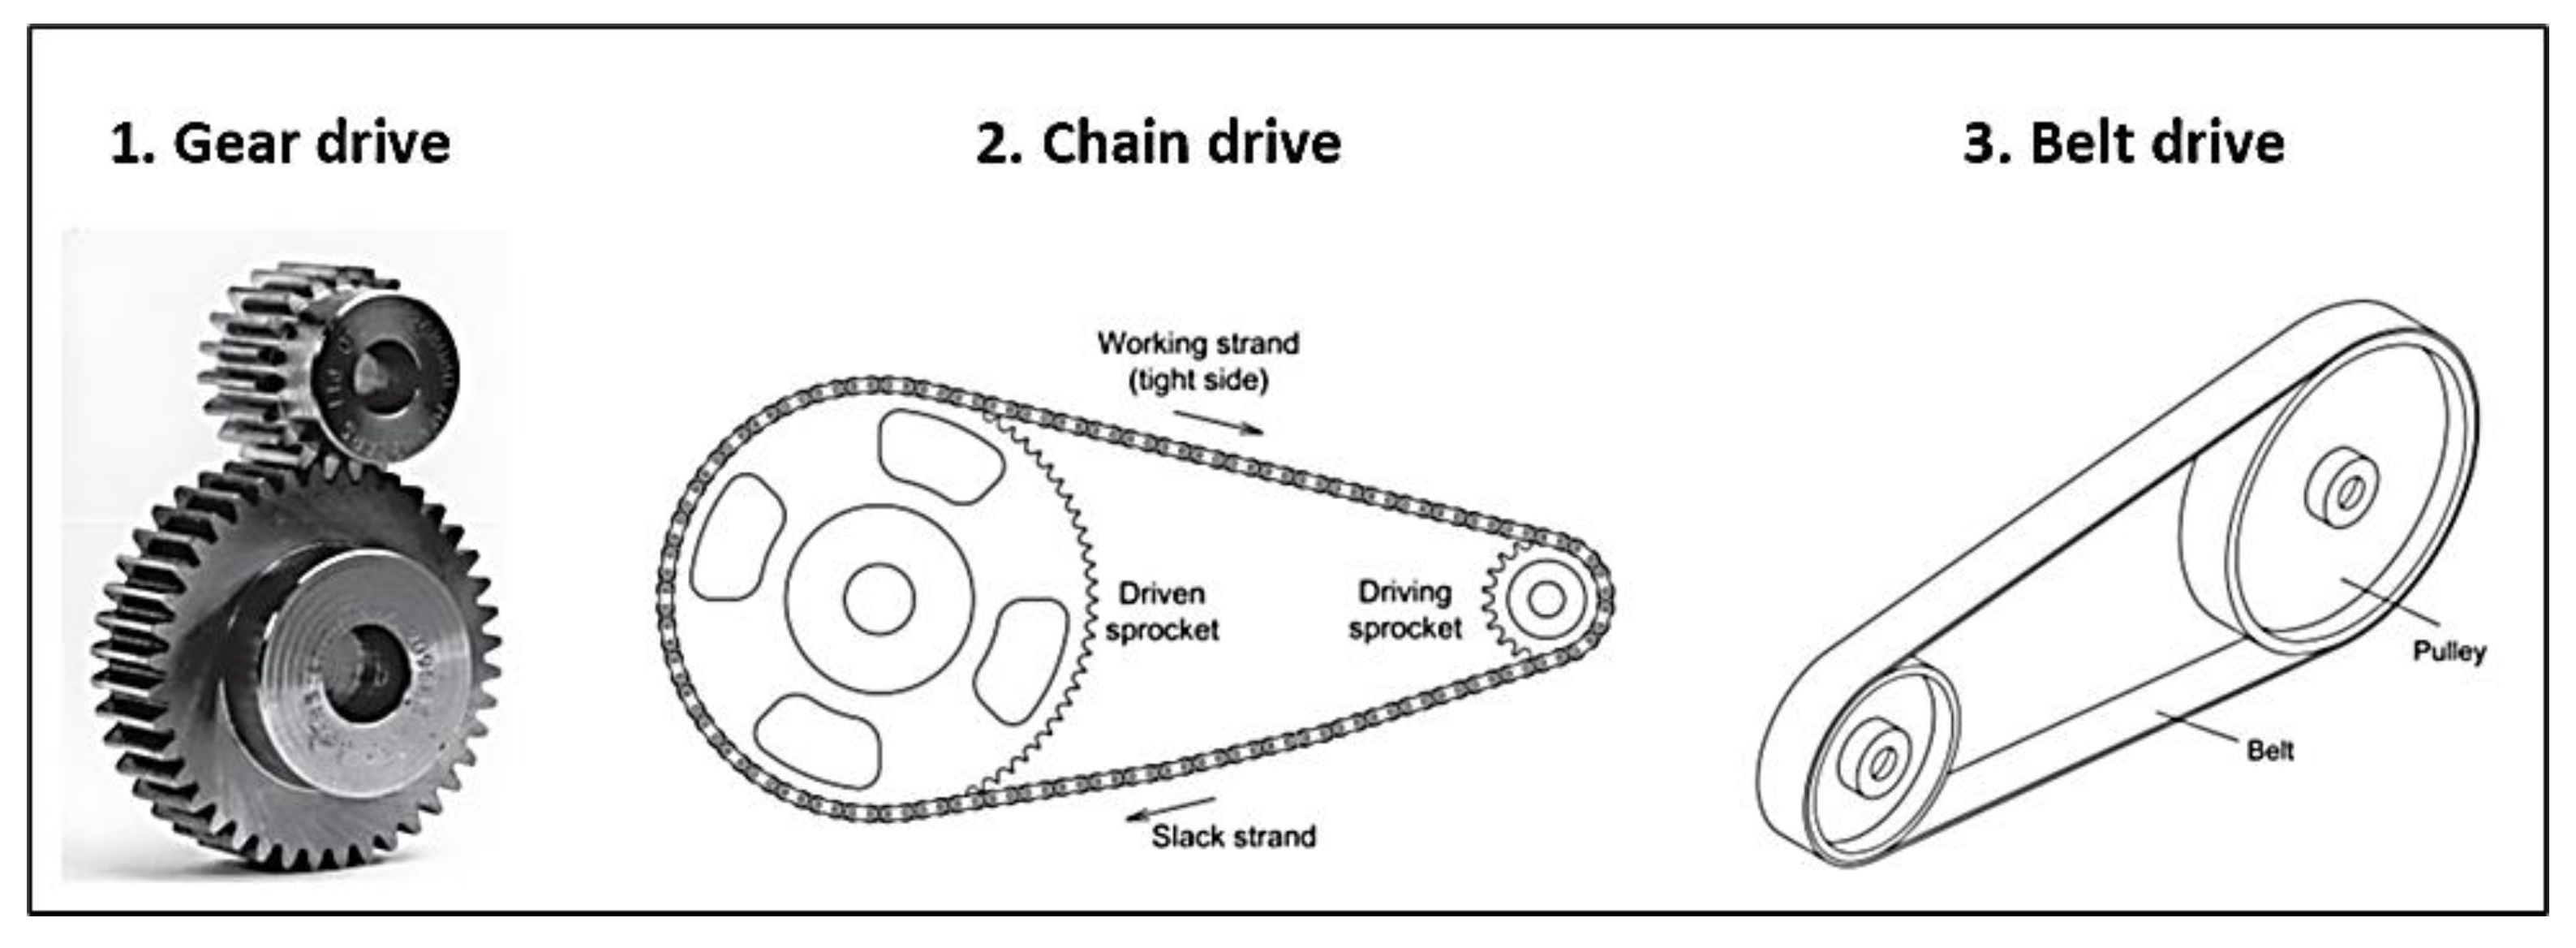
Figure 6.
Three of the conceptual motor setups.
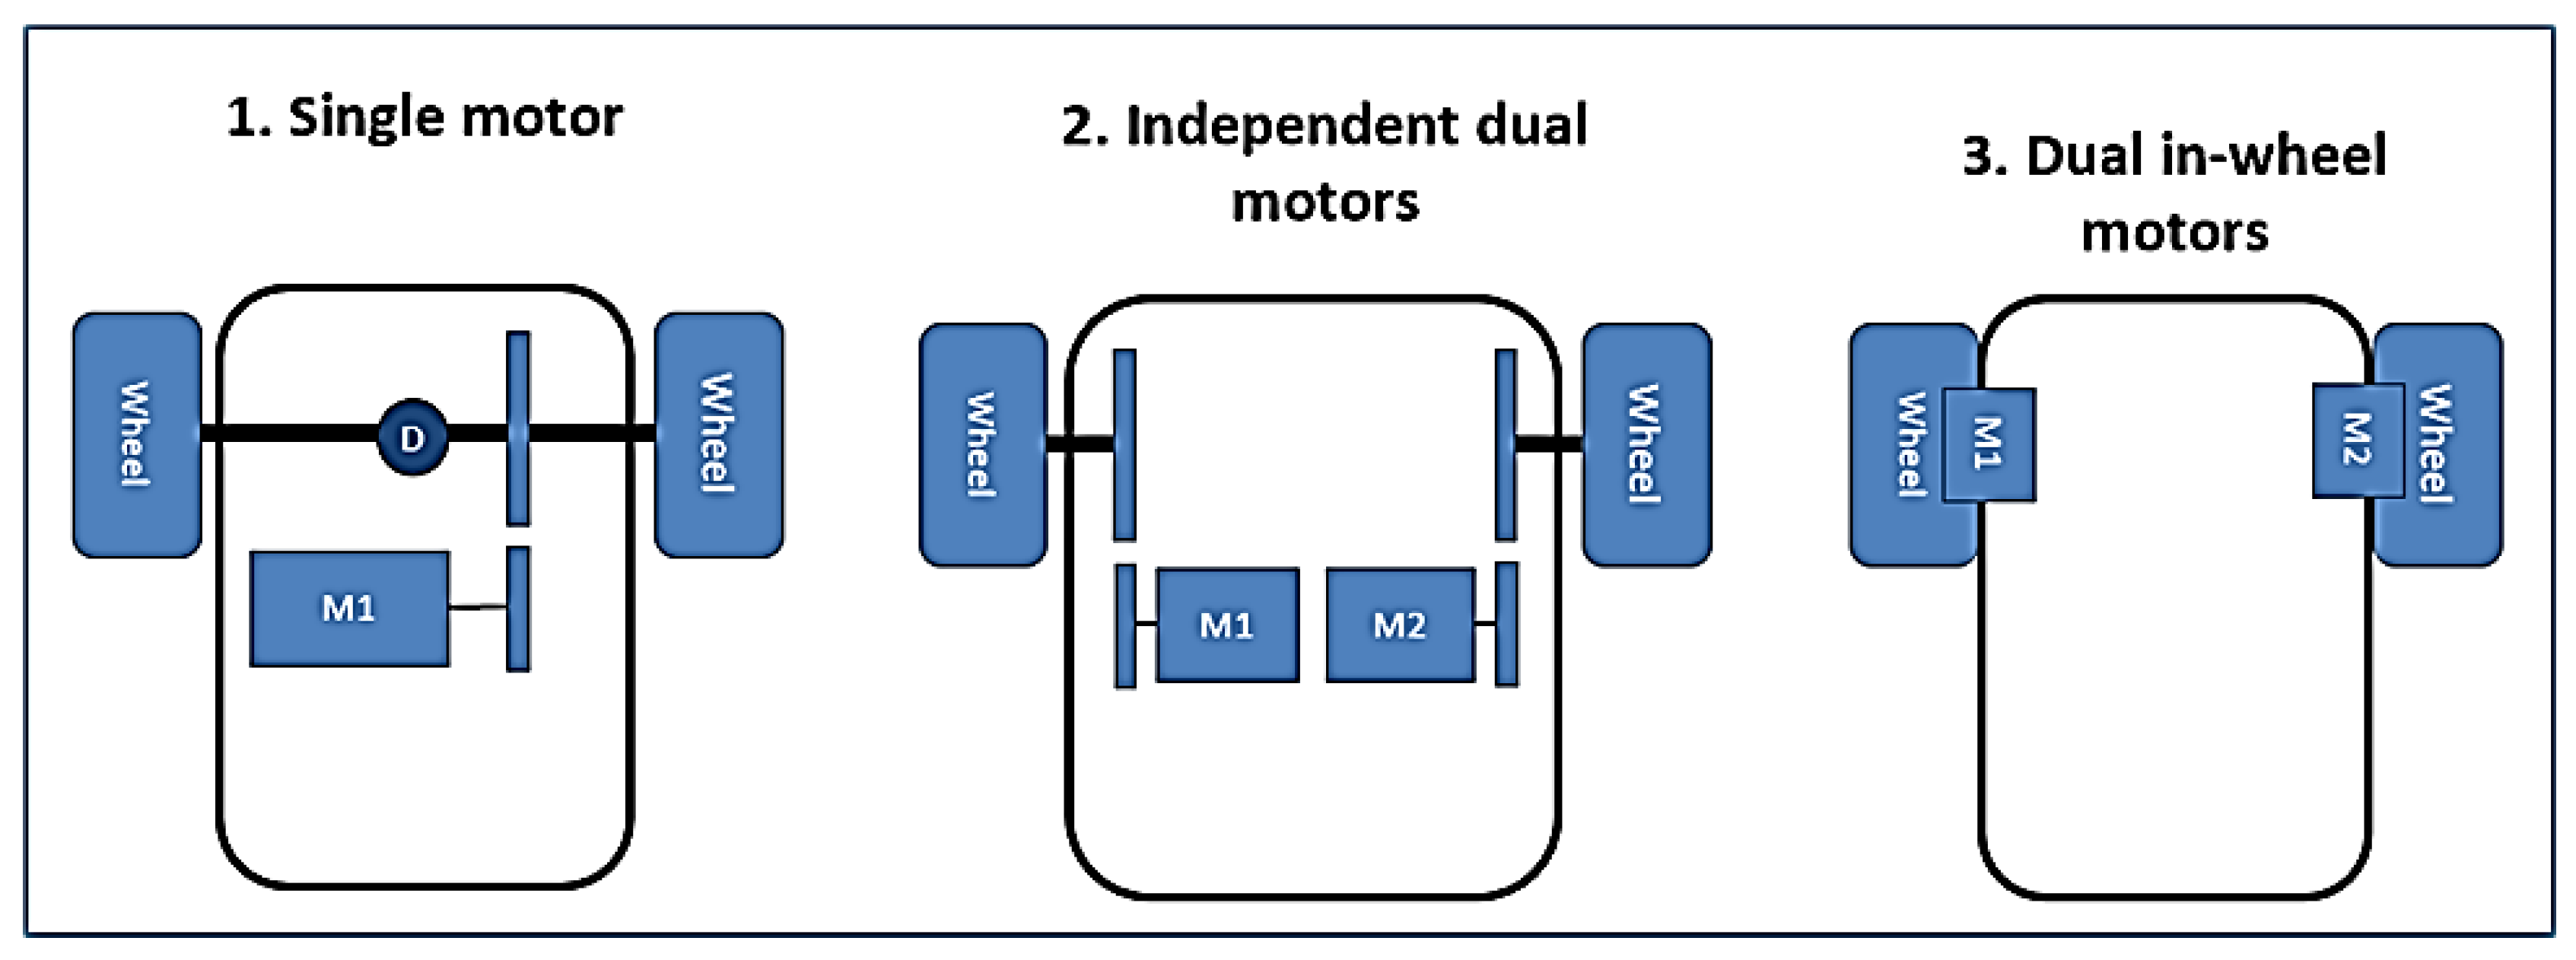
Figure 7.
CAD of battery pack from last year.
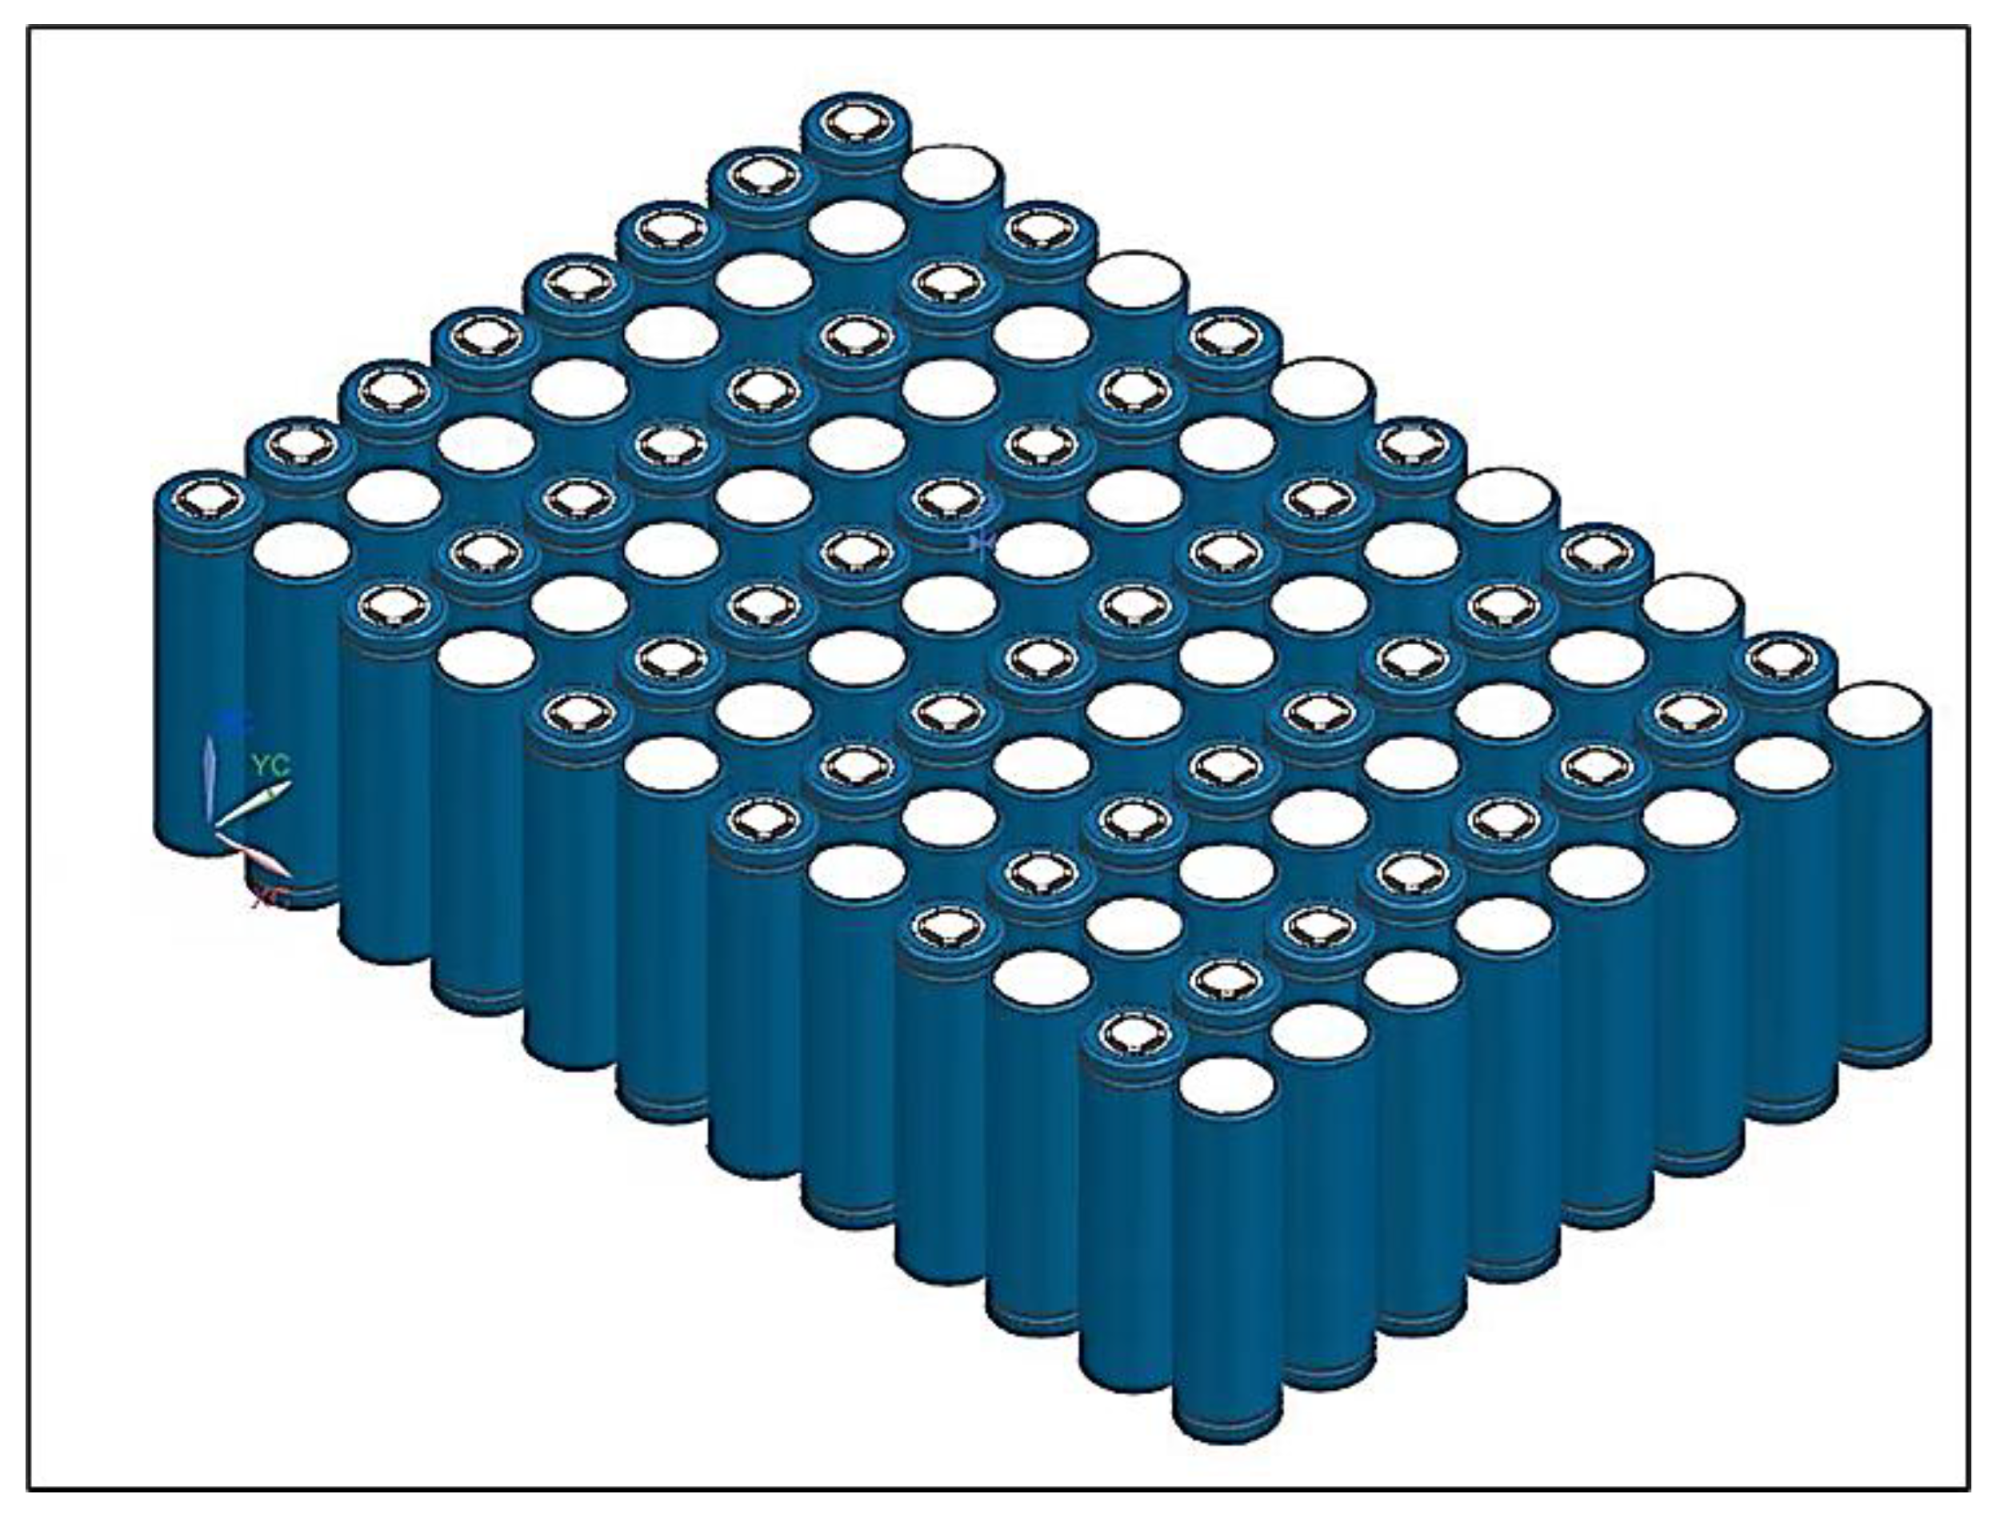
Figure 8.
Overview of single motor design.
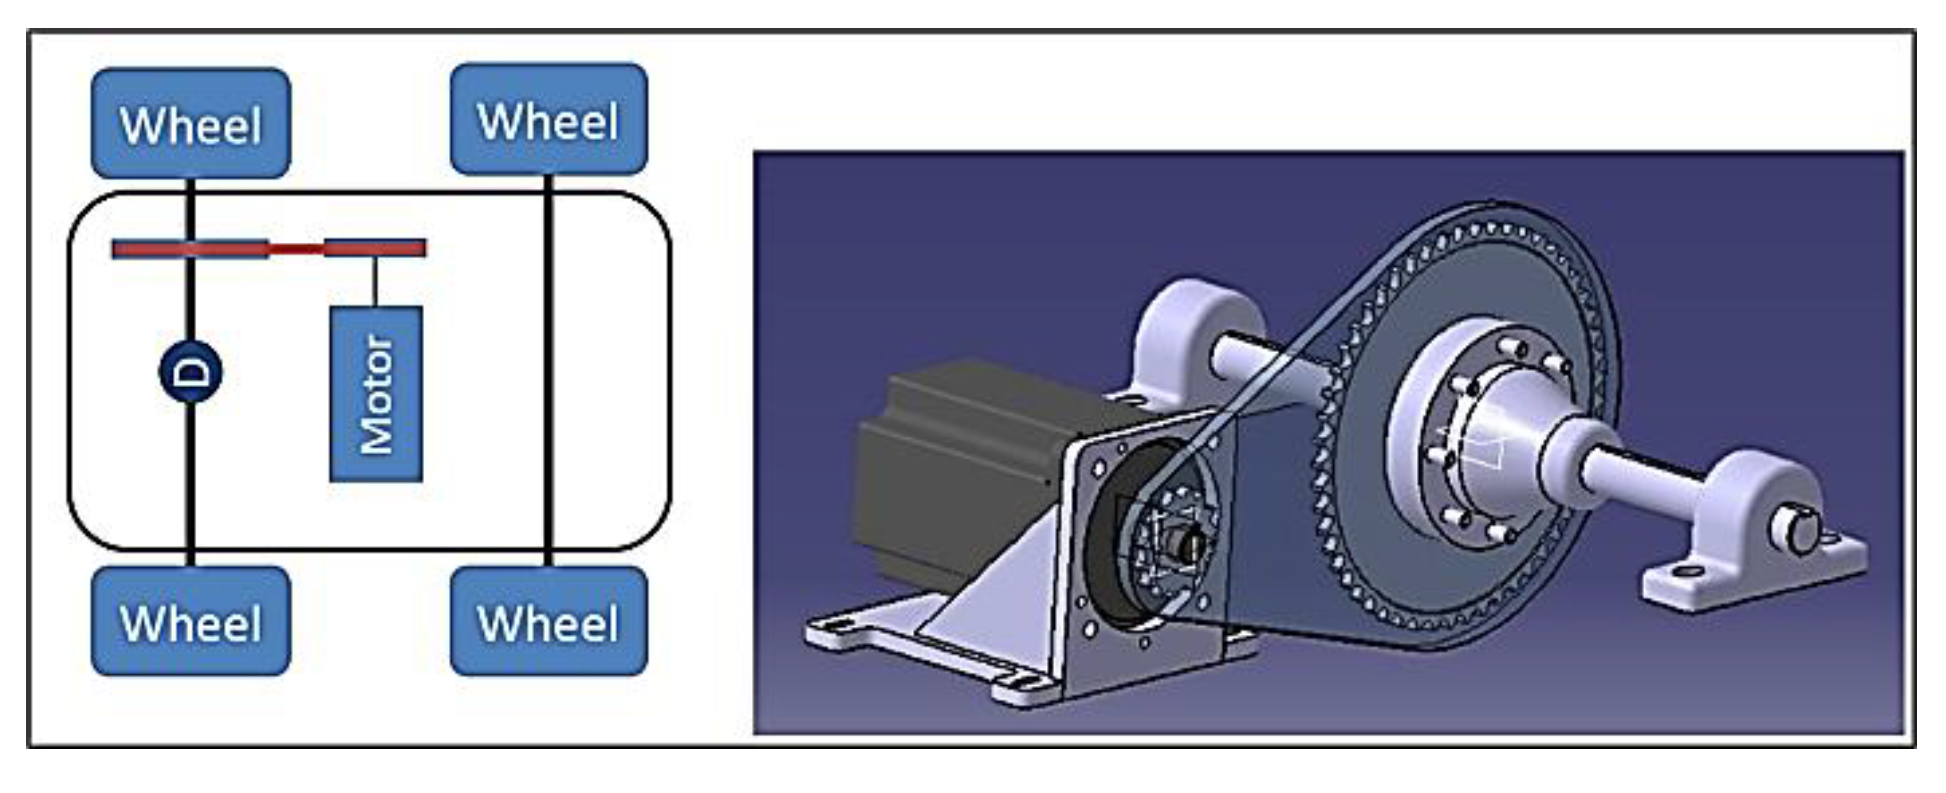
Figure 9.
Full EV assembly in context.
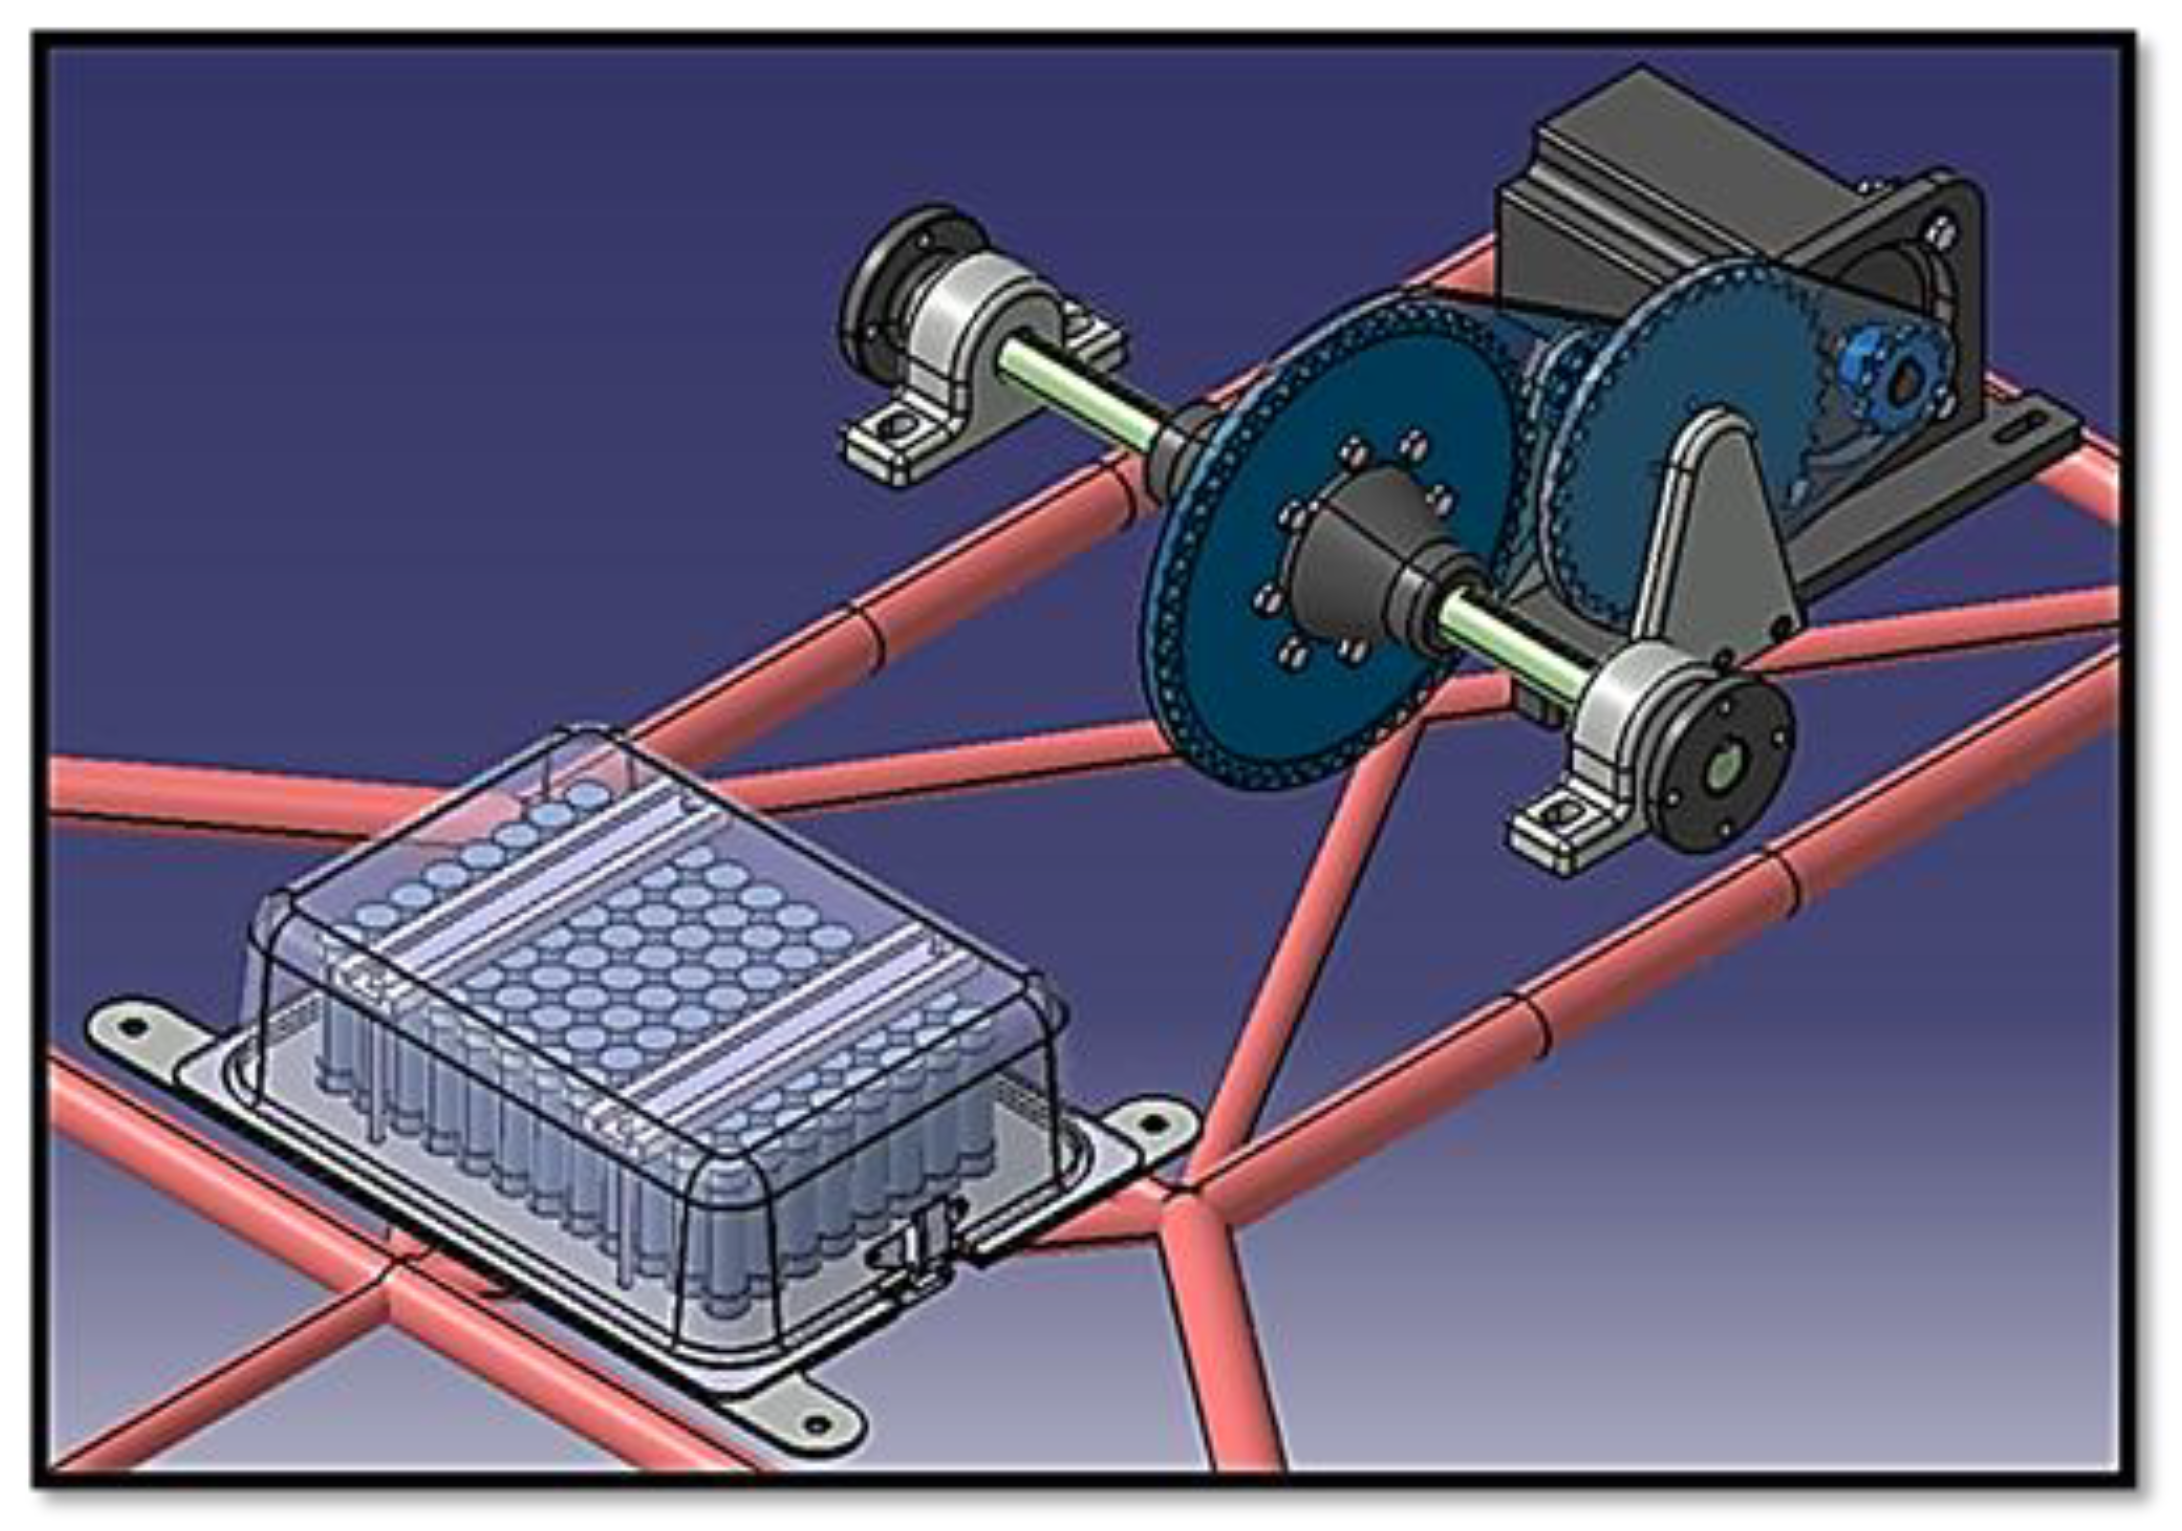
Figure 10.
Isometric view of the larger sprocket required and clashes with chassis.
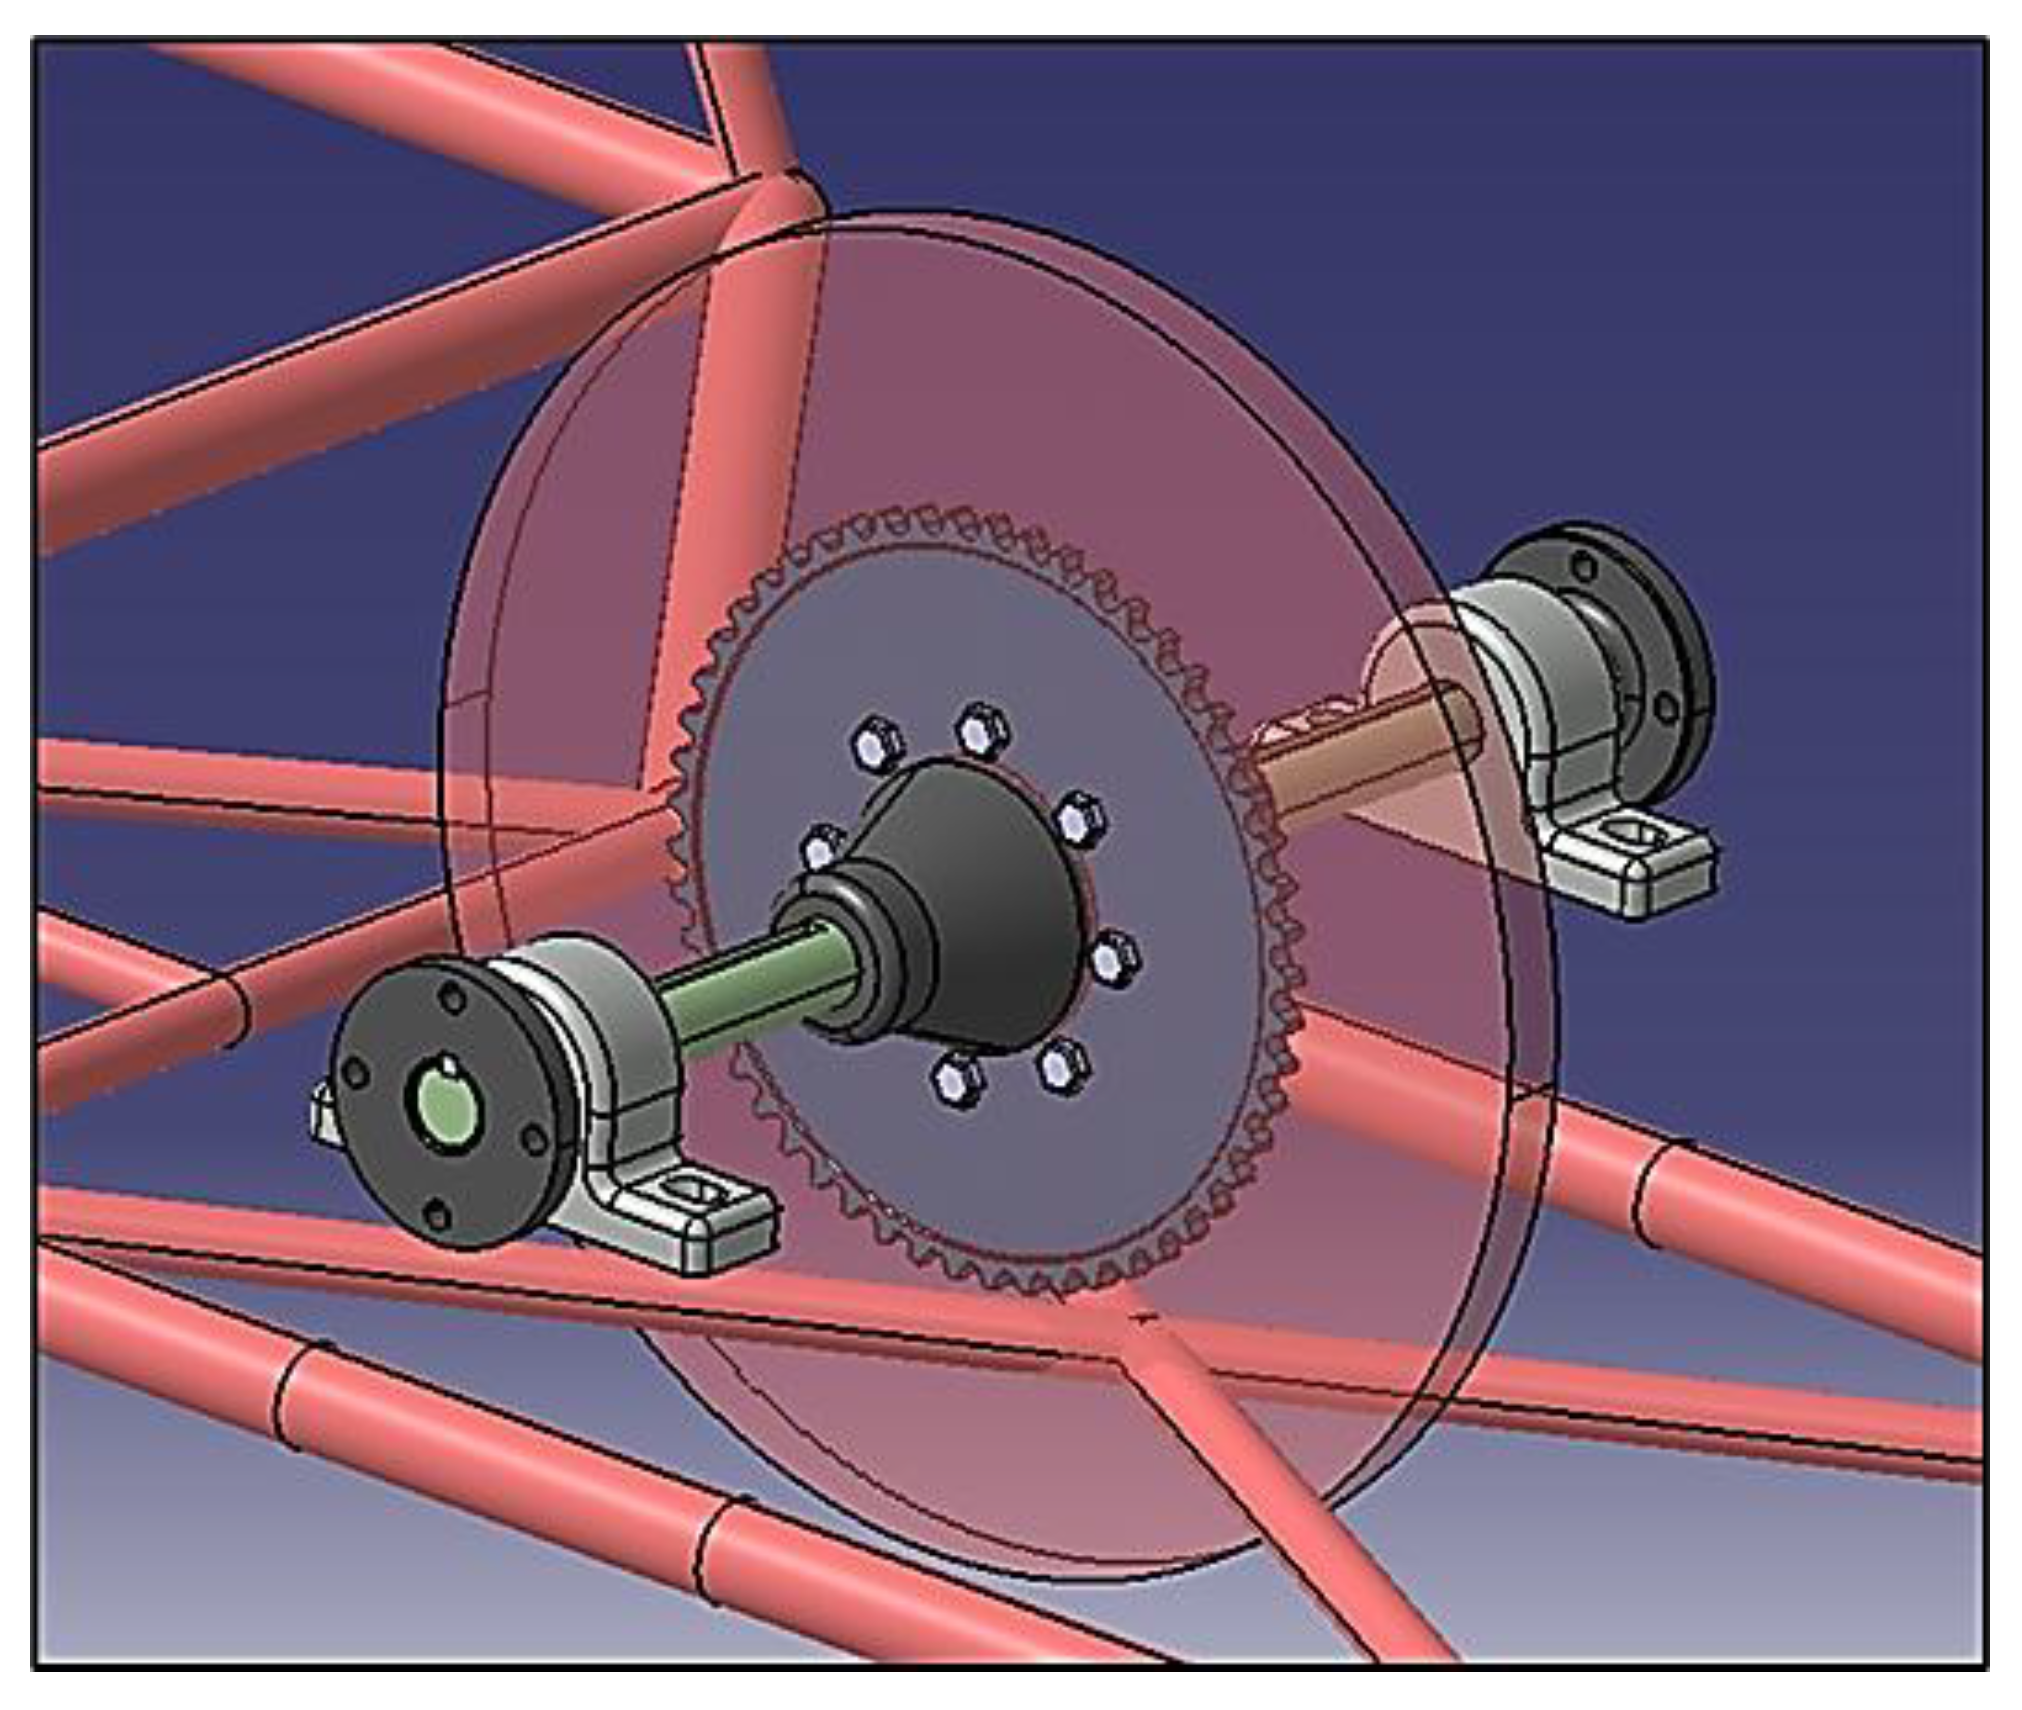
Figure 11.
Exploded view of the motor mount.
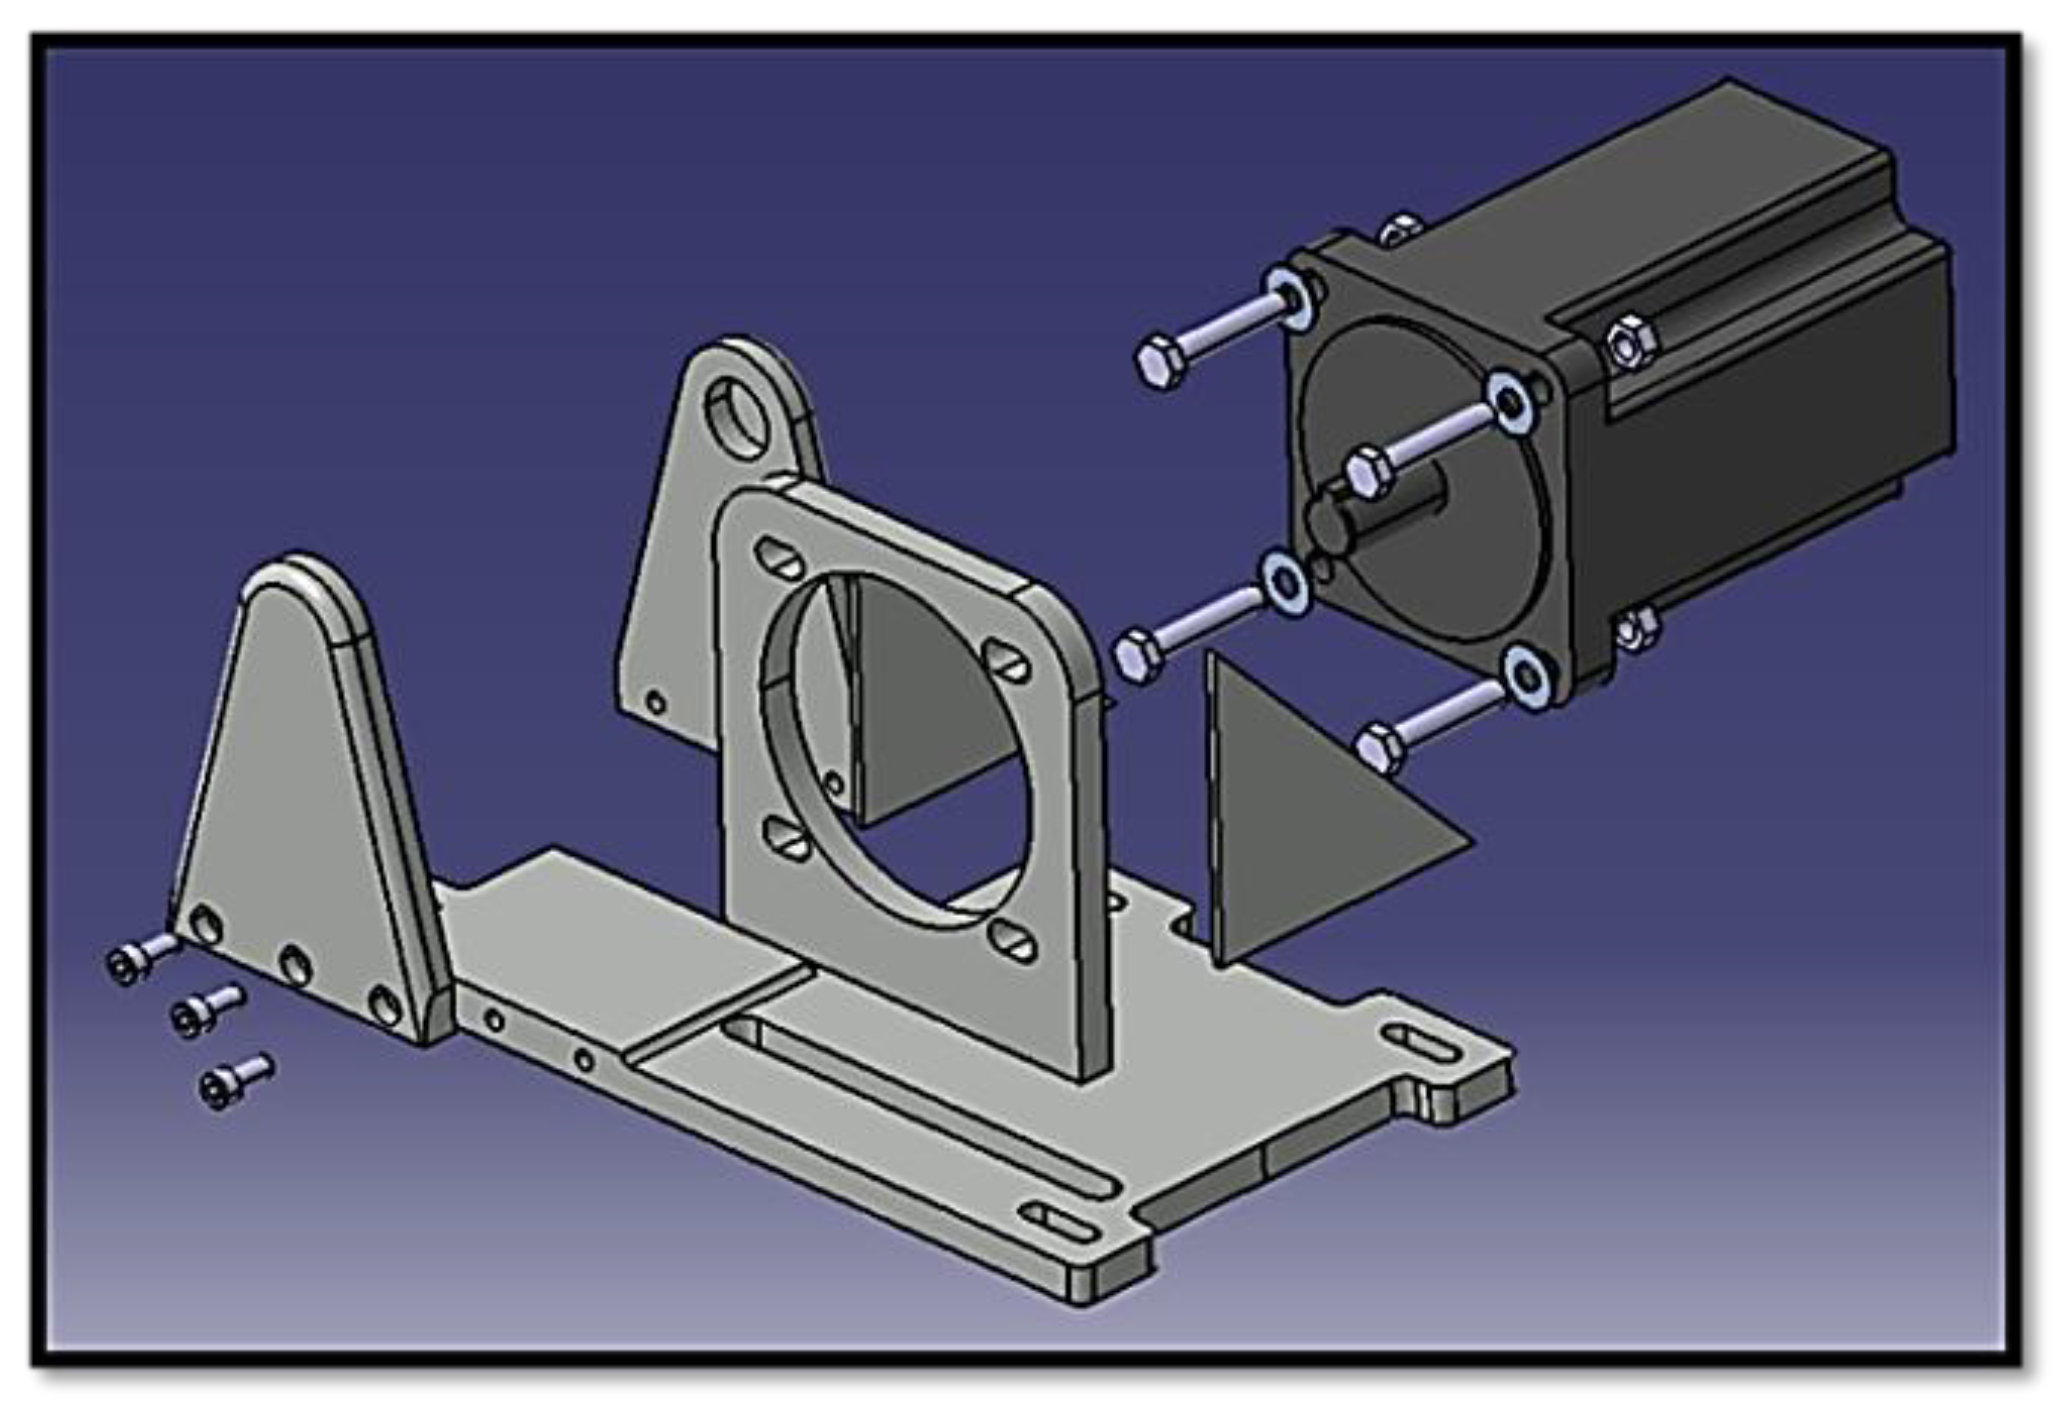
Figure 12.
Exploded view of the central transmission assembly.
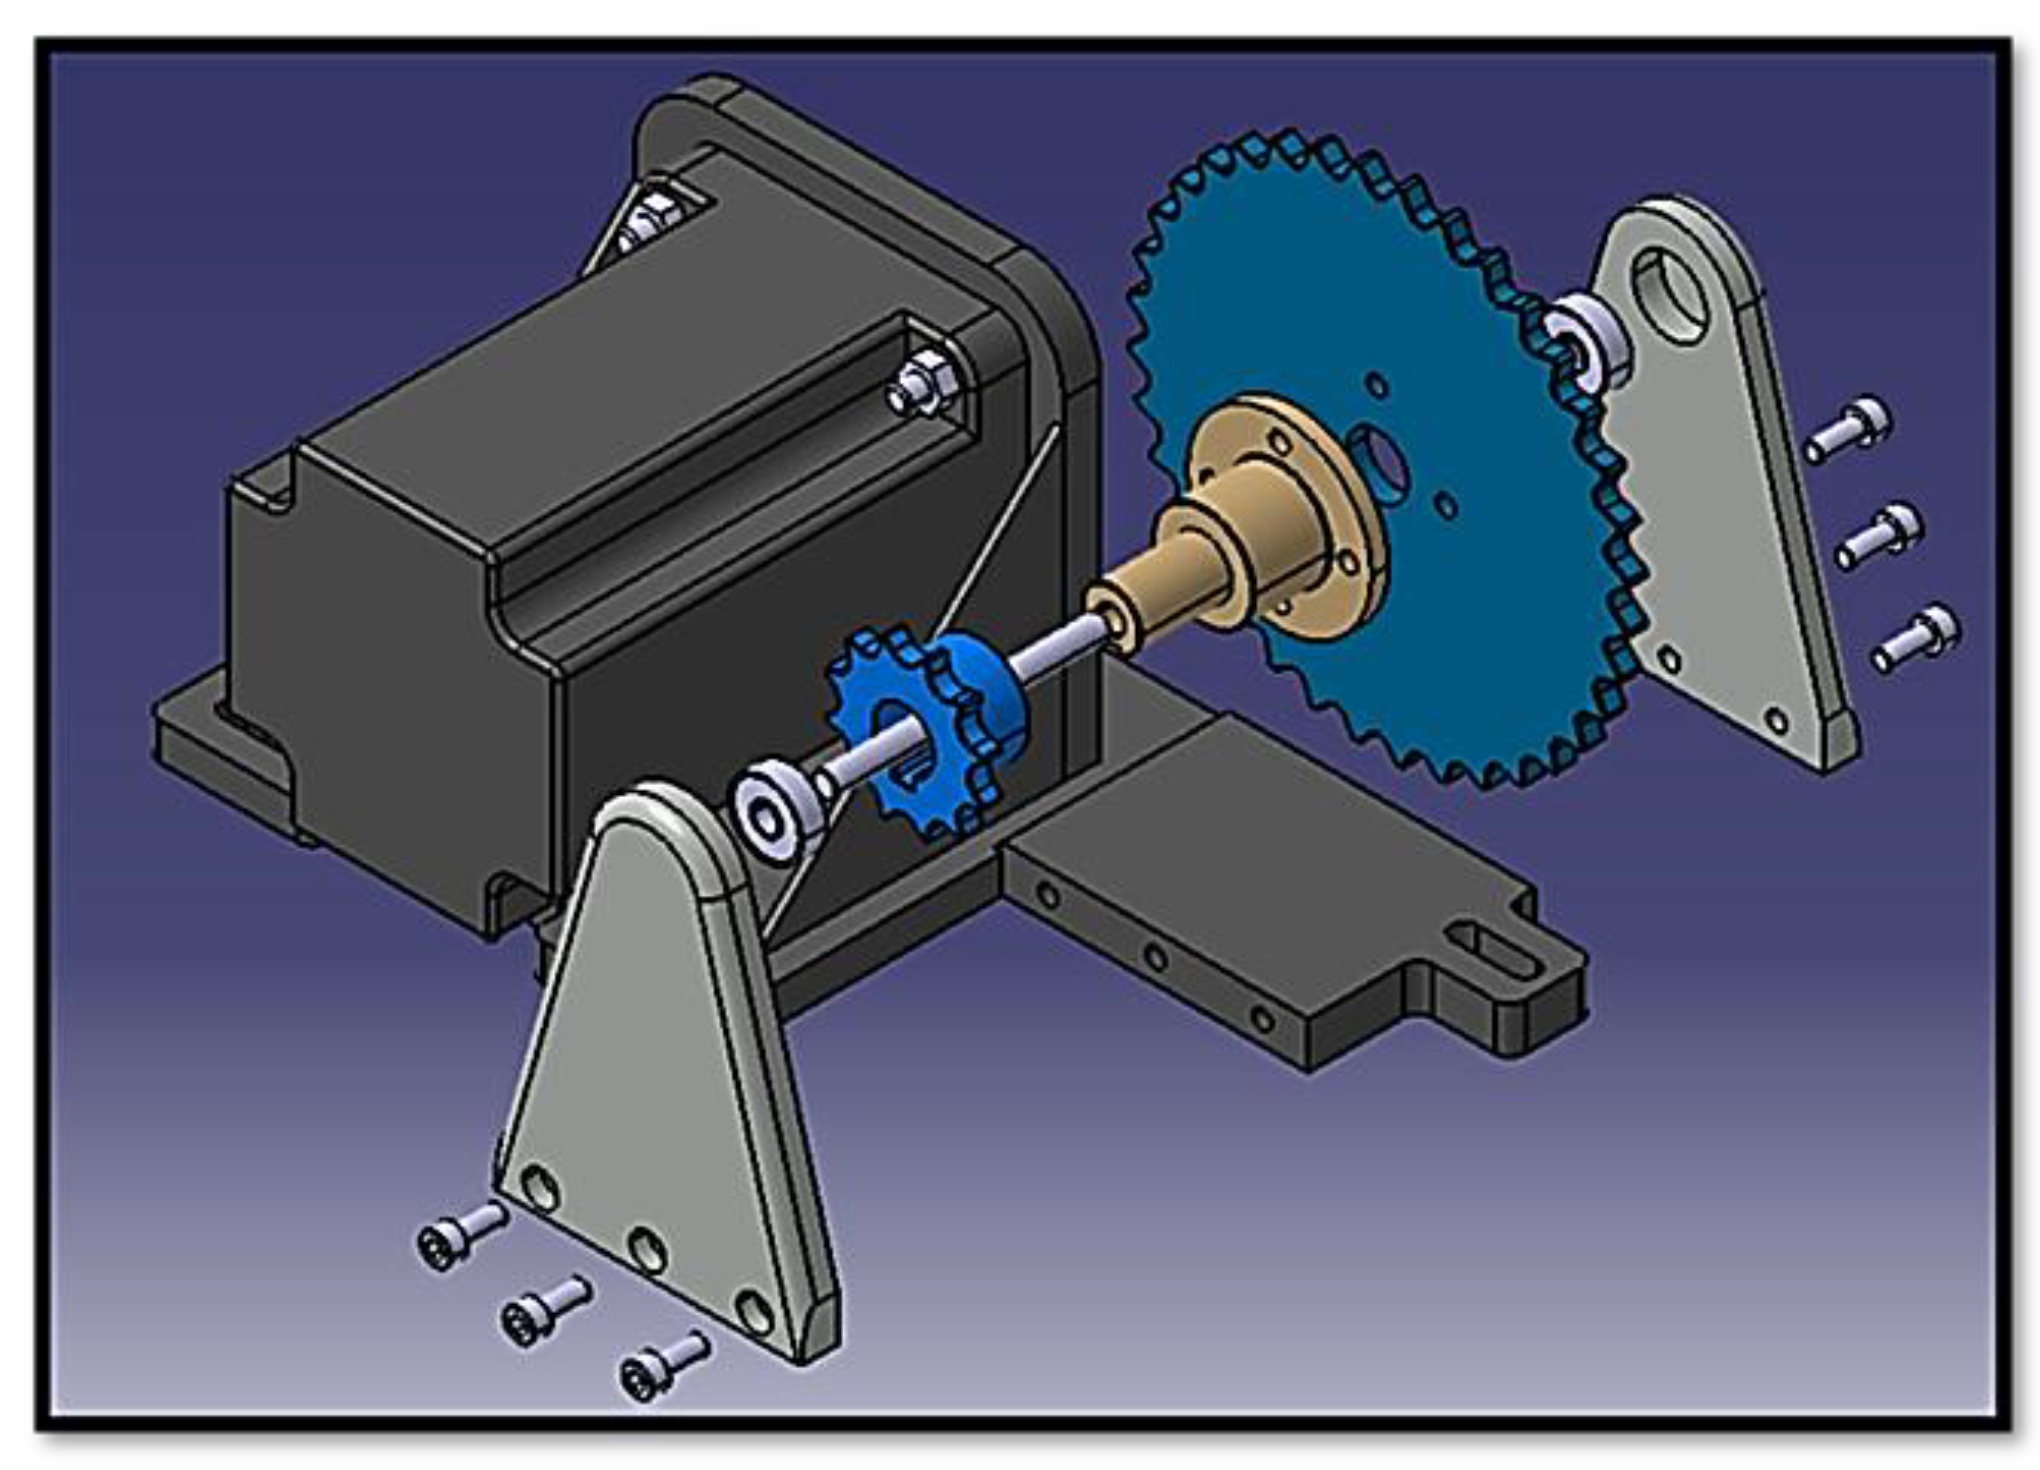
Figure 13.
Details of the battery case design.
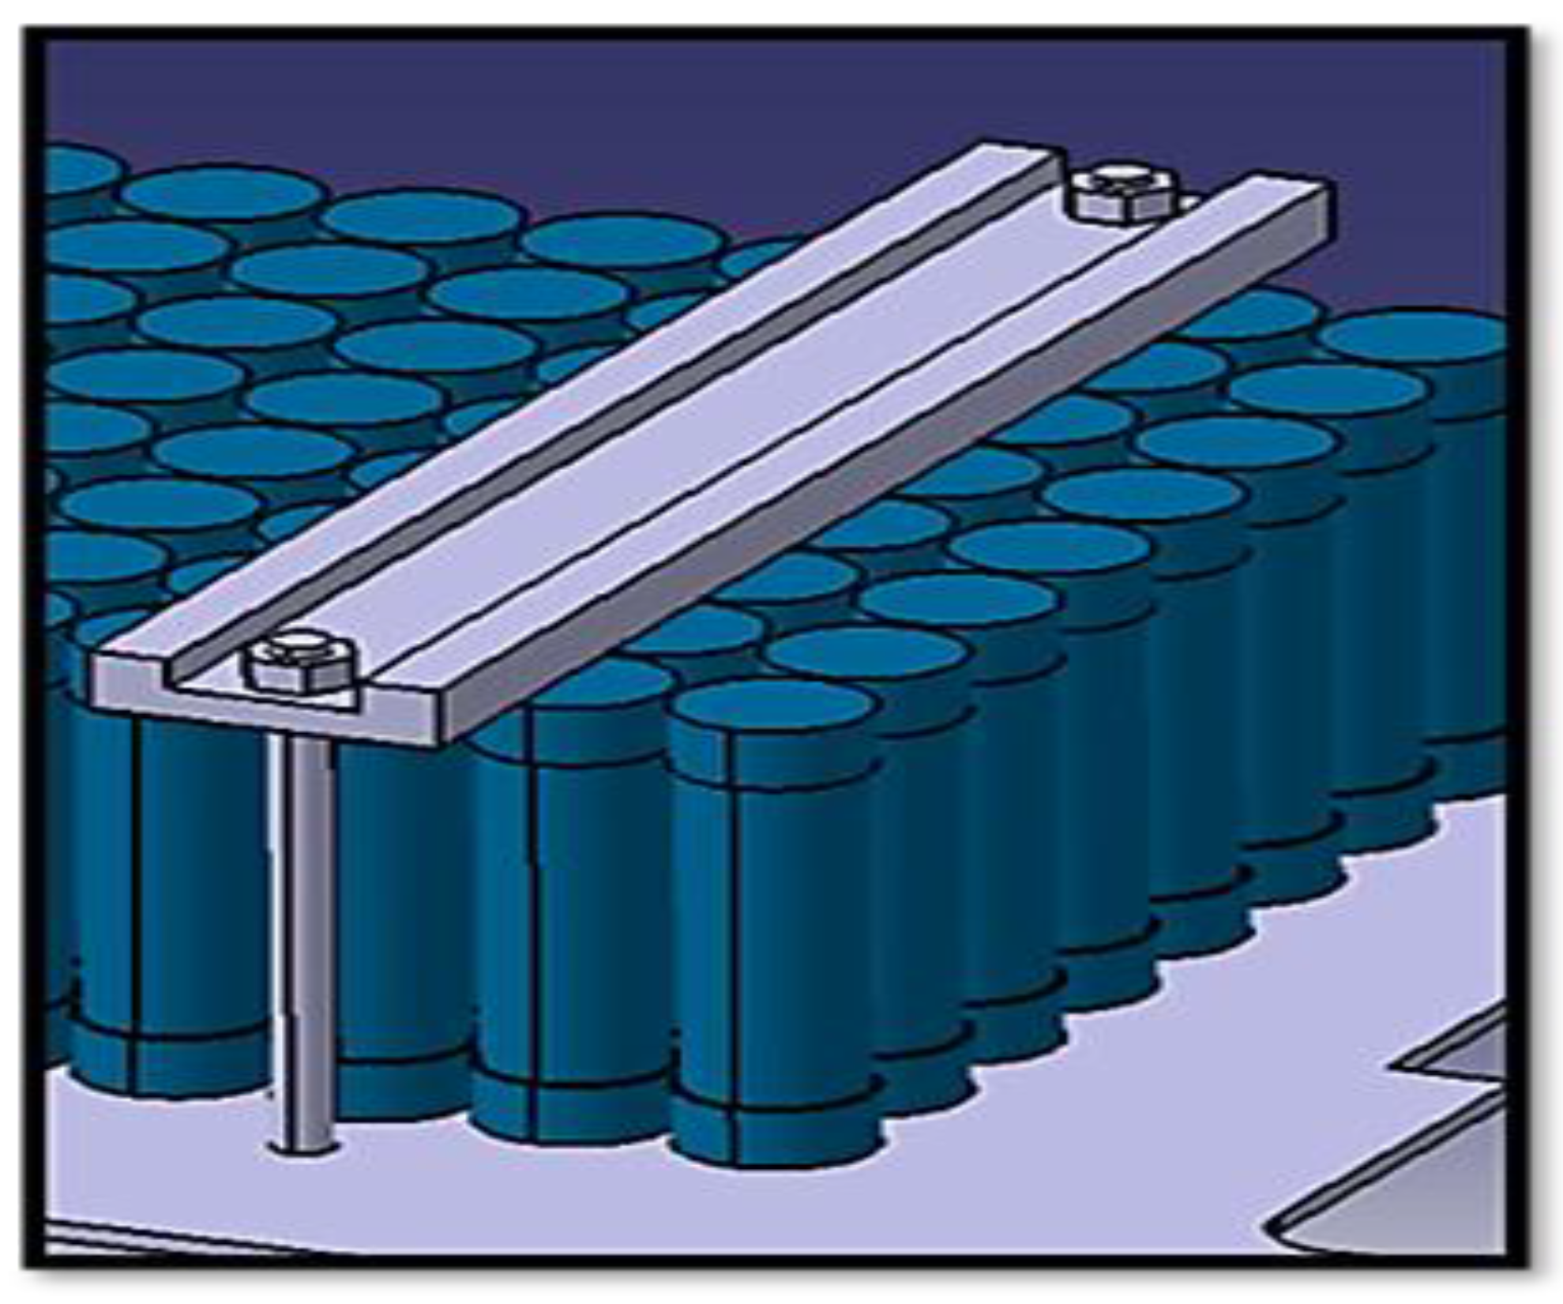
Figure 14.
Setup with the center transmission.
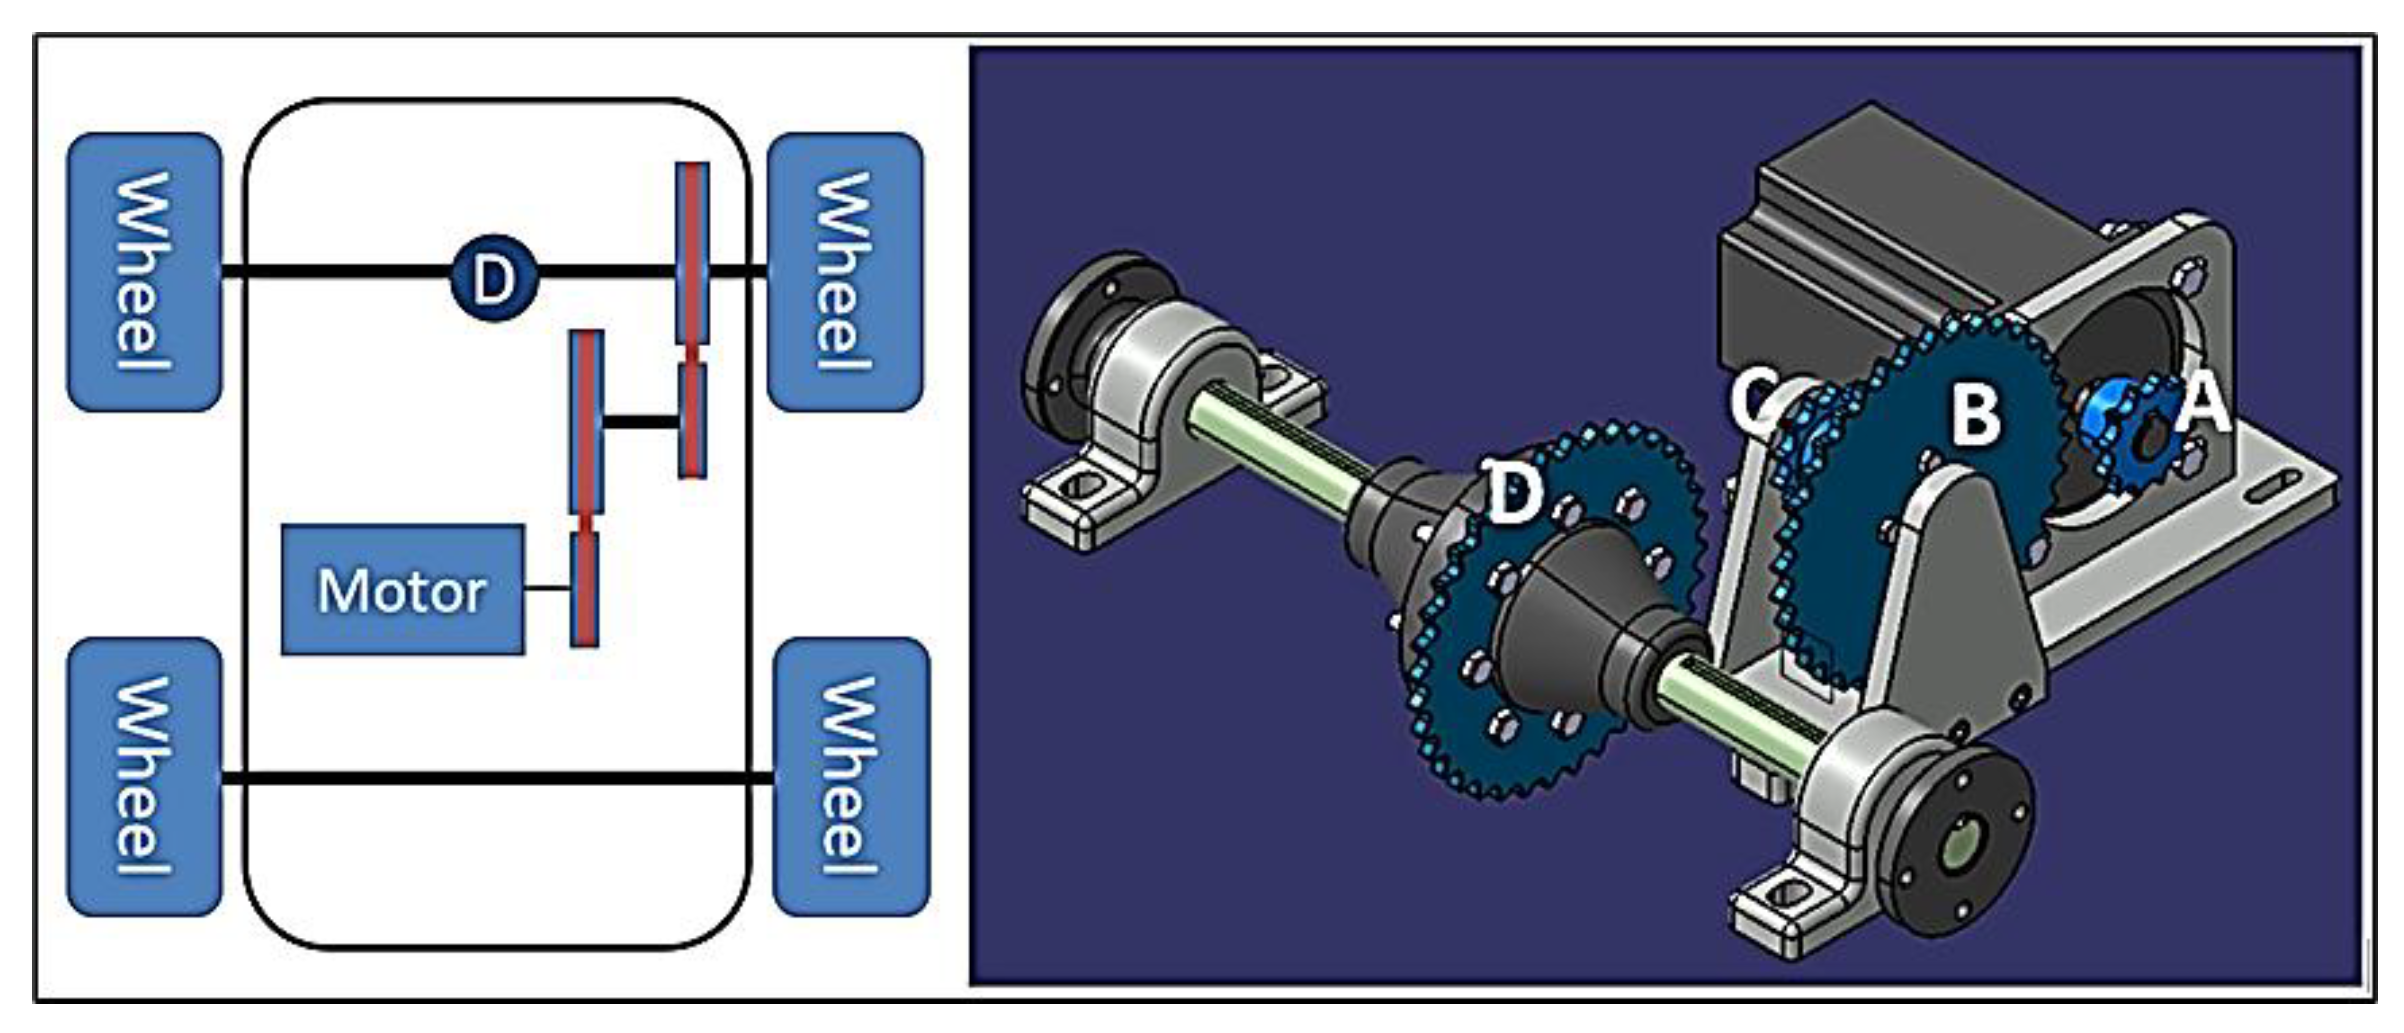
Figure 15.
Formula student LSD.
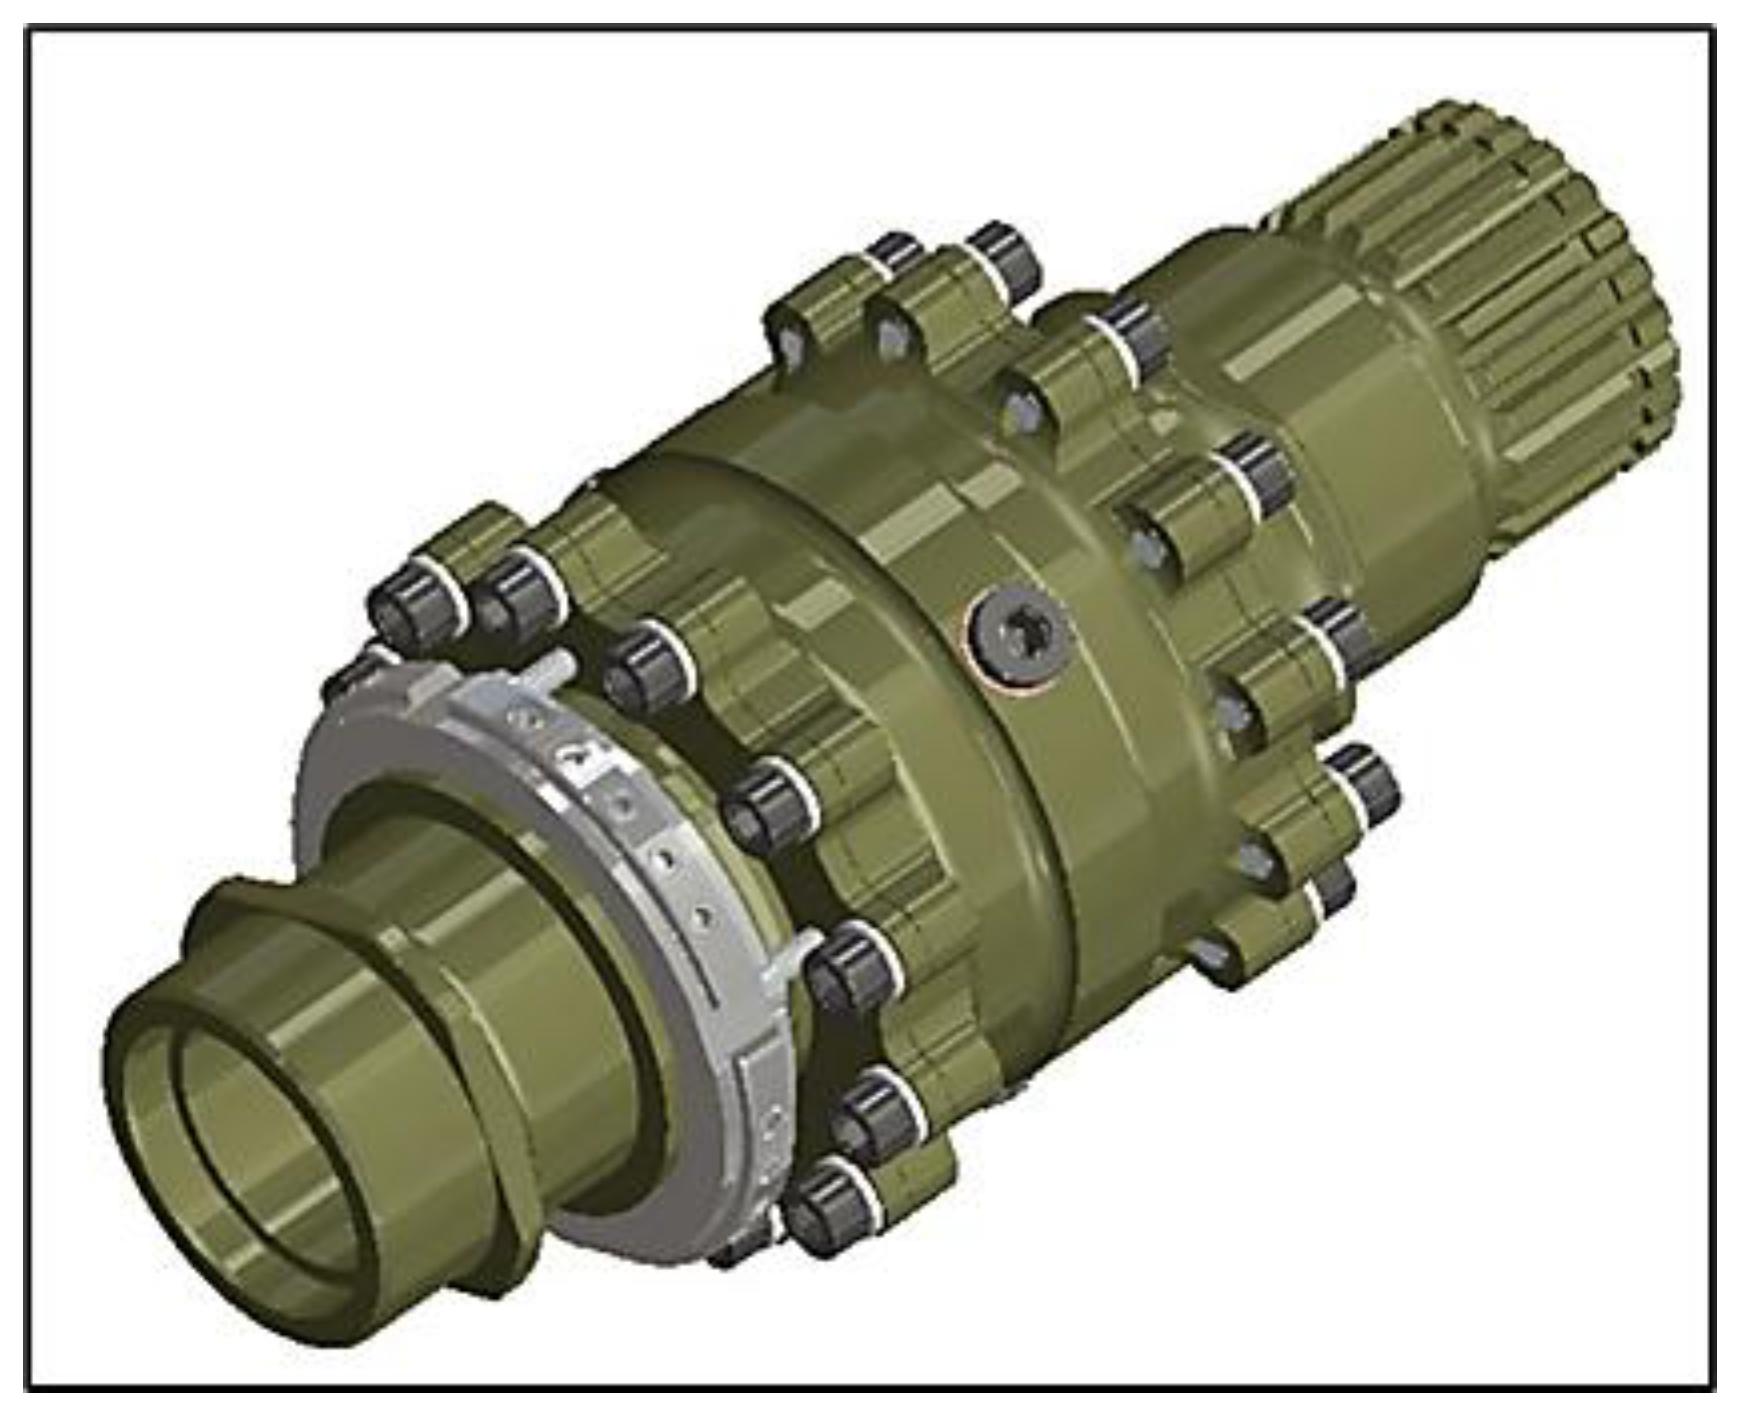
Figure 16.
Peerless 110 Differential.
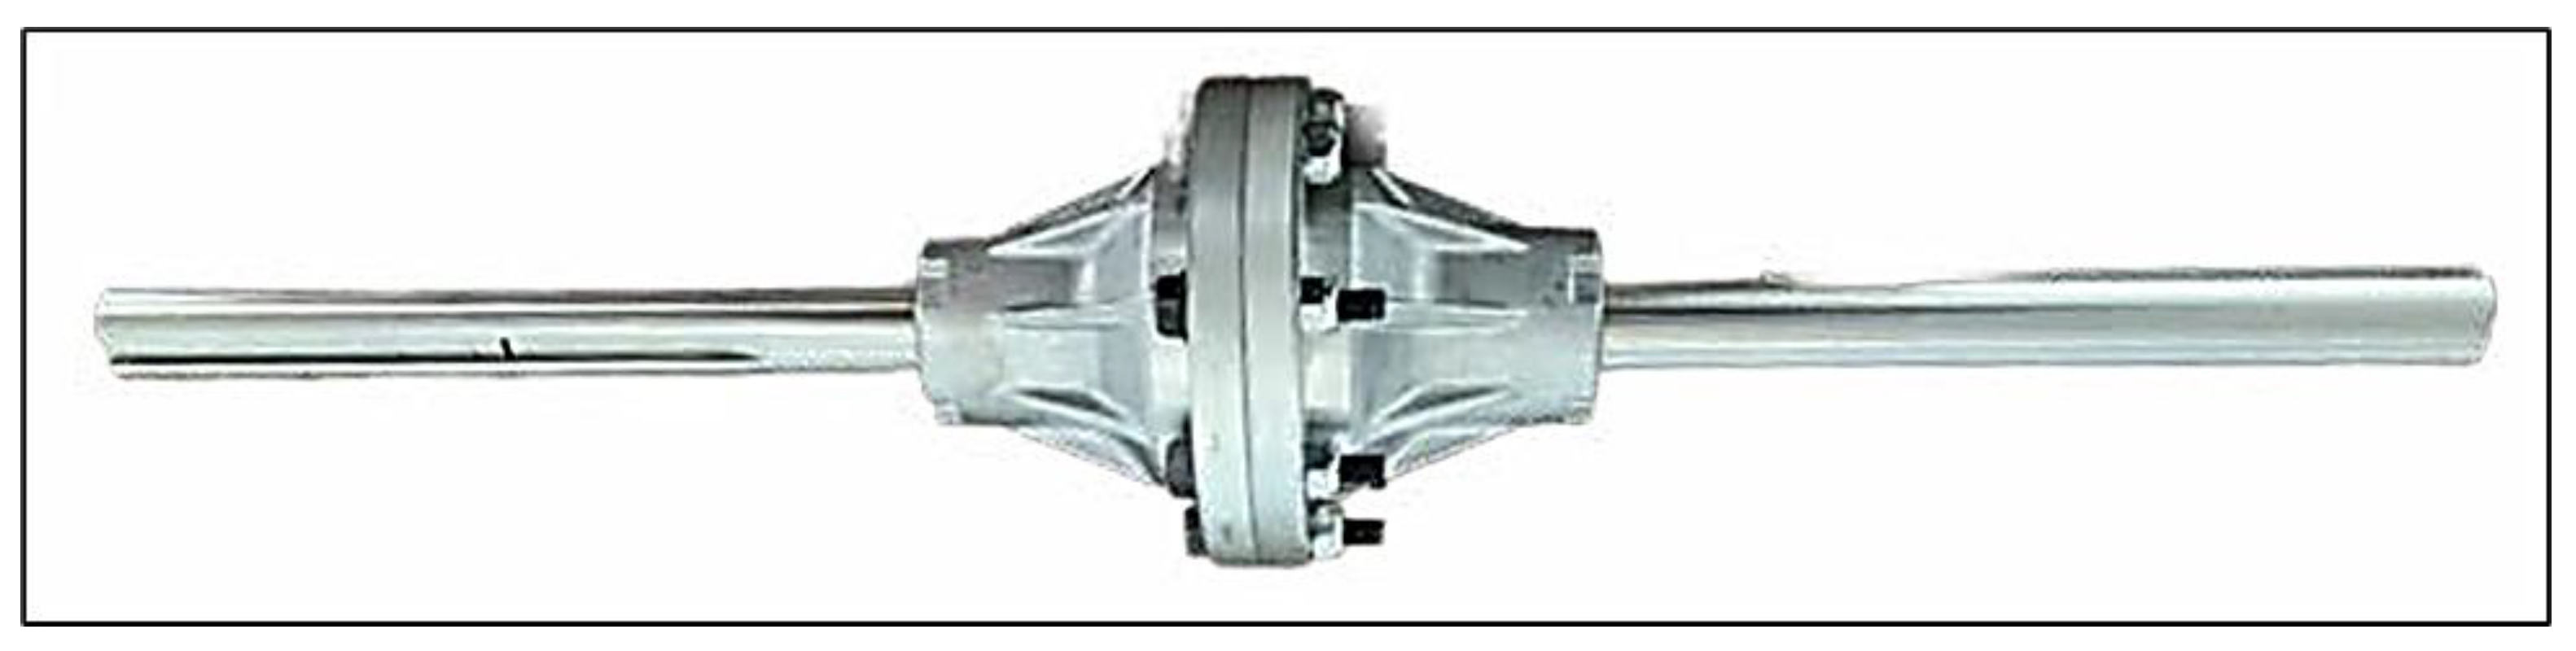
Figure 17.
Chain driven differential assembly.
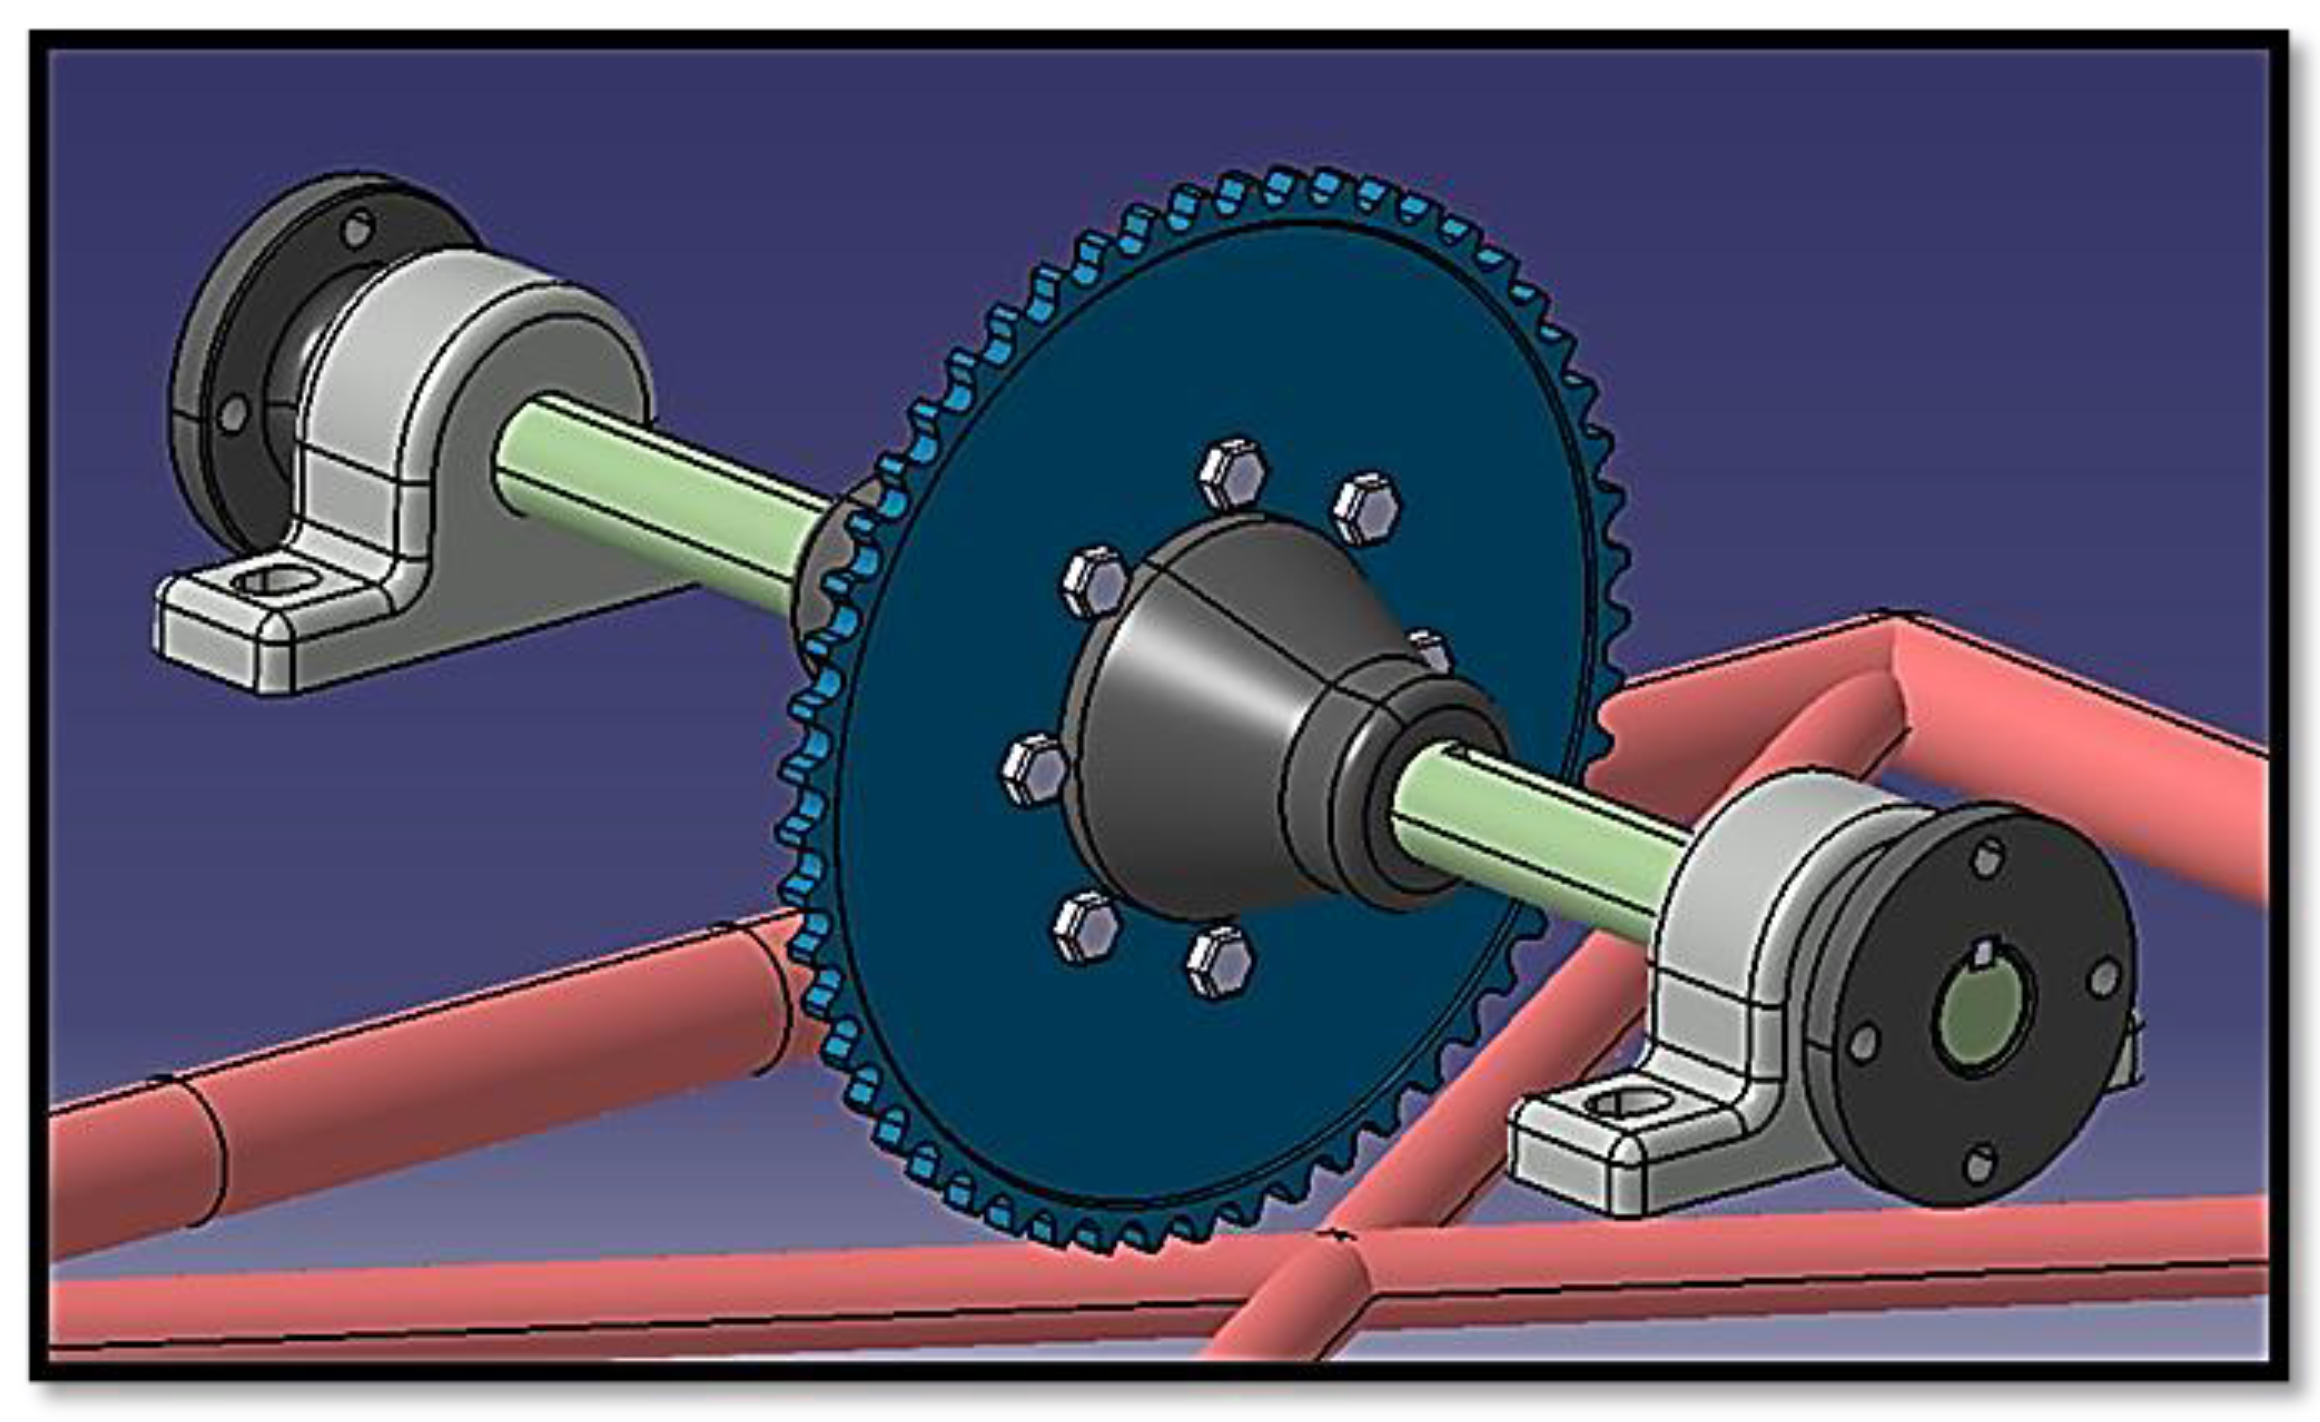
Figure 18.
Potential mount for the axle bearing housing.
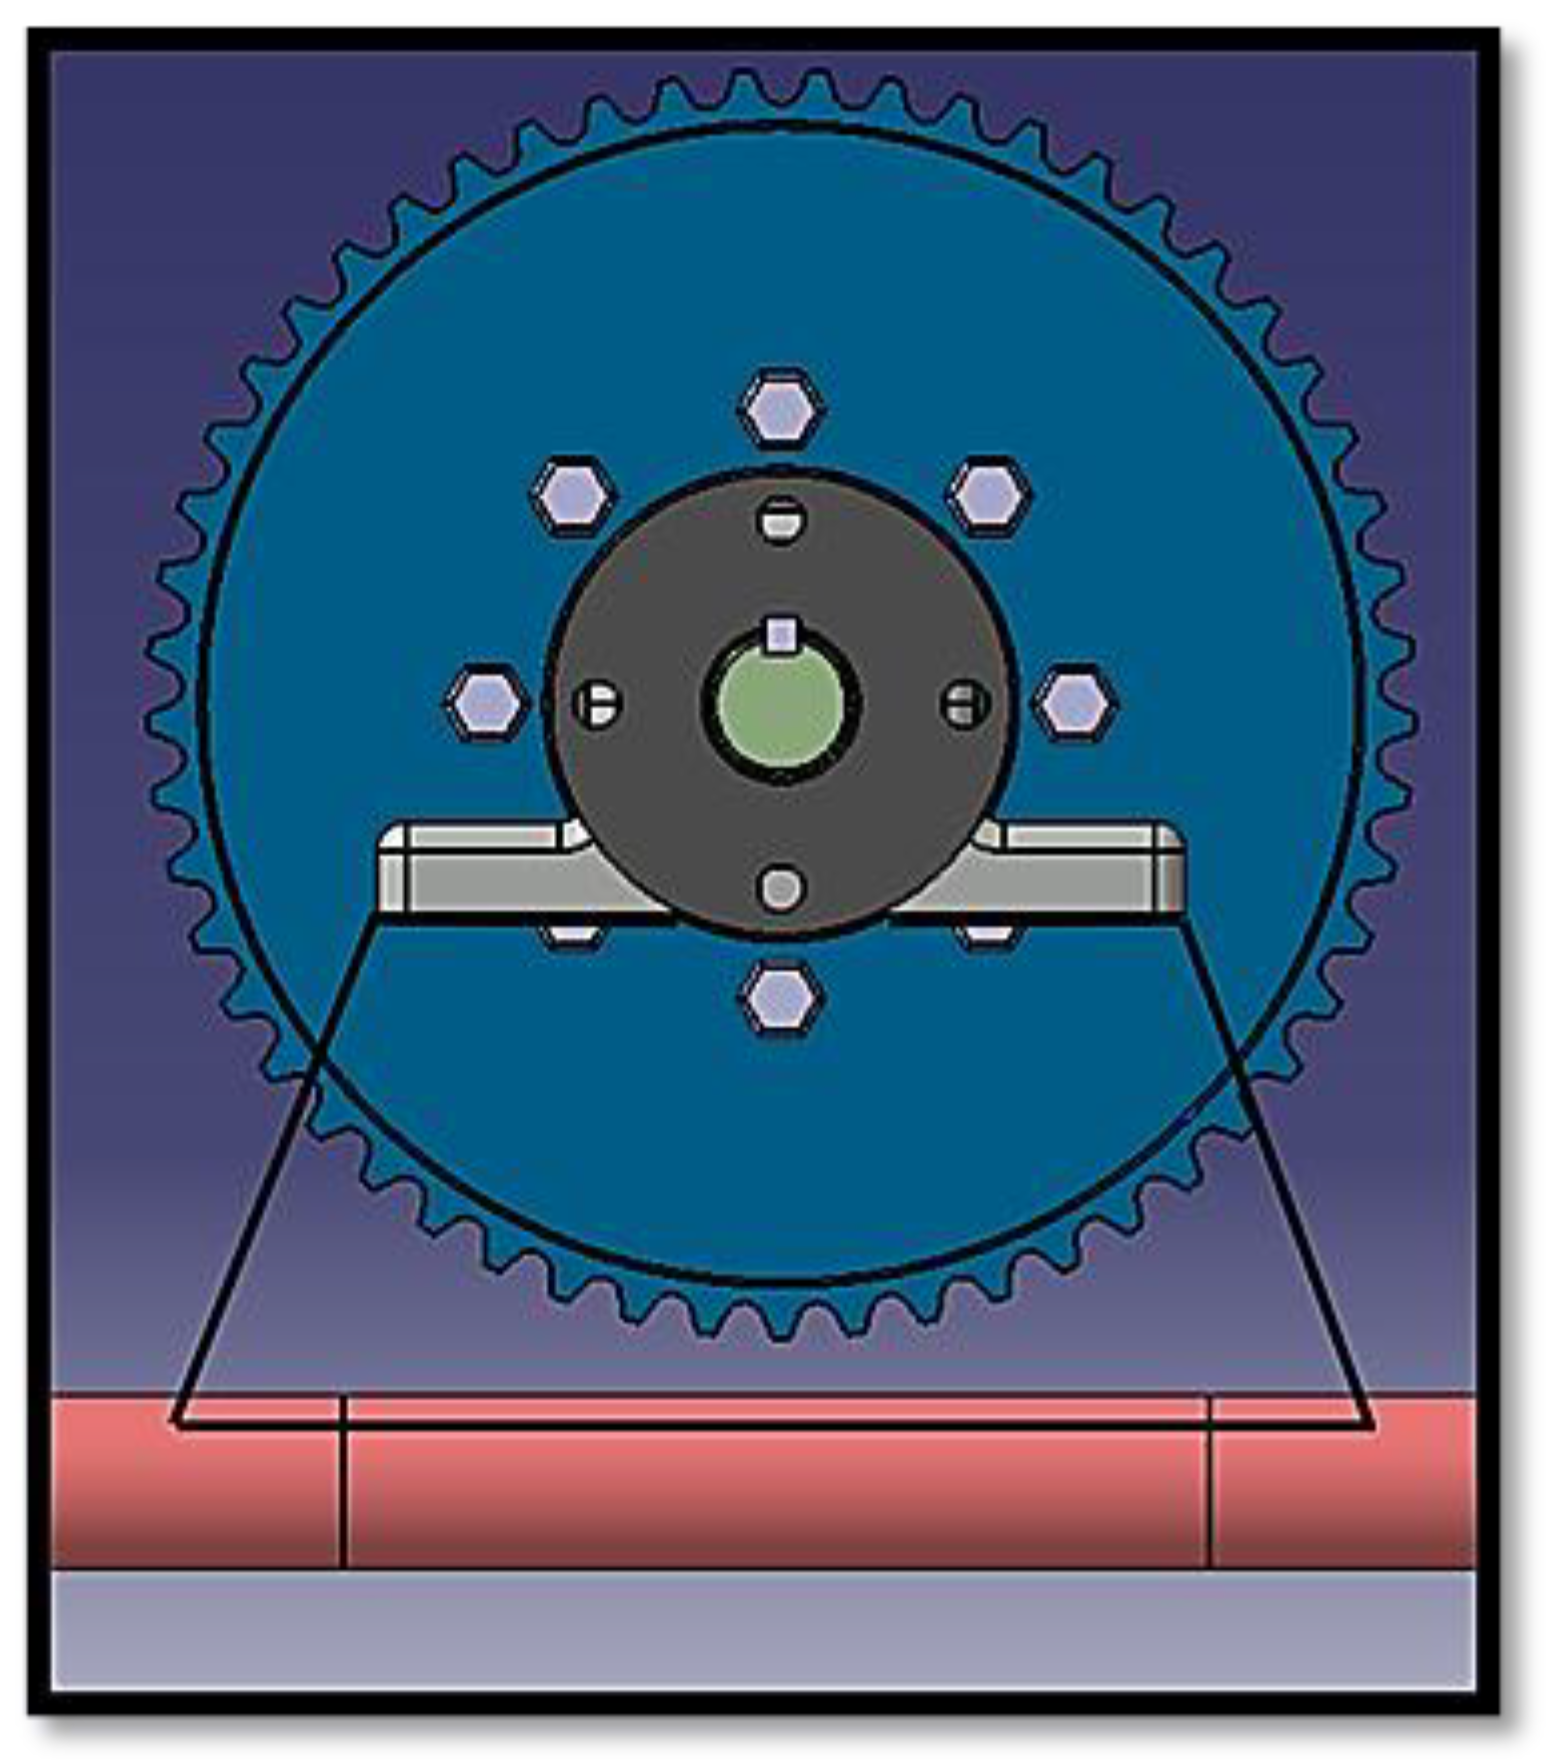
Figure 19.
Details of the chain tightening method.
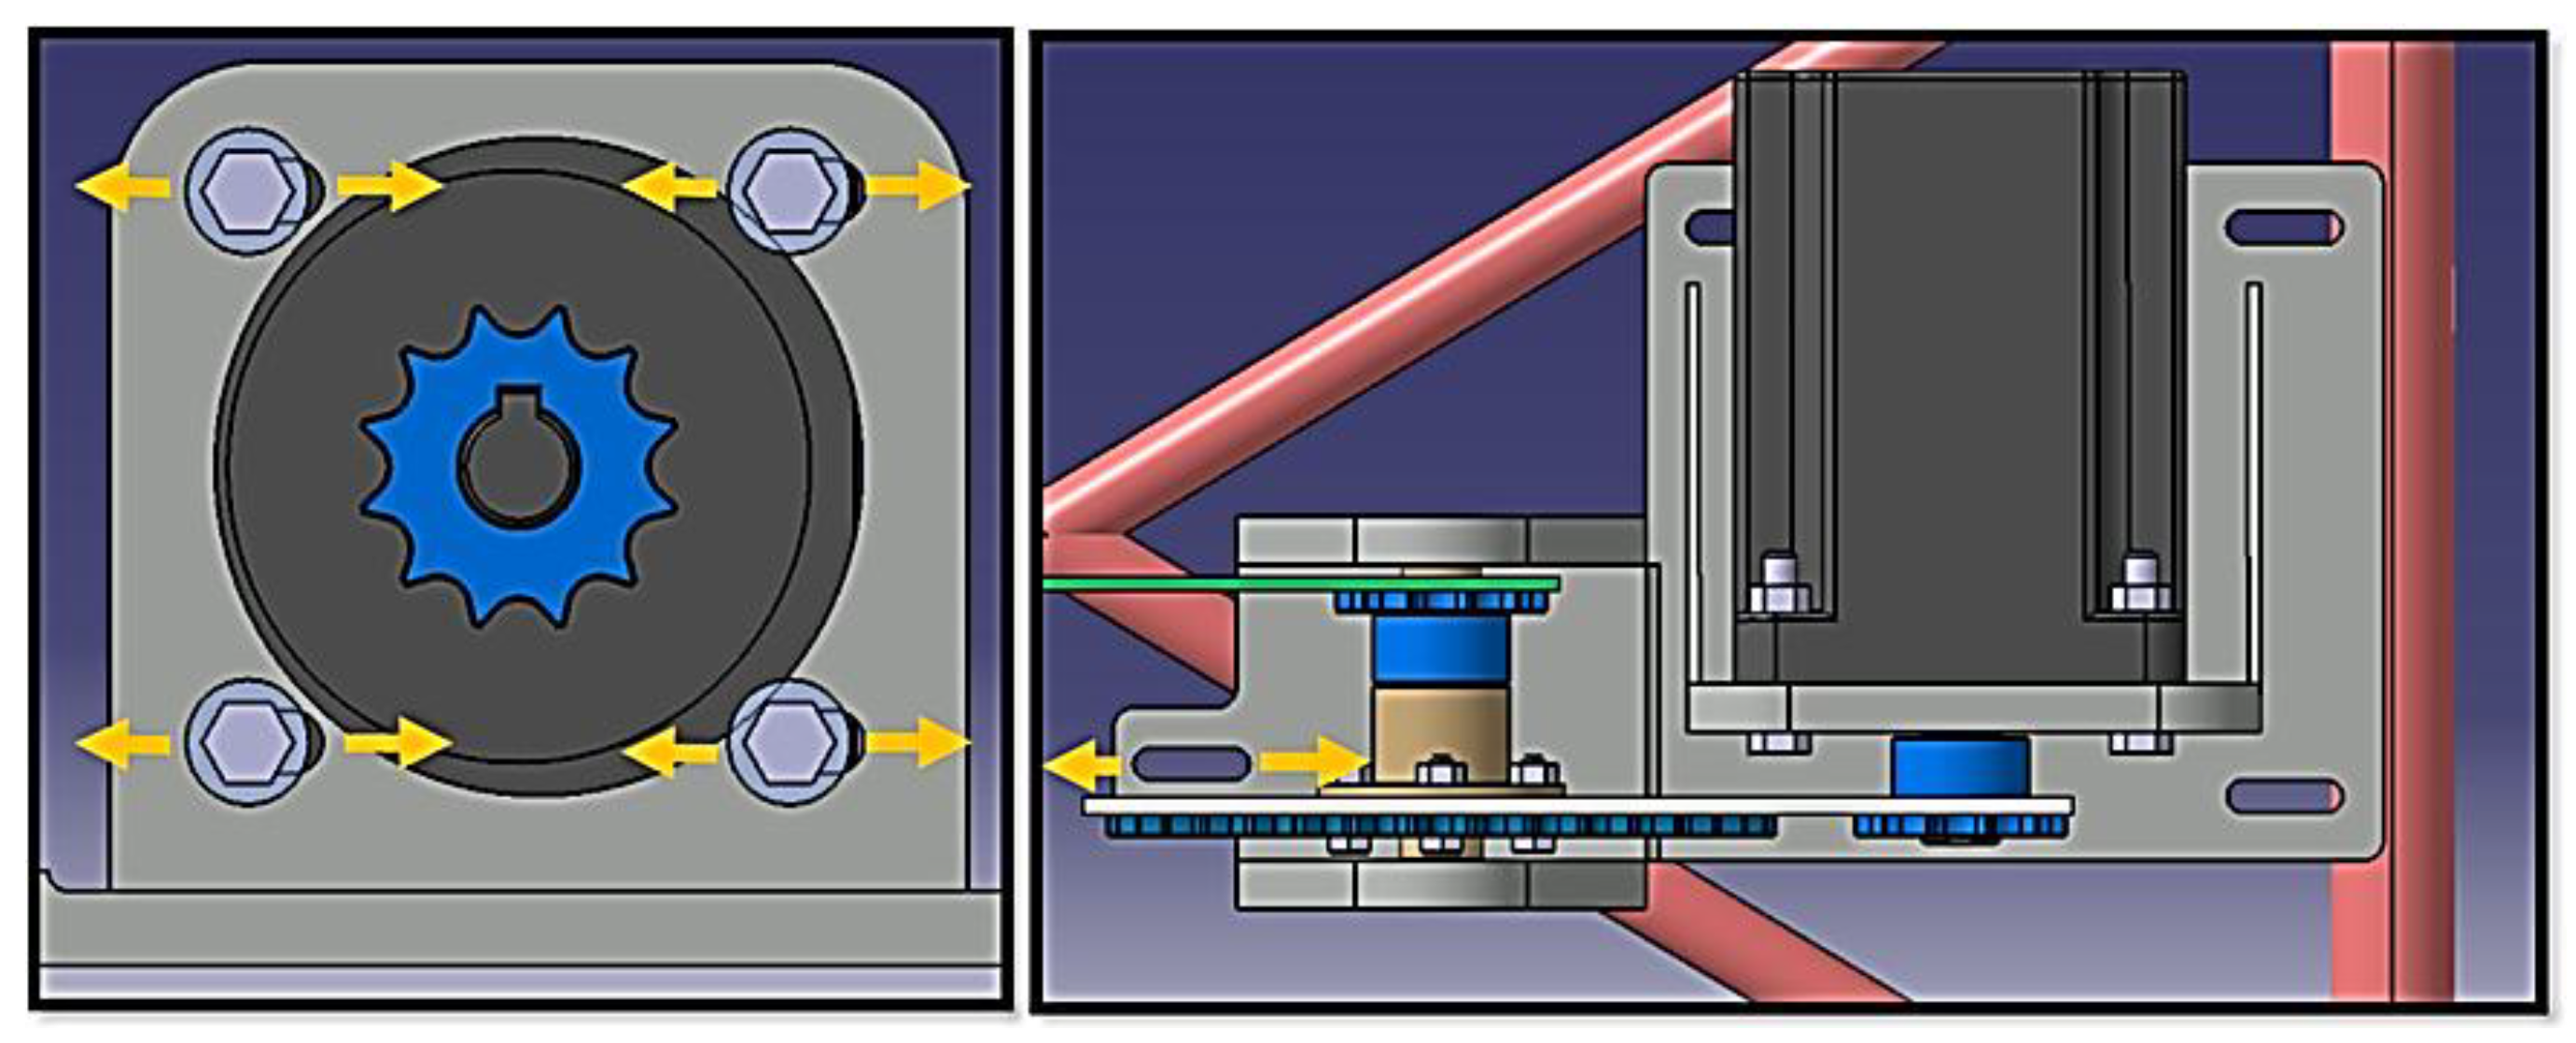
Figure 20.
Details of the battery case design.
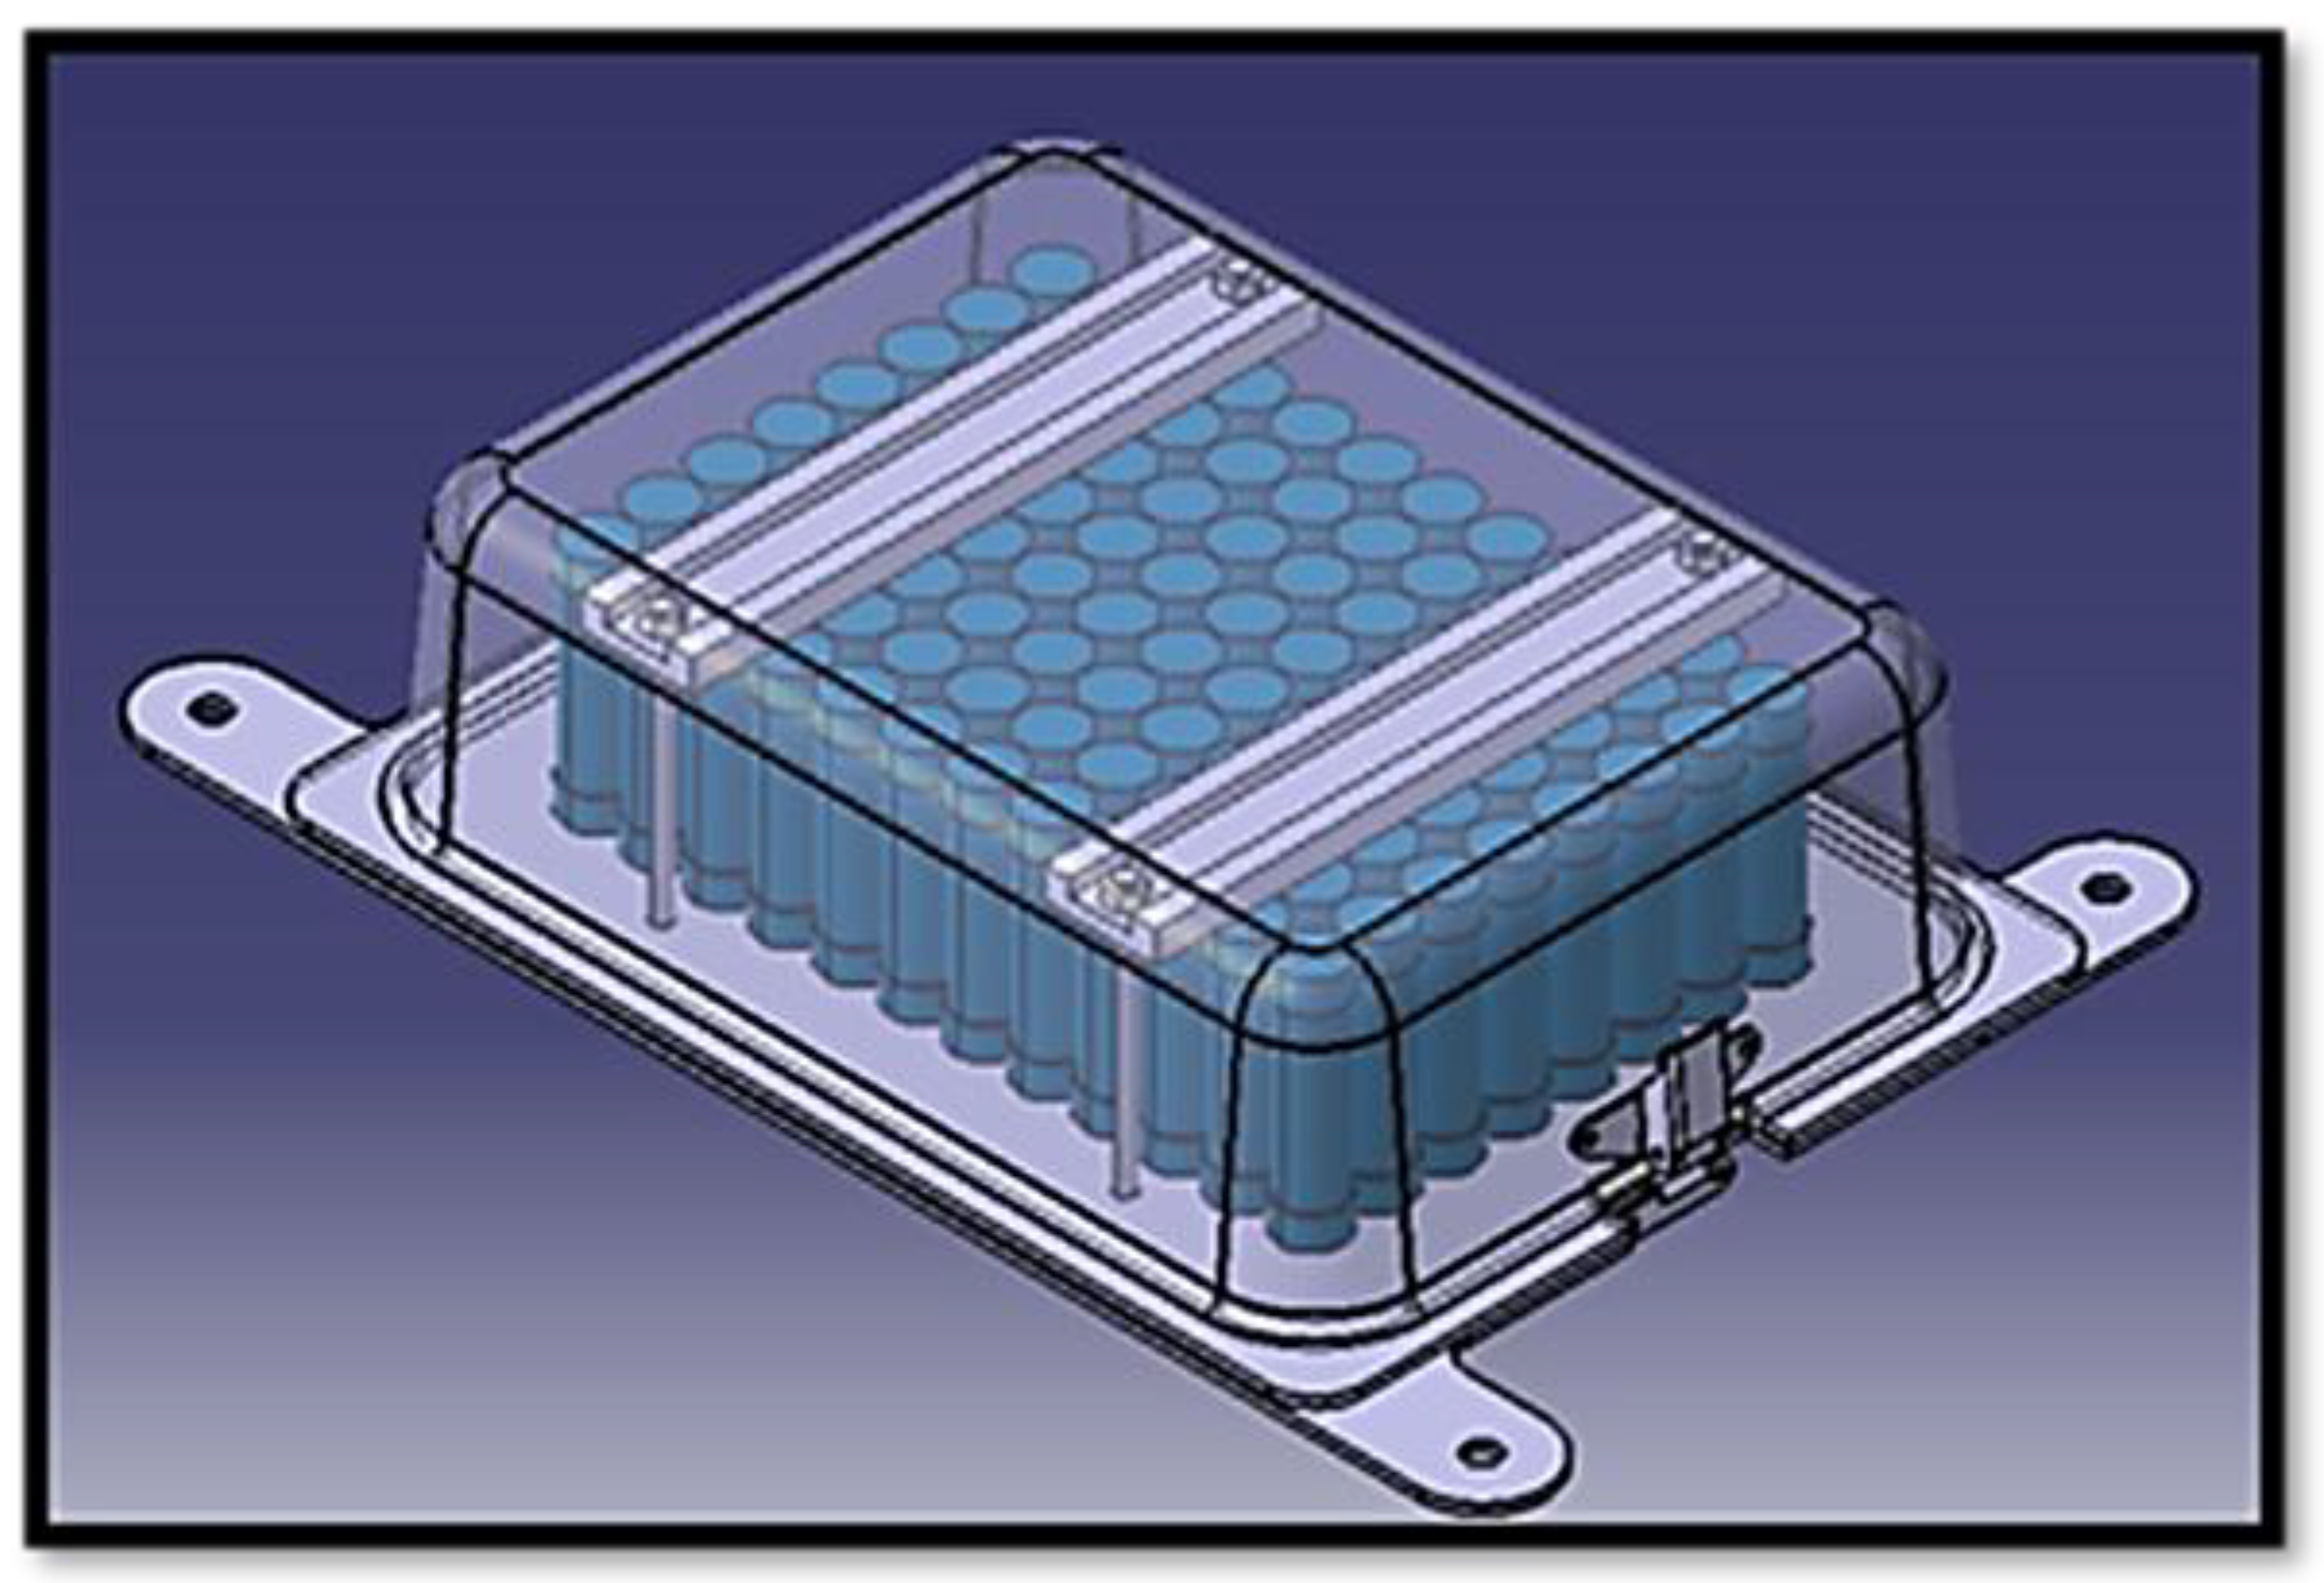
Figure 21.
DC-DC converter, (Victron Energy, 2025).
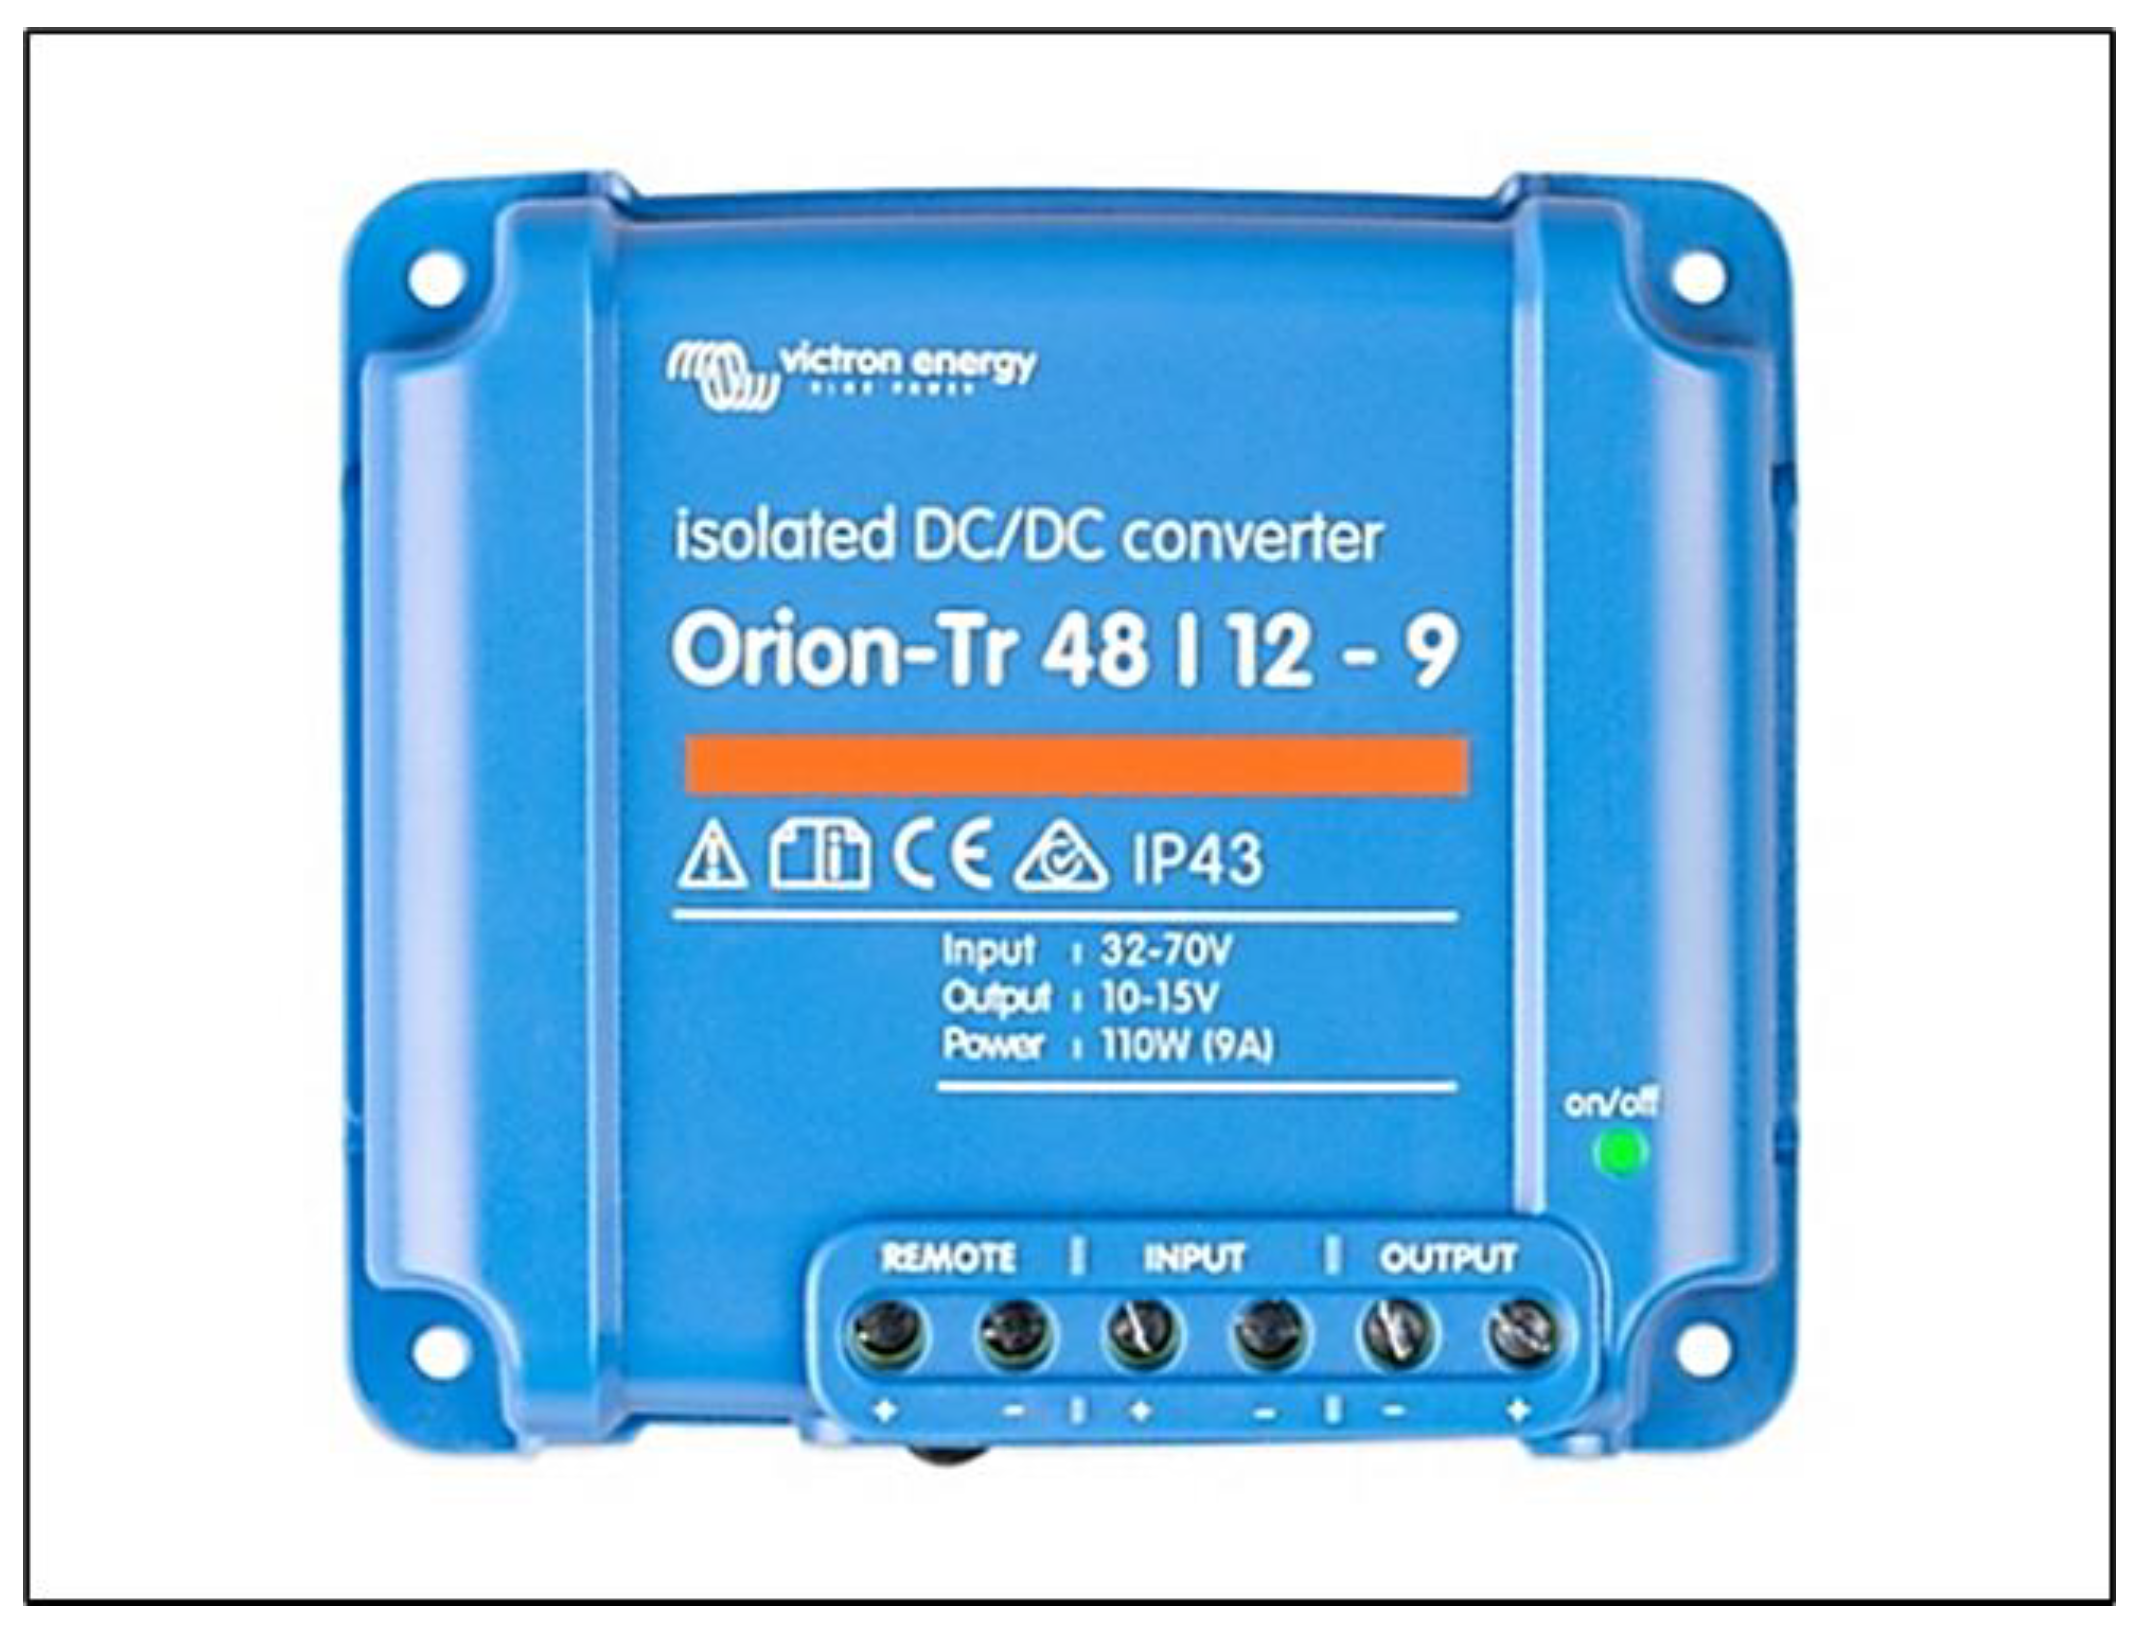
Figure 22.
Motor controller diagram.
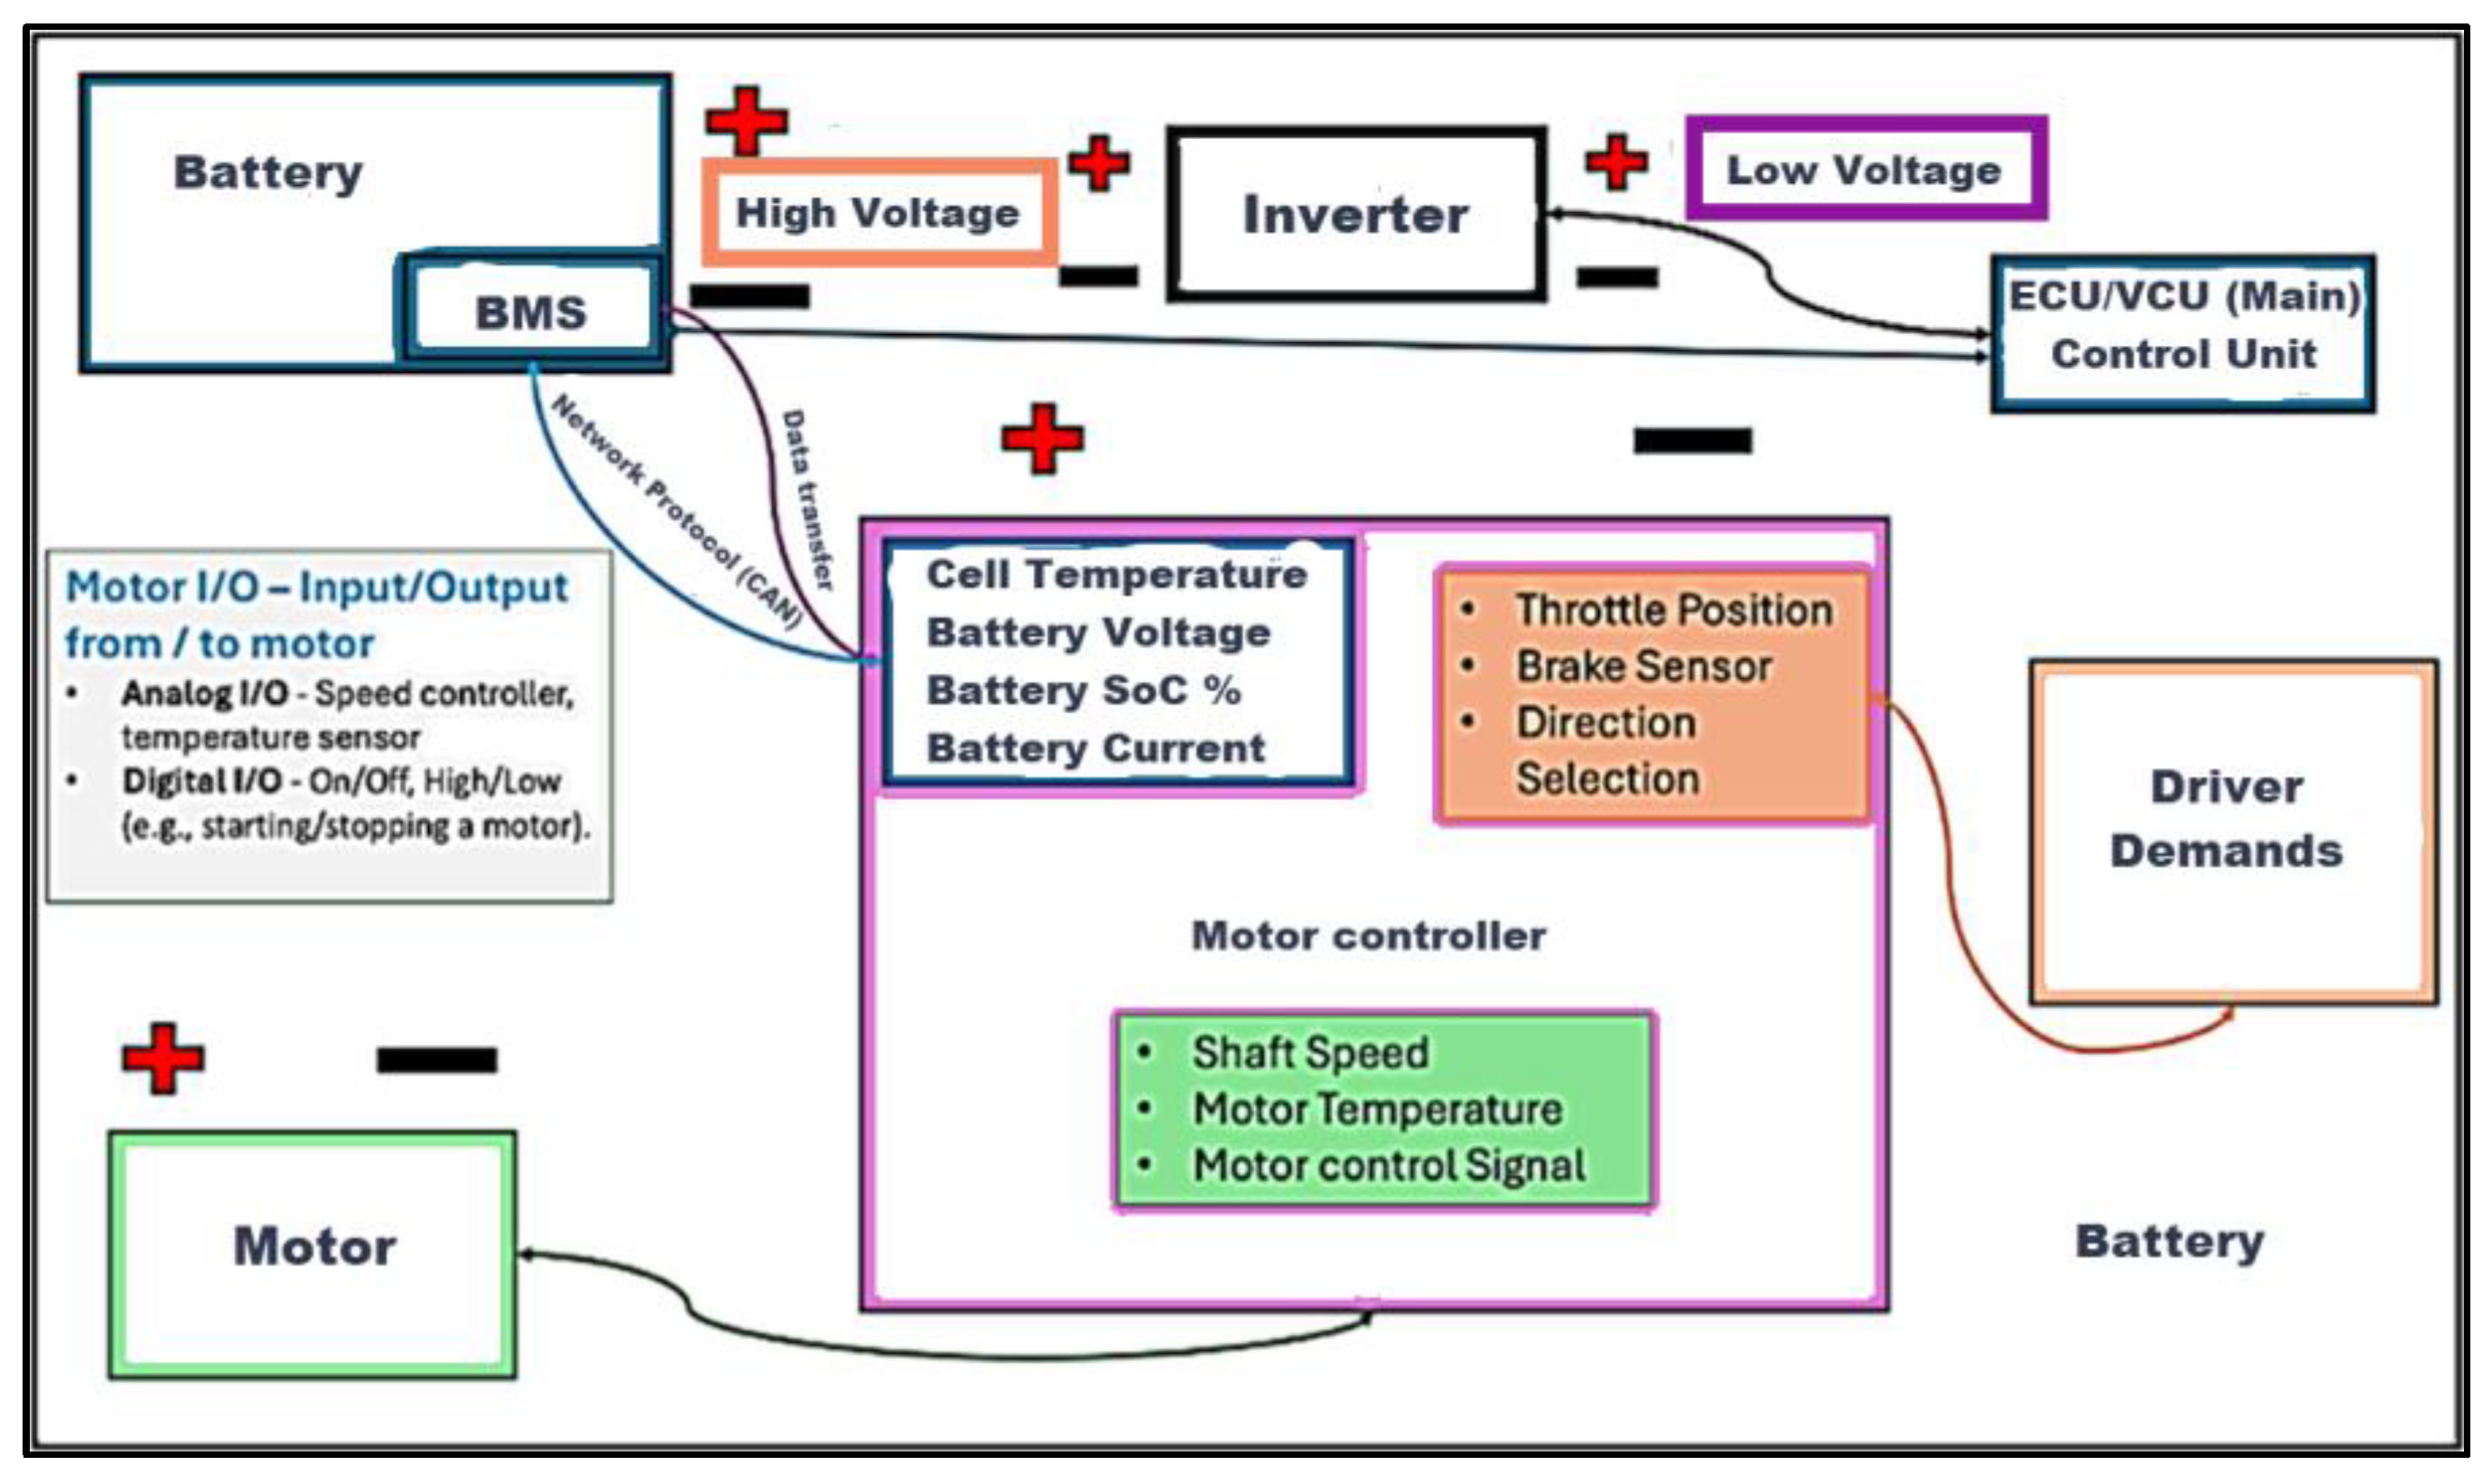
Figure 23.
Vehicle Speed Tracking (km/h vs. time).
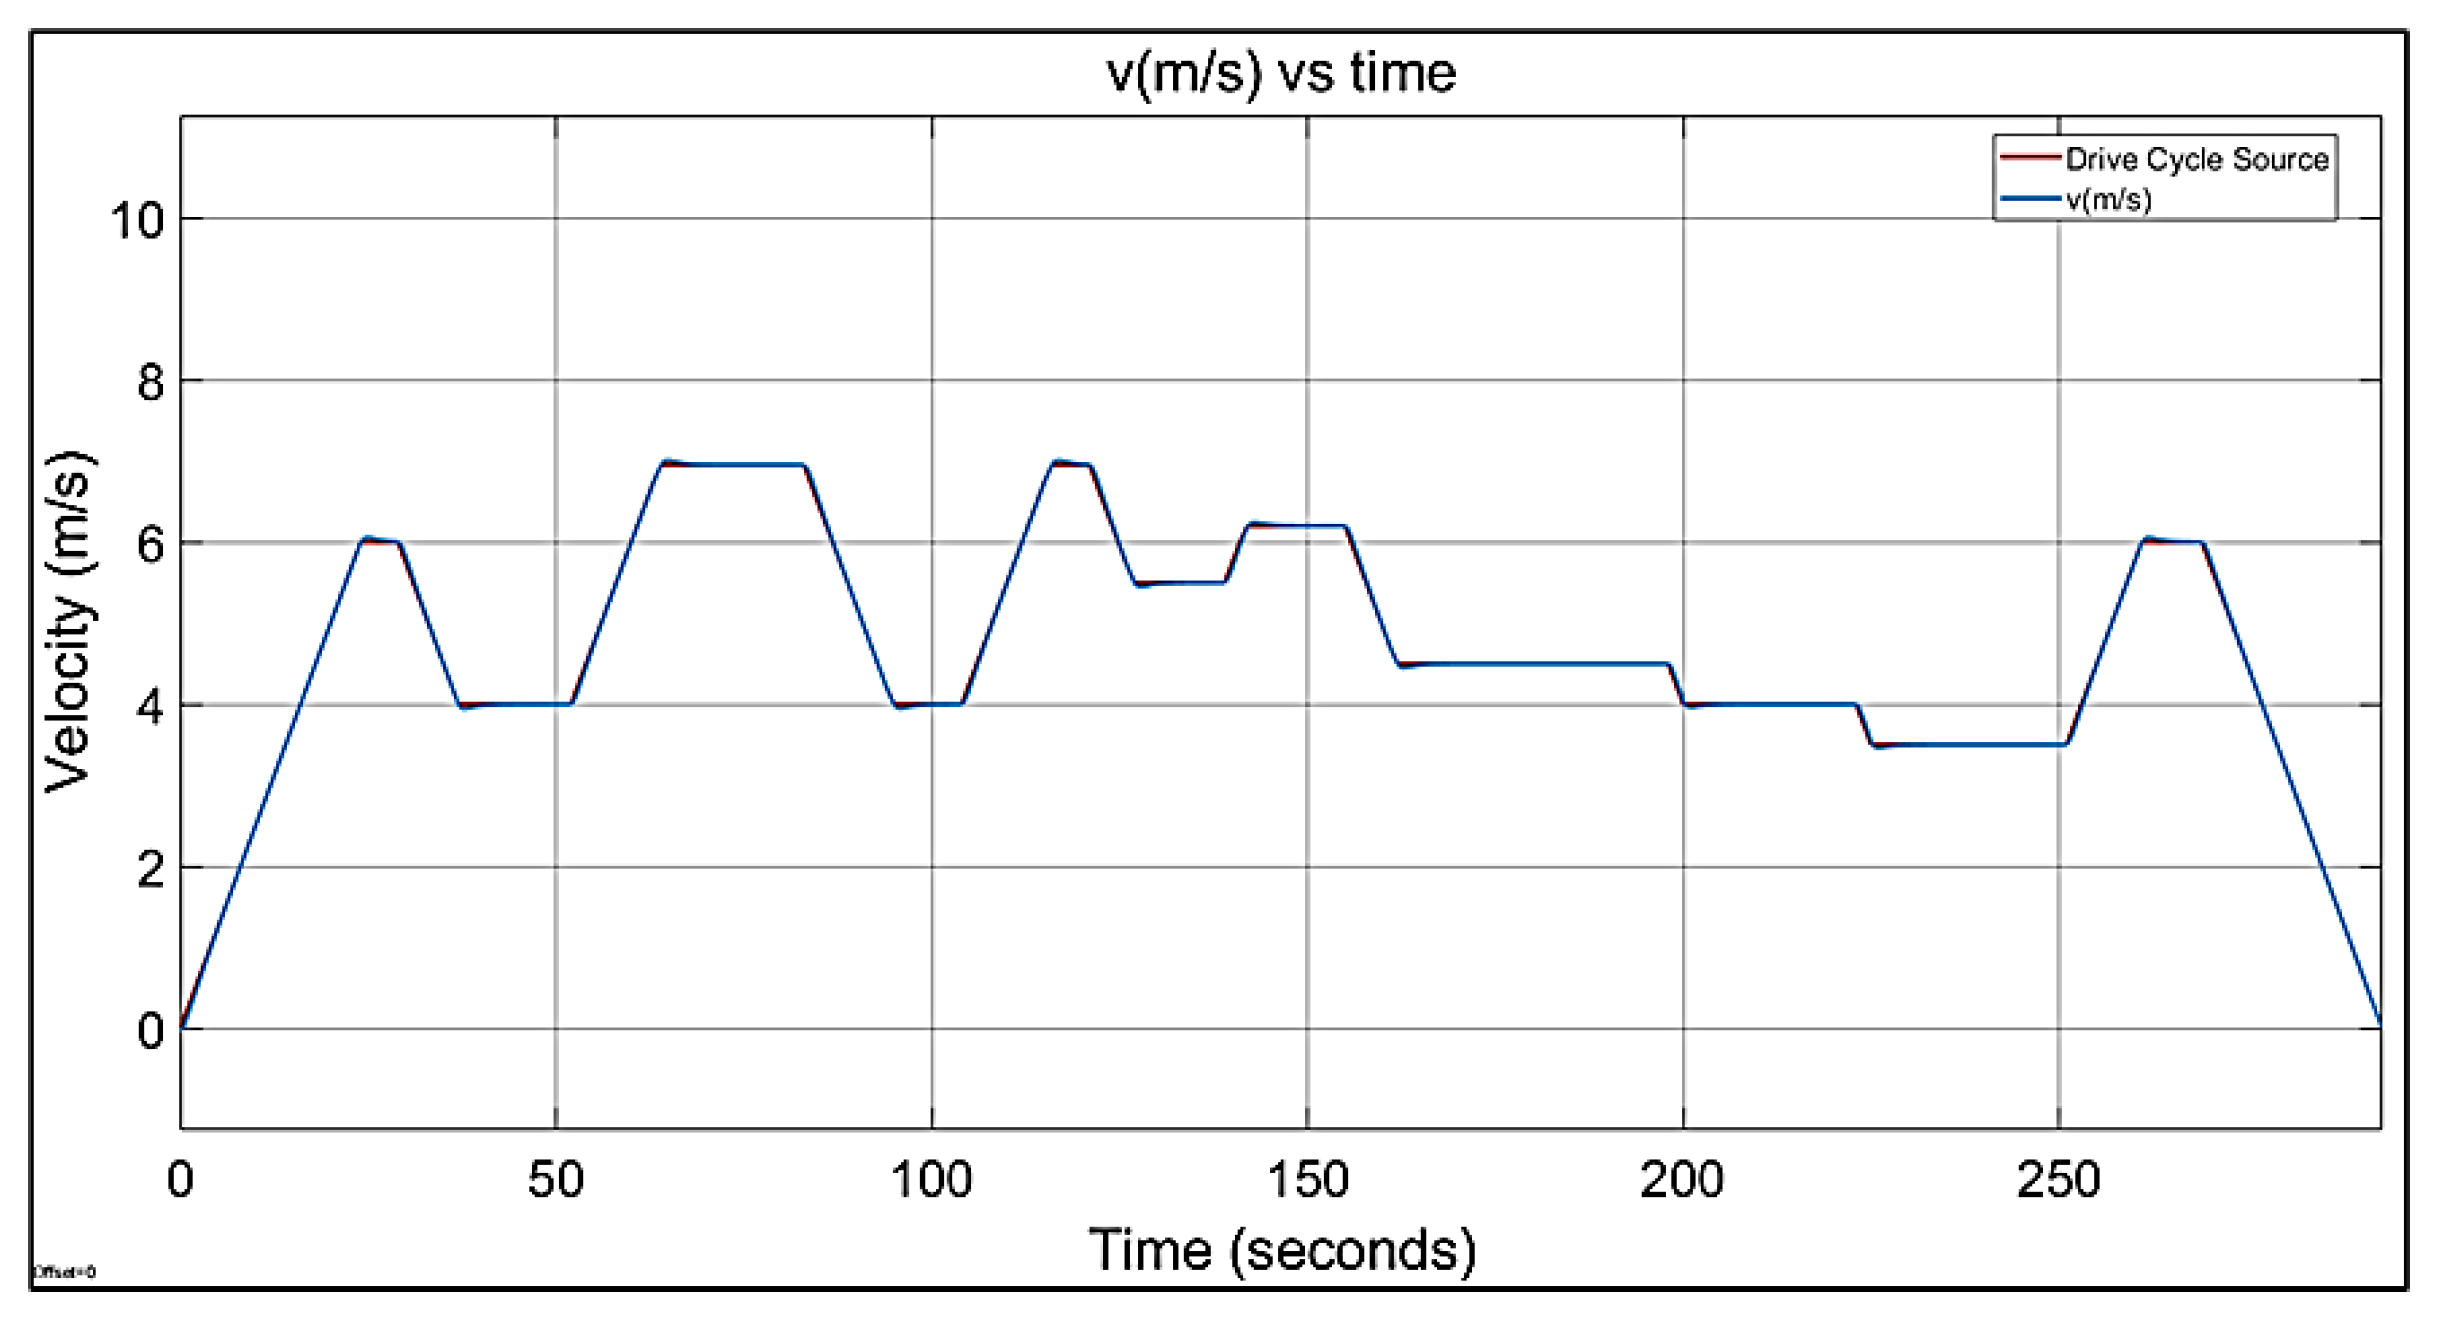
Figure 24.
EDU (Electric Drive unit) Subsystem based on 48V, 1500W brushless DC motor.
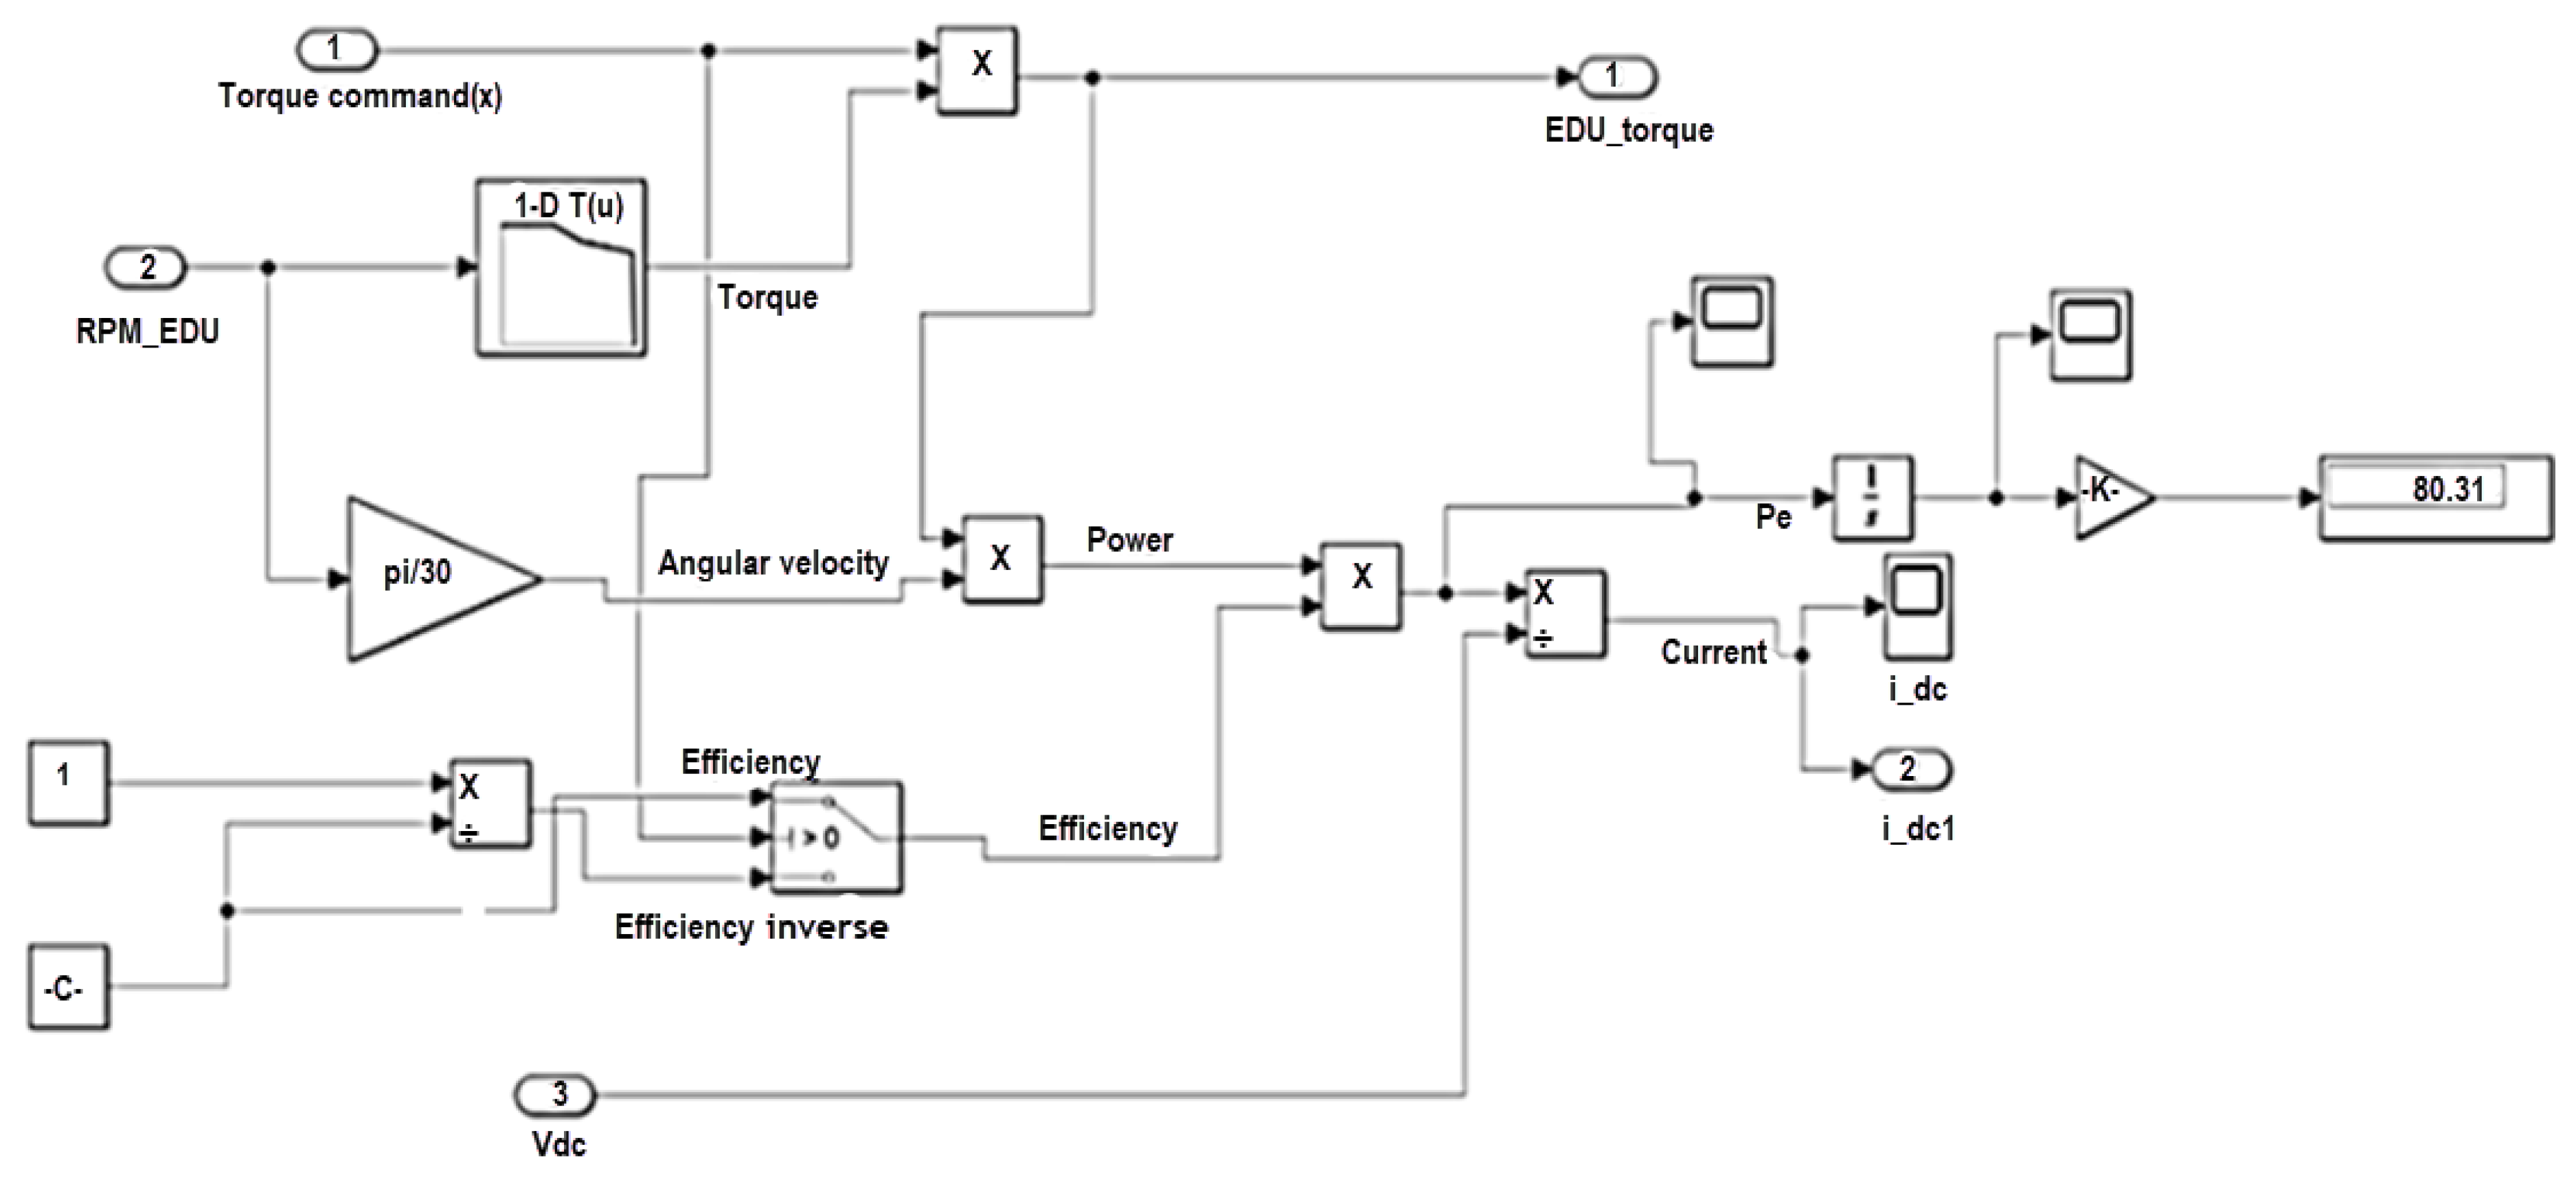
Figure 25.
EDU (Electric Drive unit) Subsystem based on 48V, 1500W brushless DC motor (same as Figure 24 for consistency).
Figure 25.
EDU (Electric Drive unit) Subsystem based on 48V, 1500W brushless DC motor (same as Figure 24 for consistency).

Figure 26.
The Battery Subsystem of 12S8P Molicel P28A 18650 lithium-ion.
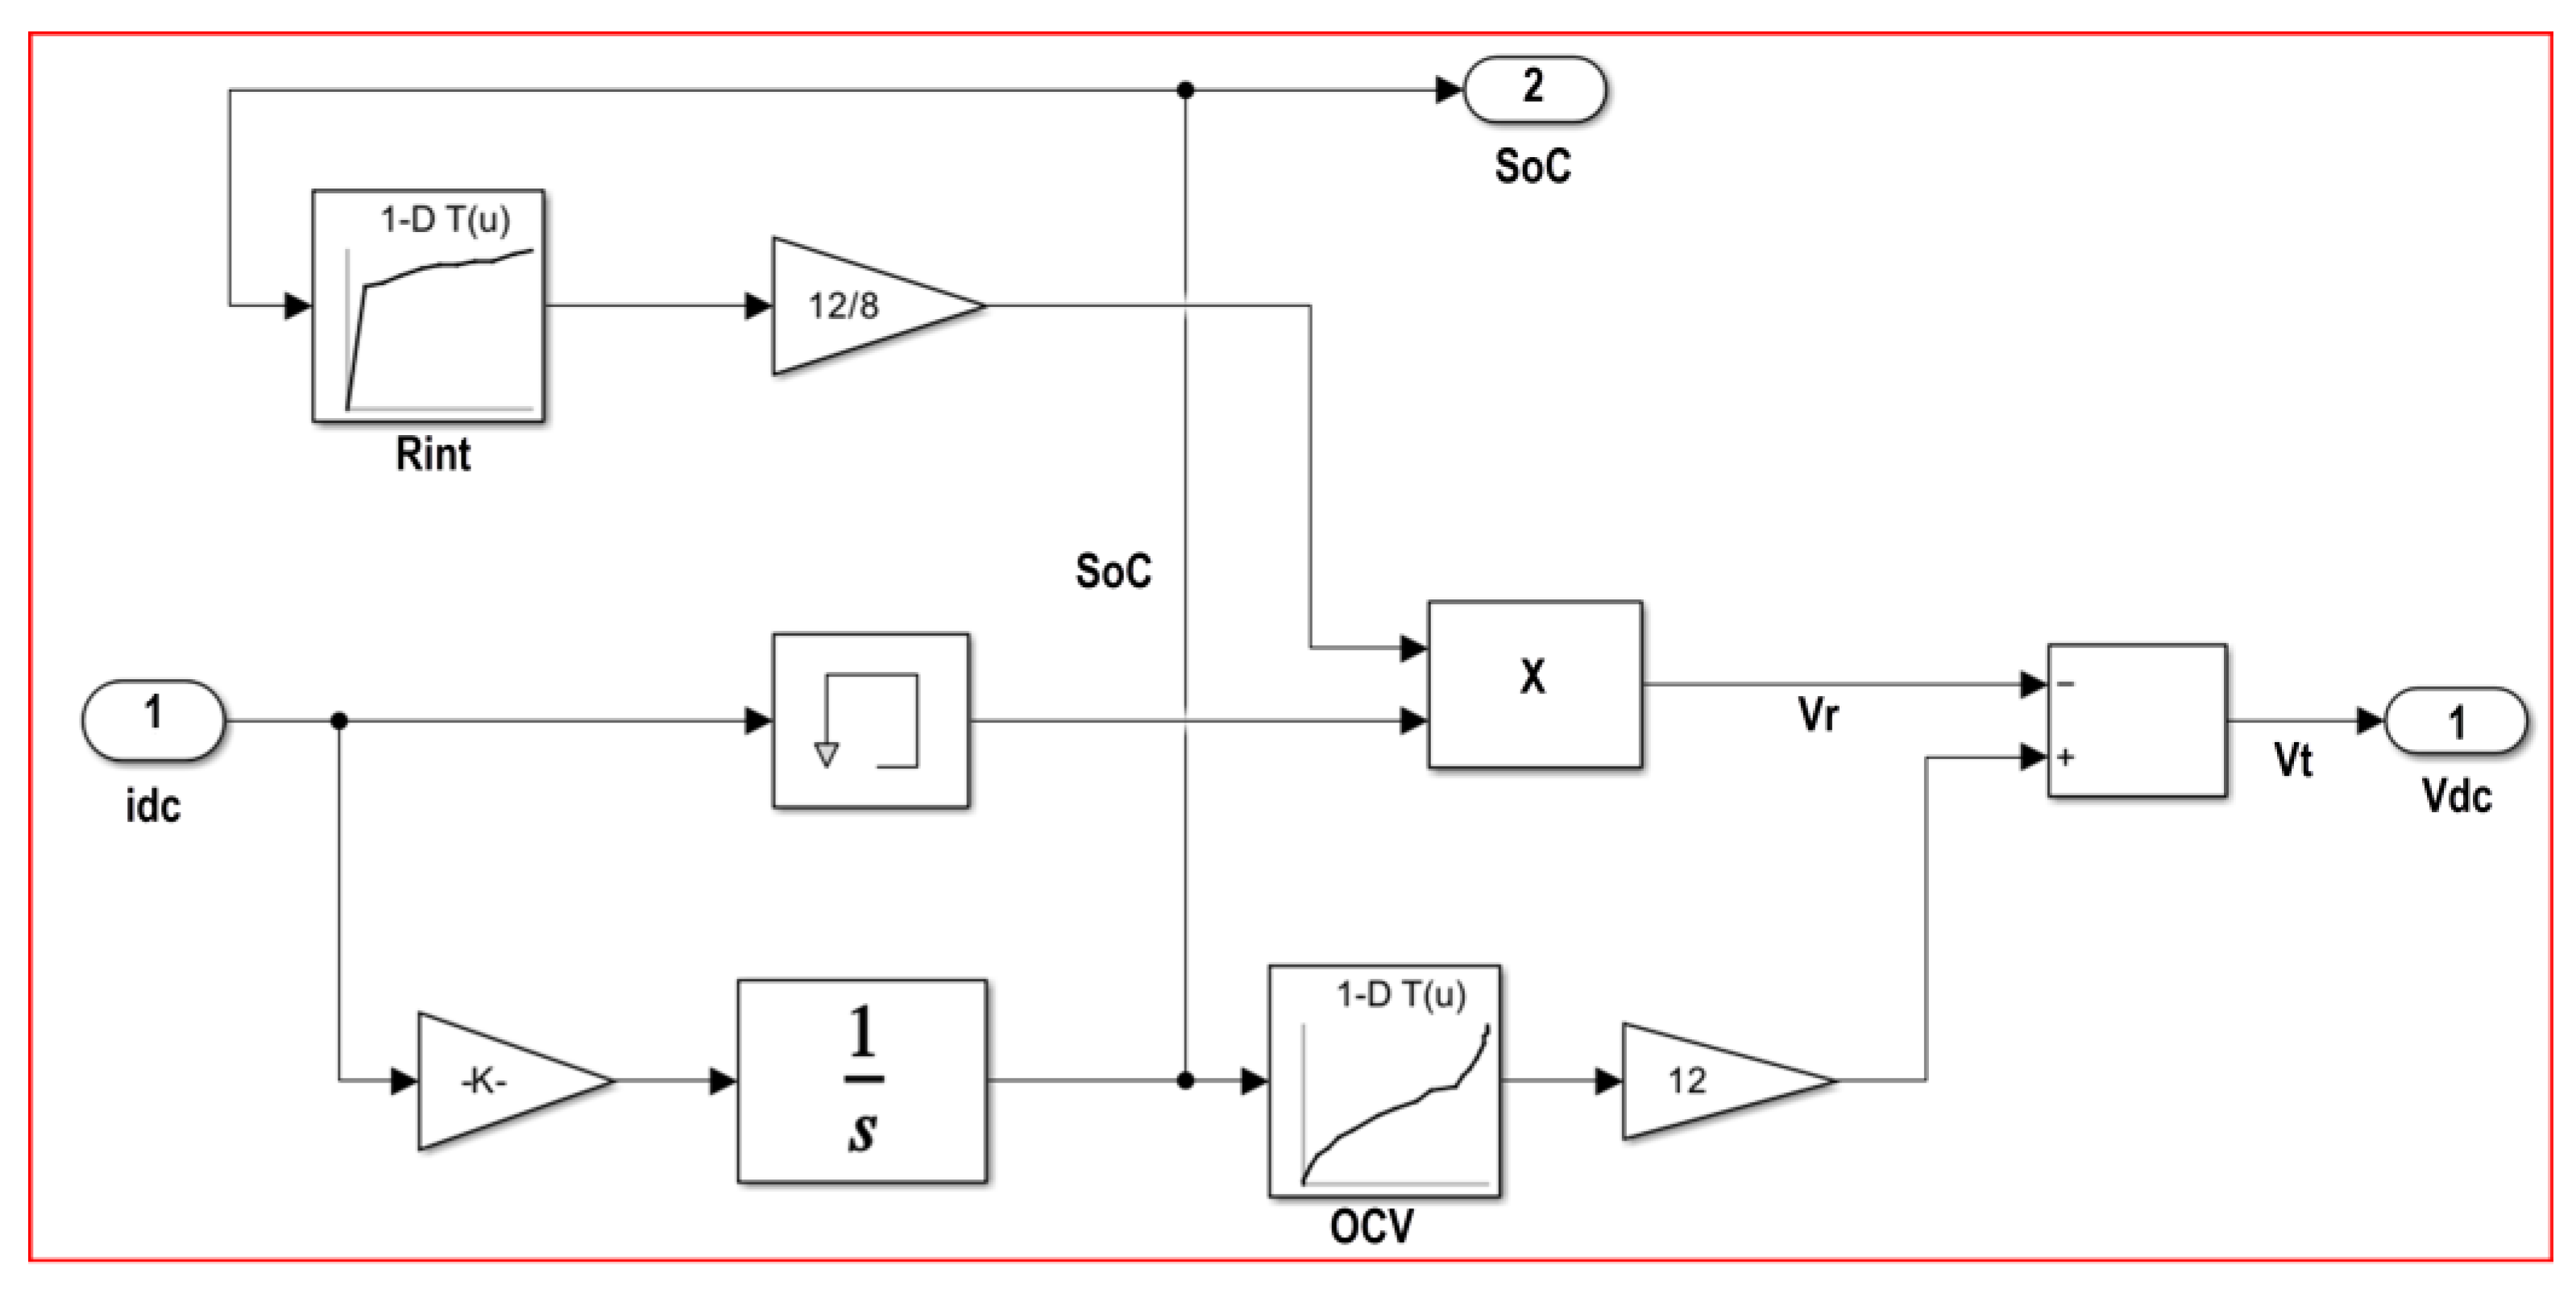
Figure 27.
Vehicle Dynamic Block.
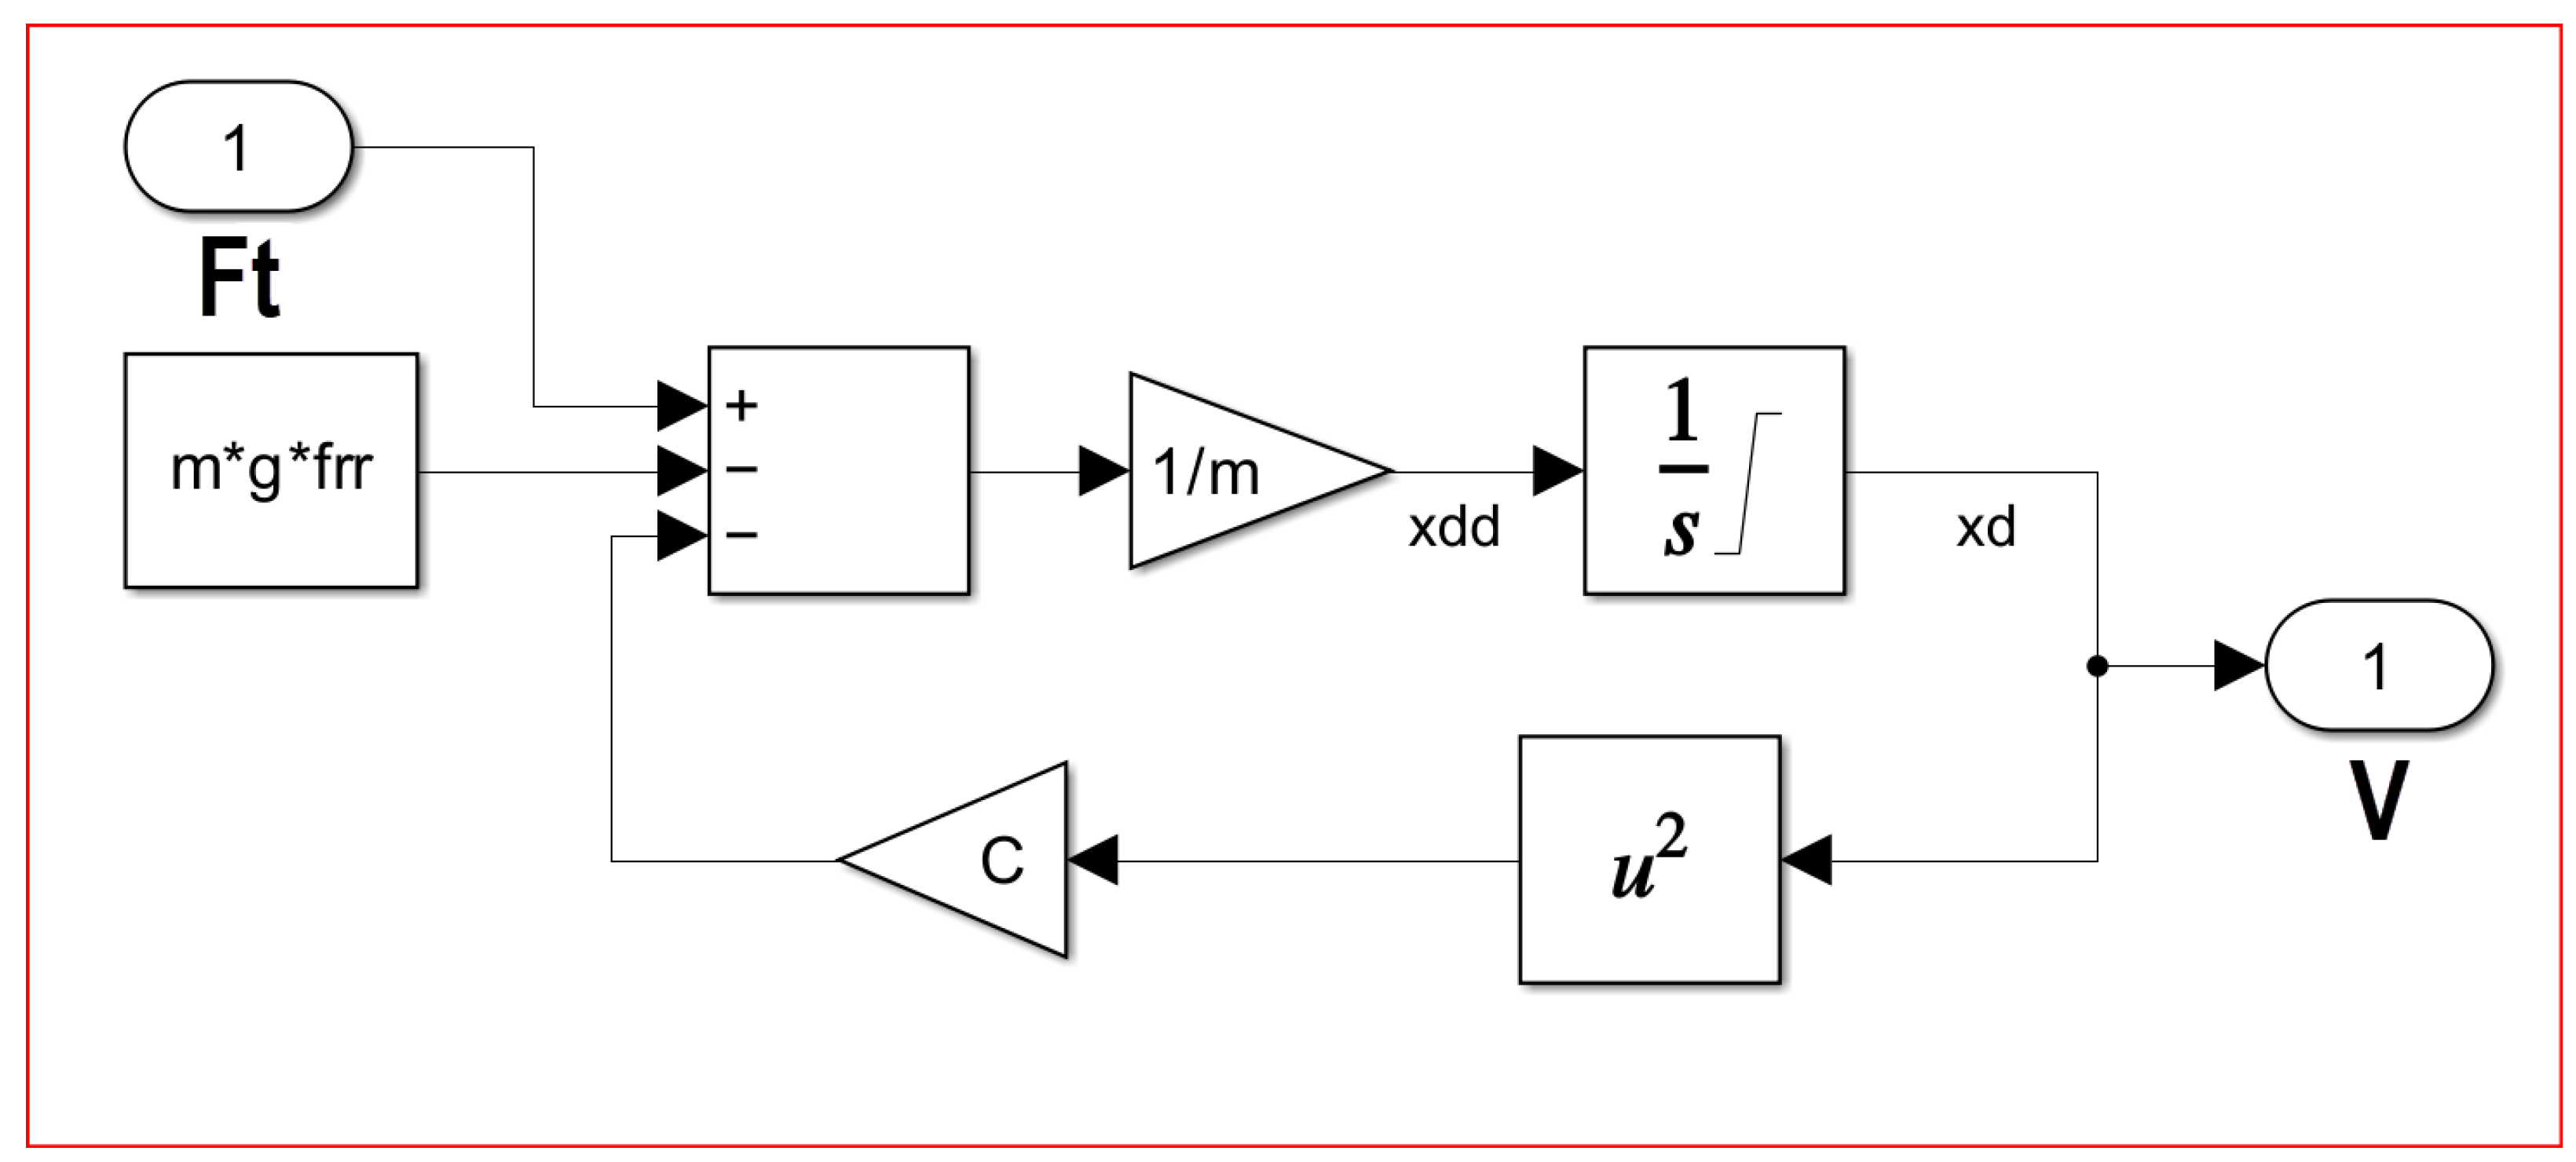
Figure 28.
SoC vs. Time This confirms that energy draw was consistent with expected consumption trends.
Figure 28.
SoC vs. Time This confirms that energy draw was consistent with expected consumption trends.
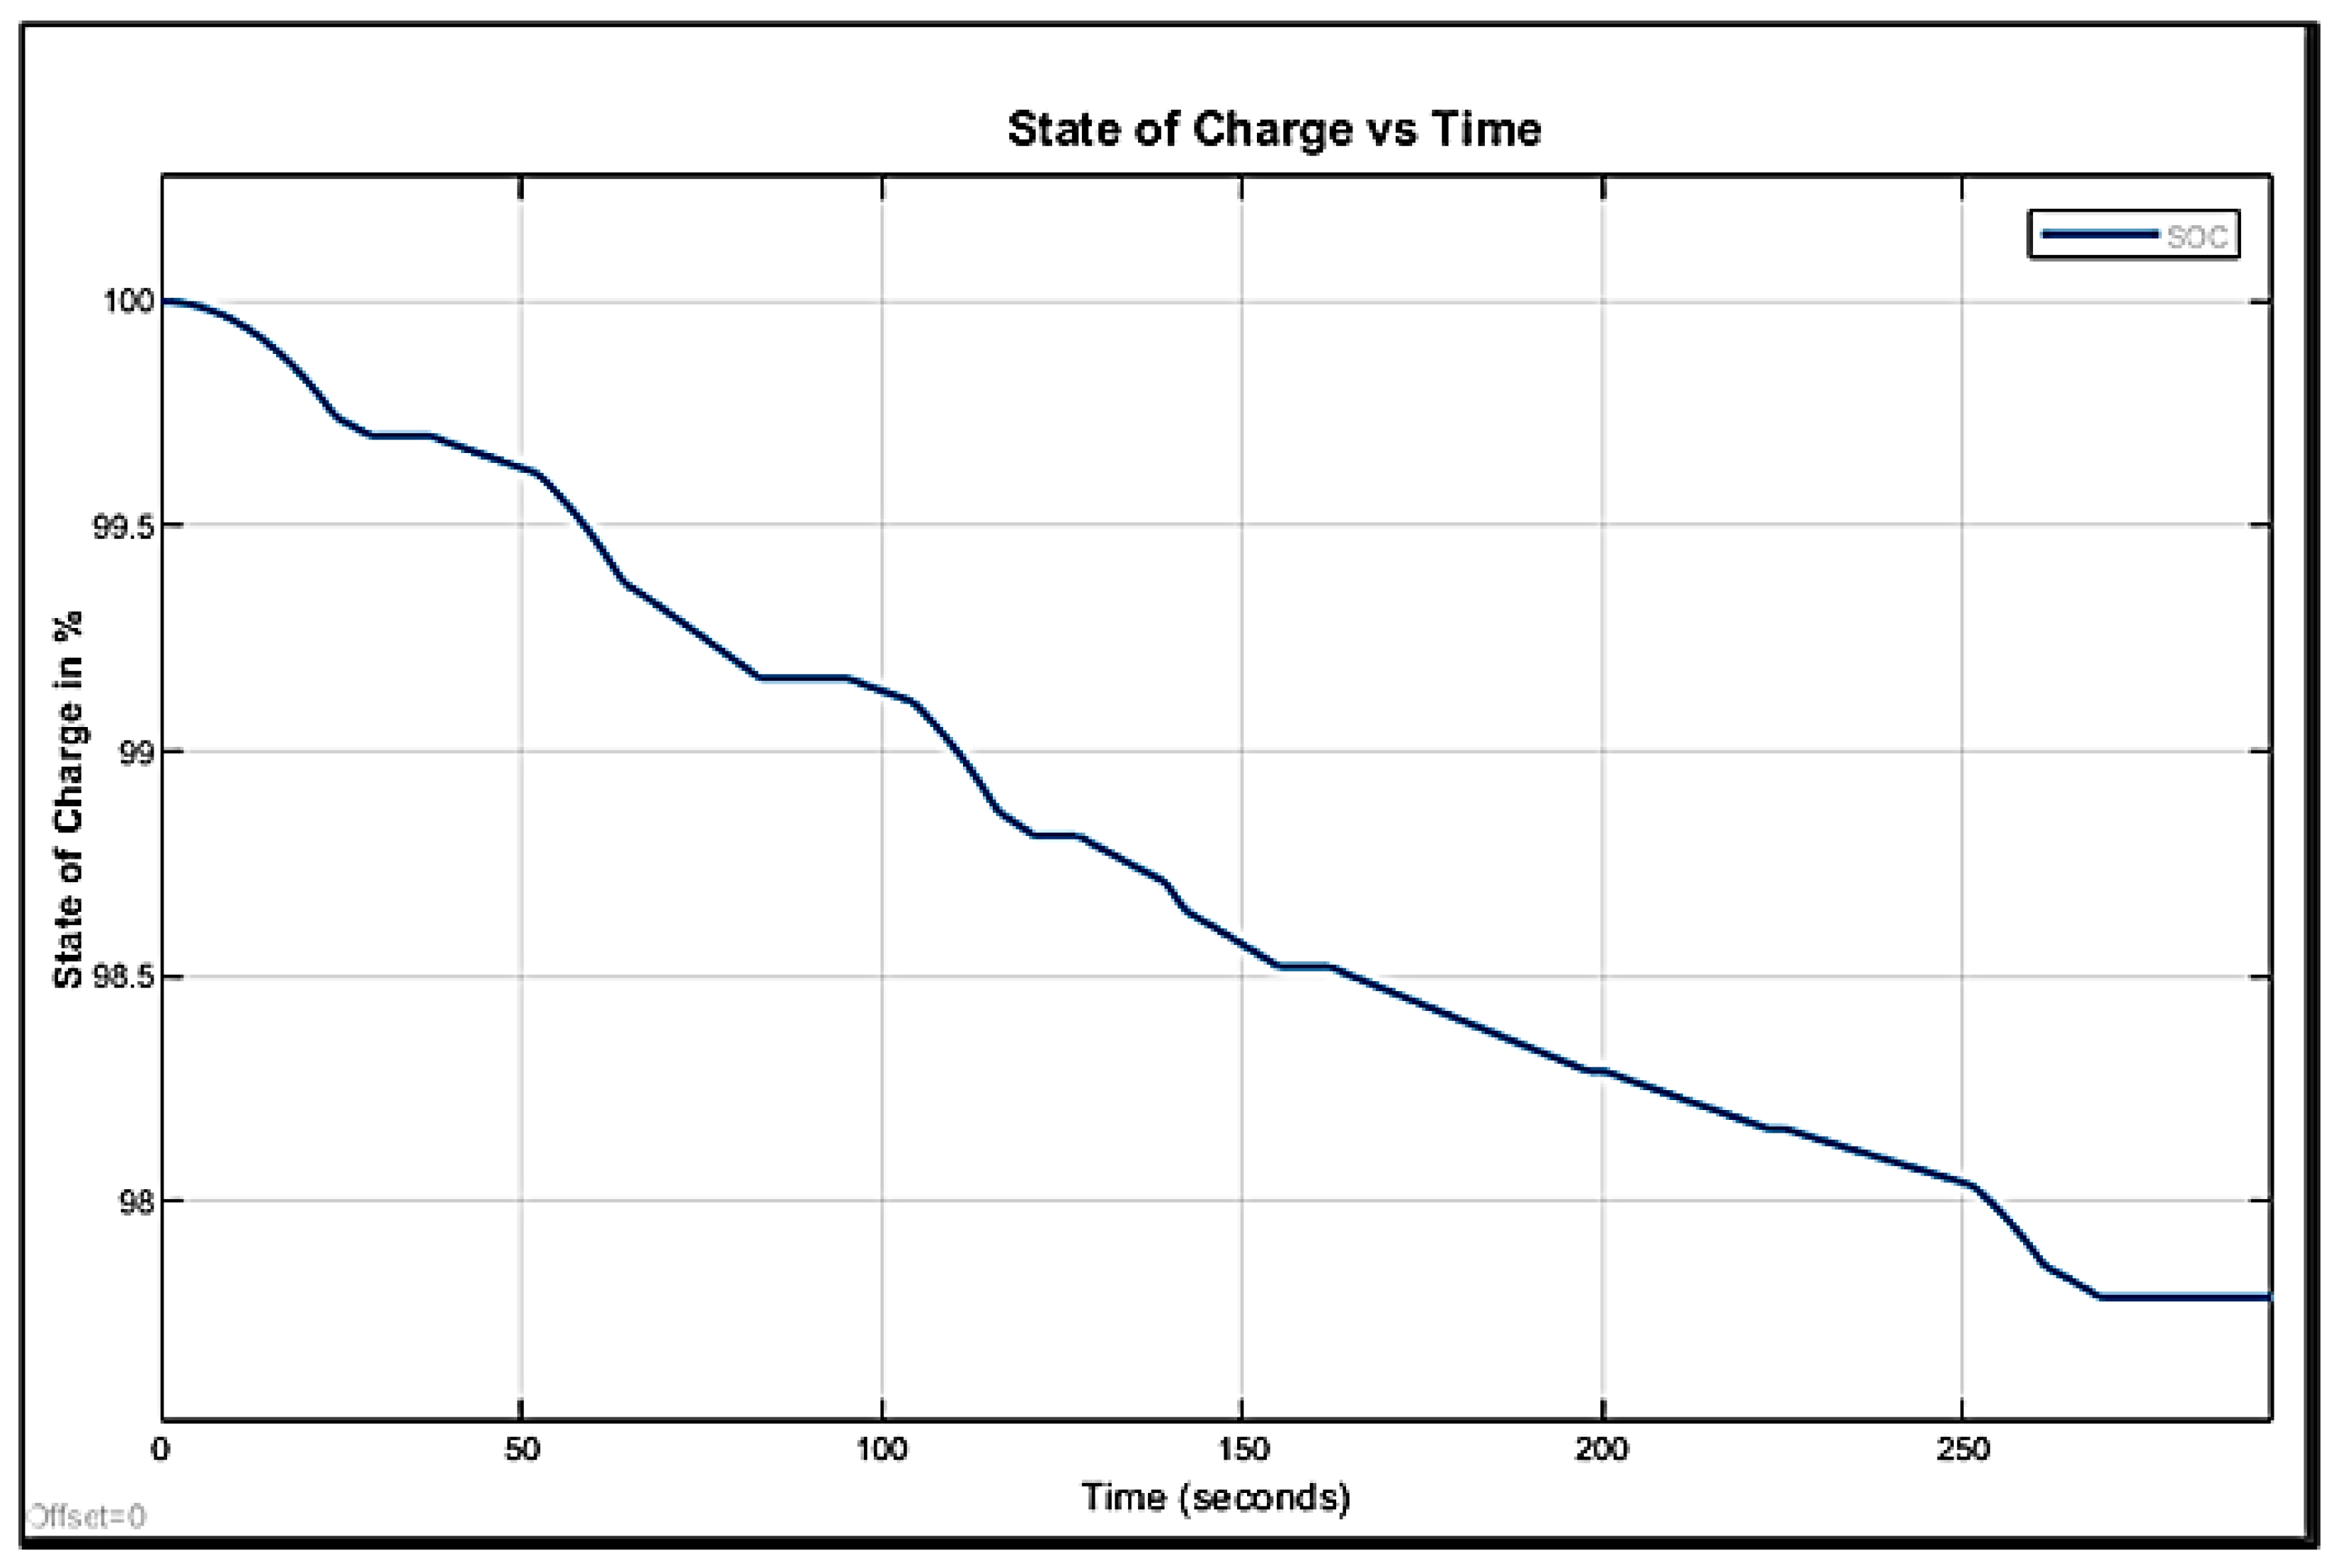
Figure 29.
Vehicle Speed Tracking (km/h vs. time).
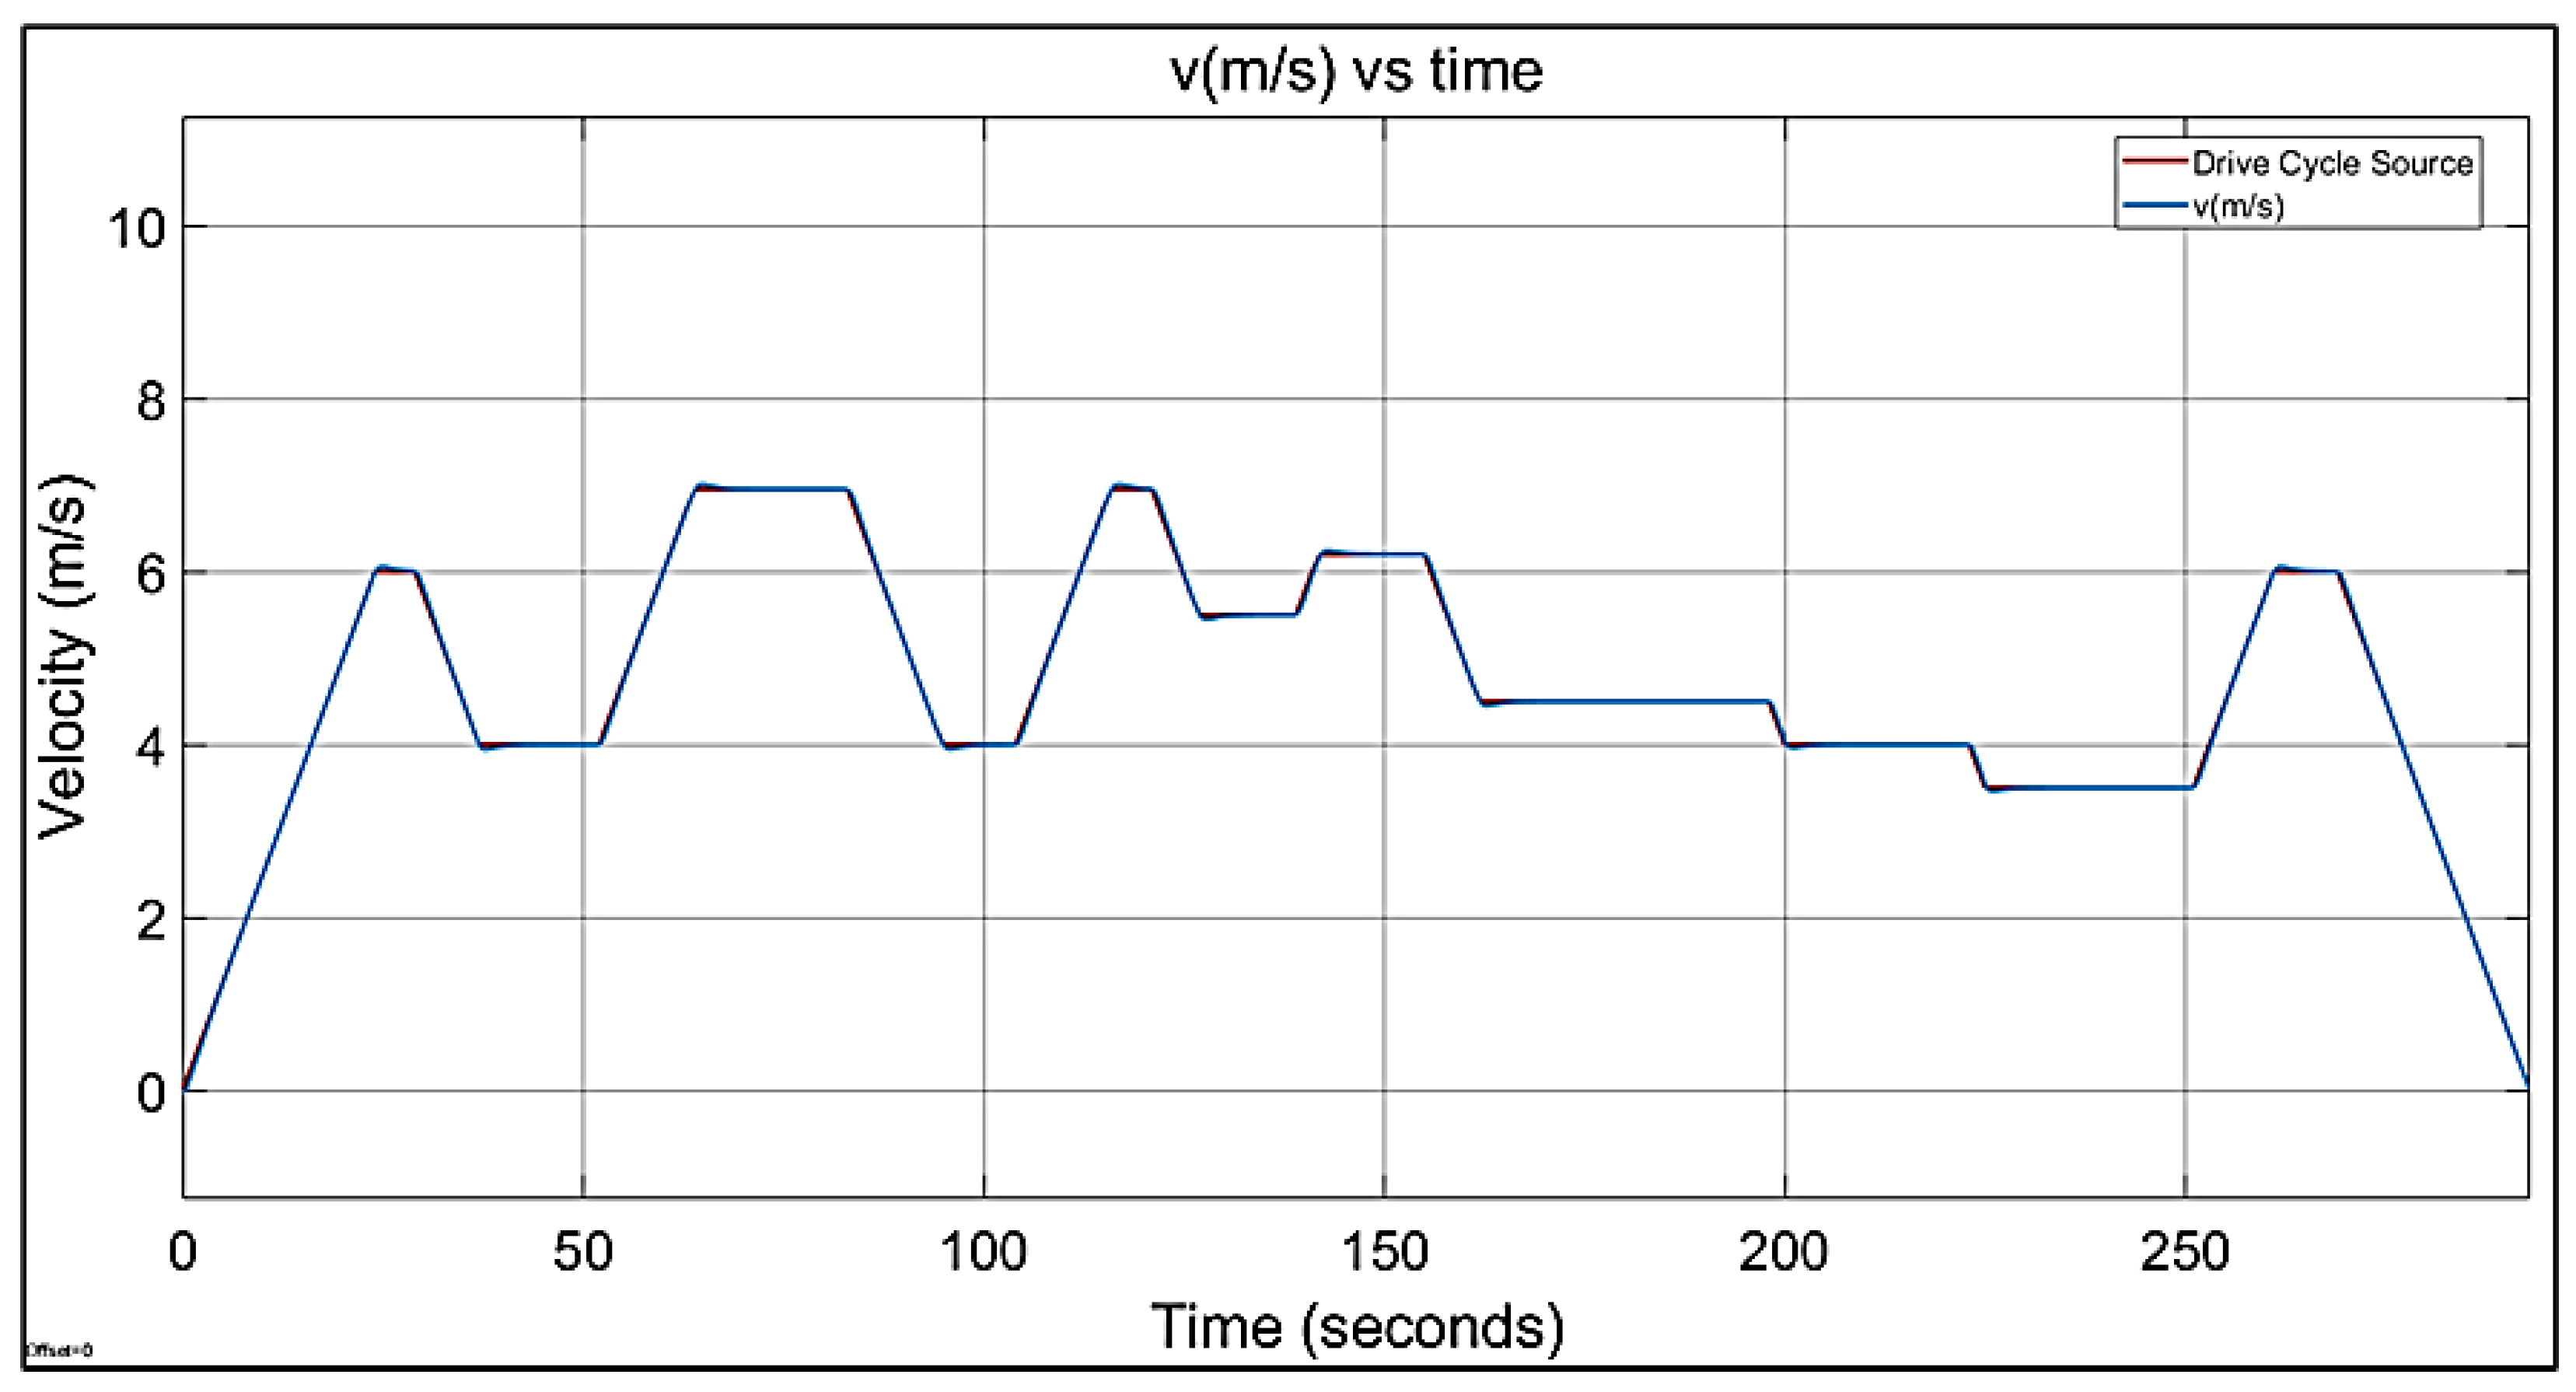

Table 1.
Input Parameters.
| Parameters | Value | Unit |
| Vehicle mass including driver (m) | 295 | kg |
| Wheel diameter (d) | 0.5715 | m |
| Distance (s) | 16 | km |
| Duration (t) | 40 | min |
| Acceleration time (ta) | 20 | s |
| Rolling coefficient (Cr) | 0.015 | |
| Drag coefficient (Cd) | 0.3 | |
| Frontal area (A) | 1.69 | m2 |
| Gravity (g) | 9.81 | m/s2 |
| Air density (ρ) | 1.225 | kg/m3 |
Table 2.
Output of calculations.
| Parameters | Value | Unit | |
| Average speed (υ) | 6.95 | m/s | |
| Acceleration (a) | 0.35 | m/s2 | |
| Total traction force (Ft) | 160.78 | N | |
| Torque (T) | 22.97 | Nm | |
| Power (P) | 1116.52 | W | |
| Energy (E) | 744.35 | Wh | |
| Energy consumption | 46.52 | Wh/km | |
| Battery rating | 827.05 | Wh |
Table 3.
Selected motor specifications.
| Speed (rpm) | Torque (Nm) | |
| Maximum efficiency point | 2991 | 2.91 |
| Maximum torque point | 2944 | 5.15 |
Table 4.
Gear ratios and their corresponding calculated outputs.
| Gear ratio | 12 | 8 |
| Most efficient vehicle speed (km/h) | 26.9 | 40.29 |
| Most efficient wheel torque (Nm) | 34.9 | 23.3 |
| Maximum vehicle speed (km/h) | 33.6 | 50.4 |
| Maximum wheel torque (Nm) | 61.8 | 41.2 |
Table 5.
Pugh matrix for transmission type.
| Criteria | Weighting | Gear drive | Chain drive | Belt drive |
| Efficiency | 10 | 3 | 2 | 1 |
| Weight | 9 | 1 | 2 | 3 |
| Reliability | 7 | 3 | 2 | 1 |
| Compact | 6 | 3 | 2 | 1 |
| Maintenance/Replacement | 6 | 1 | 3 | 2 |
| Cost | 5 | 1 | 2 | 3 |
| Total | 89 | 92 | 77 |
Table 6.
Comparison of motors.
| Motors from Brushless | ||
| Motor | 1500W 48 V | 750W 48 V |
| Cost | £334.29 | £272.75 |
| Weight | 5.5 kg | 4.5 kg |
Table 7.
Pugh matrix for transmission design.
| Criteria | Weighting | Single motor with transmission | Dual motor without differential |
Dual in-wheel-motor |
| Efficiency | 10 | 1 | 2 | 3 |
| Lightweight | 9 | 2 | 1 | 3 |
| Reliability | 7 | 3 | 2 | 1 |
| Compact | 7 | 2 | 1 | 3 |
| Cost | 6 | 3 | 2 | 1 |
| Control complexity | 6 | 3 | 2 | 1 |
| Vehicle performance | 3 | 1 | 3 | 2 |
| Riding comfort | 3 | 3 | 2 | 1 |
| Total | 111 | 89 | 106 |
Table 8.
Battery Details.
| Parameter | Value |
| Nominal pack voltage (V) | 43.2 |
| Total Energy (W h) | 967.68 |
Table 9.
Sprocket details to provide the required gear ratios.
| Sprocket |
Number of teeth (gear ratio = 12) |
Number of teeth (gear ratio = 8) |
| Motor (small) | 10 | 10 |
| Axle (large) | 120 | 80 |
Table 10.
Bill of materials.
| Quantity | Component | Source of materials | Material type | Cost |
| 1 | 1.5 kW Brushless motor | Buy OTS | - | 450 |
| 1 | Upright motor mount | Manufacture in house | - | 0 |
| 1 | Mount Base | Manufacture in house | - | 0 |
| 2 | Rib | Manufacture in house | - | 0 |
| 2 | Side Piece | Manufacture in house | - | 0 |
| 2 | 12T Sprocket | Buy OTS | - | 46.74 |
| 1 | 36T Sprocket | Outsource then modify | - | 50 |
| 1 | Gear Connector | Manufacture in house | - | 0 |
| 4 | 5 mm Key | Buy OTS | - | 20 |
| 2 | Bearing | Buy OTS | - | 6.72 |
| 1 | 8 mm Silver Steel Rod | Manufacture in house | - | 0 |
| 2 | 428 Chain | Buy OTS | - | 68 |
| 2 | Axle Bearings and housings | Buy OTS | - | 73.38 |
| 1 | Peerless 110 Differential and axle | Buy OTS then Modify | - | 195 |
| 1 | 48T Sprocket | Outsource then modify | - | 50 |
| 2 | Half Shaft Mounts | Manufacture in house | - | 0 |
| 96 | Battery Cells | Buy OTS | - | 312.96 |
| 1 | Battery connectors/ Bus bars | Buy OTS | - | 332 |
| 1 | Wiring | Buy OTS | - | 30 |
| 1 | BMS | Buy OTS | - | 40 |
| 1 | Battery Box cover | Manufacture in house | - | 0 |
| 1 | Battery Plate | Manufacture in house | - | 0 |
| 2 | Box Clips | Buy OTS | - | 10 |
| 1 | DC/DC converter | Buy OTS | - | 57 |
| 1 | Charging components | Buy OTS | 28.49 | |
| 2 | Motor controller | Buy OTS | 200 | |
| 1 | Motor control unit | Buy OTS | 100 |
Table 11.
Required sprocket sizes to achieve desired gear ratio.
| Sprocket |
Number of teeth (gear ratio = 12) |
Number of teeth (gear ratio = 8) |
| A | 12 | 12 |
| B | 32 | 48 |
| C | 12 | 12 |
| D | 36 | 36 |
Table 12.
Input Parameters for the Simulink.
| Parameter | Value |
| Total Distance (km) | 45.78km |
| Total Simulation Time | 9788s |
| Avg Speed (km/h) | 25km/h |
| Max Torque (T_EDU) | 5.9Nm |
| Peak Current (i_dc) | 20.066A |
| Initial SoC % | 100% |
| Final SoC % after 1 LAP | 97.77% |
| Final Voltage (V_dc) after 1 LAP | 47.72V |
| Energy Consumed after 1 LAP | 20.95Wh |
Disclaimer/Publisher’s Note: The statements, opinions and data contained in all publications are solely those of the individual author(s) and contributor(s) and not of MDPI and/or the editor(s). MDPI and/or the editor(s) disclaim responsibility for any injury to people or property resulting from any ideas, methods, instructions or products referred to in the content. |
© 2025 by the authors. Licensee MDPI, Basel, Switzerland. This article is an open access article distributed under the terms and conditions of the Creative Commons Attribution (CC BY) license (http://creativecommons.org/licenses/by/4.0/).
Copyright: This open access article is published under a Creative Commons CC BY 4.0 license, which permit the free download, distribution, and reuse, provided that the author and preprint are cited in any reuse.


