Submitted:
05 August 2025
Posted:
06 August 2025
You are already at the latest version
Abstract
Skin pigmentation in teleosts is a complex process governed by molecular and cellular mechanisms during development. In this study, we investigated the pigmentation process in the tomato clownfish (Amphiprion frenatus) using an integrated approach combining histological analysis, transcriptomics (RNA-Seq), and translatomics (Ribo-Seq). Histological examination revealed the stepwise differentiation of melanophores, xanthophores, and iridophores during post-embryonic development. Transcriptomic profiling between 0 and 14 days post-hatching (dph) identified 4,245 differentially expressed genes associated with metabolism, pigment biosynthesis, and extracellular matrix remodeling. The integration of transcriptomic and translatomic data revealed extensive post-transcriptional regulation, with many genes displaying discordant changes in mRNA and protein levels. Quantitative PCR analysis at 25 and 40 dph confirmed the dynamic upregulation of genes involved in cell proliferation (myc, pcna), pigment transport (myo5a, rab38), and pigment cell signaling (mchr1, ggt1). These findings demonstrate that pigmentation in A. frenatus is controlled through a multilayered regulatory network that involves both transcriptional and translational mechanisms. This study offers new insights into the molecular basis of chromatophore development and pigment pattern formation in coral reef fish species.
Keywords:
Amphiprion frenatus
; pigmentation
; skin development
; transcriptomics
; translatomics
; chromatophores
1. Introduction
Teleosts exhibit a remarkable diversity of body color patterns that serve various functions, including camouflage, communication, and mate attraction [1]. The formation of these color patterns involves a complex interplay of genetic, developmental, and environmental factors. Histologically, the skin of teleosts comprises three main layers: the epidermis, the dermis, and the subcutaneous layer. The epidermis is the outermost layer and primarily comprises stratified squamous epithelial cells, which provide a protective barrier against the external environment. The skin of teleost fish is closely linked to pigment cells known as chromatophores. They can change shape and size, allowing them to adjust the intensity and distribution of pigments in response to various stimuli such as light, stress, and social interactions.
Chromatophores are derived from neural crest cells and consist of six subtypes [2]. The main types include (1). Melanophore: These contain melanin, which is responsible for black and brown colors. Melanophores can expand or contract, allowing the fish to darken or lighten its skin. (2) Xanthophores: These chromatophores contain carotenoids and produce yellow colors. They often interact with other chromatophores to create a variety of shades. (3) Erythrophores: Like xanthophores, erythrophores contain carotenoids but primarily produce red hues. They can influence overall coloration by layering with other chromatophores. (4) Cyanophores: These contain blue pigments, although they are less common. They contribute to the blue coloration found in some species. (5) Iridophores: These chromatophores contain guanine crystals that reflect light, creating iridescent effects. The colors they produce can vary depending on the angle of light, enhancing the overall vibrancy of a fish’s coloration. (6) Leucophores: These reflect light and provide a white or light coloration, often enhancing the brightness of other pigments. The diversity of coloration in fish is controlled by many genes related to pigment synthesis, transport, and cell morphology [3].
Numerous studies have identified how genetic factors influence coloration in specific species. Zebrafish research has provided valuable insights into pigment cell development, and more recent multi-omics studies have begun to characterize pigment pathways at both the transcriptomic and translational levels. In cichlid fishes, genetic studies demonstrate how opsin genes contribute to variations in light perception and body coloration, which facilitates environmental adaptation. Teleost body coloration is the result of complex genetic interactions between pigment-producing cells (chromatophores) and regulatory genes. These genetic factors are finely tuned through evolutionary processes to help teleosts adapt to their environments, attract mates, or deter predators. Genes such as MC1R [4], TYR [5], ASIP [6], etc. play fundamental roles in determining specific colors and patterns in different teleost species, and their variability within populations leads to striking diversity in fish coloration.
In clownfish, coloration plays a critical role in their ecology and behavior [7]. The molecular basis of color variation in Amphiprion species is still under investigation [8,9]. Recently, de novo transcriptome sequencing has been used to identify genes involved in pigment synthesis in clownfish [10]. Several recent studies have used transcriptomic and genomic approaches to investigate the molecular basis of coloration in anemonefishes. For example, a chromosome-level genome assembly of Amphiprion clarkii revealed duplications in pigmentation-related genes [8]. At the same time, transcriptome analyses in Amphiprion ocellaris linked RNA methylation changes to variations in skin color [11]. Additionally, transcriptomic datasets in Amphiprion percula have served as valuable resources for exploring the expression of genes related to coloration [10].
In this study, we aimed to investigate the molecular and cellular basis of fish body color by combining fish body color ontology, histology, gene expression analysis, and transcriptomic and translatomic approaches. Using histological techniques, we examined the underlying cellular structures responsible for coloration. To further understand the genetic regulation of these color traits, we analyzed gene expression profiles and identified key genes involved in pigmentation. Finally, we examined the transcriptome and translatome to determine the molecular networks and regulatory pathways that govern color patterns at the genetic and protein levels. Analyzing both transcriptomes and translatomes is crucial for comprehending the comprehensive scope of gene regulation, particularly in systems as dynamic and responsive as teleost skin. Comparing RNA expressions with protein synthesis can reveal the precise molecular mechanisms that control complex traits, such as body coloration, and show how gene regulation is fine-tuned through transcriptional and translational processes. This integrated approach will provide valuable insights into the genetic, cellular, and molecular mechanisms driving fish coloration and its evolutionary significance.
2. Materials and Methods
2.1. Experimental Fish
Mature tomato clownfish (A. frenatus) were paired in each 50 L aquarium with several radiation sea anemones. The temperature and salinity of tank water were 27±1 ℃ and 34±1 psu, respectively. The fish were acclimated to a photoperiod with 9:15 h light: dark. The fish were fed fresh shrimp, squid, and a commercial feed (GROBEST GROUP LIMITED) ad libitum. After spawning, the newly hatched larvae were fed rotifers and, latterly, copepods. The EFRC Institutional Animal Care and Use Committee approved all experiments and procedures performed by the guiding ethical principles.
2.2. Skin Histology for Light Microscopy
A. frenatus were euthanized with MS222 in seawater and dissected to collect skin samples from the dorsal region [12]. The sampled tissues were fixed in Bouin’s solution and embedded in paraffin. The samples were sectioned at 5 µm, stained with hematoxylin and eosin (H&E) for general morphology, and observed under a light microscope.
2.3. Scanning Electron Microscopy
Larva A. frenatus, each about 10 mm in total length, were euthanized with MS222 in seawater and cut into three parts, head, middle trunk, and caudal parts, which were about 3 mm in length each, and were preserved in a fixative solution (0.2 M phosphate buffer solution (PBS) at pH 7.2, 1% glutaraldehyde and 2.5% paraformaldehyde) at 4℃. Targeted portions were preserved in a fixative solution for an additional 24 hr. After washing with 0.1 M PBS, they were post-fixed with a chilled 1% osmium tetroxide (OsO4) solution for 2 hours, followed by a final wash in 0.1 mol/L PBS. The fixed portions were dehydrated in an ethanol series and then placed into a critical-point dryer (k850, Quorum, United Kingdom) for a final 15 min of critical-point drying. The dried samples were mounted onto aluminum stubs and coated with a gold layer using an ion sputter (SC7620, Quorum, United Kingdom). Finally, samples were observed with a Hitachi SU1510 scanning electron microscope (Tokyo, Japan).
2.4. RNA Extraction and cDNA Synthesis
Total RNA was extracted using TRIzol reagent (Invitrogen) according to the manufacturer’s instructions [10]. First-strand cDNA was synthesized using Superscript III First-Strand Synthesis Supermix (Invitrogen) with oligo (dT)20 primers. This cDNA (1 μg/40 μL Milli-Q water) was used for RT-PCR and quantitative RT-PCR (qRT-PCR) analyses.
2.5. Sequencing and Analyzing Pipeline
The Illumina HiSeq platform is widely used for RNA sequencing (RNA-Seq) because of its high throughput and accuracy. RNA is extracted using commercial kits, ensuring it is free of DNA, proteins, and other contaminants. Integrity is assessed using the Bioanalyzer RNA integrity number (RIN) or an equivalent score, which measures the quality. A RIN ≥ 7 is preferred for most RNA-Seq experiments. RNA is converted into a library of cDNA fragments for sequencing. The steps include: RNA selection/enrichment, fragmentation, reverse transcription, adapter ligation, and PCR amplification. Electrophoresis-based methods are used to verify the quality and fragment size distribution of the final cDNA library. Library concentration is quantified using fluorometric methods. The library is loaded onto an Illumina flow cell. Each DNA fragment hybridizes to complementary oligonucleotides immobilized on the flow cell. Each DNA strand is sequenced base by base using fluorescently labeled nucleotides. The sequencer captures fluorescent signals as nucleotides are incorporated. This process is repeated for each cycle to build the sequence read. The sequencing run generates millions of short reads (typically 50-150 bp each). The output is in FASTQ format, containing sequence data and corresponding quality scores. Reads are aligned to a reference genome or transcriptome using STAR. The number of reads mapping to genes or transcripts is quantified using the software feature Counts. Statistical analysis is performed to identify differentially expressed genes or transcripts using the edgeR package.
2.6. Ribosome Profiling Library Preparation Protocol
This protocol [16] has been adapted with moderate modifications. Briefly, skin tissues were lysed with polysome buffer [20 mM Tris-Cl [pH7.4], 150 mM NaCl, 5 mM MgCl2, 1 mM DTT, 200µg/ml cyclohexamide, 1 % (vol/vol) Triton X-100 and 25U/ml Turbo DNase I (Ambion, Cat# AM2238)] and lysate were digested with RNAse I (Ambion, Cat# AM2294). For RNAseq library construction, total RNA was extracted and oligo-dT magnetic beads were used to select RNA containing poly-A tails. Selected RNA was fragmented, and 50-60 nucleotide-long fragments were selected following end-repairing, linker ligation, reverse transcription, and circular PCR. Ribosome-protected fragments (RPF) purified with PAGE/fragmented total RNA were dephosphorylated with T4-PNK (NEB, Cat# M0201S). Linkers were ligated to RPF/fragmented total RNA by T4 Rnl2tr K227Q ligase (NEB, Cat# M0351L), and the cDNA synthesis was performed with SuperScriptIII (Invitrogen, Cat# 18080- 093). The cDNA samples were circularized by CircLigase (Epicentre, Cat# CL4111). The DNA libraries were amplified with Phusion High-Fidelity DNA Polymerase (NEB, Cat# M0530S) and purified using the AMPure XP system (Beckman Coulter, Cat# A63880). The quantified libraries were sequenced with the Illumina sequencing platform following the manufacturer’s instructions.
2.7. Bioinformatics Analysis
All analytic pipelines were developed under Linux CentOS 6.6 environment. Due to A frenatus being a non-model species, it is challenging to study gene expression and differential expression without a reference genome or complete gene annotation. In this study we de novo assembled the A frenatus transcriptome using Trinity based on previous RNA-seq data [12]. The transcriptome is the reference for mapping reads and quantifying gene expression. We then annotated all transcripts using Trinotate. The linker sequences were trimmed from each sequence read by using Cutadapt and selected fragments between 27-40 nucleotides (nts) for Ribo-seq (25~65 nts for RNA-seq) with in-house developed scripts. We mapped the remains to A. frenatus transcriptome reference from Trinity assembly by RSEM [16]. We calculated the expression value and count for each gene at both the gene and isoform levels. For differential expression analysis, we used edgeR [17], and read counts as input to identify differentially expressed genes between groups with replicates. The log2 fold change of RNA-seq and Ribo-seq results was plotted to illustrate the transcription and translation status of each gene.
2.8. qRT-PCR
cDNA derived from 10 ng RNA was used for Quantitative PCR performed by the following conditions: 10 min at 95°C, and 40 cycles of 15 sec at 95°C, 1 min at 60°C using 2X Power SYBR Green PCR Master Mix (Applied Biosystems) and 200 nM of forward and reverse primers in 20 μL. Each assay was run in triplicate on an Applied Biosystems 7900HT Real-Time PCR system, and expression fold-changes were derived using the comparative CT method, with ef1a as the endogenous control and sample “AF-25D” as the calibrator. Table 1 lists the forward and reverse oligonucleotide primer sequences for quantitative real-time PCR (qPCR) gene expression analysis. The primer sets were used to amplify transcripts from various genes involved in cellular development, differentiation, signaling, and pigmentation in fish skin tissues. Primers were designed using Primer Express software and synthesized by Mission Biotech. Gene symbols correspond to those analyzed in Figure 5a and Figure 5b. Expression levels were normalized to ef1α (not listed in this table as the internal reference gene, and relative expression was calculated using the 2^−ΔΔCt method [18].
3. Results
3.1. Morphological Development and Pigmentation Progression in A. frenatus
The morphological development and pigmentation progression of A frenatus from the larval to juvenile stages were documented through imaging (Figure 1). Newly hatched larvae (0 day post-hatch; dph) exhibited a wholly transparent body with minimal structural differentiation and no apparent pigmentation (Figure 1A). By 1 dph, yolk absorption had begun. Still, transparency persisted (Figure 1B). At 5 dph, the earliest signs of melanophore accumulation appeared, primarily along the dorsal and caudal regions (Figure 1C), which intensified by 10 dph, giving the body a faint grayish tone (Figure 1D). By 12 dph, the body had darkened further. The fin structures became more distinct (Figure 1E). At 15 dph, a brownish hue emerged along the trunk, and eye pigmentation increased (Figure 1F). The appearance of an orange coloration was first evident at 20 dph, beginning in the posterior body (Figure 1G), and became more pronounced throughout the fins and body by 25 dph (Figure 1H). At 40 dph, the first white vertical head bar—a hallmark of the species—was observed (Figure 1I). As development continued, the orange pigmentation became dominant, and the white bar was well defined by 90 dph (Figure 1J). By 140 dph, individuals exhibited a vibrant reddish-orange body with stabilized bar patterns (Figure 1K). By 240 dph, juveniles displayed the fully mature coloration typical of the species, characterized by deep orange pigmentation and a distinct white head bar (Figure 1L). These observations indicate a sequential and coordinated pattern of pigment cell differentiation and regional pigmentation during early development.
3.2. Histological Development of the Skin in A. frenatus
Histological examination of A frenatus skin at various developmental stages revealed progressive structural and pigmentary maturation from 15 to 240 days post-hatch (dph) (Figure 2). At 15 dph, the epidermis consisted of a thin, undifferentiated epithelial sheet, with scattered melanophores present primarily in the epidermal layer, and the dermis remaining rudimentary (Figure 2A). By 25 dph, epidermal stratification became apparent, with keratinocytes beginning to form organized layers. Melanophores increased in number and migrated toward the dermo-epidermal junction. At the same time, xanthophores and early iridophores appeared in the superficial dermis (Figure 2B). At 40 dph, the epidermis displayed a more defined basal layer adjacent to the dermis, and chromatophore density increased, with all three pigment cell types—melanophores, xanthophores, and iridophores—discernible (Figure 2C). By 90 dph, the epidermis had become well-stratified. Pigment cells were abundant and spatially distributed across the epidermis and upper dermis. Iridophores and xanthophores were more prominent, indicating increased chromatophore diversification (Figure 2D). At 140 dph, the epidermis showed full stratification and a thickened basal layer, and dermal pigment cells, particularly melanophores, appeared elongated and interspersed with reflective iridophores and yellow-hued xanthophores, suggesting the onset of organized pigmentation patterns (Figure 2E). At 240 dph, skin architecture was fully mature. The epidermis was composed of multiple keratinocyte layers anchored by basal cells at the dermal interface, while the dermis exhibited thick collagen bundles and densely packed pigment cells. Chromatophores were well differentiated and stably localized, reflecting the establishment of mature skin pigmentation (Figure 2F). These findings illustrate the coordinated development of skin architecture and chromatophore populations during juvenile growth in A. frenatus.
3.3. Scanning Electron Microscopy (SEM) of Skin Structure
Scanning electron microscopy (SEM) provided detailed visualization of the surface architecture and histological organization of the skin in juvenile A frenatus. The skin surface was characterized by overlapping scales bearing posteriorly oriented ctenii, partially covered by the epithelial layer (EPL). In some regions, the EPL was removed during sample preparation, revealing underlying annuli (ans) (Figure 3A). Damaged areas of the epidermis (EPD) exposed epithelial cells (epc) and dense arrays of microridges (MRs), with annular structures clearly visible (Figure 3B). A lateral view of the trunk skin showed the multi-layered arrangement of the integument, with EPD and EPL overlaying the basement membrane (BM) and underlying dermis (DM), which contained fibroblasts (fb) (Figure 3C). The apical surface of intact EPD exhibited pronounced MRs, and the apical openings of goblet cells (ogbc) were discernible between the ridges (Figure 3D), suggesting active mucus secretion. Stratified epc and capillaries (cp) derived from dermal vasculature were also observed in association with MRs in the upper EPD (Figure 3E). At the basal end, epithelial cells were closely adhered to the BM, indicating structural cohesion within the epidermal layers (Figure 3F). These morphological features reflect the specialized skin organization in A. frenatus, supporting its protective barrier function and potential roles in mucosal immunity.
3.4. Transcriptomic Shifts Between 0 and 14 dph
RNA-Seq analysis of fish larvae is a practical approach to identify and predict genes regulated in developmental processes of 0 dph compared with 14 dph in larvae of A frenatus. We sequenced 4 cDNA libraries, each pooled from 48 samples of larvae hatched at 0 dph and 14 dph using the Illumina HiSeq platform. The sequencing runs yielded 352.90 M reads with an average length of 80 bp. The Strand NGS software (version 2.1) was used with default parameters for pre-alignment and post-alignment quality control analysis. Notably, 100% of the raw reads remained in the dataset when using the Danio rerio (zebrafish) genome for contig alignments. Of these, 68.4 M reads (19.4%) aligned into contigs, whereas 284.5 M reads (80.6%) remained unaligned singletons because of the genetic distance between the two species. The unaligned reads were excluded from further analytical steps. The high-throughput sequencing performed for different libraries yielded similar numbers of reads, ranging from 75.21 to 95.96 million, and had the same average length. The number of reads for each condition of the larvae sample and the number of reads mapped to reference sequences are shown in Table 2.
Differentially expressed genes (DEGs) between 0 and 14 dph were calculated from the raw reads using the DESeq method and moderated t-test analysis. The significance level applied to the RNA-Seq data was corrected for multiple tests using Benjamin-Hochberg correction, allowing rigorous identification of DEGs in the larvae of 0 and 14 dah. We identified 4245 DEGs out of a total of 31967 genes, which were hierarchically clustered into two major and well-separated groups (Figure 4A). We analyzed overall gene functions and uncovered specific biological processes and terms among 4245 DEGs by using the GO enrichment analysis and found that a majority of DEGs were significantly associated with GO metabolic process (1761 genes, p = 3.47E-33) and developmental process (378 genes, p = 1.40E-16) within the biological process category (2938 genes, p = 1.45E-25). The genes significantly associated with metabolic process term were mainly involved in catalytic activity (1368 genes, p = 4.94E-41), biosynthetic process (440 genes, p = 8.26E-20), and hydrolase activity (673 genes, p = 1.08E-10) (Figure 4B). However, the genes associated with the cellular metabolic process and involved in energy derivation (4 genes, p = 0.0976) and the RNA biosynthetic process (128 genes, p = 0.0833) were not significantly enriched. Interestingly, all 27 DEGs involved in glycolysis were enriched considerably and downregulated at 25 days after hatching. To identify specific altered functions, we investigated significantly associated biological processes in the subsets of DEGs up-regulated (2328 genes) and down-regulated (1917 genes) in the d25 group. Among the up-regulated genes, key enriched processes included oxidoreductase activity (207 genes, p = 2.40E-44), proteolysis (121 genes, p = 6.19E-10), and intermediate filament formation (22 genes, p = 2.53E-10), highlighting an increased emphasis on metabolic and structural regulation. Additionally, the myosin complex (27 genes, p = 2.48E-09) and pigment metabolic processes (10 genes, p = 2.01E-04) were notably upregulated (Figure 4C, left panel).
Conversely, the down-regulated subset was significantly enriched in developmental processes (258 genes, p = 1.65E-26), consistent with suppressing differentiation-related functions. Specific processes included cell differentiation (93 genes, p = 4.30E-11), neurogenesis (51 genes, p = 8.04E-09), and ameboidal cell migration (19 genes, p = 2.27E-04), indicating a broad downregulation of growth and morphogenesis pathways (Figure 4C, right panel). Furthermore, glycolysis (27 genes, p = 1.49E-22) was significantly reduced, suggesting a metabolic shift during this developmental stage. The enrichment of eye development (31 genes, p = 5.73E-03), visual perception (15 genes, p = 6.13E-06) and detection of light stimuli (9 genes, p = 1.26E-05) in the down-regulated subset further suggests a suppression of sensory-related genes. These findings reinforce the distinct regulation of metabolic activation and structural remodeling in up-regulated genes, contrasted with the repression of differentiation and developmental pathways in down-regulated genes, underscoring critical functional shifts at this stage.
3.5. Validation of Pigmentation-Related Gene Expression by Quantitative Real-Time PCR
Quantitative real-time PCR (qPCR) was performed on candidate genes in skin tissues of A. frenatus to validate transcriptomic findings and assess stage-specific gene expression during pigmentation development at 25 and 40 dph. Gene selection was based on their putative roles in cell proliferation, differentiation, pigment synthesis, and ion regulation.
As shown in Figure 5A, expression levels of genes associated with cellular proliferation and differentiation were significantly elevated at 40 dph compared to 25 dph. These included myc, pcna, and p63, proliferation and epithelial renewal markers, and pax6 and gata3, which are linked to developmental and pigment lineage commitment. Cytoskeletal genes such as myo5a, myo7a, and myh7b also showed marked upregulation, suggesting increased intracellular transport and structural remodeling activity. The pigmentation-associated gene ostm1 displayed a substantial increase at 40 dph, aligning with active melanogenesis. In a separate cluster of genes (Figure 5B), significant upregulation was also observed in regulators of melanosome transport (rab38), and pigment patterning (qnr71, sufu, sox2). Notably, mchr1 exhibited the highest fold changes, implicating them in ion homeostasis and pigment cell signaling. The transient expression of timp3, which was nearly undetectable at 25 dph but robustly induced by 40 dph, suggests dynamic regulation of extracellular structure during chromatophore stabilization. These expression patterns were consistent with RNA-Seq results and support the hypothesis that pigmentation onset involves coordinated upregulation of genes governing proliferation, differentiation, vesicle transport, and extracellular matrix reorganization. Collectively, the qPCR results confirm the developmental timing of gene activation underlying the acquisition of skin coloration in juvenile A. frenatus.
3.6. Integrated Transcriptional and Translational Regulation During Pigmentation
To evaluate the coordination between transcriptional and translational regulation during early pigmentation in A. frenatus, we performed an integrated analysis of RNA-Seq and Ribo-Seq data at 25 and 40 dph. Figure 6 presents a scatter plot comparing log2 fold changes in mRNA levels (x-axis) and ribosome-protected fragment (RPF) levels (y-axis), representing protein synthesis. Each gene was classified into one of nine regulatory categories based on the direction and magnitude of its transcriptional and translational changes (cutoff |log2FC| > 1). A substantial proportion of genes fell into Group C, which comprises genes concordantly upregulated at both the mRNA and protein levels. This group includes myc, pcna, p63, myo5a, myo7a, rab38, and mchr1, all of which were also validated by quantitative real-time PCR (qPCR) as upregulated at 40 dph. The co-induction of these genes at both transcriptional and translational levels underscores a robust, unified gene expression program during chromatophore differentiation and pigment pattern formation. These genes span multiple functional categories: myc and pcna are markers of proliferative activity; myo5a, myo7a, and rab38 participate in melanosome transport; mchr1 is involved in pigment cell signaling and ion homeostasis. Their coordinated activation suggests a tightly coupled regulatory system that ensures both transcript abundance and protein synthesis are synchronized during this critical developmental window.
Figure 5.
Quantitative real-time PCR (qPCR) validation of gene expression in skin tissues of A. frenatus at different post-hatch stages. (A) Relative expression of genes associated with development, proliferation, and stemness, including myc, myo5a, myo7a, ostm1, p63, pax6, and pcna, in skin samples collected at 25 dph, and 40 dph. (B) Expression of genes related to pigmentation, ion transport, and structural regulation, including qnr71, rab38, sufu, tm154, trpm7, and mchr1. Gene expression levels were normalized to ef1a as the internal control and are presented as fold change relative to AF-25D using the 2^−ΔΔCt method. Data are shown as mean ± standard error (SE) based on three technical replicates. The observed expression trends are consistent with transcriptome profiling results and support stage-specific regulation of genes involved in skin development and pigmentation.
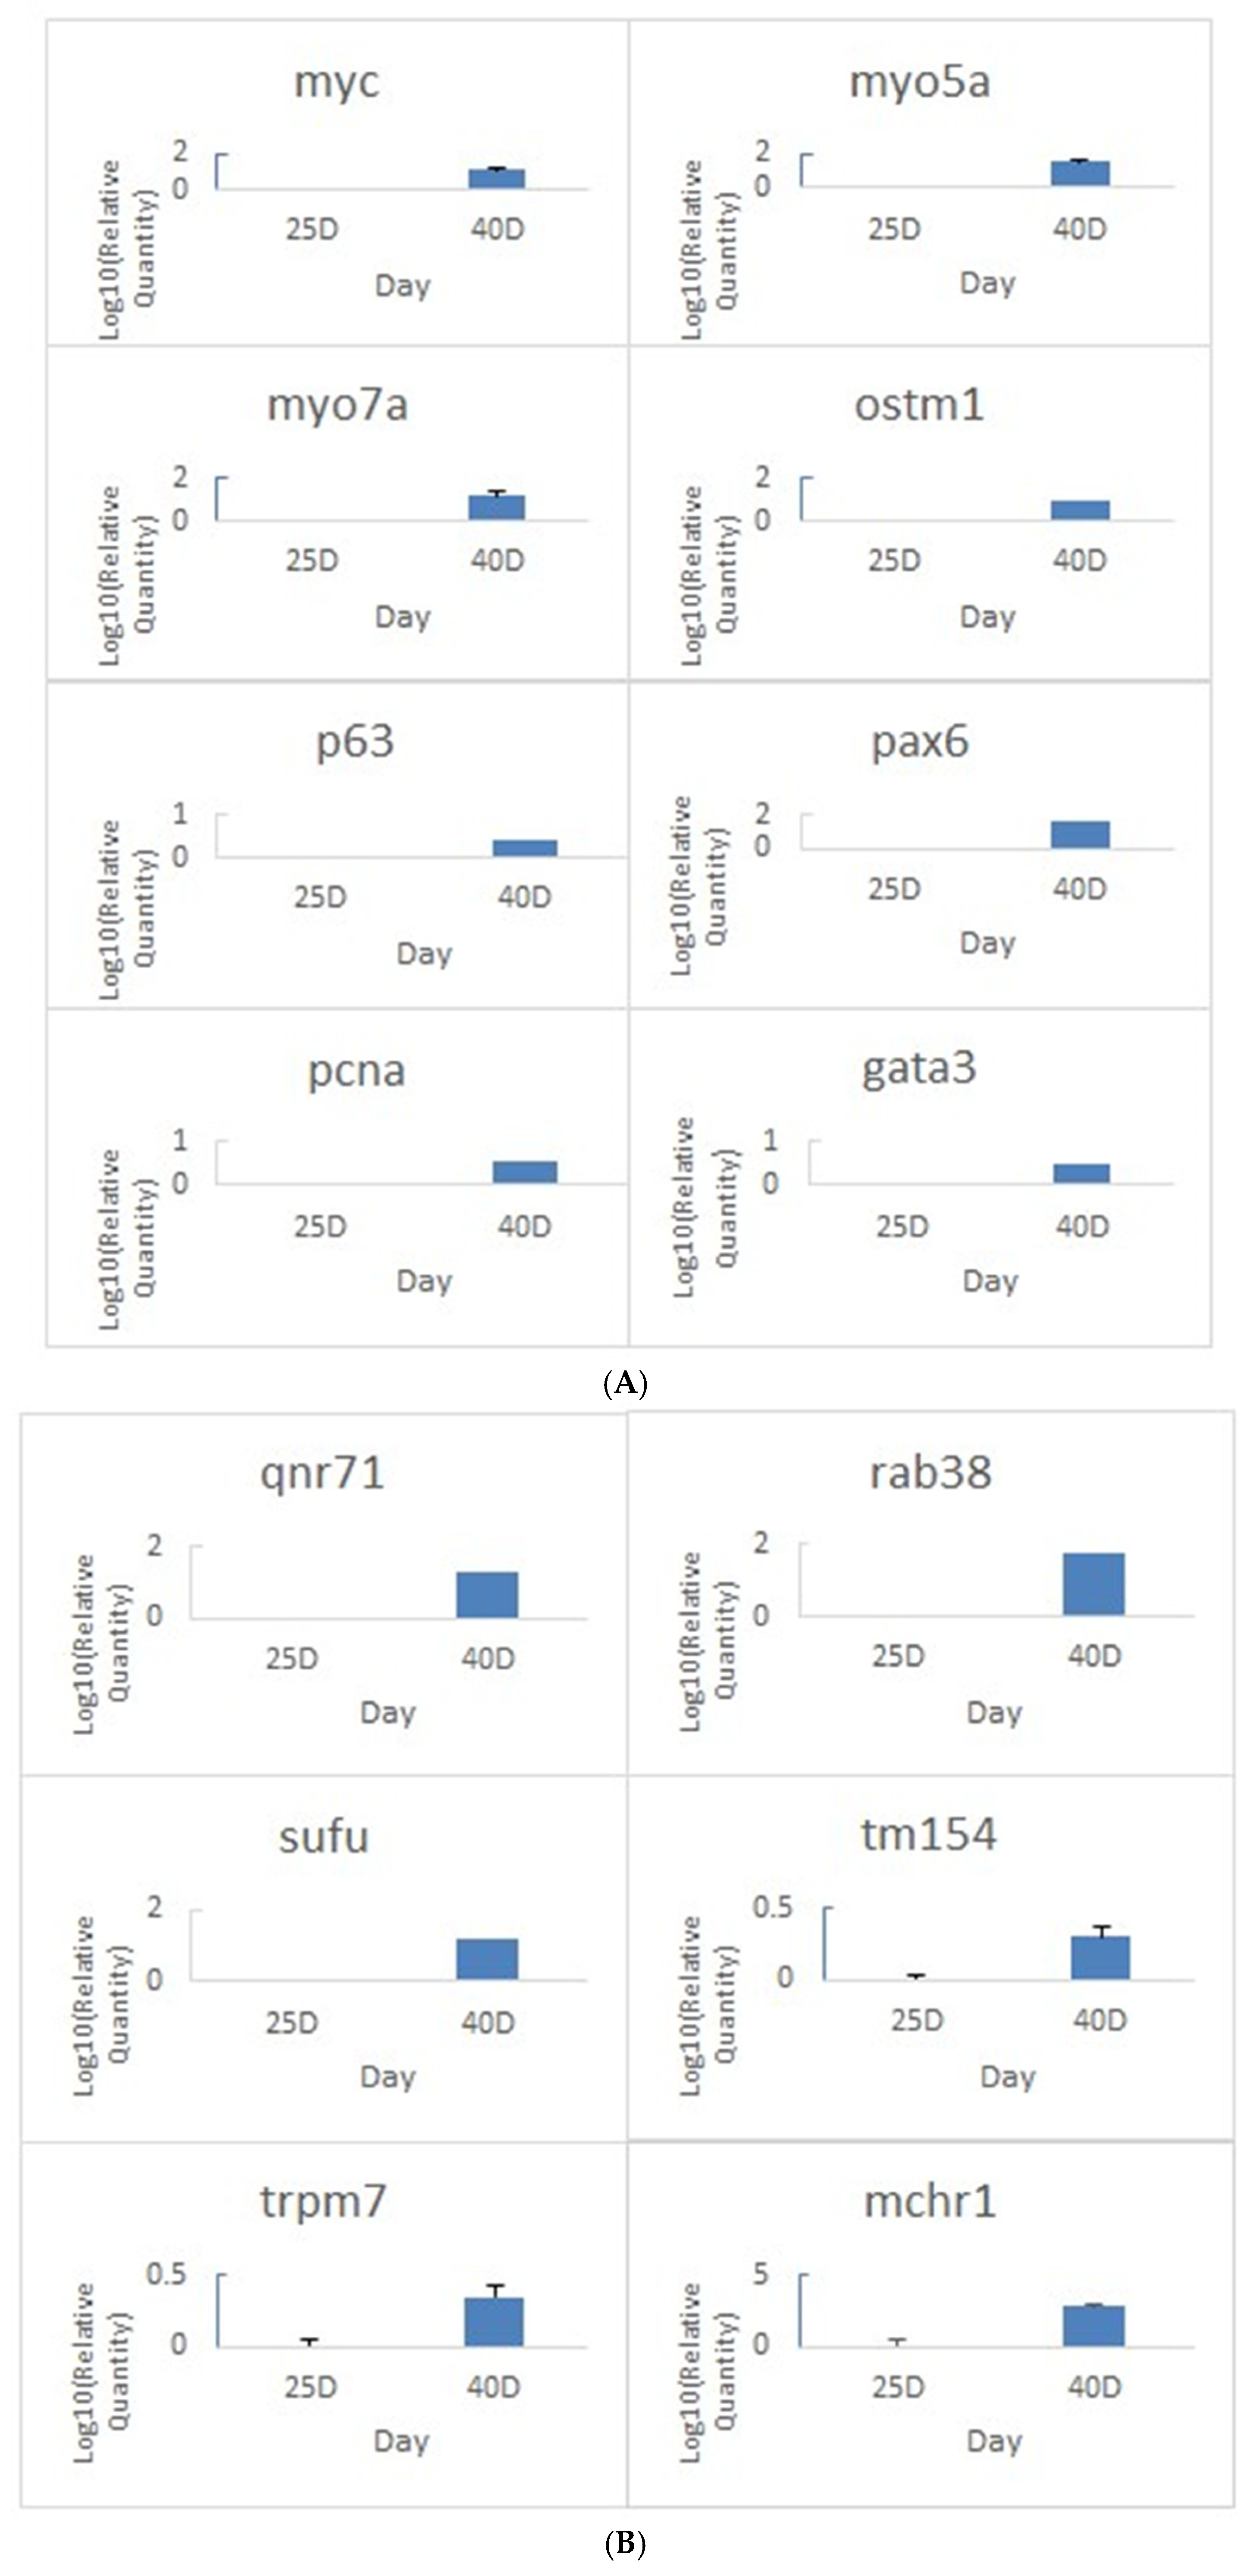
Figure 6.
Integrated analysis of transcriptional and translational gene expression during skin pigmentation (25 vs. 40 dph) in A. frenatus. Scatter plots show log2 fold changes in mRNA (x-axis) and protein (y-axis) levels. Genes are grouped into nine regulatory categories based on expression patterns, including concordant (Groups C, G) and discordant regulation (e.g., Groups A, I). Dashed lines indicate significance thresholds (log2 fold change > 1). The analysis highlights widespread post-transcriptional regulation during skin coloration.
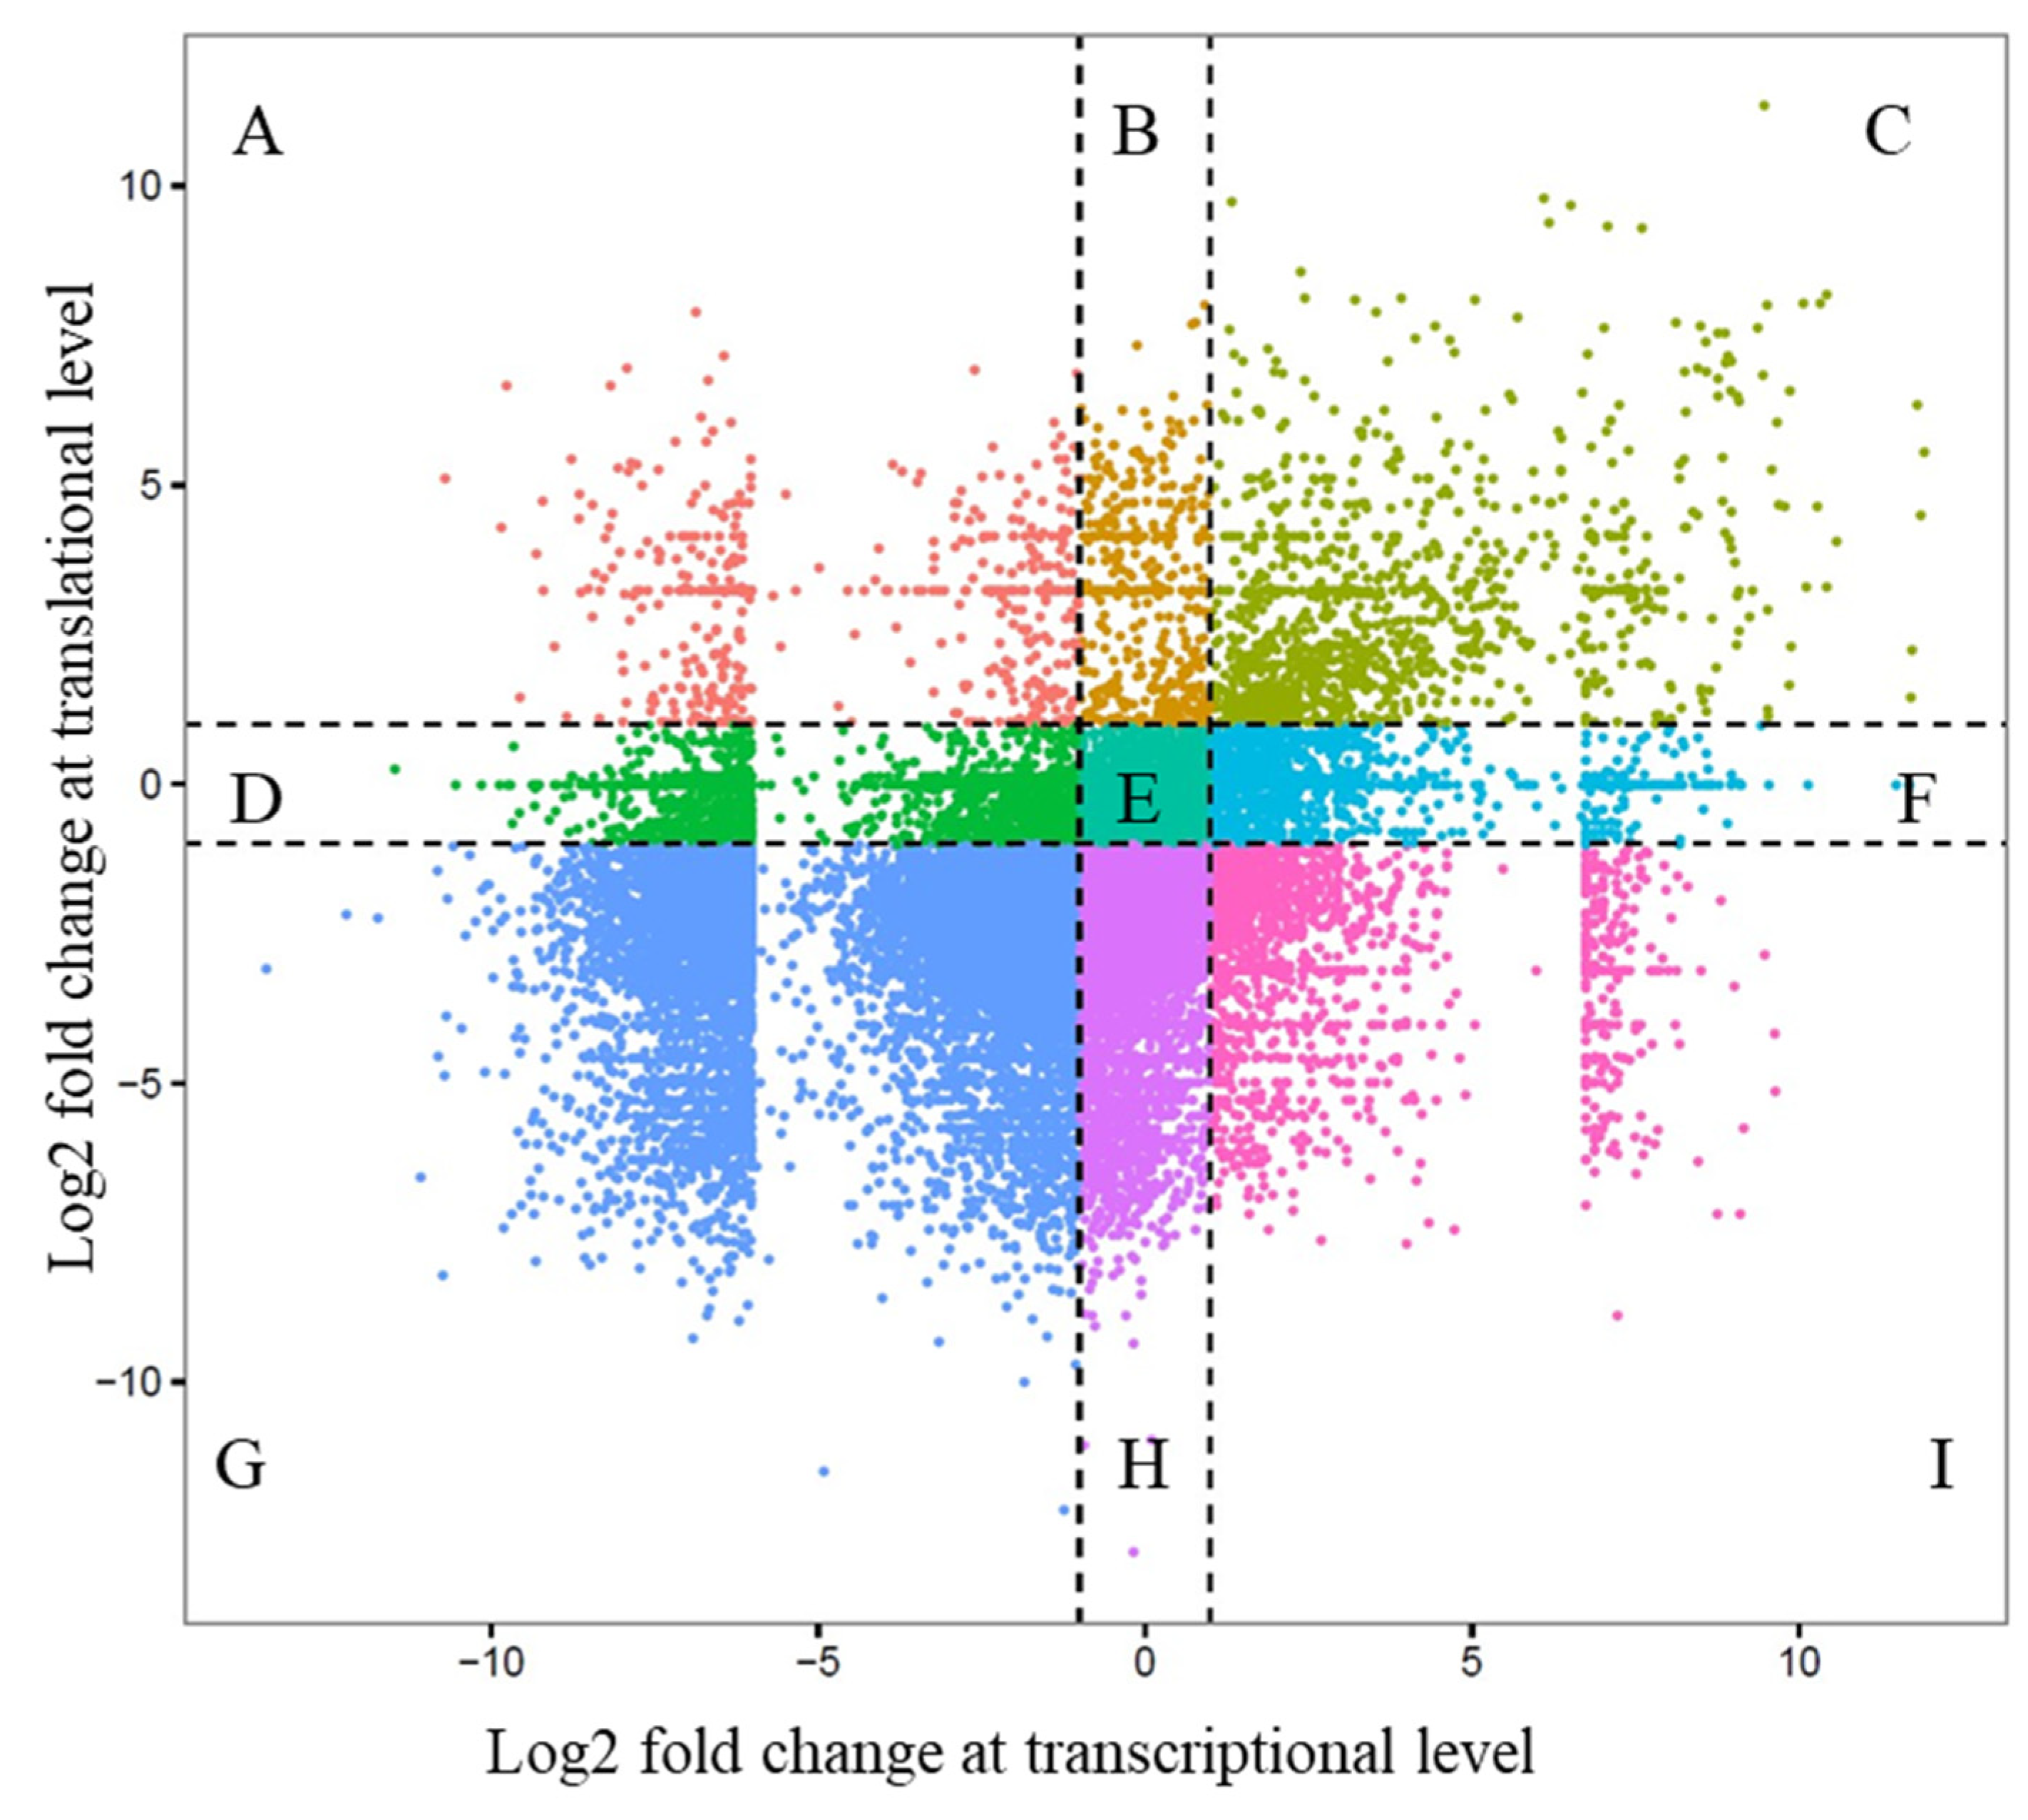
While other regulatory categories were represented across the transcriptome, the pigmentation-related genes primarily exhibited concordant regulation, affirming that the molecular control of early pigmentation in A. frenatus is driven by integrated transcriptional and translational upregulation. This finding also validates the importance of multi-omics approaches in accurately capturing the dynamics of gene expression. Overall, the integrative analysis revealed that pigmentation in A. frenatus is governed by a multi-tiered regulatory landscape, where post-transcriptional and translational mechanisms play dominant roles alongside classical transcriptional control. Numerous genes in discordant groups highlight the limitations of using transcript-level data alone to infer functional outcomes. It highlights the necessity of parallel proteomic profiling to fully understand the orchestration of developmental processes such as skin coloration.
4. Discussion
The present study comprehensively characterizes the histological, transcriptional, and translational processes underlying skin pigmentation development in A frenatus. By integrating morphological observations, transcriptome and translatome profiling, and quantitative gene expression validation, we reveal a multi-layered regulatory framework that orchestrates the emergence of this species’ characteristic pigmentation patterns.
4.1. Morphological and Histological Progression of Skin Development
The histological analysis demonstrated that skin pigmentation in A. frenatus follows a defined temporal sequence. Initially, larvae exhibit a transparent body lacking visible pigment cells. By 5 dph, melanophore precursors emerge along the dorsal and caudal regions. As development progresses, the appearance of the orange pigmentation and the distinct white head bar at 40 dph mark pivotal milestones in chromatophore organization and pigment patterning. Histologically, these changes parallel progressive epidermal stratification and dermal maturation. Melanophores first localize in the superficial epidermis but migrate toward the dermo-epidermal junction, differentiating into iridophores and xanthophores, thereby constructing a multi-layered pigment architecture. By 90–140 dph, the epidermis becomes fully stratified, and a densely pigmented dermis is apparent, reflecting mature tissue organization. These findings support previous models proposing a spatial and temporal orchestration of chromatophore lineage deployment in teleosts [19].
Recent research on brown trout and Japanese flounder provides complementary evidence for the sequential differentiation of pigment cells, contributing to species-specific coloration patterns [20,21]. Such layered chromatophore recruitment not only governs the intensity and stability of adult pigmentation but also reflects conserved morphogenetic programs across diverse teleost lineages.
4.2. Transcriptomic Shifts Associated with Early Pigmentation Development
RNA-Seq analysis comparing 0 and 14 dph revealed a substantial transcriptional reprogramming that accompanies early pigmentation development in A. frenatus. A total of 4,245 differentially expressed genes (DEGs) were identified, with enrichment analyses pointing to upregulated processes such as pigment biosynthesis, oxidoreductase activity, and energy metabolism. The elevated expression of genes involved in oxidoreductase function and proteolytic remodeling at 25 dph indicates a metabolic transition supporting the structural and biochemical requirements for pigment deposition. This metabolic shift mirrors observations in Japanese flounder and rainbow trout, where pigmentation onset coincides with increased transcription of genes involved in melanogenesis, oxidative stress regulation, and tissue remodeling [19,20].
Concurrently, genes associated with neurogenesis, glycolysis, and early cell differentiation were downregulated, suggesting a phase-specific suppression of general developmental programs in favor of epidermal specialization and commitment to the chromatophore lineage. The repression of glycolytic genes aligns with broader trends in pigmentation studies where energy pathways are reallocated toward anabolic biosynthesis and cellular differentiation [21]. These findings support a model in which early larval stages prioritize organogenesis, followed by a transcriptionally focused shift toward skin maturation and the establishment of pigment patterns. Comparative data from teleosts, such as Oncorhynchus mykiss and Paralichthys olivaceus, highlight conserved themes in these transitions, with the developmental timing of pigmentation tightly linked to the transcriptional regulation of pigmentation-specific gene networks [20,21].
4.3. Validation of Candidate Gene Expression Patterns by qPCR
The transition from larval to juvenile pigmentation in A. frenatus marks a critical developmental window characterized by intense differentiation of chromatophores and epidermal remodeling. Our qPCR validation of transcriptomic findings at 40 dph highlighted the upregulation of key genes associated with cell proliferation, epithelial stratification, pigment transport, and endocrine regulation, corresponding temporally with the emergence of species-specific pigmentation. Specifically, the elevated expression of myc and pcna underscores increased mitotic activity and epidermal expansion, a pattern consistent with pigmentation development in other teleost models [20]. The parallel rise in p63, a pivotal transcription factor for epithelial maintenance, aligns with histological evidence of epidermal stratification. Neural crest regulatory genes pax6 and gata3 were also significantly upregulated, suggesting conservation of developmental gene networks governing pigment cell fate across teleosts. Similar transcriptional activation patterns have been reported during early pigment cell migration in zebrafish and crucian carp [22].
Moreover, genes involved in pigment vesicle trafficking, such as myo5a, myo7a, and rab38, exhibited marked increases at 40 dph. These motor proteins facilitate melanosome transport along the cytoskeleton, which is crucial for uniform pigmentation [19]. Supporting this, recent functional studies in zebrafish confirm the roles of these genes in spatial pigment deposition and stripe formation [23]. Among the most prominently upregulated was mchr1, a G protein-coupled receptor implicated in melanocortin signaling, suggesting an endocrine regulatory axis during pigmentation. This is reinforced by recent findings showing thyroid hormones and melanocortin pathways modulate melanogenesis in marine teleosts and zebrafish under variable physiological and environmental conditions [24,25]. Other ion homeostasis regulators such as trpm7 may also contribute to vesicle acidification and pigment granule dynamics during melanogenesis. Together, the qPCR data corroborate transcriptomic trends and reinforce that pigment pattern formation in A. frenatus is driven by a tightly coordinated gene expression program integrating proliferative cues, neural crest lineage commitment, vesicle transport, and hormonal modulation.
4.4. Post-Transcriptional and Translational Regulation of Pigmentation Genes
Our integrative analysis of mRNA and ribosome-protected fragment (RPF) data revealed pervasive decoupling between transcript abundance and protein synthesis during pigmentation development in A. frenatus. Genes were categorized into nine distinct regulatory profiles based on their transcriptional and translational dynamics. While some (e.g., Groups C and G) exhibited concordant regulation, the majority showed discordance, indicating significant contributions from post-transcriptional mechanisms such as mRNA stability modulation, translational efficiency variation, or protein degradation. For instance, Group C genes such as muc5a and muc5b were strongly upregulated at both transcript (logFC > 5) and RPF levels (logFC > 8), reflecting active transcriptional and translational engagement during epidermal maturation. Conversely, Group G genes like pxn1 and rl27 demonstrated parallel downregulation, potentially signaling global repression during tissue differentiation. Of particular interest were genes in Group H, such as gblp and tar1, which showed stable transcript levels but sharply reduced translation, suggesting selective translational repression—a regulatory motif increasingly recognized in teleost development [26]. Group A genes, with high mRNA expression but low protein output, may reflect active proteolysis or mRNA sequestration. In contrast, Group I genes, where translation is upregulated without corresponding transcriptional change, suggest enhanced translational efficiency or stabilization of pre-existing mRNAs.
Similar regulatory dichotomies have been observed in golden-back crucian carp and zebrafish, where microRNAs such as miR-196d and translational repressors modulate melanogenesis and pigment cell behavior [25,26]. Such findings underscore the role of small RNAs and RNA-binding proteins (RBPs) in orchestrating pigment cell differentiation through post-transcriptional mechanisms. Emerging evidence from teleost models suggests that RBPs fine-tune pigment biosynthesis pathways by selectively binding to pigment-related mRNAs, thereby controlling their stability and translational readiness [24]. Additionally, environmental and endocrine factors have been shown to influence translation efficiency in pigmentation genes, suggesting that external cues integrate into the post-transcriptional regulatory landscape [19].
Our observations are aligned with recent multi-omics studies in zebrafish and flounder, which report widespread mRNA-protein mismatches during pigment cell development and tissue remodeling [19,21]. Collectively, these findings emphasize that transcriptional output alone is insufficient to predict functional protein levels, supporting the growing consensus that translational and post-translational layers are crucial determinants of pigmentation phenotypes in teleosts.
In conclusion, our study demonstrates that pigmentation development in A. frenatus is regulated through an intricate interplay of transcriptional, translational, and post-translational mechanisms. Decoupling mRNA and protein levels for key developmental genes underscores the limitations of transcriptomic data alone in developmental studies and highlights the value of integrative omics approaches. Future work should explore the roles of RNA-binding proteins, microRNAs, and translation factors that mediate these regulatory effects, and examine whether similar post-transcriptional strategies are conserved across other teleost lineages. Additionally, investigating environmental and hormonal modulators of these pathways may reveal how external stimuli interface with intrinsic genetic programs to shape pigment pattern diversity in coral reef ecosystems.
Our results demonstrate that pigmentation development in A. frenatus is a tightly coordinated process involving multiple regulatory layers. Morphological maturation of the skin and the differentiation of pigment cells are accompanied by dynamic transcriptional reprogramming. However, the discordance between transcript and protein levels reveals an additional level of translational and post-translational regulation that fine-tunes pigment production.
Author Contributions
Conceptualization, H.YS. and L.EL.; methodology, L.EL., C.KD., and L.MF.; formal analysis, L.EL. and C.KD.; investigation, H. YS., L. MF., T. DC., and C. KD.; data curation, C.KD., and L. EL.; writing—original draft preparation, L.EL. and C. KD; writing—review and editing, L. EL. and H. YS.; visualization, L. MF.; project administration, C. WT. The grant was provided by the Ministry of Agriculture (MOA), Taiwan. All authors have read and agreed to the published version of the manuscript.
Data Availability Statement
The transcriptomic (RNA-Seq) and translatomic (Ribo-Seq) sequencing data generated in this study have been deposited in the NCBI Sequence Read Archive (SRA) under BioProject accession number PRJNA1284240. These data include samples from Amphiprion frenatus at different post-hatching stages and will be publicly available starting on 2025-08-08. The dataset can be accessed via the following link: https://www.ncbi.nlm.nih.gov/bioproject/PRJNA1284240.
References
- Liu, J.; Yin, M.; Ye, Z.; Hu, J.; Bao, Z. Harnessing Hue: Advances and Applications of Fish Skin Pigmentation Genetics in Aquaculture. Fishes 2024, 9, 220. [Google Scholar] [CrossRef]
- Kelsh, R.N.; Harris, M.L.; Colanesi, S.; Erickson, C.A. Stripes and belly-spots—a review of pigment cell morphogenesis in vertebrates. Semin. Cell Dev. Biol. 2009, 20, 90–104. [Google Scholar] [CrossRef]
- Zhang, X.; Zhang, Y.; Wang, Y.; Wang, Y.; Liu, F. Pigment Identification and Gene Expression Analysis during Erythrophore Development in Spotted Scat (Scatophagus argus). Int. J. Mol. Sci. 2023, 24, 15356. [Google Scholar] [CrossRef] [PubMed]
- Bar, I.; Kolesnikov, A.; Biran, J.; Ron, M.; Elizur, A.; Levavi-Sivan, B. Melanocortin receptor 1 and black pigmentation in the ornamental Koi carp. Front. Genet. 2013, 4, 6. [Google Scholar] [CrossRef] [PubMed]
- Braasch, I.; Brunet, F.; Volff, J.N.; Schartl, M. Pigmentation pathway evolution after whole-genome duplication in fish. BMC Evol. Biol. 2009, 9, 21. [Google Scholar] [CrossRef] [PubMed]
- Cal, L.; Suarez-Bregua, P.; Braasch, I.; Rodríguez-Ramilo, S.T.; Rodríguez-Ruiz, A.; Gesto, M.; Gómez-González, N.E.; Bouza, C.; Rotllant, J.; Martínez, P. Countershading in zebrafish results from an Asip1-controlled dorsoventral gradient of pigment cell differentiation. Sci. Rep. 2019, 9, 3443. [Google Scholar] [CrossRef] [PubMed]
- Klann, M.; Mercader, M.; Carlu, L.; Hayashi, K.; Reimer, J.D.; Laudet, V. Variation on a theme: pigmentation variants and mutants of anemonefish. EvoDevo 2021, 12, 8. [Google Scholar] [CrossRef]
- Moore, B.; Herrera, M.; Gairin, E.; Li, C.; Miura, S.; Jolly, J.; Mercader, M.; Izumiyama, M.; Kawai, E.; Ravasi, T.; Laudet, V.; Ryu, T. The chromosome-scale genome assembly of the yellowtail clownfish Amphiprion clarkii provides insights into the melanic pigmentation of anemonefish. G3 Genes Genomes Genet. 2023, 13, jkad002. [Google Scholar] [CrossRef]
- He, L.-B.; Luo, H.-Y.; Zheng, L.-Y. Atmosphere and room temperature plasma alters the m6A methylome profiles and regulates gene expression associated with color mutation in clownfish (Amphiprion ocellaris). Front. Mar. Sci. 2023, 10, 1173215. [Google Scholar] [CrossRef]
- Maytin, A.K.; Davies, S.W.; Smith, G.E.; Mullen, S.P.; Buston, P.M. De novo Transcriptome Assembly of the Clown Anemonefish (Amphiprion percula): A New Resource to Study the Evolution of Fish Color. Front. Mar. Sci. 2018, 5, 284. [Google Scholar] [CrossRef]
- He, L.-B.; Luo, H.-Y.; Zheng, L.-Y. Atmosphere and room temperature plasma alters the m6A methylome profiles and regulates gene expression associated with color mutation in clownfish (Amphiprion ocellaris). Front. Mar. Sci. 2023, 10, 1173215. [Google Scholar] [CrossRef]
- Chen, Y.; Luo, W.; Zhang, S.; He, J.; Tang, Y. Histological Characterization and Gene Expression Analysis of Skin Pigmentation in Japanese Flounder. Int. J. Mol. Sci. 2022, 23, 845. [Google Scholar] [CrossRef]
- Chomczynski, P.; Sacchi, N. Single-step method of RNA isolation by acid guanidinium thiocyanate-phenol-chloroform extraction. Anal. Biochem. 1987, 162, 156–159. [Google Scholar] [CrossRef]
- Ingolia, N.T.; Brar, G.A.; Rouskin, S.; McGeachy, A.M.; Weissman, J.S. The ribosome profiling strategy for monitoring translation in vivo by deep sequencing of ribosome-protected mRNA fragments. Nat. Protoc. 2012, 7, 1534–1550. [Google Scholar] [CrossRef]
- Grabherr, M.G.; Haas, B.J.; Yassour, M.; Levin, J.Z.; Thompson, D.A.; Amit, I.; Adiconis, X.; Fan, L.; Raychowdhury, R.; Zeng, Q.; et al. Full-length transcriptome assembly from RNA-Seq data without a reference genome. Nat. Biotechnol. 2011, 29, 644–652. [Google Scholar] [CrossRef]
- Martin, M. Cutadapt removes adapter sequences from high-throughput sequencing reads. EMBnet.journal 2011, 17, 10–12. [Google Scholar] [CrossRef]
- Li, B.; Dewey, C.N. RSEM: accurate transcript quantification from RNA-Seq data with or without a reference genome. BMC Bioinform. 2011, 12, 323. [Google Scholar] [CrossRef]
- Livak, K.J.; Schmittgen, T.D. Analysis of relative gene expression data using real-time quantitative PCR and the 2−ΔΔCT method. Methods 2001, 25, 402–408. [Google Scholar] [CrossRef]
- Zhang, X.; Lu, X.; Yang, H.; Wu, J.; Xu, Y. Proteomic and transcriptomic profiling reveals dynamic regulation of pigmentation-related genes during larval development in zebrafish. Int. J. Mol. Sci. 2022, 23, 15329. [Google Scholar] [CrossRef]
- Sun, C.; Li, Y.; Li, Y.; Xu, Z.; Zhang, H. Transcriptomic analysis of pigment synthesis pathways during color pattern formation in yellow mutant rainbow trout (Oncorhynchus mykiss). Int. J. Mol. Sci. 2023, 24, 11457. [Google Scholar] [CrossRef]
- Ma, D.; Wang, J.; Wang, X.; Liu, H. Comparative transcriptomics reveal molecular mechanisms of skin pigmentation in Japanese flounder (Paralichthys olivaceus). Int. J. Mol. Sci. 2021, 22, 10120. [Google Scholar] [CrossRef]
- Fang, Q.; Tang, H.; Zhao, M.; Wang, X. Decoupling of mRNA and protein expression during early pigmentation in golden-back crucian carp. Int. J. Mol. Sci. 2021, 22, 7733. [Google Scholar]
- Xiao, J.; Zhang, Q.; Zhao, Y.; Sun, Y. Functional analysis of vesicle trafficking genes in chromatophore patterning of zebrafish. Int. J. Mol. Sci. 2022, 23, 9322. [Google Scholar] [CrossRef]
- Li, Z.; Zhou, Y.; Zhang, L.; Yang, J.; Li, G. Role of thyroid hormone in pigmentation modulation of marine teleosts. Int. J. Mol. Sci. 2024, 25, 2187. [Google Scholar] [CrossRef]
- Luo, L.; Wang, S.; Li, J.; Fan, Y.; Yang, X. Insights into microRNA regulation of melanogenesis: Evidence from zebrafish and other teleosts. Int. J. Mol. Sci. 2022, 23, 4212. [Google Scholar] [CrossRef]
- Chen, L.; Zhang, S.; Feng, Y.; Jiang, Y. Post-transcriptional control in teleost pigmentation: Regulatory roles of RNA-binding proteins. Int. J. Mol. Sci. 2023, 24, 4465. [Google Scholar] [CrossRef]
Figure 1.
Morphological development and pigmentation progression in A. frenatus from larval to juvenile stages. (A) Newly hatched larva (0 days post-hatch, dph) showing a transparent body, undeveloped fins, and no pigmentation. (B) At 1 dph, partial yolk absorption is evident, with the body remaining largely transparent. (C) At 5 dph, initial melanophore development appears along the dorsal and caudal regions. (D) At 10 dph, melanophore proliferation continues, resulting in a slight grayish tint. (E) At 12 dph, body pigmentation darkens, and fin structures become more defined. (F) At 15 dph, brownish pigmentation is apparent along the trunk, and the eyes darken. (G) At 20 dph, orange pigmentation begins to emerge in the posterior body. (H) At 25 dph, orange coloration becomes more distinct, especially in the posterior body and fins. (I) At 40 dph, the first white vertical bar appears on the head, accompanied by intensified pigmentation. (J) At 90 dph, the orange hue dominates the body and the head bar is well-defined. (K) At 140 dph, the body exhibits a deep orange-red coloration with a stable bar pattern. (L) At 240 dph, juveniles display the mature phenotype typical of the species, characterized by a deep reddish-orange body and a prominent white head bar. Scale bars: A–H = 1 mm; I–L = 5 mm.
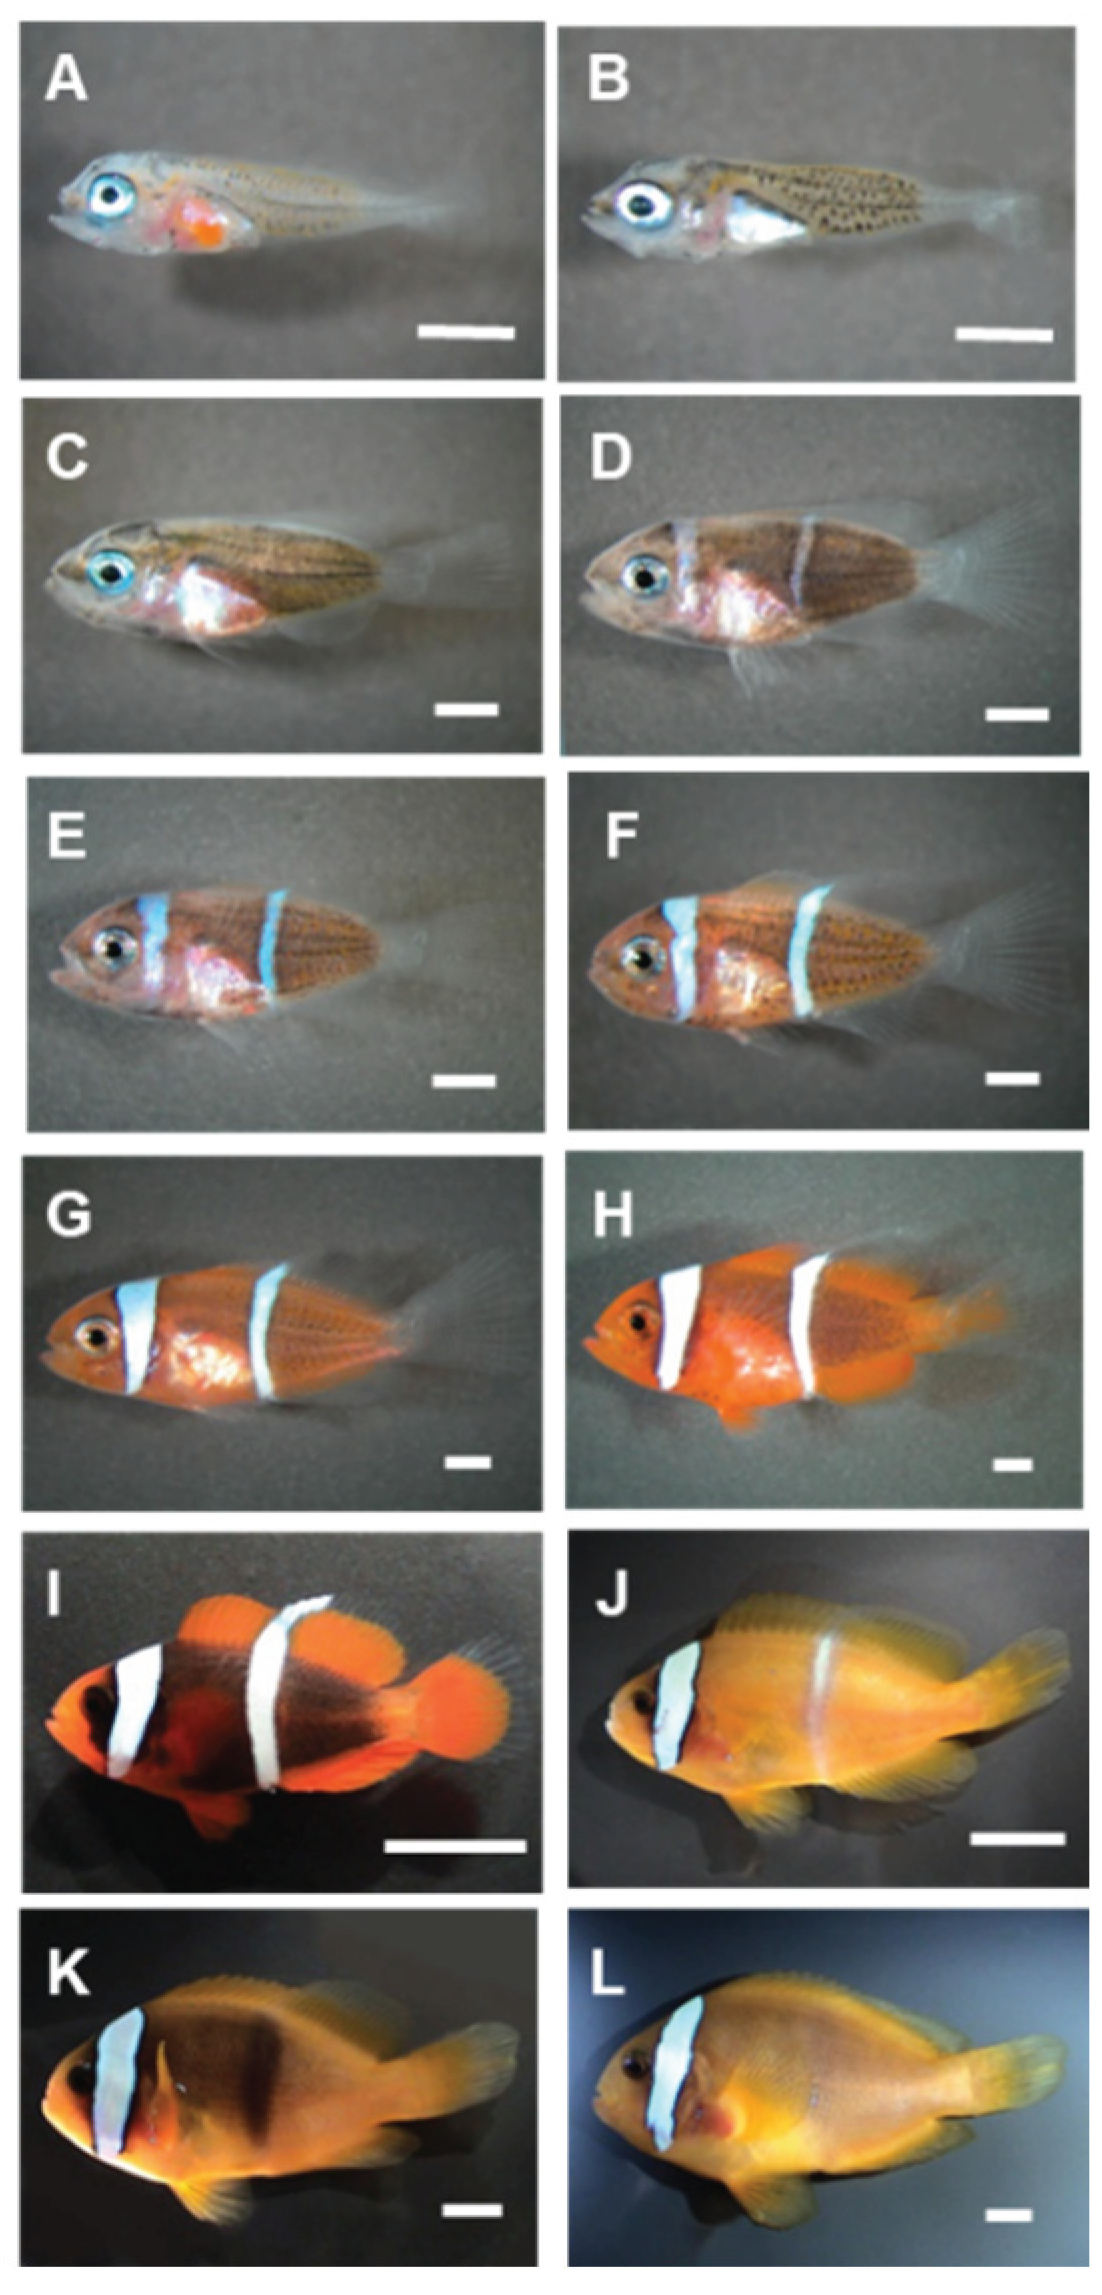
Figure 2.
Histological development of the skin in A. frenatus at various post-hatch ages. (A) At 15 dph, the epidermis is thin and composed primarily of undifferentiated epithelial cells. Scattered melanophores are present within the epidermis, while xanthophores are beginning to emerge. Iridophores are not yet visible, and the dermis remains poorly developed. (B) At 25 dph, stratification of the epidermis becomes evident, and keratinocytes begin to form organized layers. Melanophores increase in number and migrate toward the dermo-epidermal junction. Xanthophores appear in the superficial dermis, and iridophores begin to emerge. (C) At 40 dph, a basal cell layer becomes defined adjacent to the dermis, and chromatophores—melanophores, xanthophores, and iridophores—are more numerous and spatially distinct. (D) At 90 dph, the epidermis exhibits clear stratification, and pigment cells are abundant in both the epidermis and upper dermis. Iridophores and xanthophores are well developed. (E) At 140 dph, the epidermis thickens and a robust basal layer forms. Dermal pigmentation is mature, and elongated melanophores are interspersed with xanthophores and iridophores. (F) At 240 dph, the skin structure is fully developed, featuring a stratified epidermis with multiple keratinocyte layers and a thick dermis with organized collagen bundles and dense pigment cell populations. All sections were stained with hematoxylin and eosin (H&E). Scale bar = 10 μm.
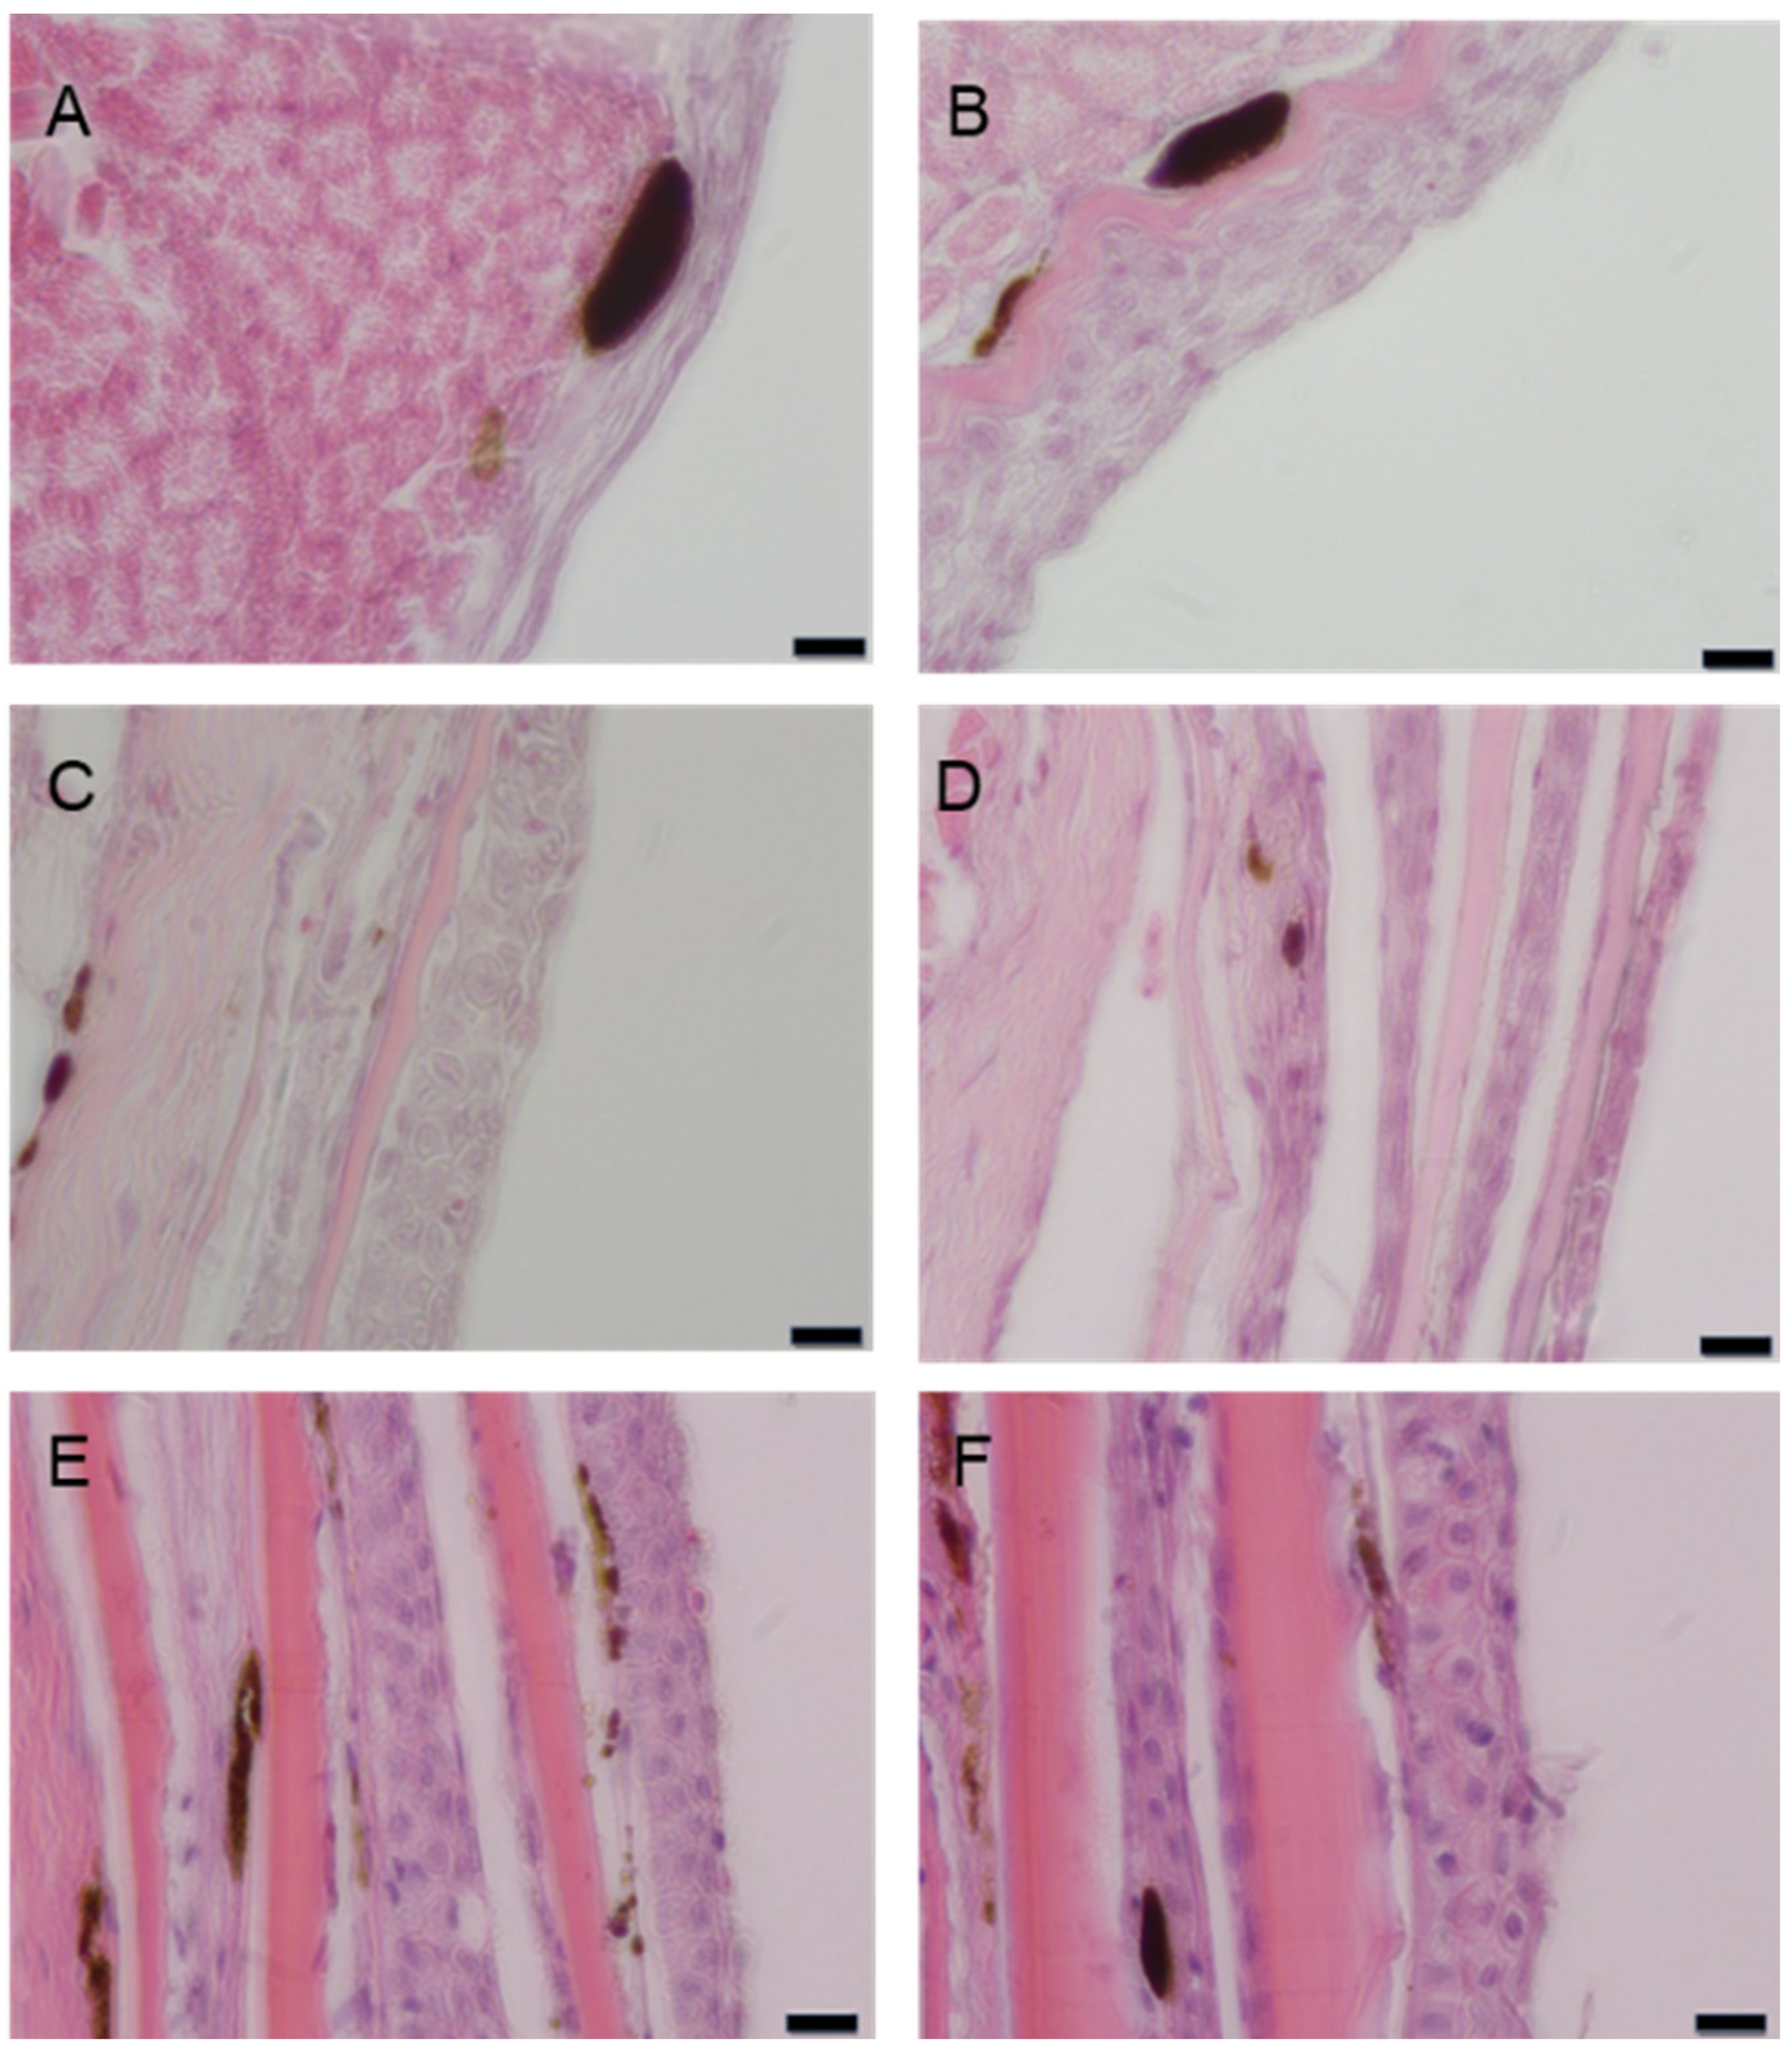
Figure 3.
Scanning electron micrographs of architectures on the skin surface of juvenile A. frenatus. (A) Scales with ctenii at the posterior ends were arranged in an overlapping manner. Parts of the epithelial layer (EPL) on the scales were removed during preparation, and annulus (ans) on the scales were revealed. (B) Ans, epithelia cells (epc) and microridges (MRs) were shown on the damaged surface of epidermis (EPD). (C) The lateral view of trunk indicated EPD with overlapping scales covered by EPL and dermis (DM) containing fibroblasts (fb). Basement membrane (BM) were located between EPD and DM. (D) The intact skin surface had clear MRs on the apex of EPD. Apical openings of goblet cells (ogbc) were visible between MRs. (E) EPD contained apical MRs, stratified epc, capillary (cp) from blood vessels in DM. (F) The lowest portion of the stratified epithelial cells was attached to the BM.
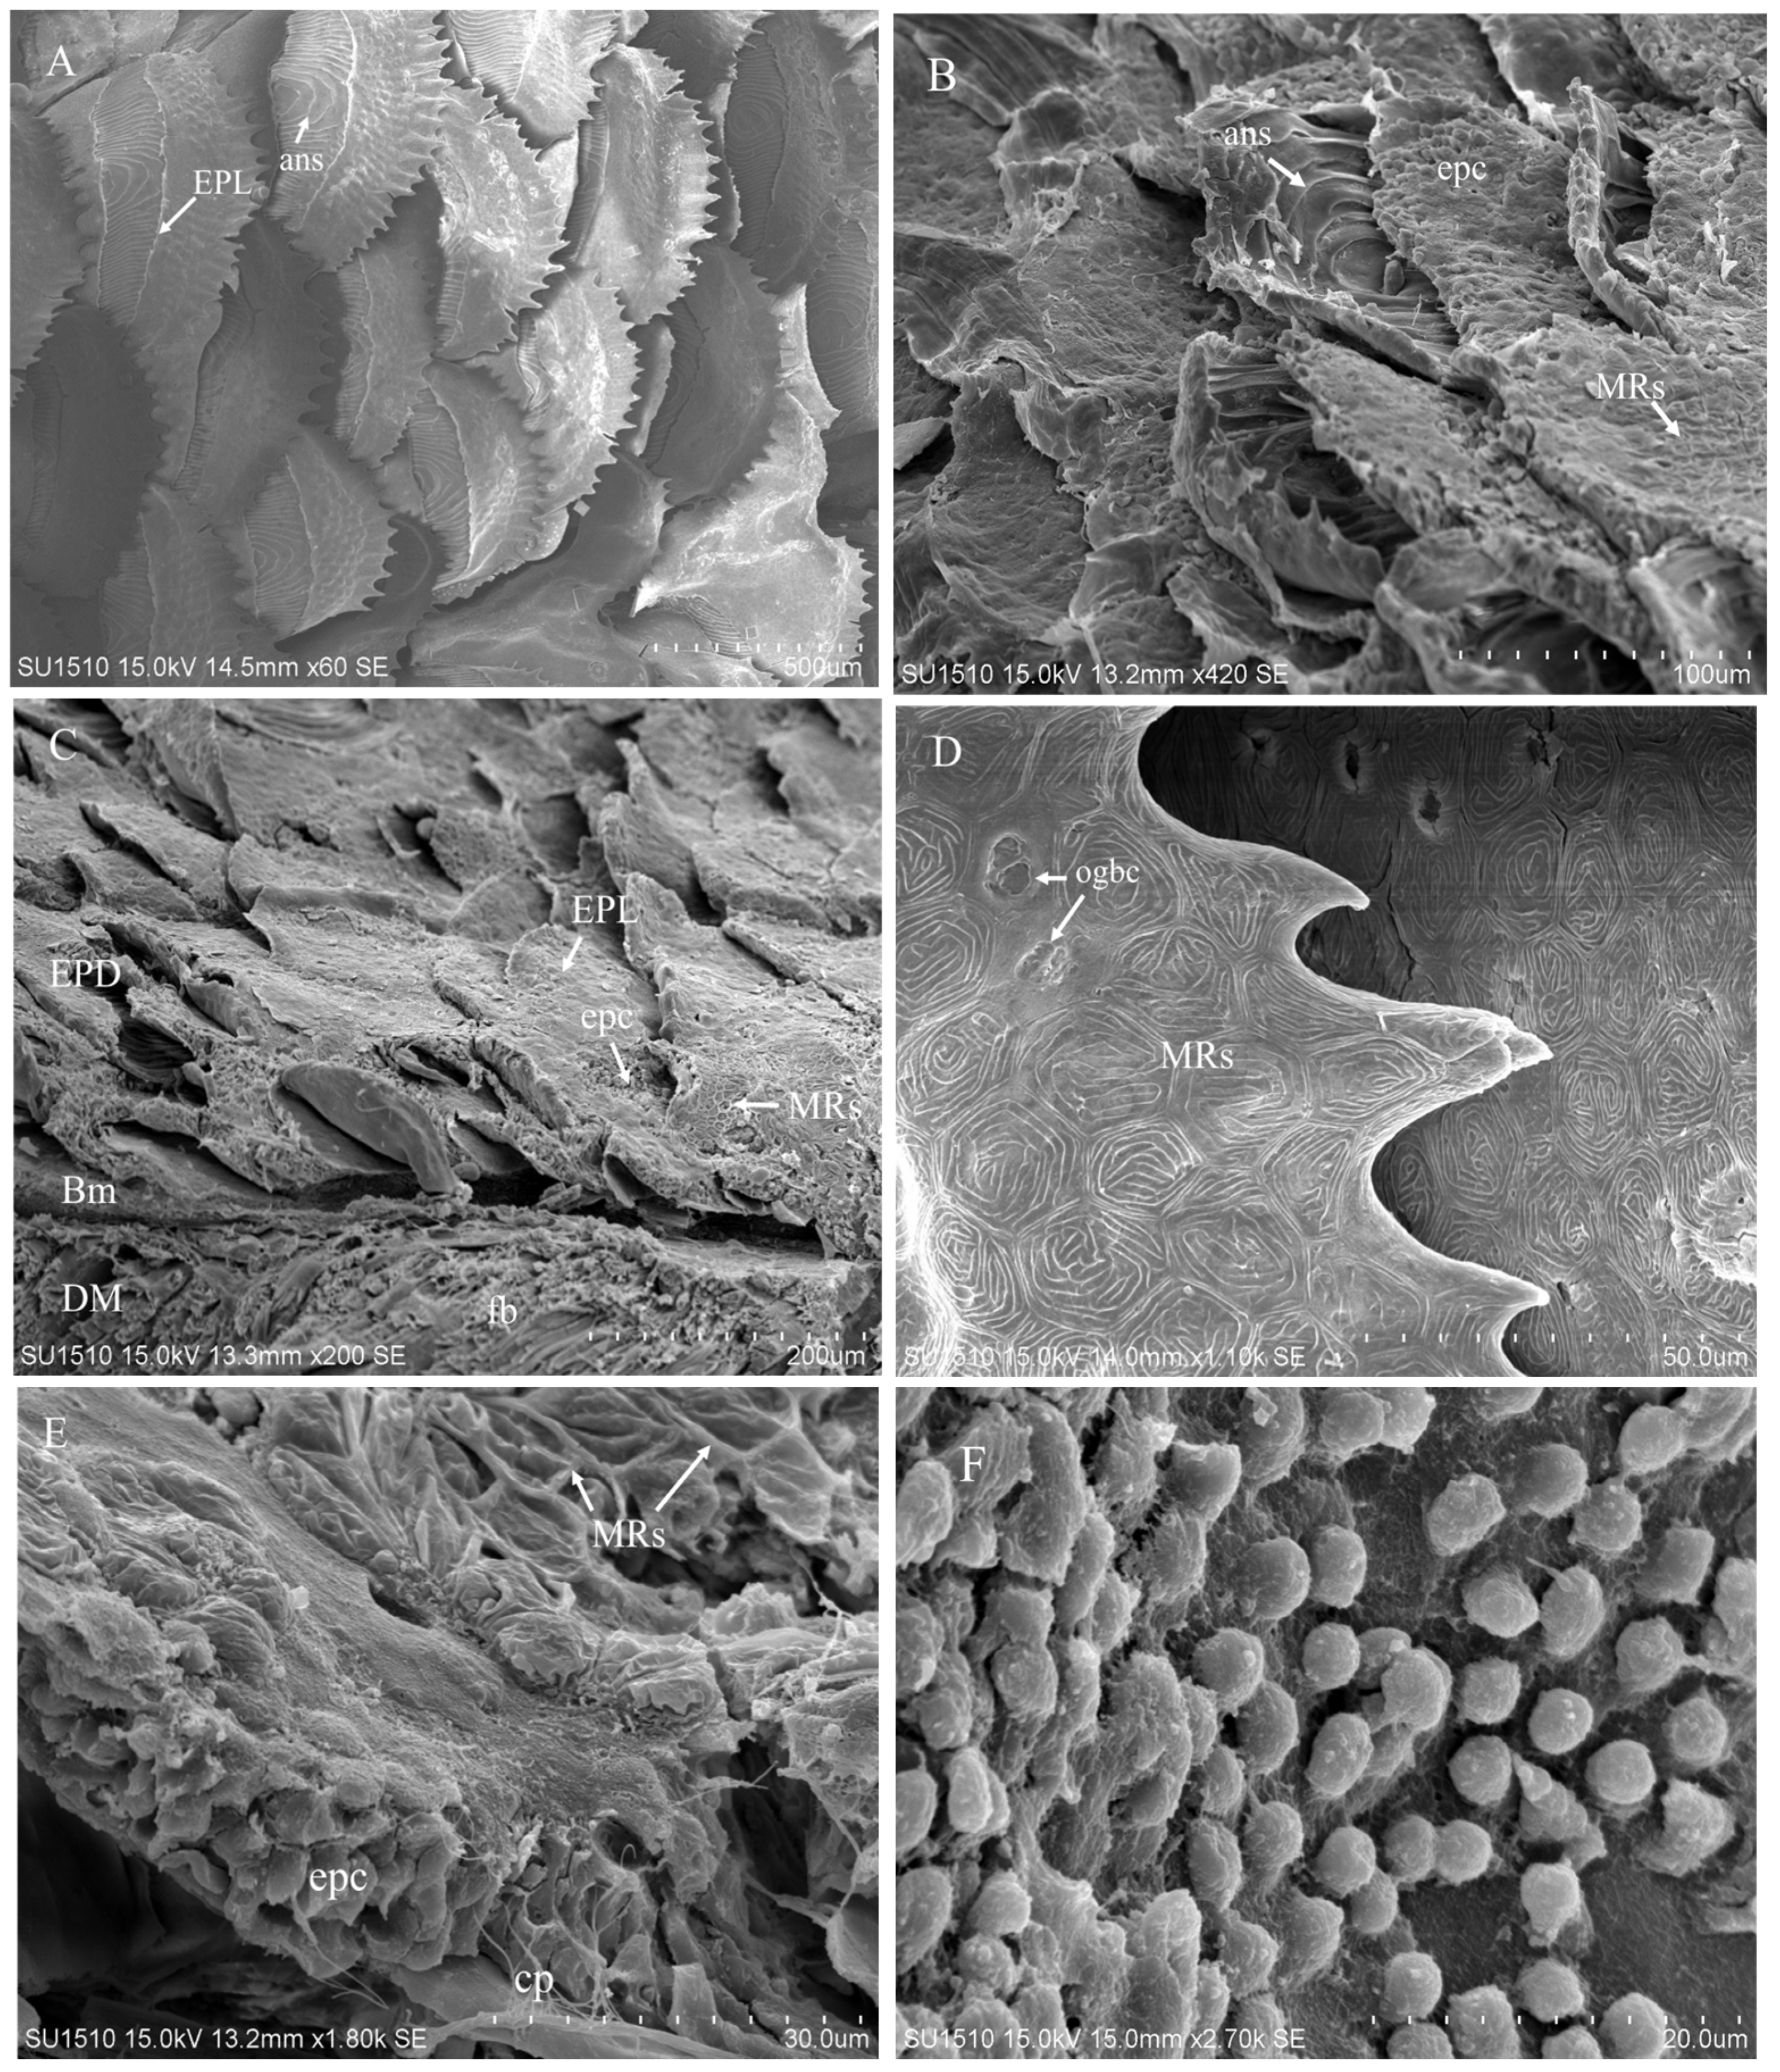
Figure 4.
Transcriptomic and functional analysis of differentially expressed genes (DEGs) in A. frenatus larvae at 0 and 14 dah. (A) Hierarchical clustering of 4,245 DEGs identified by RNA-Seq out of 31,967 genes. DEGs were determined using the DESeq method with a moderated t-test and false discovery rate correction (Benjamini–Hochberg). Heatmap visualization shows distinct gene expression profiles between day 0 (d0) and day 25 (d25) larvae, with red and green indicating up- and down-regulation, respectively. (B) Gene Ontology (GO) enrichment analysis of DEGs. Enriched biological processes include metabolic process (GO:0008152; 1,761 genes, p = 3.47 × 10⁻³³), developmental process (GO:0032502; 378 genes, p = 1.40 × 10⁻¹⁶), catalytic activity (GO:0003824; 1,368 genes, p = 4.94 × 10−41), and hydrolase activity (GO:0016787; 673 genes, p = 1.08 × 10⁻¹⁰). Notably, glycolysis-related genes (27) were significantly down-regulated at d25, indicating a metabolic shift. (C) Functional categorization of DEGs at d25. Left panel: Up-regulated genes (2,328) were enriched in oxidoreductase activity (207 genes, p = 2.40 × 10−44), proteolysis, intermediate filament formation, and pigment metabolic processes. Right panel: Down-regulated genes (1,917) were associated with developmental pathways, including neurogenesis, cell differentiation, and visual perception. The reduction of glycolysis- and eye-related gene expression reflects a shift away from early larval developmental programs toward structural and functional maturation.
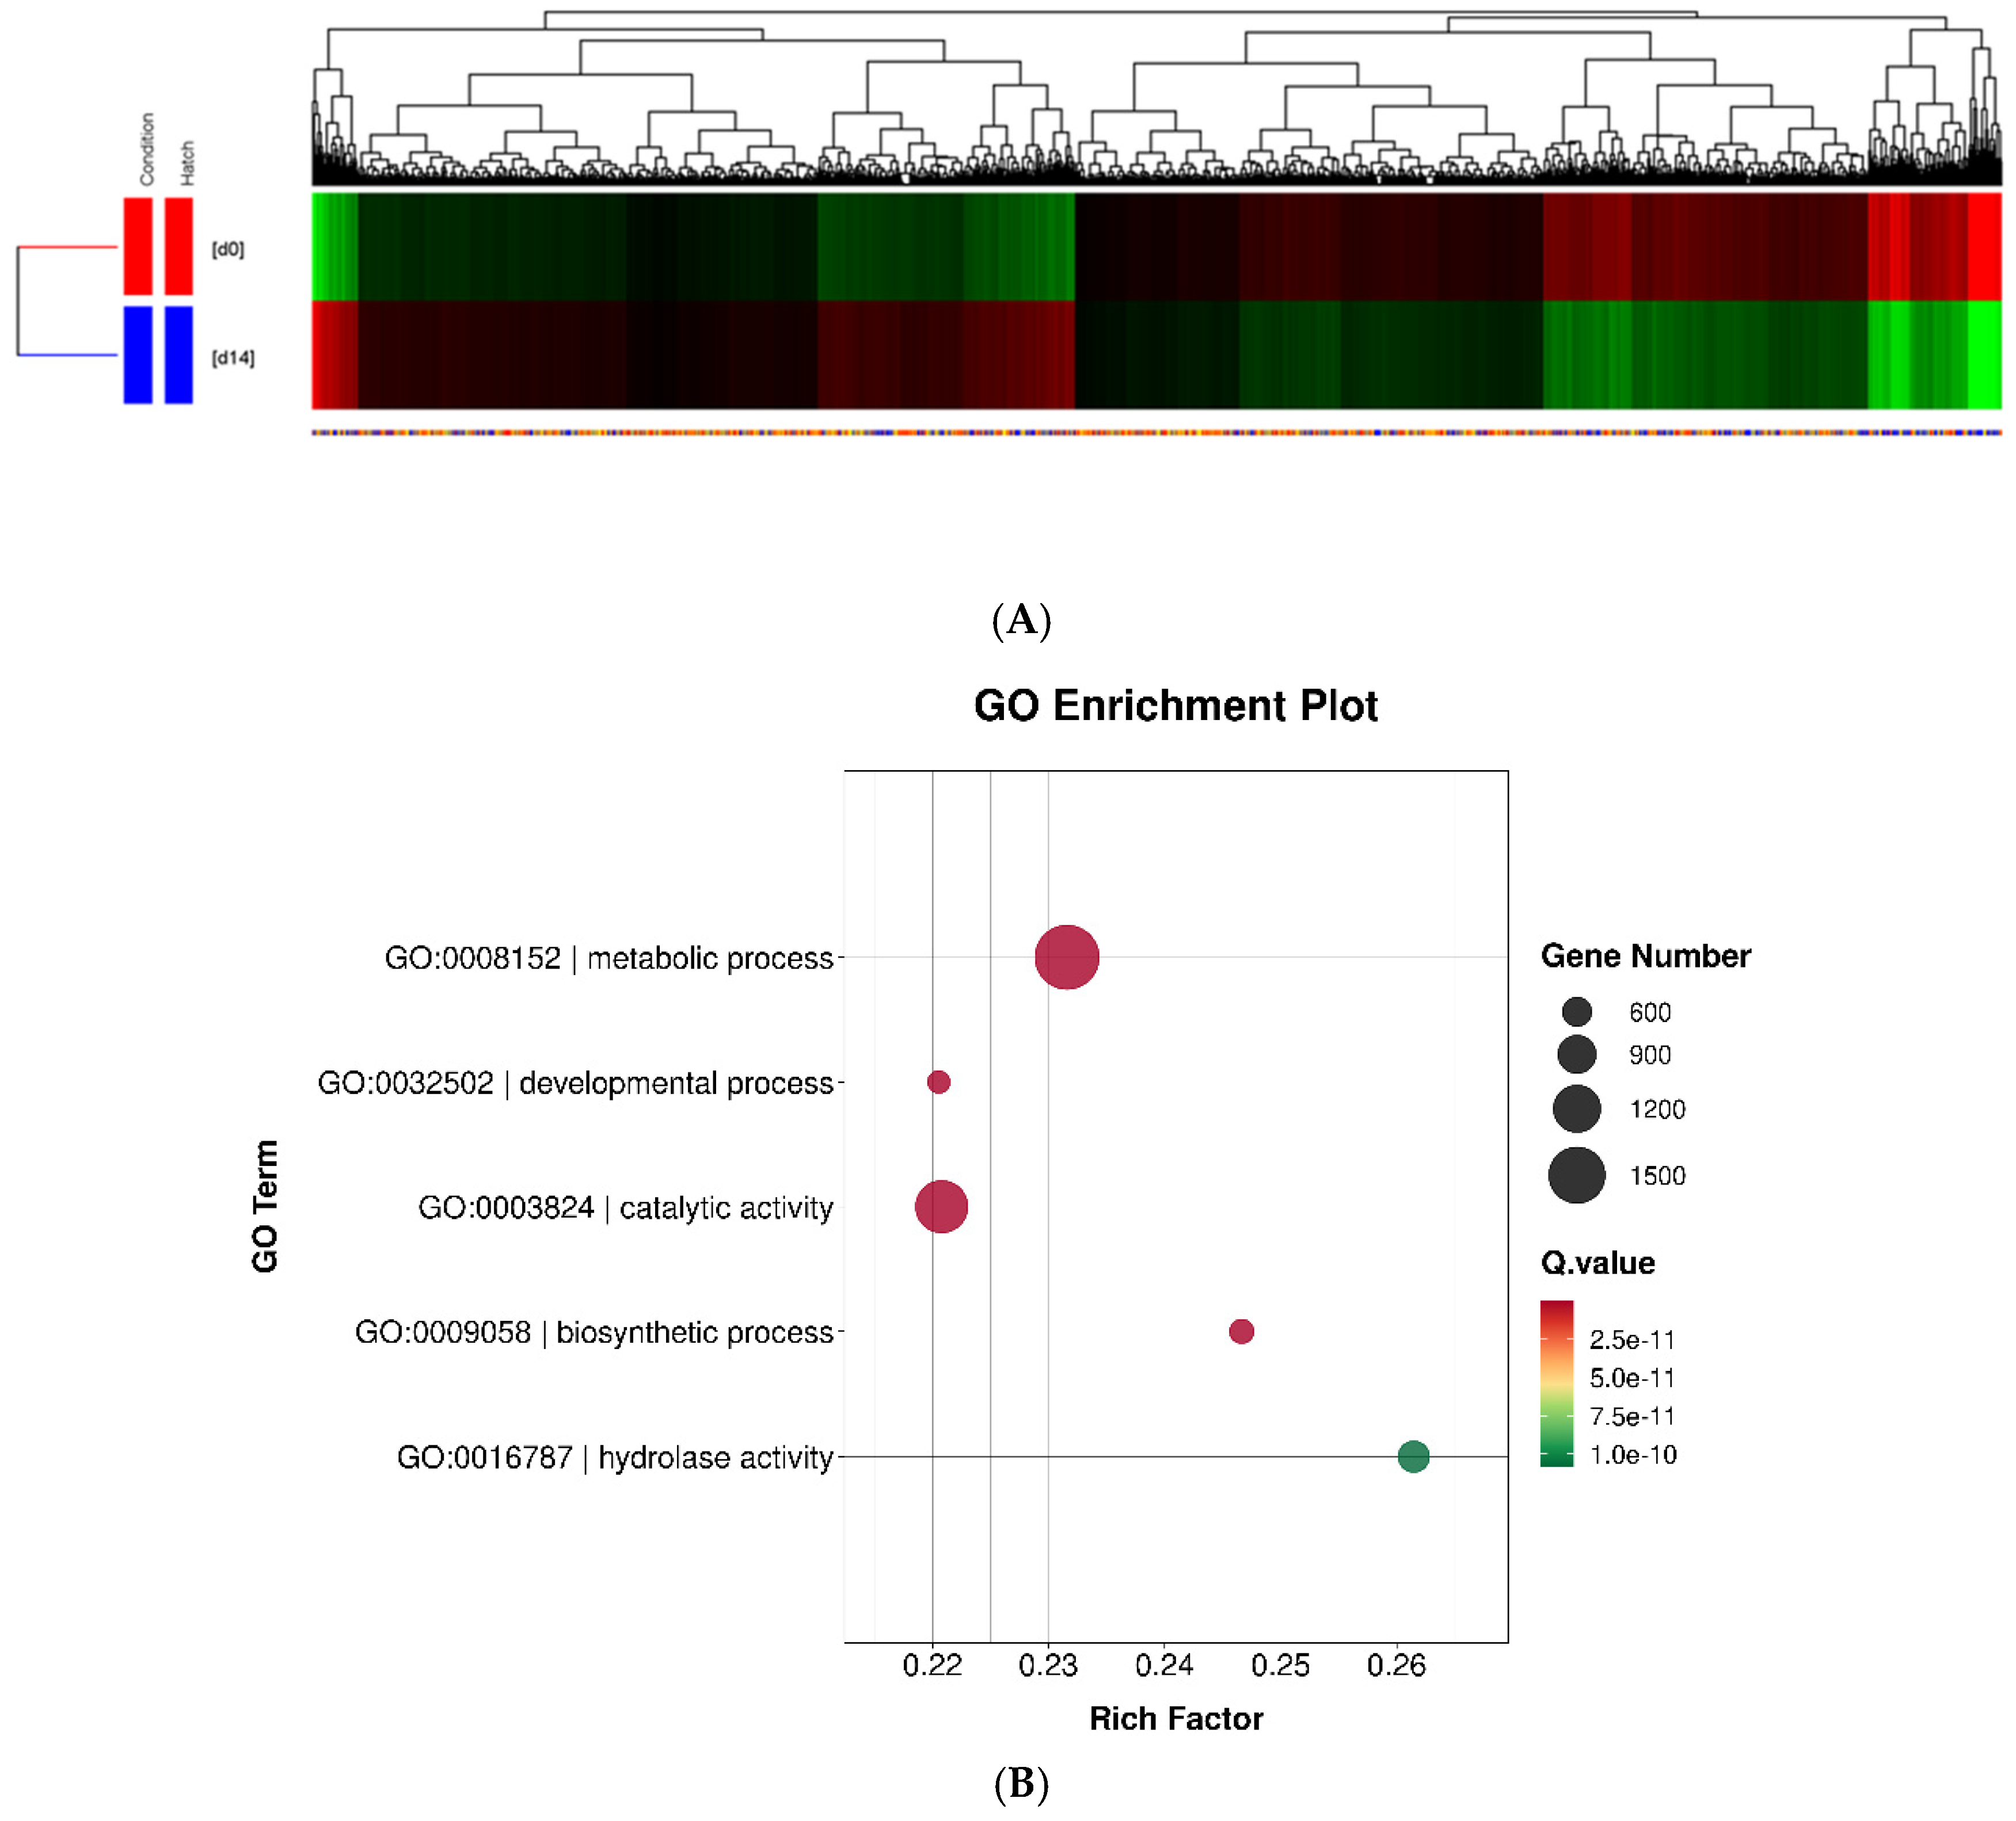
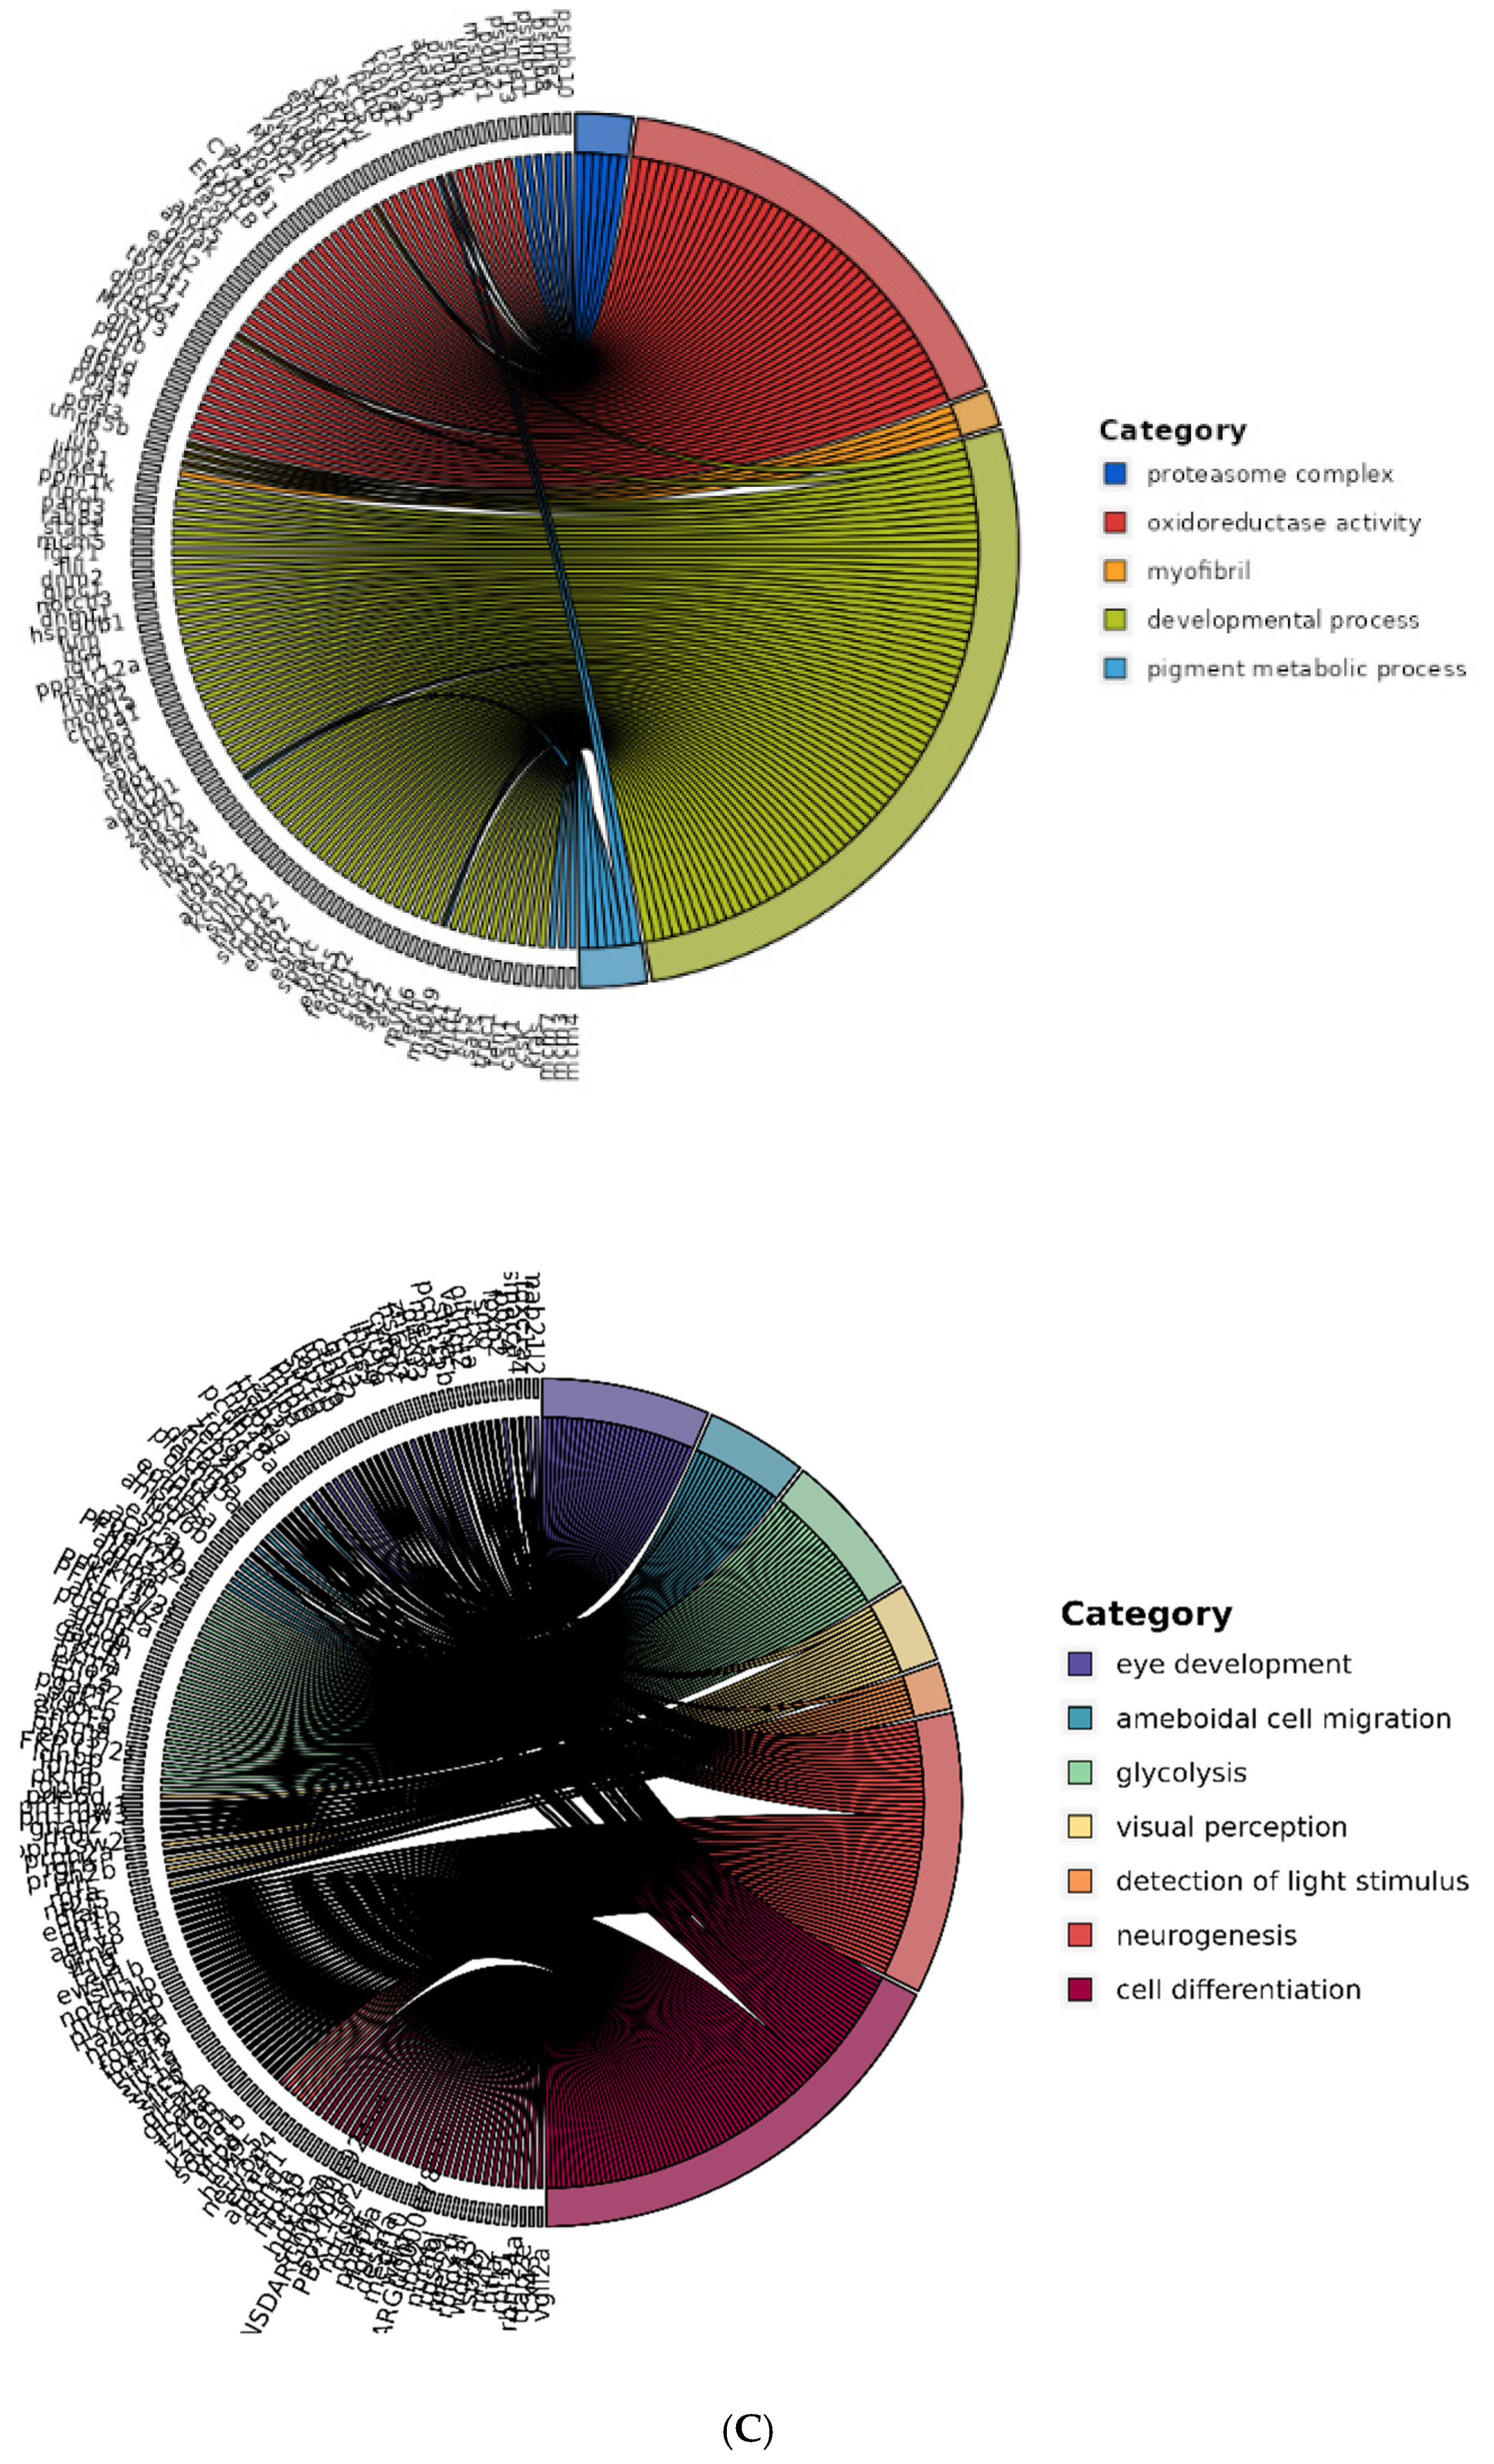

Table 1.
Gene-specific primer sequences used in qPCR.
| Gene | Forward Primer | Reverse Primer |
|---|---|---|
| gata3 | TCAATCGGAGCAGGGTCATC | TCAGGCTACTTGGTGGGAAGA |
| mchr1 | CGACATCACCACTTTCATGCA | CCAGCCCGTTGGCTATAACTC |
| myc | ACAGCGCCGCAACGAA | CTTCAGGATCACCACCTTGGA |
| myo5a | GCTACTGCGGGAGGCTAAGG | CTGCAGGTAGACGATGGAGTGA |
| myo7a | CAGCTGAGGTATTCTGGGATGAT | GGACTCTGTAGCGATCCACAAAC |
| ostm1 | GGCCAGCGGTATGTGGACTAT | TGTCCACCAGTTTGCCATAAGT |
| p63 | CGACTCACGGAAAAGTCAACAA | GTGAGGCCTCCAGACATGCT |
| pax6 | GATGGCTGCCAACAACAAGAC | TCTTGAGCTGCAGTCGCATCT |
| pcna | AGCCCGTCCAGCTGATCTT | GGGATATCAGCCGACATGCT |
| qnr71 | TCCTCCAGCATCACCATCAA | TCGCGCTTCCTGTAGACCAT |
| rab38 | GCGGTTCGGCAACATGAC | TTTTGTGACGGCCTCAAAGG |
| sufu | ACCTAGTGGGTTTGGCTTTGAG | AGCCAGGCCTTGCATGAG |
| tm154 | AAGACCACAGCTCAGGACACAGT | GAGGTTCCGTCTGTGGCATT |
| trpm7 | AAGTACGGCGCTGAGGTCAA | TGACCAATTCGCGCATGTAT |
Table 2.
Total and aligned sequencing reads in RNA-Seq libraries from A. frenatus larvae at 0 and day 14 dph.
Table 2.
Total and aligned sequencing reads in RNA-Seq libraries from A. frenatus larvae at 0 and day 14 dph.
| Day 0 – pool1 | Day 0 – pool2 | Day 14 – pool1 | Day 14 – pool2 | |
| Total number of reads | 86,922,844 | 75,208,725 | 94,806,901 | 95,957,826 |
| Aligned reads | 18,034,936 | 15,497,985 | 17,291,632 | 17,636,124 |
| Unaligned reads | 68,887,908 | 59,710,740 | 77,525,269 | 78,321,702 |
Disclaimer/Publisher’s Note: The statements, opinions and data contained in all publications are solely those of the individual author(s) and contributor(s) and not of MDPI and/or the editor(s). MDPI and/or the editor(s) disclaim responsibility for any injury to people or property resulting from any ideas, methods, instructions or products referred to in the content. |
© 2025 by the authors. Licensee MDPI, Basel, Switzerland. This article is an open access article distributed under the terms and conditions of the Creative Commons Attribution (CC BY) license (http://creativecommons.org/licenses/by/4.0/).
Copyright: This open access article is published under a Creative Commons CC BY 4.0 license, which permit the free download, distribution, and reuse, provided that the author and preprint are cited in any reuse.


