Submitted:
07 August 2025
Posted:
08 August 2025
You are already at the latest version
Abstract
This study explored whether combining promotional strategies with specific shipping types influenced consumer spending. The assumption was that a discount paired with fast or free shipping might have increased purchase amounts. Using a real-world dataset that included demographic variables, purchase history, promo code use, and shipping preferences, the outcome variable, purchase amount, was treated as continuous.Linear regression and XGBoost models were used to test both main and interaction effects. SHAP values and supporting visuals helped interpret model behavior.Across all models, the findings were consistent: there was no statistically significant relationship between promo code use, shipping type, or their interaction and how much people spent. SHAP confirmed that these features had little predictive weight.Although the hypothesis was not supported, the results raised broader questions. Some of the most widely used marketing tactics may not have always moved the needle on spending. More detailed, context-rich data might have been needed to uncover what actually did.
Keywords:
consumer behavior
; promotional strategies
; shipping options
; purchase amount
; e-commerce
; machine learning
; XGBoost
; SHAP values
; regression analysis
; marketing analytic
Introduction
In a world where retail had become increasingly reliant on online shopping and consumer data had become more saturated, personalizing marketing strategies was not just helpful, it had become essential in the competitive market. Companies that had a better understanding of their customers’ spending habits were able to adjust their promotional offers and customer experiences in a way that influenced purchase behavior. From all the factors that were known to shape consumer behavior, both promotional strategies and logistics such as shipping types, were seen as very influential. While both of these factors had been researched on their own, relatively few studies had looked into their combined effect on purchase behavior. This study addressed that with the research question: Can the combination of promotional strategies and shipping types lead to an increase in the average purchase amount, and if so, what was the optimal combination?
The answer to this question held both practical and theoretical importance. Understanding how the interaction could have helped promotional strategies and logistics offerings, would be of practical use for numerous companies. Theoretically, it benefited multiple disciplines within the academic space, from consumer psychology to marketing analytics.
The Rise of Promotion-Logistics Strategy
The last decade saw a dramatic shift in how people shopped and what they expected from brands. The expansion of e-commerce and direct-to-consumer (D2C) gave consumers more control, and raised the bar for what they considered important. Consumers’ expectations had grown beyond just competitive pricing, and now included speed and convenience. Promotional strategies remained relevant, but the effectiveness of tools like discount codes and personalized offers, seemed to be more tied to context than ever before. Shipping, once viewed purely as an operational concern, became at the forefront of the customer decision making process. Delivery speed, shipping cost, and perceived convenience could have been deal-breakers when customers were in the checkout process.
Recent research had started to examine the concept that promotional incentives and shipping preferences could no longer be looked at separately, but had to be looked at together. This came from the idea that when a discount code was combined with fast shipping, it might have created a sense of urgency. While this research was mostly based on theoretical assumptions, few studies had tested whether these combinations actually influenced customers’ willingness to spend more. This study aimed to explore the gap between evidence and application.
Academic and Practical Relevance
Theoretically, this study hoped to contribute to ongoing conversations in marketing and consumer research about how different elements of the customer journey worked together. Most of the existing research isolated promotions and logistics, or focused only on outcome measures such as conversion rates. This study approached the problem a little differently; instead of looking at conversion rates alone, it examined purchase amount, a continuous outcome that gave a more detailed view of how consumers responded to promotional and logistical features. This helped not only capture whether a customer was persuaded to buy, but showed how much they were willing to spend when they were.
The findings were intended to be relevant to marketers, customer retention specialists, and logistics managers. Businesses regularly investigated the success of different promotional offers or optimized shipping policies, but these efforts were rarely evaluated as a combined effort. Knowing if certain combinations of promotions and shipping types drove higher order value, could have helped influence budget allocation, campaign timing, or fulfillment strategy. This became even more relevant as consumer acquisition costs rose and brands looked for ways to increase average order value without relying on deep discounts alone.
This study emphasized the importance of data interpretation. When predictive models grew more advanced, there also was a growing demand to understand why those models behaved the way they did. This study utilized tools like SHAP (SHapley Additive exPlanations) to bridge that gap; clarifying which variables mattered most and if the combination of promo codes and shipping types actually played a role in driving purchase outcomes.
Methodological Overview
To answer the research question, this study used a real-world dataset. The data included demographic variables like age and gender, behavioral variables such as previous purchases, as well as marketing inputs (promo code usage) and fulfillment details (shipping type). The outcome variable used was purchase amount in U.S. dollars, a continuous variable suited to both traditional regression and machine learning techniques.
The analysis followed a multi-step approach. Data preparation was the first step; cleaning the data, encoding categorical variables, and transforming skewed outcomes where needed. This was followed by exploratory analysis, including correlation checks and initial patterns across groups. The main analytical work involved linear regression models to test statistical relationships and interaction effects, alongside machine learning models (specifically XGBoost) to account for non-linear patterns that standard regression might have missed.
Interpretation of the results leaned heavily on SHAP values. These helped identify which predictors had the strongest impact, not only on their own but also in combination with each other. These results were complemented by visualizations like a partial dependence plot and a coefficient plot to test whether the combination of promotions and shipping strategies influenced purchase amount in a measurable way.
All in all, the methods used enabled the study to test for any interaction effect. The findings were interpreted based on data alone, not necessarily on what theory pre-assumed.
This study set out to evaluate whether promo codes and shipping choices affected how much customers spent, aiming to combine academic depth with business relevance. The chapters that follow explore prior research, describe the data and methods used, present the results, and reflect on what those results may (or may not) mean for marketers and researchers trying to understand how consumers navigate complex choices online.
Theoretical Background
Understanding consumer purchase behaviors, in order to potentially influence them, require a better understanding of marketing theories, social behaviors, retail strategies, and machine learning. This chapter discusses previous research that lay the foundation of answering the research question: Can the combination of promotional strategies and shipping types lead to an increase in the average purchase amount, and if so, what was the optimal combination?
Promotional Strategies and Consumer Psychology
Previous studies had looked extensively into the use of promotional strategies as a tool to influence consumer decision-making. The use of price-based promotions, such as discount codes, percentage-off offers, or limited time deals, was psychologically proven to be influential in the decision-making process. This came mostly from the concept that consumers assessed spending decisions based on perceived gains or losses, especially when relative to a reference point (Thaler, 1985). The use of promotional offers helped shift that reference point, creating a perceived reward that pushed purchase behavior.
Another study that reiterated this was the prospect theory of Kahneman and Tversky (1984), which illustrated how the likelihood of purchase could be increased if a discount was shown as a reduction from the original price, persuading consumers to interpret the deal as a gain. This psychological bias, where consumers were more easily influenced by perceived gains than by actual value, led to pricing strategies in which companies listed a higher original price with a discount, even when the final price was equivalent to a regular net price. Consumers tended to respond more positively to the perception of a deal than to the objective cost (Kaufmann, Smith & Ortmeyer, 1994). This framing effect was useful in today’s digital commerce environment where price comparisons were imminent, and purchasing decisions were made rapidly.
While promotional strategies could boost conversion likelihood, some studies looked more closely at their effect on perceived brand value. DelVecchio, Henard, and Freling (2006) found that while promotions stimulated demand, they could also reduce brand preference, especially when used too frequently. Therefore, brands needed to weigh the benefits of boosting conversion likelihood against the potential risk of depleting perceived brand value over time when using aggressive promotional strategies.
Another risk of frequent exposure to promotional offers was the concept of consumer conditioning. According to Lichtenstein, Ridgway, and Netemeyer (1993), price-conscious consumers might have delayed purchases in anticipation of future discounts. This complicated both the promotion strategies and revenue forecasting for companies.
Consumers were often only willing to spend more when a promotion felt relevant to them and added perceived value to the product (Stremersch & Tellis, 2002). The use of promotions would in that case have increased average purchase amounts, but only under the right conditions.
Previous research had shown that the success of promotions depended not only on their financial value, but also on how they were framed, timed, and targeted. When promotions were used correctly, they increased the likelihood of purchase and, when used in the right circumstances, the total amount a customer was willing to spend.
Shipping Type as a Psychological and Strategic Variable
Shipping options were once treated as purely logistical or operational factors, but they came to play a much bigger role in shaping how people shopped and what they spent. The introduction of fast-delivery services, like Amazon Prime’s same-day delivery, changed consumer expectations around shipping times. Shipping speed and cost were no longer just concerns at checkout, but became part of how people decided what and where they bought in the first place.
In today’s e-commerce landscape, shipping fees had a direct impact on both consumer acquisition and retention (Lewis, 2006). The availability of free or low-cost shipping reduced the likelihood of cart abandonment and improved how customers perceived a brand.
Nowadays, shipping options influence consumer behavior in two major ways. First, offering fast delivery options created a sense of urgency, especially in combination with limited-time offers or promotions, encouraging customers to make quicker decisions (Wollenburg et al., 2018). Second, even a small delivery fee could have been a deal breaker, especially when consumers were shopping for low-priced items, and potentially had a large impact on whether customers followed through with a purchase (Dholakia & Simonson, 2005; Lewis, Singh & Fay, 2006). Factors like age, and past online shopping experience influenced consumer preferences around shipping cost (Kwon & Noh, 2010).
These findings suggested that shipping fees had become a vital part of the consumer’s decision-making process. Where it was once only a concern at the end of checkout, it became a deciding factor in whether or not a consumer completed a purchase.
The Combined Effect of Promotions and Shipping
While there was extensive research on shipping options and promotional strategies individually, the combination of both had not been looked into to the same extent. This was a noticeable gap, especially since high shipping fees and lack of promotions tended to push customers to other options in the market. Factors like how long a customer had been with a brand, predicted the effectiveness of promotions, and it was likely that it also predicted how customers responded to shipping options (Anderson & Simester, 2004). In a society where convenience is so important, discounts in combination with fast and/or free delivery can make buying a product so much more appealing.
Framing theory helped to explain why these combinations mattered. The appeal of discounts depended both on the price drop itself and on other features, like the type of shipping offered (Grewal et al., 2010). Customers might have lost interest in a promotional offer if it was paired with slow or expensive shipping. On the contrary, when that same discount was combined with fast or free shipping, it increased the perceived value of the offer by the customers. This was especially true when discounts were perceived as time-sensitive or urgent.
This idea was supported by research showing that consumers considered multiple product features at once and made trade-offs based on how those attributes worked together (Green & Srinivasan, 1978). More recent conjoint research methods confirmed that consumers evaluated promotional value, shipping speed, and delivery cost in connected ways when making a purchase. But most of these findings came from research that was based on surveys or simulated choices, which did not always capture how people behaved when they were not being asked to think about these factors.
Research Gap and Contribution
While there was an extensive amount of research on how promotional strategies and shipping preferences lived within consumer spending behavior, most of the research only looked at these factors separately. Studies explored how discounts influenced purchase likelihood, and how shipping speed influenced cart abandonment, but very few looked at the interaction between these factors. When looking at real-world e-commerce transactions, shipping options and discount codes were often selected at the same time during checkout. Dismissing potential combined effects, oversimplified how consumers actually made purchase decisions.
This study aimed to contribute to existing literature by examining the combined effect of promotional offers and shipping types using actual transactional data. By doing so, a better understanding of how these variables influenced purchase amount in practice was obtained. The other aim of the study was to combine traditional statistical modeling with machine learning tools, in this case XGBoost and SHAP, to test main effects and interaction effects in a more extensive way.
Together, these contributions aimed to bridge the gap between theory and application. By integrating established marketing frameworks with behavioral data modeling, this study offered a more realistic and analytical understanding of how e-commerce strategies impacted spending behavior, and under what conditions their combinations were most effective.
Data Description
This chapter examined the dataset that was used to investigate whether promo code usage, shipping preferences, and their interaction influenced consumer purchase behavior. The dataset, which was sourced from Kaggle and titled Consumer Behavior and Shopping Habits, contained 3,900 transactions and provided a broad view of online consumer behavior, including customer demographics, past shopping behavior, product details, promo code usage, and shipping choices (Aslan, 2023).
Dataset Overview
The dataset was designed for market strategy analysis and captured a wide range of variables relevant to digital marketing and consumer psychology. The rows within the dataset presented a consumer transaction, with the columns giving details of the transaction, from product details to customer preferences. The scale of the dataset allowed for extensive analysis on how promotional strategies and shipping options might had related to purchase amount.
Demographic Variables
Two of the demographics found in the dataset were age and gender. Age was displayed as a continuous variable, with customers ranging from 18 to 70 years, and the average customers’ age was 44.17 years. Due to the even distribution of age, potential differences in shopping behaviors between generations could had been looked into. For example, if there was a difference in focus on value between young and old customers.
Gender was shown as a binary variable, as male and female. About 65 percent of all purchases were made by male customers, indicating a slight imbalance. Although this study did not explore further differences in behaviors between genders, it presented an opportunity to examine the contrast in shopping behaviors between men and women.
Promotional Features
The dataset included two types of promotional activity; whether a discount was applied and whether a promo code was used. Both were displayed as a binary variable, with a “yes” or “no” answer. The difference between the two variables was that they showed active (promo code usage) and passive (automatic discounts) forms of promotional strategy. For this study, Promo Code Usage was looked at due to its ability to show if customers made conscious choices to apply a discount code at checkout.
Shipping Preferences
Shipping preferences were recorded as a continuous variable, with shipping types including Express, Free Shipping, Next Day Air, Standard, 2-Day Shipping, and Store Pickup. While the dataset reflected a wide range of delivery options, this study focused on a binary distinction between Standard Shipping and Fast Shipping, where Fast Shipping included Express and Next Day Air. The variable was used as an indicator for urgency and perceived value, enabling the analysis to explore how logistics choices aligned with promo code usage and influenced consumer spending behavior.
Purchase Behavior History
To better understand current transactions, information on previous purchases and purchase frequency were also included in the dataset. Both were measured as continuous variables. Customer history data helped explain their engagement with the platform over time and could had helped determine if a customer was a new, occasional or frequent shopper. While this study left these variables out of the model, they could had provided important context to understand the behavior of the customers in the dataset.
Outcome Variable: Purchase Amount
The outcome variable was Purchase Amount, and was measured in U.S. dollars as a continuous variable. It represented the total value of each transaction and was used as the dependent variable in the analyses. Purchase Amount was evenly distributed, and had a mean of $59.76. To fix the slightly right skew, a log transformation was used in order to prepare the data for analysis.
Product and Contextual Features
Other parts of the dataset that were not utilized in this study were product category, item color, season of purchase, size, and geographic location. The details of the purchase could have potentially explained if certain product categories were more price sensitive, or if specific seasons could have indicated more urgency in shipping options. Geographic data could have been further explored to understand which States could have benefited from marketing initiatives.
Data Quality
The absence of missing values highlighted the strength of the dataset. All variables had complete data, which made the analysis more reliable.
Summary
Due to the completeness of the dataset, limited changes were needed to use the data for statistical and machine learning analyses. With demographic details, purchase history, shipping preferences, promo code usage, the dataset provided a great overview of consumer behavior. The dataset also had no missing values, laying a strong foundation for the exploration of the relationship between promo code usage, shipping preferences, their interaction, and purchase amount. The following chapter will go into the methods that were used to look into these relationships.
Methods
This chapter explained the methodological framework that was used to explore if there was a relationship between promo code usage, shipping options, and consumer purchase behavior. More specifically, it looked into whether the use of a promo code, the choice of fast shipping compared to standard shipping, or the interaction between these two influenced the amount spent by consumers. To analyze this, traditional statistical techniques and modern machine learning approaches were used. A detailed description of the data preparation, the development of the model, and the interpretation procedures used for the analysis will be described below.
Data Preparation
The dataset used for the analysis contained information about customer demographics and their purchase behavior. The outcome variable, Purchase Amount, was found in the dataset as a continuous dependent variable and presented the total value of each customer transaction. Key predictors Promo Code Used and Shipping Type were found as binary variables, indicating if a customer used a promotional code or not and whether the customer selected fast shipping compared to standard shipping for their purchase. Previous Purchases, showcasing the number of previous transactions of the customer, or Age, showing the customer’s age in years, were also looked at.
Before the start of the analysis, the dataset was screened for outliers and missing values. The cleaning of the dataset included conversion of categorical variables into binary numerical ones, verification that data types were consistent across the dataset, and checks of the distribution and scale of continuous variables. An interaction between Shipping Type and Promo Code Usage was created in order to test for any combination effects that these variables might have had on customers’ purchase behavior.
Descriptive Analysis
An exploratory data analysis was used to better understand the characteristics of the dataset and to detect potential data irregularities. The average purchase amount of all of the transactions within the dataset was approximately $60. There was an imbalance in the usage of promo codes, with a slightly higher number of customers applying them at checkout. Most customers chose the standard shipping option over the fast shipping option at checkout. Looking at the combination of promo code usage and shipping type choices, most customers who used a promo code, also used standard shipping. Because the group sizes were uneven, it may have limited the ability to detect interaction effects between promo code usage and shipping type.
Regression Modeling
To assess if the variables Promo Code Use and Shipping Type influenced purchase amount, a linear regression was implemented by using the lm() function in R. The regression used Promo Code Used, Shipping Type, the interaction of these two, Previous Purchases and Age as predictors for the dependent variable, Purchase Amount. This analysis helped establish the estimation of the main and interaction effects of the promotional and shipping variables.
The results of the regression showed that none of the predictors significantly influenced purchase amount. Promo Code Used even showed a negative effect, meaning that there was a potential decrease in purchase amount spent, but with a p-value of 0.275, this effect was not statistically significant. Fast Shipping had a small positive coefficient of 0.092, but was not statistically significant either, with a p-value of 0.900. The interaction between Promo Code Used and Fast Shipping had a coefficient of 0.33, however due to the p-value being 0.871, it showed no statistically meaningful effect. Overall, the regression analysis did not support the hypothesis that either predictors or their interaction influenced customer purchase amount.
Machine Learning and Model Interpretability
A machine learning approach was applied using the XGBoost to dive further into the results of the regression. The dataset was split into training, validation, and test subsets for the evaluation. Root Mean Square Error (RMSE), Mean Absolute Error (MAE), and R-squared were calculated to evaluate the model’s predictive accuracy.
A scatterplot was used to compare the predictors with the actual purchase amounts, in which each point represented an individual transaction. Most points clustered around the diagonal reference line, showing alignment between predicted and observed values. However, the spread, especially when looking at higher purchase amounts, showed that the model’s predictions were not fully accurate.
SHAP Analysis
To be able to interpret the influence of each predictor on the XGBoost model’s output, SHAP analyses were made by using the iml package in R. This method helped to break down each prediction into contributions from individual features, giving insight into the importance of each variable.
A SHAP dependence plot was made looking at Promo Code Used and Fast Shipping, showcasing a flat trend, indicating no meaningful effect on the predicted purchase amount. The lack of variation confirmed that neither promo code usage nor fast shipping had an influence on consumer spending in the machine learning model.
These results reiterated the findings from the linear regression, emphasizing the validity of the overall conclusion. The consistency between both traditional and modern modeling approaches solidified that promotional strategies and shipping preferences did not significantly impact purchase amount.
Summary of Analytical Approach
In summary, all the chosen analyses to look into whether the use of a promo code, the choice of shipping type, or their interaction influenced how much customers spent, were described. The study used linear regression, XGBoost modeling, and SHAP-based analyses to assess these potential effects. All of these analyses came to the same conclusion; there was no statistically significant relationship between promotional strategies, shipping types and customer spending. The consistency in results across all these methods, increased confidence in the null result which will be further interpreted in the Discussion chapter.
Results
This chapter will present the results of the statistical analyses used to explore potential relationships between promo code usage, shipping types, and the purchase amounts. As previously described, regression and machine learning methods were used to assess whether the use of promo codes, the type of shipping, or the interaction between these two, influenced the amount of money customers spent. While the theoretical background suggested the potential influence, the data did not statistically support the hypothesis that promo code usage combined with fast or free shipping potentially led to higher purchase amounts. This section will walk through the results of the analyses that had been done in order to explore this potential relationship.
Descriptive Summary
To better understand the distribution of the independent variables and their relationship to the dependent variable, purchase amount, basic descriptive statistics were reviewed. A deep dive into promo code usage by shipping type showed that promo codes were used with fast and standard shipping options, but most customers that used a promo code chose standard shipping. Due to these more common choices, somewhat of an imbalance was found for the testing of the interaction of the two.
Assumption Checks and Correlation Analysis
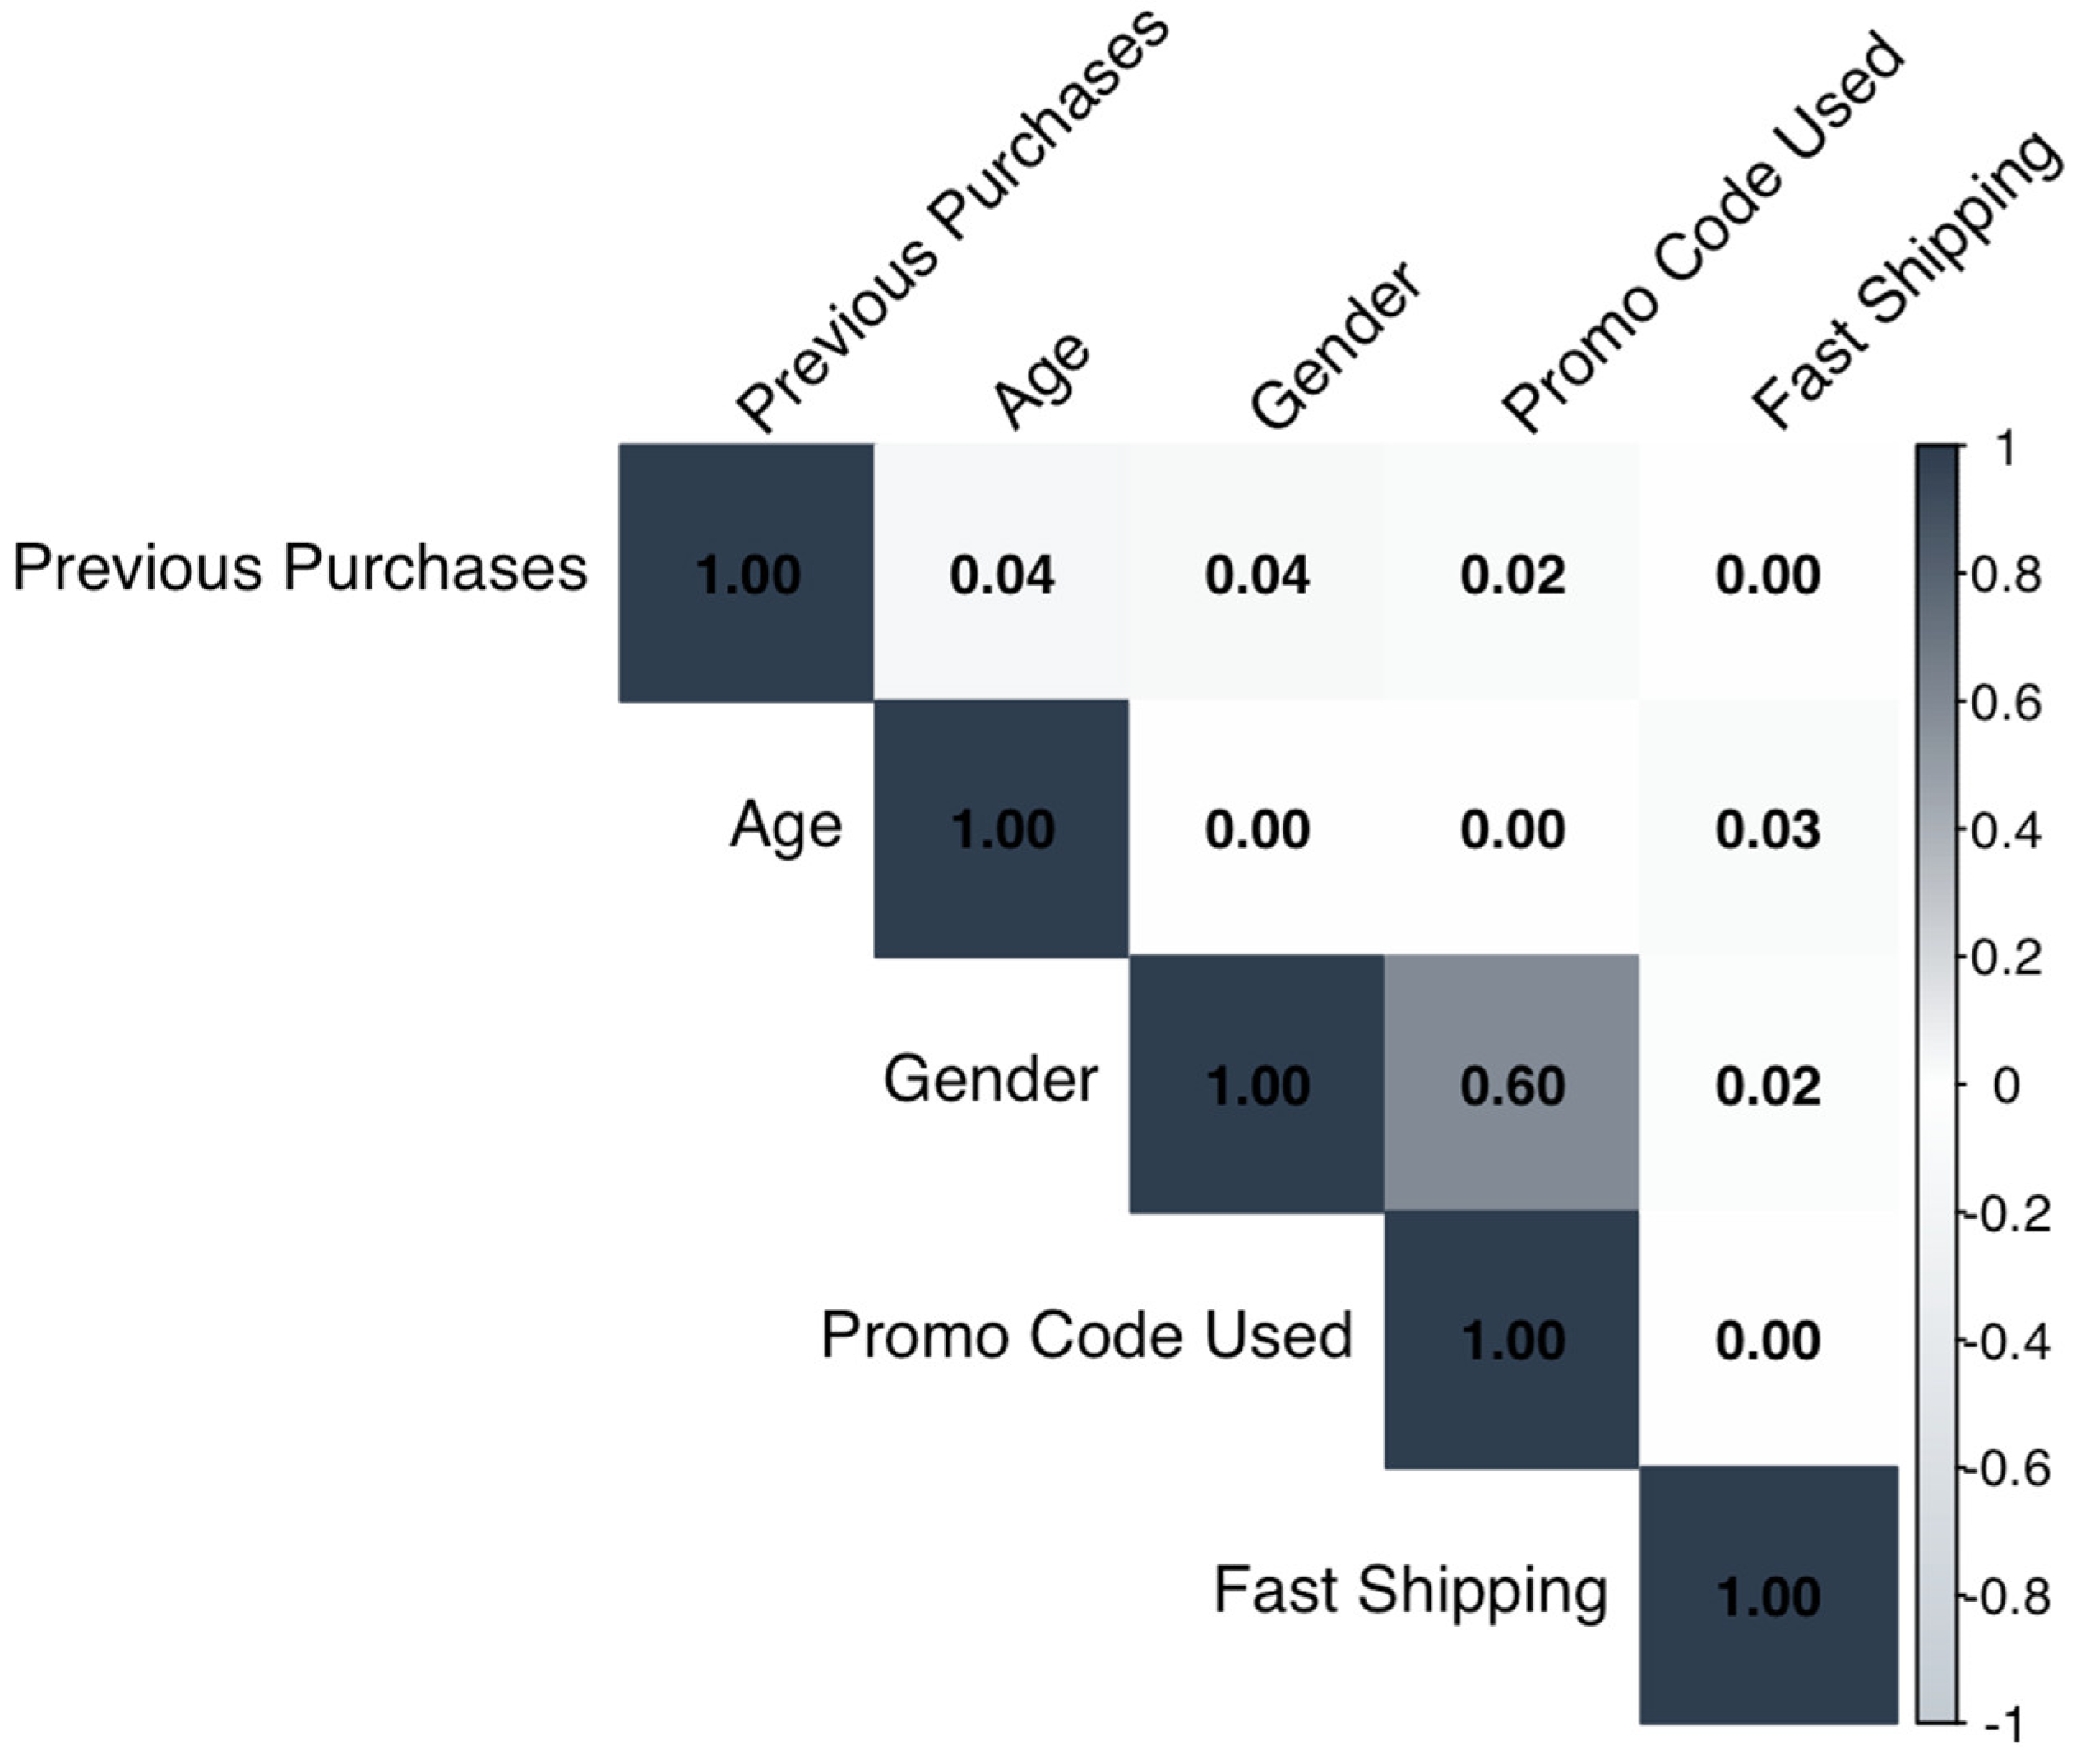
Before interpreting the regression results, basic assumption checks were conducted. Residuals appeared to be normally distributed and centered around zero, which suggested no major violations of linearity or homoscedasticity. A correlation matrix was used to assess multicollinearity among predictors. Most variables showed weak correlations, with the highest being between Gender and Promo Code Used (r = .60). No correlations showed levels of concern, which indicated acceptable independence between predictors.
Figure 1.
Correlation Matrix of Key Predictors and Log-Transformed Purchase Amount. Note: Confirms low correlation among predictors. The only moderate correlation is between Gender and Promo Code Used (r = 0.60). This low multicollinearity suggests the model isn’t distorted by overlapping predictors. All analysis code used to generate this and the following tables is available on GitHub (Beelen, 2025).
Visual Analysis of Group Means
A bar plot was made to visualize how the combination of promo code usage and shipping options affect spending behavior. This plot showed the predicted average purchase amount for each of the four possible combinations between promo code usage and fast shipping, for example if a customer did not use a promo code but did choose fast shipping.
As shown in Figure 2 below, the average purchase amount was not significantly higher for customers who used a promo code and chose the fast shipping options, compared to those who chose standard shipping in combination with promo code usage. Similarly, customers who did not apply a promo code at check out while selecting fast shipping spent similar amounts compared to customers who selected standard shipping without using a promo code. The differences between the two groups were slim, suggesting there was no meaningful interaction effect.
Regression Model Results
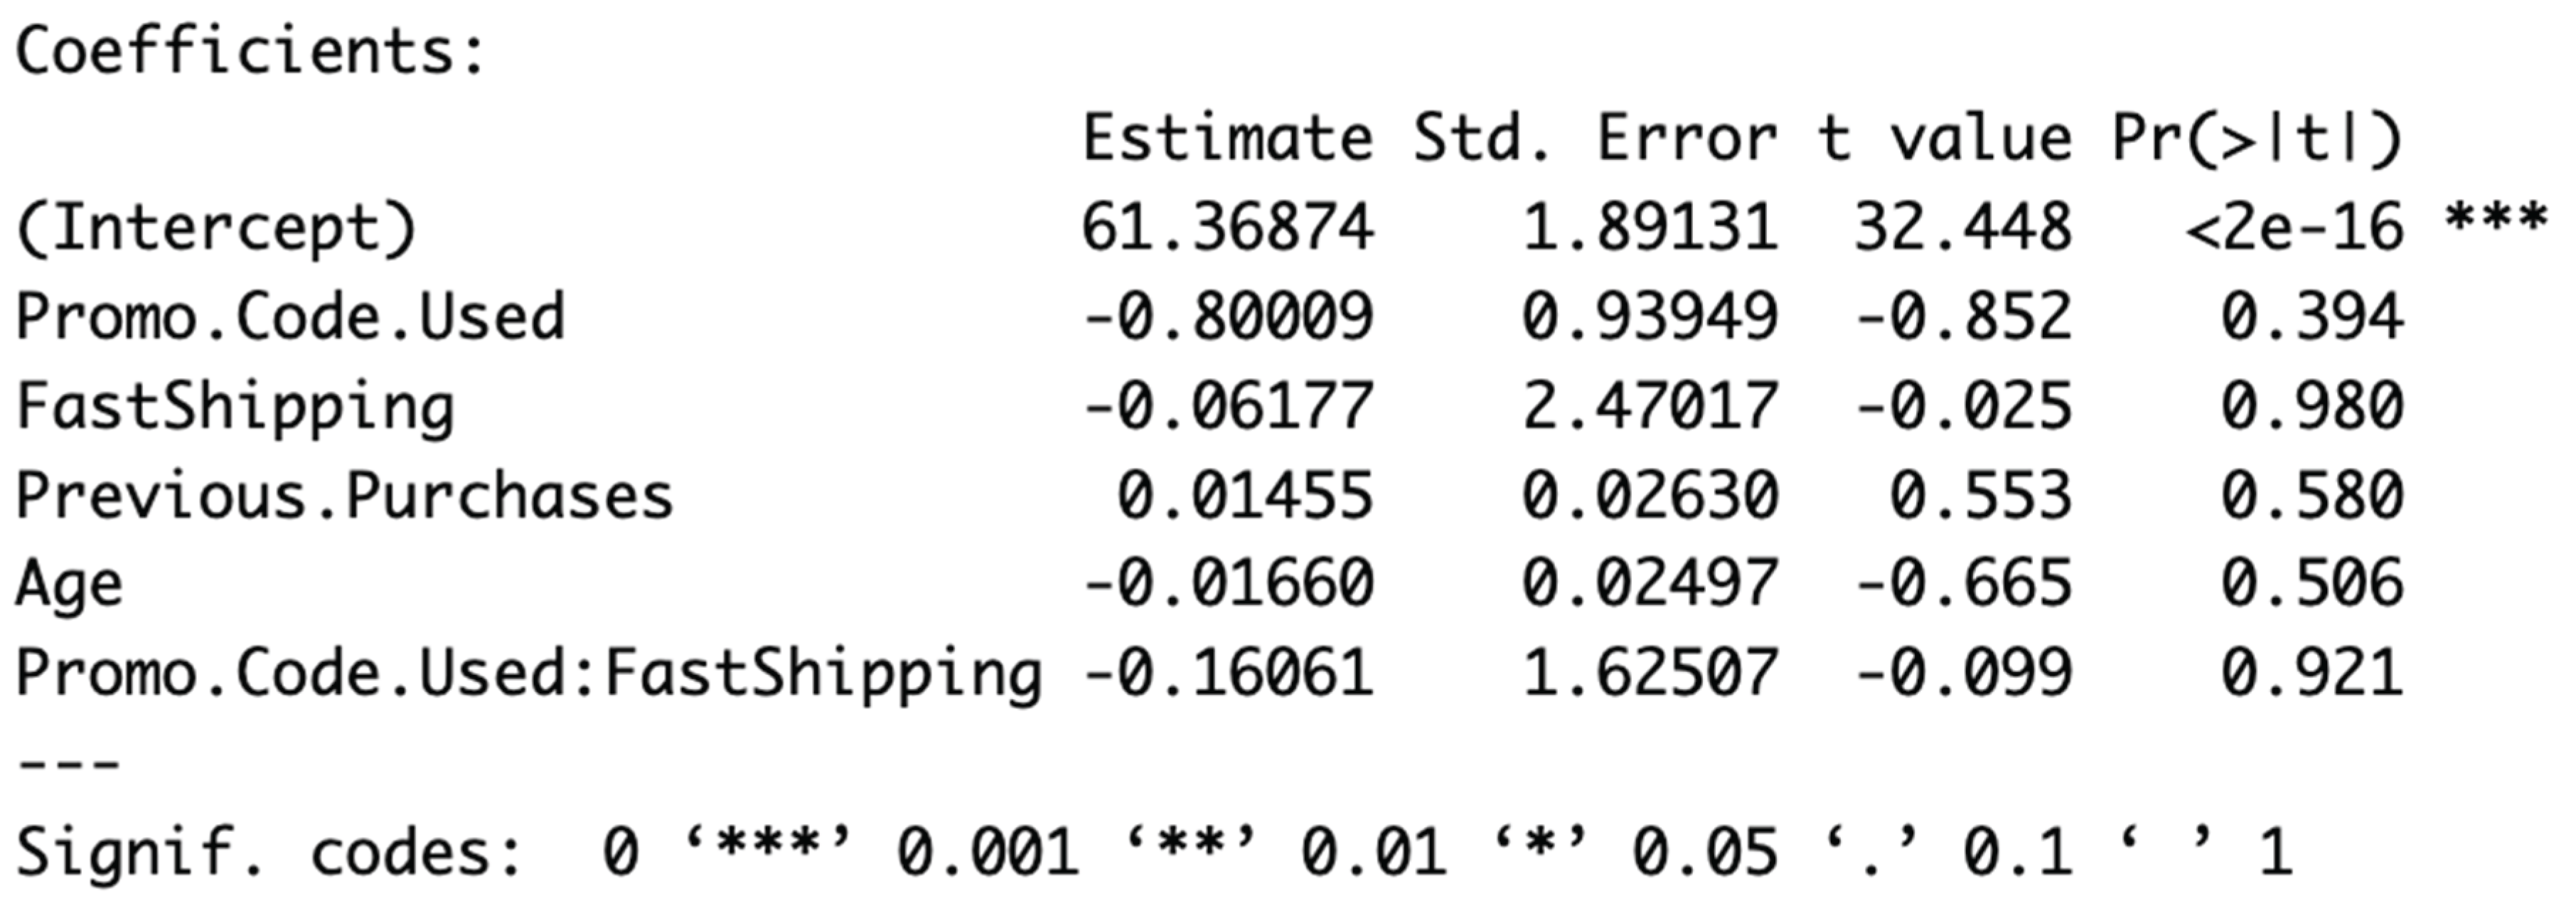
The linear regression model displayed the effect of promo code usage, fast shipping, previous purchases, customer age, and the combination of fast shipping with promo code usage. The regression outcome was summarized in Table 1 below.
While the intercept was highly significant and consistent, none of the predictors showed significance at the 0.05 threshold. Promo code usage even showed a negative coefficient, suggesting a slight decrease in purchase amount, but this effect had no statistical relevance.
Fast shipping did show a small negative coefficient, however this effect also had no statistical relevance with a p-value of 0.980. The interaction between promo code usage and fast shipping had a negative coefficient of -0.16, suggesting a slight decrease in purchase amount when promo code use and fast shipping were combined, but again, no statistical significance was found (p = 0.921).
Visualizing Model Results
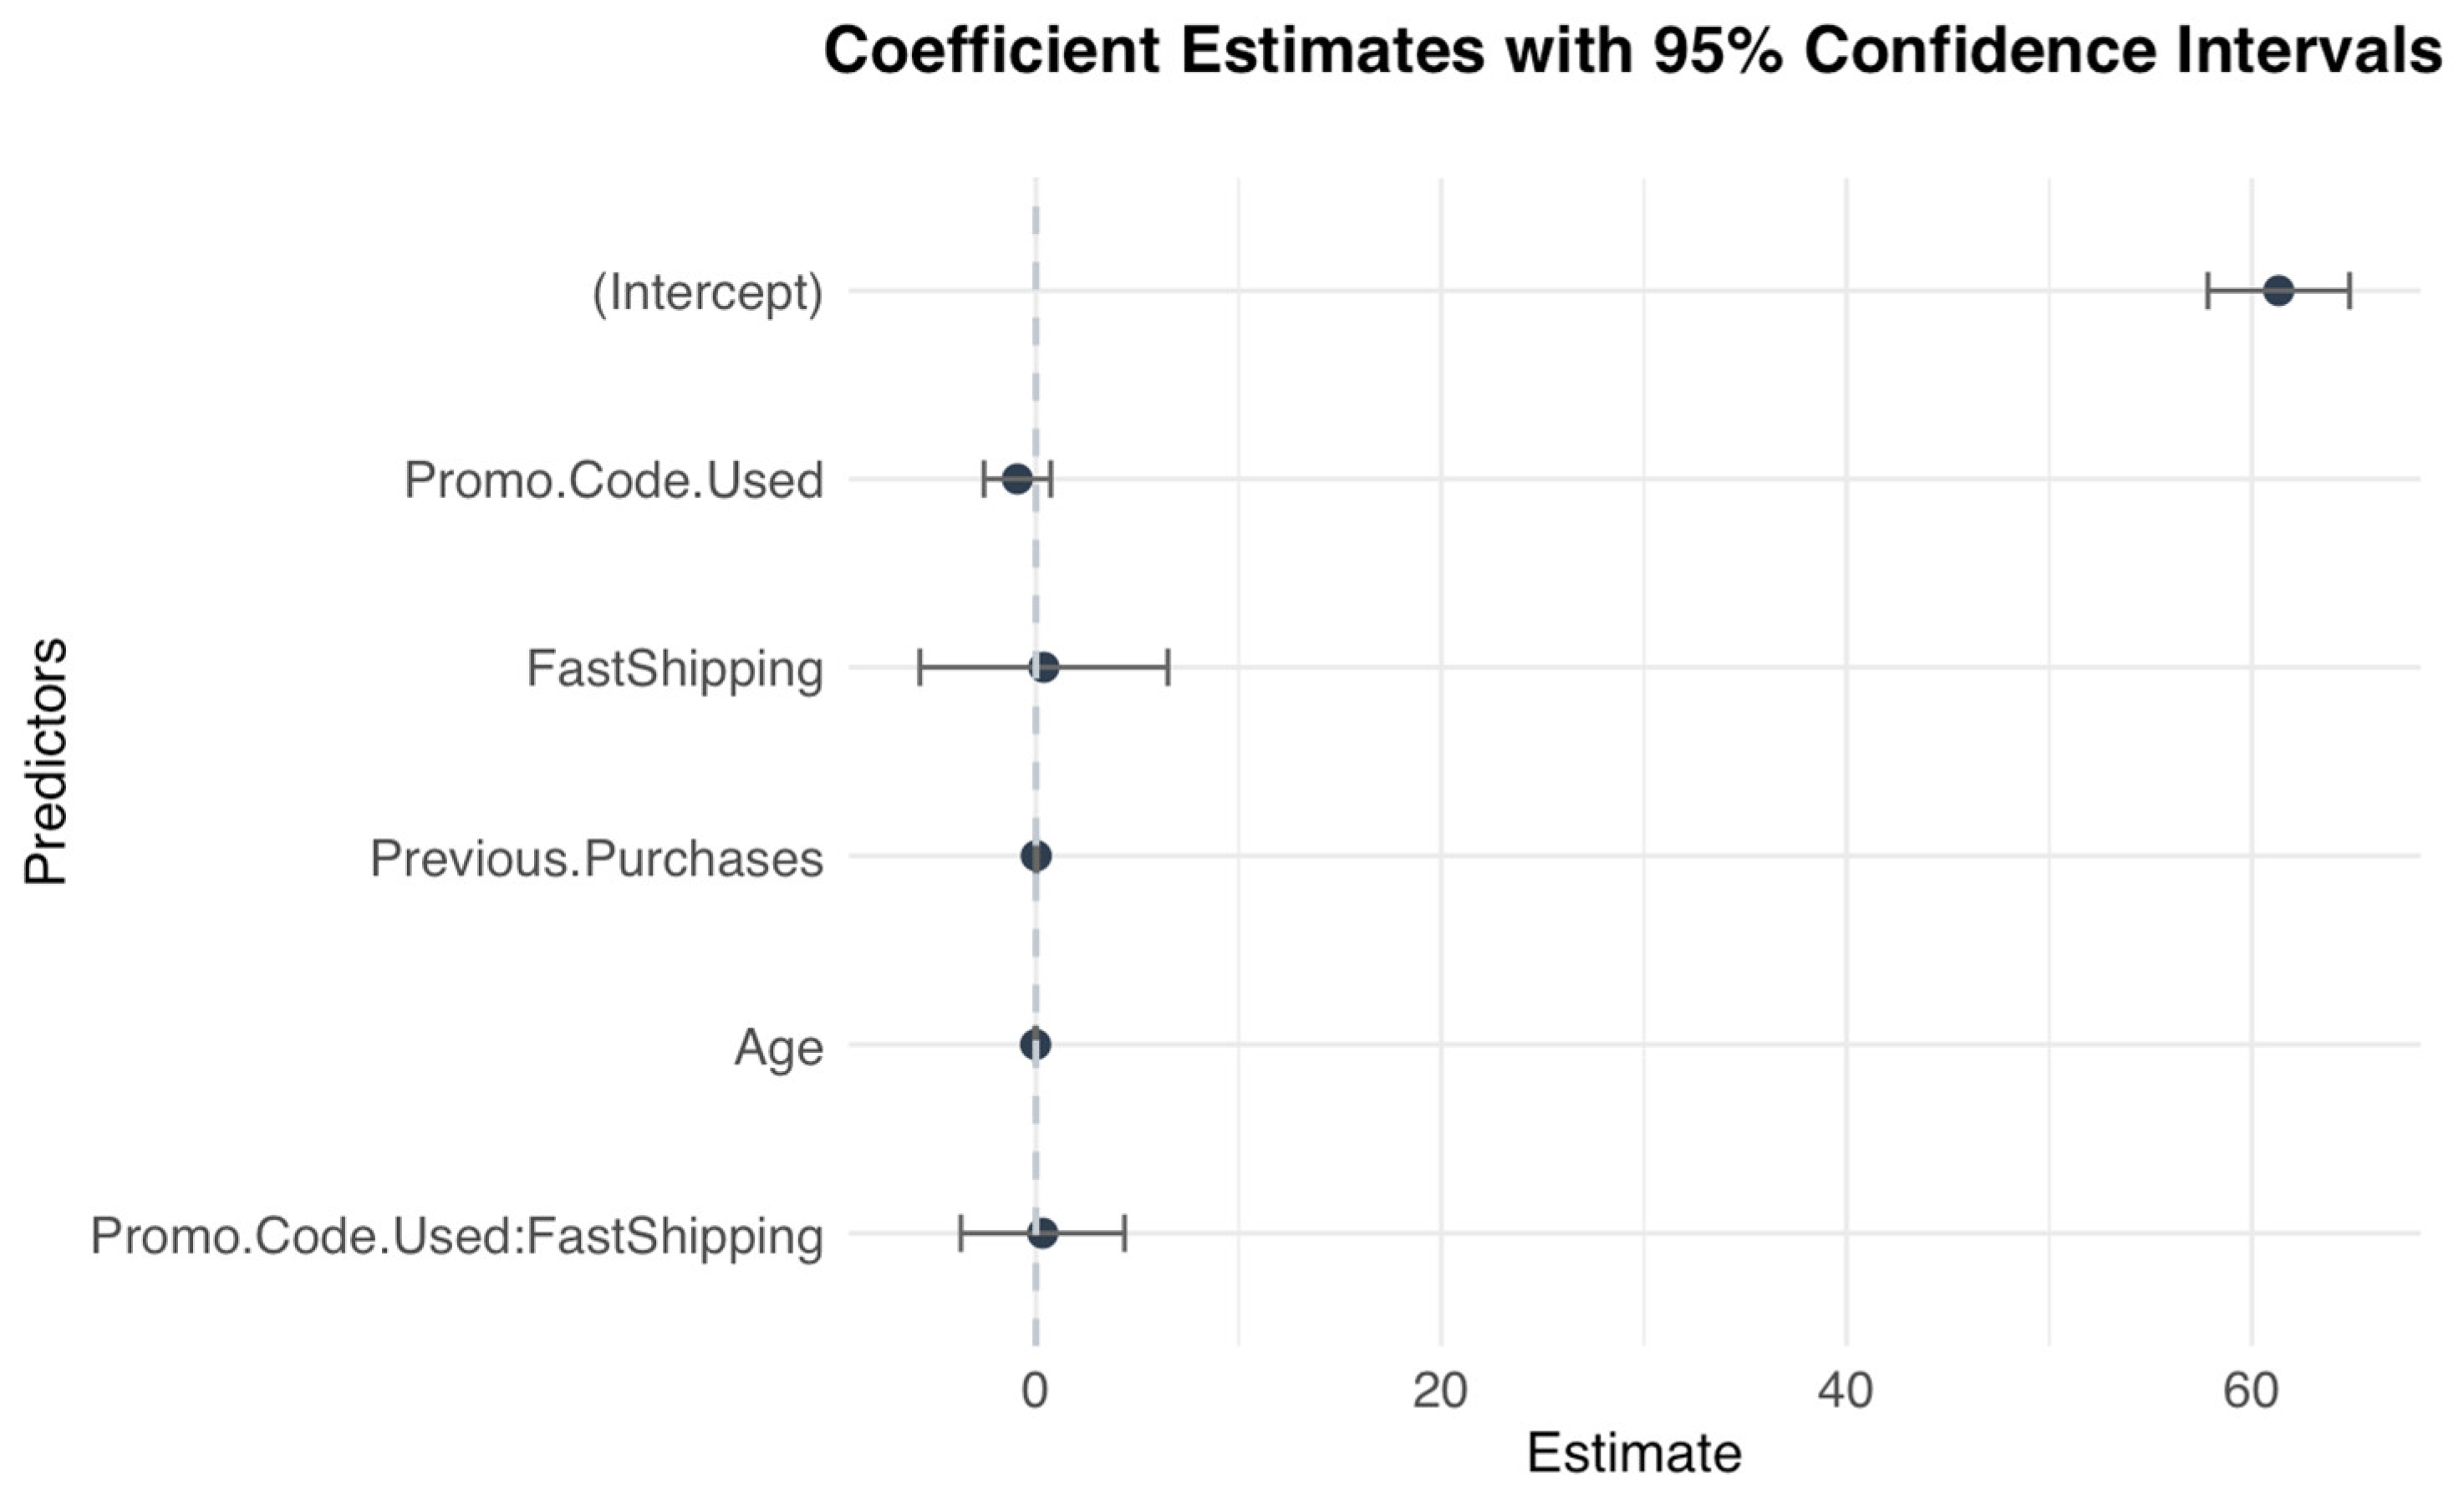
To illustrate the regression results, a coefficient plot with confidence intervals was made. This plot indicated clearly that the confidence intervals of all predictors crossed the zero lines, adding to the fact that the predictors lacked statistical significance. Fast Shipping was the most influential predictor visually, due to it having the largest absolute effect estimate out of all of the predictors, but the difference was small and did not pass the significance threshold.
Figure 3.
Coefficient plot with 95% confidence intervals. Note: Visualizes regression coefficients and their confidence intervals. Every predictor (except intercept) has a CI that crosses zero, including the interaction term Promo Code Used & FastShipping. This supports the statistical insignificance of both main effects and interaction effects.
SHAP Value Considerations
After evaluating all the models, the XGBoost model performed the best. Based on this, it was used to fit an additional model using SHAP values. However, the results of the SHAP analysis and the dependence plots showed flat patterns, which suggested that the model did not rely on promo code usage or shipping type when making predictions about customers’ spending behavior. These findings were in line with the results from the regression; the variables did not add any valuable contributions to explain variance in purchase amount.
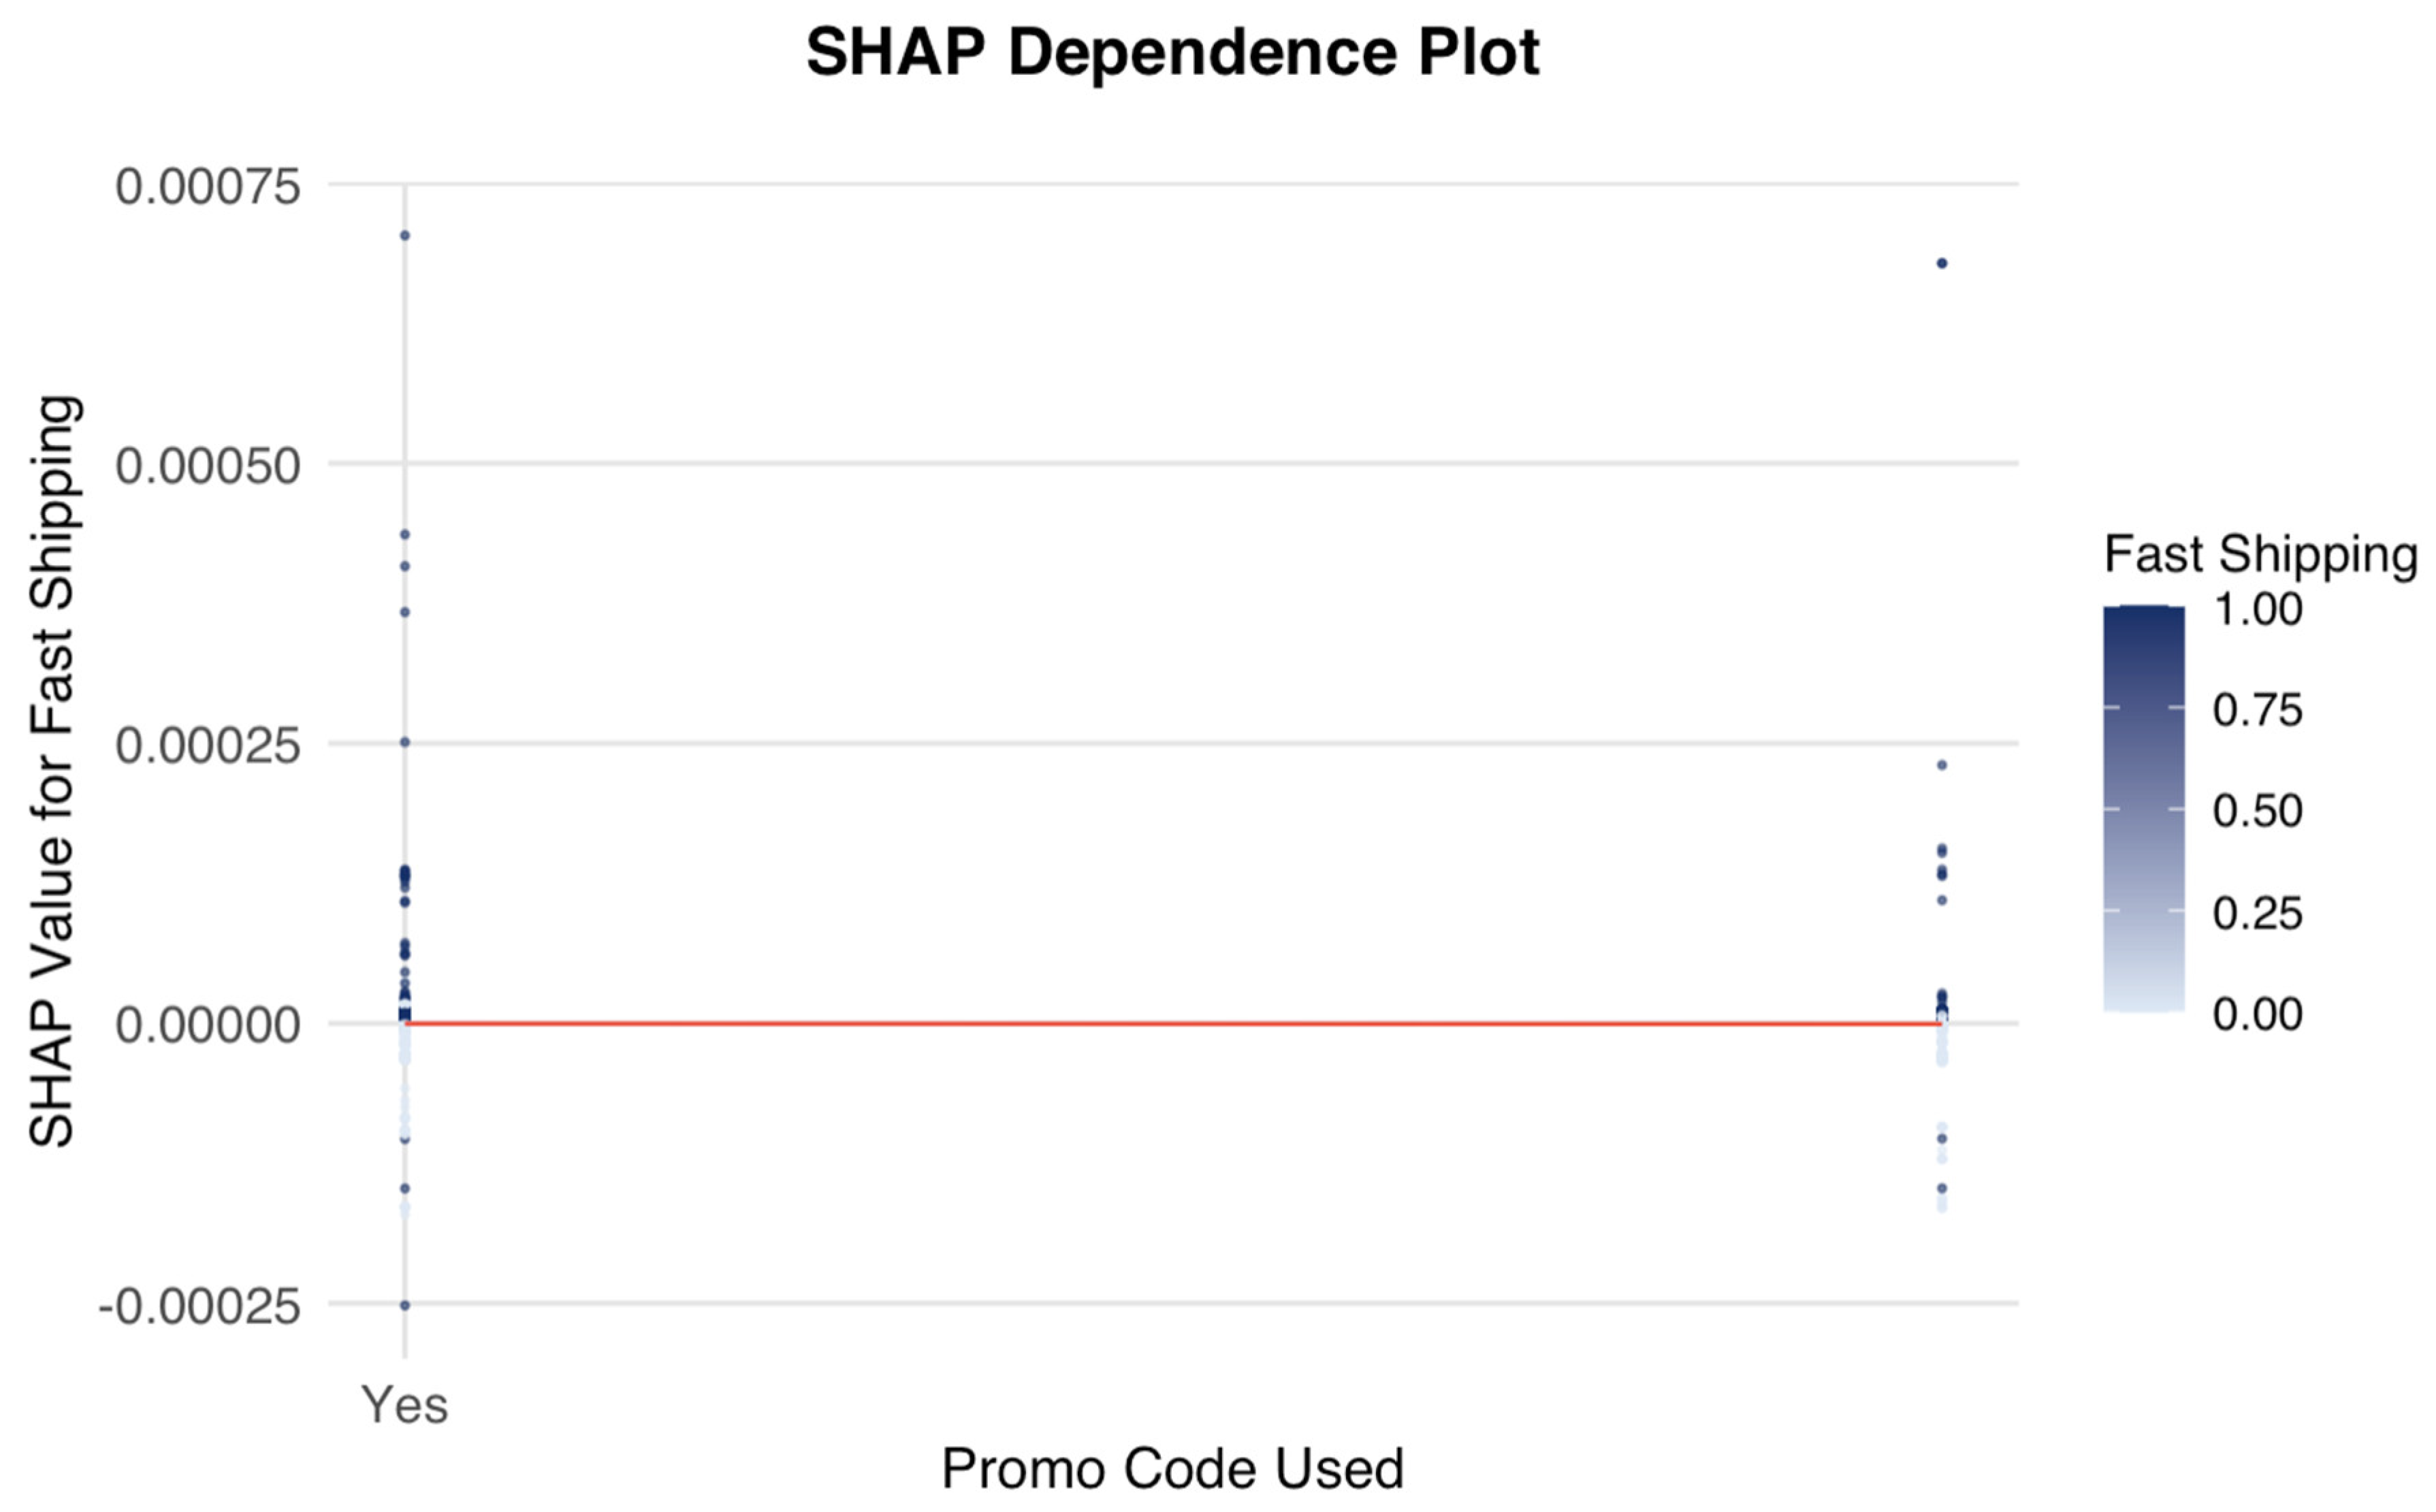
The SHAP dependence plot matched the results from the regression, showing no noticeable interaction between promo code usage and shipping type in influencing customer spending, as indicated by its flat line.
Figure 4.
SHAP dependence plot of Promo Code Used versus FastShipping. Note: This plot shows the SHAP values for FastShipping conditioned on whether a promo code was used. The y-axis (SHAP Value for Fast Shipping) reflects the feature’s contribution to model predictions. Almost all SHAP values are close to zero, indicating Fast Shipping has minimal predictive influence, regardless of promo code usage.
Exploring Feature Distribution
Diving deeper into these findings, a bar plot was made showcasing the number of customers who applied or did not apply a promo code across both standard and fast shipping. As previously mentioned, the imbalance in group sizes, especially when looking at fast shipping customers, may have led to an inability to detect an interaction effect.
Figure 5 showed that while promo code usage was mostly balanced, fewer customers who chose fast shipping also used promo codes. This imbalance might have partially explained the weak interaction, because that group was small, the sample may have lacked the power to detect subtle effects.
Model Fit and Residual Analysis
The overall model fit was poor. With the R-squared value only being 0.0007, there was an indication that the model explained less than 0.1 percent variance in purchase amount. The adjusted R-squared showed a negative value, which often suggested that the model had a worse fit compared to a simple mean-only model. The residual analysis did not show any serious violations, like heteroskedasticity or non-linearity. The residuals were symmetrically distributed around zero and relatively normal. However, the flatness of the residual distribution and low explanatory power confirmed that the predictors did not drive purchase amount.
Summary
All of the results combined rejected the hypothesis that a combination of promo code usage and fast or free shipping led to higher spending among customers. Both effects, and the interaction of the two, showed no statistical significance. The interaction showed a slight decrease in consumers’ purchase amount, but the difference was not statistically significant, as shown by the SHAP analysis. These findings suggested that spending behavior of customers might have been driven by other overlooked factors, like product type, timing of purchase, or browsing behavior.
The following chapter will discuss the possible implications of these findings, proposed potential explanations for the results, and suggested recommendations for future research.
Discussion
This chapter will reflect on the findings from the results chapter, looking into the implications within existing literature and the research objectives. The hypothesis suggested that the combination of promo code usage with fast shipping would lead to higher purchase amounts. However, the data did not support this. All analyses gave similar results; no meaningful effects were found. This chapter explores possible reasons for why no effects were found, and suggests how future research could learn from these findings and limitations.
Revisiting the Hypothesis
The research question focused on whether there was an effect between promo code usage and shipping types on consumer spending. Existing literature on marketing and behavioral theories, formed the belief that a combination would enhance the perceived value and lead to higher purchase amounts. However, the results of the regressions and models used in this study, found no significant effects.
The insignificant results showed that the expected results, that were based on literature, should have been reconsidered. While previous research had seen positive effects of promo codes and fast shipping independently, the assumption that their combination would increase that effect might have been made too easily. The results of this study showed that the impact of promo codes and fast shipping did not automatically magnify each other’s effect when looking at data about consumer’s shopping behaviors.
Comparing to Existing Research
Previous work, including studies by Grewal et al. (2010) and Anderson and Simester (2004), highlighted how framing and deal appeal could have influenced what people chose to buy. Those studies relied on controlled experiments or very detailed e-commerce datasets. In contrast, the data used in this study came from real-world observations, which inevitably brought in additional noise, factors like timing, product type, brand preference, or even how the website looked, none of which were able to be controlled for.
Another difference was how earlier research typically treated promotions and shipping options as separate levers. The approach in this study combined them as an interaction term, which had not been commonly explored. This was an interesting direction methodologically, though it came with limitations. This study might not have found significant results for the interaction, but that had potentially more to do with measurement noise than with the theoretical idea itself.
Model Behavior Versus Significance
One important takeaway from this study lay in how the models behaved, especially when examined through machine learning interpretation tools. Using SHAP values from the iml package gave insights into which features mattered most to the ensemble model’s predictions, even when traditional regression showed no clear effects.
The SHAP dependence plot’s flat line showed that the effect of Fast Shipping on predicted purchase amount did not change depending on whether a promo code was used. That indicated that this variable did not contribute much to prediction accuracy. These results were in line with the regression coefficient (−0.80) and its non-significant p-value (0.394). Fast shipping showed a similar pattern, with both a low impact and a high regression p-value (0.980). All methods used, consistently showed no effects, suggesting that there were indeed no effects found in this study.
Data Limitations and Potential Biases
The likely reason for these null results lay in the dataset’s structure. While the sample size was large, with around 3900 transactions, the imbalance between certain groups made it harder to detect possible interactions. Very few people both used a promo code and selected fast shipping. Figure 5 showed this clearly, with very few users in the hypothesized “synergistic” group.
Another limitation was the absence of time or context-based variables. The dataset did not provide the knowledge if the promo codes were limited-time offers or part of a seasonal push. Likewise, shipping choices were treated as fixed, even though customer urgency or expectations likely varied. These missing elements may have introduced bias by omitting important predictors.
Purchase amount was treated as a continuous outcome without breaking it down by product type or order composition. The dataset did not break down if one customer might have bought one single expensive item, or might have purchased multiple cheaper items. Without transactions being broken down by product, these opposite purchase behaviors looked similar, which made the total purchase amount harder to interpret.
Practical Implications
Even though support was not found for the original hypothesis, there were still useful insights for marketers. First, promo codes or shipping upgrades did not automatically lead to customers spending more. Businesses should have been careful not to assume that layering incentives always boosts spending. Based on the analyses in this study, tailoring promotions to a customer’s loyalty or history might have been more effective.
Second, the fact that past purchases, while not a strong predictor, were still more consistent than our main variables, suggested that retention could have been a more impactful strategy than trying to incentivize new purchases. Personalized follow-ups, loyalty rewards, and targeted offers could have made loyal customers feel more valued, and might have been more effective than offering the same discount to everyone.
Third, this study showed the importance of using A/B testing when reviewing combinations of marketing strategies. It was difficult to say if certain effects were caused by the tested tactics. Future studies would benefit from using different combinations, especially by using a factorial design. This will allow for potential interaction effects to be identified more clearly.
Methodological Reflection
Combining traditional regression with interpretable machine learning offered a balanced and informative approach. While neither showed significant effects, their similar results proved the findings to be true. SHAP helped indicate which predictors mattered to the model, which tended to be unclear in traditional black-box models.
Using statistical modeling in combination with interpretation tools like SHAP turned out to be valuable, allowing for cross-validation between the findings. SHAP was especially useful when there was a suspicion that non-linear or subtle interactions were at play. Even when findings were null, examining how the model made decisions could have guided future improvements in data collection or experimental design.
Suggestions for Future Research
Going forward, future research would benefit from datasets with more detail and context. Information such as when and what was bought, would allow for clearer modeling. Combining this kind of data analysis with insights from customer surveys, could help to better understand how people actually respond to different types of promotions.
Using experimental designs would also help clarify cause and effect. Instead of looking at past purchase data only, future research could simulate online shopping experiences where consumers were randomly assigned to different combinations of promotions. This would make it easier to tell whether combining promo codes with fast shipping truly drives behavior.
Finally, future models might benefit from accounting for differences between types of shoppers. The interaction that was expected by the hypothesis, might have only been found for certain groups, like high spenders of first-time buyers. By aggregating everyone into one model, those effects may have been lost.
Conclusion
While the main hypothesis was not supported, this study still offered important insights. The alignment between traditional and machine learning models gave us confidence in our findings, and it served as a reminder not to overgeneralize what seemed like intuitive marketing strategies. This study emphasized once again that consumer decisions tended to be more complex than expected. Future research should use more extensive data to better understand consumer decisions. Only then could we truly understand how layered incentives shaped purchasing behavior.
Conclusion
This study examined if combining two commonly used marketing tactics, promo codes and fast shipping, led to customers spending more money in an e-commerce setting. Previous research had already established that promotions and logistics played individual roles in shaping consumer behavior, where this study put the focus on their potential interaction. The hypothesis was based on the idea that financial incentives and convenience benefits would strengthen the effect of one another and influence customer spending. After multiple types of analyses, no significant effects were found to support that assumption. In other words, the combination of a promo code and shipping type did not seem to influence how much people spent.
Understanding the Null Result
The absence of significant results may have initially seemed like a disappointing outcome, especially given the logic behind the hypothesis. Many marketing campaigns relied on this logic. But the results of this study suggested that such combinations might not have been as influential as previously believed, at least not in terms of increasing total spend.
There were a few possible explanations. Some customers may have simply taken advantage of a promo code or fast shipping without spending more overall. A discount might have just lowered the cost of an item they already intended to buy. Other customers may have responded to these offers by making a purchase, not by increasing basket size. This difference between conversion behavior and purchase amount mattered, but often got lost when the focus lay on whether a customer converted, not on how much they spent. Lastly, customers’ preferences and shopping intentions differed more than was assumed, and marketing strategies focusing on the combination of discounts and express shipping might not have enhanced their experience, it just checked two boxes without creating a multiplier effect.
Limitations and Considerations
While this study used a real-world dataset that included transactional and demographic data, some limitations had to be acknowledged. The lack of product-level information, such as what items were bought or their prices, limited the ability to know whether a high purchase amount meant that a customer bought one expensive item or several cheap ones. Without this context, it was difficult to fully understand what a higher purchase amount represented.
Additionally, while the dataset included demographics and past behavior, it did not include attitudinal or psychographic data. Both variables often played a central role in purchase decisions. Customer data on brand loyalty, their buying urgency, or lack of intent to spend, was missing from the dataset. These were all factors that could have explained how promotions and shipping options were perceived, and how effective they were.
The study used an observational design, meaning that there was no random assignment to promotional or shipping conditions. While statistical controls were used, there remained a possibility that unobserved variables influenced both the independent and dependent variables. To control for that, randomized design could have better suited the testing of causal effects.
Strengths of the Approach
Despite these limitations, the study’s analytical approach did have several strengths. Combining traditional regression modeling with machine learning methods, allowed interaction effects to be detected. The use of SHAP values added to the XGBoost model showed insights into which variables had the most impact on the predictions. Visualizations helped demonstrate the results in an easy to interpret format. Multiple approaches gave the same outcomes, increasing the confidence in the results, even when it showed a lack of an effect. In the same direction, it increases confidence in what had been observed, even when it showed an absence of effect.
Implications for Marketing Practice
For marketers, these findings suggested that the effectiveness of promotions and shipping strategies was not immediately written off, but that their value just might not have increased purchase amount directly. They might have been more effective at reducing cart abandonment, encouraging repeat purchases, or improving satisfaction.
This also highlighted the importance of experimental testing. Rather than relying on assumptions, businesses should A/B test combinations of promotional and logistical elements to explore what works best for different customer types. Only by doing so, businesses csn understand what offers work together and for whom.
Directions for Future Research
Future studies could further expand on this work. For example, by running a controlled experiment where customers shop in a simulated environment and are randomly assigned to different combinations of discounts and shipping offers. That kind of design would give stronger insights into potential effects.
Another idea would be to integrate product-level data, so researchers can distinguish between changes in item count, item value, and product type. Combining this with richer behavioral data, like browsing time, click paths, or referral source, might reveal interaction effects that were not detectable in the current study. Certain interaction effects might exist, but only for certain kinds of users; first-time buyers, high-frequency shoppers, or people who browse without checking out. Without that level of detail, effects could easily be overlooked.
Lastly, would be involving qualitative research. Interviewing customers directly on their thoughts about certain offers, could uncover the trade-offs they’re willing to make, and whether certain combinations were preferred over others. Understanding customers’ preferences and help understand the failure of certain combinations in increasing spend.
Final Reflection
At the start of this study, it seemed likely that the combination of a promo code with fast or free shipping would have made customers spend more. While the assumption was based on theory and often backed by marketing strategies, the data did not support it. While it was possible that effects existed under specific conditions, this analysis found no evidence that such combinations indeed increase purchase amount.
That outcome did not diminish the relevance of promotional and logistical tactics in marketing, it simply suggested the need for reframing the understanding of their impact. Rather than assuming that these marketing tactics amplified spending, a focus on shaping brand trust, satisfaction, or perception might have been more important. While the marketing tools remain useful, the marketing outcomes might be more subtle and context dependent than simple models assume.
In the end, this study served as a reminder that consumer behavior could not be understood through assumptions alone. Promotions and shipping types were just two of many moving parts within the customer journey. This research offered not a prescription, but a perspective; a view of what did not drive purchase amount in today’s e-commerce landscape.
References
- nderson, E. T., & Simester, D. I. (2004). Long-run effects of promotion depth on new versus established customers: three field studies. Marketing Science, 23(1), 4-20. [CrossRef]
- slan, S., (2023). Consumer behavior and shopping habits dataset [Dataset]. Kaggle. https://www.kaggle.com/datasets/zeesolver/consumer-behavior-and-shopping-habits-dataset.
- eelen, B., (2025). Code for purchase behavior thesis [Source code]. GitHub. https://github.com/bfacbeelen/finalthesis.
- DelVecchio, D., Henard, D. H., & Freling, T. H. (2006). The effect of sales promotion on post-promotion brand preference: A meta-analysis. Journal of Retailing, 82(3), 203–213. [CrossRef]
- Dholakia, U. M., & Simonson, I. (2005). The effect of explicit reference points on consumer choice and online bidding behavior. Marketing Science, 24(2), 206–217. [CrossRef]
- Green, P. E., & Srinivasan, V. (1978). Conjoint analysis in consumer research: Issues and outlook. Journal of Consumer Research, 5(2), 103–123. [CrossRef]
- Grewal, D., Ailawadi, K. L., Gauri, D., Hall, K., Kopalle, P., & Robertson, J. R. (2011). Innovations in retail pricing and promotions. Journal of Retailing, 87(1), 43–52. [CrossRef]
- Kahneman, D., & Tversky, A. (1984). Choices, values, and frames. American Psychologist, 39(4), 341–350. [CrossRef]
- Kaufmann, P. J., Smith, N. C., & Ortmeyer, G. K. (1994). Deception in retailer high-low pricing: A “rule of reason” approach. Journal of retailing, 70(2), 115-138. [CrossRef]
- Kwon, W. S., & Noh, M. (2010). The influence of prior experience and age on mature consumers’ perceptions and intentions of internet apparel shopping. Journal of Fashion Marketing and Management: An International Journal, 14(3): 335–349. [CrossRef]
- Lewis, M. (2006). The effect of shipping fees on customer acquisition, retention, and purchase quantities. Journal of Retailing, 82(1), 13–23. [CrossRef]
- Lewis, M., Singh, V., & Fay, S. (2006). An empirical study of the impact of nonlinear shipping and handling fees on purchase incidence and expenditure decisions. Marketing Science, 25(1), 51–64. [CrossRef]
- Lichtenstein, D. R., Ridgway, N. M., & Netemeyer, R. G. (1993). Price perceptions and consumer shopping behavior: A field study. Journal of Marketing Research, 30(2), 234–245. [CrossRef]
- Stremersch, S., & Tellis, G. J. (2002). Strategic bundling of products and prices: A new synthesis for marketing. Journal of Marketing, 66(1), 55–72. [CrossRef]
- Thaler, R. (1985). Mental accounting and consumer choice. Marketing Science, 4(3), 199–214. [CrossRef]
- Wollenburg, J., Holzapfel, A., Hübner, A., & Kuhn, H. (2018). Configuring Retail Fulfillment Processes for Omni-Channel Customer Steering. International Journal of Electronic Commerce, 22(4), 540–575. [CrossRef]
Figure 2.
Bar plot of average predicted purchase amount by promo code usage and shipping type. Note: Each bar represents the average predicted purchase amount for each promo–shipping combination, showing only minimal variation across conditions.
Figure 2.
Bar plot of average predicted purchase amount by promo code usage and shipping type. Note: Each bar represents the average predicted purchase amount for each promo–shipping combination, showing only minimal variation across conditions.
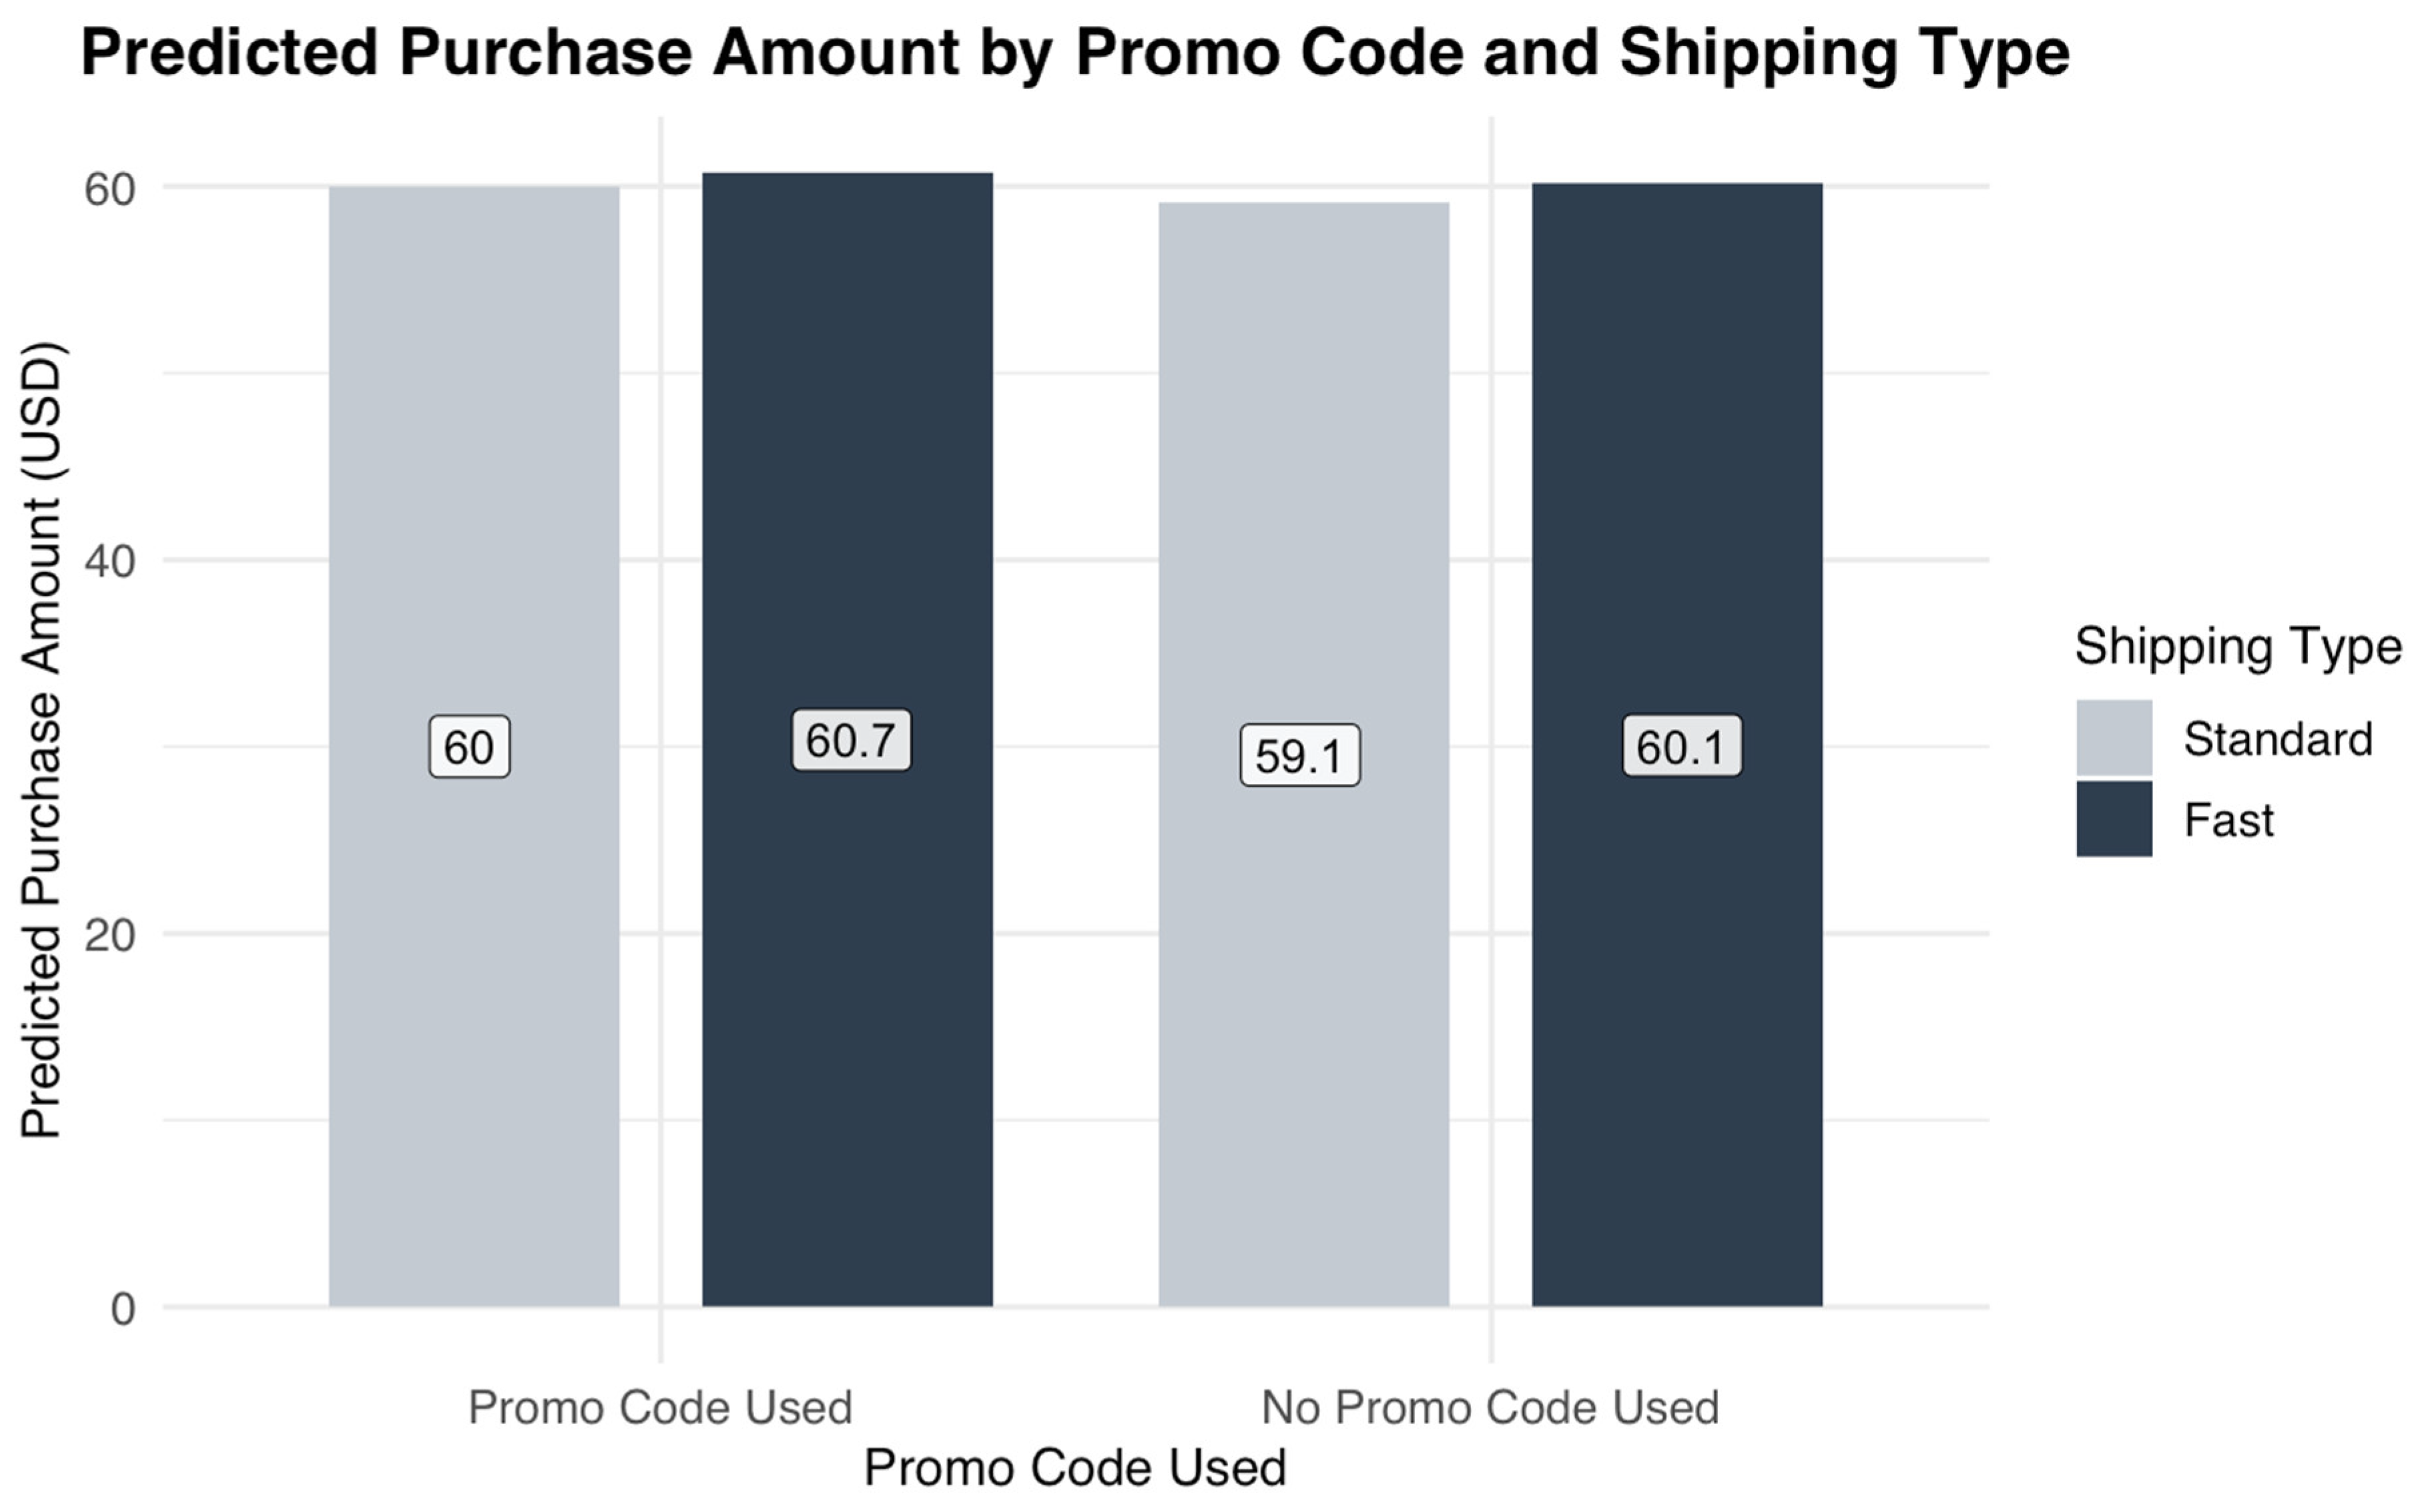
Figure 5.
Promo Code Usage by Shipping Type. Note: This plot shows that standard shipping was used more frequently than fast shipping regardless of promo code usage, with promo codes being more commonly applied overall.
Figure 5.
Promo Code Usage by Shipping Type. Note: This plot shows that standard shipping was used more frequently than fast shipping regardless of promo code usage, with promo codes being more commonly applied overall.
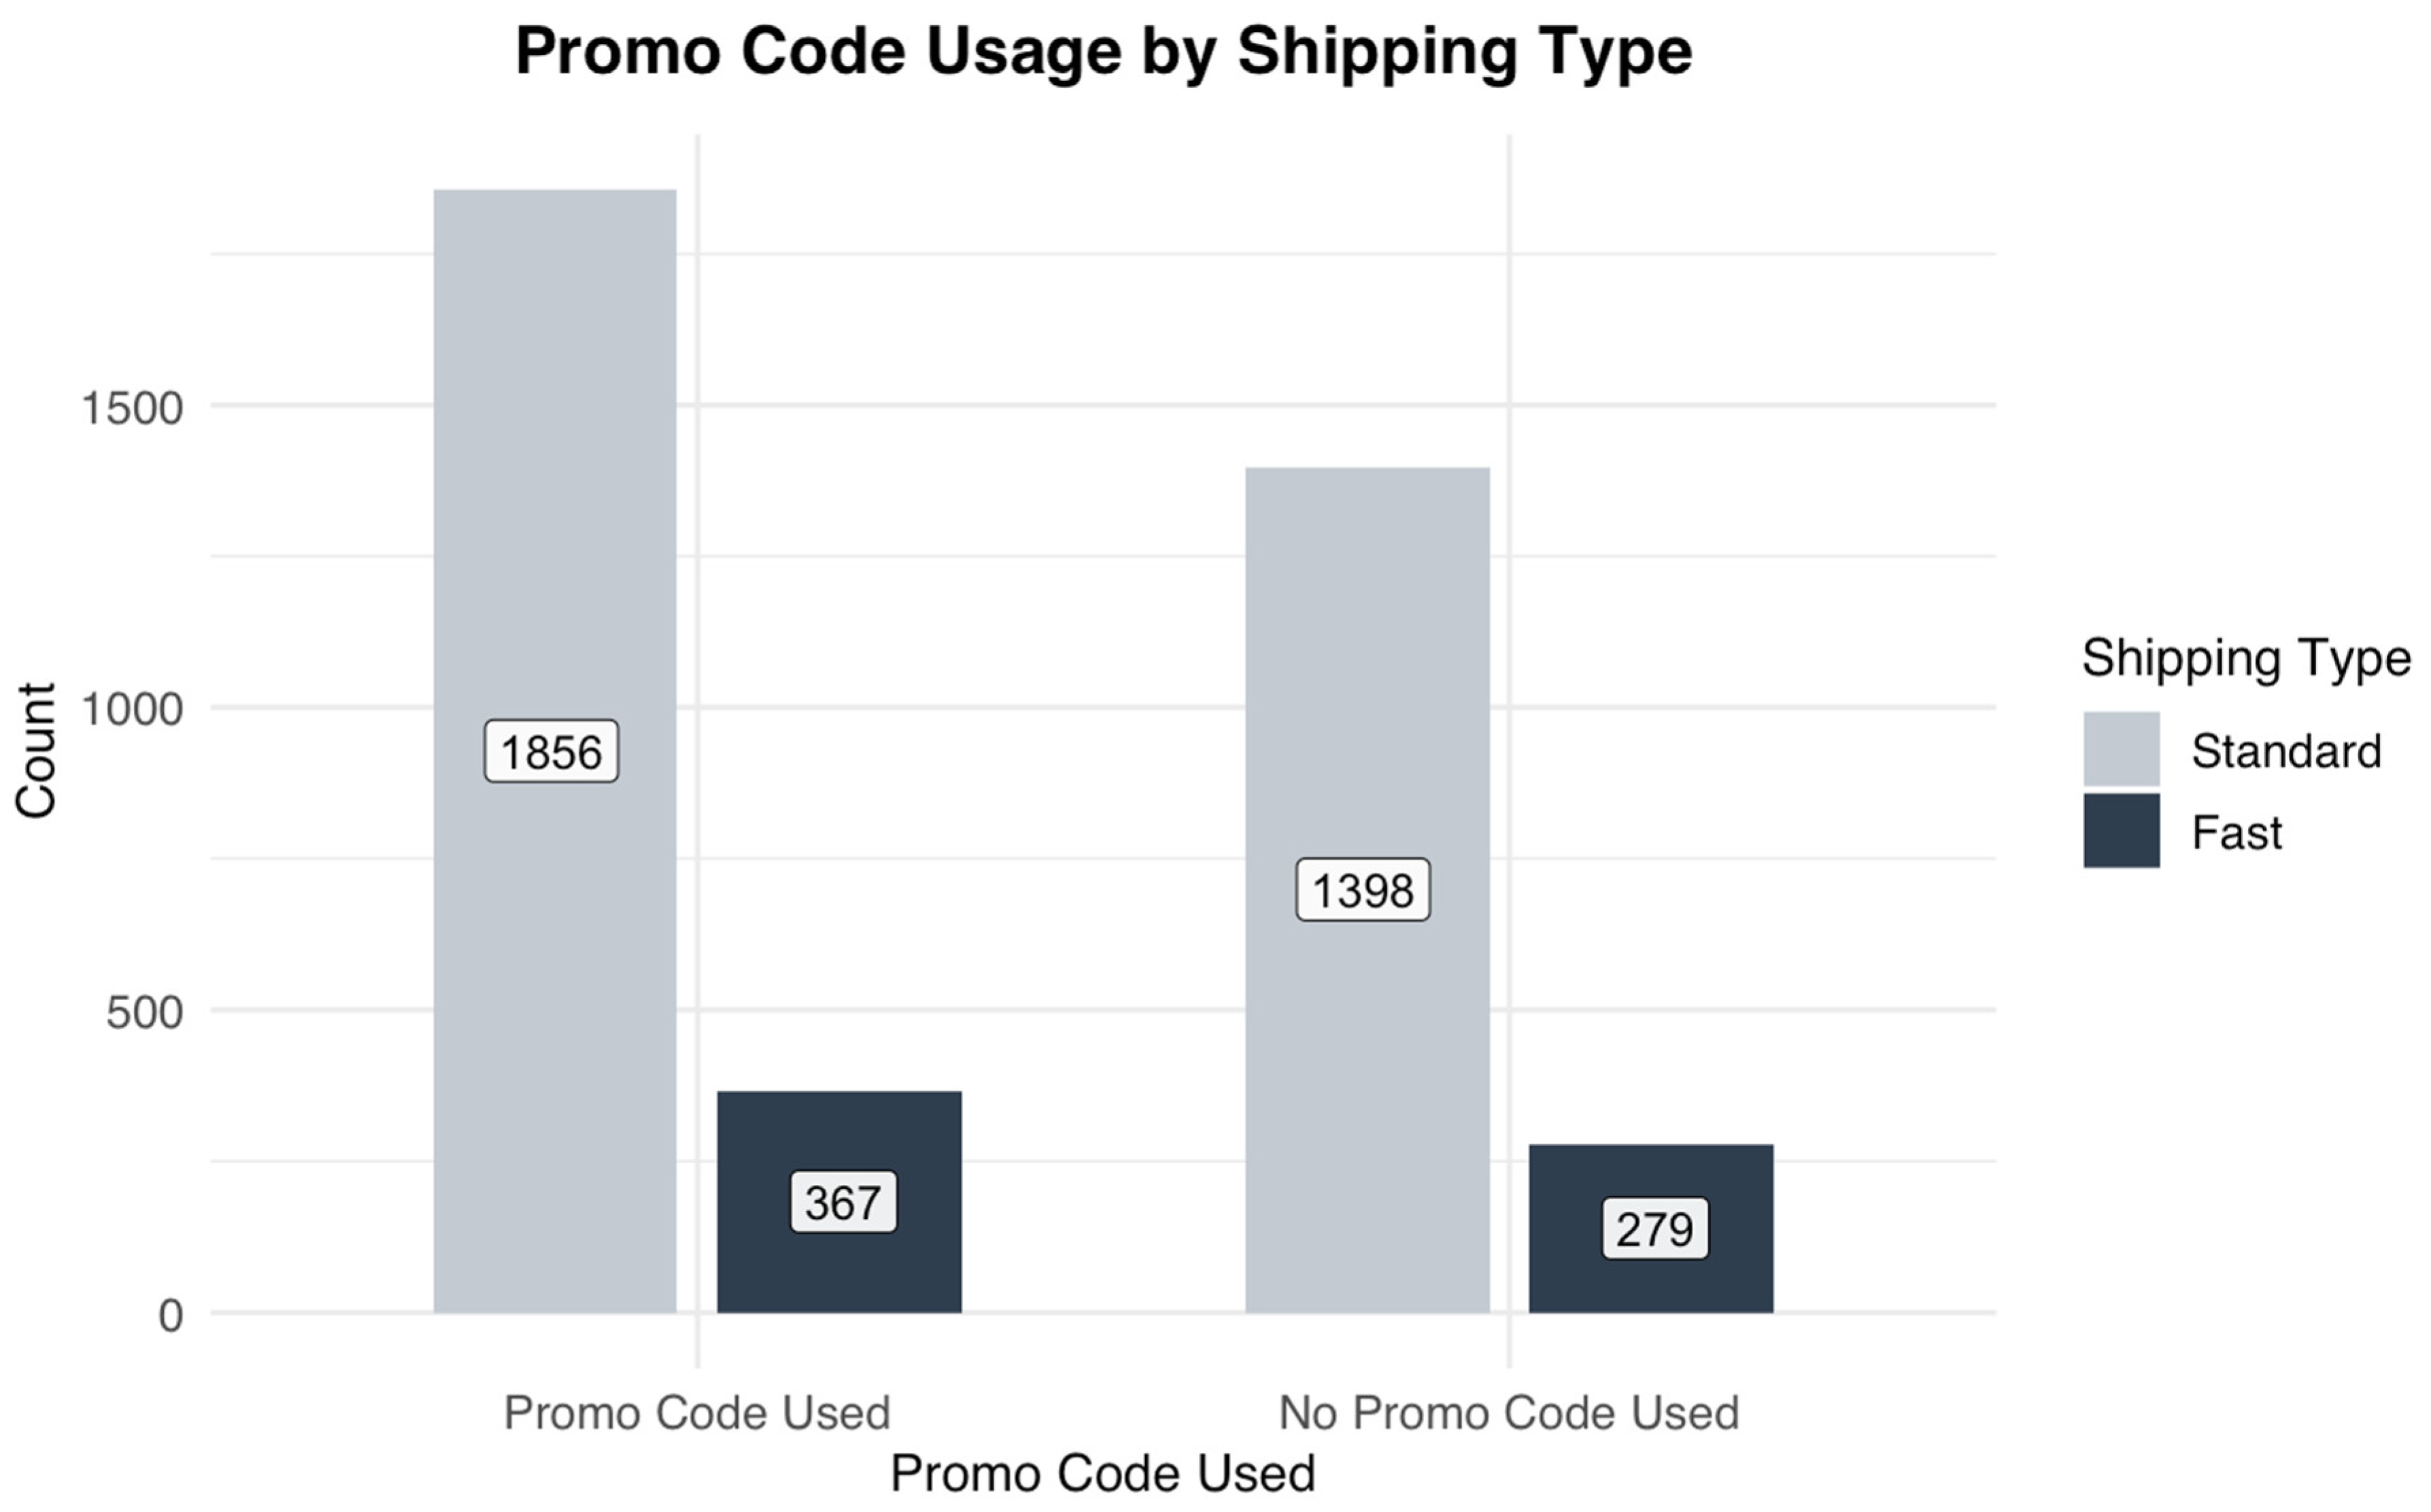

Table 1.
Linear Regression Output. Note: The regression results indicate that none of the predictors, including
the interaction term, significantly influenced purchase amount.
Table 1.
Linear Regression Output. Note: The regression results indicate that none of the predictors, including
the interaction term, significantly influenced purchase amount.
Disclaimer/Publisher’s Note: The statements, opinions and data contained in all publications are solely those of the individual author(s) and contributor(s) and not of MDPI and/or the editor(s). MDPI and/or the editor(s) disclaim responsibility for any injury to people or property resulting from any ideas, methods, instructions or products referred to in the content. |
© 2025 by the authors. Licensee MDPI, Basel, Switzerland. This article is an open access article distributed under the terms and conditions of the Creative Commons Attribution (CC BY) license (http://creativecommons.org/licenses/by/4.0/).
Copyright: This open access article is published under a Creative Commons CC BY 4.0 license, which permit the free download, distribution, and reuse, provided that the author and preprint are cited in any reuse.


