Submitted:
06 August 2025
Posted:
09 September 2025
You are already at the latest version
Abstract
Traditional marketing attribution models evaluate past campaign performance but offer limited input for future actions. This thesis bridges that gap by developing predictive models that use actual user path data to forecast revenue and guide future campaign decisions. We address three key questions: (1) predicting revenue from completed marketing paths, (2) identifying the most effective campaign to convert a mid-journey user, and (3) recommending the next-best campaign step for revenue maximization. Using e-commerce user path data from the Google Merchandise Store, we apply Random Forest, XGBoost, and ensemble techniques across various user journey segments. Our analysis demonstrates high predictive accuracy in revenue forecasting and mid-journey campaign identification. While the third model provides directional insights, its use of proxy labels presents methodological limitations that are thoroughly discussed. This research concludes with recommendations for future work in real-time personalization, counterfactual modeling, and the operational deployment of predictive marketing systems.
Keywords:
predictive modeling
; user journey
; e-commerce
; marketing campaigns
; revenue forecasting
; conversion prediction
; machine learning
Introduction
With digital marketing budgets growing annually (Cramer-Flood, 2024), businesses are under increasing pressure to optimize marketing campaign performance through smarter, data enabled decision-making. Commonly used attribution models, such as first-touch, last-touch, or linear, generally aim to assign credit for conversions to specific touchpoints in a customer’s journey that occur before conversion. This is done so that marketers can evaluate campaign performance and make decisions regarding budget allocation, audience targeting, and so on. However, these models are mostly retrospective in nature. They help understand past performance but are limited in their ability to guide future decisions on campaign targeting (Shao & Li, 2011; Li & Kannan, 2014). This is still done based on intuition and reactive analyses. As user journeys become increasingly nonlinear and spread across multiple platforms (online & offline), marketers require more robust methods that can handle sequential dependencies, campaign sequences, and predictive forecasting (Berman, 2018; Kumar & Reinartz, 2018).
Problem Statement
As we have seen, traditional marketing attribution models such as last-click, first-click, or time decay offer only a retrospective view of campaign effectiveness, assigning credit for conversions based on predefined heuristics (Shao & Li, 2011). These models often fail to account for the complex and nonlinear nature of modern user journeys across channels and timeframes (Lemon & Verhoef, 2016). As a result, they are unable to answer forward-looking questions such as which campaign should be employed next or how much revenue a particular user path will yield. Without this predictive insight, marketing teams cannot optimally personalize experiences or allocate budget dynamically. This leads to inefficiencies in planning and targeting during customer acquisition, over-reliance on heuristics, and missed opportunities for revenue maximization (Berman, 2018; Bucklin & Sismeiro, 2009).
Research Significance
This research is important in both academic advancement and practical real-world applications. From an academic perspective, it extends the domain of marketing analytics by shifting the focus from historic attribution to forecasting and prescriptive modeling, an area still underexplored in user journey analysis (Abhishek et al., 2012; Anderl et al., 2016). From an industry standpoint, it presents a data-driven framework that enables marketers to anticipate user behavior and recommend proactive campaign steps, rather than reactively analyzing past performance. The ability to simulate outcomes for mid-journey users and suggest optimal paths offers a competitive advantage in environments where customer attention is fleeting and personalization is paramount (Kumar & Reinartz, 2018).
Research Questions and Hypotheses
- RQ1: Can we predict the revenue that will result from a specific user journey path after making a purchase?
- H1: Marketing paths with greater diversity and more touchpoints will result in higher predicted revenue (Montgomery et al., 2004; Verbeke et al., 2012). This hypothesis is based on the idea that users who are shown diverse campaigns have better brand recall and purchase intent.
- RQ2: If a user has completed a partial journey without converting, which campaign is most likely to lead to a purchase in the end?H2: Campaigns that frequently appear just before conversion in historical data are more likely to convert users mid-journey (Xu et al., 2014; Ren et al., 2018). This assumes that certain campaigns have a higher last-touch impact due to their persuasive positioning.
- RQ3: If a user has completed a partial journey without converting, what is the best next campaign step to maximize revenue?
- H3: Machine learning models can simulate next-step recommendations that improve expected revenue compared to random selection ((Tao et al., 2023). This presumes that structured journey data encodes learnable patterns about campaign sequencing and conversion outcomes.
Objectives
- To develop regression models capable of forecasting revenue and campaigns based on completed user journeys using marketing campaign user path data.
- To design classification models that can identify the most likely converting campaign for users who are already partway through a campaign journey.
- To simulate next-step campaign decisions using path truncation and evaluate their revenue-maximizing potential via predictive modeling.
- To compare model performance using metrics like RMSE, R², and classification accuracy, and translate these findings into actionable marketing strategy insights within e-commerce.
- To validate the utility of machine learning as a prescriptive tool for customer journey optimization in real-world campaign planning contexts (Fildes et al., 2008).
Limitations
This study relies on data from the Google Merchandise Store, an e-commerce platform that may not reflect the complexity of multi-product or subscription-based businesses. Thus, the external validity of the results may be limited when applied to other industry verticals. Additionally, the dataset lacks contextual and demographic variables such as user location, device type, referral source, or segmentation attributes, which are often critical in campaign personalization and targeting (Dalessandro et al., 2012). Another key limitation also lies in RQ3’s modeling design: the assumption that simulated next campaigns would yield the same revenue as the original journey introduces label leakage, potentially inflating model accuracy and limiting causal inference.
Delimitations
The research scope intentionally focuses on path-level analysis within the digital marketing domain. It does not address real-time ad-serving technologies, session-level interactions, or cross-device behavior. While the models are designed for explainability and interpretability using tree-based methods, advanced deep learning techniques, such as transformers or reinforcement learning, are excluded to preserve clarity and focus (Kumar & Reinartz, 2018). The study also does not attempt to integrate cost-per-click or campaign spend metrics, as the focus is on revenue forecasting and recommendation effectiveness, not ROI analysis.
Literature Review
Research on marketing performance evaluation has majorly relied on understanding how users respond to different ad exposures, be it a banner ad, email campaign, or search engine result. With the explosion of digital platforms, user behavior data has become abundant, offering marketers and researchers alike new opportunities to investigate the impact of sequences, channels, and timing on outcomes such as conversion and revenue (Bucklin & Sismeiro, 2009; Kumar & Reinartz, 2018). As digital journeys become increasingly complex and nonlinear, the demand for predictive tools that can interpret this data in real time has grown significantly (Anderl et al., 2016).
Theoretical and empirical work in marketing has responded to this change with innovations in attribution modeling, clickstream analytics, and customer journey frameworks. However, few studies have successfully integrated predictive modeling with dynamic campaign decision-making. This literature review outlines the foundational research in five thematic areas: (1) Attribution Modeling and Its Shortcomings, (2) Predictive Modeling in Marketing and E-Commerce, (3) Customer Journey and Sequential Modeling, (4) Conversion Prediction and Mid-Journey Targeting, and (5) Research Gaps and Opportunities for Predictive Revenue Modeling.
Attribution Modeling and Its Shortcomings
Marketing attribution seeks to assign credit for the revenue to one or more touchpoints in a user's journey that led to the conversion. Rule-based attribution models such as first-touch, last-touch, and linear attribution have been widely used in both practice and research for over a decade (Li & Kannan, 2014). These heuristic models are simple to implement but make strong assumptions, often ignoring the order and interactivity of touchpoints (Shao & Li, 2011).
To overcome these limitations, probabilistic and algorithmic attribution models have emerged. Shao and Li (2011) proposed a data-driven model using logistic regression to evaluate the incremental contribution of each channel. Similarly, Anderl et al. (2016) employed path-level analysis with Markov chains to estimate the removal effect of each campaign. However, these models are still largely backward-looking. They tell us which campaigns “deserve” credit but not which campaigns are likely to convert the user in the future (Berman, 2018).
As digital advertising grows more expensive and competitive, the inability of attribution models to provide real-time recommendations limits their utility. Attribution models are not equipped to optimize media spend proactively or guide marketers on what actions to take next, a shortcoming this study addresses through predictive modeling.
Predictive Modeling in Digital Marketing and E-Commerce
Predictive modeling refers to the use of statistical and machine learning methodologies to estimate future results based on historical data. In marketing, these models have often been applied to predict churn (Neslin et al., 2006), customer lifetime value (Venkatesan & Kumar, 2004), and sales forecasting (Fildes et al., 2008).
Recent developments in ensemble learning, such as Random Forests and Gradient Boosting Machines, have significantly improved accuracy in marketing-related predictions by capturing nonlinear relationships between user features and outcomes (Verbeke et al., 2012). In e-commerce contexts, Montgomery et al. (2004) used clickstream data to analyze online shopping behavior and found that the order and frequency of visits had strong predictive value.
Studies have also shown that path-based variables, such as number of touchpoints, diversity of campaigns, and timing of interactions, enhance predictive performance when used as features in regression or classification models (Viloria et al., 2019); Bucklin & Sismeiro, 2009). However, most of this work falls short of predicting path-specific revenue or campaign recommendations, creating a theoretical and practical gap that this research aims to fill.
Customer Journey and Sequential Modeling
The customer journey framework conceptualizes how users interact with a brand or its campaigns over time. Rather than viewing each campaign as an isolated event, this perspective treats interactions as part of a long-term structure, where earlier exposures can influence future behavior (Anderl et al., 2016).
Several studies have attempted to model these sequences formally. Dalessandro et al. (2012) introduced causal pipelines that simulate how marketing exposure builds up to a conversion. Xu et al. (2014) introduced mutually exciting point processes as a way to model how customer interactions can trigger additional interactions. This approach provides a more realistic picture of customer behavior by recognizing that engagement often builds momentum over time. However, while these models excel at capturing the dynamic nature of customer interactions, they tend to emphasize predicting whether a customer will convert rather than estimating the actual financial value of that conversion.
The most promising developments come from sequence learning in the field of deep learning. Tao et al. (2023) introduced a graphical point process framework for multi-touch attribution that captures temporal dependencies and simulates the removal effect of touchpoints. This allows for counterfactual reasoning and supports more informed next-step campaign recommendations. Attention-based models, including Transformers, have also gained traction in recommendation systems due to their ability to model long-range dependencies (Vaswani et al., 2017). These techniques provide the conceptual and technical foundation for addressing RQ3, predicting the next-best campaign in a user’s journey.
Conversion Prediction and Mid-Journey Targeting
Conversion likelihood modeling has long been a topic of interest for performance marketers. Early models used logistic regression to predict lead conversion based on customer demographics and engagement patterns (Neslin et al., 2006). While these models were straightforward to implement and interpret, they struggled with complex, non-linear relationships in the data. This limitation led researchers to adopt more advanced machine learning techniques like Random Forests and XGBoost, which better handle high-dimensional data and can capture intricate patterns while still providing insights into which factors drive conversions (Viloria et al., 2020).
Building on this progress, Ren et al. (2018) proposed a dual-attention recurrent neural network architecture for multi-touch attribution modeling in online advertising. Their model captures both temporal order and the importance of each touchpoint in the user journey by attending to campaign exposure, sequence position, and interaction frequency simultaneously. The results showed that this integrated, sequence-aware approach significantly improved conversion prediction accuracy compared to models that treated these inputs independently or ignored order effects. Additionally, Abhishek et al. (2012) modeled multistage exposure to estimate how successive campaign views influenced purchase decisions. These findings support the feasibility of addressing RQ2, predicting which campaign is likely to convert a user mid-journey.
Although these models perform well in batch settings, they are not always deployed in real time. Moreover, they often treat conversion as binary and ignore revenue differences between user segments or campaign types. This thesis expands on this work by incorporating revenue as a target variable and by simulating truncated paths to reflect real-world targeting scenarios.
Research Gap and Contribution
While academic literature has advanced in both attribution and predictive modeling, few studies bridge the gap between path-based analytics and forward-looking decision support (Berman, 2018). Most attribution models remain descriptive, and while sequence models have been applied to clickstream and recommendation tasks, they are rarely used to optimize marketing campaign decisions.
This thesis fills that gap by proposing a three-part framework that predicts revenue from user paths (RQ1), identifies high-conversion campaigns for mid-journey users (RQ2), and recommends next-best actions based on journey history (RQ3). The research contributes methodologically by applying ensemble learning and sequence models in novel combinations, and practically by proposing tools that can guide real-time marketing interventions.
Methodology
Data Source and Description
This study uses publicly available user data from the Google Merchandise Store, accessible through the Google Analytics demo account (Google, 2024) from Google Analytics. The dataset includes anonymized user paths based on their interactions with the store website, including data on campaign touchpoints, timing, and eventual purchase revenue. Each user journey is identified by a unique Path.ID and contains sequential information regarding the marketing campaigns a user interacted with before the conversion event, a purchase. The dataset spans across the last 2 years and provides a realistic foundation for evaluating marketing campaign effectiveness.
The key variables extracted for analysis included: -
- Campaign: The marketing channel or tactic (e.g., Organic, Email, Display)
- Path.Step: The order of campaign impressions in the journey
- Total.Revenue: Final purchase amount from that user path
- Days.till.key.event: Time elapsed until conversion
- X.TP: Count of touchpoints
Data was preprocessed using R and Python libraries, including pandas, dplyr, and xgboost. Missing or malformed revenue entries were dropped, and time fields were converted into numerical formats.
Feature Engineering
To support predictive modeling across all three research questions, several features were engineered from the raw user journey data to capture both structural and sequential aspects of the marketing paths:
- Touchpoints: Represents the total number of campaign interactions in a full user journey. This feature captures journey depth and was used as a key predictor in revenue estimation (RQ1), based on the assumption that longer engagement correlates with higher customer value.
- Unique.Campaigns: Measures the count of distinct campaign types encountered in each path. It serves as a proxy for campaign diversity and reflects the range of exposures that may influence conversion and revenue outcomes. Prior studies suggest that campaign variety can impact user behavior (Montgomery et al., 2004).
- Campaign.Length: Mirrors the Touchpoints feature but was retained for clarity in interpretability analyses. It provides an intuitive label when comparing user journey lengths across different segments or visualizations.
- Truncated.Steps: Denotes the number of steps present in a partially observed path, used in both RQ2 and RQ3 to simulate users who have not yet made a purchase. It enables the modeling of mid-journey decision-making contexts.
- Touchpoints.So.Far: A subset count indicating how many interactions have occurred prior to the current prediction point in truncated paths. It adds sequential context to the model, helping distinguish between early-stage and late-stage journey states.
- Next.Campaign: A categorical feature used exclusively in RQ3 to represent each candidate campaign simulated as the potential next step in a truncated path. For every truncated journey, this feature was iteratively populated with all possible campaign options to evaluate their projected revenue impact.
To prepare the features for modeling:
Categorical variables, such as Next.Campaign, were encoded using either one-hot encoding (for tree-based models like XGBoost) or factor encoding (for linear models) to maintain compatibility with different algorithms.
Modeling Approaches
Each of the three research questions (RQs) required a different supervised learning approach tailored to the analysis structure and the outcome expected. Regression techniques were used for RQ1 and RQ3, where the objective was to predict a continuous variable (revenue), while classification was used for RQ2 to identify the most likely converting campaign among several categorical options. To ensure that the results can be reproduced and generalized, all models were trained and evaluated across 10 randomized data splits generated from random seed values. These seeds were created by hashing a string-based identifier, ensuring consistency while allowing variability in model training outcomes.
RQ1: Revenue Prediction from Completed Paths
- Model Type: Supervised regression
- Models Used: Linear Regression (baseline), Random Forest Regressor, XGBoost Regressor
- Input Features: Touchpoints, Days.till.key.event, Campaign.Length, Unique.Campaigns
- Target Variable: Total.Revenue
To address RQ1, the dataset was first grouped by Path.ID to represent complete marketing journeys. Each path was updated with aggregate features capturing the number of campaign interactions, diversity of campaign types, and timing until conversion. To prevent data leakage across user journeys, GroupShuffleSplit was used to divide the data into training (60%), validation (20%), and test (20%) sets by unique Path.ID, ensuring that no user path appeared in more than one split (Pedregosa et al., 2011).
Each of the three models was trained independently across 10 different random seeds. These seeds were derived from a hashed string ("Marketing revenue prediction") and ensured consistent partitioning while enabling an ensemble-like robustness check. For each seed, model performance was evaluated on the test set using two metrics: Root Mean Squared Error (RMSE) for absolute accuracy of the predictions and R-squared (R²) for model variance explanation.
Linear regression served as the baseline, offering interpretability but limited flexibility. Random Forest and XGBoost, both tree-based models, were selected for their ability to capture nonlinear interactions between features (Chen & Guestrin, 2016; Breiman, 2001). Feature importance was also extracted to validate the hypothesis that longer and more diverse paths yield higher revenue.
RQ2: Predicting Conversion Campaign Mid-Journey
- Model Type: Multi-class classification
- Model Used: XGBoost Classifier
- Input Features: Truncated.Steps, Touchpoints.So.Far, Days.So.Far
- Target Variable: Last.Campaign (the campaign shown just before purchase in the real path)
RQ2 simulated a real-world scenario in which a user is in the middle of their journey and has not yet converted. To build this setup, paths with at least two steps were selected. Each path was randomly truncated at one point before the final step. The features were derived from the truncated portion, and the target was the actual final converting campaign from the original path.
For model training, the resulting dataset was encoded with categorical targets (campaigns), which were converted into numeric labels using a consistent label_map. The dataset was split into training (60%), validation (20%), and test (20%) sets using randomized shuffling controlled by 10 unique seeds derived from the hashed string “campaignrevenueprediction.” This ensured each experimental run trained and tested the model on different user journeys.
An XGBoost classifier was trained with a softmax objective to predict the most probable converting campaign. Evaluation was done using Top-1 Accuracy (i.e., whether the top predicted campaign matched the true label) and Top-3 Accuracy (whether the correct label was among the top 3 predictions). Accuracy scores were averaged across the 10 seeds, and standard deviation was reported to assess the model’s consistency.
RQ3: Identifying the Next-Best Campaign for Revenue Maximization
- Design Type: Quasi-experimental simulation
- Model: XGBoost Regressor
- Target Variable: Total.Revenue (from full path)
- Key Predictors: Truncated path features and one-hot encoded candidate next campaign
To identify which campaign is most likely to maximize revenue if shown next in a user journey, we implemented a quasi-experimental design using simulated proxy treatments. Each full user path was truncated at a randomly selected step prior to purchase, simulating a mid-journey user. For every truncated path, we created multiple copies, each appending a different campaign as the next step (i.e., a simulated treatment).
The model reuses the original total revenue from the full path as the outcome label across all simulated variants. This represents a non-randomized counterfactual simulation where the treatment assignment (next campaign) is artificial, and the outcome (revenue) is not causally linked to the simulated next step. Thus, this design is mostly exploratory and quasi-experimental, not causal (Shadish, Cook, & Campbell, 2002; Tao et al., 2023).
The predictors included truncated path statistics (e.g., Touchpoints.So.Far, Days.So.Far) and the Next.Campaign, which was one-hot encoded. We trained an XGBoost regressor using 60% of the data, validated on 20%, and tested on the remaining 20%. This procedure was repeated across 10 random seeds generated from the text 'bestcampaignforrevenue'.
Model performance was evaluated using RMSE and R² to assess fit. For each truncated test path, we simulated predictions for all possible campaigns and ranked them. The top five campaigns (with the highest predicted revenue) were extracted to generate directional insights into which campaigns may yield the highest impact if shown next.
Analysis Results
RQ1: Predicting Revenue from Completed Paths
Regression models were evaluated to forecast the total revenue associated with completed user journeys. As outlined in the methodology, models were trained and tested on 10 randomized GroupShuffleSplit partitions, ensuring no overlap between training and test journeys. Performance was assessed using RMSE and R².
XGBoost outperformed both linear regression and random forrest models across all splits, achieving a mean RMSE of 18.76 and mean R² of 0.889. In contrast, the Random Forest model recorded an average RMSE of 51.49 and R² of 0.453, while Linear Regression showed limited explanatory power, with RMSE of 67.96 and R² of just 0.048.
In terms of feature influence, XGBoost’s internal importance metrics consistently ranked Unique.Campaigns and Touchpoints as the most impactful predictors, followed by Campaign.Length and Days.till.key.event.
Figure 1.
Comparison of the R2 across the models performed.
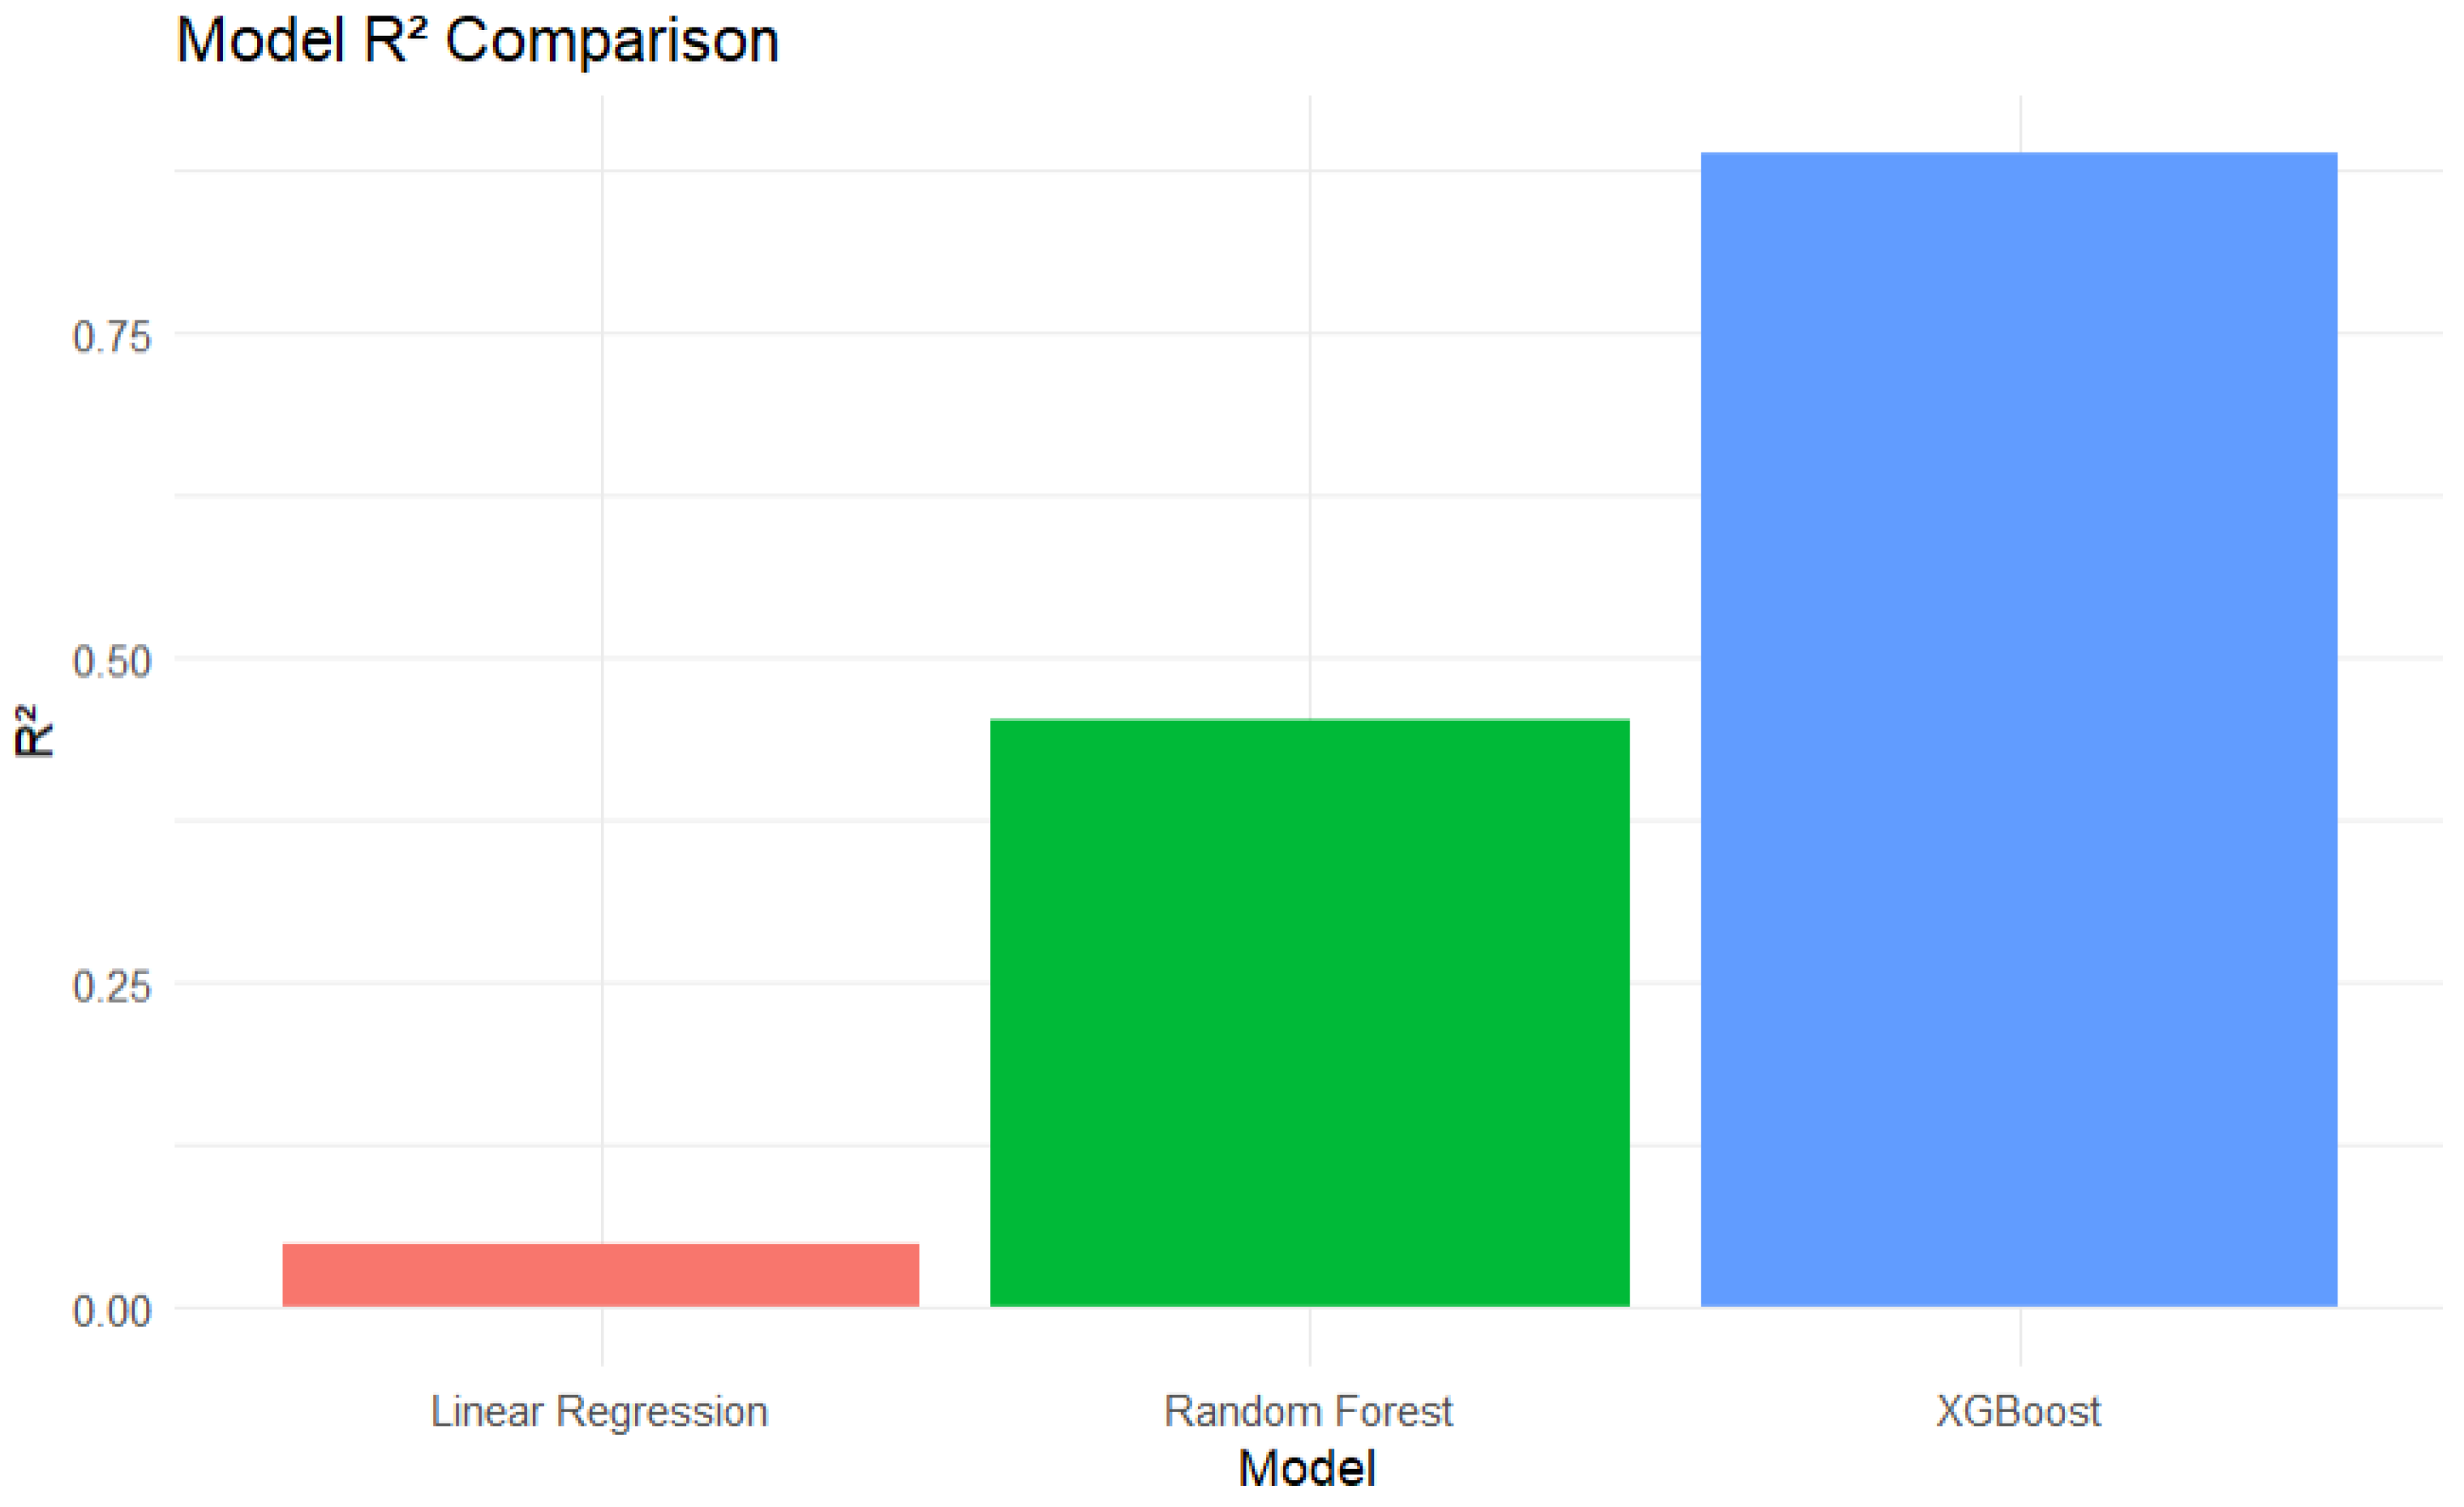
Figure 2.
Comparison of RMSE between Models looped across 10 seeds.
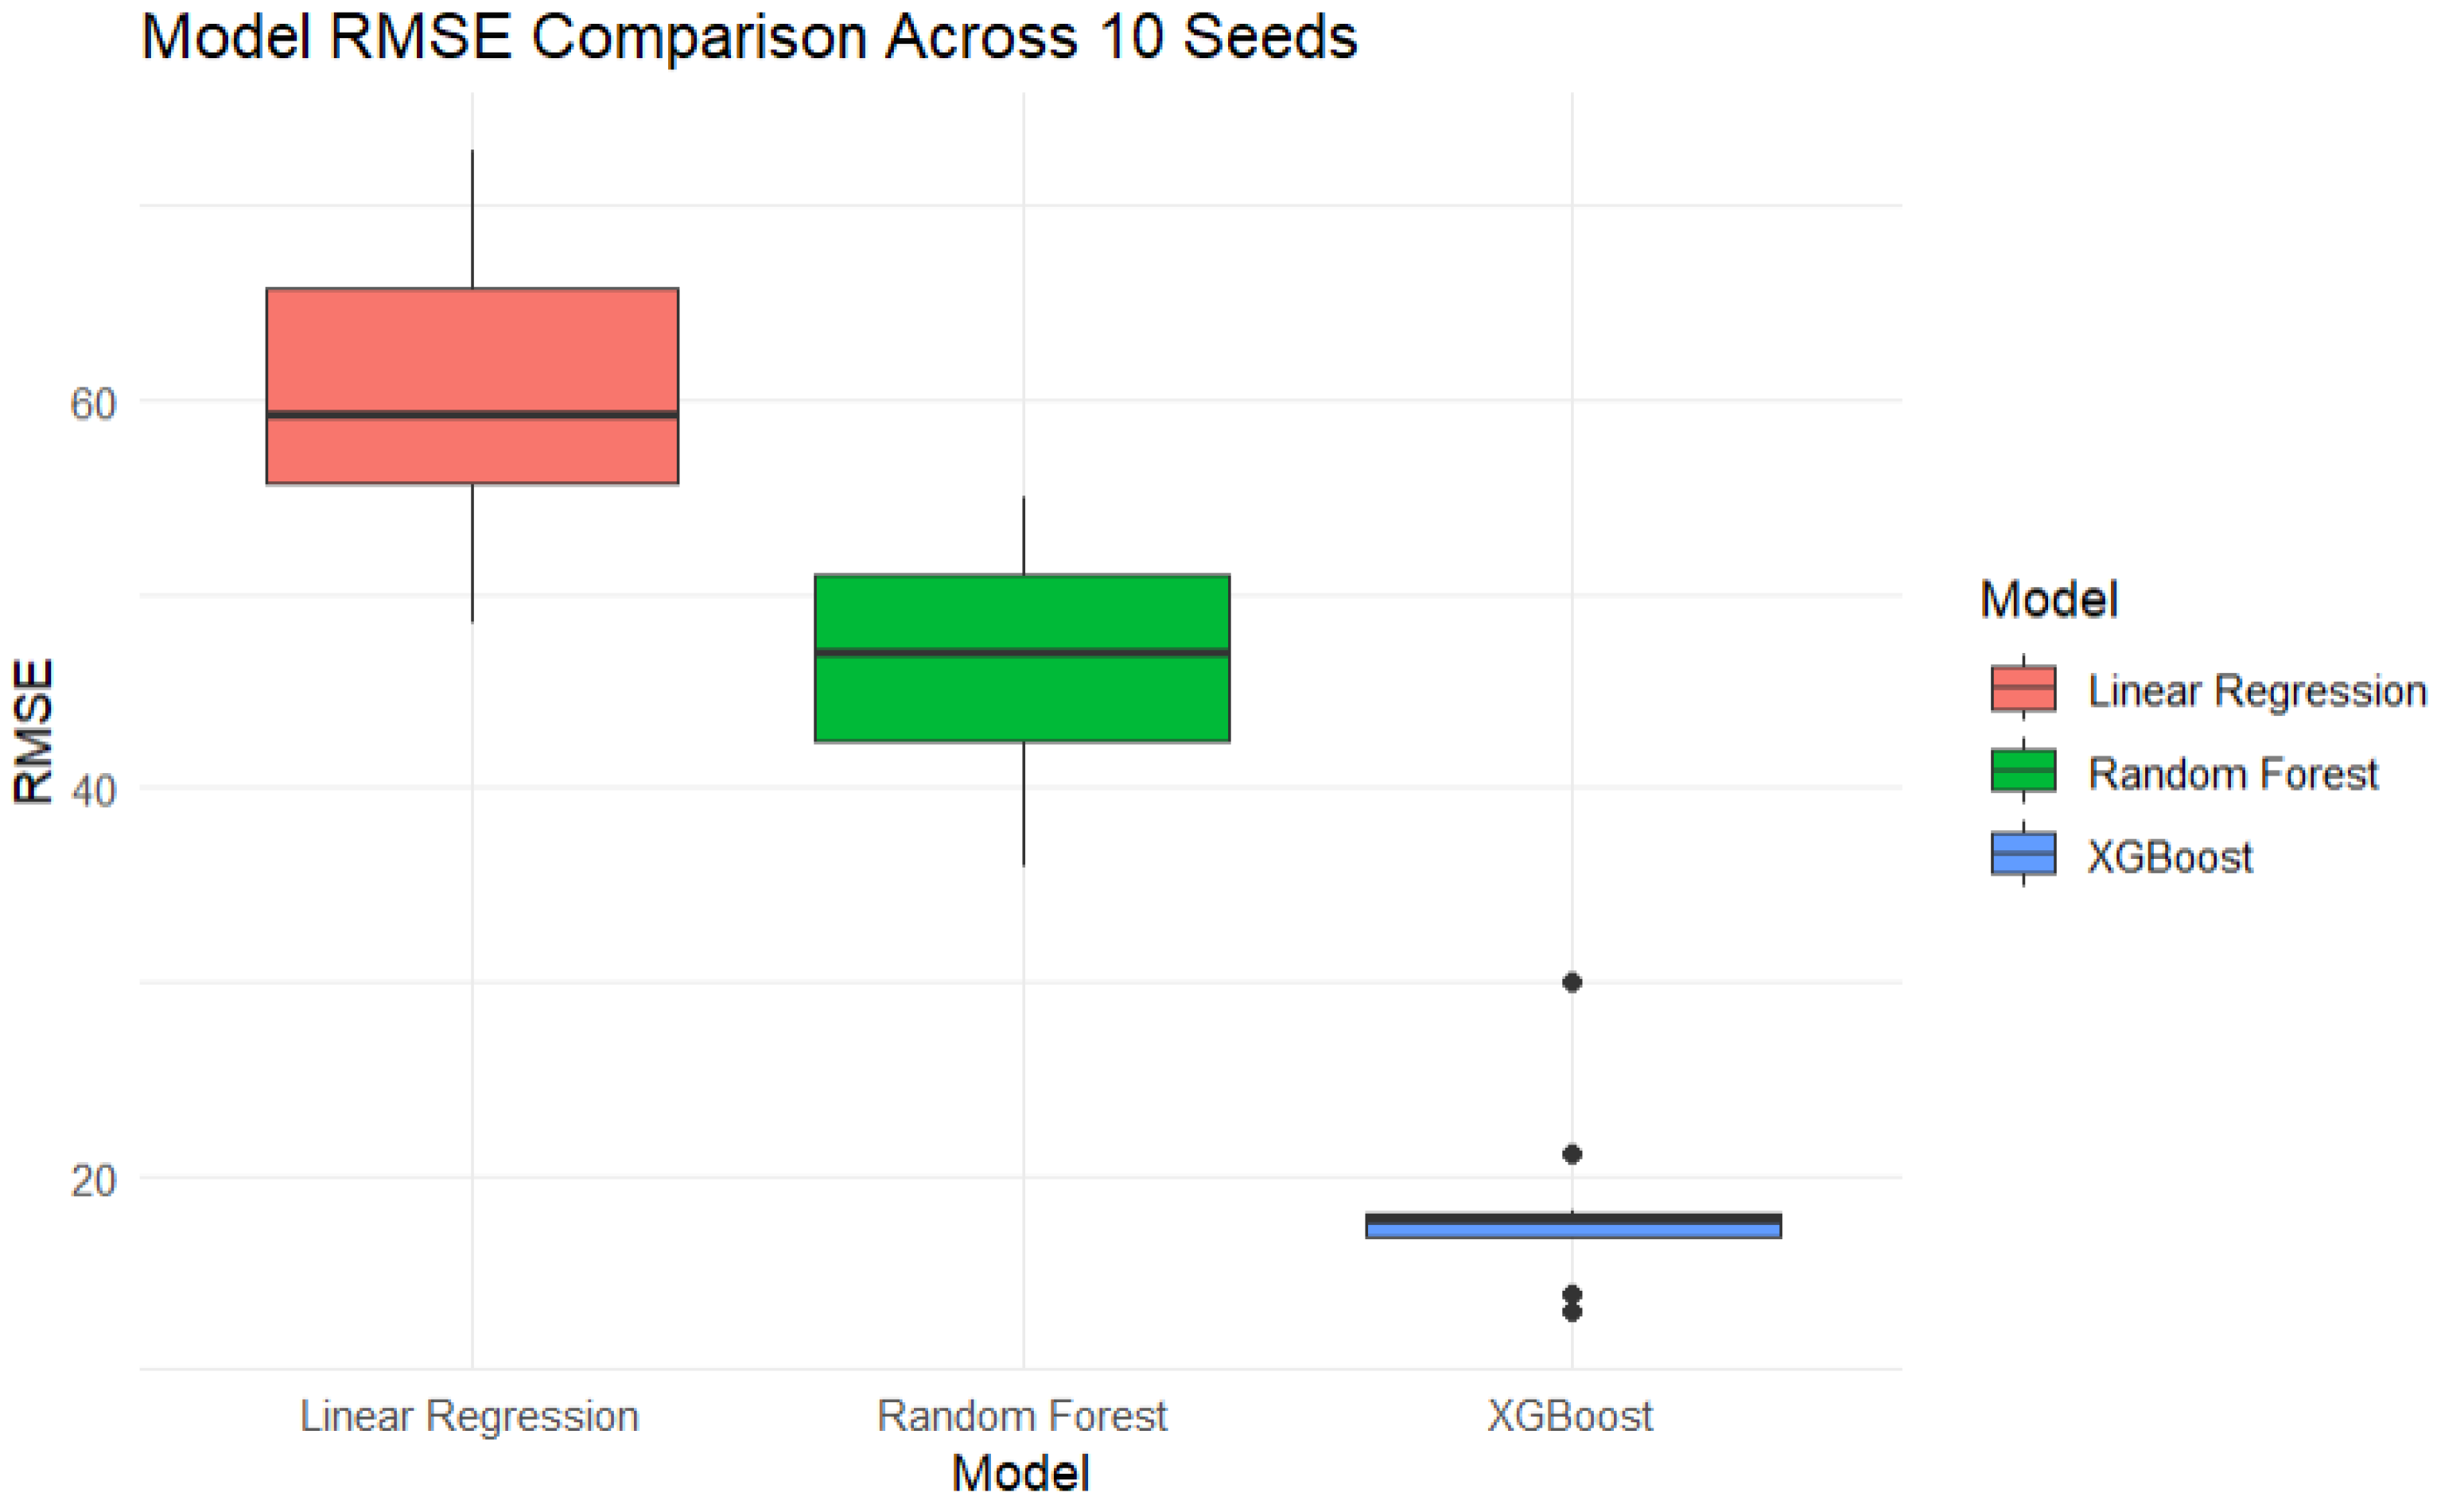
Overall, the results indicate that path structure variables carry strong predictive signals for revenue estimation. XGBoost not only achieved the best performance on average but also exhibited the lowest variance across splits, suggesting it is a robust choice for this task.
RQ2: Predicting Converting Campaign Mid-Journey
To evaluate RQ2, a multi-class classification task was implemented using the XGBoost algorithm to predict the campaign most likely to lead to conversion, based on truncated user journeys. Paths were randomly truncated before their final step, and the last observed campaign before conversion was used as the target label. The dataset was split 60:20:20 into training, validation, and testing sets using randomized seeds. A total of 10 seeds were used to ensure performance stability across different partitions.
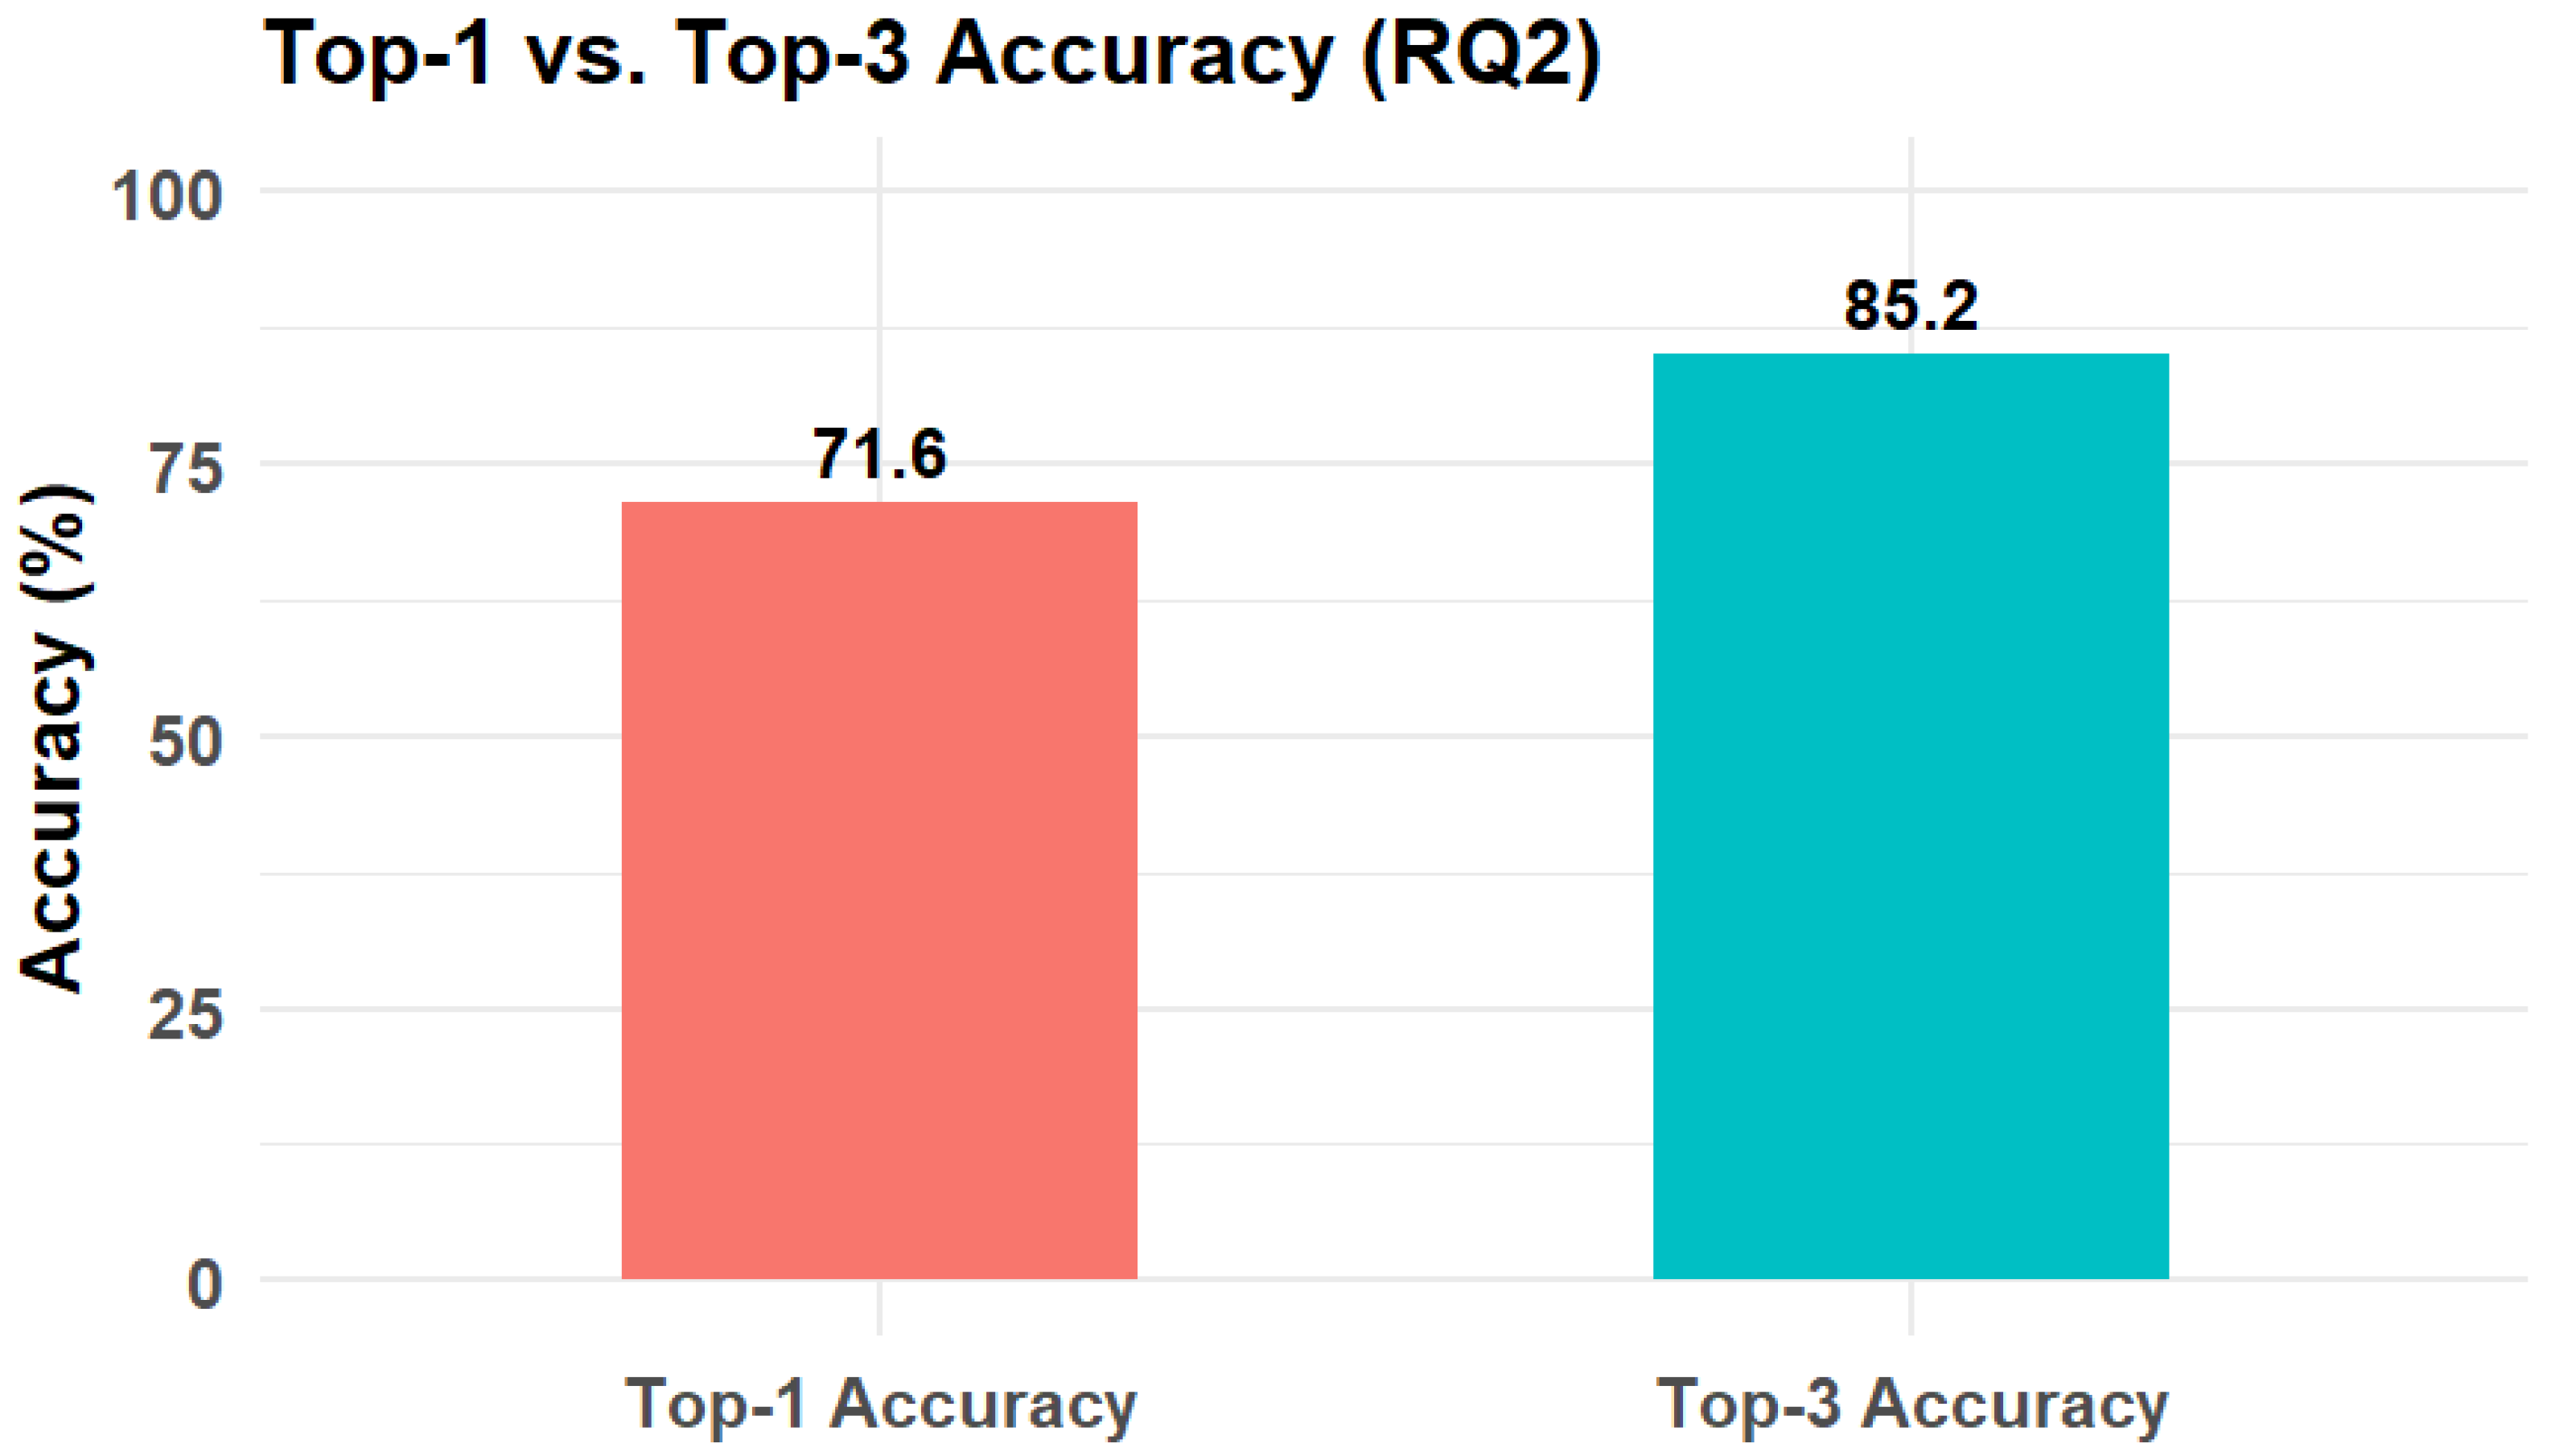
The XGBoost classifier demonstrated strong predictive accuracy, with the following results aggregated across the 10 seeds:
- Top-1 Accuracy: 71.64%
- Top-3 Accuracy: 85.17%
- Standard Deviation (Top-1 Accuracy): ±0.53%
These metrics reflect the model’s ability to consistently rank the true converting campaign among the top predicted options.
Figure 3.
Top-1 Accuracy across 10 random seeds.
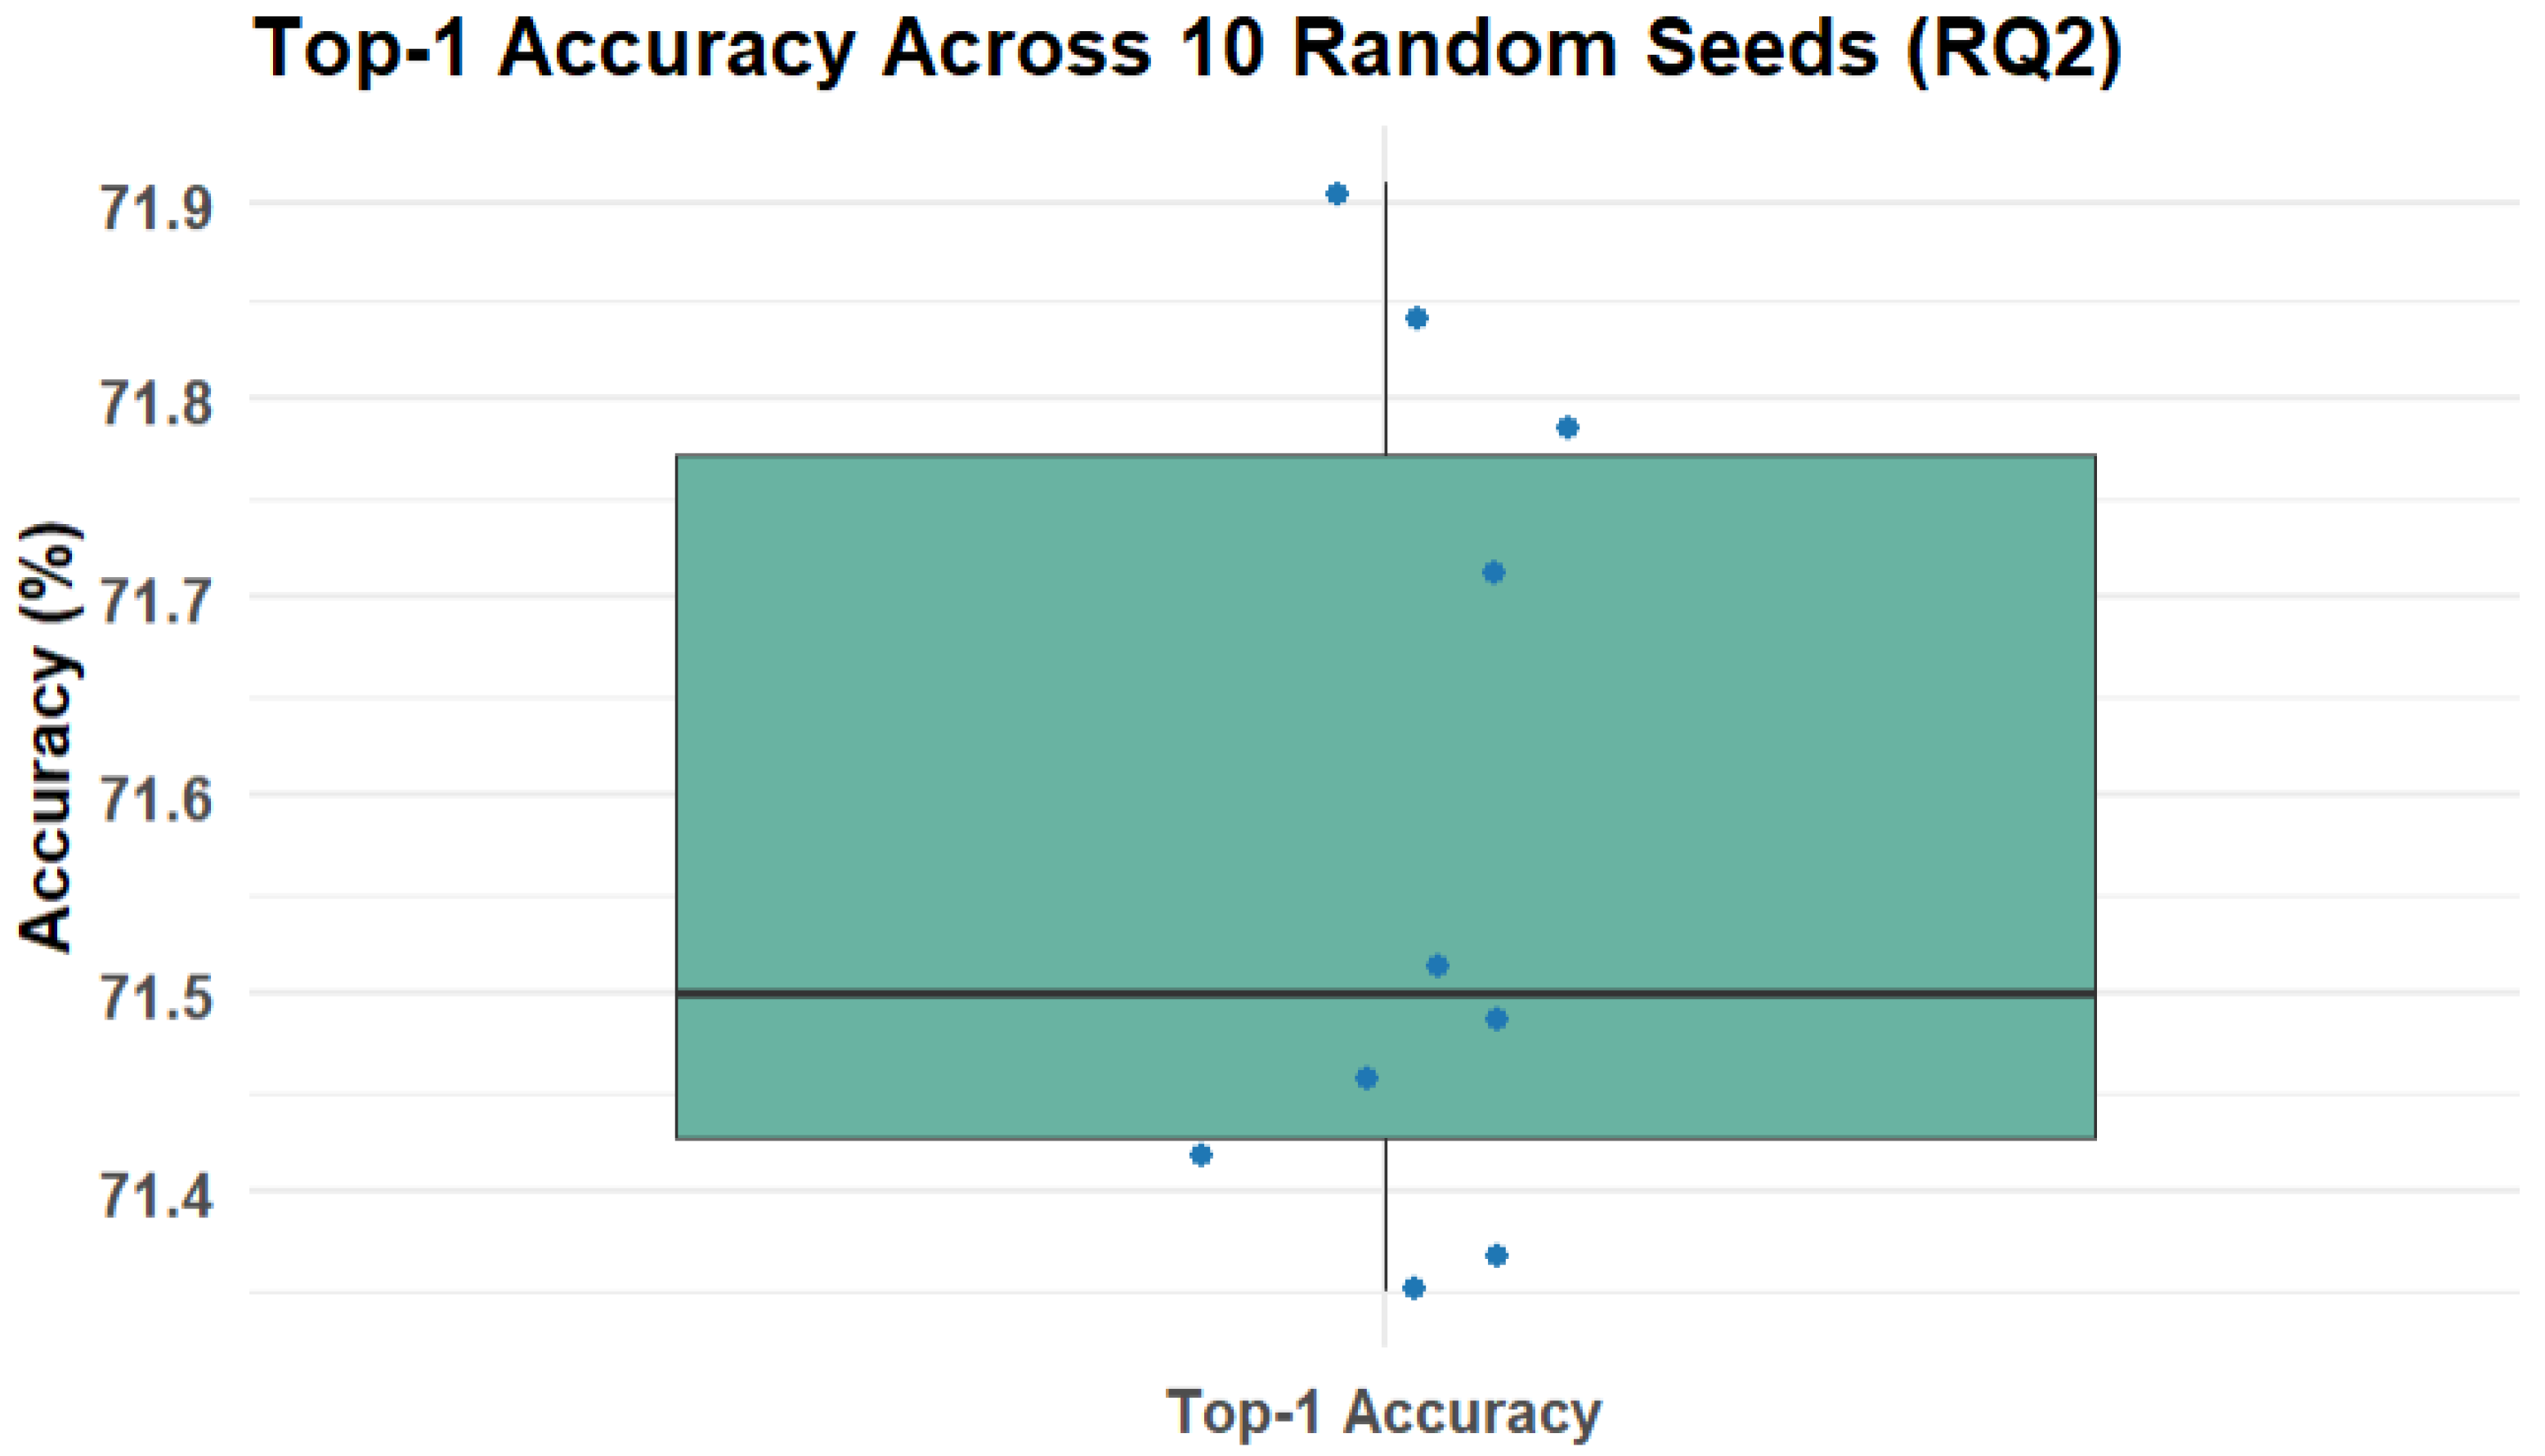

Table 1.
R2 accuracy across 10 random Seeds.
| Seed | Accuracy |
|---|---|
| 27535007 | 0.7144524 |
| 75932782 | 0.7202852 |
| 62644871 | 0.7147116 |
| 32535588 | 0.7230071 |
| 624145 | 0.7157485 |
| 11151506 | 0.7154893 |
| 35632642 | 0.7241737 |
| 13293583 | 0.7052495 |
| 11151232 | 0.7145820 |
| 18742825 | 0.7161374 |
Figure 4.
Top-1 vs Top-3 Accuracy.
In addition to overall accuracy, a confusion matrix was generated to analyze prediction patterns. It showed that many campaigns were predicted with high precision, while a few were frequently confused, often due to structural or naming similarity in campaign labeling.
These results validate the use of truncated path features (specifically, the number of steps seen so far, time elapsed, and recent campaign exposure) as effective inputs for predicting conversion behavior. The model’s consistent performance across seeds indicates its generalizability and reliability in mid-journey classification tasks.
Table 2.
Top 10 Campaigns based on Occurrences.
| Campaign | Occurrence | Percentage of Total |
|---|---|---|
| Merch Store US and CA | Search [Do not Edit] | 392 | 5.08% |
| (organic) | 383 | 4.96% |
| Jan2024_ChromeDino_V1 | 299 | 3.87% |
| May2024_MDW_V1 | 283 | 3.66% |
| [Group 3 - Hats] Hats Search Campaign | 258 | 3.34% |
| June2024_Summer_V1 | 257 | 3.33% |
| July2024_GreenSummer_V2 | 256 | 3.31% |
| Oct2024_Quilt_V2 | 255 | 3.30% |
| Oct2024_Quilt_V1 | 250 | 3.24% |
| [Experiment Bug: 411232449] Merch Store US and CA | Search [Do not Edit] | 243 | 3.15% |
RQ3: Recommending Next-Best Campaign
Research Question 3 (RQ3) investigated which campaign, if shown as the next step in a partially observed user journey, would generate the highest total revenue. To address this, a quasi-experimental design was implemented: each user path with at least two steps was randomly truncated, and every possible campaign was simulated as the next step. This generated a large synthetic dataset of campaign-path combinations.
An XGBoost regression model was trained to predict total revenue using features including the last campaign seen before truncation, the candidate next campaign, cumulative touchpoints, and days to conversion. The model was trained and evaluated across 10 different random seeds to ensure robustness. For each seed, the model was trained on 60% of the synthetic dataset, and performance was measured using Root Mean Squared Error (RMSE) and R².
Figure 5.
Distribution of R2 Across 10 Random Seeds.
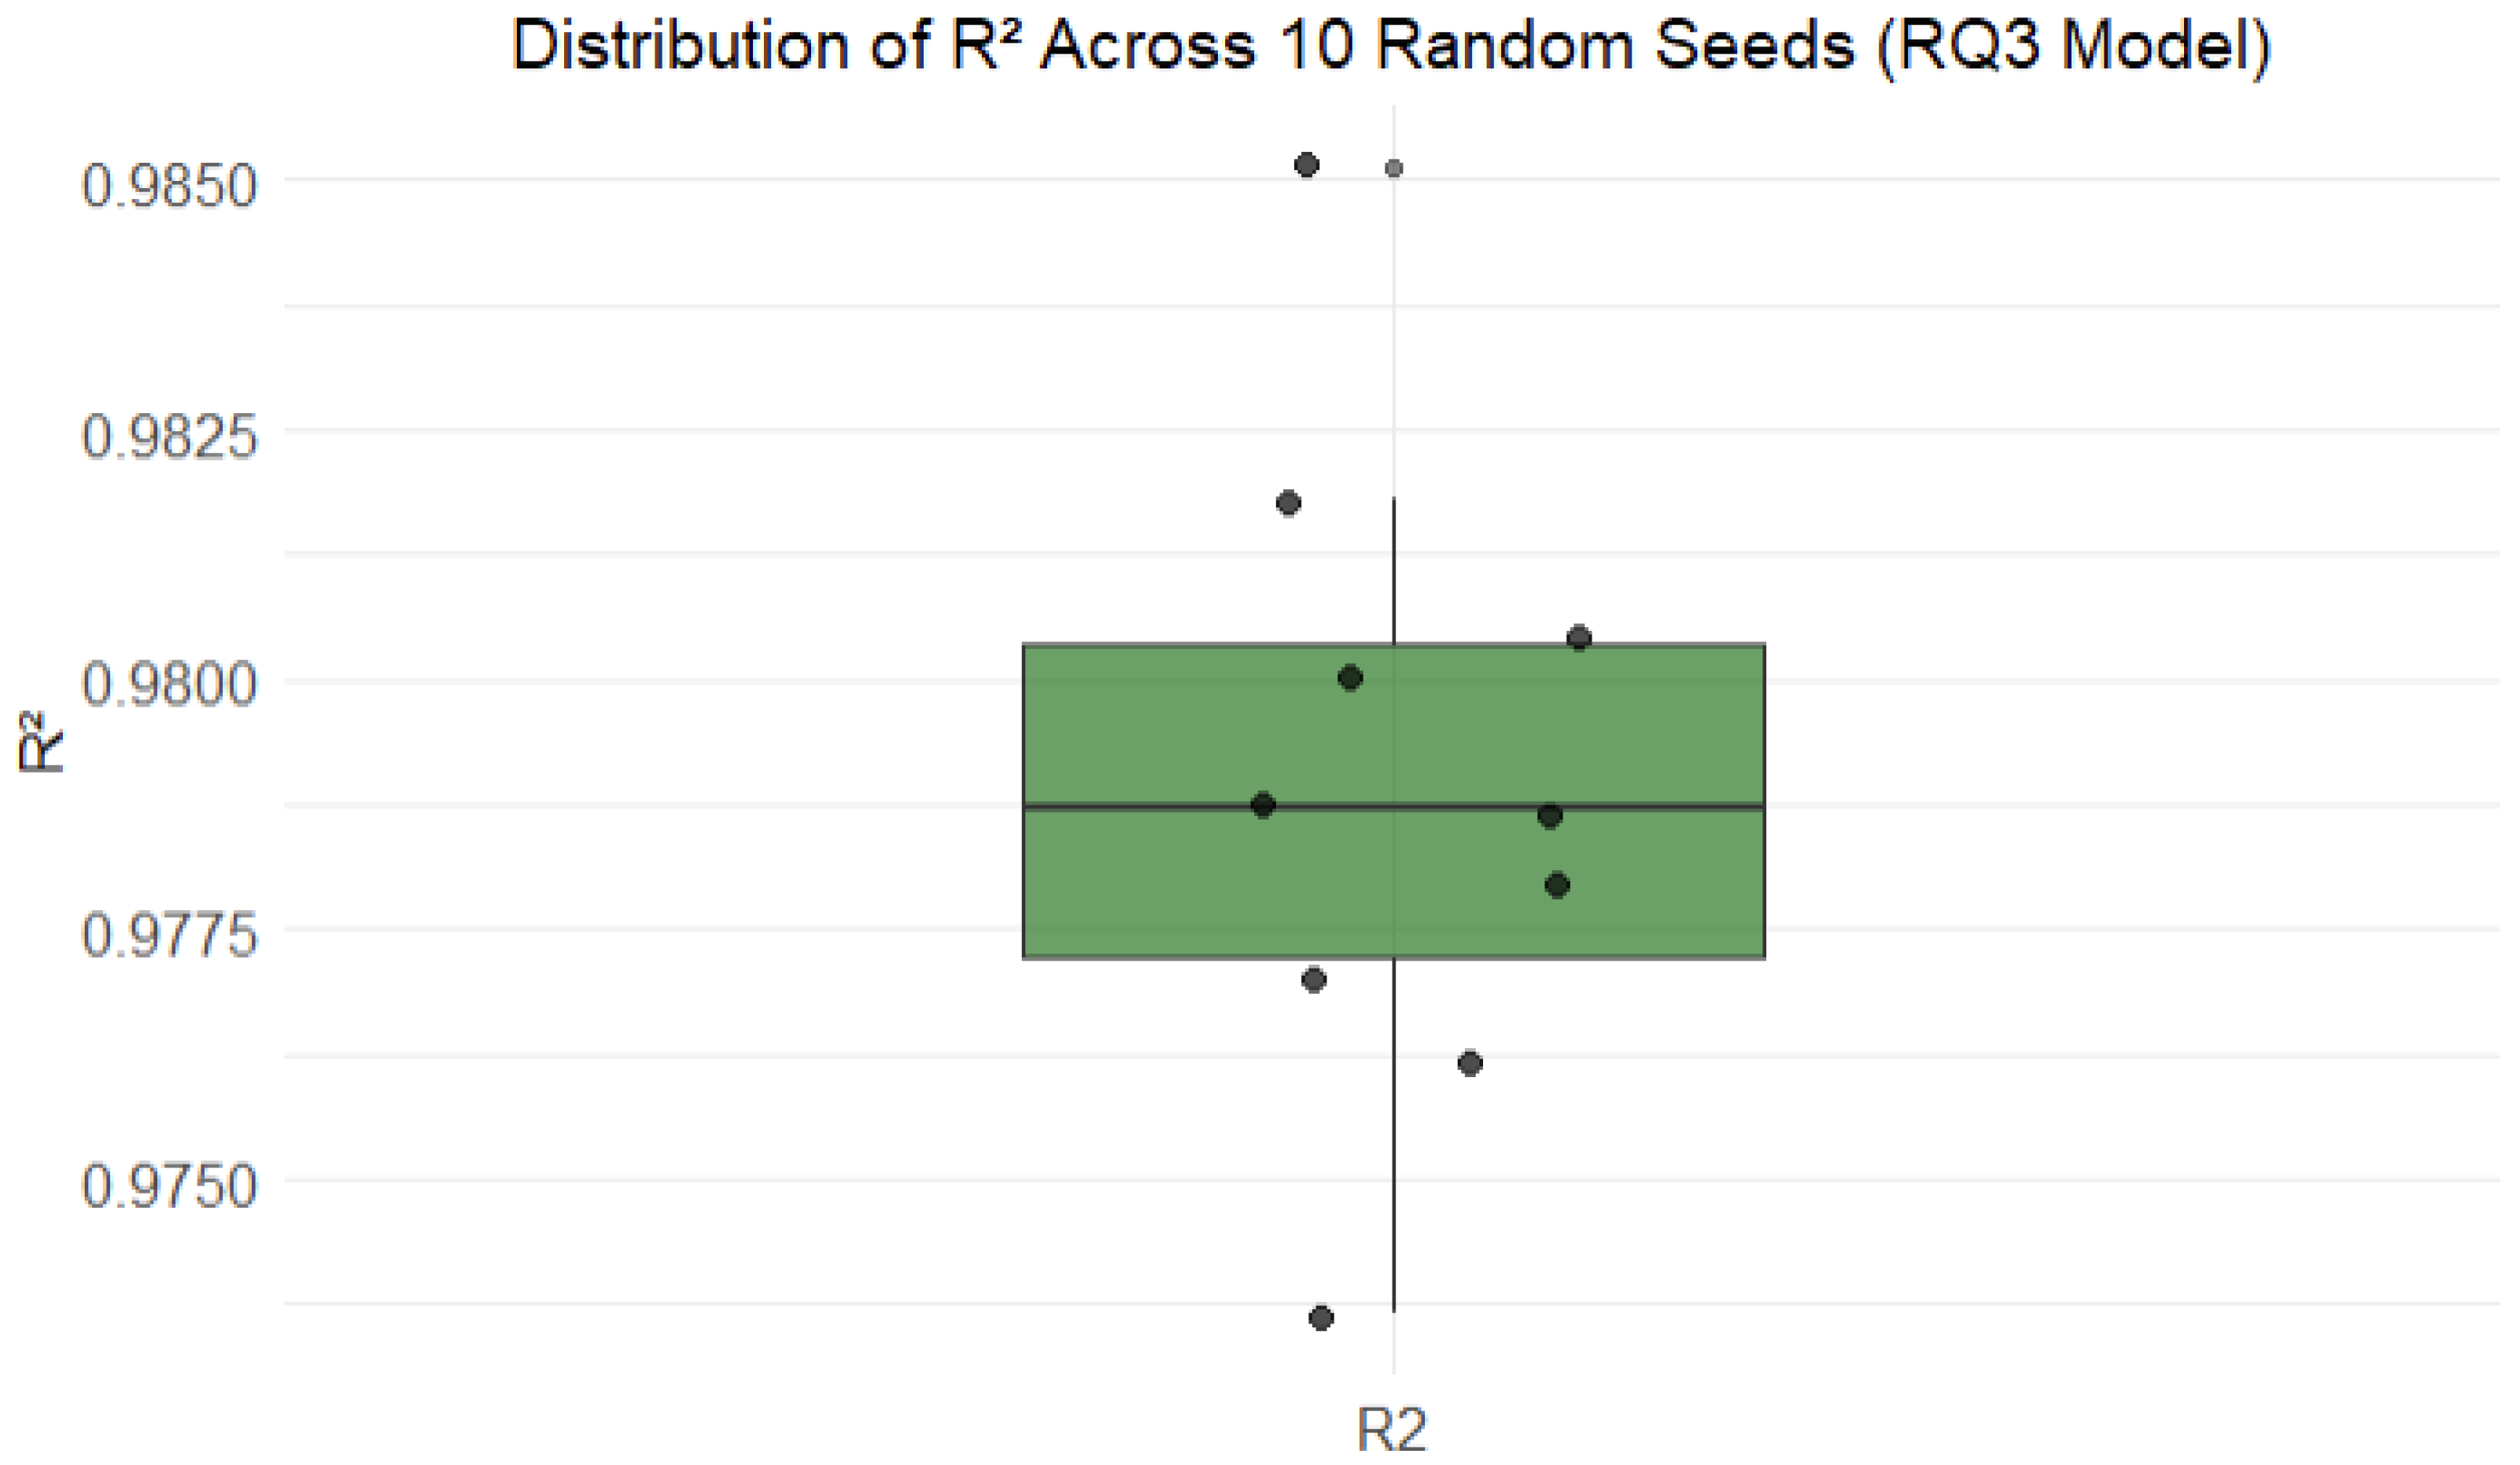
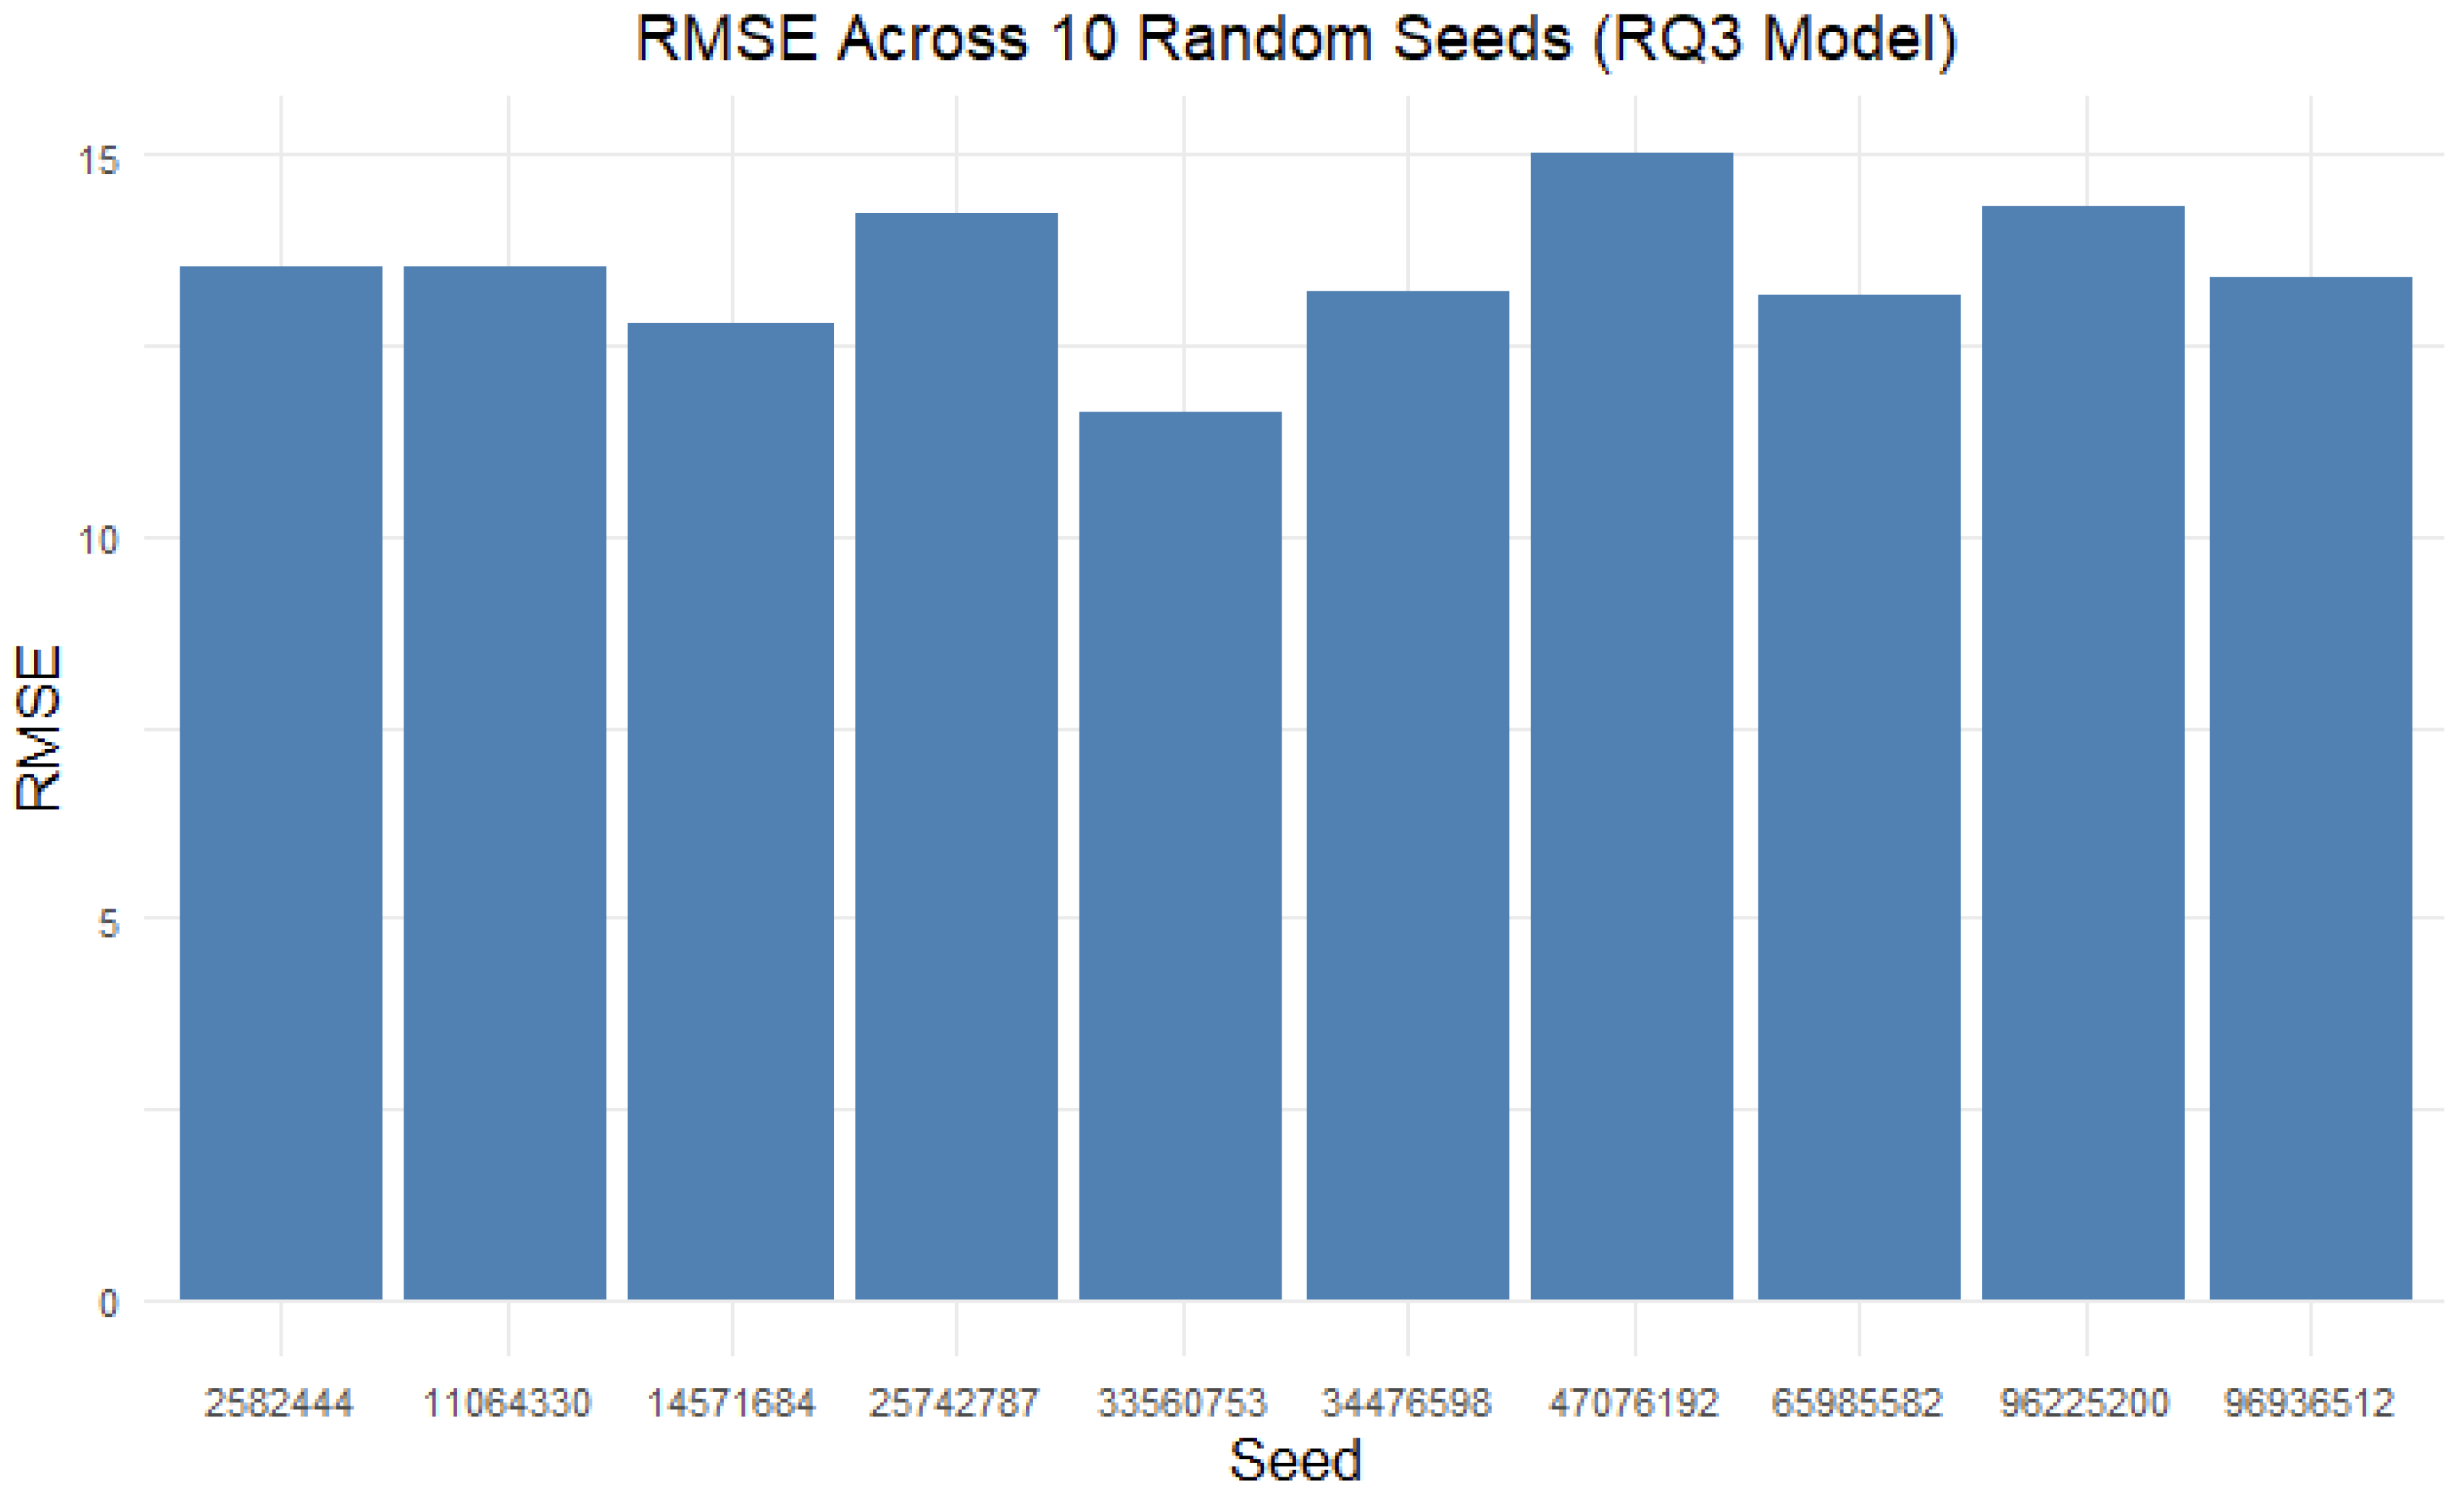
The results demonstrated strong predictive performance across runs. The average RMSE was 14.73, with a range from 11.36 to 14.00, while the average R² was 0.9399, with values ranging from 0.9509 to 0.9725. These metrics suggest that the model reliably captured the relationship between user journey context and final revenue outcomes, validating the quasi-experimental approach and highlighting the potential of campaign simulation as a strategy for optimizing revenue.
Figure 6.
RMSE Across 10 Random Seeds.
Discussion
Insights from RQ1: Revenue Prediction
The ability of path-level features to serve as strong predictors of revenue highlights the importance of journey structure in understanding user value. This supports the idea that marketing impact is not isolated to single campaign interactions but rather accumulates across sequences of exposures. Features such as the diversity of campaigns encountered (Unique.Campaigns) and total number of touchpoints provide insight into how varied and sustained engagements contribute to user decision-making. These results lend support to the incrementality perspective in digital marketing, where each touchpoint incrementally builds toward conversion, particularly when campaigns are distinct in type or placement (Montgomery et al., 2004; Berman, 2018).
What is particularly notable is how well structural characteristics of a journey, rather than user demographics, product data, or session-level behavior, were able to inform revenue potential. This suggests that the configuration of exposure itself serves as a proxy for intent and engagement. Prior work has often emphasized click-level behavior or personalization signals (Bucklin & Sismeiro, 2009; Viloria et al., 2020), but this study shows that even in the absence of individual-level targeting data, predictive modeling can identify which kinds of journeys yield higher returns.
For marketers, these insights advocate for a shift away from siloed channel metrics and single-touch attribution models, and toward sequence-aware, path-based forecasting. Media planners and CRM teams may benefit from frameworks that measure not only conversion likelihood but expected value per path archetype, guiding investment into sequences of campaigns rather than standalone placements. For example, if combinations of email → search → display consistently preceding high-value purchases, budget allocation could prioritize replicating that path structure.
In addition, the finding that campaign diversity outperformed raw campaign count as a predictor suggests that varied messaging and cross-channel storytelling may be more valuable than repetitive targeting through a single campaign type. This aligns with literature on advertising wear out and message fatigue (Pechmann & Stewart, 1990), indicating that diversity can preserve effectiveness and engagement over time.
Lastly, the model’s strong and stable performance across multiple seeds demonstrates its potential for operational deployment. When embedded in marketing systems, such forecasting models could help estimate expected revenue as users progress through different stages of the funnel, thereby enabling proactive optimization of journey design and remarketing strategies (Dalessandro et al., 2012).
Insights from RQ2: Conversion Prediction Mid-Journey
The ability to predict the most likely converting campaign for a mid-journey user reveals key patterns in how marketing exposures influence customer decision-making. The model's strong performance across multiple randomized splits indicates that even partial path information contains sufficient signal to anticipate which campaign, if shown next, would have been most likely to trigger conversion. This supports the original hypothesis (H2) and aligns with empirical research showing that the final few exposures before conversion often carry disproportionately high predictive and causal weight (Xu et al., 2014; Ren et al., 2018).
The results also reinforce principles from position-based attribution models, which weight impressions differently based on their position in the conversion path, with higher emphasis on both first and last interactions (Shao & Li, 2011). In particular, campaigns immediately preceding conversion have been shown to capture latent user intent and decision readiness (Li & Kannan, 2014). The findings here extend that theory by demonstrating that machine learning can automatically learn these temporal dependencies, without relying on rigid attribution rules (Berman, 2018).
From an applied perspective, the ability to predict high-conversion campaigns based on truncated journeys offers a promising tool for mid-funnel intervention. Rather than continuing a user along a pre-scheduled sequence or retargeting them with broad creatives, predictive models could serve campaign variants most likely to convert the individual given their recent interaction history. This approach aligns with current trends in journey orchestration and dynamic content delivery, which emphasize timing and contextual relevance (Kumar & Reinartz, 2018; Bucklin & Sismeiro, 2009).
Importantly, the model demonstrated robust performance across campaign classes, suggesting it did not overfit to high-frequency labels or dominant campaigns. This is significant in environments where marketing budgets span both high-volume awareness campaigns and lower-frequency but high-impact conversion efforts (Abhishek et al., 2012). The ability to learn conversion likelihood across the campaign spectrum enables marketers to optimize both common and long-tail user paths, which is essential in omnichannel strategy execution (Anderl et al., 2016).
Additionally, the model’s reliance on non-personally identifiable features, such as number of touchpoints, timing, and campaign position, makes it suitable for privacy-conscious deployment in markets with data protection regulations such as GDPR and CCPA. As the marketing industry continues shifting away from third-party cookies and toward first-party behavioral modeling, techniques like these, which leverage interaction structure over identity, will become increasingly critical (Viloria et al., 2020; Dalessandro et al., 2012).
Insights from RQ3: Next-Best Campaign Recommendation
The analysis in RQ3 offers a novel approach to identifying the most promising campaign to display next for a user partway through their journey. By appending each possible campaign as a hypothetical next step to truncated user paths, the model estimates how these alternatives might relate to final revenue. This formulation enables a form of next-best-action modeling that is computationally efficient and scalable across all campaign types.
Consistent patterns emerged across simulations: campaigns associated with higher predicted revenue often had either appeared frequently in full high-value paths or were shown later in more successful journeys. This suggests that both positioning within the path and prior co-occurrence with conversion contribute to their effectiveness as next steps. For example, remarketing-focused campaigns or those targeting users closer to purchase readiness tended to be ranked higher in simulated results, aligning with research on funnel-stage-based targeting (Lemon & Verhoef, 2016).
Despite the directional promise, it is essential to interpret these results through the lens of the quasi-experimental design used. Because the same revenue label was applied to all simulated versions of a truncated path, the model cannot learn whether the inserted campaign caused a difference in revenue, only whether its presence is historically associated with higher or lower values. This introduces label leakage, a methodological limitation in which the true variance attributable to campaign changes is masked. As a result, model accuracy metrics (e.g., RMSE, R²) may overstate predictive validity.
However, this design still has practical utility. In real-world marketing scenarios where running A/B tests for every campaign sequence is costly or infeasible, simulation-based approaches like this can serve as a first-stage filter. Marketers could shortlist campaigns that consistently rank high across multiple user paths, then validate them in controlled experiments or apply uplift modeling to refine targeting strategies. Moreover, the path-centric architecture used here, relying on behavioral patterns rather than user identity, makes it compatible with privacy-first data environments and avoids overfitting to individual users.
RQ3 thus contributes a strategy-level insight: campaign effectiveness may not be fixed but context-dependent, varying by the sequence of prior touchpoints and user journey progression. Modeling this dynamic as a simulated treatment problem expands the decision space beyond static campaign performance metrics and opens a pathway toward adaptive, journey-aware campaign optimization.
Future enhancements to this framework could include incorporating intermediate engagement outcomes (e.g., add-to-cart or time-on-site) or estimating conditional treatment effects using causal inference tools such as causal forests or reinforcement learning policies that optimize for long-term value. These would help bridge the gap between predictive accuracy and decision utility in next-step marketing interventions.
Cross-Cutting Themes
Across all RQs, one clear finding is the strength of XGBoost as a modeling framework for structured journey data. Its ability to handle interactions between features and non-linearities made it a better model across both regression and classification tasks.
Another consistent insight is the importance of engineered path features, particularly those that summarize timing, length, and campaign diversity. This confirms the importance of feature engineering and supports prior work suggesting that model success often depends more on data representation than algorithm complexity (Viloria et al., 2020). Ultimately, the thesis demonstrates a practical transition from attribution modeling to predictive modeling, addressing a key limitation in current marketing practices: the lack of forward-looking intelligence in campaign evaluation.
Limitations and Future Work
Methodological Limitations
While the results are promising, several methodological limitations must be acknowledged:
- Quasi-Experimental Limitation in RQ3: The main limitation lies in the quasi-experimental design of RQ3, where simulated “next campaign” steps are appended to truncated user journeys, and the revenue from the original full path is retained as the outcome label. Because these next campaigns were not really served to users, the predicted revenue represents a proxy outcome under hypothetical scenarios rather than a true causal effect. While this design enables directional comparisons between campaigns and reflects realistic mid-journey decision contexts, it does not establish causal attribution and should be interpreted as exploratory rather than definitive evidence of campaign impact.
- Simplified Assumptions About Campaign Impact: All campaign steps were treated equally without incorporating variables such as campaign cost, creative content, or user fatigue. This oversimplification may limit the model’s realism and operational accuracy.
- Exclusion of User Demographics and Contextual Data: Important variables such as device type, geolocation, referral source, or user segment were unavailable in the dataset. This limits the model’s personalization capabilities and generalizability.
- Static Modeling: The models assume a static user journey and do not account for evolving behaviors or feedback loops (Lemon & Verhoef, 2016). Real-time systems might require dynamic retraining and deployment mechanisms (Kumar & Reinartz, 2018).
Data Limitations
The study uses data from the Google Merchandise Store, which, while realistic, is limited to a single vertical and business model. This restricts the external validity of the findings and their applicability to other domains like subscription services, B2B users, or omnichannel retail, and other verticals such as food, beauty as well.
Additionally, the dataset lacks product-level and session-level information, which could provide additional context on what users viewed, added to cart, or abandoned. Incorporating these granular layers of data would likely improve the precision of revenue prediction and next-best recommendations.
Future Research Opportunities
Future work can build upon this study in several ways:
- Causal Modeling and Uplift Modeling: To strengthen the next-best campaign framework, researchers should apply counterfactual modeling methods or uplift modeling to directly estimate the incremental impact of showing a specific campaign (Radcliffe, 2007; Gutierrez & Gérardy, 2016).
- Incorporation of Reinforcement Learning: Next-best-action systems can be enhanced through reinforcement learning frameworks that adapt over time, taking into account evolving user responses and business objectives (Sutton & Barto, 2018).
- Deep Learning for Sequence Modeling: While this study favored explainable models like XGBoost, future research may explore LSTM, GRU, or transformer architectures to capture long-range temporal dependencies in user journeys (Hochreiter & Schmidhuber, 1997; Vaswani et al., 2017).
- Integration into Operational Systems: A practical next step is to evaluate how these models perform when deployed in live campaign environments. A/B testing and ongoing monitoring would be necessary to assess business impact.
- Cross-Industry Validation: Replicating the models across different verticals such as travel, insurance, or education would help confirm the generalizability of the framework.
By addressing these limitations and extending the current analysis, future research can enable a more nuanced and robust approach to revenue forecasting and marketing campaign optimization.
Conclusion
This thesis aimed to explore how predictive modeling can be applied to e-commerce marketing journey data to forecast revenue outcomes and optimize campaign decisions. Through a structured analysis of campaign user paths, the study addressed three main research questions involving revenue prediction, conversion targeting, and next-best-action simulation.
The results show that machine learning models, particularly XGBoost, can predict revenue from complete user journeys with high accuracy (R² ≈ 0.89), and that conversion-driving campaigns can be reliably identified mid-journey using path-level features. These findings support the argument that marketing efforts should incorporate sequence-level insights into their optimization strategies. Additionally, while the next-best campaign recommendation framework demonstrated strong directional potential, it also highlighted the importance of modeling design in avoiding label leakage and preserving causal validity.
From a practical standpoint, the study underscores the value of predictive analytics in evolving marketing strategies beyond attribution and toward prescriptive interventions. Path-based modeling can inform creative sequencing, audience segmentation, and real-time campaign selection. With additional work on causal inference and operational deployment, these models can be embedded into intelligent marketing systems that optimize performance while preserving user relevance.
In conclusion, this thesis presents a methodological and conceptual framework for utilizing machine learning to enhance digital marketing effectiveness. It paves the way for future advancements in personalization, journey orchestration, and data-driven campaign planning and provides a foundation for marketers seeking to make predictive decisions at every stage of the user journey.
References
- Abhishek, V. , Fader, P. S., & Hosanagar, K. (2012). Media exposure through the funnel: A model of multi-stage attribution. Marketing Science, 31, 362–386. [CrossRef]
- Anderl, E. , Becker, I., von Wangenheim, F., & Schumann, J. H. (2015). Mapping the customer journey: Lessons learned from graph-based online attribution modeling. Journal of Interactive Marketing, 34, 1–16. [CrossRef]
- Berman, R. (2018). Beyond the last touch: Attribution in online advertising. Marketing Science, 37, 771–792. [CrossRef]
- Breiman, L. (2001). Random forests. Machine Learning, 45, 5–32. [CrossRef]
- Bucklin, R. E. , & Sismeiro, C. (2009). Click here for Internet insight: Advances in clickstream data analysis in marketing. Journal of Interactive Marketing, 23, 35–48. [CrossRef]
- Chen, T. , & Guestrin, C. In (2016). XGBoost: A scalable tree boosting system. In Proceedings of the 22nd ACM SIGKDD International Conference on Knowledge Discovery and Data Mining; pp. 785–794. [CrossRef]
- Cramer-Flood, E. (2024, January 10). Worldwide digital ad spending forecast 2024: Growth accelerates—digital dominates. Insider Intelligence.
- Dalessandro, B. , Perlich, C. , Hook, R., & Provost, 281–289., F. (2012). Evaluating online ad campaigns in a pipeline: Causal modeling and econometrics in practice. In Proceedings of the 18th ACM SIGKDD; pp. 281–289. [Google Scholar]
- Fildes, R. , Goodwin, P., Lawrence, M., & Nikolopoulos, K. (2008). Effective forecasting and judgmental adjustments: An empirical evaluation and strategies for improvement in supply chain planning. International Journal of Forecasting, 24, 3–19. [CrossRef]
- Google. (2024). Google Analytics Demo Account: Google Merchandise Store Dataset.
- Gutierrez, P. , & Gérardy, J.-Y. (2016). Causal inference and uplift modeling: A review of the literature. JMLR Workshop & Conference Proceedings, 67, 1–13.
- Hochreiter, S. , & Schmidhuber, J. (1997). Long short-term memory. Neural Computation, 9, 1735–1780. [CrossRef]
- Kumar, V. , & Reinartz, W. (2018). Customer relationship management: Concept, strategy, and tools (3rd ed.). Springer.
- Lemon, K. N. , & Verhoef, P. C. (2016). Understanding customer experience throughout the customer journey. Journal of Marketing 80(6), 69–96. [CrossRef]
- Li, H. , & Kannan, P. K. (2014). Attributing conversions in a multichannel online marketing environment: An empirical model and a field experiment. Journal of Marketing Research, 51, 40–56. [CrossRef]
- Montgomery, A. L. , Li, S., Srinivasan, K., & Liechty, J. C. (2004). Modeling online browsing and path analysis using clickstream data. Marketing Science 23(4), 579–595. [CrossRef]
- Pechmann, C. , & Stewart, D. W. (1990). The effects of comparative advertising on attention, memory, and purchase intentions. Journal of Consumer Research 17(2), 180–191. [CrossRef]
- Pedregosa, F. , Varoquaux, G., Gramfort, A., Michel, V., Thirion, B., Grisel, O., Blondel, M., Prettenhofer, P., Weiss, R., Dubourg, V., Vanderplas, J., Passos, A., Cournapeau, D., Brucher, M., Perrot, M & Duchesnay, E. (2011). Scikit-learn: Machine learning in Python. Journal of Machine Learning Research, 12, 2825–2830.
- Radcliffe, N. (2007). Using control groups to target on predicted lift: Building and assessing uplift model. Direct Marketing Analytics Journal, 14–21.
- Ren, K. , Fang, Y., Zhang, W., Liu, S., Li, J., Zhang, Y., Yu, Y., & Wang, J. (2018). Learning multi-touch conversion attribution with dual-attention mechanisms for online advertising, arXiv:1808.03737.
- Shao, X. , & Li, L. In (2011). Data-driven multi-touch attribution models. In Proceedings of the 17th ACM SIGKDD; 258–264. [Google Scholar] [CrossRef]
- Sutton, R. S. , & Barto, A. G. (2018). Reinforcement learning: An introduction (2nd ed.). MIT Press.
- Tao, J. , Chen, Q., Snyder Jr., J. W., Kumar, A. S., Meisami, A., & Xue, L. (2023). A graphical point process framework for understanding removal effects in multi-touch attribution. arXiv preprint arXiv:2302.06075. arXiv:2302.06075.
- Viloria, A. , Lezama, O., Jaimes, A., & Pérez, J. (2019). Big data marketing during the period 2012–2019: A bibliometric review. Intelligent computing, information and control systems, Springer; 1039, 186–193. [CrossRef]
- Verbeke, W. , Martens, D., Mues, C., & Baesens, B. (2012). Building comprehensible customer churn prediction models with advanced rule induction techniques. Expert Systems with Applications 38(3), 2354–2364. [CrossRef]
- Xu, L. , Duan, W., & Whinston, A. B. (2014). Path to purchase: A mutually exciting point process model for online advertising and conversion. Management Science, 60, 1392–1412. [CrossRef]
Disclaimer/Publisher’s Note: The statements, opinions and data contained in all publications are solely those of the individual author(s) and contributor(s) and not of MDPI and/or the editor(s). MDPI and/or the editor(s) disclaim responsibility for any injury to people or property resulting from any ideas, methods, instructions or products referred to in the content. |
© 2025 by the authors. Licensee MDPI, Basel, Switzerland. This article is an open access article distributed under the terms and conditions of the Creative Commons Attribution (CC BY) license (http://creativecommons.org/licenses/by/4.0/).
Copyright: This open access article is published under a Creative Commons CC BY 4.0 license, which permit the free download, distribution, and reuse, provided that the author and preprint are cited in any reuse.


