
Submitted:
01 August 2025
Posted:
04 August 2025
You are already at the latest version
Abstract
A recently emerging area of molecular biology is focused on the regulatory potential of bacterial RNA fragments that are excised from functional transcripts and acquire an in-dependent role in cells. During processing, some fragments are subject to modifications that may expand their functional inventory. Here we introduce elongation of the 5'-terminal fragments from leucine tRNAs with random sequences as a discriminative feature protecting them from Dps-dependent secretion. By analyzing 14 E. coli datasets we observed an exclusive enrichment of modified LeuT(VPQ) tRNA fragments in intracellular transcriptomes compared to secretomes and revealed dependence of their abundance on growth medium and the presence of competing bacteria. To assess the ordinariness of this modification, we developed a computational pipeline for detecting variable RNA termini in RNA-seq data. Beyond tRNALeuT(VPQ) fragments a few types of genomic loci produced oligos with heterogeneous ends, suggesting that random non-templat elongation, though most abundant in LeuT(VPQ), is not exclusive to these fragments. Regulatory potency of LeuT(VPQ) synthetic analogs tested ex vivo revealed predominantly their stimulatory ef-fect on persistence of multiple taxa in artificial microbiome, which was attenuated by 3'-end elongation. Terminal diversification of certain RNA fragments may, therefore, be considered as a process evolved to broaden the spectrum of regulatory molecules in the cell.
Keywords:
posttranscriptional RNA modifications
; 3’-end modifications
; 3’-end extensions
; polynucleotidilation
; chimeric oligonucleotides
; leucine tRNAs
; Dps
; secreted RNAs
1. Introduction
Being found in all classes of RNAs, posttranscriptional modifications may be considered as functional tools in various processes in living cells [1,2]. The possible effects from these variants can not only result in altered structure and stability of transcripts and their fragments [3], but also influence interaction with proteins [4,5] and affect gene expression [6]. The structural impact is presumed to be the major outcome from RNA modifications [5]. By affecting the intrinsic physico-chemical properties of nucleotides, modifications can actually influence interaction of transcripts with different proteins [7].
More than 170 posttranscriptional alterations have been registered to date [8] across all domains of life [9], many of which are well-studied and have a clear biological role. A wide range of chemical modifications have been described as functionally relevant elements of transfer and ribosomal RNAs. For instance, pseudouridine (Ψ) protects tRNA and rRNA molecules from cleavage, stabilizes their regional structures and prepares rRNAs for proper ribosome assembly, decoding of mRNAs and translation [10]. Inosine in tRNAs plays an essential role in wobble base pairing during translation [11]. Being a prevalent type of RNA modifications in eukaryotes [12], N6-methyladenosine regulates numerous cellular processes, including differentiation [13] splicing [14], mRNA translation [15] and stability [16]. In bacteria, the role of m6A is apparently not so well-studied, and though some authors suggest functional significance of this abundant nucleotide [17], recent studies raise a doubt on its high relevance for bacterial cells and suggest an absence of direct enzymatic recognition mechanism for its formation [18].
A particular group of modifications includes terminal extensions of RNA molecules, and addition of adenines to the 3’-ends of messenger RNAs is known to exist both in higher organisms and bacteria [19, 20]. However, unlike in eukaryotes, where polyadenylation ensures mRNA stability [21], in E. coli and other bacteria it is rather used as a decay signal: poly(A) polymerase I (PAP I) adds poly(A) tails to transcripts, marking them for degradation and assisting in RNA quality control [22].
Another enzyme, PNPase, is bifunctional and can both degrade RNAs via 3′→5′ phosphorolysis and, under certain conditions, add heteropolymeric (A-rich) non-template extensions at their 3′-ends, especially in products originated from Rho-dependent transcription [22,23,24]. Due to this ambiguity, debates are ongoing on its biological significance: whether to consider the PNPase tagging function as a separate process that provides accessible single-stranded overhangs for degradosome-mediated decay [25], or nucleotides are added as a by-process during stalled degradation caused by secondary structures or pauses [26]. According to this concept, structural or sequence barriers may lead to cycles of addition or degradation of a few nucleotides, so the observed tails are an intrinsic outcome of phosphorolysis/polymerization balance rather than a targeted tailing action [22]. Only part of transcripts undergo polyadenilation in bacteria, and in E. coli substrate selection is presumed to be determined by the low level of PAP I, as witnessed from a significant increase in the number of polyadenylated transcripts associated with induced overproduction of this enzyme [27,28]. In vivo, RNA-binding factors, including Hfq, CspE, and S1 protein of the ribosome may influence whether PNPase acts predominantly as polymerase or exonuclease [22]. Notably, PAP I can also interact with Hfq, as well as with PNPase and RNase E in vivo and in vitro [29,30] and the interplay between these enzymes have been proposed to play a major role in deciding between PAP I and PNPase as the polymerizing enzyme [22].
A hallmark of contemporary molecular biology is the increasing focus on the regulatory roles of short RNAs (≤40 nt) derived from processed transcripts of functional genes. Through structural rearrangements or processing-induced modifications, some of these molecules may develop independent cellular or extracellular functions. Assuming the potential regulatory significance of short RNAs with secondary biogenesis in intercellular communications, we have initiated a comprehensive investigation of bacterial RNA secretomes. These extracellular molecular assemblages form composition profiles markedly distinct from intracellular transcriptomes [31,32,33,34], suggesting potential signaling and/or regulatory functions. However, such activities would require both selective export of functional oligonucleotides and protection them against degradation. Posttranscriptional modifications may serve as markers of RNAs designed for secretion and favor their stability maintenance. To investigate this paradigm, we conducted a targeted search for regulatory RNA fragments in E. coli through comparative analysis of intracellular and extracellular RNA fractions from the wild-type K-12 MG1655 and its Δdps mutant strains. We selected the nucleoid protein Dps as a candidate transport factor based on its ability to bind both DNA and RNA [35,36,37,38,39,40] along with several reports of its association with membrane structures [41,42]. Comparative analysis revealed over one hundred transcribed genomic loci with reduced abundance of products in the Δdps secretome, maintaining wild-type or higher levels inside mutant cells [43]. Among specifically secreted oligonucleotides, we identified a nanomere (5’-GCCAAGGCG-3’) frequently attaching to fragments of processed RNAs, i.e. participated in the rarest posttranscriptional modification – chimerization. At frequencies exceeding random ligation probabilities, it formed chimeric molecules predominantly derived from tRNAs. In this study, we expanded the previously undertaken differential analysis to focus on the most frequent posttranscriptional modification - non-template nucleotides incorporation at the 3’-ends of processed RNAs. We revealed striking diversity in the 3'-ends of oligonucleotides derived from 5 of 8 leucine tRNAs; proved exclusive non-random extension patterns in fragments processed from four leucine tRNAs (LeuT, LeuV, LeuP, and LeuQ); and witnessed functional implications of random 3–9 nucleotide extensions incorporated at their 3'-termini.
2. Materials and Methods
2.1. Bacterial Strains
We used Escherichia coli K-12 MG1655 wild-type strain and its dps-null mutant (Δdps; constructed as described in [44] to identify oligonucleotides with Dps-dependent secretion and to assess their influence on bacterial growth in monoculture. For Dps overproduction we used E. coli BL21(DE3) cells, and Rhodospirillum rubrum ATCC 11,170 (R. rubrum) was implemented as an external control taxon in artificial microbiome experiments.
2.2. Extracellular Dps Detection (Western Blot Analysis)
E. coli strains K-12 MG1655, Δdps mutant and BL21(DE3) were cultured overnight in 25 ml of M9 medium. Cells from 1 ml aliquotes were precipitated, resuspended in 100 µl of loading buffer (0.125 M Tris-HCI (pH 6.8), 4% SDS, 20% glycerol, 0.002% bromphenol blue, 10% β-mercaptoethanol), and lysed by heating at 90°C for 10 min. Subsequently, 15 µl samples were analyzed by electrophoresis in 12.5% SDS-PAGE. For extracellular protein analysis, 20 ml of spent medium from E. coli K-12 MG1655 and BL21(DE3) cultures was collected after cell removal and concentrated to 200-360 µl using Amicon® Ultra 3K centrifugal filters (Millipore, Burlington, USA). Following electrophoretic fractionation, proteins were transferred to a PVDF membrane. Fot Dps detection, the membrane was treated with rabbit anti-Dps antibodies [44] followed by horseradish peroxidase-conjugated goat anti-rabbit IgG secondary antibodies. Protein bands were visualized using Pierce™ ECL Western Blotting Substrate (Thermo Scientific, Waltham, USA) and imaged on an iBright™ CL750 Imaging System (Thermo Scientific, Singapore). Band intensities were quantified using ImageJ software (v1.52) [45]. For this experiment, recombinant Dps was purified from E. coli BL21(DE3) cells transformed with the pGEMΔXba-dps plasmid, constructed as described in [46]. Transformed cells were cultured in LB medium supplemented with ampicilin (100 μg/ml) at 37 °C. Gene expression was induced by 0.02 mM IPTG at mid-log phase (OD600 0.4–0.6), followed by 12 h of incubation for Dps production. The purification protocol consisted of sequential ion-exchange chromatography (DEAE-Sephadex A-25, GE Healthcare, Upsala Sweden) and gel filtration using Sephadex G-200 (Pharmacia/Cytiva, Upsala, Sweden). The protein was then concentrated using Vivaspin-20 centrifugal concentrators (Sartorius, Goettingen, Germany), dialyzed against storage buffer (50 mM Tris-HCl (pH 7.5), 50 mM NaCl, 0.1 mM EDTA, 5% of glycerol) and stored in the freezer.
2.3. RNA Purification and Sequencing
Intracellular RNAs were isolated from 15 ml of bacterial cultures using TRIzol reagent (Invitrogen, Carlsbad, USA) and following protocols optimized previously [32,33,47]. Small RNA enrichment was performed using the mirVana miRNA Isolation Kit (Ambion, Austin, USA). For extracellular RNAs (exoRNAs) isolation, 1 ml of cell-free culture medium was obtained by centrifugation (2,000 rpm, 20 min) followed by double filtration through 0.22 μm sterile syringe filters. exoRNAs were purified using the miRNeasy Serum/Plasma Kit (Qiagen, Hilden, Germany) and their concentrations were estimated using Qubit 3.0 fluorometer (Thermo Fisher Scientific, Singapore) and Qubit RNA HS Assay Kit (Thermo Fisher Scientific, Eugene, USA). RNA sequencing libraries were prepared according to the standard protocol of Ion Total RNA-Seq Kit v2 (Thermo Fisher Scientific, Carlsbad, USA) with minor modifications. For precise identification of oligonucleotide termini, RNA samples underwent 5’- and 3’-ends adapter ligation. Following reverse transcription, samples were purified using AMPure XP (Beckman Coulter, Brea, USA). PCR amplification was performed with 0.7 μl of each v2 primers, after which the products were purified with the Monarch PCR & DNA Cleanup Kit (New England Biolabs, Ipswich, USA). Size selection was carried out by electrophoresis in a 6% polyacrylamide gel using Quick-Load pBR322 DNA-MspI Digest DNA ladder (New England Biolabs, Ipswich, USA) as a length marker. Gel areas with cDNA amplicons (90-123 bp) were excised and minced. Target products were eluted overnight using Elution Buffer from the NEBNext Multiplex Small RNA Library Prep Set for Illumina (Set 1) (New England Biolabs, Ipswich, USA). Subsequent sample preparation steps, including cDNA precipitation, pellet washing and resuspension in Low TE buffer, were performed following the NEBNext Multiplex Small RNA Library Prep Set for Illumina (Set 1) protocol. Library concentration was estimated using Qubit 3. Libraries were diluted to 100 pM and subjected to emulsion PCR using the Ion OneTouchTM 2 System with Ion PGM Hi-Q View OT2 Kit (Thermo Fisher Scientific, Carlsbad, USA). Sequencing was performed on an Ion Torrent PGM analyzer (Thermo Fisher Scientific, Carlsbad, USA), and the resulting sequencing libraries were deposited in the NCBI SRA database (Table 1).
2.4. Pre-Processing of RNA-seq Datasets and Their Mapping to the Genome
Quality filtering was performed using the Filter by Quality tool on the UseGalaxy.org platform [48], retaining only reads with ≥90% of nucleotides meeting a Q20 quality threshold. Adapter sequences were removed by Ion Torrent PGM software followed by an additional trimming of 3’-end sequences containing ATCACCGACTGCCCA(N)n, (the 5’-terminal sequence of adapter) motifs. Trimmed reads were sorted by length (16–50 nt) and fragments of each size were separately aligned to the genome of E. coli K-12 MG1655 (NCBI RefSeq accession NC_000913.3) [49]. For 5'-end mapping of the obtained reads we used Matcher software (http://www.mathcell.ru/DnaRnaTools/Matcher.zip Last excess 28.07.2025) [32,32,44,50] requiring precise coincidence with the genome. Reads with sequences matching several genomic loci were attributed to all of them in equal proportions. Reads with different lengths in each position were summarized, providing the profile of their 5’-ends distribution over the entire genome.
2.5. Search for Oligonucleotides with Dps-Dependent Secretion
The search for genomic regions producing potential signaling exoRNAs was carried out as described in [43] with modifications aimed to increase the sensitivity of the approach for detecting modified oligonucleotides. Matcher-derived profiles were normalized per 1 million of quality-controlled reads (16-50 nt) in each of the eight experiments (Table 1). For differential analysis, transcript counts were summed within sliding 5 bp windows (1 bp step size). The mean read counts across four types of paired experiments for each window were then calculated. For genomic loci, yielding at least 25 reads, the ratio of product abundances among the wild type and mutant strains was calculated. Candidate selection required: (1) ≥1.5-fold reduced abundance in the Δdps mutant secretome, and (2) comparable or elevated levels in the Δdps intracellular transcriptome. For each candidate region, we identified the peak position with maximum read number and compared the wild-type and mutant transcriptional outputs.
2.6. Search for Textual Deviations from the Genomic Sequences
Reads derived from the selected genomic loci were assembled using unique “anchors” defined by 5’-ends corresponding to peak maxima and sufficient length (12-14 nt) to ensure specificity (Figure 1a).
The obtained reads were aligned to the E. coli K-12 MG1655 genome using either Excel sorting option or MUSCLE [51] available at the EMBL-EBI service platform. The identified sequence deviations were classified into three categories. (1) Non-template additions: 1-3 nt extensions of any sequence at either end, or longer extensions containing only 1-2 distinct nucleotides. (2) Chimeras: ≥4 nt extensions at any end containing ≥3 distinct nucleotides. (3) Insertions or deletions (Indels) and (4) base substitutions (Mismatches) occurring outside terminal triplets. A total number of reads with such modifications was required to accurately quantify the percentage of reads containing 3'-end extensions, which were the focus of this study. For classification purposes, each read was counted as a single erroneous sequence even when containing multiple deviation types, though all individual deviations were recorded for frequency calculations. Deviation frequencies were calculated as mean values from two experimental replicates when each contained ≥100 reads. For sample sets contained fewer reads, the outputs of two replicate experiments were either pooled or ignored (if the total count was less than 80).
2.7. Search for Oligonucleotides Containing Random Sequences at the 3’-End (RandExt Algorithm)
The RandExt algorithm has been developed to detect transcripts containing random sequences at the 3'-ends (Figure 1b). The software processes oligonucleotides of user-defined length determined by both the target k-mer size at the 5'-ends and the desired length (L) of non-templated 3'-sequences. At the preliminary stage, the algorithm identifies and removes the remnants of the 3’-adapter by its 5’-terminal sequence (ATCACCGACTGCCCA) in the reads and also filters out reads that perfectly match the genome. Since our Ion Torrent PGM sequencing datasets contained negligible 5'-adapter contamination (if any), the algorithm does not include 5'-adapter removal option. The remaining reads are aligned to the genome and those, which match the genome sequence exceeding the specified k-mer length, are ignored. For reads containing sequence difference from the genome copy numbers are determined, and sequence diversity is then assessed using the Shannon index: H = -Σpi x Ln(pi), where pi represents the frequency of each unique oligonucleotide. For flank analysis with L = 4, we required complete sequence divergence from the genome. For longer extensions, L-4 matching nucleotides were permitted. The algorithm is available at: https://mathcell.ru/prog/StudyRna.rar (last access 25 July, 2025).
2.8. Datasets Used to Analyze LeuTVPQ Extentions Depending on Culture Media, the Presence of Competing Bacteria and Exogenous Oligonucleotides
To examine the influence of growth conditions on LeuTVPQ terminal modifications, we analyzed twenty RNA-seq datasets previously obtained from E. coli intracellular transcriptomes or secretomes [32,33,43,52]. All datasets contained fraction of short oligonucleotides, from cells grown in either M9 medium or Luria-Bertani (LB) broth (Table 2). The datasets were processed and evaluated as described in section 2.4, except that LB-born RNAs were removed from the datasets as described in [33].
2.9. Evaluation of the Effect of LeuTVPQ with Non-Template Nucleotides at the 3'-Ends on the E. coli Growth in Monoculture
Growth experiments were carried out in 0.2 mL volume in 96-well TC Plates, Suspension, F (Sarstedt AG & Co, Nümbrecht, Germany) in Synergy H1 Hybrid Multi-Mode Reader (BioTek Instruments Inc, Berlin, Germany), at 37°C, with agitation. Depending on the task, M9 mineral medium, Luria-Bertani broth (tryptone 1.0 g/L, yeast extract 0.5 g/L, and NaCl 1.0 g/L) or complex Gut Microbiome Medium (GMM) were used in these experiments. GMM contained tryptone peptone, 0.2%; yeast extract, 0.5%; D-glucose, 2.2 mM; L-cysteine, 3.2 mM; cellobiose, 2.9 mM; maltose, 2.8 mM; fructose, 2.2 mM; meat extract, 0.5%; KH2PO4, 10 mM; MgSO4 × 7H2O, 0.008 mM; NaHCO3, 4.8 mM; NaCl, 1.37 mM; Tween-80, 0.05%; CaCl2, 0.072 mM; resazurin, 4 μM; vitamin K, 5.8 μM; FeSO4 × 7H2O, 1.44 μM; histidine-hematin stock solution, 0.1% (1.2 mg/mL hematin in 0.2 M histidine), vitamin mix, 1.0%; trace mineral mix, 1.0%, pH 7.0). Filter-sterilized vitamin K, FeSO4 × 7H2O, histidine-hematin solution, vitamin mixture, and trace element mixture were added to the total volume of autoclaved sterilized medium before inoculation. An inoculum of E. coli K12-MG1655 was prepared by diluting an overnight culture to OD600 = 0.5. This inoculum was then added to fresh medium at a 1:500 dilution yielding approximately 105 CFU/ml. For the assay, 190 μl aliquots of inoculated culture were dispensed into plate reader wells, followed by addition of 10 μl of either dissolved synthetic RNAs (Syntol, Moscow, Russia) or sterile water as control. Synthetic analogs of oligonucleotides (Table 3) were added to the bacterial culture to a final concentration ranging from 2,5 to 1000 μM, and the bacterial growth was carried out at 37°C under aerobic conditions with dynamics monitoring by measuring OD600 for 24-48 hours.
To assess the functionality of terminal extensions, three synthetic analogs of model oligonucleotides containing random sequences at the 3’-end (LeuTVPQ_3N-6N) were used (Table 3). Their effect was compared with the influence of oligonucleotides with genomic sequences of the same length in growth experiments using LB and GMM media.
2.10. Revival of Rat Fecal Bacteria in GMM and Their Treatment with Synthetic Oligonucleotides
The medium prepared as described above, was heated at 80°C to ensure complete dissolution of all components, then cooled under CO2 flow and transferred to N2-purged Hungate tubes. After sealing, the tubes were sterilized at 121°C for 20 minutes. Fecal samples (0.2-0.3 g) from five laboratory rats were homogenized in 1 mL of GMM, as suggested in [53]. Following homogenization, insoluble particles were pelleted using a spinner and the supernatant from each of homogenized fecal samples was aseptically transferred into Hungate tubes containing 10 mL of fresh GMM using sterile syringes. The inoculated medium was cultured at 37°C for 48 h with gentle agitation. The resulting culture was then divided equally to five aliquots and transferred to fresh Hungate tubes containing an equivalent volume of GMM. One aliquote of each sample derived from the feces of each rat were used as a control, while the remaining four were supplemented with model oligonucleotides listed in Taблe 3 at a final concentration of 200 or 400 µM. The cultures were maintained at 37°C, with the second addition of oligos at identical concentrations after 24 hours, followed by continued cultivation for another 24 hours.
Bacterial cultures from all twenty-five samples were peletted by centrifugation (3,000 rpm, 20 min) and washed twice with sterile PBS. Genomic DNA was then extracted using the EasyPure® Stool Genomic DNA Kit (TransGen, Beijing, China) following the manufacturer’s protocol for pathogenic bacteria. DNA was eluted from the filtes by applying two sequential 30 μL aliquotes of elution buffer. DNA concentration was measured using a Qubit 3.0 fluorometer (Thermo Fisher Scientific, Singapore), while sample purity was assessed by measuring A260/A280 and A260/A230 ratios on a NanoDrop ND-1000 spectrophotometer (Thermo Scientific, Wilmington, DE, USA).
2.11. Amplicon Sequencing of 16S rRNA Genes for Taxonomic Analysis
The impact of model oligonucleotodes on ex vivo cultured fecal bacteria was evaluated by 16S rRNA phylotyping. PCR amplification was carried out in 2 × 25 μL reactions using Veriti 96-well Thermal Cycler (Applied Biosystems, Thermo Fisher Scientific, Foster City, CA, USA) with Q5 High-Fidelity DNA Polymerase (New England BioLabs, Ipswich, MA, USA) and universal primers 27f and 1492r (Evrogen, Moscow, Russia). Prior to amplification, DNA samples were normalized to 50 ng/μL and 1 μL per 25 μL reaction was used as a template. The thermal cycling protocol consisted of: initial denaturation (95°C for 5 min); 30 cycles of synthesis (95°C for 1 min, 59°C for 1 min, 72°C for 1.5 min); final extension (72°C for 5 min). Amplification efficiency was verified by electrophoresis of 2 μL aliquotes of PCR products in a 1% agarose gel with ethidium bromide staining. Amplicons were then purified using AMPure XP magnetic beads (Beckman Coulter, Brea, CA, USA). Sequencing libraries were prepared using the the Native Barcoding Kit 96 V14 (SQK-NBD114.96) protocol, with modified incubation times for enzymatic reactions: the DNA repair step using NEBNext® Ultra™ II End Repair/dA-Tailing Module (New England Biolabs, Ipswich, MA, USA) was extended to 25 min, and the ligation step was run for 60 min. The barcoded libraries were then loaded onto a PromethION Flow Cell (R10.4.1) and sequenced. The sequencing parameters selected in the MinKNOW GPU v23.04.3 program were: quality threshold - QC 9, basecalling model - high accuracy (Dorado 7.2.11 algorithm, dna_r10.4.1_e8.2_400bps_hac@v4.3.0), activated demultiplexing function with removal of barcodes and adapters. Complete sequencing statistics for all samples are provided in Supplementary Table S1.
2.12. Taxonomic Analysis of Ex Vivo Cultured Bacterial Communities
The obtained amplicons were taxonomically classified using EPI2ME Desktop V5.2.2 software with the Metagenomics workflow with Kraken2 classificator [54]. The resulting datasets contained 203,684-414,638 sequences successfully classified to 195 bacterial genera. Relative taxon abundances were calculated as percentages of total reads in each of the 25 datasets. To enable these calculations, we added one pseudocount to genera that received zero assigned reads, thereby preventing division by zero errors. To minimize inconsistency from low-abundance genera, we applied the following inclusion criteria: for taxa showing increased abundance, the experimental sample required ≥0.01% representation; for suppressed taxa, the control sample required ≥0.01% presence. Genera meeting these thresholds in at least four of five paired samples were retained for downstream analysis. For each qualifying genus, we calculated fold change ratios (FCRs) and averaged them across replicates (n=4-5). Standard deviations (StDs) and Z-scores were computed in Excel, with FCR = 1 as the null hypothesis. For Z-scores <8, p-values were derived using Excel 1-NORM.S.DIST(Z,TRUE) function. Z-scores ≥8 were analyzed separately in R to ensure accurate extreme value estimation.
2.13. Statistics
Statistical analyses were performed using SigmaPlot (v11.0). We first assessed data normality using the Shapiro-Wilk test. If the datasets violated normality assumptions, group comparisons were conducted using the non-parametric Mann-Whitney U test (via SigmaPlot "Compare Two Groups" function) to evaluate median differences. To assess the statistical significance of posttranscriptional modifications, we combined replicates from wild-type E. coli K-12 MG1655 and Δdps mutant strains. P-values were calculated across four datasets, with Bonferroni correction applied for multiple comparisons. Due to non-normality, variability was also assessed using mean absolute deviations (MAD) instead of two-way ANOVA. We used the Pearson correlation coefficient (R) to assess the consistency of RNA-seq datasets. The statistical significance of R was estimated using a VassarStats online tool (http://vassarstats.net/tabs_r.html, last access on 25.07.2025) [55].
3. Results
3.1. Dps Protein Found in Culture Milieu May Promote the Release of RNAs from Cells
Inspired by literature data on the presence of nucleoid protein Dps in membrane structures [41,42], and keeping in mind our pull-down assay results indicating Dps ability to retain short RNAs in vitro [39], we perormed Western blotting to assess the amount of Dps present in the culture medium (Figure 2a).
As expected, no reactivity with anti-Dps antibodies was found in the E. coli_Δdps mutant lysates (Figure 2a, lane 1), whereas E. coli K-12 MG1655 cell population accumulated a detectable amount of this protein both inside and outside the cells (lanes 2 and 3). Induction of the recombinant dps expression from the pGEMΔXba-dps vector in E. coli BL21(DE3) cells gave an obvious increase in the amount of this protein (lanes 4 and 5). Quantitative analysis using ImageJ showed that 0.34 ± 0.07% of total Dps is located extracellularly in the wild-type strain, and in E. coli BL21(DE3) culture its extracellular level was approximately at the same level (0.52 ± 0.12%). Thus, although Western blotting has inherent limitations for precise quantitation method, and the sensitivity of two strains to excess Dps may be different, it is likely that overproduced Dps does not reach cytotoxic concentrations requiring its active export and adaptation at the level of gene expression.
We assumed that Dps appearance in culture medium, either through membrane translocation or due to release from lysed cells, could enhance extracellular accumulation of short RNAs. To test this assumption, we conducted differential RNA-seq analysis comparing the sectetomes and transcriptomes of the wild-type and Δdps mutant strains. Eight RNA-seq experiments were performed. Four of them (denoted by asterisks in Table 1) were carried out simultaneously, with parallel isolation of intracellular and secreted RNAs from both strains. Four other experiments were conducted separately to assess reproducibility of transcriptomic data.
The obtained sequence reads were aligned to the E. coli MG1655 genome, using the option of Matcher software [50,55] when only reads ideally coinciding with the genomic sequence were retained, and only their 5’-ends were mapped. Normalized expression profiles demonstrated strong correlation between replicates, which was maximal for two samples with intracellular RNA fragments from the Δdps mutant (R = 0.98). An inferior, but still high correlation (R = 0.58) was observed for two extracellular RNA sets (exoRNAs) from the mutant strain. Two wild-type replicates correlated with R = 0.90 (intracellular samples Eco_in_M9_ 1 and 2) and R = 0.65 (extracellular samples Eco_exo 1 and 2).
Figure 2b,c display four profiles averaged over two paired experiments. The differences between similarly colored profiles in Figure 2b,c confirms an already known difference in the spectra of secreted and intracellular RNAs [31,32,33]. The difference between the outer and inner profiles in panels 2b and 2c reflects variations in the transcriptional output in the parental strain and Δdps mutant, consistent with non-random Dps binding pattern across the E. coli genome [44]. The absence of Dps appears to have only moderate effects, as evidenced by the strong correlation (R = 0.92) between the wild-type and mutant transcriptomes (Figure 2d). In contrast, secretome profiles, showed minimal similarity (R = 0.134, Figure 2e), indicating their pronounced Dps dependence. This dramatic loss of correlations primarily resulted from numerous oligonucleotides with a high difference in the abundance patterns. As shown in Figure 2e, many data points align along the axes, representing oligonucleotides that are highly abundant in the Eco_exo samples, while being at almost the background level in the mutant secretomes (or vice versa). Most of these discrepancies arise from small shifts in the positions of peaks in the 5’-ends profiles. Without including these points, the correlation in the main part of the dataset increases, but only to R = 0.74. Thus, while the major changes arise from shifted 5'-ends of reads rather than from global variance in the RNA content, RNA secretome is clearly sensitive to Dps.
3.2. RNA-seq Analysis Revealed Oligonucleotides with Potential Dps-Dependent Secretion
Following our previous strategy [43] we combined replicate profiles to identify genomic regions, yielding products with ≥1.5-fold decreased representation in the Δdps mutant secretomes, maintaining wild-type or higher levels in intracellular transcriptomes. The previous analysis revealed 132 genomic loci corresponding to these criteria [43]. Fragments of tRNAs and sRNAs, the genes of which occupy only 0.14% and 0.4% in the genome, were significantly overrepresented among these regions, accounting for 23.5% and 19.7% of the identified loci, respectively. A similar binding preference was observed in our pull-down experiments with immobilized Dps and E. coli intracellular RNAs [39], indicating that short tRNA and sRNA fragments have a predominant affinity to Dps. The rationale to reevaluate the previous analysis was based on two key observations: fragments of only 10 types of tRNAs were identified as potential Dps partners and not all homologous tRNAs exhibited similar dependence on Dps [43]. To understand the biological basis of this apparent selectivity, we developed an improved search strategy for the current study.
By changing the normalization of datasets from the number of genome-mapped reads to the number of quality-controlled reads, we accounted for the contribution of unmapped reads, the moiety of which contains modified oligonucleotides. By increasing the minimum length of analyzed reads from 12 to 16 nucleotides, we excluded predominantly unmodified short oligonucleotides. Finally, by reducing the running window from 10 to 5 bp and adding a peak pinpointing step, we ignored oligonucleotides differing in 5’ends. These refinements still yielded 102 genomic loci meeting our criteria for differential transcriptional output and secretion between the wild-type and mutant strains (Supplementary Table S2). This final set contains one or even two fragments derived from different stem-loop structures of 19 tRNA types, including SelC. However, fragments of all isoleucine and methionine tRNAs, as well as oligonucleotides derived from homologs of some selected tRNAs, were not identified.
Their inspection in most cases revealed only quantitative deviation from the criteria used (Table 4). However, fragments derived from methionine and arginine tRNAs, along with ileV and valT(Z) gene products, exhibited an opposite Dps-dependence (Table 4). Thus, the scale and type of Dps dependence are not universal for all tRNA fragments.
3.3. Fragments of Homologous Leucine and Serine tRNAs Exhibited Different Patterns of 3’-End Posttranscriptional Modifications
To identify the structural or sequence features distinguishing homologous tRNAs with different dependence from Dps, we analyzed their fragmentation profiles, using the 5’-ends of precisely mapped reads as markers of endonucleolytic cleavage sites. We focused on serine and leucine tRNAs, as only SerV among the four serine tRNA types exhibited Dps dependence, while among the five leucine tRNAs, only LeuW avoided significant suppression in the secretomes (Table 4 and Supplementary Table S2). However, visualization of fragmentation profiles of all these tRNAs and calculation of Pearson correlation coefficients as a metric of similarity, revealed no discernible differences between cognate tRNAs with various Dps dependence. Surprisingly, fragmentation profiles showed even a strong correlation across the different strains and sample types (transcriptomes vs. secretomes; Figure 3a). This observation suggests that Dps is unlikely directly involved in either RNA degradation or their protection from nucleolytic cleavage.
Analysis of unmapped oligonucleotides, on the contrary, was more informative. Focusing on 3’ non-templated extensions as the main source of sequence deviations, we observed that the fraction of “correct” SerV-tRNA fragments precisely matching to the genome was the smallest compared to oligonucleotides derived from other serine tRNAs with weaker dependence on Dps (Figure 3b). At the same time, the percentage of reads with 3’-end non-template extensions was the highest in all types of experiments (Figure 3c). By explaining the dependence of the number of correct reads, this also drew our attention to 3’-terminal modifications as potential discriminatory features. The situation with leucine oligonucleotides turned out to be even more interesting. Fragments derived from LeuZ and LeuX tRNAs, exhibit the same pattern of distribution among correct and terminally extended reads as fragments of SerV tRNA (Figure 3d,e). Their dependence on Dps may be driven by an elevated proportion of erroneous sequences in the mutant strain’s secretome compared to the wild-type cells, while LeuW oligonucleotides may not meet the selection criteria due to the minimal error rate in the Δdps_exo dataset (Figure 3e). Exceptionally low levels of correct reads among oligonucleotides derived from LeuU and identical LeuT, V, P, Q tRNAs (further LeuTVPQ) in combination with unusually frequent non-template incorporations at their 3’-ends in transcriptomes (Figure 3d,e) represented a specific pattern of their distribution and prompted our focused investigations of LeuTVPQ fragments.
3.4. Fragments of Leucine tRNAs Exhibited Three Different Modes of 3’-End Modifications
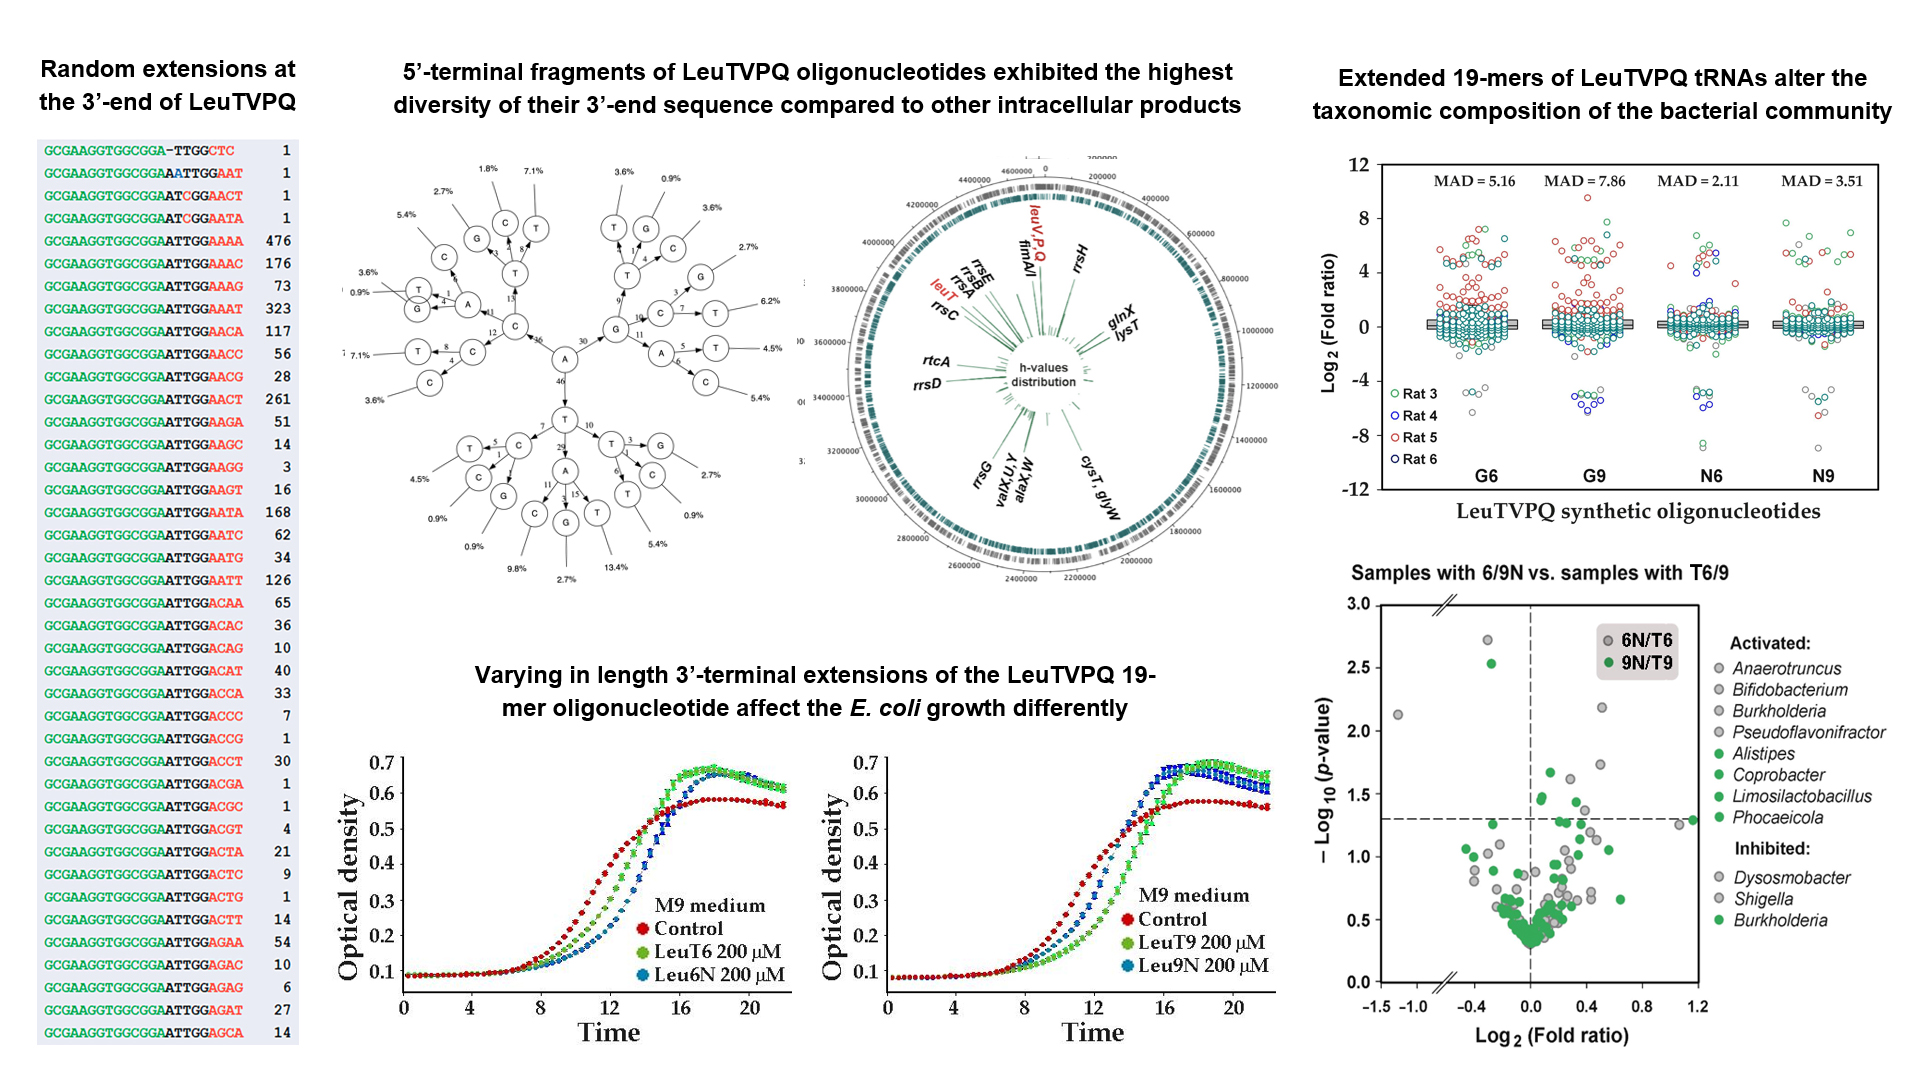
In E. coli, leucine is encoded by five codons (CTA, CTC, CTG, TTA and TTG) and is delivered to ribosomes by tRNAs transcribed from eight genes [56]. Four of them (leuTVPQ) share nearly identical sequences, all with anticodon CAG, differing only by a single nucleotide in the variable loop of LeuP (Figure 4a).
These genes are organized into two operons argX-hisR-leuT-proM and leuQ-leuP-leuV. Genes for LeuW (UAG) and LeuZ (UAA) are located within the operons metT-leuW-glnUW-metU-glnVX and glyW-cysT-leuZ-3’ETS, respectively. LeuX (CAA) is transcribed individually, while LeuU (GAG) is part of a unique E. coli operon (secG-leuU) that encodes both a protein and a tRNA. All leucine tRNAs undergo D-arm loop cleavage by endonucleases, but deviation analysis of their 5’-terminal fragments revealed distinct patterns of posttranscriptional modifications at the 3’-ends. The fragments from LeuX, LeuZ, and LeuW tRNAs displayed size and copy number distributions with the 3’-end extensions in most of the analyzed samples (Supplementary Table S3). Typically, only one or two non-template nucleotides were detected in ~5% of reads, with longer extensions being progressively rarer. Thus, the most abundant oligonucleotides in the RNA-seq datasets are correct (Figure 3b,d). In contrast, LeuTVPQ and LeuU fragments exhibited a significantly higher rate of reads with non-template motifs at their 3’-ends (Figure 4c). For LeuTVPQ this primarily resulted from the consistent incorporation of random nucleotides to the growing end of the GCGAAGGTGGCGGAATTGG 19-mer (marked by an asterisk in Figure 4b). A similar phenomenon was at least partly observed for LeuU fragments from the highly similar 5’-terminal 19-mer GCCGAGGTGGTGGAATTGG (Figure 4a). Consequently, while LeuXZW fragments rarely contain even single non-template nucleotides, LeuTVPQ fragments incorporated nearly all 64 possible triplets in one experiment and more than half of the 256 possible tetraplets (Figure 4d and Supplementary Table S3).
Most tetraplets found at the ends of other reads displayed predominant sequence motifs, leading us to classify them as “chimeras” resulting from illegitimate ligation of short oligos. However, LeuTVPQ-associated “chimeras” exhibited two distinct properties: (1) they were predominantly linked to the 3'-ends of specific 19-mers, and (2) in some cases, their stepwise elongation could be traced up to 26-mers. These observations suggest the potential involvement of a specific RNA polymerase in this process. While LeuU tRNA fragments also frequently contained 3’-end extensions on their 5’-terminal 19-mer, these tails showed less diversity compared to LeuTVPQ reads (Figure 4d and Supplementary Table S3), which implies some difference in the biogenesis mechanism for these two types of modifications.
3.5. LeuTVPQ tRNA Fragments Show Exceptional 3’-End Extension Diversity but Are Not Exclusive Substrates for This Modification
It is already well-known that some bacterial RNAs are polyadenylated. While poly(A) polymerases primarily incorporate adenines, they occasionally add other nucleotides, with cytosine (C) being the most common. However, in oligos derived from LeuTVPQ, we observed an extraordinary variability in the 3’-terminal extensions (Supplementary Table S3), which only moderately followed the expected preference for A and C. To assess the uniqueness of the phenomenon, we developed RandExt algorithm to identify reads with heterogeneous sequences (Figure 1b) and provide copy numbers and Shannon diversity indices (H) in its output files. The analysis was focused on short oligonucleotides (k-mers) ranging from 13 to 22 nucleotides in length, containing non-template flanks of 4 - 10 nt. Since secretomes usually possessed a lower level of reads with variable 3’-ends compared to transcriptomes (Figure 3c,e), we evaluated the uniqueness of the phenomenon using only the transcriptomic data of the wild-type strain and Δdps mutant (Figure 5a,b).
While selecting reads with variable ends across all four datasets using H>2.0 as a threshold, we identified only 121 genomic locus as their potential origins (Figure 5a,b and Supplementary Table S4). The output data varied depending on parameter combinations used (k-mer length and extension size L), affecting both read counts assigned to a specific position and the resulting H-value assessed from a particular program run. Due to the non-linear dependence of H-values on the profile of detected reads, they cannot be meaningfully averaged. We therefore used the maximal H-index in each genomic position revealed by using 56 parameter combinations (a total of 224 program runs for 4 datasets) and identified LeuTVPQ fragments as the most variable oligonucleotides (H = 4.46) (Figure 5a).
LeuU fragments showed a significantly lower diversity (H = 1.95), falling below the threshold. The next significantly varied oligonucleotides (H = 4.14) were processed from an intergenic region flanking 16S rRNA genes (Figure 5c). This region is transcribed from two promoters located 286 and 178 bp upstream of the ribosomal operon. The transcripts are cleaved by an endonuclease 115 nt from the 5’-end of 16S rRNA (red asterisk in Figure 5c), predominantly yielding 22-nt oligonucleotide, which appeared to undergo substantial sequence diversification.
Being highly consistent with the distribution of the most variable RNA fragments Figure 5a), the profile based on their normalized abundances (Figure 5b) differed in the relative amplitudes of peaks. The most pronounced discrepancy was observed for reads mapped to the beginning of RtcA mRNA, encoding RNA 3'-terminal phosphate cyclase. RtcA fragment variability was only detectable using specific parameter combinations: short k-mers (13-14 nt) and long flanking regions (L = 7-10 nt). The identity of RtcA anchor 13-mer with the 5’-terminal 13-mer of LeuTVPQ tRNA, in combination with the absence of an AAUU motif in RtcA fragments (Figure 5d), means that most leucine tRNA fragments with non-templated extensions, contribute to the observed abundance of fragments assigned to RtcA (Figure 5b), although their variability is lower (Figure 5b, H = 3.9). Although similar cross-contribution may take place for other RNA fragments, their limited occurrence will not hinder similar verification. In any case, the confirmed diversity of LeuTVPQ 3’-termini prompted us to assess their potential functionality.
3.6. Presence of Modified LeuTVPQ Fragments in Transcriptomes and Their Influence on E. coli Growth in Monoculture are Medium-Dependent
Extraordinary diversity observed at the termini of one of the leucine tRNA fragments represents a new phenomenon, the biological role of which is only speculative. At this stage, the key question is whether further investigation is advisable. Assuming that the most sensitive indicator of the functionality of a new agent is its temporal or spatial specificity, we studied 16 additional RNA-seq libraries (PRJNA687658, GSE221667). Among these, 10 datasets derived from secretomes showed nearly undetectable levels of extended leucine tRNAs fragments. This is probably one of the most important results of our study suggesting that their localization is tightly regulated, though precluding their statistical analysis. The remaining six datasets (Eco_in_LB_1/2, Eco_Pr_1/2 and Eco_Rh_1/2) contained intracellular RNAs from E. coli grown in Luria-Bertani broth, either as a monoculture, or in resource-shared conditions with Prevotella copri or Rhodospirillum rubrum (Table 2). Those co-cultures were maintained in membrane-separated compartments within a common chamber [52].
The numbers of correct and modified LeuTVPQ 19-mers were estimated in 10 replicate experiments for oligonucleotides sized 20-23 nt, and their ratios were used as a metric reflecting excessive abundance of modified fragments (Figure 6a). We observed that modified 19-mers in cells grown in M9 medium (Eco_M9_in_1/2 and Δdps_M9_in_1/2) always exceeded correct oligonucleotides in number. Among these, reads with non-templated triplets showed a 20-fold excess over correct 22-nt reads (Figure 6a). In contrast, transcriptomes from cells cultured in LB medium did not display such a pronounced accumulation of random 3 nt extensions in LeuTVPQ fragments. Although cells grown in LB had, on average, 7-fold excess of oligonucleotides with incorrect terminal monomers, their ratio for longer extended RNAs fell below 1:1 even at the level of trimers (Figure 6a). Notably, the same distribution pattern of modified versus unmodified RNA fragments was observed in the transcriptomes [52] from E. coli cells grown adjacently to P. copri or R. rubrum (dark cyan and red bars). Thus, it is likely that the biogenesis of extended RNAs in cells depends on some specific components of LB medium that we have not been able to identify yet.
Figure 6b illustrates the impact of LeuTVPQ 19-mer on the E. coli growth dynamics in M9 medium. A concentration of mere 2.5 μM induced notable growth suppression, while 5 μM produced a clear bacteriostatic effect and promoted a higher cell density at stationary phase compared to the control (Figure 6b). At the same time, significantly higher concentrations of synthetic oligonucleotides were required to inhibit E. coli growth in LB broth (Figure 6c). This inhibition proceeded without lag-phase extension and never exceeded the control cell density at stationary phase. Longer oligonucleotides (LeuT3, LeuT6 and LeuT9), prepared as control samples for randomly extended synthetic Leu3N, Leu6N and Leu9N caused weaker growth delays compared to the 19-mer (Figure 6b,d–f), and random terminal triplets typically showed minimal or no effect on growth (Figure 6d). However, 6- and 9-nt extensions consistently altered E. coli growth dynamics in monocultures retaining typical for M9 medium growth profile. Therefore, at the final stage of this study we tested the influence of potentially functional Leu6N and Leu9N (Figure 6e,f) on the taxonomic composition of microbiomes transferred of laboratory rat feces to GMM.
Longer oligonucleotides (LeuT3, LeuT6 and LeuT9), prepared as control samples for randomly extended synthetic Leu3N, Leu6N and Leu9N caused weaker growth delays compared to the 19-mer (Figure 6b,d–f), and random terminal triplets typically showed minimal or no effect on growth (Figure 6d). However, 6- and 9-nt extensions consistently altered E. coli growth dynamics in monocultures retaining typical for M9 medium growth profile. Therefore, at the final stage of this study we tested the influence of potentially functional Leu6N and Leu9N (Figure 6e,f) on the taxonomic composition of microbiomes transferred of laboratory rat feces to GMM.
3.6. 5’-Terminal 19-mers from LeuTVPQ Are Involved in Artificial Microbiome Shaping Depending on the Presence and Length of Their Random Extensions
Assuming that random sequences in model nucleotides N6 and N9 might promote or enhance RNA interference in bacterial consortia, we added R. rubrum bacteria, as an external species to assess its sensitivity to model oligos. This bacterium was introduced to the culture medium prior to inoculation to a final concentration of 4 × 10⁶ CFU/mL and was detected in all control samples with consistent persistence (0.0071 ± 0.0007). Following oligonucleotide supplementation, their relative abundance increased in all microbiomes, ranging from on average 1.49 ± 0.43 fold in three microbiomes to over 12-folds in some experimental consortia from rats 3 and 5 without apparent dependence from the type of 3’-end extensions. This response precluded R. ribrum application as a neutral reference taxon, but likely reflects its specific reaction to oligonucleotide exposure. Nevertheless, the bacterial response to the oligonucleotides was sufficiently congruent to follow the adaptive reaction of nearly 100 genera, and many other taxa exhibited an increased abundance in the microbiome of rat 5 response to oligos T6 and T9 compared with unexposed control samples (red dots in Figure 7a). Their response to the randomly modified 6N and 9N appeared to be more consistent with bacteria of other samples. Decreased Mean Absolute Deviation (MAD) values in the combined set of FCRs provide a quantitatively estimation consistency (Figure 7a).
While introduction of oligonucleotides with the genomic sequence (T6 or T9) increased the abundance of many taxa, only 16 genera exhibited statistically significant expansion (Figure 7b). In most cases, the large increase (up to 3 folds, Log2 = 1.58) was statistically insignificant. Minor suppression, on the contrast, was registered only for Limosilactibacillus and Desulfovibrio. It should be considered, however, that dead cells also contribute to the rate of detected bacteria. Thus, the number of inhibited taxa is underestimated.
Terminally diversified LeuTVPQ oligos decreased variability in the bacterial responses (Figure 6a) thereby increasing the number of both reliably activated and suppressed taxa (Figure 7c). Although only 5 of 16 genera from panel (b) appeared in the set of bacteria stimulated by diversified oligonucleotides (panel c), eight more of them were also activated in 4 of 5 microbiomes. Thus, the data were rather consistent. We then compared the effects from oligonucleotides with random 3’-end extensions and those having genomic sequences at the end (Figure 7d). Presumably identifying taxa with direct dependence on random extensions, we observed eight genera with a higher abundance compared to samples supplemented with correct oligonucleotides. Five of them exhibited the same difference with blank controls as in Figure 6f for E. coli, indicating a stimulatory effect of random extensions. However, non-template 3’-termini of 9N reversed the effect of T6 on the abundance of Limosilactobacillus , while 6N extention converted the stimulatory effect of T6 for Shigella (b,d), as in Figure 6e for E. coli. For Burkholderia, with T9 activated growth compared to untreated microbiomes (Figure 6b), 9N was a suppressor, while 6N had a stimulatory influence (Figure 6d). Therefore, not only 5’-terminal fragments of LeuTVPQ tRNAs, but also their 3’-end extensions, may play a regulatory role in bacterial communities.
4. Discussion
mRNA polyadenylation in eukaryotes is one of the key and well-studied process of transcript maturation. In addition to Poly(A) Polymerase (PAP) activity, efficient polyadenylation requires recognition of A/U-rich signals located 10-30 nt upstream of the polymerization site in the pre-mRNA by cleavage and polyadenylation specificity factor (CPSF), as well as a number of cis-elements including a U/GU-rich downstream element (DSE) located within ∼40 nt downstream from the polymerization sites [57]. Adenine attachment is tightly coupled with endonucleolytic cleavage of premature mRNAs [58], and the process occurs in two phases: slow incorporation of a limited number of nucleotides probably by PAP alone followed by rapid elongation, triggered by the binding of nuclear poly(A)-binding protein (PABPN1), which enhances PAP processivity [59].
Bacterial polyadenylation does not rely on a signal recognition step. It is generally accepted that bacterial PAP initiates polyadenylation simply by recognizing a free 3’-OH group of RNA substrates, without strict sequence or structural requirements [24]. The best-studied mechanism is poly(A)-tailing, carried out by poly(A) polymerases PAP I and PAP II. In E. coli PAP I adds ~10–40 adenines to the 3'-termini of RNAs, which typically provokes decay via recruiting exoribonucleases such as RNase II and PNPase, but can also stabilize mRNAs by competitive elongation of their 3’-termini. Since not all tRNA genes encode the CCA sequence in their genomic DNA, the CCA-adding enzyme (tRNA nucleotidyltransferase) synthesizes and appends this critical triplet in a non-template manner [60]. Although CCA is usually incorporated at the end of LeuTVPQ 19-mer along with other 64 triplets, this modification takes place without essential prevalence. Thus, it is unlikely that tRNA nucleotidyltransferase encoded in E. coli by cca gene is responsible for an intensive incorporation of random nucleotides at the end of several RNA fragments, including LeuTVPQ oligonucleotides, which is the main discovery in our study.
Excluding the product of rtcA, 8 of 22 oligonucleotides with highly diversified 3’-ends (H > 3.0) originated from tRNAs, while the remaining 14 were processed from polycistronic transcription units of ribosomal operons and from their leader sequences (Figure 5c). Endonuclease cleavage is part of their maturation process, which is obligatory for eukaryotic poly(A) polymerases, but is not strictly required for the bacterial PAP activity. Thus, it is likely that their terminal diversification is directly coupled with processing. However, the question of whether random extensions are signals for degradation of products of continued processing is so far opened. Since randomly modified LeuTVPQ fragments were significantly enriched in the bacterial transcriptomes, compared to their unmodified counterparts, yet were nearly absent from the secretomes, their targeted diversification for intracellular use appears to be worthwhile. In cells, oligonucleotides with variable termini could bind diverse cellular RNAs, potentially facilitating elimination of mRNAs uninvolved in translation through an RNA interference-like mechanism. On the other hand, forced diversification inevitably generates sequences absent in the E. coli genome. Such oligonucleotides can constitute a primitive defense system: while lacking adaptive memory, they could provide alertness against foreign nucleic acids when even imperfect base pairing with invader molecules might become the frontline to delay the infection.
By identifying RNA fragments exhibiting Dps-dependent secretion, we provide evidence supporting the potential role of Dps in RNA export. This is in line with several studies localizing Dps in membrane structures [41,42]. Given its ability to bind both DNA and RNA, Dps may capture short RNAs immediately after their synthesis and facilitate their export before terminal diversification. This could also explain the significantly reduced level of terminally modified LeuTVPQ 19-mers in the secretomes and a dramatic decline in correlation between the wild-type and Δdps exoRNAs caused by altered 5’-ends, either mediated by Dps protection or by involvement of extracellular endonucleases.
The most unexpected finding of this study is the clear dependence of model oligonucleotides impacts on growth medium composition. This manifested itself as significantly enhanced sensitivity of E. coli cells to their bacteriostatic effects in mineral medium compared to nutrient-rich broth and as altered the distribution pattern of extension lengths. While the underlying mechanism remains unclear, these synthetic oligonucleotides consistently caused reproducible effects in E. coli monocultures cultivated in vivo and revealed statistically significant alterations in several dozen of taxa from microbiota consortia transferred from rat fecal materia to GMM. Notably, among the limited number of taxa responding to 3'-randomized oligonucleotides, we observed a selective activation of potentially probiotic Bifidobacteria, and inhibition of potentially pathogenic Shigella species, denoting possible therapeutic applications. In monoculture experiments, E. coli exposed to synthetic oligonucleotides suffered growth suppression during logarithmic phase, but outcompeted the control samples at stationary phase without essential changes in the total culture density. Consequently, in ex vivo experiments, E. coli also maintained stable population levels, changing on average for 1.26 ± 0.12 times from 3.99 ± 0.67% in the control samples. This consistency paves a way for implementation of revived microbiomes for an extensive search of taxa responding to novel agents of biotechnological or medical significance.
5. Conclusions
We undertook the presented study in an attempt to reveal and systematically characterize posttranscriptional modifications in E. coli oligonucleotides with a potential regulatory or signaling role. Discovering unusual diversification in 5’-terminal fragments of LeuTVPQ, we made a few steps towards understanding of this phenomenon, demonstrating uniqueness of LeuTVPQ fragments and evaluating the functional relevance of their modifications. While the biological role of random extensions remains to be fully elucidated, our findings provide a foundation for future studies to unravel the mechanistic and physiological significance of modifications evolutionary attuned to increase biodiversity.
Supplementary Materials
The following supporting information can be downloaded at: https://www.mdpi.com/article/doi/s1. Table S1: Sequencing statistics of Amply-Seq carried out for ex-vivo cultured bacteria; Table S2: Genomic loci producing oligonucleotides with Dpa-depended secretion; Table S3: 3'-Terminal diversity of reads related to leucine tRNAs with extended 3'-ends s; Table S4: RNA fragments identified in the E. coli transcriptomes with 3'-terminal non-template extensions.
Author Contributions
Conceptualization, O.O; methodology, O.O.; software, V.P., N.M.K.; validation, N.P.K. and O.O.; formal analysis, N.M.K.; investigation, N.M.K., N.M., U.S.S., O.A.G. and K.S.; resources, O.O., K.S.; data curation, N.P.K.; writing—original draft preparation, O.O.; writing—review and editing, O.O.; visualization, O.A.; supervision, O.O.; project administration, O.O.; funding acquisition, O.O. All authors have read and agreed to the published version of the manuscript.
Funding
This research was funded by Russian Science Foundation, grant number 24-14-00433 (O.O.).
Institutional Review Board Statement
Not applicable.
Informed Consent Statement
Not applicable.
Data Availability Statement
Previously abtained RNA-seq data are available at SRA Database of NCBI (NCBI GEO Project and GSE221667). Amply-Seq libraries for taxonomic analysis generated in this study are available at SRA Database of NCBI (BioProject PRJNA1291452).
Conflicts of Interest
The authors declare no conflicts of interest. The funders had no role in the design of the study; in the collection, analyses, or interpretation of data; in the writing of the manuscript; or in the decision to publish the results”.
References
- Artika, I.M.; Arianti, R.; Demény, M.Á.; Kristóf, E. RNA modifications and their role in gene expression. Front. Mol. Biosci. 2025, 12, 1537861. [Google Scholar] [CrossRef]
- Arzumanian, V.A.; Dolgalev, G.V.; Kurbatov, I.Y.; Kiseleva, O.I.; Poverennaya, E.V. Epitranscriptome: review of top 25 most-studied RNA modifications. Int. J. Mol. Sci. 2022, 23(22), 13851. [Google Scholar] [CrossRef] [PubMed]
- Nachtergaele, S.; He, C. Chemical modifications in the life of an mRNA transcript. Annu. Rev. Genet. 2018, 52, 349–372. [Google Scholar] [CrossRef] [PubMed]
- Li, Y.; Yi, Y.; Gao, X.; Wang, X.; Zhao, D.; Wang, R.; Zhang, L.S.; Gao, B.; Zhang, Y.; Zhang, L.; et al. 2'-O-methylation at internal sites on mRNA promotes mRNA stability. Mol. Cell, 2320. [Google Scholar]
- Vandelli, A; Broglia, L.; Armaos, A.; Delli Ponti, R.; Tartaglia, G.G. Rationalizing the effects of RNA modifications on protein interactions. Mol. Ther. Nucleic Acids, 1023.
- Frye, M.; Harada, B.T.; Behm, M.; He, C. RNA modifications modulate gene expression during development. Science 2018, 361(6409), 1346–1349. [Google Scholar] [CrossRef]
- Zacco, E.; Broglia, L.; Kurihara, M.; Monti, M.; Gustincich, S.; Pastore, A.; Plath, K.; Nagakawa, S.; Cerase, A.; Sanchez de Groot, N.; Tartaglia, G.G. RNA: the unsuspected conductor in the orchestra of macromolecular crowding. Chem. Rev. 2024, 124(8), 4734–4777. [Google Scholar] [CrossRef]
- Xuan, J.; Chen, L.; Chen, Z.; Pang, J.; Huang, J.; Lin, J.; Zheng, L.; Li, B.; Qu, L.; Yang, J. RMBase v3. 0: decode the landscape, mechanisms and functions of RNA modifications, Nucleic Acids Res. 2024, 52, D273–D284. [Google Scholar]
- Boccaletto, P.; Machnicka, M.A.; Purta, E.; Piatkowski, P.; Baginski, B.; Wirecki, T.K.; de Crecy-Lagard, V.; Ross, R.; Limbach, P.A.; Kotter, A.; et al. MODOMICS: a database of RNA modification pathways. 2017 update. Nucleic Acids Res. 2018, 46, D303–D307. [Google Scholar] [CrossRef]
- Ge, J.; Yu, Y.-T. RNA pseudouridylation: new insights into an old modification. Trends in Bio-chemical Sciences.
- Agris, P.F.; Eruysal, E.R.; Narendran, A.; Väre, V.Y.P.; Vangaveti, S.; Ranganathan, S.V. Celebrating wobble decoding: Half a century and still much is new. RNA Biol.
- Oerum, S.; Meynier, V.; Catala, M.; Tisné, C. A comprehensive review of m6A/m6Am RNA methyltransferase structures. Nucleic Acids Res. 2021, 49(13), 7239–7255. [Google Scholar] [CrossRef]
- Zhao, B.; Roundtree, I.; He, C. Post-transcriptional gene regulation by mRNA modifications. Nat. Rev. Mol. Cell. Biol. 2017, 18, 31–42. [Google Scholar] [CrossRef]
- Bartosovic, M.; Molares, H.C.; Gregorova, P.; Hrossova, D.; Kudla, G.; Vanacova, S. N6-methyladenosine demethylase FTO targets pre-mRNAs and regulates alternative splicing and 3‘-end processing. Nucleic Acids Res. 2017, 45(19), 11356–11370. [Google Scholar] [CrossRef]
- Barbieri, I.; Tzelepis, K.; Pandolfini, L.; Shi, J.; Millán-Zambrano, G.; Robson, S.C.; Aspris, D.; Migliori, V.; Bannister, A.J.; Han, N.; et al. Promoter-bound METTL3 maintains myeloid leukaemia by m6A-dependent translation control. Nature 2017, 552, 126–131. [Google Scholar] [CrossRef]
- Tang, C.; Klukovich, R.; Peng, H.; Wang, Z.; Yu, T.; Zhang, Y.; Zheng, H.; Klungland, A.; Yan, W. ALKBH5-dependent m6A demethylation controls splicing and stability of long 3′-UTR mRNAs in male germ cells. Proc. Natl. Acad. Sci. U.S.A. 2018, 115(2), E325–E333. [Google Scholar] [CrossRef]
- Deng, X.; Chen, K.; Luo, G.-Z.; Weng, X.; Ji, Q.; Zhou, T.; He, C. Wide-spread occurrence of N6-methyladenosine in bacterial mRNA. Nucleic Acids Res. 6557. [Google Scholar]
- Szydlo., K.; Santos, L.; Christian, T.W.; Maharjan, S.; Dorsey, A.; Masuda, I.; Jia, J.; Wu, Y.; Tang, W.; Hou, Y.-M. Szydlo. K.; Santos, L.; Christian, T.W.; Maharjan, S.; Dorsey, A.; Masuda, I.; Jia, J.; Wu, Y.; Tang, W.; Hou, Y.-M.; et al. m6A modification is incorporated into bacterial mRNA without specific functional benefit. Nucleic Acids Res.
- Hajnsdorf, E.; Kaberdin, V.R. RNA polyadenylation and its consequences in prokaryotes. Phil. Trans. R. Soc. B. 2018, 373, 20180166. [Google Scholar] [CrossRef]
- Mofayezi, A.; Jadaliha, M.; Zangeneh, F.Z.; Khoddami, V. Poly(A) tale: from A to A; RNA polyadenylation in prokaryotes and eukaryotes. Wiley Interdiscip. Rev. RNA. 2024, 15(2), e1837. [Google Scholar] [CrossRef]
- Passmore, L.A.; Coller, J. Roles of mRNA poly(A) tails in regulation of eukaryotic gene expression. Nat. Rev. Mol. Cell. Biol. 2022, 23(2), 93–106. [Google Scholar] [CrossRef] [PubMed]
- Mohanty, B.K.; Kushner, S.R. Bacterial/archaeal polyadenylation. Wiley Interdiscip. Rev. RNA 2016, 7(1), 31–44. [Google Scholar]
- Mohanty, B.K.; Kushner, S.R. New Insights into the relationship between tRNA processing and polyadenylation in Escherichia coli. Trends Genet. 2019, 35(6), 434–445. [Google Scholar] [CrossRef]
- Régnier, P.; Marujo, P.E. Polyadenylation and degradation of RNA in prokaryotes. In: Madame Curie Bioscience Database [Internet]. Austin (TX): Landes Bioscience 2000-2013. Available from: https://www.ncbi.nlm.nih.gov/books/NBK6253.
- Coburn, G.A.; Mackie, G.A. Degradation of mRNA in Escherichia coli: an old problem with some new twists. Prog. Nucleic Acid Res. Mol. Biol. 1999, 62, 55–108. [Google Scholar] [PubMed]
- Spickler, C.; Mackie, G.A. Action of RNase II and polynucleotide phosphorylase against RNAs containing stem-loops of defined structure. J. Bacteriol. 2000, 182, 2422–2427. [Google Scholar] [CrossRef]
- Mohanty, B.K.; Kushner, S.R. The majority of Escherichia coli mRNAs undergo post-transcriptional modification in exponentially growing cells. Nucleic Acids Res. 2006, 34, 5695–5704. [Google Scholar] [CrossRef]
- Mohanty, B.K.; Kushner, S.R. Analysis of the function of Escherichia coli poly(A) polymerase I in RNA metabolism. Mol. Microbiol. 1999, 34, 1094–1108. [Google Scholar] [CrossRef]
- Mohanty, B.K.; Maples, V.F.; Kushner, S.R. The Sm-like protein Hfq regulates polyadenylation dependent mRNA decay in Escherichia coli. Mol. Microbiol. 2004, 54, 905–920. [Google Scholar] [CrossRef]
- Raynal, L.C.; Carpousis, A.J. Poly(A) polymerase I of Escherichia coli: characterization of the catalytic domain, an RNA binding site and regions for the interaction with proteins involved in mRNA degradation. Mol. Microbiol. 1999, 32, 765–775. [Google Scholar] [CrossRef]
- Ghosal, A.; Upadhyaya, B.B.; Fritz, J.V.; Heintz-Buschart, A.; Desai, M.S.; Yusuf, D.; Huang, D.; Baumuratov, A.; Wang, K.; Galas, D.; et al. The extracellular RNA complement of Escherichia coli. Microbiology 2015, 4, 252–266. [Google Scholar] [CrossRef] [PubMed]
- Alikina, O.V.; Glazunova, O.A.; Bykov, A.A.; Kiselev, S.S.; Tutukina, M.N.; Shavkunov, K.S.; Ozoline, O.N. A cohabiting bacterium alters the spectrum of short RNAs secreted by Escherichia coli. FEMS Microbiol. Lett. 2018, 365, fny262. [Google Scholar] [CrossRef] [PubMed]
- Markelova, N.; Glazunova, O.; Alikina, O.; Panyukov, V.; Shavkunov, K.; Ozoline, O. Suppression of Escherichia coli growth dynamics via RNAs secreted by competing bacteria. Front. Mol. Biosci. 2021, 8, 609979. [Google Scholar] [CrossRef] [PubMed]
- Blenkiron, C.; Simonov, D.; Muthukaruppan, A.; Tsai, P.; Dauros, P.; Green, S.; Hong, J.; Print, C.J.; Swift, S.; Phillips, A.R. Uropathogenic Escherichia coli releases extracellular vesicles that are associated with RNA. PLoS ONE 2016, 11, e0160440. [Google Scholar] [CrossRef]
- Ren, B.; Tibbelin, G.; Kajino, T.; Asami, O.; Ladenstein, R. The multi-layered structure of Dps with a novel di-nuclear ferroxidase center. J Mol Biol. 2003, 329(3), 467–477. [Google Scholar] [CrossRef]
- Wolf, S.G.; Frenkiel, D.; Arad, T.; Finkel, S.E.; Kolter, R.; Minsky, A. DNA protection by stress-induced biocrystallization. Nature 1999, 400, 83–85. [Google Scholar] [CrossRef]
- Frenkiel-Krispin, D.; Levin-Zaidman, S.; Shimoni, E.; Wolf, S.G.; Wachtel, E.J.; Arad, T.; Finkel, S.E.; Kolter, R.; Minsky, A. Regulated phase transitions of bacterial chromatin: a non-enzymatic pathway for generic DNA protection. EMBO J. 2001, 20, 1184–1191. [Google Scholar] [CrossRef]
- Janissen, R.; Arens, M.M.A.; Vtyurina, N.N.; Rivai, Z.; Sunday, N.D.; Eslami-Mossallam, B.; Gritsenko, A.A.; Laan, L.; de Ridder, D.; Artsimovitch, I.; et al. Global DNA compaction in stationary-phase bacteria does not affect transcription. Cell, 1188. [Google Scholar]
- Bykov, A.A.; Shavkunov, K.S.; Panyukov, V.V.; Ozoline, O.N. Bacterial nucleoid protein Dps binds structured RNA molecules. Mat. Biol. Bioinform. 2017, 12(S), t1–t11. [Google Scholar]
- Park, C.; Jin, Y.; Kim, Y.J.; Jeong, H.; Seong, B.L. RNA-binding as chaperones of DNA binding proteins from starved cells. Biochem. Biophys. Res. Commun. 2020, 524(2), 484–489. [Google Scholar] [CrossRef] [PubMed]
- Lacqua, A.; Wanner, O.; Colangelo, T.; Martinotti, M.G.; Landini, P. Emergence of biofilm-forming subpopulations upon exposure of Escherichia coli to environmental bacteriophages. Appl. Environ. Microbiol. 2006, 72, 956–959. [Google Scholar] [CrossRef]
- Pang, B.; Hong, W.; Kock, N.D.; Swords, W.E. Dps promotes survival of nontypeable Haemophilus influenzae in biofilm communities in vitro and resistance to clearance in vivo. Front. Cell. Infect. Microbiol. 2012, 2, 58. [Google Scholar] [CrossRef] [PubMed]
- Shavkunov, K.S.; Markelova, N.Yu.; Alikina, O.V.; Glazunova, O.A.; Panyukov, V.V.; Kolzhetsov, N.P.; Kiselev, S.S.; Ozoline, O.N. Products of abortive transcription can prime synthesis of chimeric oligonucleotides. Mat. Biolog. Bioinform. 2024, 19(2), 453–471. [Google Scholar] [CrossRef]
- Antipov, S.S.; Tutukina, M.N.; Preobrazhenskaya, E.V.; Kondrashov, F.A.; Patrushev, M.V.; Toshchakov, S.V.; Dominova, I.; Shvyreva, U.S.; Vrublevskaya, V.V.; Morenkov, O.S.; et al. The nucleoid protein Dps binds genomic DNA of Escherichia coli in a non-random manner. PLoS One 2017, 12(8), e0182800. [Google Scholar] [CrossRef]
- Schneider, C.A.; Rasband, W.S.; Eliceiri, K.W. NIH Image to ImageJ: 25 years of image analysis. Nature Methods 2012, 9, 671–675. [Google Scholar] [CrossRef]
- Melekhov, V.V.; Shvyreva, U.S.; Timchenko, A.A.; Tutukina, M.N.; Preobrazhenskaya, E.V.; Burkova, D.V.; Artiukhov, V.G.; Ozoline, O.N.; Antipov, S.S. Modes of Escherichia coli Dps interaction with DNA as revealed by atomic force microscopy. PloS One 2015, 10, e0126504. [Google Scholar] [CrossRef]
- Bykov, A.; Glazunova, O.; Alikina, O.; Sukharicheva, N.; Masulis, I.; Shavkunov, K.; Ozoline, O. Excessive promoters as silencers of genes horizontally acquired by Escherichia coli. Front. Mol. Biosci. 2020, 7, 28. [Google Scholar] [CrossRef]
- Afgan, E.; Baker, D.; van den Beek, M.; Blankenberg, D.; Bouvier, D.; Cech, M. The Galaxy platform for accessible, reproducible and collaborative biomedical analyses: 2016 update. Nucleic Acids Res. 2016, 44, 3–10. [Google Scholar] [CrossRef]
- Blattner, F.R.; Plunkett, G. 3rd.; Bloch, C.A.; Perna, N.T.; Burland, V.; Riley, M.; Collado-Vides, J.; Glasner, J.D.; Rode, C.K.; Mayhew, G.F.; et al. The complete genome sequence of Escherichia coli K-12. Science, 277, 1453-1462.
- Panyukov, V.V.; Kiselev, S.S.; Shavkunov, K.S.; Masulis, I.S.; Ozoline, O.N. Mixed promoter islands as genomic regions with specific structural and functional properties. Mat. Biolog. Bioinform. 2013, 8(2), 432–448. [Google Scholar] [CrossRef]
- Edgar, R.C. MUSCLE: multiple sequence alignment with high accuracy and high throughput. Nucleic Acids Res. 2004, 32, 1792–1797. [Google Scholar] [CrossRef] [PubMed]
- Shavkunov, K.S.; Markelova, N.Y.; Glazunova, O.A.; Kolzhetsov, N.P.; Panyukov, V.V.; Ozoline, O.N. The Fate and functionality of alien tRNA fragments in culturing medium and cells of Escherichia coli. Int. J. Mol. Sci. 2023, 24, 12960. [Google Scholar] [CrossRef] [PubMed]
- Kolzhetsov, N.; Markelova, N.; Frolova, M.; Alikina, O.; Glazunova, O.; Safonova, L.; Kalashnikova, I.; Yudin, V.; Makarov, V.; Keskinov, A.; et al. Enterotype-dependent probiotic-mediated changes in the male rat intestinal microbiome in vivo and in vitro. Int. J. Mol. Sci. 2024, 25, 4558. [Google Scholar] [CrossRef]
- Wood, D.E.; Lu, J.; Langmead, B. Improved metagenomic analysis with Kraken 2. Genome Biol. 2019, 20, 257. [Google Scholar] [CrossRef]
- Shavkunov, K.S.; Masulis, I.S.; Tutukina, M.N.; Deev, A.A.; Ozoline, O.N. Gains and unexpected lessons from genome-scale promoter mapping. Nucleic Acids Res. 2009, 37(15), 4919–4931. [Google Scholar] [CrossRef] [PubMed]
- Tierrafría, V.H.; Rioualen, C.; Salgado, H.; Lara, P.; Gama-Castro, S.; Lally, P.; Gómez-Romero, L.; Peña-Loredo, P.; López-Almazo, A.G.; Alarcón-Carranza, G.; et al. RegulonDB 11.0: Comprehensive high-throughput datasets on transcriptional regulation in Escherichia coli K-12. Microb. Genom. 2022, 2022 8, mgen000833. [Google Scholar] [CrossRef]
- Shi, Y.; Manley, J.L. The end of the message: multiple protein-RNA interactions define the mRNA polyadenylation site. Genes Dev. 2015, 29(9), 889–897. [Google Scholar] [CrossRef]
- Neve, J.; Patel, R.; Wang, Z.; Louey, A.; Furger, A.M. Cleavage and polyadenylation: Ending the message expands gene regulation. RNA Biol. 2017, 14(7), 865–890. [Google Scholar] [CrossRef]
- Kühn, U.; Gündel, M.; Knoth, A.; Kerwitz, Y.; Rüdel, S.; Wahle, E. Poly(A) tail length is controlled by the nuclear poly(A)-binding protein regulating the interaction between poly(A) polymerase and the cleavage and polyadenylation specificity factor. J. Biol. Chem. 2009, 284(34), 22803–22814. [Google Scholar] [CrossRef]
- Weiner, A.M. tRNA maturation: RNA polymerization without a nucleic acid template. Curr. Biol. 2004, 14(20), R883–885. [Google Scholar] [CrossRef]
Figure 1.
Schemes illustrating (a) the strategy used for the selection of RNAs with presumably Dps-dependent secretion and (b) for identifying RNA fragments with random extensions (RandExt) .
Figure 1.
Schemes illustrating (a) the strategy used for the selection of RNAs with presumably Dps-dependent secretion and (b) for identifying RNA fragments with random extensions (RandExt) .
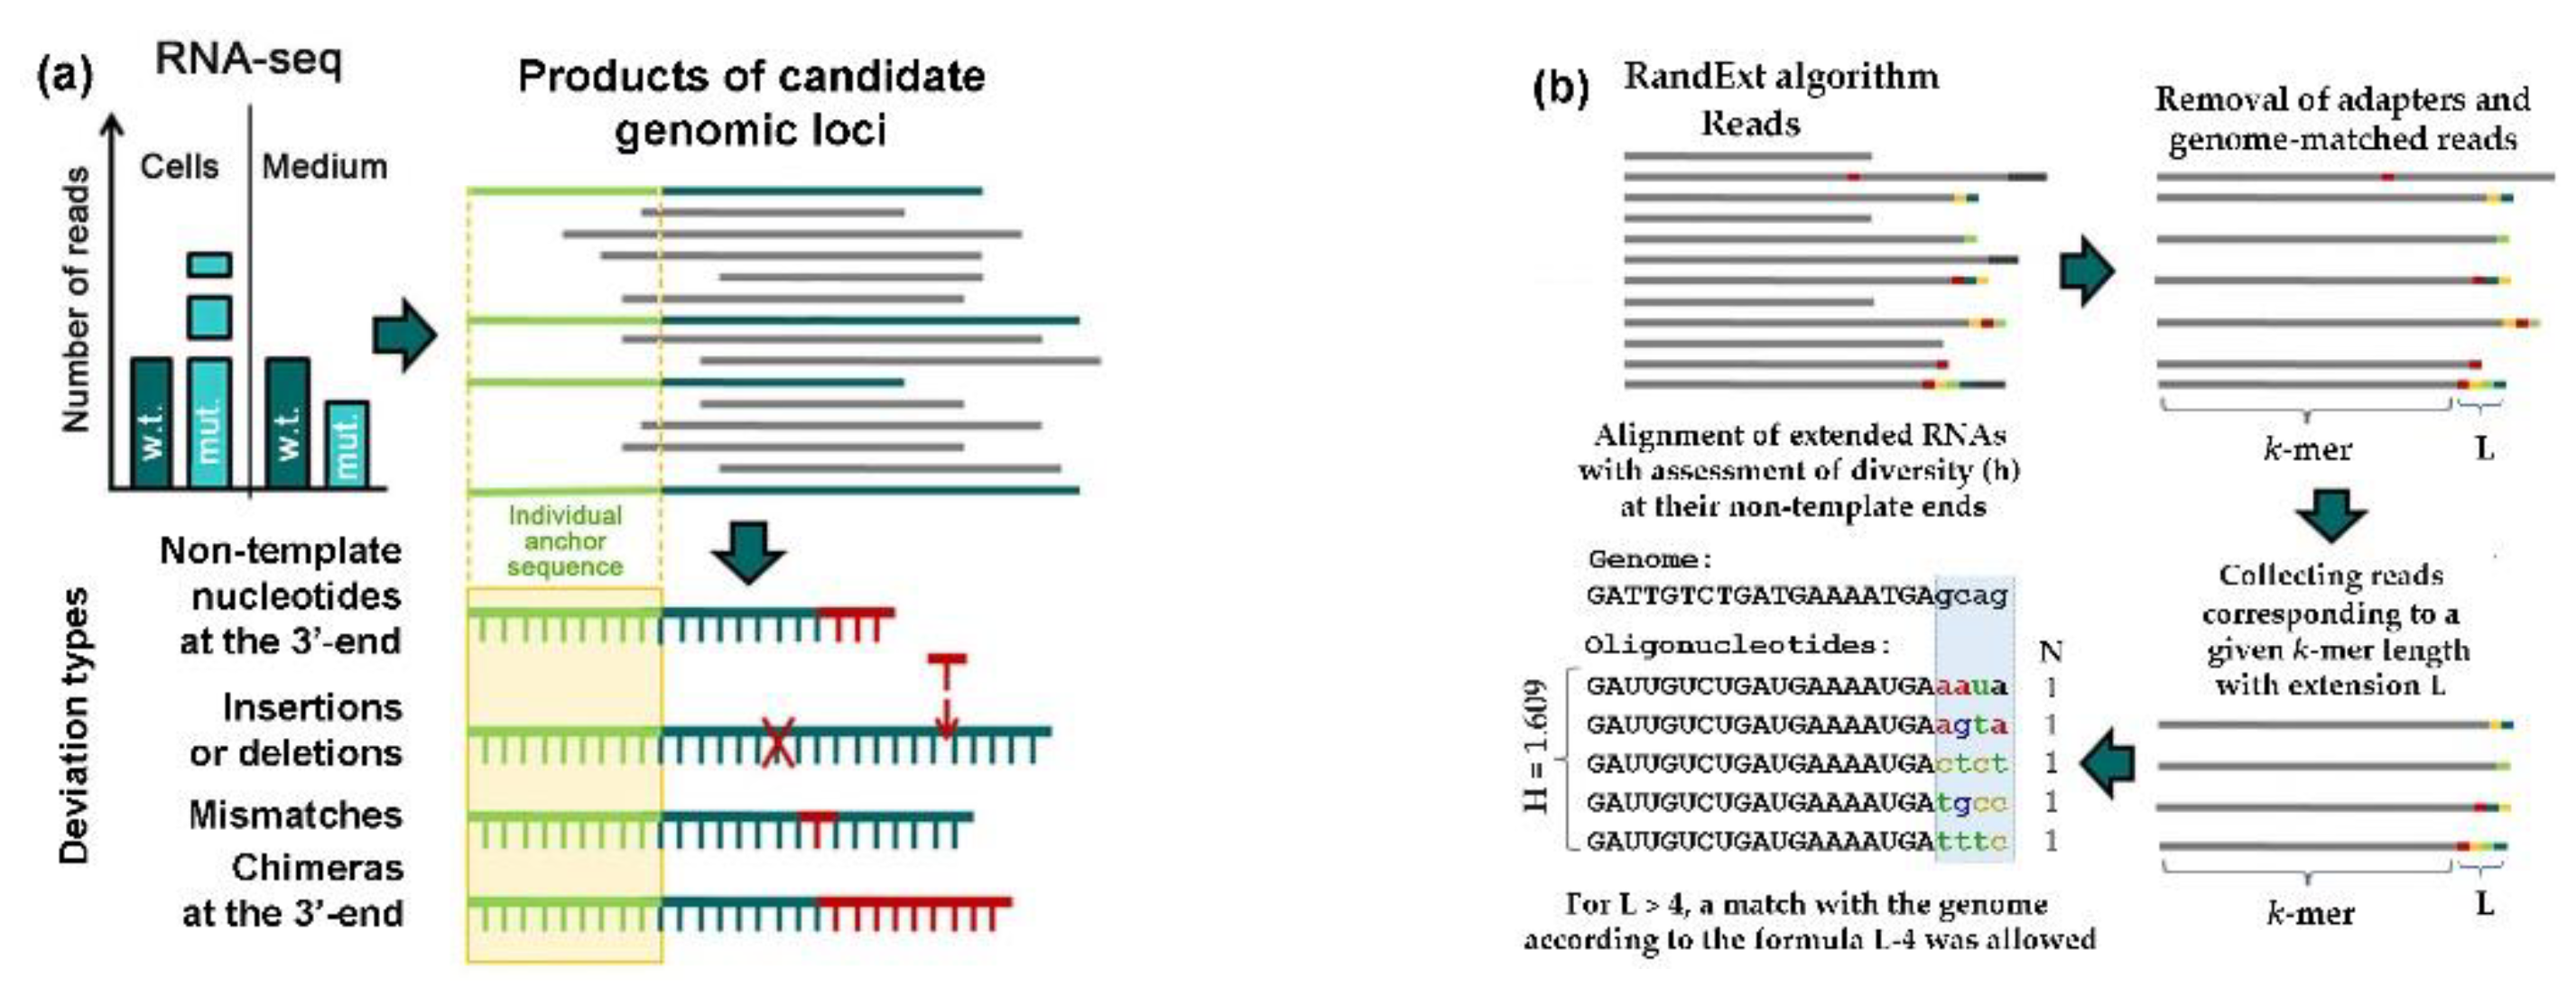
Figure 2.
Western blot hybridization (a) revealed the presence of Dps outside E. coli cells, while differential RNA-seq analysis (b–c) identified short RNAs with potential Dps-dependent excretion. (a) Cellular samples (lanes 1, 3 and 5) were 10-fold concentrated. Extracellular fractions were concentrated 50- and 27.8-fold for E. coli MG1655 and BL21(DE3) samples, respectively. (b,c) Profiles show the normalized distribution of RNA-seq reads obtained from cellular transcriptomes (b) and secretomes (c), which ideally matched the genome. (d,e): Correlation plots for the number (N) of 16-50 nt reads obtained in indicated RNA-seq experiments. Colored symbols correspond to RNAs whose intracellular content of the mutant strain remained at the baseline or increased (d), while decreased in its secretomes (e). Corresponding positions in the genome are marked by ticks (b,c).
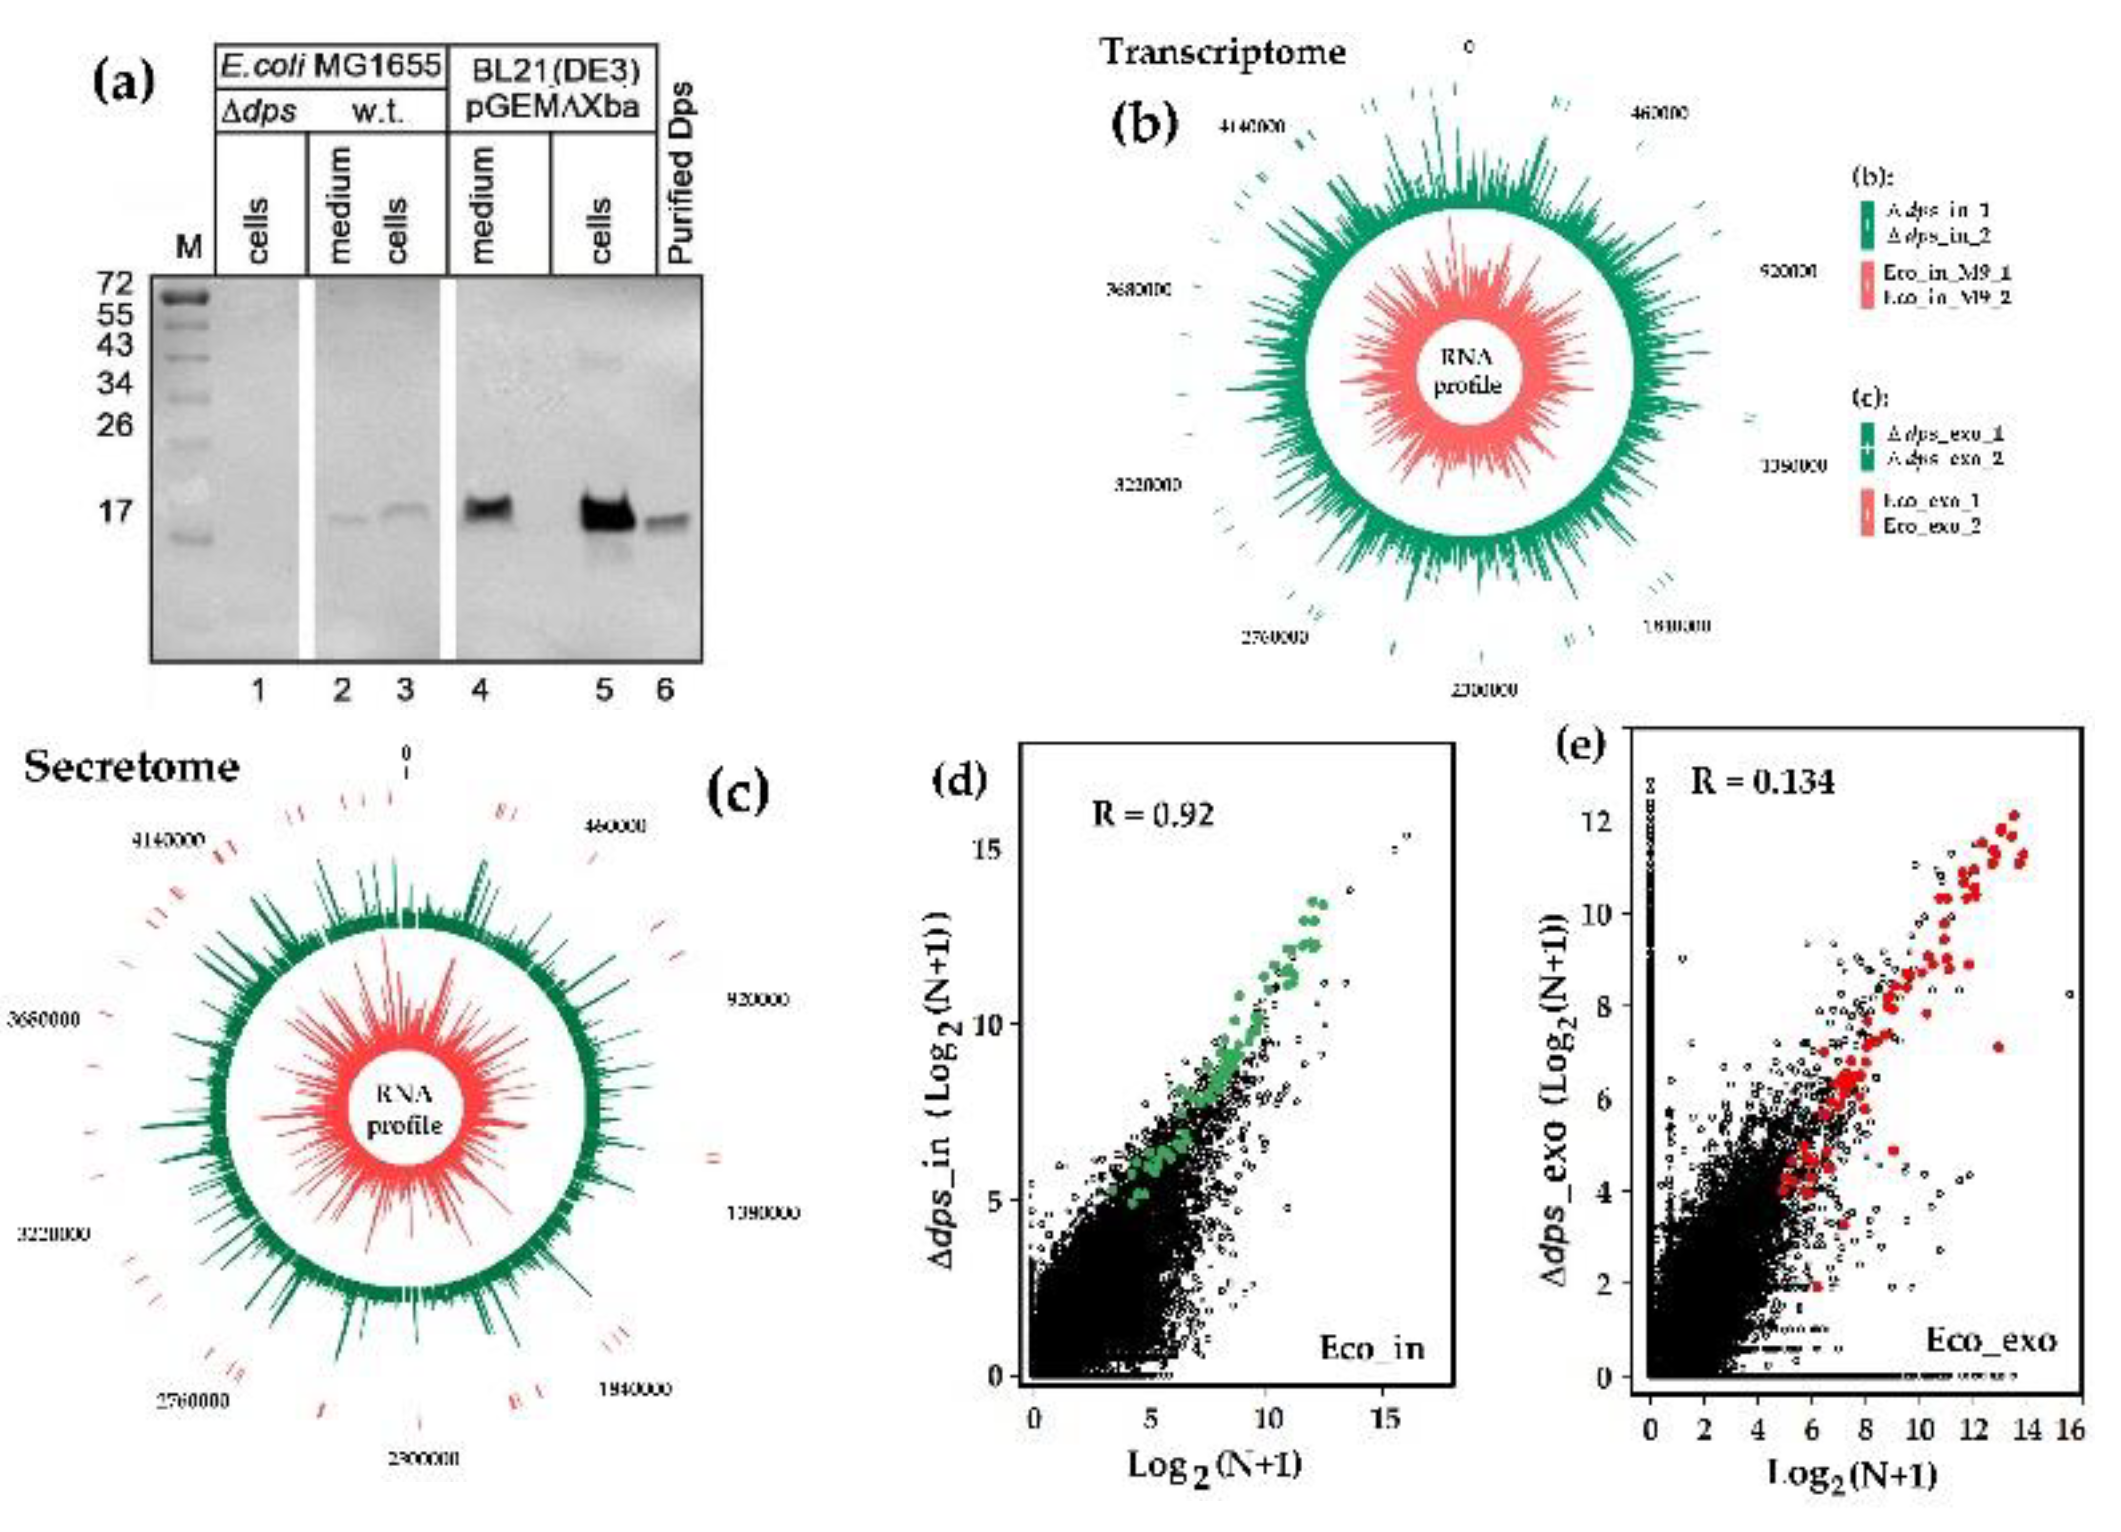
Figure 3.
While being similarly fragmented (a,f), oligonucleotides derived from homologous tRNAs substantially differ at least in the efficiency of posttranscriptional extension of 3’-ends (b–e). (a,f) Normalized and averaged profiles representing the distribution of 5’-ends of fragmented tRNAs SerV and LeuW in different datasets. (b,d) Correct reads were ascribed to the specified genes using Matcher software [50,55]. To estimate their rate among all reads derived from the target genes, “erroneous” oligonucleotides were collected using gene-specific 12-mer anchors, as illustrated in Figure 1a. (c,e) Reads were considered “extended”, if they contained non-template incorporations or chimeras at the 3’-ends. Bars represent their normalized and averaged across similar datasets percentages for each tRNA type except reads from SerX(W) tRNAs in the Δdps_exo dataset, which was too small in number for evaluation. R-values indicated in (a) and (f) reflect correlation with Eco_in and Δdps_in samples, respectively.
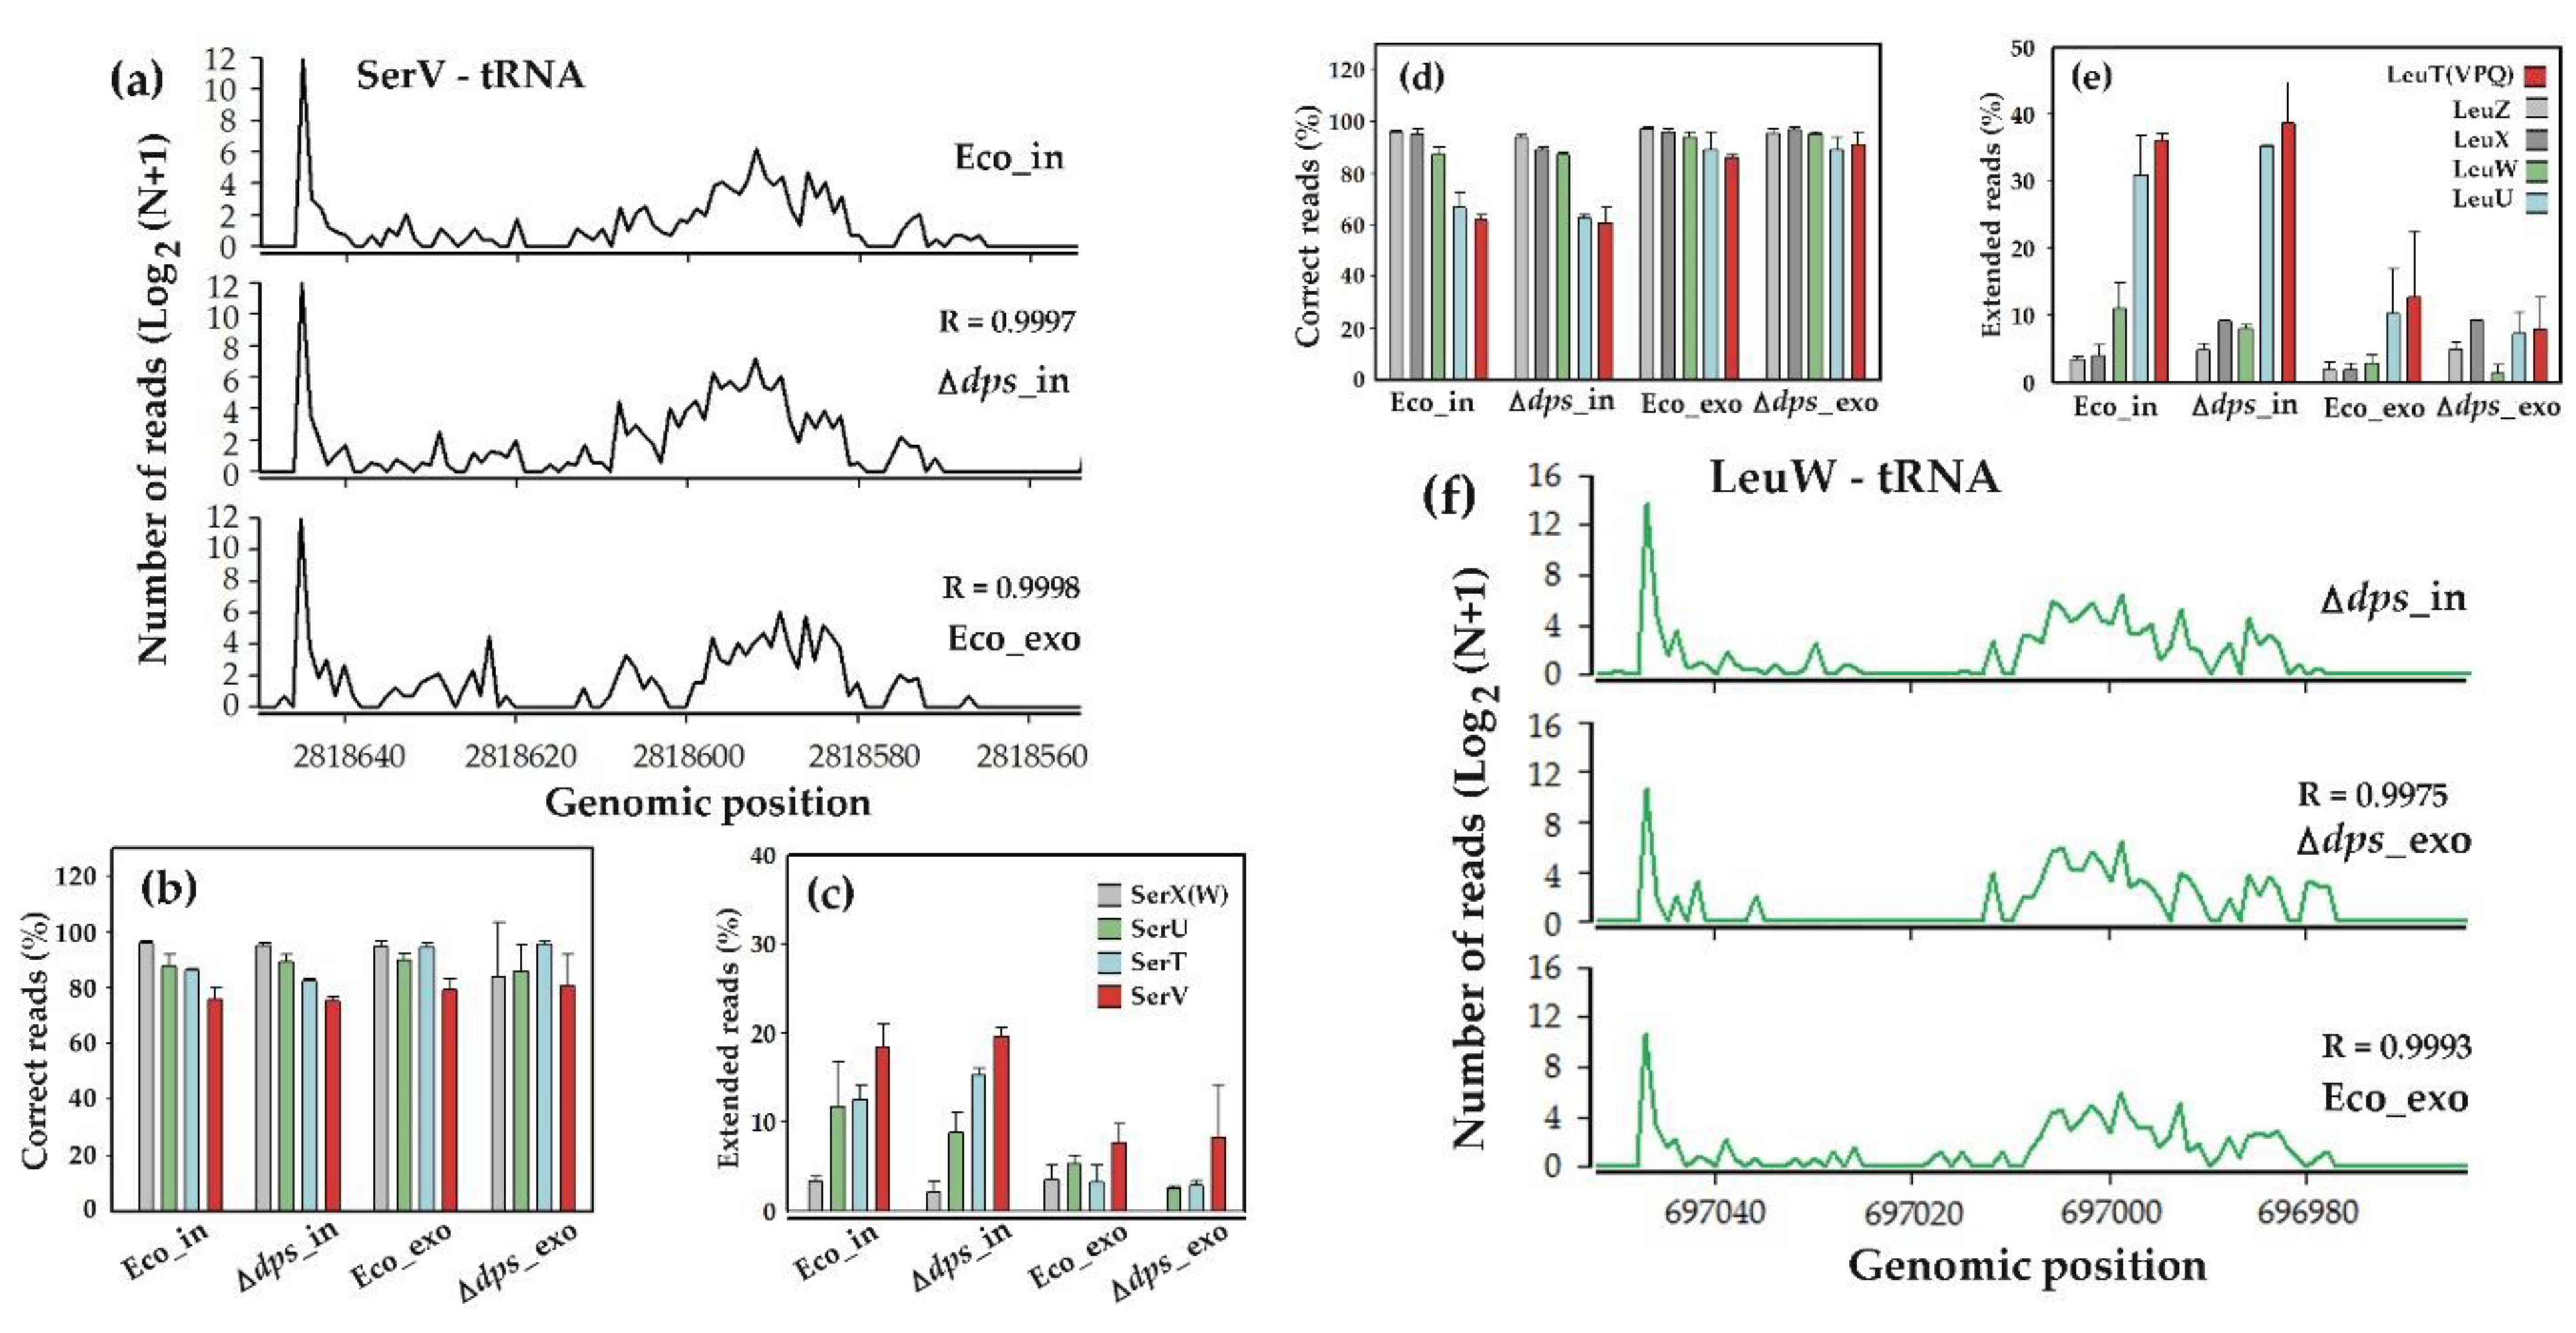
Figure 4.
Being highly similar in sequence, the fragments of LeuTVPQ tRNAs vary in their posttranscriptional modifications. (a) Secondary structure of LeuT, V, P and Q tRNAs with alignment of their identical 5’-terminal 19-mer compared to other leucine tRNAs fragments. Nucleotides matching LeuTVPQ are highlighted in green (LeuZ, X, W), while differing nucleotides in LeuU are marked in red. The single-nucleotide difference in the LeuP variable loop is indicated in brackets. (b) Top: 5’-ends distribution of 16-50 nt fragments derived from LeuT. Bottom: Size and abundance distribution of the most prevalent oligonucleotides (sample Eco_in_2), with red caps marking 3’-end non-template extensions in 19-mer. (c) Mean percentage of reads with non-template nucleotides at the 3’-ends. Fragments of different tRNAs were collected individually using their specific anchor sequences. Values for separately analyzed LeuU and LeuTVPQ tRNAs represent means across eight RNA-seq experiments. Values of LeuW, X and Z were additionally averaged to show their common difference from the former two samples. (d) Diversity of 3’-end non-template motifs. For each library, motif richness was calculated as the percentage of observed unique sequences relative to all possible motifs with a particular lengths (4, 16, 64 and 256 for mono-, di-, tri and tetranucleotides, respectively). Then, the values were averaged as described in (c).
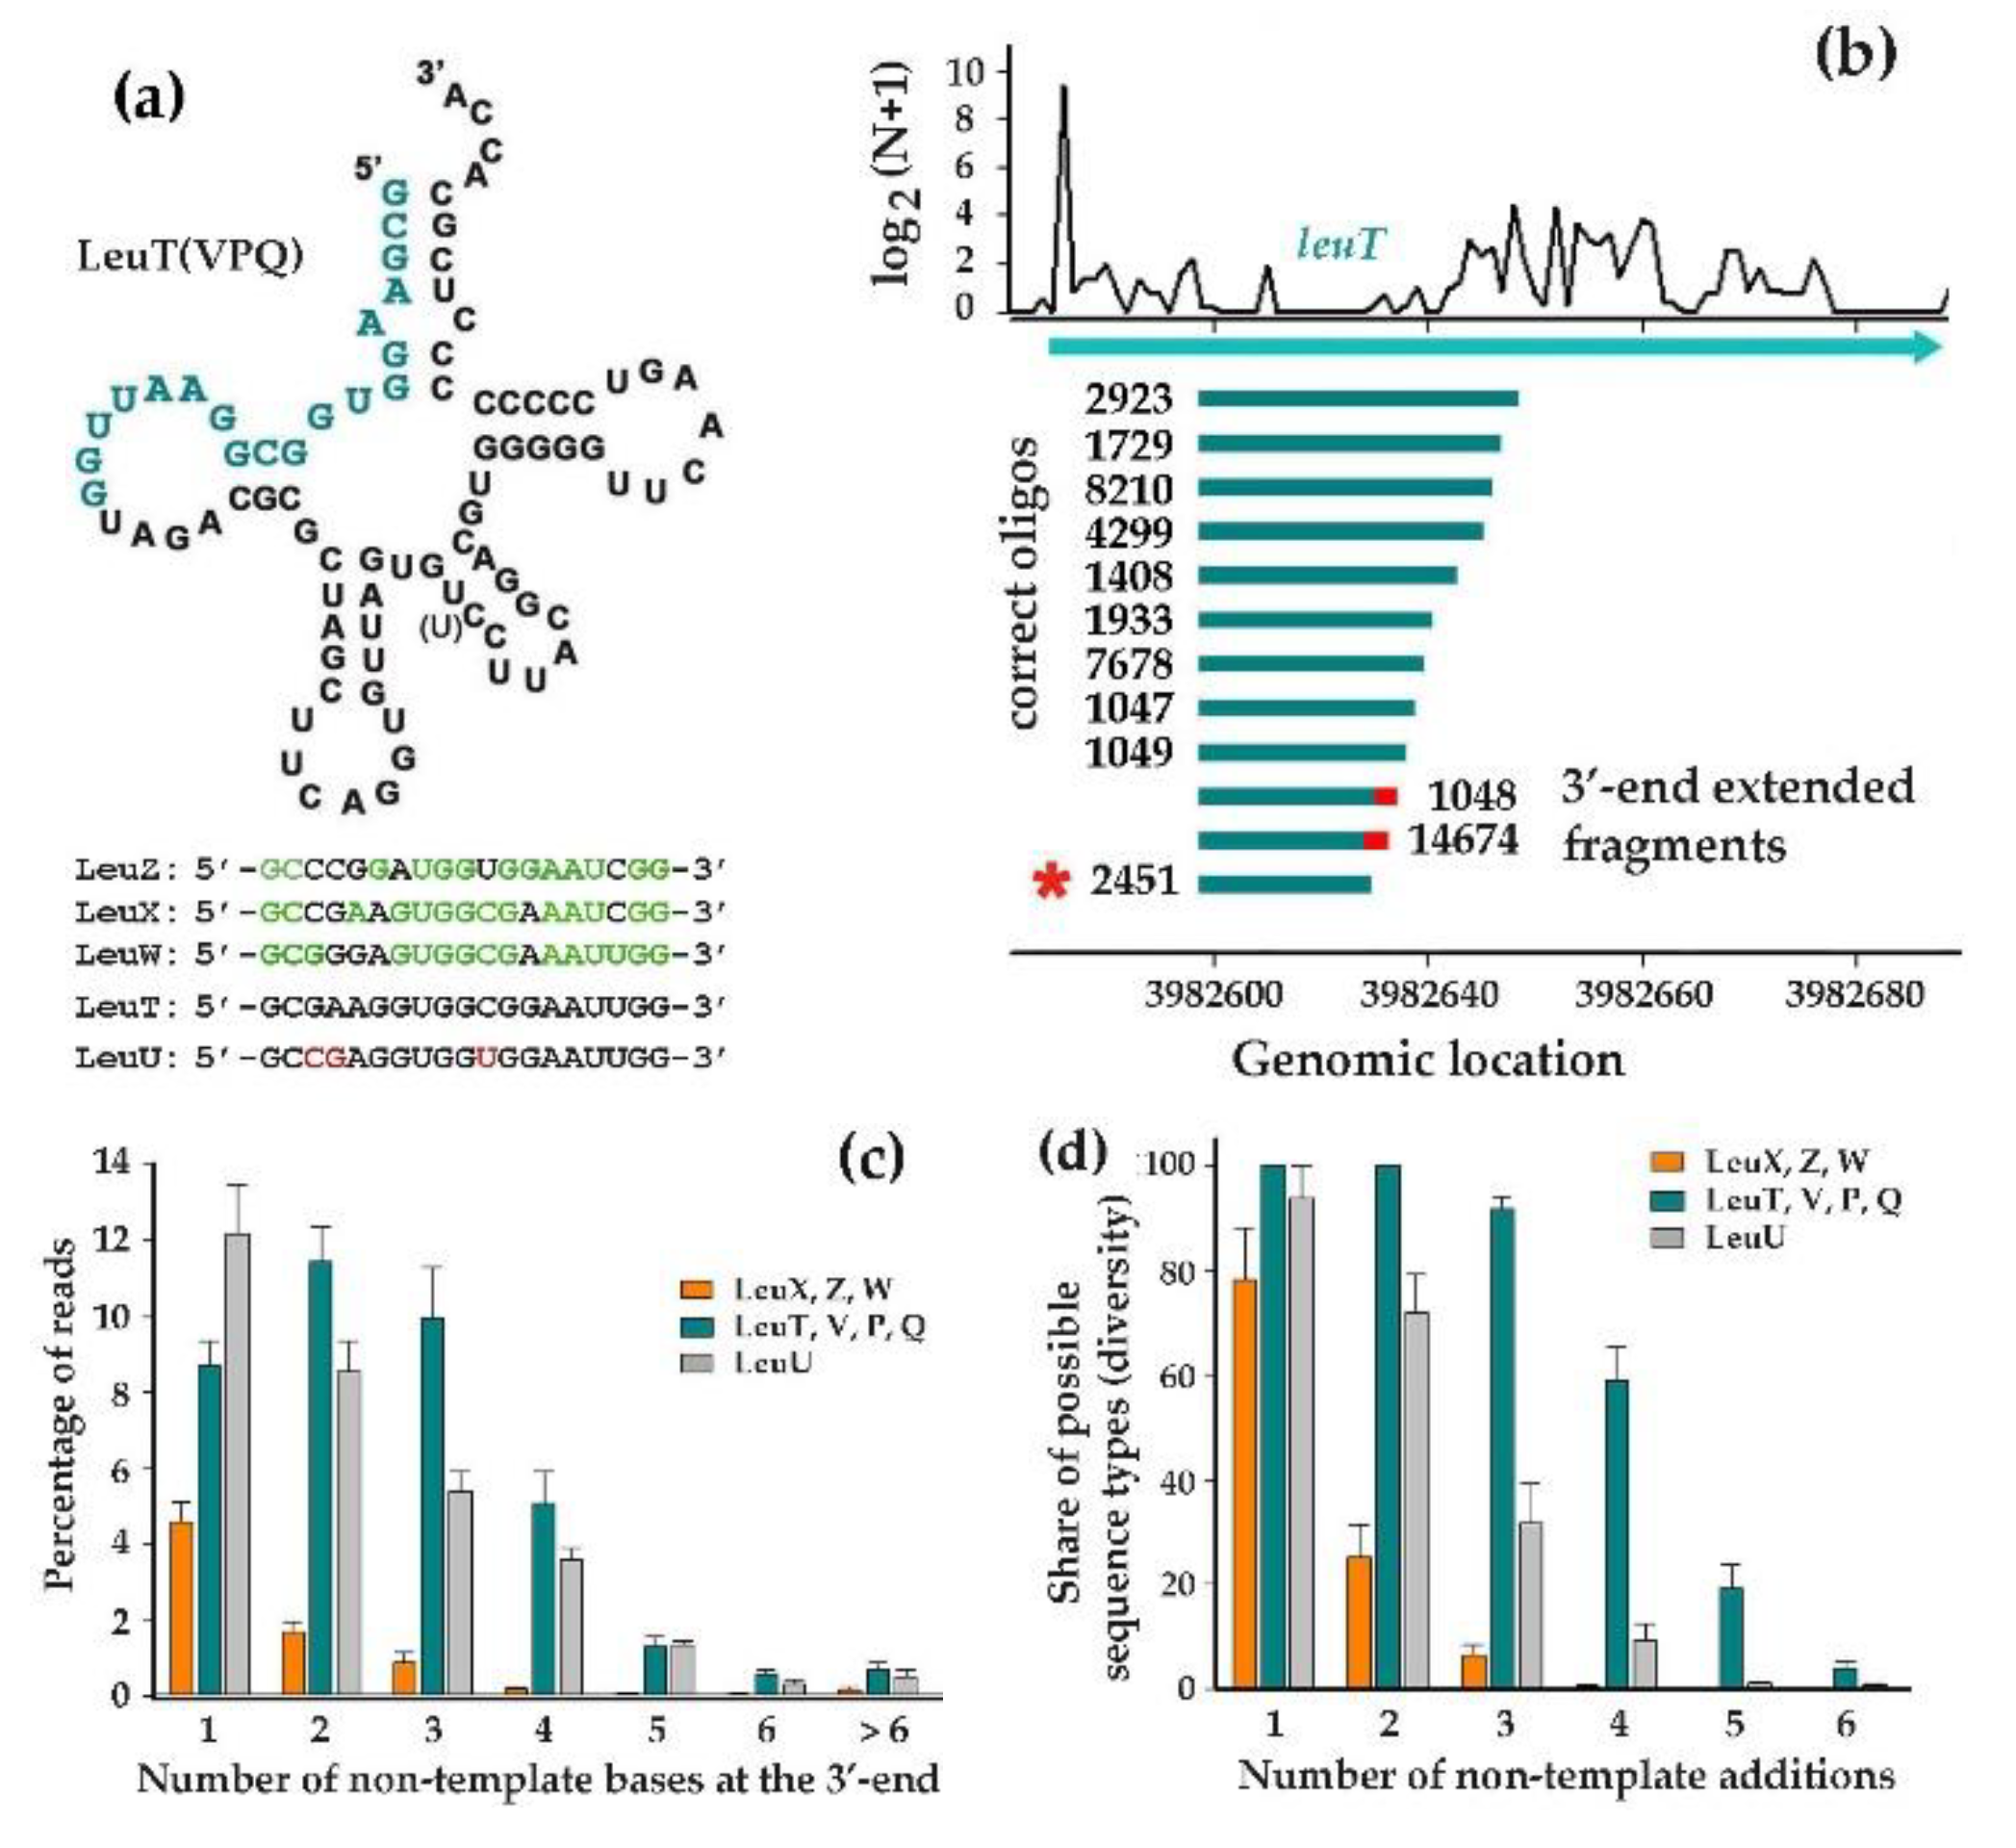
Figure 5.
Although LeuTVPQ oligonucleotides exhibit the highest diversity, they are not the only substrates for terminal extensions (a–c) and contribute to the abundance of RNA products ascribed to the rtcA gene (d). (a,b) Profiles of the genomic loci, producing variable oligos (H-index >2.0), plotted either by maximal H-values (a) or normalized copy numbers averaged across four cellular transcriptomes (b). (c) Normalized distribution of RNA-seq reads matching the genomic region near the rrsH ribosomal operon. Red arrows indicate transcription start points and asterisk marks the peak, corresponding to diversified RNAs. Logarithmic scale was used in all profiles. (d) Alignment of 23-nt reads representing modified fragments potentially derived from RtcA mRNA and LeuTVPQ tRNA. Genomic sequences of these products are shown above and below the alignment. Extended k-mers are marked in green. .
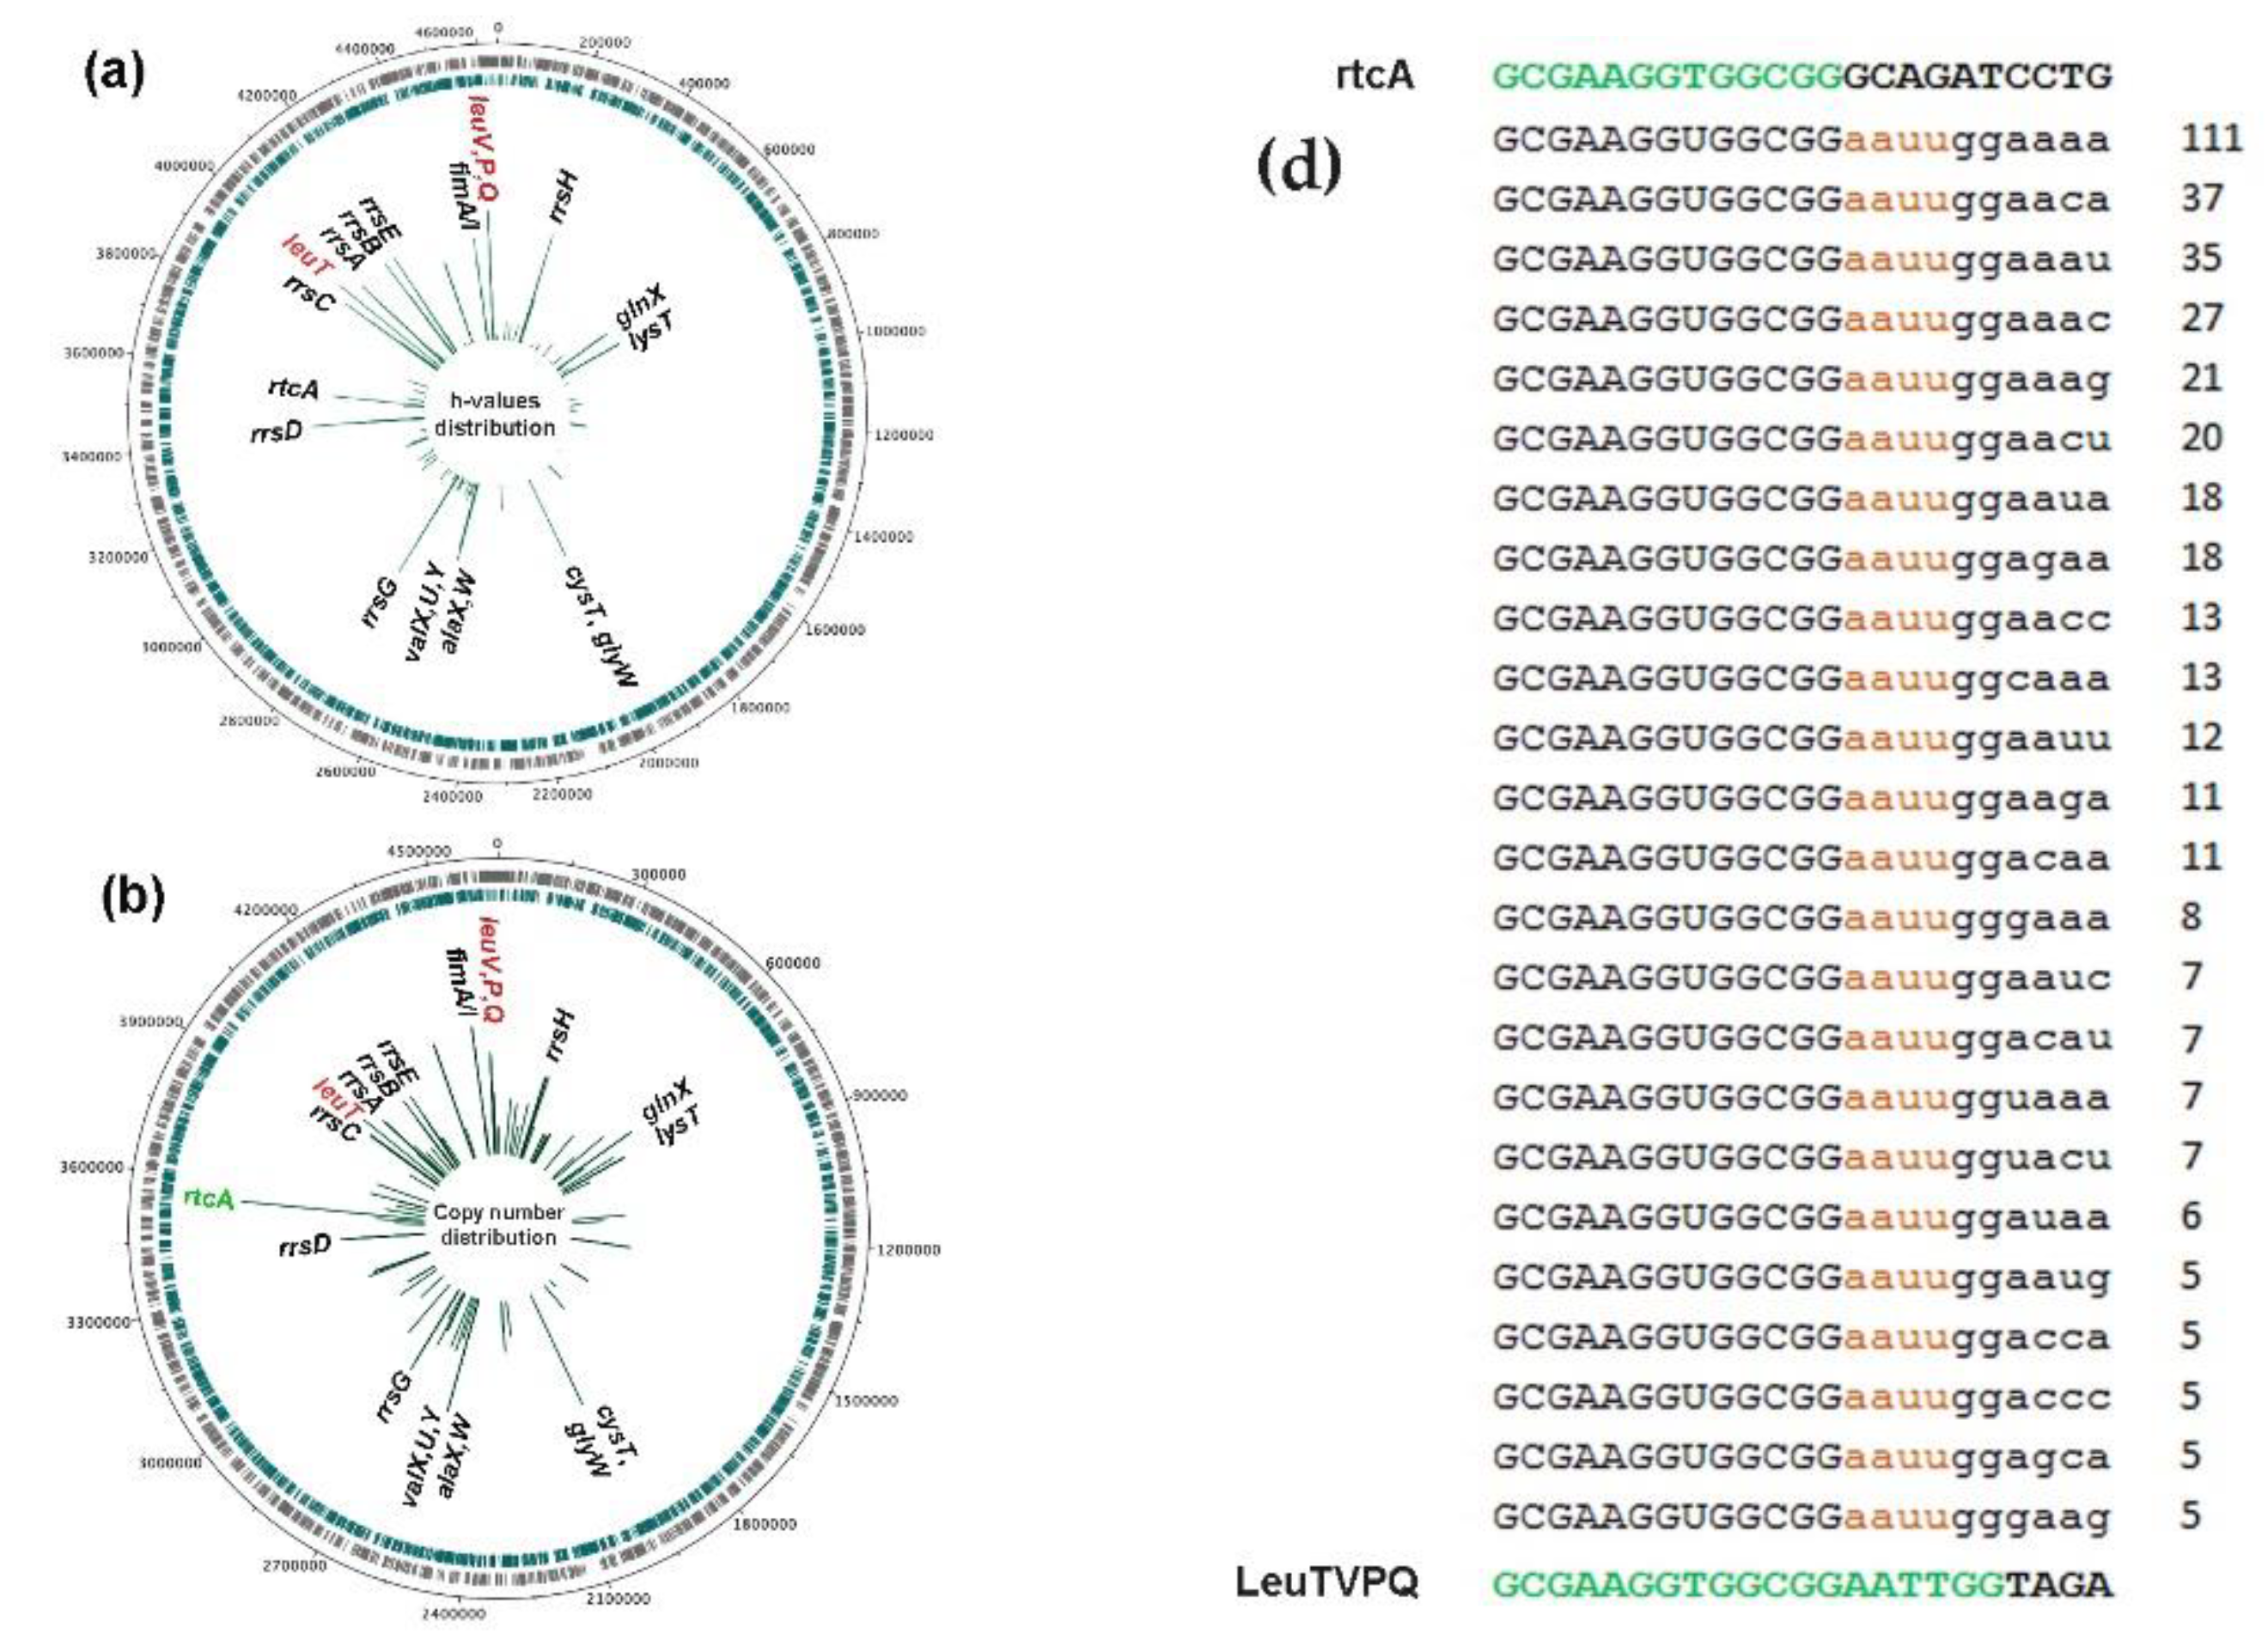
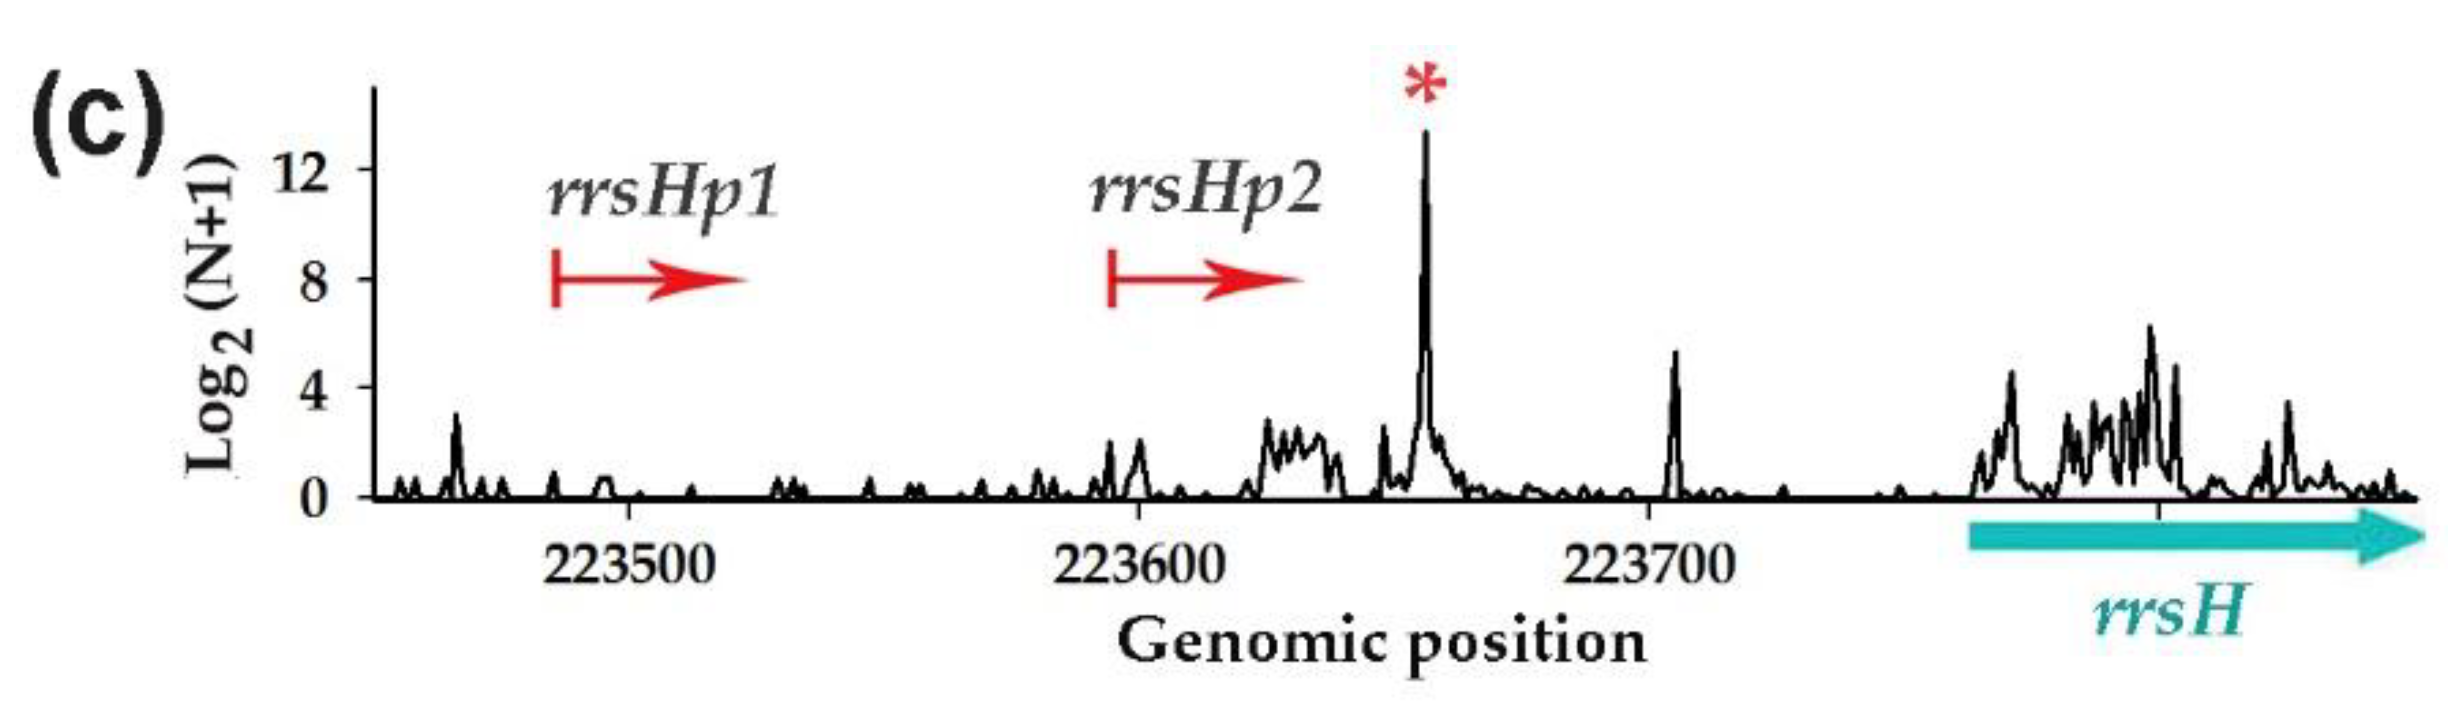
Figure 6.
The culture medium influence the distribution of terminal extension lengths in LeuTVPQ fragments (a), which affected the functionality of the modified fragments (d–f). (a) Analysis of RNA-seq datasets targeted to evaluate the ratio of modified to unmodified RNA fragments. Six additional datasets analyzed in this part of the study are characterized in Table 2. Numbers of correct and modified LeuTVPQ 19-mers were individually estimated in each dataset and averaged across replicates. (b–f) Representative growth curves of E. coli in M9 (b,d–f) and Luria Bertani media (c) in the presence and absence of model oligonucleotides. .
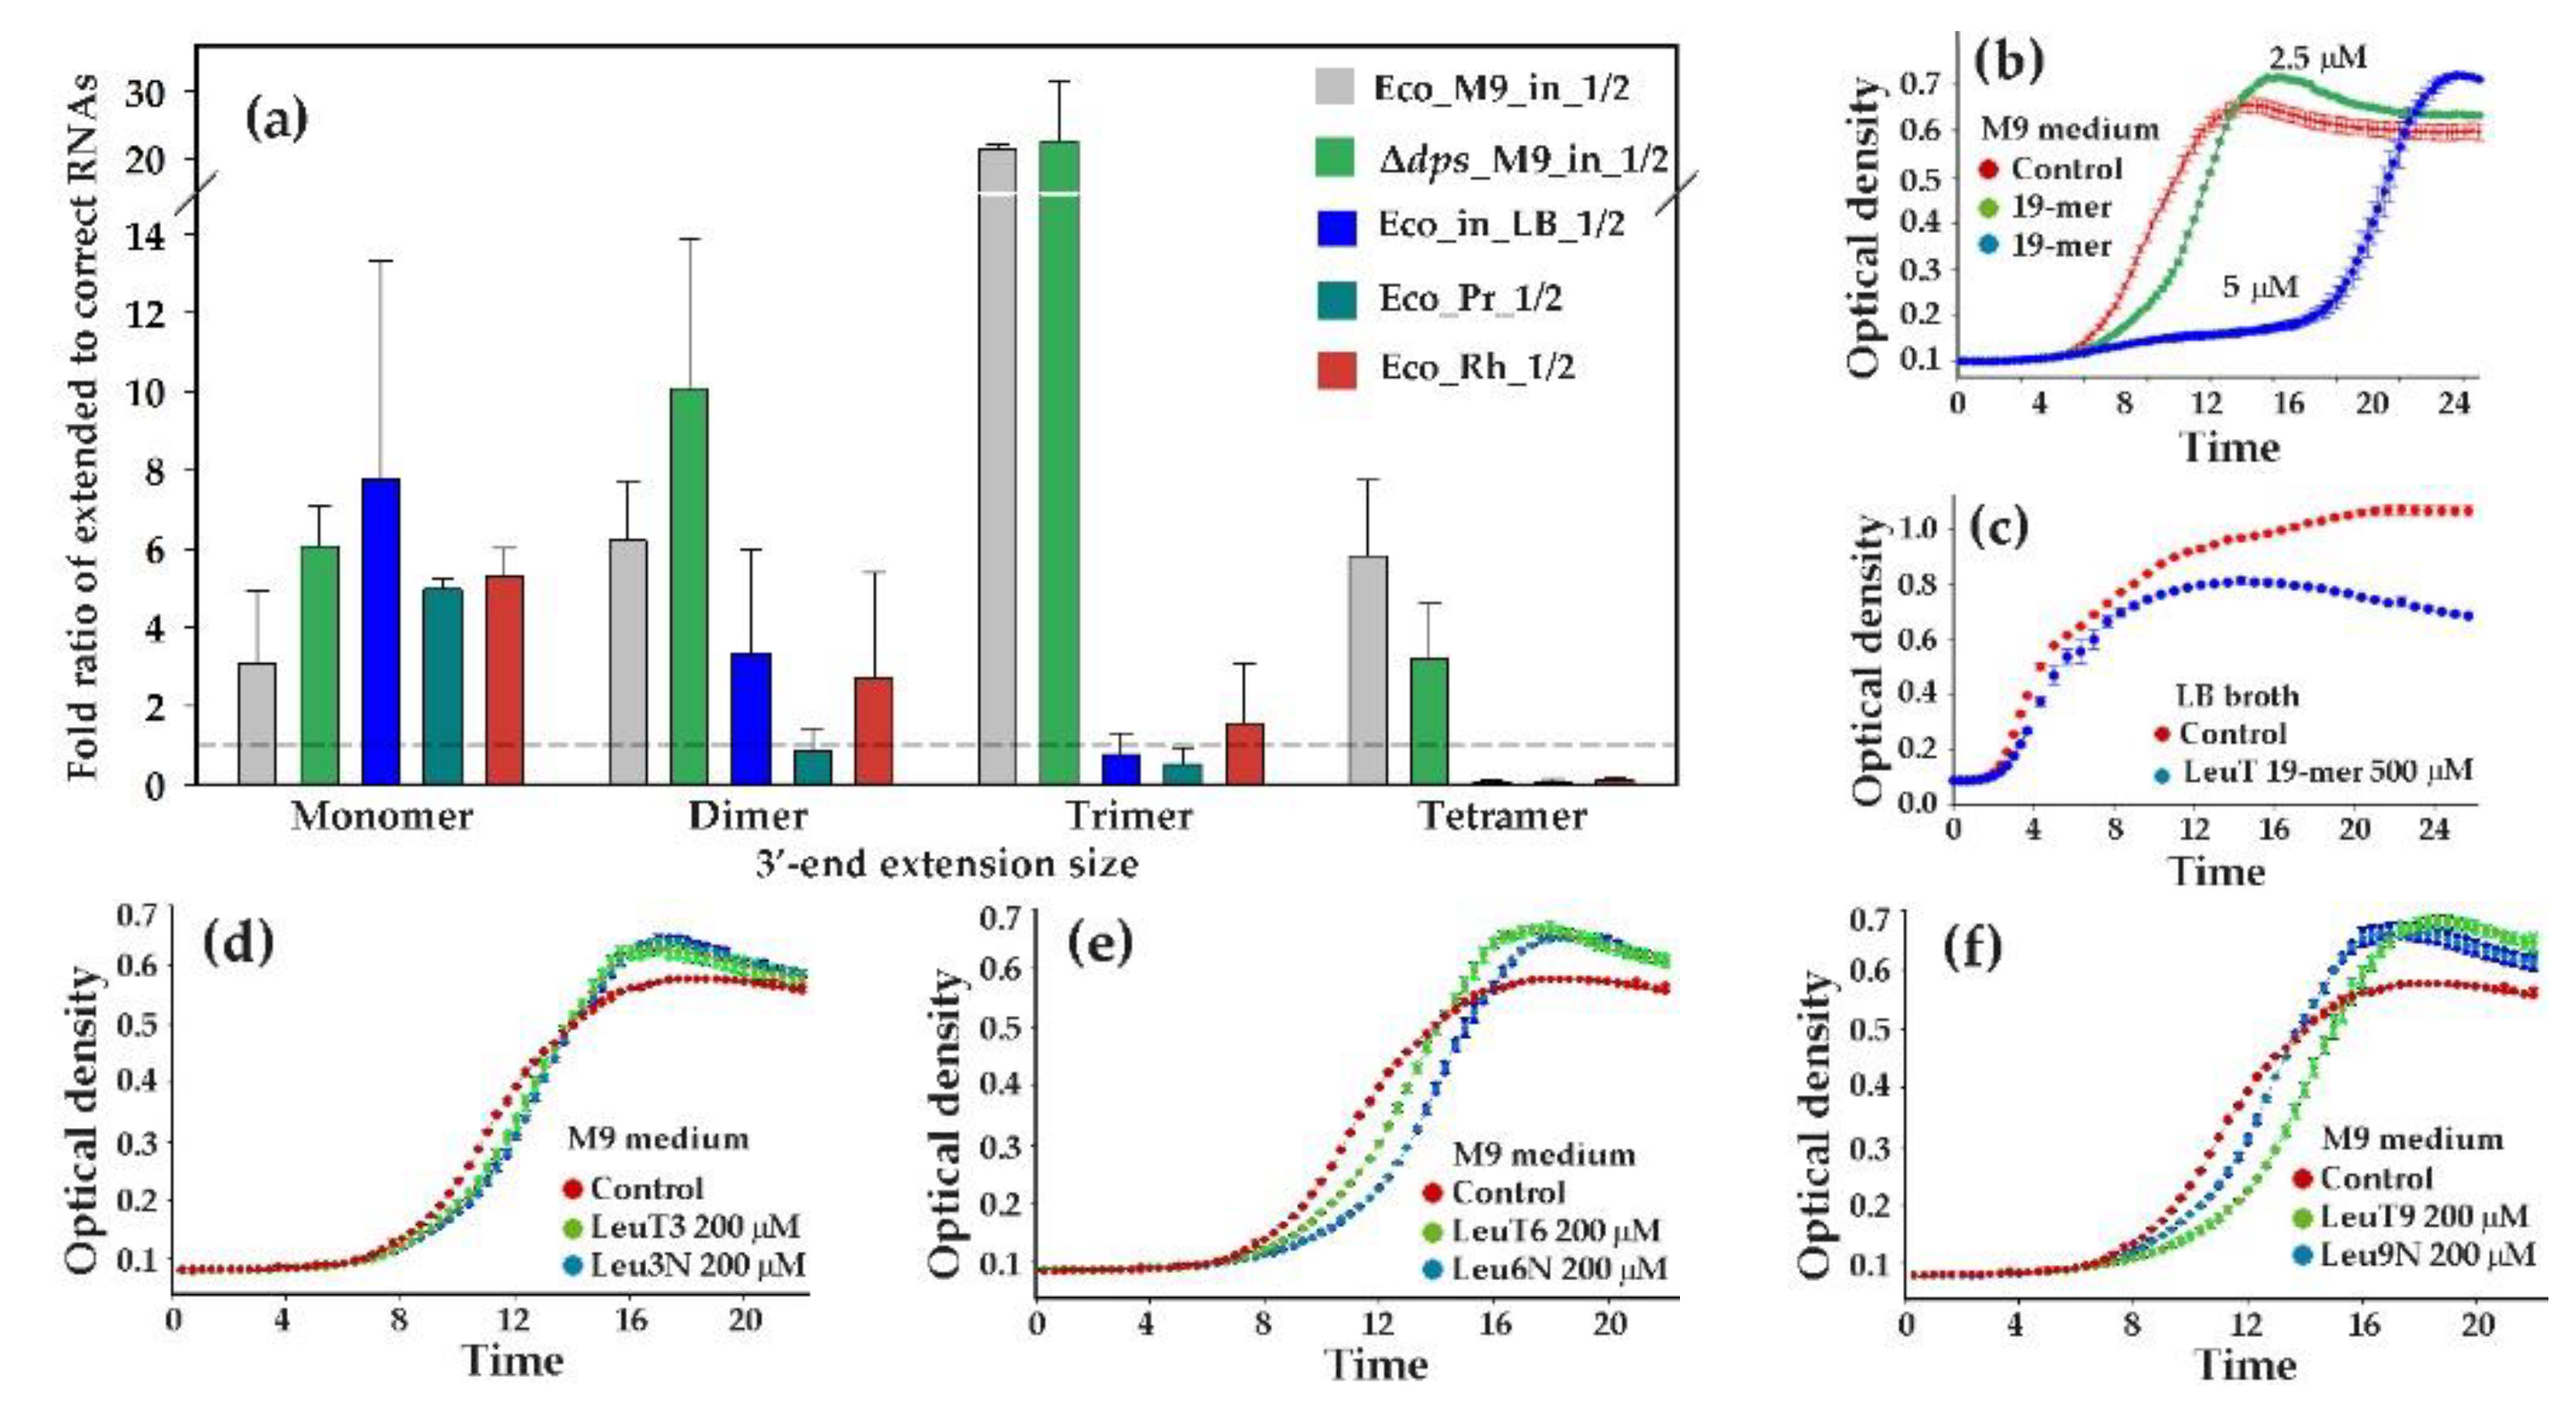
Figure 7.
The 5’-terminal 19-mers of LeuTVPQ tRNAs extended by genomic nucleotides (G6, G9) or random sequences (N6, N9) alter the taxonomic balance of the bacterial community revived from rat feces. (a) Box plots show Fold Change Ratios (FCR) of individual taxa with ≥ 0.01 abundance, while Mean Absolute Deviation (MAD) reflects their variance across all biological samples. (b–d) Volcano plots were generated based on at least four FCRs. Gray and green symbols represent the bacterial community response to oligonucleotides with 6-nt and 9-nt extensions, respectively. Horizontal dashed lines indicate significance level of p = 0.05.
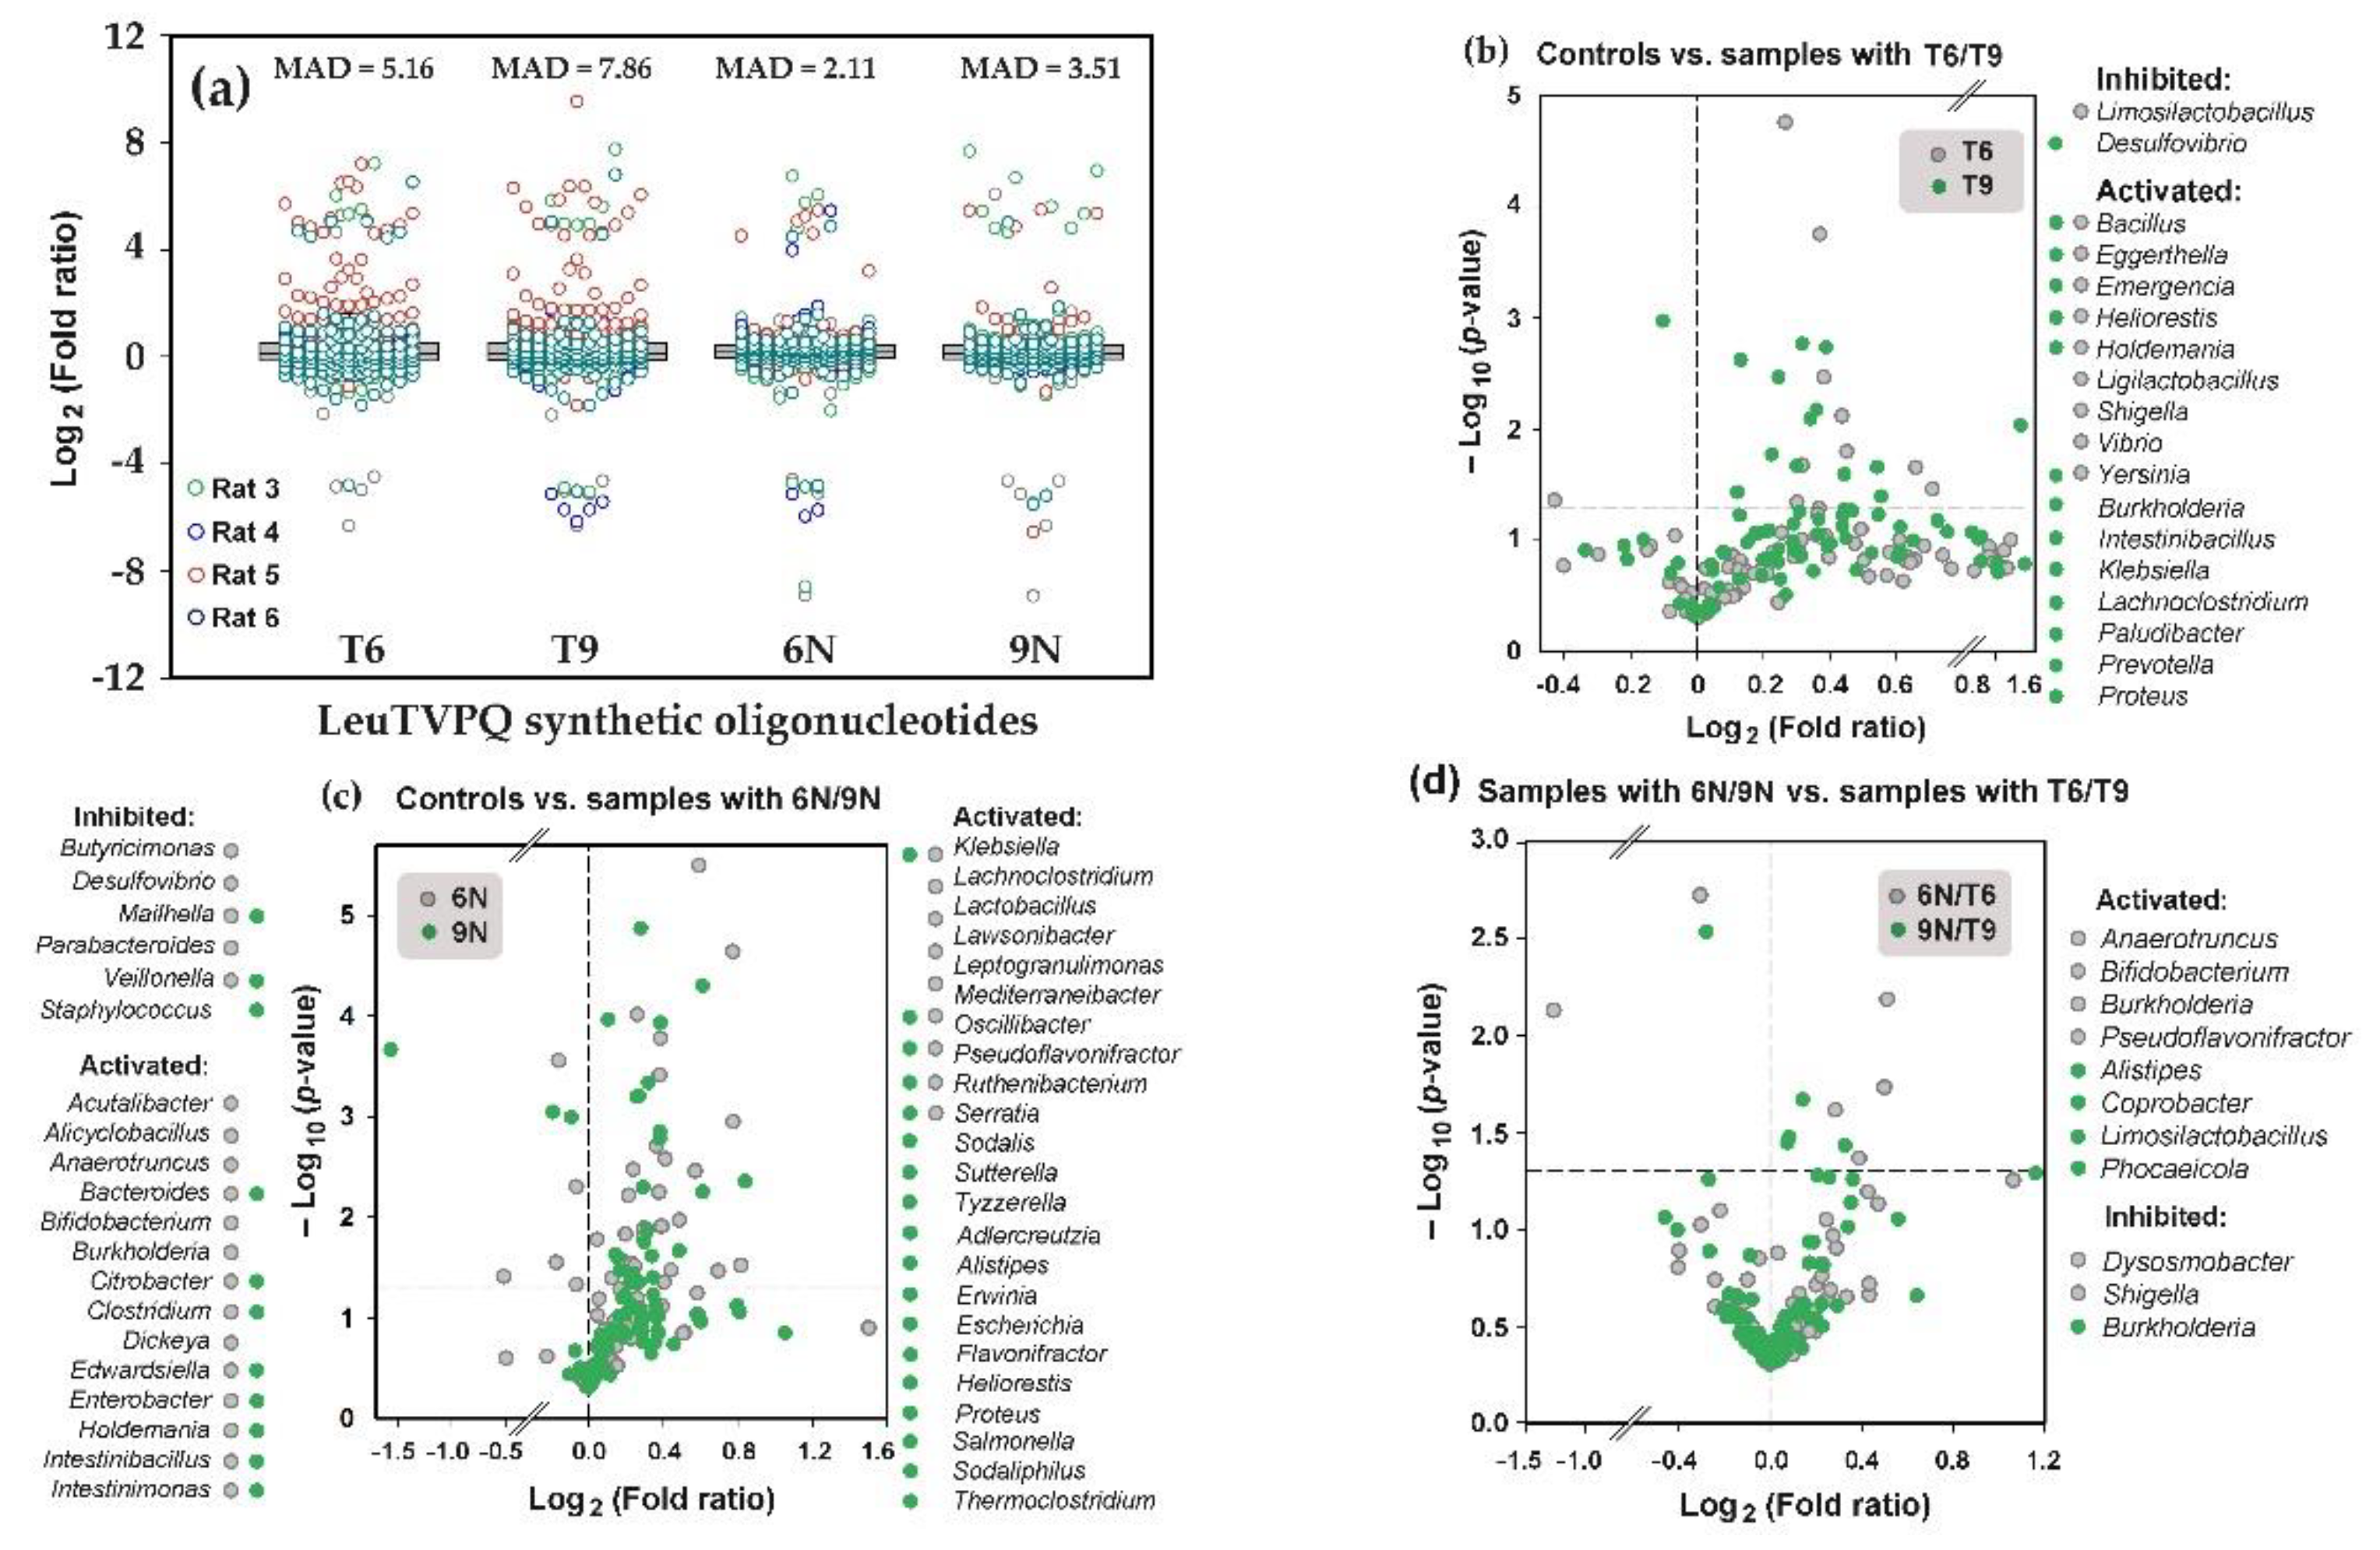

Table 1.
Sequencing statistics of RNA samples obtained from the transcriptomes and secretomes of the wild-type strain E. coli K-12 MG1655 and its ΔdpsΔ mutant (Project NCBI GEO GSE221667).
Table 1.
Sequencing statistics of RNA samples obtained from the transcriptomes and secretomes of the wild-type strain E. coli K-12 MG1655 and its ΔdpsΔ mutant (Project NCBI GEO GSE221667).
| Sample | Number of reads | Description | Data availability |
||
|---|---|---|---|---|---|
| Before QC | After QC | 16 ≤ L ≤ 50 | |||
| Eco_in_M9_1* Eco_in_M9_2 |
1,546,157 2,494,971 |
996,435 1,528,878 |
821,483 1,517,245 |
Intracellular RNAs isolated from the wild-type strain | GSM6892281 GSM6892282 |
|
dps_del_in_1* dps_del_in_2 |
2,093,000 1,771,628 |
1,294,678 1,082,635 |
1,292,272 1,072,005 |
Intracellular RNAs isolated from the Δdps mutant strain | GSM6892285 GSM6892286 |
| Eco_exo_1* Eco_exo_2 |
1,832,829 1,220,822 |
890,000 737,402 |
788,543 729,656 |
Extracellular RNAs isolated from the wild-type strain | GSM6892283 GSM6892284 |
|
dps_del_exo_1* dps_del_exo_2 |
608,759 917,604 |
182,984 258,455 |
158,810 180,502 |
Extracellular RNAs isolated from the Δdps mutant strain | GSM6892287 GSM6892288 |
* RNA-seq experiments performed simultaneously.
Table 2.
RNA-seq datasets used to assess the dependence of the terminal processing on growth conditions .
Table 2.
RNA-seq datasets used to assess the dependence of the terminal processing on growth conditions .
| Sample | Number of reads | Growth conditions |
BioProject PRJNA687658 sample description and references |
|
|---|---|---|---|---|
| Before QC | After QC | |||
| Eco_in_LB_1 Eco_in_LB_2 |
1,320,485 2,305,864 |
299,167 1,589,066 |
Anaerobic growth | Intracellular RNAs of E. coli grown in monoculture [33] |
| Eco_Pr_1 Eco_Pr_2 |
2,629,571 864,537 |
1,563,678 652,497 |
Anaerobic growth | RNAs isolated from E. coli cells after their co-cultivation with Prevotella copri or Rhodospirillum rubrum in membrane-separated compartments within common chamber [52] |
| Eco_Rh_1 Eco_Rh_2 |
1,301,404 1,176,395 |
1,028,350 681,123 |
Anaerobic growth | |
Table 3.
Sequences of synthetic analogs used for functional analysis.
| Name | 5’-terminal sequences of the fragments of four leucine tRNAs |
|---|---|
| LeuTVPQ | 5’- GCGAAGGUGGCGGAAUUGG - 3’ |
| LeuTVPQ_T3 | 5’-GCGAAGGUGGCGGAAUUGGUAG - 3’ |
| LeuTVPQ_3N* | 5’-GCGAAGGUGGCGGAAUUGGNNN - 3’ |
| LeuTVPQ_T6 | 5’-GCGAAGGUGGCGGAAUUGGUAGACG - 3’ |
| LeuTVPQ_6N | 5’-GCGAAGGUGGCGGAAUUGGNNNNNN - 3’ |
| LeuTVPQ_T9 | 5’-GCGAAGGUGGCGGAAUUGGUAGACGCGC - 3’ |
| LeuTVPQ_9N | 5’-GCGAAGGUGGCGGAAUUGGNNNNNNNNN - 3’ |
* nucleotides randomly incorporated in RNA in the presence of all 4 substrates.
Table 4.
Genomic regions encoding tRNAs with and without Dps-dependent secretion .
| Peak maximum | Strand | Number of reads* | Genomic locus | Strand | |||||
|---|---|---|---|---|---|---|---|---|---|
| Transcriptome | Secretome | Gene(s) | Borders | ||||||
| w.t. | Δdps | w.t. | Δdps | Right | Left | ||||
| 225381 | + | 941 | 638 | 2,318 | 966 | ileV | 225381 | 225457 | + |
| 3427152 | - | 618 | 718 | 1,204 | 1,109 | ileU | 3427076 | 3427152 | - |
| 4037141 | + | 618 | 718 | 1,159 | 966 | ileT | 4037141 | 4037217 | + |
| 564723 | + | 137 | 113 | 477 | 169 | argU | 564723 | 564799 | + |
| 2817860 | - | 422 | 386 | 1,311 | 1,662 | argQ(ZYV) | 2817784 | 2817860 | - |
| 3423655 | - | 1,387 | 2,127 | 4,380 | 4,053 | thrV | 3423580 | 3423655 | - |
| 696740 | - | 1,499 | 2,822 | 2,310 | 2,490 | metU(T) | 696664 | 696740 | - |
| 2947387 | + | 408 | 307 | 1,182 | 501 | metZ(WV) | 2947387 | 2947463 | + |
| 3318289 | - | 413 | 316 | 1,265 | 616 | metY | 3318213 | 3318289 | - |
| 697047 | - | 12,294 | 14,261 | 1,730 | 1,652 | leuW | 696963 | 697047 | - |
| 780765 | + | 1,046 | 941 | 473 | 357 | valT(Z) | 780765 | 780840 | + |
| 1031712 | - | 1,354 | 2,065 | 1,233 | 1,076 | serT | 1031625 | 1031712 | - |
| 1097652 | - | 2,279 | 3,837 | 818 | 724 | serX(W) | 1097565 | 1097652 | - |
| 2043557 | - | 432 | 624 | 198 | 148 | serU | 2043468 | 2043557 | - |
| 2521253 | + | 1,868 | 2,918 | 1,576 | 1,603 | lysV | 2521253 | 2521328 | + |
| 2729444 | - | 286 | 398 | 460 | 391 | gltW | 2729369 | 2729444 | - |
* Deviations from the required parameters are color-highlighted depending on their strength.
Disclaimer/Publisher’s Note: The statements, opinions and data contained in all publications are solely those of the individual author(s) and contributor(s) and not of MDPI and/or the editor(s). MDPI and/or the editor(s) disclaim responsibility for any injury to people or property resulting from any ideas, methods, instructions or products referred to in the content. |
© 2025 by the authors. Licensee MDPI, Basel, Switzerland. This article is an open access article distributed under the terms and conditions of the Creative Commons Attribution (CC BY) license (http://creativecommons.org/licenses/by/4.0/).
Copyright: This open access article is published under a Creative Commons CC BY 4.0 license, which permit the free download, distribution, and reuse, provided that the author and preprint are cited in any reuse.


