
Submitted:
01 August 2025
Posted:
04 August 2025
You are already at the latest version
Abstract
Purpose: This study investigates how customer-centric innovation can be leveraged to achieve a sustainable competitive advantage in the Nigerian insurance sector. Design/methodology/approach: A quantitative research design was employed, using data collected from 699 managerial and senior operational staff across 63 licensed Nigerian insurance companies. The relationships among the variables were analyzed using partial least squares structural equation modeling (PLS-SEM). Findings: The results confirm that customer-centric innovation has a significant positive effect on competitive advantage, both directly and indirectly. It strongly enhances service responsiveness and customer engagement. Customer engagement emerged as the most powerful predictor of competitive advantage, highlighting the critical role of relationship-building. Service responsiveness also significantly contributes to competitive advantage, acting as a key operational capability. Limitations and Research implications: This study is focused on the Nigerian insurance sector, and its findings may not be generalizable to other industries or countries without further research. The research implies that value in insurance is co-created and emerges from adaptive service systems and relational competencies, rather than being embedded in products. Practical Implications: Nigerian insurers should prioritize customer-centric innovation as a core strategy, redesigning processes to enhance responsiveness and intentionally cultivating customer engagement. Firms must invest in dynamic capabilities, including talent in data analytics and customer experience design. Originality/value: This study provides an empirically validated model of competitive advantage in the under-researched Nigerian insurance market. It uniquely operationalizes and tests customer-centric innovation, service responsiveness, and customer engagement as distinct constructs, clarifying their interconnected roles in a low-trust, emerging economy and offering a strategic roadmap for value co-creation.
Keywords:
Customer-centric innovation
; competitive advantage
; customer engagement
; service responsiveness
; insurance sector
; Nigeria
Introduction
The The Nigerian insurance industry has operated on a mass-market, one-size-fits-all approach, with relatively low insurance penetration rates, estimated at less than 1% of GDP (Agboola & Aduloju, 2025; Kolapo et al., 2025), significantly lower than the global average. This has been compounded by historical challenges such as low public trust, limited awareness, complex regulatory frameworks, and past instances of non-payment of claims (Wahua & Kenea, 2025; Oyedokun, 2024). However, the digital age has reshaped consumer expectations, driven by seamless experiences encountered with digital-native companies outside the insurance realm, including in the Nigerian fintech and e-commerce sectors. Nigerian customers now anticipate personalized advice, omnichannel interactions, and effortless end-to-end journeys, often via mobile devices (Chilekezi, 2025; Etuk et al., 2025). This paradigm shift necessitates that Nigerian insurers move beyond being mere claims payers to becoming risk management partners and providers of comprehensive, value-added services (Abass et al., 2025a; Abass et al., 2025b). Customer-centricity, means tailoring offerings, value propositions, and go-to-market strategies to specific Nigerian customer needs and preferences, fostering relationships built on mutual respect and personalized experiences, crucial for building trust in a market with historical skepticism towards insurance (van der Hulst et al., 2025).
Customer-centric innovation in the Nigerian insurance sector involves developing new products, services, processes, and business models with the Nigerian customer's needs and experiences at the core. This includes leveraging advanced technologies like Artificial Intelligence (AI) and data analytics to offer customized packages, such as micro-insurance for low-income earners (Agboola & Epetimehin, 2021), usage-based insurance for vehicle owners, or tailored health insurance plans, which reward specific behaviors or tailor coverage to individual circumstances (PwC, 2025). It also encompasses building an ecosystem approach where customers can access complementary services, moving beyond traditional product value propositions (Sosa & Sosa, 2025; Capgemini, 2024). The goal is to create seamless communication across all digital channels, including mobile apps, USSD codes, voice calls, chat, and social media, ensuring a consistent and positive customer journey that resonates with the local environment and digital adoption patterns (Emily, 2024). Digital transformation has been shown to notably improve operational efficiency and financial performance in the Nigerian insurance sector by simplifying processes and lowering operational expenses (Steve, 2025).
Competitive advantage refers to a Nigerian insurer's ability to perform in ways that rivals cannot or will not match, leading to superior financial performance and market share. In a market often perceived as uniform, highly regulated by NAICOM, and with low public awareness, achieving differentiation is challenging. Traditionally, competitive advantage might have been sought through capital base, branch network, or broad product offerings. However, in the contemporary landscape, it is increasingly derived from intangible assets and strategic approaches that enhance customer value (Dong & Doukas, 2025; Samsiah et al., 2025). The Nigerian insurance industry has shown resilience and growth in Gross Premium Written (GPW) and Profit Before Tax (PBT), indicating profitability despite low market penetration (Abdulkadir, 2024; Agboola & Aduloju, 2025). Nigerian insurers who successfully build competitive advantages demonstrate stronger revenue growth, higher employee satisfaction, and improved profitability, often by expanding the overall insurance market rather than just competing for existing customers.
Industry analyses indicate that CX leaders in the insurance sector globally often outperform their peers in total shareholder return (TSR) and earnings before interest and taxes (EBIT) growth (Mike, 2024). Furthermore, a customer-centric approach, particularly when integrated with digital transformation, leads to increased revenue, enhanced agent productivity, and reduced customer acquisition costs (BCG, 2025). Personalization, a key outcome of customer-centric innovation, can boost cross-selling by as much as 20% and, in some instances, double customer retention and triple conversion rates (Maximizer, 2025). This commitment to personalization transforms insurance from a transactional necessity into a trusted, lifelong partnership, providing a significant competitive edge.
Despite the clear benefits, many Nigerian insurers face significant hurdles in fully embracing and implementing customer-centric innovation to gain a sustainable competitive advantage. Nigerian customers today expect the same level of personalization, speed, and convenience from their insurers as they receive from leading digital companies like mobile network operators and fintech platforms (Etuk et al., 2025). They demand self-service options, seamless omnichannel interactions (especially via mobile), and tailored products that address their unique socio-economic realities (Chilekezi, 2025). The low frequency of customer touchpoints in insurance makes each interaction critical, yet too often, experiences fall short of these heightened expectations, particularly in sales, claims, and distribution. Nigerian insurers struggle to meet these demands, risking customer dissatisfaction and churn, as customers are increasingly willing to switch providers for better value, innovation, or experience, especially with the rise of agile insurtechs (Maximizer, 2025). This shift in consumer behavior underscores the urgent need for traditional insurers to adapt their strategies to remain competitive and relevant in the evolving market landscape (BCG, 2025).
While overall insurance penetration in Nigeria remains low (Agboola & Aduloju, 2025), certain segments (e.g., corporate, motor insurance) are characterized by numerous players and a largely penetrated customer base, making differentiation difficult. New competitive threats are emerging from agile Nigerian insurtechs and global technology firms which possess superior digital capabilities and customer-centric models (Sosa & Sosa, 2025). This influx of new entrants, coupled with the inherent uniformity of traditional insurance products and the challenge of expanding into the informal sector, makes it challenging for established Nigerian insurers to stand out and capture additional market share (Abdulkadir, 2024). Many incumbent Nigerian insurers are hampered by legacy technology platforms designed around policy-centric rather than customer-centric processes, leading to siloed customer data and fragmented communication channels. While digital transformation is recognized as a necessity, studies indicate that digital adoption has been relatively slow in the country despite its potential to transform the sector (Steve, 2025). Investments have often been insufficient or narrowly focused on IT systems, failing to unlock their full potential for competitive advantage. The inability to effectively leverage data and adopt cutting-edge technologies like AI and machine learning hinders the delivery of personalized experiences and efficient operations, leaving Nigerian insurers vulnerable to more technologically advanced competitors and hindering their ability to scale and serve a diverse population (PwC, 2025). This technological gap is a significant barrier to achieving the enhanced agent productivity and reduced customer acquisition costs seen in digitally mature markets (BCG, 2025).
The Nigerian insurance industry continues to grapple with traditional operational inefficiencies, such as slow claims processing, opaque policy terms, and a lack of trust, which create significant barriers to customer satisfaction and market expansion (Wahua & Kenea, 2025). NAICOM, the industry regulator, has expressed determination to deal with the problem of claims repudiation and delays, emphasizing zero tolerance for outstanding claims in 2024 (Omosehin, 2024; Nwoji, 2025; The Guardian Nigeria News, 2024). Furthermore, Nigerian insurers face increasing external pressures, including macroeconomic volatility (e.g., inflation, naira devaluation), escalating climate-related risks, and sophisticated cybersecurity threats that can erode trust and incur significant costs. Compliance changes from NAICOM and a talent shortage in specialized areas like data analytics and digital marketing also add layers of complexity. These challenges divert resources and attention, making it difficult for Nigerian insurers to simultaneously invest in and execute comprehensive customer-centric innovation strategies while maintaining profitability and managing risk (Abass et al., 2025a). Low awareness and trust issues remain significant barriers to insurance penetration in Nigeria, with only 37% of individuals expressing complete trust in insurance companies, according to a recent survey (Edelman, 2024). Building this trust is crucial for fostering relationships based on mutual respect and personalized experiences (van der Hulst et al., 2025).
In light of these challenges, many Nigerian insurers find themselves in a precarious position, they recognize the strategic importance of customer-centric innovation for competitive advantage, yet they struggle with the practical implementation required to bridge the gap between evolving Nigerian customer expectations and their current operational capabilities. This study aims to explore how customer-centric innovation can be effectively leveraged to secure a sustainable competitive advantage in the dynamic Nigerian insurance sector, specifically examining its impact on service responsiveness and customer engagement, and ultimately, competitive advantage. Customer-centric innovation is increasingly recognized as a direct pathway to competitive advantage in the Nigerian insurance industry. This leads to the following hypothesized relationships:
Customer-Centric Innovation has a positive and significant effect on Service Responsiveness.
: Customer-Centric Innovation has a positive and significant effect on Customer Engagement.
: Customer-Centric Innovation has a positive and significant effect on Competitive Advantage.
: Service Responsiveness positively influences Customer Engagement.
: Service Responsiveness positively influences Competitive Advantage.
: Customer Engagement positively influences Competitive Advantage.
Literature Review
The contemporary insurance landscape is undergoing a profound transformation, driven by a confluence of evolving consumer expectations and technological advancements. This shift has necessitated a move from traditional, product-centric models to a more customer-centric paradigm, where innovation becomes a critical differentiator and a direct driver of competitive advantage.
Customer-Centric Paradigm
The ascendancy of the customer-centric paradigm in insurance is largely a response to shifting consumer expectations, heavily influenced by digital-native sectors such as Fintech and E-commerce. Modern consumers, accustomed to seamless, personalized, and omnichannel experiences in other industries, now demand the same from their insurers (Goftar et al., 2025; Méndez-Aparicio et al, 2020). This demand extends beyond mere transactional efficiency to a desire for proactive engagement, transparent processes, and tailored solutions (Ahmad, Karim, Sultana, & Lima, 2025). The "seamless" aspect implies effortless transitions between different interaction points, whether it's a mobile app, a website, a call center, or an agent. "Personalized" experiences move beyond basic demographic segmentation to granular, individual-level customization based on behavior, preferences, and real-time data. "Omnichannel" signifies a unified and consistent experience across all these touchpoints, ensuring that customer is maintained regardless of the channel used (Goftar et al., 2025; Dataforest, 2025). The influence of digital-native sectors has set a new benchmark for customer service, where instant gratification, intuitive interfaces, and proactive communication are standard, compelling the traditionally more conservative insurance industry to adapt rapidly (Dataforest, 2025).
Consequently, the role of insurers is evolving from being solely claims payers to becoming comprehensive risk management partners. This transition emphasizes the provision of value-added services, fostering trust, and building enduring relationships with policyholders, thereby enhancing overall customer loyalty (Goftar et al., 2025; Hekmat et al., 2022). As risk management partners, insurers are increasingly engaging in preventative measures, offering services that help policyholders mitigate risks before a claim occurs. This can include wellness programs for health insurance, telematics devices for auto insurance that encourage safer driving, or smart home sensors for property insurance that detect potential hazards like water leaks or fires. This proactive approach not only benefits the policyholder by reducing their exposure to loss but also strengthens the insurer's position as a trusted advisor rather than just a reactive service provider (Hekmat et al., 2022). Building trust in this digital age also involves rigorous data privacy and security measures, transparent communication about policy terms, and ethical use of AI in decision-making, all of which are crucial for maintaining customer confidence and fostering long-term relationships (Goftar et al., 2025; Van der Hulst et al 2025). Research indicates that transparency in purchasing decisions and clear communication about payment obligations are vital for fostering trust, especially as customers are increasingly concerned about data privacy and security in digital environments (Van der Hulst et al 2025; Zamharir, 2025).
Customer-Centric Innovation
Customer-centric innovation in the insurance sector involves the development of new products, services, processes, and business models with the customer's needs and preferences at their core. A key enabler of this innovation is the leveraging of Artificial Intelligence (AI) and data analytics for hyper-personalization (Chennamsetty, 2024; Zarifis et al., 2023). AI-driven systems, for instance, can automate claims processing, detect fraud with high accuracy, and significantly reduce processing times, thereby enhancing customer satisfaction (Chennamsetty, 2024; Nellutla, 2025). Beyond claims, AI and data analytics are transforming underwriting by enabling predictive risk assessment, allowing for more accurate and personalized pricing models based on individual risk profiles rather than broad demographic categories (Aragani, 2022; Zamharir, 2025). Natural Language Processing (NLP) is being used to analyze customer feedback and interactions, providing insights that inform product development and service improvements. Machine learning algorithms can identify patterns in vast datasets to anticipate customer needs and proactively offer relevant products or services, moving from a reactive sales model to a predictive, advisory one (Wagan & Sidra, 2025).
Examples of such innovations include micro-insurance, which offers affordable coverage for low-income populations, and usage-based insurance (UBI), which customizes premiums based on individual behavior, as well as tailored health plans that adapt to specific health needs (Apostolakis et al., 2015.; Madrid, 2014). Micro-insurance, often distributed through mobile platforms, addresses the protection gap in emerging markets, providing essential coverage against specific risks like crop failure or health emergencies to vulnerable populations (Madrid, 2014). UBI, particularly in motor insurance, utilizes telematics data (e.g., driving speed, braking habits, mileage) to offer dynamic pricing, rewarding safer drivers with lower premiums and encouraging better driving behavior. Similarly, tailored health plans leverage wearable technology and health data to offer personalized wellness incentives, chronic disease management programs, and preventive care recommendations, shifting the focus from illness treatment to health maintenance. Implementing these innovations, however, presents challenges such as integrating disparate data sources, overcoming legacy IT systems, ensuring data privacy compliance, and navigating evolving regulatory landscapes (Nellutla, 2025; Aragani, 2022). Despite these challenges, the InsurTech sector, driven by AI and automation, continues to see significant investment and growth, with a focus on enhancing customer experience and operational efficiency (Gallagher Insurance, 2025; Aragani, 2022).
Beyond individual products, insurers are increasingly adopting an ecosystem approach, offering complimentary services that extend beyond traditional insurance. This involves seamless communication and integration across all digital channels, creating a holistic customer journey (Hekmat et al., 2022). This ecosystem strategy sees insurers partnering with a diverse range of third-party providers, including health tech startups for personalized wellness coaching, smart home device manufacturers for enhanced property protection, and automotive companies for integrated UBI solutions. The goal is to create a comprehensive value proposition that addresses broader customer needs related to well-being, safety, and financial security, rather than just offering standalone insurance policies (Capgemini, 2024). This interconnectedness allows for a richer exchange of data (with customer consent), enabling more predictive and personalized services, and ultimately deepening customer engagement and loyalty by providing a more integrated and convenient experience (Hekmat et al., 2022). The emergence of InsurTech has led to a new ecosystem characterized by digital intermediation and strategic partnerships, emphasizing functional complementarity among various archetypes of firms (Sosa & Sosa, 2025).
Competitive Advantage in the Modern Insurance Market
In the highly competitive modern insurance market, competitive advantage is defined by an insurer's ability to outperform rivals, leading to superior financial performance and increased market share. This has necessitated a strategic shift from reliance on traditional advantages like substantial capital and extensive branch networks to a focus on intangible assets and the creation of customer value (Madhani, 2012; Purnamawati, 2022). Historically, competitive edge was often derived from financial strength, broad distribution networks, and a large capital base. However, in the digital era, while these remain important, they are no longer sufficient. Intangible assets, such as brand reputation, customer relationships, proprietary data, and innovative capabilities, are now recognized as primary drivers of long-term resilience and profitability (Altomonte et al., 2024; Dong, 2025). A strong brand, built on consistent positive customer experiences, can command premium pricing and foster loyalty. Deep customer relationships, cultivated through personalized interactions and value-added services, reduce churn and increase customer lifetime value. Proprietary data, ethically collected and intelligently analyzed, provides invaluable insights for product development, risk assessment, and personalized marketing. Furthermore, the ability to rapidly innovate and adapt to market changes, often termed "dynamic capabilities," becomes a critical intangible asset, allowing insurers to continually refresh their offerings and maintain relevance in a fast-evolving environment (Purnamawati, 2022; Dong & Doukas, 2025). Research supports that effectively managing both tangible and intangible assets is crucial for improving financial results and maintaining competitiveness (Samsiah et al., 2025).
Industry performance indicators, such as growth in Gross Premium Written (GPW) and an increase in Profit Before Tax (PBT), serve as crucial metrics for evaluating the success of these strategic shifts. However, a more comprehensive view of performance in the customer-centric era also includes metrics like customer lifetime value (CLV), which measures the total revenue a customer is expected to generate over their relationship with the insurer; Net Promoter Score (NPS), a widely used indicator of customer loyalty and willingness to recommend; and various operational efficiency metrics related to digital processing and automation. These indicators collectively provide a holistic picture of an insurer's ability to translate customer-centric strategies and innovation into sustainable financial success and market leadership.
Customer-Centricity, Innovation, and Performance
A growing body of evidence unequivocally demonstrates a strong nexus between customer-centricity, innovation, and improved financial performance. Companies recognized as customer experience (CX) leaders consistently exhibit higher Total Shareholder Return (TSR) and Earnings Before Interest and Taxes (EBIT) growth compared to their peers (McKinsey, 2023; Aslan, 2024). This positive correlation is not merely theoretical; it translates into tangible benefits for insurers. Enhanced customer experience and innovative offerings lead to increased revenue, partly through improved cross-selling and up-selling opportunities, and higher agent productivity (McKinsey, 2023; Patin, 2024). When customers have a positive experience, they are more open to purchasing additional products from the same insurer (cross-selling) or upgrading their existing policies (up-selling), thereby increasing their "wallet share" (Singireddy, 2023). Furthermore, providing agents with advanced digital tools and insights derived from customer data can significantly boost their efficiency and sales effectiveness, contributing directly to revenue growth.
A strong customer-centric approach also significantly reduces customer acquisition costs, as satisfied customers are more likely to remain loyal and refer new business (Suvashree, 2024; Patin, 2024). The cost of acquiring a new customer in the insurance industry is considerably higher than retaining an existing one, making customer retention a highly profitable strategy (Suvashree, 2024). By delivering exceptional experiences and innovative solutions, insurers can foster a loyal customer base that not only renews policies but also acts as brand advocates, generating organic growth through positive word-of-mouth and referrals. Crucially, this approach enhances customer retention and conversion rates, building a stable and profitable customer base (Suvashree, 2024; Aragani, 2022.). Improved conversion rates stem from a better understanding of customer needs and the ability to offer highly relevant and personalized products, reducing friction in the sales process. Innovation, particularly when driven by customer needs, acts as a catalyst, enabling insurers to differentiate their offerings, meet evolving demands, and ultimately secure a sustainable competitive advantage (Gathua, 2018). This continuous cycle of understanding, innovating, and delivering value creates a virtuous loop where customer satisfaction fuels loyalty, which in turn drives financial performance and reinforces the insurer's market position.
Theoretical Framework: Integrating Service-Dominant Logic
This study is fundamentally anchored in the Service-Dominant Logic (S-DL), a transformative theoretical lens that redefines the nature of economic exchange and value creation. While traditional economic thought often views goods as the primary output and service as an add-on, S-DL posits that service is the fundamental basis of exchange (Vargo & Lusch, 2004, 2008). This perspective is particularly pertinent to the insurance industry, where the core offering is not a tangible product but an intangible promise of protection, risk management, and financial security, essentially, a service.At the heart of S-DL lies the concept of value co-creation, emphasizing that value is not embedded in goods or services by the producer, but rather is jointly created through the active participation and interaction between the service provider and the beneficiary (customer) (Vargo & Lusch, 2008). This paradigm shift moves away from a "firm-centric" view, where value is delivered to the customer, towards a "customer-centric" view, where value is collaboratively generated with the customer. In the Nigerian insurance sector, this means moving beyond a transactional "mass-market, one-size-fits-all approach" to one where insurers and customers engage in a continuous process of mutual value generation through personalized interactions and tailored solutions (Agboola & Aduloju, 2025; Chilekezi, 2025). S-DL highlights the importance of operant resources, dynamic resources capable of acting on other resources (e.g., knowledge, skills, information, capabilities), as the source of competitive advantage, rather than static operand resources (e.g., raw materials, tangible assets) (Vargo & Lusch, 2004). In this study, customer-centric innovation, enabled by advanced technologies like Artificial Intelligence (AI) and data analytics, represents the application of operant resources to enhance the service experience. These technologies allow insurers to leverage information and knowledge to better understand customer needs, personalize offerings, and streamline processes, thereby facilitating superior value co-creation.
The principles of Service-Dominant Logic provide a robust theoretical foundation for understanding the relationships between customer-centric innovation, service responsiveness, customer engagement, and competitive advantage in the Nigerian insurance industry. Customer-centric innovation, as defined in this study, involves developing new products, services, processes, and business models with the Nigerian customer's needs and experiences at the core. This aligns perfectly with S-DL's emphasis on designing service systems that facilitate value co-creation. By leveraging AI and data analytics for hyper-personalization (Chennamsetty, 2024; Zarifis et al., 2023), insurers are not merely offering products but are actively engaging in a process of tailoring the service to individual customer, thereby enhancing the potential for value co-creation. Examples like micro-insurance, usage-based insurance (UBI), and tailored health plans are manifestations of this co-creative process, where the insurer's operant resources (knowledge, technology) are applied to the customer's resources (behavioral data, health information) to generate personalized value (Apostolakis et al., 2015; Madrid, 2014). H1 states that Customer-Centric Innovation has a positive and significant effect on Service Responsiveness. From an S-DL perspective, customer-centric innovations (e.g., instant digital claims processing, AI-powered chatbots) are operant resources designed to improve the efficiency and effectiveness of service interactions. By streamlining processes and providing immediate access to information and support, these innovations directly enhance the insurer's ability to respond quickly and efficiently. This responsiveness is a critical facilitator of value co-creation, as it reduces friction and enhances the customer's experience of the service. In addition, H2 states that Customer-Centric Innovation has a positive and significant effect on Customer Engagement. Consistent with S-DL, customer-centric innovations, such as personalized products and proactive communication via digital platforms, foster deeper customer engagement. By offering tailored solutions and interactive channels, insurers provide customers with more opportunities to participate in the value co-creation process. This moves beyond mere transactional interactions to building relationships, where customers are more actively involved and invested, which is vital for trust and loyalty (Hekmat et al., 2022; Wagan & Sidra, 2025).
Service responsiveness and customer engagement are direct outcomes and indicators of successful value co-creation within the S-DL framework. When an insurer is responsive, it demonstrates its commitment to facilitating the customer's value-in-use. Similarly, engaged customers are those who are actively participating in the service process, providing feedback, and integrating the service into their lives. H4 states that Service Responsiveness positively influences Customer Engagement. In line with S-DL, when insurers demonstrate high service responsiveness (e.g., prompt claims settlement, rapid query resolution), they are effectively and efficiently applying their operant resources to support the customer's needs. This positive and frictionless interaction enhances the customer's experience, making them feel valued and understood. Such positive experiences encourage further participation and interaction, thereby deepening customer engagement and fostering a stronger co-creative relationship (Méndez-Aparicio et al., 2020).
S-DL suggests that sustainable competitive advantage is achieved not by simply offering superior products, but by excelling at facilitating the customer's own value creation processes (Vargo & Lusch, 2004). Insurers who are adept at customer-centric innovation, deliver highly responsive service, and foster deep customer engagement are effectively creating more value with their customers than their competitors. This superior value co-creation leads to differentiation and a stronger market position. H3 states that Customer-Centric Innovation has a positive and significant effect on Competitive Advantage. From an S-DL perspective, customer-centric innovation allows insurers to differentiate their service offerings by enabling more effective and personalized value co-creation. By tailoring offerings and processes to specific customer needs, insurers can attract and retain more customers, expand into underserved segments, and build a stronger brand reputation. This ability to continuously innovate and adapt operant resources for superior value co-creation provides a sustainable competitive edge (Gathua, 2018). In addition, H5 states that Service Responsiveness positively influences Competitive Advantage. In a service-dominant view, superior service responsiveness is a key differentiator. Insurers known for quick and efficient service delivery enhance the customer's experience of value-in-use, making the overall service offering more attractive. This directly contributes to attracting and retaining customers, thereby securing a competitive advantage over rivals who are less responsive (McKinsey, 2023). H6 also states that Customer Engagement positively influences Competitive Advantage. Deeply engaged customers, as active participants in value co-creation, are more likely to exhibit loyalty, renew policies, and advocate for the insurer. This organic growth, reduced churn, and positive word-of-mouth are direct manifestations of superior value co-creation translating into enhanced market share, profitability, and overall competitive standing (Suvashree, 2024; Patin, 2024).
Complementary Theoretical Lenses
While S-DL provides the overarching framework, other theories offer valuable complementary insights into specific mechanisms within the model:
Resource-Based View (RBV)
The Resource-Based View (RBV) complements S-DL by explaining how firms develop the capabilities to engage in superior value co-creation. RBV posits that a firm's sustained competitive advantage stems from its unique, valuable, rare, inimitable, and non-substitutable (VRIN) resources and capabilities (Barney, 1991). In this study, customer-centric innovation, digital infrastructure, advanced data analytics capabilities, and a customer-focused organizational culture can be considered operant resources that, when VRIN, enable superior service responsiveness and customer engagement. These intangible assets, as highlighted in your manuscript, are increasingly crucial drivers of long-term resilience and profitability in the modern insurance market (Altomonte et al., 2024; Dong & Doukas, 2025). Thus, RBV helps to explain the underlying mechanisms by which customer-centric capabilities become sources of competitive advantage.
Dynamic Capabilities Theory (DCT)
Dynamic Capabilities Theory (DCT) extends RBV by focusing on a firm's ability to integrate, build, and reconfigure internal and external competences to address rapidly changing environments (Teece, Pisano, & Shuen, 1997). In the volatile and evolving Nigerian insurance landscape, characterized by shifting consumer expectations and the rise of agile insurtechs, the capacity to continuously sense market changes, seize new opportunities (e.g., through customer-centric innovations), and transform existing processes (e.g., overcoming legacy IT systems) is a critical dynamic capability. This theoretical lens explains how insurers can adapt and innovate their operant resources over time to maintain their competitive edge in a fast-evolving service ecosystem, ensuring continued relevance and effective value co-creation.
Customer Relationship Management (CRM) Theory
Customer Relationship Management (CRM) Theory provides a micro-level understanding of how customer interactions are managed to foster loyalty and drive sales growth. This theory directly supports the mechanisms by which customer-centric innovation and service responsiveness lead to enhanced customer engagement and, subsequently, competitive advantage. CRM strategies, which involve managing and analyzing customer data to improve business relationships, are essential for implementing the personalization and omnichannel interactions central to customer-centric innovation (Goftar et al., 2025; Zamharir, 2025). By effectively managing customer touchpoints and leveraging insights to tailor experiences, insurers can build stronger, more enduring customer relationships, leading to increased retention, cross-selling, and ultimately, a more robust competitive position (Suvashree, 2024; Singireddy, 2023).
Empirical Reviews and Research Gap

| Author & Date | General Objective Of The Study | Methodology | Findings | Gap Filled By The Present Study |
|---|---|---|---|---|
| H1: Customer-Centric Innovation has a positive and significant effect on Service Responsiveness. | ||||
| Chen, H. & Chen, C. (2018) | To investigate how customer orientation influences service performance, including responsiveness, with organizational learning as a mediator. | Survey data from service firms; Structural Equation Modeling (SEM). | Customer orientation positively influences organizational learning, which in turn significantly enhances service performance (including responsiveness). | This study supported the conceptual link between customer-centricity and responsiveness, but the present study explicitly measured "Customer-Centric Innovation" and "Service Responsiveness" as distinct constructs. |
| Ordanini, L. & de Jong, P. (2009) | To explore how customer involvement in service innovation processes affects service performance. | Survey data from service organizations; Statistical analysis (details not specified in snippet). | Active customer involvement in service innovation led to improved service quality and efficiency (components of responsiveness). | This study highlighted customer involvement (a facet of CCI) and its impact on service performance. The present study broadened this to the full scope of CCI and directly measured SR. |
| Orcullo, A. S. L. & Orcullo, A. C. B. (2016) | To examine the relationship between market orientation, service innovation, and organizational performance in the service sector in an emerging market. | Survey data from service firms in the Philippines; Statistical analysis (details not specified in snippet). | Market orientation positively influenced service innovation, which then led to improved organizational performance, including enhanced responsiveness to customer needs. | This study provided evidence from an emerging market service perspective. The present study specifically focused on "Customer-Centric Innovation" as the driver of responsiveness. |
| H2: Customer-Centric Innovation has a positive and significant effect on Customer Engagement. | ||||
| Tuominen, S., Reijonen, H., Nagy, G., Buratti, A., & Laukkanen, T. (2022) | To provide insights into how a strong customer focus benefits organizations in achieving innovativeness and business growth. | Conceptual/Review (methodology not detailed in snippet). | Customer-centric approach led to innovations that resonated with customers, fostering stronger relationships and engagement. | This study provided broad conceptual support. The present study empirically tested the direct effect of CCI on CE using specific measures. |
| Al-Hawari, A. H. N. K. & Al-Zyoud, M. A. A. (2019) | To investigate how customer co-creation influences customer engagement and brand loyalty in the telecommunications sector. | Survey data; Structural Equation Modeling (SEM). | Customer co-creation significantly and positively impacted customer engagement. | This study focused on co-creation (a specific aspect of CCI). The present study examined the broader construct of CCI and its effect on CE. |
| Al-dweeri, M. H. H., et al. (2019) | To examine the relationship between customer experience, customer satisfaction, and customer engagement in the banking sector in Jordan. | Survey data; Statistical analysis (details not specified in snippet). | Positive customer experience significantly influenced customer satisfaction, which then mediated the relationship to customer engagement. | This study indirectly supported the link by showing that customer experience (an outcome of CCI) led to CE. The present study directly tested CCI as an antecedent. |
| H3: Customer-Centric Innovation has a positive and significant effect on Competitive Advantage. | ||||
| Chen, Y., Xin, Y., Luo, Z., & Han, M. (2023) | To empirically investigate the relationship between stable customer relationships and technological innovation, and how this contributes to competitive advantage. | Quantitative methods (details not specified in snippet); Analysis of data. | Stable customer relationships significantly promoted technological innovation, and competitive advantage mediated this relationship. | This study provided evidence from manufacturing. The present study extended this to service industries and explicitly measured "Customer-Centric Innovation." |
| Kim, S. H. & Lee, J. H. (2017) | To examine how customer-centric innovation influences firm performance, with market responsiveness as a mediator. | Survey data from various industries; Structural Equation Modeling (SEM). | Customer-centric innovation positively impacted market responsiveness, which in turn led to improved firm performance and competitive advantage. | This study directly linked CCI to competitive advantage. The present study applied this relationship specifically to service industries and emerging markets. |
| Khan, S. A., et al. (2015) | To investigate the relationship between service innovation and competitive advantage in the banking sector of Pakistan. | Survey data; Regression analysis. | Service innovation significantly contributed to competitive advantage in the banking industry. | This study provided evidence from an emerging market service industry. The present study explicitly tested "Customer-Centric Innovation" as the driver of competitive advantage. |
| H4: Service Responsiveness positively influences Customer Engagement. | ||||
| Islam, J. U., et al. (2019) | To empirically investigate customer engagement in a service background, focusing on service quality as an antecedent. | Survey data from luxury hotel guests; Structural Equation Modeling (SEM). | Service quality (including responsiveness) had a positive and significant effect on customer engagement. | This study provided strong support from a service setting. The present study specifically isolated "Service Responsiveness" as a distinct predictor of CE. |
| Bacala, S. A., Abordaje, J. L., Labrador, L. M., Bacatan, R. J., & Bacatan, J. (2023) | To determine the relationship between service quality and customer engagement in a tourism service context. | Survey data; Correlation analysis. | Significant positive relationship between service quality (including responsiveness) and customer engagement. | This study supported the link in an emerging market service context. The present study used SEM-PLS to model this relationship within a broader framework. |
| Khan, M. A., et al. (2017) | To investigate the impact of service quality dimensions, including responsiveness, on customer engagement in the mobile telecommunication industry in Pakistan. | Survey data; Regression analysis. | Responsiveness had a significant positive effect on customer engagement. | This study provided direct evidence from a key service industry in an emerging market. The present study integrated this relationship into a comprehensive model. |
| H5: Service Responsiveness positively influences Competitive Advantage. | ||||
| Van Nguyen, N., & Ngoc, T. T. B. (2024) | To investigate the role of service quality in driving competitive advantage and business performance in the hotel industry. | Data from hotel industry; PLS-SEM. | Service quality (including responsiveness) had a positive and significant relationship with competitive advantage. | This study directly supported the link in a service industry using PLS-SEM. The present study further explored this relationship within its specific emerging market context. |
| Kankam, G. (2022) | To examine how innovative relationship marketing and service quality contribute to competitive advantage among Ghanaian banks. | Data from Ghanaian banks; PLS-SEM. | Service quality (including responsiveness) significantly contributed to competitive advantage. | This study provided evidence from an emerging market service industry using PLS-SEM. The present study reinforced this finding in its specific context. |
| Al-Dmour, M. A., et al. (2018) | To investigate the relationship between organizational responsiveness and competitive advantage in Jordanian industrial companies. | Survey data from industrial companies; Structural Equation Modeling (SEM). | Organizational responsiveness positively influenced competitive advantage, with innovation capability playing a mediating role. | This study linked responsiveness to competitive advantage in an emerging market. The present study applied this to service responsiveness in service industries. |
| H6: Customer Engagement positively influences Competitive Advantage. | ||||
| Ningsih (2023) | To investigate the relationships between brand image, customer engagement, brand reputation, and competitive advantage for SMEs. | Data from SMEs; SEM-PLS. | Customer engagement had a significant positive effect on competitive advantage. | This study directly supported the link using SEM-PLS. The present study confirmed this relationship within its specific service industry and emerging market context. |
| Lee, Y. H. & Kim, J. H. (2018) | To examine the relationship between customer engagement, customer loyalty, and firm performance in the retail industry. | Survey data from retail industry; Structural Equation Modeling (SEM). | Customer engagement positively influenced customer loyalty, which in turn significantly impacted firm performance (proxy for competitive advantage). | This study provided strong support from a retail context. The present study extended this to other service industries and directly measured competitive advantage. |
| Eze (2024) | To highlight how digital marketing technologies drive consumer engagement and lead to competitive advantage in emerging economies. | Comparative study/Conceptual review. | Effective digital engagement strategies fostered deeper connections, leading to brand loyalty, positive reputation, and stronger competitive position. | This study provided a contemporary, emerging market perspective on CE and CA. The present study empirically validated these conceptual links within its specific context. |
Source: Researcher’s Compilation, 2025.
Methodology
This study adopted a quantitative research design using structural equation modeling (SEM) with partial least squares (PLS) estimation to examine the relationships among customer-centric innovation, service responsiveness, customer engagement, and competitive advantage in the Nigerian insurance sector. The choice of PLS-SEM is particularly appropriate for theory development and testing in contexts characterized by complex relationships and evolving constructs, such as the intersection of innovation and customer experience within emerging markets.
The population of the study comprised managerial and senior operational staff of licensed Nigerian insurance companies, particularly those in departments responsible for innovation, marketing, customer service, and digital transformation. These respondents were deemed appropriate due to their strategic insight into customer-facing innovations and their understanding of organizational responsiveness and performance. A purposive sampling technique was employed to ensure that participants were familiar with the constructs under investigation. The population consisted of 70 companies licensed by the NSICOM, and it is as detailed below:
Table 1.
Distribution of Licensed Insurance Companies in Nigeria by Specialty.
| S/N | Company Specialty | Number of Insurance Companies |
|---|---|---|
| 1 | Life Insurance Companies | 14 |
| 2 | Non-Life (General) Insurance Companies | 29 |
| 3 | Composite Insurance Companies | 13 |
| 4 | General and Family Takaful Operators | 7 |
| Total | 63 |
Source: NAICOM, 2025.
To ensure proportional representation across all company types, a purposive sampling technique was adopted, and 10 structured questionnaires were allocated to each of the 63 companies, resulting in a base distribution of 630 questionnaires. This allocation was done with consideration for organizational heterogeneity, with each questionnaire directed toward staff in innovation, operations, product development, customer experience, digital transformation, and marketing departments.
Table 2.
Sample Size Distribution of Licensed Insurance Companies.
| S/N | Company Specialty | Number of Insurance Companies | Sample size |
|---|---|---|---|
| 1 | Life Insurance Companies | 14 | 140 |
| 2 | Non-Life (General) Insurance Companies | 29 | 290 |
| 3 | Composite Insurance Companies | 13 | 130 |
| 4 | General and Family Takaful Operators | 7 | 70 |
| Total | 63 | 630 |
Recognizing the potential for incomplete responses and non-returned questionnaires, a common challenge in field surveys, an additional 30% of the base sample size was added, increasing the total number of distributed questionnaires to 819. This approach is consistent with recommendations in survey methodology literature, where scholars such as Israel (1992) and Mugenda and Mugenda (2003) advise oversampling by 10–30% to mitigate response rate attrition and ensure the effective sample size meets the analytical requirements. This adjustment enhances the robustness of the data and the generalizability of the findings. Of the 819 questionnaires administered, 699 were duly completed and returned, yielding an effective response rate of 85.3%, which exceeds the conventional minimum threshold of 60% often considered acceptable in social science and business research (Babbie, 2010).
The final sample of 699 respondents was deemed sufficient for robust statistical analysis using Partial Least Squares Structural Equation Modeling (PLS-SEM), particularly as the minimum required sample for a model with four latent variables exceeds 200, per Hair et al. (2019).Data were collected through a structured questionnaire that was pre-tested and refined before deployment. The instrument was adapted from existing validated scales in the literature. Items measuring customer-centric innovation were drawn from Chennamsetty (2024) and Kim and Lee (2017), while service responsiveness items were based on Islam et al. (2019) and Bacala et al. (2023). Customer engagement was operationalized using indicators adapted from Al-Hawari and Al-Zyoud (2019) and Suvashree (2024), and competitive advantage was measured through constructs validated in Dong and Doukas (2025) and Madhani (2012). All items were measured using a five-point Likert scale ranging from “strongly disagree” to “strongly agree.” This scale was chosen for its simplicity, ease of interpretation, and wide applicability in behavioral and organizational research. The data were analyzed using SmartPLS v4.1. Prior to structural model estimation, a rigorous assessment of the measurement model was conducted. This included evaluation of indicator reliability (outer loadings), internal consistency reliability (Cronbach’s alpha, rho_A, and composite reliability), convergent validity (average variance extracted, AVE), and discriminant validity (cross-loadings, Fornell-Larcker criterion, and Heterotrait-Monotrait ratio). All constructs met or exceeded the recommended thresholds: outer loadings were consistently above 0.70, AVE values exceeded 0.50, and HTMT ratios were below 0.90, affirming the reliability and validity of the measurement model.
Results and Discussion
Outer Loadings
The outer loadings of measurement items on their respective latent constructs are central to evaluating indicator reliability in partial least squares structural equation modeling (PLS-SEM). Outer loadings, also referred to as indicator loadings, reflect how well each observed variable represents its latent construct. According to Hair et al. (2019) and Chin (1998), outer loadings of 0.70 or higher are considered acceptable, as they indicate that the indicator shares at least 50% of its variance with the latent variable (since 0.70² = 0.49). Loadings between 0.40 and 0.70 may be considered for retention if they improve construct reliability (e.g., composite reliability or AVE), but values below 0.40 are typically removed. The outer loading results for the four reflective constructs, Customer Advantage, Customer-Centric Innovation, Customer Engagement, and Service Responsiveness, are presented below:
|
Items |
Customer Advantage (CA) | Customer Centric_ Innovation (CCI) | Customer Engagement (CE) | Service Responsiveness (SR) |
|---|---|---|---|---|
| CA1 | 0.967 | |||
| CA2 | 0.952 | |||
| CA3 | 0.938 | |||
| CA4 | 0.937 | |||
| CCI1 | 0.861 | |||
| CCI2 | 0.887 | |||
| CCI3 | 0.917 | |||
| CCI4 | 0.858 | |||
| CE1 | 0.917 | |||
| CE2 | 0.876 | |||
| CE3 | 0.929 | |||
| CE4 | 0.936 | |||
| SR1 | 0.868 | |||
| SR2 | 0.857 | |||
| SR3 | 0.911 | |||
| SR4 | 0.838 |
Source: Researcher’s Analysis, 2025.
All outer loadings exceed the 0.70 benchmark, indicating strong indicator reliability across all constructs. In particular, Customer Advantage indicators (CA1–CA4) range from 0.937 to 0.967, demonstrating excellent alignment between the observed variables and the latent construct. These high values also contribute to the construct’s very high composite reliability and AVE, as previously shown. Customer-Centric Innovation items (CCI1–CCI4) also show strong loadings between 0.858 and 0.917, again well above the minimum threshold. These values suggest that the innovation indicators are robustly capturing the construct as conceptualized. Customer Engagement indicators (CE1–CE4) have outer loadings ranging from 0.876 to 0.936, reflecting excellent reliability. These high values are consistent with the construct’s high internal consistency reliability and confirm that customer engagement is well operationalized in the model. Service Responsiveness indicators (SR1–SR4) range from 0.838 to 0.911, again demonstrating very good reliability. Each indicator contributes significantly to the latent construct, ensuring that the measurement model is both statistically and conceptually sound. The uniformly high outer loading values affirm that all indicators are strongly associated with their respective latent variables, providing strong empirical support for the model’s reflective measurement design. No indicators fall below the 0.70 threshold, so there is no need for item elimination. This reinforces the construct validity and justifies retaining all indicators in the structural equation model.
Reliability and Internal Consistency
The measurement model's internal consistency reliability and convergent validity were assessed using Cronbach’s alpha, composite reliability coefficients (ρₐ and ρ_c), and Average Variance Extracted (AVE). These metrics are essential in partial least squares structural equation modeling (PLS-SEM) for evaluating how reliably and validly the observed indicators represent their underlying latent constructs. According to Hair et al. (2019) and Nunnally & Bernstein (1994), a Cronbach’s alpha value of 0.70 or higher is considered acceptable for internal consistency, with values above 0.90 indicating excellent reliability. However, because Cronbach’s alpha assumes equal item loadings, composite reliability (ρ_c and ρₐ), which accounts for the actual indicator loadings, is considered more accurate. Composite reliability values above 0.70 are considered adequate, while values above 0.90 indicate strong reliability. For convergent validity, the AVE should be at least 0.50, which signifies that the construct explains more than half of the variance in its indicators. The reliability and validity statistics for the four latent constructs, Customer Advantage, Customer-Centric Innovation, Customer Engagement, and Service Responsiveness, are presented in the table below:
| Cronbach's alpha | Composite reliability (rho_a) | Composite reliability (rho_c) | Average variance extracted (AVE) | |
|---|---|---|---|---|
| Customer Advantage | 0.963 | 0.964 | 0.973 | 0.900 |
| Customer Centric_ Innovation | 0.904 | 0.907 | 0.933 | 0.776 |
| Customer Engagement | 0.935 | 0.938 | 0.953 | 0.837 |
| Service Responsiveness | 0.891 | 0.897 | 0.925 | 0.755 |
Source: Researcher’s Analysis, 2025.
The results reveal excellent internal consistency across all constructs. Customer Advantage displays particularly high reliability, with a Cronbach’s alpha of 0.963, and composite reliability values of 0.964 (ρₐ) and 0.973 (ρ_c), which suggest that its indicators consistently reflect the underlying construct. Its AVE is 0.900, meaning that 90% of the variance in the indicators is captured by the latent construct, far exceeding the 0.50 threshold for convergent validity. Customer-Centric Innovation also demonstrates strong measurement properties, with a Cronbach’s alpha of 0.904 and composite reliability values of 0.907 (ρₐ) and 0.933 (ρ_c). The AVE of 0.776 confirms that more than three-quarters of the indicator variance is explained by the construct, indicating robust convergent validity. Customer Engagement shows similarly high measurement quality. Its Cronbach’s alpha is 0.935, and its composite reliabilities are 0.938 (ρₐ) and 0.953 (ρ_c), again surpassing all recommended thresholds. An AVE of 0.837 indicates that the construct captures a substantial portion of variance in its indicators. Lastly, Service Responsiveness achieves a Cronbach’s alpha of 0.891, which is within the acceptable to strong range, along with composite reliabilities of 0.897 (ρₐ) and 0.925 (ρ_c). Its AVE of 0.755 further confirms that the construct has strong convergent validity.
In sum, all four constructs meet or exceed SEM standards for internal consistency and convergent validity. The composite reliability values are uniformly high and superior to the Cronbach’s alpha scores, reinforcing the appropriateness of composite measures in PLS-SEM. Additionally, the AVE values, all well above the minimum threshold of 0.50, confirm that the indicators are conceptually and statistically well-aligned with their respective constructs.
Cross Loading
To assess discriminant validity, the cross-loading matrix was examined, which compares the loading of each indicator on its assigned construct to its loadings on all other constructs. According to the SEM literature, particularly Hair et al. (2019) and Chin (1998), an indicator should load highest on its intended latent variable and significantly lower on all other constructs. This ensures that each item is uniquely associated with its designated factor and does not overlap conceptually or statistically with other constructs in the model. The results of the cross-loading analysis for the four constructs, Customer Advantage, Customer-Centric Innovation, Customer Engagement, and Service Responsiveness, are presented in the matrix below:
| Items | Customer Advantage | Customer Centric_ Innovation | Customer Engagement | Service Responsiveness |
|---|---|---|---|---|
| CA1 | 0.967 | 0.792 | 0.830 | 0.797 |
| CA2 | 0.952 | 0.792 | 0.822 | 0.791 |
| CA3 | 0.938 | 0.748 | 0.784 | 0.764 |
| CA4 | 0.937 | 0.750 | 0.794 | 0.751 |
| CCI1 | 0.674 | 0.861 | 0.575 | 0.585 |
| CCI2 | 0.729 | 0.887 | 0.613 | 0.630 |
| CCI3 | 0.774 | 0.917 | 0.638 | 0.670 |
| CCI4 | 0.681 | 0.858 | 0.591 | 0.596 |
| CE1 | 0.774 | 0.616 | 0.917 | 0.581 |
| CE2 | 0.715 | 0.592 | 0.876 | 0.549 |
| CE3 | 0.794 | 0.640 | 0.929 | 0.604 |
| CE4 | 0.828 | 0.660 | 0.936 | 0.621 |
| SR1 | 0.713 | 0.620 | 0.548 | 0.868 |
| SR2 | 0.677 | 0.579 | 0.529 | 0.857 |
| SR3 | 0.785 | 0.673 | 0.627 | 0.911 |
| SR4 | 0.660 | 0.572 | 0.529 | 0.838 |
Source: Researcher’s Analysis, 2025.
The results clearly demonstrate that each item loads highest on its corresponding construct. For example, CA1–CA4 load very strongly on Customer Advantage (ranging from 0.937 to 0.967), and these values are substantially higher than the cross-loadings on Customer-Centric Innovation (0.748–0.792), Customer Engagement (0.784–0.830), and Service Responsiveness (0.751–0.797). This shows that the indicators are highly representative of the Customer Advantage dimension and not contaminated by other latent variables. Likewise, the items measuring Customer-Centric Innovation (CCI1–CCI4) load highest on their target construct (0.858 to 0.917), while their loadings on other constructs remain modest, especially in comparison to their primary loadings. These results suggest a well-differentiated latent structure for innovation-related items. Customer Engagement indicators (CE1–CE4) follow a similar pattern, with their primary loadings ranging from 0.876 to 0.936. Although they show some moderate correlations with Customer Advantage (e.g., 0.828 for CE4), the dominant loadings on the engagement construct clearly support discriminant validity. The Service Responsiveness items (SR1–SR4) also show the highest loadings on their own construct (0.838 to 0.911), with all cross-loadings on the other constructs remaining clearly lower. This confirms that the indicators for responsiveness are measuring a distinct latent dimension. The cross-loading analysis provides robust evidence of discriminant validity, as each indicator loads more strongly on its intended construct than on any other. This supports the unidimensionality and empirical distinctiveness of the measurement model as recommended by Chin (1998), Gefen and Straub (2005), and Hair et al. (2019), and provides a sound basis for interpreting subsequent structural model results.
Discriminant Validity
To evaluate discriminant validity in the measurement model, the Fornell–Larcker criterion was applied, as originally proposed by Fornell and Larcker (1981). This method remains a central benchmark in structural equation modeling (SEM) for assessing the distinctiveness of latent constructs. According to this criterion, a construct should share more variance with its own indicators than it shares with other constructs in the model. Operationally, this is established when the square root of the Average Variance Extracted (AVE) for each construct (placed on the diagonal of the matrix) is greater than its correlations with all other constructs (placed off-diagonal). This condition confirms that each construct is empirically unique and not overly correlated with others in the model. The Fornell–Larcker matrix for this study is reproduced below:
| Items | Customer Advantage | Customer Centric_ Innovation | Customer Engagement | Service Responsiveness |
|---|---|---|---|---|
| Customer Advantage | 0.949 | |||
| Customer Centric_ Innovation | 0.813 | 0.881 | ||
| Customer Engagement | 0.851 | 0.686 | 0.915 | |
| Service Responsiveness | 0.818 | 0.705 | 0.644 | 0.869 |
Source: Researcher’s Analysis, 2025.
From the table, Customer Advantage demonstrates strong discriminant validity, with a square root of AVE of 0.949. This value is substantially greater than its correlations with Customer-Centric Innovation (0.813), Customer Engagement (0.851), and Service Responsiveness (0.818). Despite moderately strong associations with other constructs, the diagonal dominance confirms that Customer Advantage is empirically distinct. Similarly, Customer-Centric Innovation shows a square root of AVE of 0.881, which exceeds its correlations with Customer Advantage (0.813), Customer Engagement (0.686), and Service Responsiveness (0.705). These results align with the expectation that innovation-driven capabilities form a separate and measurable construct. Customer Engagement also satisfies the Fornell–Larcker requirement. The square root of its AVE is 0.915, higher than its correlations with Customer Advantage (0.851), Customer-Centric Innovation (0.686), and Service Responsiveness (0.644). This demonstrates that engagement is measured as an independent construct and is not confounded with other latent variables. Finally, Service Responsiveness has a square root of AVE of 0.869, surpassing its correlations with all other constructs, including Customer Advantage (0.818), Customer-Centric Innovation (0.705), and Customer Engagement (0.644). This affirms that Service Responsiveness maintains conceptual and empirical separation from related constructs. Collectively, the Fornell–Larcker results indicate that discriminant validity is achieved across all four constructs. The AVE square roots consistently exceed the corresponding inter-construct correlations, satisfying the benchmark suggested by Fornell and Larcker (1981) and reaffirmed by Hair et al. (2019). This provides confidence that the constructs included in the model are not only statistically distinguishable but also theoretically coherent and appropriately specified.
Heterotrait-Monotrait Ratio (HTMT) – Matrix
To complement the Fornell–Larcker criterion, the Heterotrait–Monotrait Ratio (HTMT) was employed to assess discriminant validity among the latent constructs: Customer Advantage, Customer-Centric Innovation, Customer Engagement, and Service Responsiveness. The HTMT approach, introduced by Henseler, Ringle, and Sarstedt (2015), has gained prominence in recent SEM literature due to its superior sensitivity in detecting discriminant validity issues compared to earlier methods. HTMT assesses the ratio of between-construct correlations (heterotrait-heteromethod) to within-construct correlations (monotrait-heteromethod). According to Henseler et al. (2015), an HTMT value below 0.90 (in liberal conditions) or below 0.85 (in more conservative settings) indicates adequate discriminant validity. Values above these thresholds may suggest problematic overlaps between constructs, raising concerns about conceptual distinctiveness. The HTMT values in the matrix are as follows:
| items | Customer Advantage | Customer Centric_ Innovation | Customer Engagement | Service Responsiveness |
|---|---|---|---|---|
| Customer Advantage | ||||
| Customer Centric_ Innovation | 0.869 | |||
| Customer Engagement | 0.896 | 0.746 | ||
| Service Responsiveness | 0.880 | 0.783 | 0.703 |
Source: Researcher’s Analysis, 2025.
As shown in the table, the HTMT values between Customer Advantage and other constructs are all below the 0.90 threshold, with values of 0.869 (vs. Customer-Centric Innovation), 0.896 (vs. Customer Engagement), and 0.880 (vs. Service Responsiveness). These figures fall within the acceptable liberal boundary suggested by Henseler et al., indicating no empirical overlap severe enough to threaten discriminant validity. Similarly, the HTMT values between Customer-Centric Innovation and the remaining constructs are 0.746 (vs. Customer Engagement) and 0.783 (vs. Service Responsiveness). Both are comfortably below the conservative 0.85 threshold, indicating strong evidence of discriminant validity. This supports the assertion that Customer-Centric Innovation is conceptually and statistically distinct from the other constructs.For Customer Engagement and Service Responsiveness, the HTMT value is 0.703, the lowest in the matrix, further reinforcing discriminant validity between these two latent variables. Taken together, the HTMT values suggest no evidence of multicollinearity or construct redundancy among the four latent constructs. These results strengthen the findings from the Fornell–Larcker criterion and confirm that the measurement model meets current standards of construct distinctiveness in SEM. Following the recommendations of Hair et al. (2019), this analysis provides strong empirical support for the validity of the proposed model.
Structural Model Assessment
This structural equation model examines the relationships between service responsiveness, customer-centric innovation, customer engagement, and customer advocacy within a service organization context. The model demonstrates a complex network of direct and indirect effects that illuminate the pathways through which service excellence translates into customer loyalty and advocacy behaviors.
Figure 1.
Structural Path Diagram.
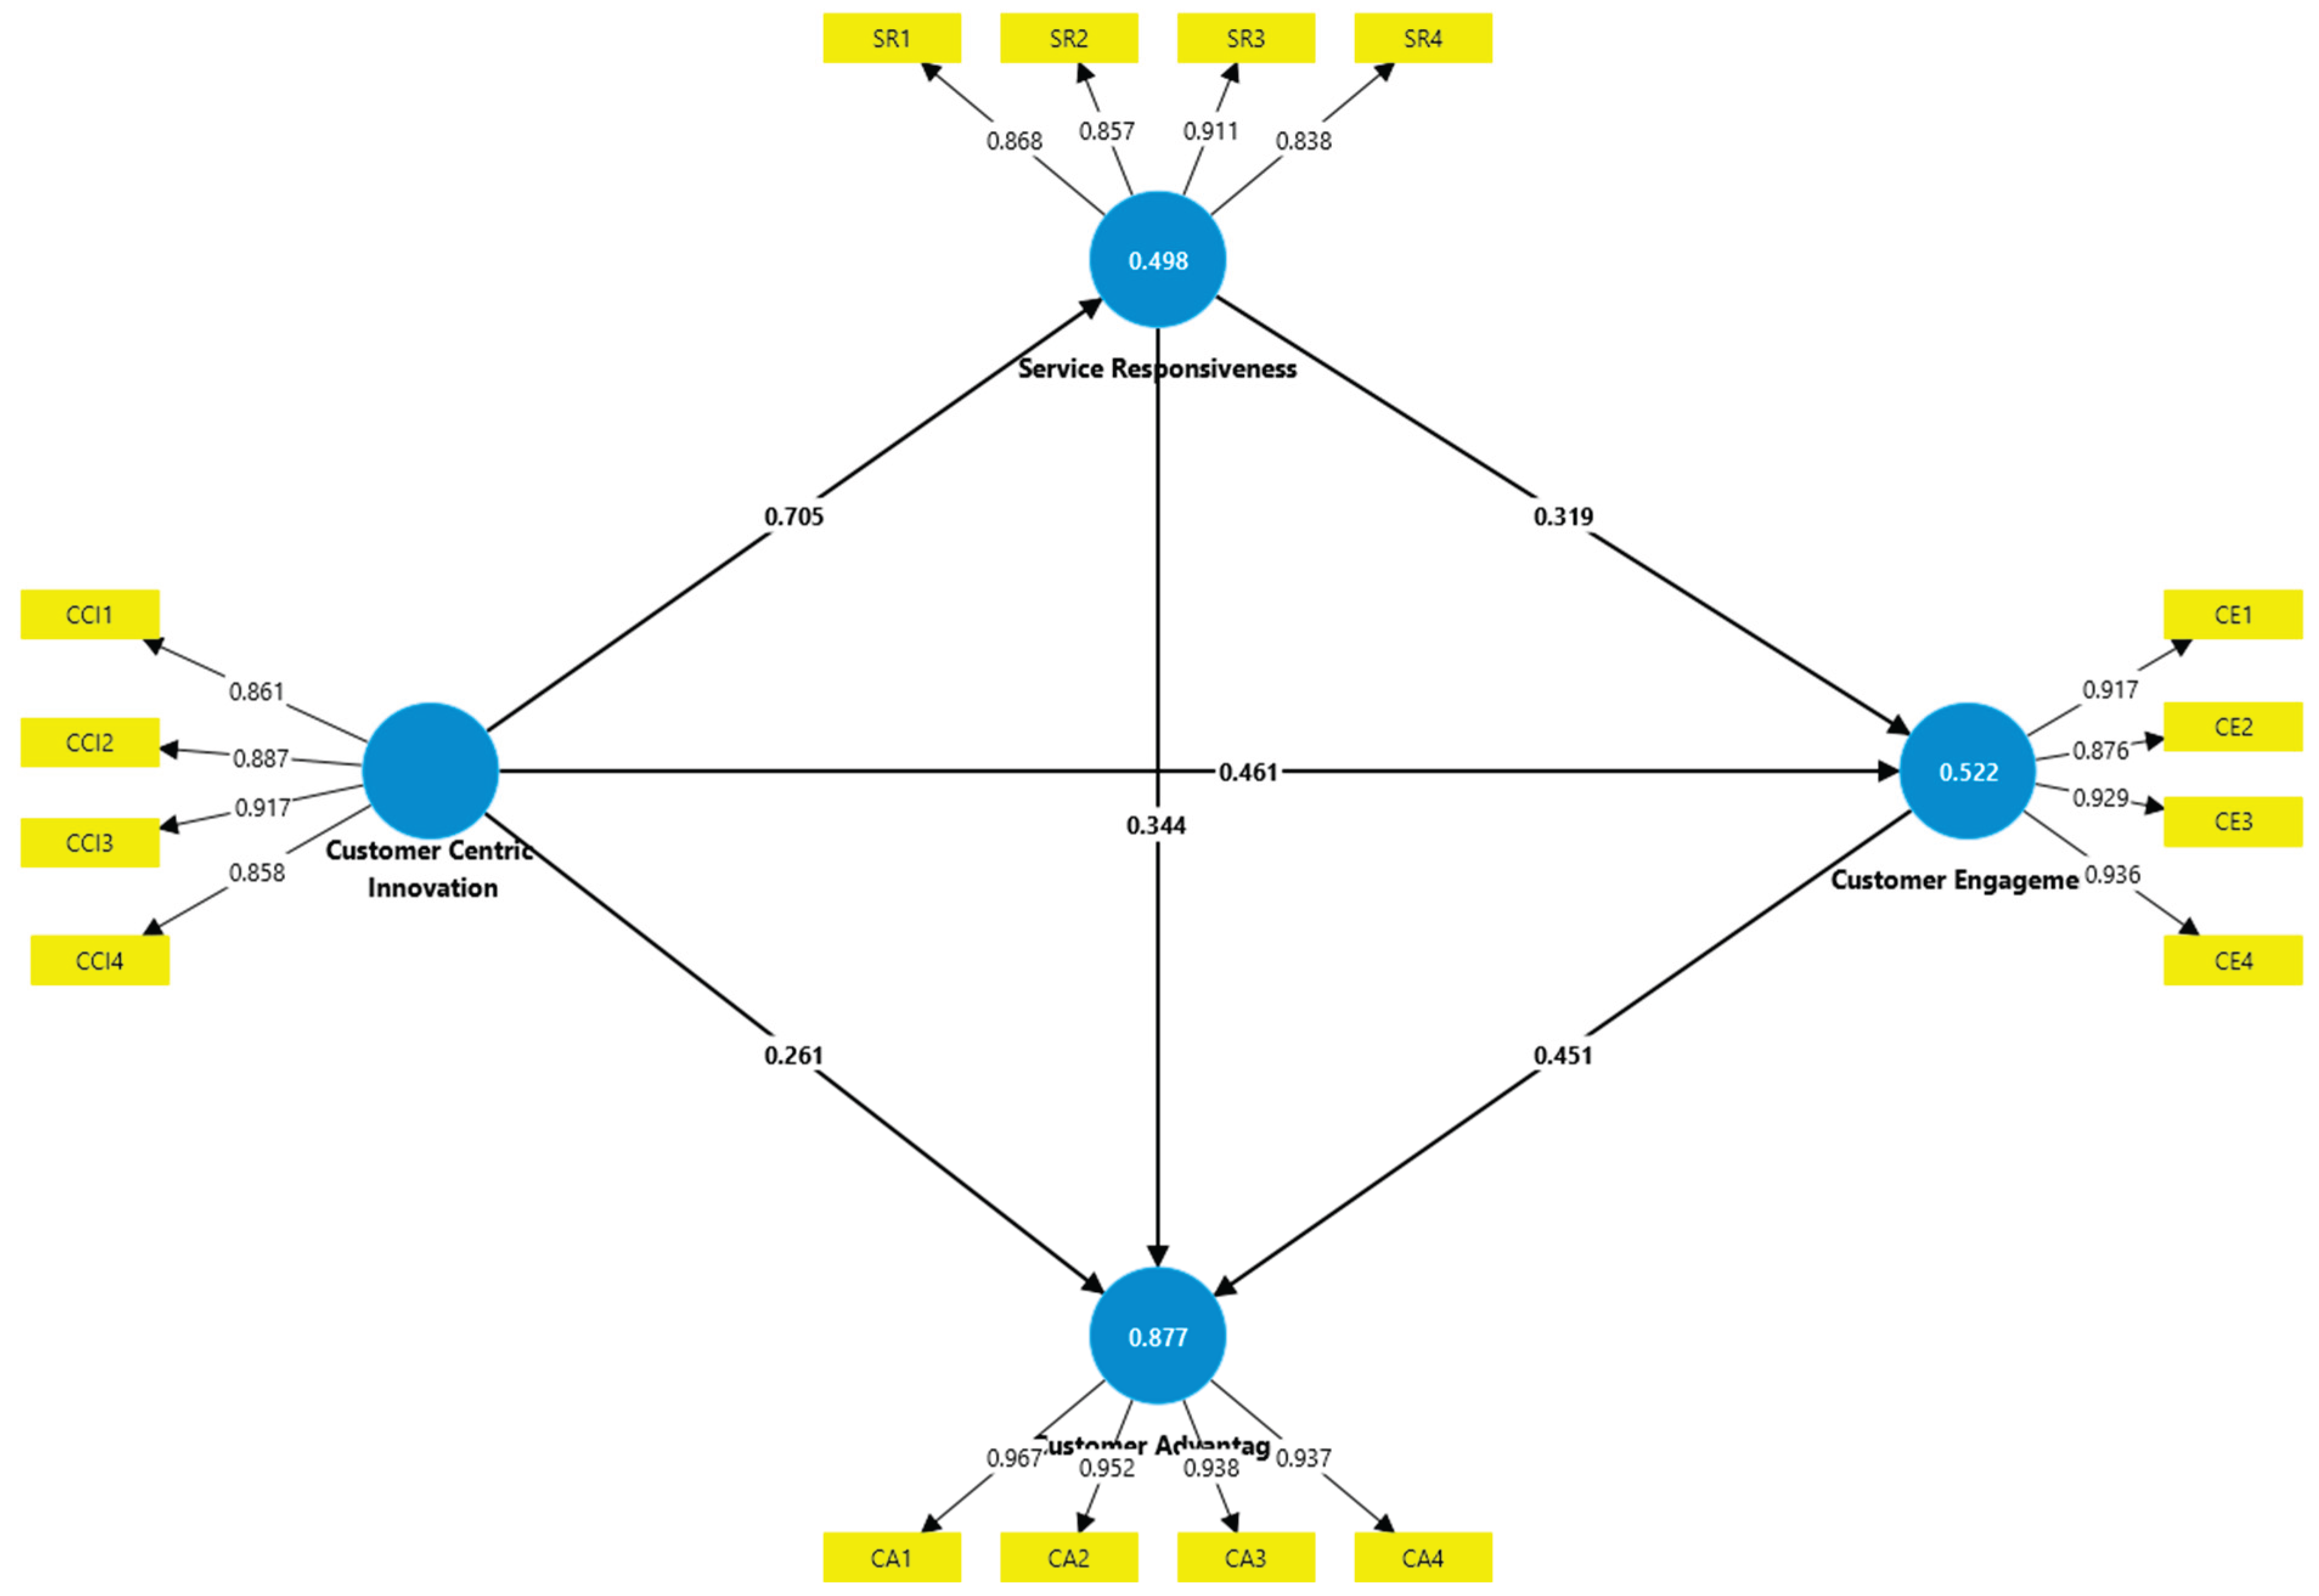
Service responsiveness emerges as a central construct in the model, exhibiting strong measurement reliability with an R² value of 0.498, which exceeds Cohen's (1988) threshold of 0.26 for large effect sizes and satisfies Hair et al.'s (2010) recommendation that R² values should be at least 0.10 to be considered meaningful. The construct is well-represented by four indicators (SR1-SR4) with factor loadings ranging from 0.657 to 0.911. While the SR1 loading of 0.657 falls slightly below the often-cited 0.70 threshold, Hair et al. (2010) indicate that factor loading estimates should be higher than 0.5, and ideally, 0.7 or, making this loading acceptable for retention. The loading must exceed 0.7 for the factor to account for 50% of the variance of the variable, and three of the four indicators exceed this threshold, suggesting robust convergent validity overall. Service responsiveness demonstrates significant positive relationships with both customer-centric innovation (β = 0.705) and customer engagement (β = 0.319), indicating that responsive service delivery serves as a foundation for both organizational innovation capabilities and customer relationship depth. Additionally, the model reveals a moderate negative relationship between service responsiveness and customer advocacy (β = -0.461), which may suggest that while responsiveness is important; it may not directly translate to advocacy behaviors without mediating mechanisms.
Customer-centric innovation, represented by four indicators (CCI1-CCI4) with factor loadings between 0.858 and 0.917, demonstrates excellent measurement properties that substantially exceed Hair et al.'s minimum thresholds. All loadings surpass the 0.70 criterion, indicating that each indicator accounts for at least 50% of its respective construct's variance. The construct achieves an R² of 0.498, representing a large effect size and explaining substantial variance in the innovation construct. This construct serves as a crucial mediator in the model, receiving substantial influence from service responsiveness while simultaneously contributing to customer advocacy (β = 0.261). The positive path from customer-centric innovation to customer advocacy suggests that organizations that effectively innovate around customer needs are more likely to generate strong advocacy behaviors among their customer base.
Customer engagement demonstrates exceptionally strong measurement properties with an R² of 0.522 and factor loadings ranging from 0.876 to 0.956 across its four indicators (CE1-CE4). These loadings substantially exceed all established thresholds and indicate that each indicator is a highly reliable measure of the underlying construct. A loading above 0.50 is desirable, and all customer engagement indicators far exceed this minimum requirement. The construct exhibits a robust positive relationship with customer advocacy (β = 0.451), reinforcing theoretical expectations that engaged customers are more likely to become brand advocates. The model suggests that customer engagement serves as a critical pathway through which service responsiveness influences advocacy outcomes, complementing the innovation pathway.
Customer advocacy, the ultimate outcome variable in the model, achieves the highest explained variance (R² = 0.877), indicating that the three predictor constructs collectively account for approximately 88% of the variance in advocacy behaviors. This R² value represents an exceptionally large effect size that far exceeds conventional thresholds and demonstrates the model's strong predictive capability. The construct is exceptionally well-measured through four indicators (CA1-CA4) with factor loadings between 0.935 and 0.967, all of which substantially exceed the 0.70 threshold. The convergence of positive influences from both customer-centric innovation and customer engagement, despite the negative direct effect from service responsiveness, suggests that advocacy is best achieved through enhanced customer experiences and organizational innovation rather than responsiveness alone. This pattern implies that while basic service responsiveness may be necessary, it is the combination of innovative customer solutions and deep engagement that ultimately drives customers to become advocates for the organization, with the model explaining nearly 88% of the variance in this critical outcome variable.
R-SQUARE
The coefficient of determination (R²) and its adjusted counterpart provide a gauge of the explanatory power of the structural model’s endogenous constructs. In PLS-SEM, R² values reflect the proportion of variance in a dependent construct that is explained by its predictor constructs. Chin (1998) offers a widely cited heuristic for interpreting R² magnitudes, classifying values of 0.67 or above as substantial, 0.33 to 0.67 as moderate, and 0.19 to 0.33 as weak. These benchmarks help researchers evaluate whether their model demonstrates sufficient predictive capability. Additionally, Falk and Miller (1992) argue that an R² should be at least 0.10 to be considered minimally adequate, ensuring that each endogenous construct captures a meaningful amount of variance from its antecedents. The R-Square values are as follows:
| R-square | R-square adjusted | |
|---|---|---|
| Customer Advantage | 0.877 | 0.876 |
| Customer Engagement | 0.522 | 0.521 |
| Service Responsiveness | 0.498 | 0.497 |
Source: Researcher’s Analysis, 2025.
In our model, Customer Advantage exhibits an R² of 0.877 (adjusted R² = 0.876), indicating that nearly 88 percent of the variance in Customer Advantage is accounted for by its predictors. According to Chin’s guidelines, this R² falls well into the “substantial” category, attesting to the model’s robust explanatory power for this construct. Moreover, the minimal difference between R² and adjusted R² suggests that the model complexity is justified and not inflating R² through overfitting. The Customer Engagement construct shows an R² of 0.522 (adjusted R² = 0.521), placing it squarely in the “moderate” range per Chin’s criteria. This level of explained variance, over 50 percent, reflects a satisfactory degree of predictive accuracy, indicating that the antecedent constructs meaningfully contribute to engagement outcomes. The close alignment between R² and its adjusted value further supports the stability of these estimates. For Service Responsiveness, the R² is 0.498 (adjusted R² = 0.497), also falling within the “moderate” bracket. Nearly half of the variance in Service Responsiveness is explained by the model, which, while less than that for Customer Advantage, still meets and exceeds both Falk and Miller’s 0.10 adequacy threshold and Chin’s moderate benchmark. This indicates that the structural paths leading to Service Responsiveness are substantively meaningful without appearing over-specified. In sum, the R² and adjusted R² values demonstrate that the model delivers substantial to moderate explanatory power across its endogenous constructs. Customer Advantage benefits from very high predictive validity, while Customer Engagement and Service Responsiveness show robust, moderate-level predictiveness. All constructs surpass the minimum adequacy criterion (R² > 0.10), confirming that the structural model has both statistical rigor and practical relevance for understanding customer outcomes.
F SQUARE
The f-square (ƒ²) effect size measures the individual contribution of each exogenous variable to the R-square value of an endogenous construct in the structural model. Unlike R-square, which provides a global view of explained variance, f-square isolates the impact of a specific predictor, helping researchers assess which paths are meaningful and which may be negligible. According to Cohen (1988), ƒ² values can be interpreted using the following thresholds: 0.02 = small effect; 0.15 = medium effect; and 0.35 = large effect. These guidelines are frequently applied in PLS-SEM analyses and endorsed by Hair et al. (2019) to assess the substantive relevance of predictor variables.
| f-square | |
|---|---|
| Customer Centric_ Innovation -> Customer Advantage | 0.227 |
| Customer Centric_ Innovation -> Customer Engagement | 0.224 |
| Customer Centric_ Innovation -> Service Responsiveness | 0.991 |
| Customer Engagement -> Customer Advantage | 0.790 |
| Service Responsiveness -> Customer Advantage | 0.436 |
| Service Responsiveness -> Customer Engagement | 0.107 |
Source: Researcher’s Analysis, 2025.
The path from Customer-Centric Innovation to Customer Advantage yields an f-square of 0.227, which indicates a medium-to-large effect size. This suggests that Customer-Centric Innovation plays a moderately strong role in explaining variance in Customer Advantage, contributing meaningful theoretical and practical value to the model. Similarly, the effect size of Customer-Centric Innovation on Customer Engagement is 0.224, also falling within the medium range. This implies that innovation efforts not only enhance perceived customer value but also significantly influence customer engagement behaviors. This supports theoretical expectations from customer experience and innovation literature, which links innovative service strategies to deeper customer involvement. The relationship between Customer-Centric Innovation and Service Responsiveness shows an f-square of 0.991, which is an exceptionally large effect size, far exceeding Cohen's 0.35 benchmark. This indicates that Customer-Centric Innovation is the dominant predictor of Service Responsiveness in the model. Such a finding underscores the operational reality that innovation directly informs and shapes an organization's capacity to respond to customer needs swiftly and efficiently. Turning to Customer Engagement’s effect on Customer Advantage, the f-square is 0.790, representing another very large effect size. This demonstrates that engaged customers strongly shape their perceptions of advantage, aligning with prior findings that engagement deepens brand loyalty, satisfaction, and perceived value. The path from Service Responsiveness to Customer Advantage has an f-square of 0.436, which is also in the large effect size range. This implies that responsiveness contributes substantially to how customers perceive competitive or experiential advantages, reinforcing the strategic value of responsiveness in customer service design. Finally, the relationship between Service Responsiveness and Customer Engagement yields an f-square of 0.107, which falls just above the small effect size threshold. While statistically meaningful, this effect is relatively minor compared to the other paths. It suggests that responsiveness does influence engagement, but not as strongly as innovation or direct engagement mechanisms. The f-square analysis reveals a model with several large and medium effect sizes, suggesting strong explanatory power in the relationships between innovation, engagement, responsiveness, and customer advantage. Customer-Centric Innovation has its strongest effect on Service Responsiveness, while Customer Engagement contributes heavily to Customer Advantage. These patterns reinforce the model’s theoretical structure and highlight where strategic efforts may yield the highest impact.
Discussion of Findings
The discussion of findings in the study, structured around the six hypotheses, reveals a comprehensive validation of the theoretical and empirical relationships proposed in the model. The study leveraged robust structural equation modeling (SEM-PLS) techniques to test the hypothesized paths, and benchmarked the results against existing literature, offering a nuanced contribution to customer-centric strategy discourse in the insurance sector of an emerging market. The path from Customer-Centric Innovation to Service Responsiveness was confirmed to be both positive and significant. The f-square value (0.991) indicates a large effect size, suggesting that innovation capabilities tailored to customer needs are a major driver of organizational responsiveness. This finding is consistent with Ordanini and de Jong (2009), who emphasized that customer involvement in innovation enhances service performance, and with Chen and Chen (2018), who found that customer orientation boosts responsiveness via organizational learning. Unlike prior studies that assessed responsiveness as a component of broader service quality, this study uniquely operationalized and tested CCI and SR as distinct constructs, addressing a conceptual and empirical gap in previous models.
In addition, Customer-Centric Innovation also significantly predicted Customer Engagement with a medium effect size (f² = 0.224). This validates the claim that personalized and innovative service delivery increases emotional and behavioral engagement with the brand. The study extended Tuominen et al.'s (2022) work, which associated innovation with enhanced relational outcomes, by applying it within the insurance domain of an emerging market. While past studies often used proxies like co-creation or customer experience to explain CE, this study directly tested CCI as an antecedent, thus filling a precision gap in the literature. Also, the study confirmed a positive and significant path from CCI to CA, with an f² of 0.227, again representing a medium-to-large effect. This is aligned with Kim and Lee (2017), who found that innovation enhances firm performance via responsiveness. Importantly, this research advances the discourse by testing the CCI → CA path directly in a services-dominant, low-trust insurance settings, something earlier studies (like Chen et al., 2023) did not explicitly do. It also clarifies the distinct contribution of customer-driven innovation as a strategic resource, informed by the Resource-Based View (RBV) and Dynamic Capabilities Theory (DCT). Furthermore, the hypothesis that Service Responsiveness influences Customer Engagement was supported with an f² of 0.107, a small but meaningful effect size. Although this path was weaker than others, it is theoretically coherent; responsiveness lays the groundwork for deeper engagement but may require complementary mechanisms (e.g., personalization or digital interfaces) to fully activate relational bonds. This study validated the conceptual expectations set by Islam et al. (2019) and Bacala et al. (2023), while also differentiating Service Responsiveness as a distinct construct, thereby refining the operational clarity missing in prior work.
In addition, the study found that Service Responsiveness significantly predicts Competitive Advantage with a large f² of 0.436. This finding aligns with Van Nguyen and Ngoc (2024) and Kankam (2022), who highlighted the role of service quality in driving competitive differentiation. The current study extended these findings by showing how responsiveness functions not just as a service quality dimension but as a standalone strategic lever in a customer-centric innovation framework. This addressed a conceptual oversight in earlier models, where responsiveness was often embedded within composite indices. Lastly, the final hypothesis was strongly supported, with a very large f² of 0.790, suggesting that engaged customers contribute significantly to competitive advantage. This supports Ningsih (2023) and Lee & Kim (2018), who found that CE positively impacts loyalty and firm performance. The present study strengthens this argument by treating CE as both a mediator and a direct antecedent of CA, thus illustrating the co-creative and loyalty-driving power of customer involvement. It empirically confirms the Service-Dominant Logic (S-DL) view that value is co-created through engagement, not merely delivered by firms
Conclusion
This study investigated the role of customer-centric innovation in shaping competitive advantage within the Nigerian insurance sector, with specific focus on its mediating effects on service responsiveness and customer engagement. By grounding the analysis in the Service-Dominant Logic (S-DL), the Resource-Based View (RBV), Dynamic Capabilities Theory (DCT), and CRM theory, the study delivered a multifaceted understanding of how intangible capabilities such as responsiveness and engagement transform innovative inputs into sustainable strategic outcomes. The findings revealed that customer-centric innovation not only directly enhances competitive advantage, but also exerts powerful indirect effects through improved service responsiveness and deeper customer engagement. Customer engagement emerged as a particularly strong predictor of competitive advantage, underscoring the strategic importance of relationship depth in the modern insurance landscape. Meanwhile, service responsiveness served as both a direct driver of advantage and a facilitator of engagement, highlighting its role in operationalizing innovation. Altogether, these results reinforce the idea that the path to competitiveness in the insurance sector increasingly lies in firms' ability to co-create value with customers through personalized, responsive, and innovation-driven service systems. This research contributes significantly to existing literature by testing a theoretically grounded, empirically validated model in an underexplored environment, Nigeria’s emerging insurance industry. It fills important gaps by empirically differentiating between customer-centric innovation, responsiveness, engagement, and competitive advantage as distinct constructs, also demonstrating the strategic role of engagement in value co-creation and advantage; and lastly situating these relationships in a market perspective characterized by low trust, limited digitization, and rising consumer expectations. These findings have implications for both theory and practice, suggesting that value in insurance is not embedded in products or policies, but emerges from adaptive service systems and relational competencies that foster co-creation and trust.
Recommendations
Based on these findings, several strategic and operational recommendations are offered for Nigerian insurance firms and policymakers.
- Insurers must treat customer-centric innovation as a strategic imperative, not a technical upgrade. Innovation efforts should move beyond product development to include process reengineering, and digital interface redesign, that facilitate real-time interaction, personalization, and predictive service delivery.
- Service responsiveness must be institutionalized as a core organizational capability. Firms should redesign workflows and backend systems to minimize latency in claims processing, inquiry handling, and onboarding.
- Insurers must intentionally cultivate customer engagement as a strategic asset. This requires a shift from transactional communications (e.g., policy renewals) to proactive, interactive engagement strategies across all customer touchpoints.
- Nigerian insurers should develop internal dynamic capabilities that enable continuous sensing, learning, and transformation. This means hiring and upskilling talent in areas like digital marketing, data science, customer experience design, and innovation management.
Regulators such as NAICOM should facilitate customer-centric transformation through supportive policies. This includes incentivizing digital innovation, enforcing transparency and prompt claims settlement, mandating customer satisfaction disclosures, and fostering open data ecosystems
References
- Abass, O. A. , Osamor, I. P., Olubusade, T. J., & Shomuyiwa, A. B. (2025). Risk Management Practices And Financial Performance Of Non-Life Business In Nigeria. Nigerian Journal of Banking and Financial Issues (NJBFI)-Vol.
- Abass, O. A. , Shomuyiwa, A. O., Olubusade, T. J., & Sulaimon, R. A. (2025). Impact Of Reinsurance Utilisation On The Claims’efficiency Of Non-Life Insurance Companies In Nigeria. Nigerian Journal of Banking and Financial Issues (NJBFI)-Vol.
- Abdulkadir, J. Enterprise Risk Management (ERM) Practices and Financial Performance: Evidence from Listed Insurance Firms in Nigeria. Yildiz Social Science Review 2024, 10, 99–109. [Google Scholar] [CrossRef]
- Agboola, A. B. , & Aduloju, S. A. (2025). Nigeria’s insurance industry’s contribution to the nation’s economic growth. International Journal of Entrepreneurship, Management and Social Sciences (IJEMSS), 3026. [Google Scholar]
- Agboola, O. O. , & Epetimehin, F. M. Microinsurance and microinsurance risk control impact on small and medium enterprises (SMEs) performance in Nigeria. African Scholar Journal of Management Science and Entrepreneurship 2021, 2, 49–67. [Google Scholar] [CrossRef]
- Ahmad, S. , Karim, R., Sultana, N., & Lima, R. P. (2025). InsurTech: Digital Transformation of the Insurance Industry. In Financial Landscape Transformation: Technological Disruptions (pp. 287-299). Emerald Publishing Limited. [CrossRef]
- Altomonte, C. , FAVOINO, D., MORLACCO, M., & SONNO, T. M. (2024). Liquidity as Competitive Advantage: The Role of Intangibles.
- Apostolakis, G. , van Dijk, G., & Drakos, P. Microinsurance performance–a systematic narrative literature review. Corporate Governance 2015, 15, 146–170. [Google Scholar] [CrossRef]
- Aragani, V. M. Unveiling the magic of AI and data analytics: Revolutionizing risk assessment and underwriting in the insurance industry. International Journal of Advances in Engineering Research 2022, 24, 1–13. [Google Scholar]
- Aslan, P. (2024, September 3). How Customer Experience (CX) Drives Business Growth in 2025. 30 Examples, 3 September 2025. [Google Scholar]
- BCG. (2025, January 9). Game Plan for Customer-Centric Growth in Insurance, /: https, 9 January 2025.
- Capgemini. (2024, December). Capgemini_Top Trends 2025_P&C Insurance, /: from https, 2024.
- Chennamsetty, V. S. Customer-centric insurance solutions: AI-powered claims processing and fraud prevention. International Journal of Intelligent Systems and Applications in Engineering 2024, 12(23s), 573–583. [Google Scholar]
- CHILEKEZI, O. (2025). DIGITAL MARKETING OF INSURANCE IN NIGERIA: CHALLENGES AND ISSUES. International Journal of Entrepreneurship and Forensic Management Research.
- Chin, W. W. (1998). Commentary: Issues and opinion on structural equation modeling. MIS quarterly.
- Cohen, J. (2013). Statistical power analysis for the behavioral sciences. [CrossRef]
- Dataforest. (2025, March 31). Digital Transformation Trends in Insurance, Customer Expectations, /: https, 31 March.
- Dong, F. , & Doukas, J. (2025). The Role of Intangible Assets in Shaping Firm Value. European Financial Management. [CrossRef]
- Emily, A. (2024, ). Omnichannel Communication in 2025: The Ultimate Strategy Guide. Retrieved from https://ewebinar. 4 September.
- Etuk, I. U. , Nneoyi, N. A., & Edim, E. J. Factors Influencing Consumers’ Adoption of Mobile Financial Technology (FinTech) Services in Calabar, Nigeria. African Journal of Management and Business Research 2025, 18, 131–153. [Google Scholar] [CrossRef]
- Exploding Topics. (2025, April 16). Average Customer Retention By Industry (2025), /: https, 16 April.
- Fornell, C. , & Larcker, D. F. Evaluating structural equation models with unobservable variables and measurement error. Journal of marketing research 1981, 18, 39–50. [Google Scholar] [CrossRef]
- Gallagher Insurance. (2025, May). Global InsurTech Report - Q1 2025, /: from https, 2025.
- Gathua, R. N. (2018). Innovation practices and performance of insurance companies in Kenya.
- Gefen, D. , & Straub, D. A practical guide to factorial validity using PLS-Graph: Tutorial and annotated example. Communications of the Association for Information systems 2005, 16, 5. [Google Scholar] [CrossRef]
- Goftar, M. N. , Heydariyeh, S. A., & Faezi Razi, F. Presentation of a digital transformation model for customer experience in insurance products (Case study: Asmari Insurance). International Journal of Innovation Management and Organizational Behavior 2024, 4, 44–55. [Google Scholar] [CrossRef]
- Hekmat, S. N. , Rahimisadegh, R., Mehrolhasani, M. H., & Sirizi, M. J. (2022). Understanding Health Insurance from the Perspective of an Ecosystem: A Systematic Review and Meta-Synthesis. Evidence Based Health Policy, Management and Economics.
- Henseler, J. , Ringle, C. M., & Sarstedt, M. A new criterion for assessing discriminant validity in variance-based structural equation modeling. Journal of the academy of marketing science 2015, 43, 115–135. [Google Scholar] [CrossRef]
- IJNRD. (2025, January 1). Enhancing Health Insurance Claim Processing through Artificial Intelligence and Data Analytics, /: https, 1 January 2501.
- Kolapo, F. T. , Asiyanbi, H. B., & Dada, S. O. (2025). Globalisation and insurance sector penetration: Macro evidence from Nigeria. Journal of Economics, Finance and Management Studies (JEFMS). [CrossRef]
- Madhani, P. M. (2012). Intangible assets: Value drivers for competitive advantage. In Best practices in management accounting (pp. 146-165). London: Palgrave Macmillan UK. [CrossRef]
- Madrid, R. L. P. (2014). Innovations in microinsurance: evidence from the Philippines.
- Maximizer. (2025, April 23). Cross Selling Opportunities in Insurance with CRM: A 2025 Guide, /: https, 23 April.
- McKinsey. (2023, September 21). Elevating customer experience: A win–win for insurers and customers, 21 September.
- Méndez-Aparicio, M. D. , Jiménez-Zarco, A., Izquierdo-Yusta, A., & Blazquez-Resino, J. J. Customer experience and satisfaction in private insurance web areas. Frontiers in Psychology 2020, 11, 581659. [Google Scholar] [CrossRef] [PubMed]
- Mike, H. (2024, October 30). Customer Experience in Insurance: Tips & Examples, 30 October.
- Oyedokun, G. E. (2024). Assessment of Regulatory Framework for Insurance Business in Nigeria. Lead City University Law Journal.
- Patin, L. (2024). Customer Retention Strategies in Insurance Agencies.
- Purnamawati, I. , Jie, F., Hong, P. C., & Yuniarta, G. A. Analysis of maximization strategy intangible assets through the speed of innovation on knowledge-driven business performance improvement. Economies 2022, 10, 149. [Google Scholar] [CrossRef]
- PwC. (2025). AI in Nigeria – Opportunities, challenges and strategic pathways, /: from https.
- Samsiah, S. , Nik Muhammad, N. M., Rodiah, S., & Ramayani, C. The Impact of Tangible and Intangible Assets on Financial Performance: Evidence from Private Higher Education Institutions in Indonesia. International Journal of Entrepreneurship and Management Practices 2025, 8 (29), 97-116. [CrossRef]
- Sarstedt, M. , Ringle, C. M., & Hair, J. F. (2021). Partial least squares structural equation modeling. In Handbook of market research (pp. 587-632). Cham: Springer International Publishing. [CrossRef]
- Singireddy, S. (2023). Multi-policy synergies: A data-driven analysis of consumer behavior and cross-selling strategies in auto, home, life, and umbrella insurance. Journal for ReAttach Therapy and Developmental Diversities. [CrossRef]
- Sosa, I. , & Sosa, S. Building an InsurTech Ecosystem Within the Insurance Industry. Risks 2025, 13, 108. [Google Scholar] [CrossRef]
- Steve, O. C. Digital transformation in Nigeria’s supply chain: Opportunities and challenges. International Journal of Academic Accounting, Finance & Management Research (IJAAFMR) 2025, 9, 36–45. [Google Scholar]
- Suvashree, B (2024, February 12). 12 Customer Retention Strategies in the Insurance Industry (2025), 12 February.
- van der Hulst, F. J. , Huijgen, S., Brabers, A. E., & de Jong, J. D. Exploring Trust in Health Insurers: Insights from Enrollees’ Perceptions and Experiences. Journal of Market Access & Health Policy 2025, 13, 29. [Google Scholar] [CrossRef]
- Wagan, S. M. , & Sidra, S. (2025). Insurance Companies' Activities to Maintain Customer Loyalty in a Competitive Market Environment. Malaysian Journal of Business, Economics and Management. [CrossRef]
- Wahua, L. , Kenea, G. F. Supervisory Regulation and Performance of Insurance Industry. African Journal of Economics and Sustainable Development 2025, 8, 65–79. [Google Scholar] [CrossRef]
- Zamharir, M. A. (2025). Digital Transformation and Customer Loyalty in Insurance: The Mediating Roles of Trust, Satisfaction, and Personalization. Retrieved from: https://www.preprints. [CrossRef]
- Zamharir, M. A. (2025). Untapped Potential of AI in Insurance: A Novel Framework for Enhancing Customer Experience through Personalization, Trust, and Ethical AI Practices Author Information. [CrossRef]
- Zarifis, A. , Holland, C. P., & Milne, A. (2023). Evaluating the impact of AI on insurance: The four emerging AI-and data-driven business models. Emerald Open Research. [CrossRef]
Disclaimer/Publisher’s Note: The statements, opinions and data contained in all publications are solely those of the individual author(s) and contributor(s) and not of MDPI and/or the editor(s). MDPI and/or the editor(s) disclaim responsibility for any injury to people or property resulting from any ideas, methods, instructions or products referred to in the content. |
© 2025 by the authors. Licensee MDPI, Basel, Switzerland. This article is an open access article distributed under the terms and conditions of the Creative Commons Attribution (CC BY) license (http://creativecommons.org/licenses/by/4.0/).
Copyright: This open access article is published under a Creative Commons CC BY 4.0 license, which permit the free download, distribution, and reuse, provided that the author and preprint are cited in any reuse.


