
Submitted:
22 June 2025
Posted:
24 June 2025
You are already at the latest version
Abstract
n the rapidly evolving telecommunications landscape, customer satisfaction is a key driver of organizational competitiveness, loyalty, and market sustainability. Yet, traditional analytical approaches often fail to account for the complex, interdependent factors shaping user behavior. This study adopts a systems thinking approach, operationalized through Causal Loop Diagrams (CLDs), to explore the dynamic relationships underpinning customer loyalty in the telecom sector. Drawing on survey data from 1,140 participants across Africa, Europe, and North America, the research identifies and models key variables, including service quality, perceived value, customer confidence, price sensitivity, and market competition. The resulting CLD reveals six reinforcing and two balancing feedback loops that capture the nonlinear mechanisms influencing consumer satisfaction and brand commitment. These insights offer both theoretical and practical contributions: enriching the literature on customer experience with a systems perspective and equipping telecom providers and policymakers with actionable strategies to foster loyalty, inclusivity, and market resilience.
Keywords:
telecommunications
; customer satisfaction
; systems thinking
; causal loop diagrams
; loyalty dynamics
; market competition
; word of mouth
; IoT
; 5G and beyond
; predictive analytics
Keywords telecommunications; customer satisfaction; systems thinking; causal loop diagrams; loyalty dynamics; market competition; word of mouth; IoT; 5G and beyond; predictive analytics
1. Introduction
In the digital economy, the telecommunications industry plays a pivotal role in shaping connectivity, innovation, and social inclusion. As mobile and broadband services become increasingly commoditized, customer satisfaction emerges as a critical differentiator, directly influencing loyalty, market share, and long-term profitability. While numerous studies have examined consumer satisfaction in telecoms, these often rely on static, linear models that treat key variables such as service quality, pricing, and perceived value in isolation. This fragmented perspective fails to capture the inherently dynamic and systemic nature of customer experience. (Bankole & Bankole, 2017; Kumar, Verma & Mirza, 2024).
This study addresses that gap by applying a systems thinking approach to model telecom customer satisfaction and loyalty. Specifically, it employs Causal Loop Diagrams (CLDs) to visualize and analyze the feedback structures among crucial factors including service quality, customer confidence, market competition, and word of mouth. Unlike traditional methods, systems thinking allows for an integrated view of how these variables interact over time to reinforce or balance behavioral patterns in the consumer base (Sterman, 2002; Rebs, Brandenburg, & Seuring, 2019; Felicetti, Linzalone, Filippelli, & Bigliardi, 2024).
Drawing on survey data from over a thousand respondents across the globe, this research identifies six reinforcing loops and two balancing loops that shape customer engagement in telecom services. By making these feedback structures explicit, the study contributes a novel diagnostic lens for telecom strategists, regulators, and researchers alike, one that highlights leverage points for sustainable growth and inclusive service delivery.
2. Literature Review
Customer satisfaction has long been recognized as a critical determinant of success in the telecommunications sector, where offerings are often intangible and the market is characterized by high competition and low switching costs (Calvo-Porral & Lévy-Mangin, 2015; Gerpott, Rams, & Schindler, 2001; Hajar et al., 2022). Scholars have consistently highlighted the strong correlation between satisfaction and behavioral outcomes such as customer loyalty, reduced churn, and positive word-of-mouth, underscoring its importance in both academic research and industry practice. However, traditional evaluative tools frequently fall short in capturing the nuanced and evolving nature of customer experiences (Anderson, 1998; Bhattacharyya & Dash, 2021; Marcos & Coelho, 2022).
Among the tools developed to assess customer satisfaction, the Service Quality (SERVQUAL) framework by Parasuraman, Zeithaml, and Berry has been widely adopted to evaluate service delivery by comparing customer expectations with actual experiences across five dimensions: reliability, assurance, tangibles, empathy, and responsiveness. This model offers diagnostic clarity by identifying specific service gaps that influence satisfaction. It has been particularly valuable in telecommunications, where service delivery emphasizes interaction quality, reliability, and support rather than tangible goods (Zeithaml & Parasuraman, 2004; Mauri, Saravanan, & Rao, 2007; Minazzi & Muccio, 2013).
Complementing SERVQUAL’s detailed diagnostic capabilities, the Net Promoter Score (NPS) provides a broader indicator of customer loyalty and advocacy by asking customers how likely they are to recommend the service. The resulting score—based on promoters, passives, and detractors—serves as a proxy for long-term brand perception (Owen & Brooks, 2008; Freed, 2013; Shukla, Gupta, & Agarwal, 2024). While NPS lacks SERVQUAL’s multi-dimensional depth, its simplicity and predictive power make it highly effective for tracking emotional engagement and customer retention trends over time (Baehre, O'Dwyer, O'Malley, & Story, 2022; Dawes, 2024).
Together, these frameworks provide a layered perspective: SERVQUAL offers insights into the operational aspects of service delivery, while NPS reflects outcomes related to customer loyalty. However, both models remain fundamentally linear and are limited in their ability to capture the systemic interdependencies and feedback loops that characterize real-world customer behavior. In contrast, systems thinking introduces a dynamic, non-linear lens that enables researchers to visualize how variables such as service quality, customer expectations, word of mouth, and market competition interact over time (Hogreve, Iseke, & Derfuss, 2022; Maani, 2016; Sabharwal, 2025).
Despite the increasing complexity of global telecom markets and the abundance of consumer data, few studies have applied systems thinking to loyalty modeling in this domain (Lottu, Ezeigweneme, Olorunsogo, & Adegbola, 2024; Pagani & Fine, 2008; Wang & Jones, 2013). Existing applications of systems thinking in sectors such as energy, tourism, and healthcare highlight its potential for mapping multi-factorial feedback structures and guiding strategic interventions (Peres, Muller, & Mahajan, 2010; Qiu, 2009; Wang & Jones, 2013).
This study addresses this research gap by integrating the diagnostic precision of traditional frameworks with the systemic clarity provided by causal loop diagrams, offering a novel approach to understanding, predicting, and shaping customer loyalty in telecommunications.
2.1. Systems Thinking in Customer Experience Research
Systems thinking offers a holistic alternative to linear models by emphasizing interdependencies, feedback loops, and time delays. This approach has been applied in diverse fields such as energy policy, tourism, and organizational change, yet its use in telecommunications customer satisfaction research remains limited (Baumann, Elliott, & Burton, 2012). Arnold and Wade (2015) define systems thinking as a synergistic set of analytical skills that enhance the ability to understand and influence complex systems. In the context of telecom services, this lens can illuminate how variables like pricing, competition, and perceived value interact dynamically to shape customer loyalty.
2.2. Causal Loop Diagrams (CLDs) as Analytical Tools
Despite the growing complexity of telecom markets and the availability of extensive customer data, limited research has integrated systems thinking into loyalty modeling. This oversight leaves a critical gap in understanding how feedback dynamics shape consumer behavior over time (Lottu, Ezeigweneme, Olorunsogo, & Adegbola, 2024; Pagani & Fine, 2008; Wang & Jones, 2013). Existing evidence from other domains—such as energy, tourism, and healthcare—demonstrates that systems thinking can provide valuable insights by mapping multi-factorial feedback structures and identifying strategic leverage points (Peres, Muller, & Mahajan, 2010; Qiu, 2009).
This study responds to that need by constructing a Causal Loop Diagram (CLD) informed by empirical survey data. By making the feedback structure of telecom customer satisfaction explicit, the research offers a novel framework for analyzing, understanding, and influencing customer loyalty. This integrated approach represents both a methodological contribution and a practical tool for providers and policymakers seeking to foster sustained engagement in a rapidly evolving service environment.
3. Research Design
This study employs a cross-sectional survey design to explore the dynamic relationships that shape customer satisfaction and loyalty within telecommunications. The systems approach justifies the use of a methodology capable of identifying patterns and connections rather than isolating variable effects (Jones, 2014; Markus, Majchrzak, & Gasser, 2002). This approach is particularly well-suited for examining complex service ecosystems like telecoms, where customer decisions are shaped by social, economic, and experiential interactions (Goldspink, 2002; Jones, 2014).
3.1. Data Collection
Data were collected through an online survey distributed across Africa, Europe, and North America, yielding 1,140 valid responses. The survey instrument included structured items addressing demographic attributes (e.g., age, region, gender, employment), telecom usage patterns, satisfaction levels, perceived service quality, pricing perceptions, and loyalty indicators such as brand affinity and switching behavior. Both categorical and Likert-scale responses were included to support the identification of patterns necessary for systems mapping.
3.2. Data Transformation
A multi-step transformation process was implemented to translate survey responses into causal structures suitable for systems modeling. The first step involved identifying key variables relevant to telecom customer loyalty, such as perceived value, customer satisfaction, service suitability, market competition, confidence, and word of mouth. Subsequent frequency and correlation analyses helped establish plausible directional relationships among these variables. These insights were then synthesized into dynamic feedback structures, forming the foundation of the Causal Loop Diagram (CLD).
4. Conceptual Framework
To operationalize the systems thinking approach outlined in the literature, this study developed a Causal Loop Diagram (CLD) grounded in empirical survey data. The research model comprises three interlinked stages: data collection, data transformation, and systems modeling. The use of quantitative categorical responses rendered the dataset particularly well-suited for qualitative systems modeling (Luna-Reyes & Andersen, 2003).
The transformation process followed a systematic, multi-step procedure. First, core variables relevant to telecom loyalty dynamics were identified, including customer satisfaction, loyalty, willingness to pay, perceived value, occupation level, market share, competition, confidence, influence, and service usage. Frequency analysis was then conducted to uncover potential causal connections, revealing directional relationships such as:
- Willingness to pay → Price sensitivity
- Service quality → Customer satisfaction → Perceived value → Loyalty
- Confidence and dignity → Influence of others → Switching likelihood
- Competition → Switching likelihood → Customer loyalty (See Figure 1)
These identified relationships formed the foundation for mapping a dynamic causal structure, ultimately leading to the construction of the CLD.
These findings informed a preliminary causal map that laid the foundation for the Causal Loop Diagram (CLD). In the final phase, each identified variable was assigned to a node, and directional arrows marked with positive or negative polarity were used to depict causal relationships. Feedback loops were then analyzed in light of survey data and industry trends, enabling the identification of six reinforcing and two balancing loops. Scenario-based simulations were also conducted to explore how the system behaves under varying assumptions, offering insights with potential policy and strategic implications (Azen & Walker, 2021; Forbus, 2011).
By transforming a diverse dataset into a visually structured systems model, this research bridges empirical insights with dynamic analysis offering a robust lens through which telecom customer satisfaction and loyalty can be interpreted.
Building on established service quality frameworks (e.g., SERVQUAL and NPS) and recognizing their limitations in capturing the dynamic nature of customer behavior, this study advances a systems-based research model for exploring the drivers of customer loyalty in the telecommunications sector. The model integrates constructs identified in the literature—such as service quality, perceived value, customer satisfaction, loyalty, word of mouth, market competition, and price sensitivity—into a unified causal structure.
Central to this framework is the premise that customer loyalty is not a linear outcome but an emergent property of interacting feedback loops. Reinforcing mechanisms (e.g., satisfaction leading to advocacy and increased market share) and balancing forces (e.g., competition and pricing pressure) coexist within a dynamic system that evolves over time. The model is operationalized through the CLD, which visualizes these interdependencies and identifies leverage points for strategic intervention (Hijazin, Tamayo-Torres, & Nusairat, 2023).
This conceptual framework serves as the methodological backbone of the study, informing the selection of variables, the design of the survey instrument, and the structure of the systems map. By adopting this dynamic perspective, the research moves beyond static measurement to provide a systems-oriented understanding of customer loyalty in telecommunications.
4.1. CLD Development
The Causal Loop Diagram (CLD) was developed using an iterative modeling process. Variables were represented as nodes, with directional arrows illustrating influences and polarity signs (+/–) indicating the nature of each relationship. Based on these configurations, six reinforcing loops (R1–R6) and two balancing loops (B1–B2) were mapped, each capturing a distinct behavioral or market-based dynamic. The model was validated through feedback loop testing and scenario-based simulations, which assessed how small changes in key variables could generate system-wide effects (see Figure 1).
This framework can be summarized as follows:
- Traditional Models → SERVQUAL (Service Quality Dimensions) → NPS (Customer Loyalty Indicator)
- Identified Constructs → Service Quality, Perceived Value, Customer Satisfaction, Loyalty, Word of Mouth, Price Sensitivity, Market Competition
- Systems Thinking Lens → Dynamic Interactions → Feedback Loops (R1–R6, B1–B2) → Emergent Behavior
- Causal Loop Diagram (CLD) → Visual Mapping of Interdependencies → Identification of Leverage Points
5. Methodology
This study adopts a qualitative systems thinking approach to examine the dynamic and nonlinear relationships that shape customer satisfaction and loyalty in the telecommunications sector (Octabriyantiningtyas & Suryani, 2019). Unlike traditional static models, systems thinking offers a holistic framework that captures feedback loops, time delays, and interdependencies among the key variables influencing customer behavior (Koskela, 2002). The primary analytical tool employed in this research is the Causal Loop Diagram (CLD), which visualizes these complex relationships and helps identify strategic leverage points within the system (see Figure 1).
6. Data Analysis and Results
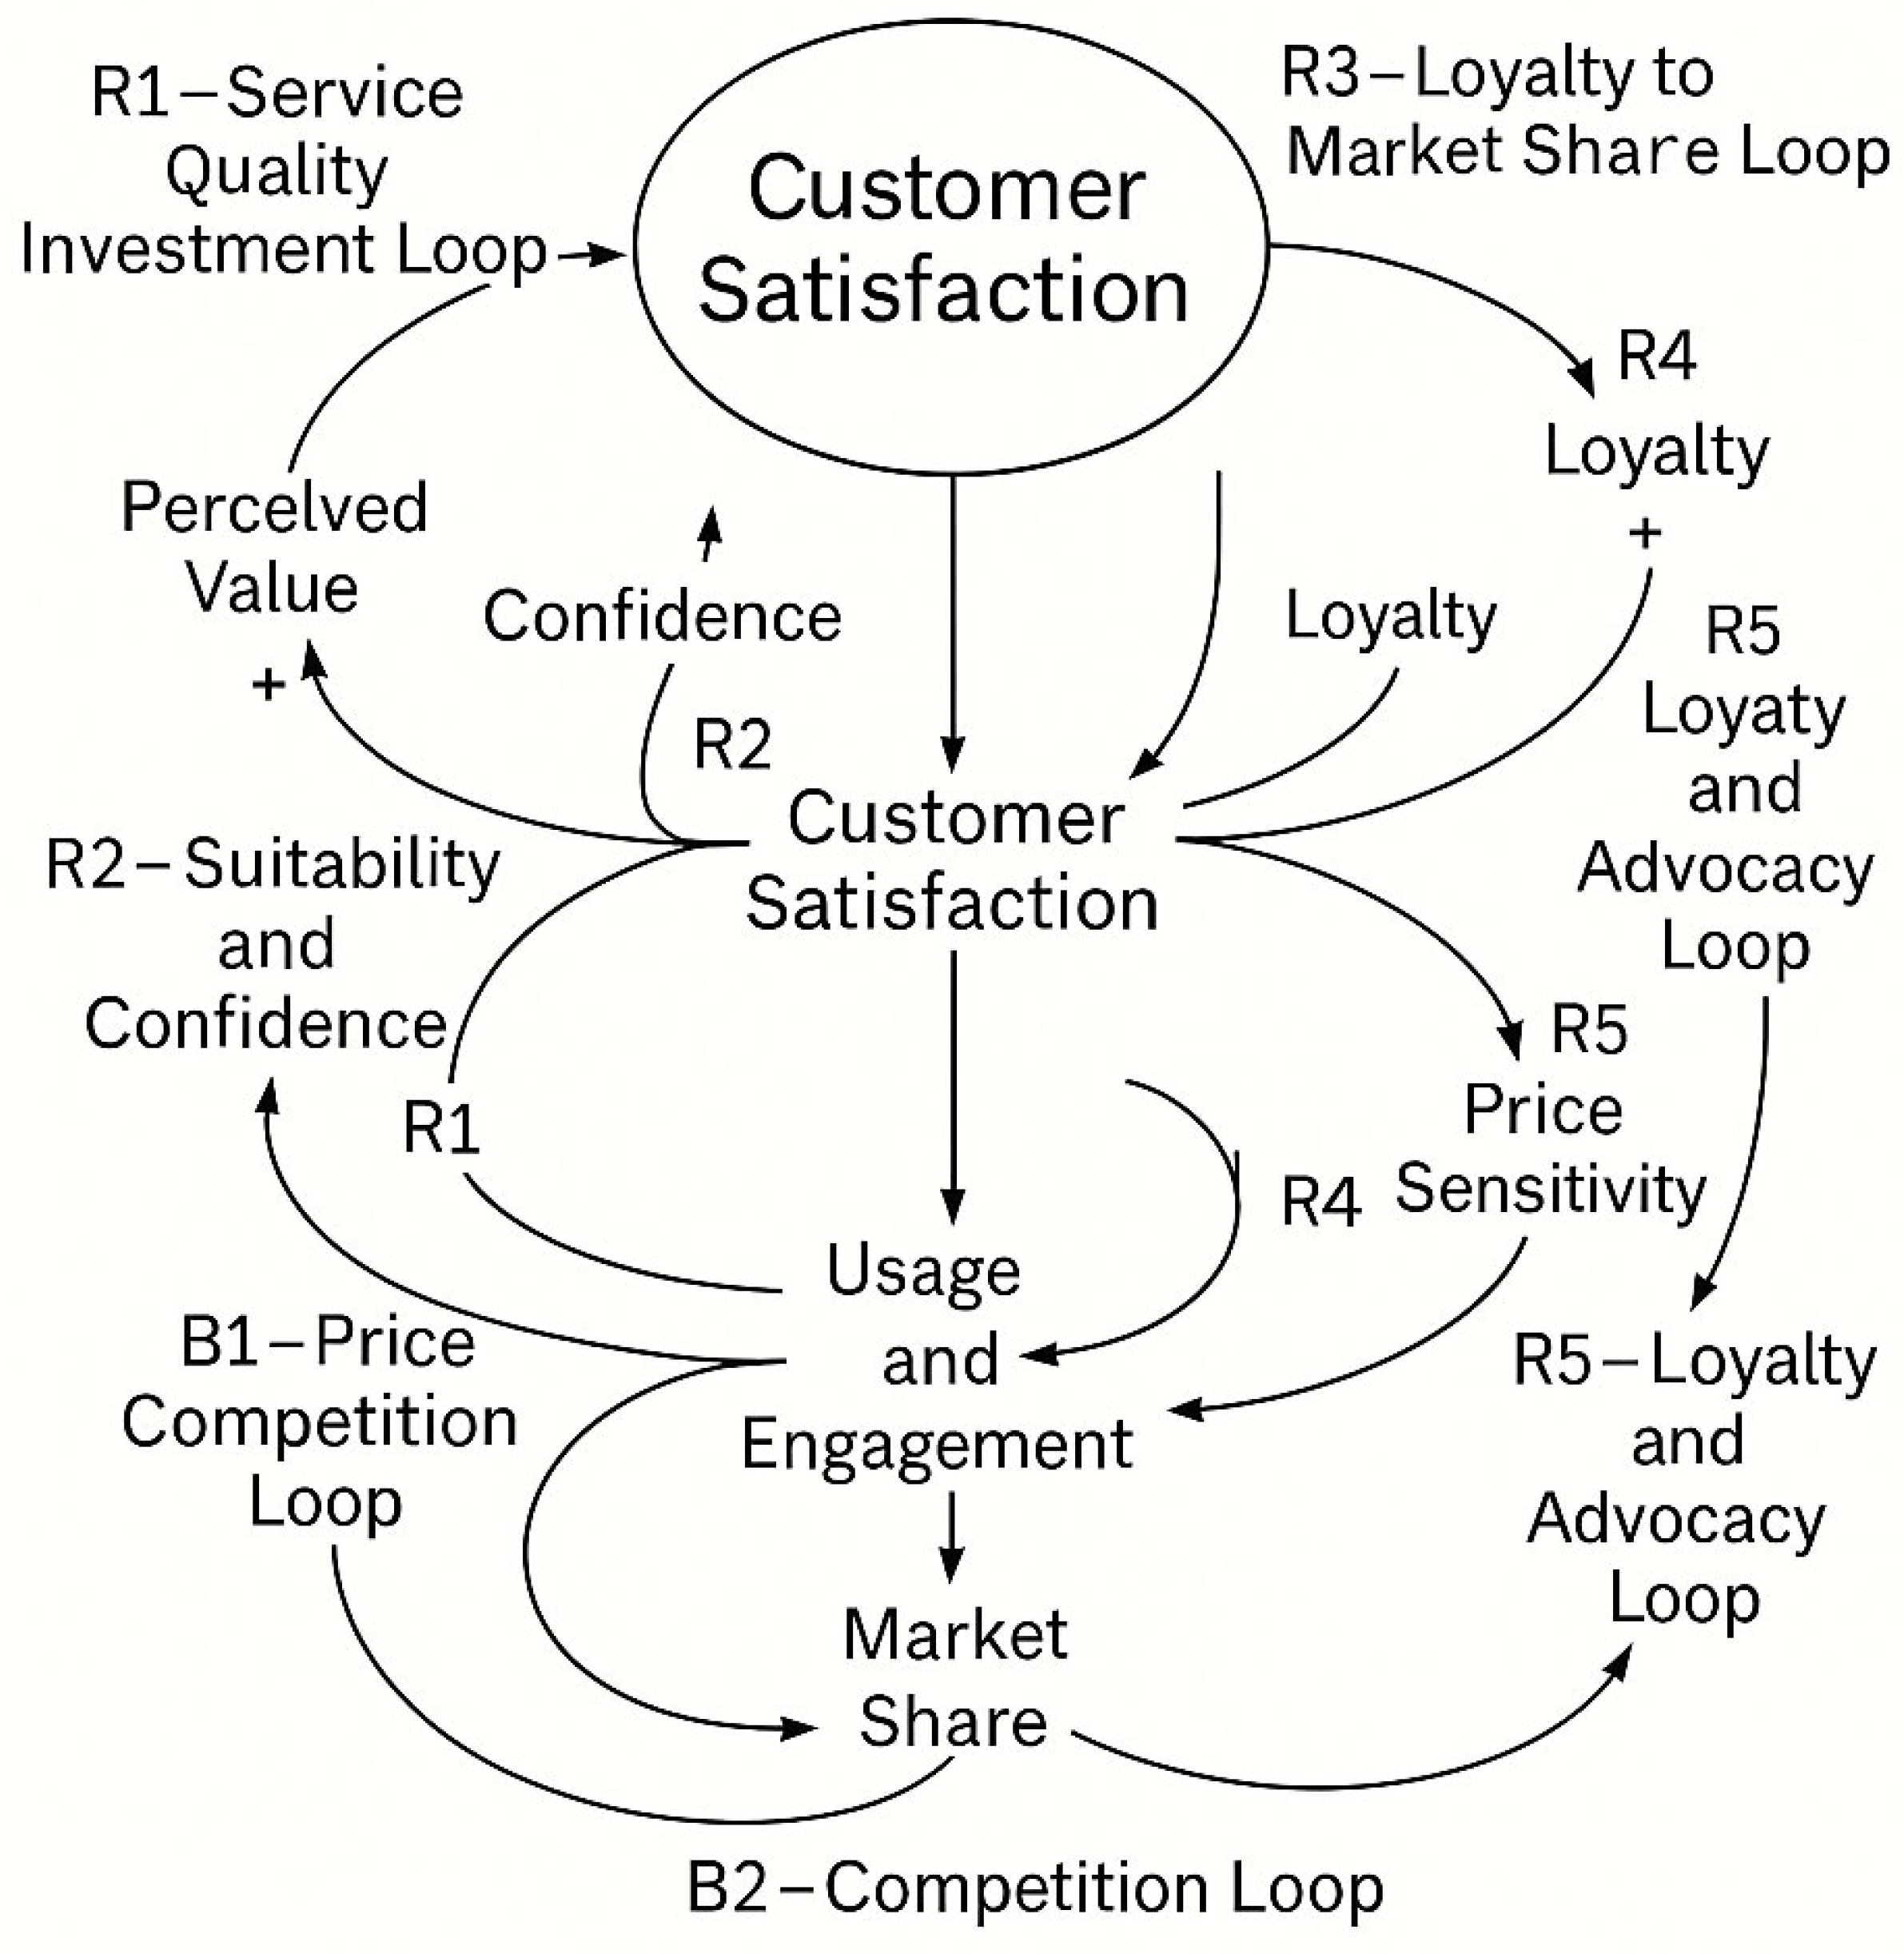
This section presents findings from the systems modeling of telecom customer satisfaction, illustrated through the Causal Loop Diagram (CLD). Based on transformed survey data, the study identifies six reinforcing loops (R1–R6) and two balancing loops (B1–B2), capturing the dynamic interactions among core variables such as service quality, perceived value, word of mouth, customer loyalty, market competition, and price sensitivity (see Figure 2). Each feedback loop is analyzed in terms of its behavioral logic and its strategic implications for telecom providers and policymakers.
6.1. Reinforcing Feedback Loops (R1–R6)
The reinforcing loops illustrate virtuous cycles in which improvements in one domain stimulate positive changes in others, generating momentum for sustained growth in customer satisfaction and retention:
- R1 – Service Quality Investment Loop: Enhanced service quality increases customer satisfaction, which raises perceived value and willingness to pay. This, in turn, enables further investment in quality improvements (Jen & Lu, 2011; Tam, 2004).
- R2 – Suitability and Confidence Loop: Tailoring services to customers’ needs enhances satisfaction and fosters confidence and dignity, which cascades into positive influence and advocacy (Amerta & Madhavi, 2023; Berggren & von Schreeb, 2024).
- R3 – Loyalty to Market Share Loop: Satisfied customers demonstrate brand loyalty, promote positive word of mouth, expand market share, and reinforce brand trust (Chaudhuri & Holbrook, 2001; Liao, Chung, Hung, & Widowati, 2010).
- R4 – Usage and Engagement Loop: Customer satisfaction encourages more frequent usage, which reinforces perceptions of service quality and amplifies trust and endorsement (Hoang, Kousi, Martinez, & Kumar, 2023; Kim & Yum, 2024).
- R5 – Loyalty and Advocacy Loop: Loyal customers generate word of mouth that drives adoption and builds confidence among new users, which in turn strengthens satisfaction (Ahmad & Dirbawanto, 2024; Sweeney, Payne, Frow, & Liu, 2020).
- R6 – Value and Price Sensitivity Loop: High service quality elevates perceived value, which boosts willingness to pay and reduces price sensitivity—a pattern that varies by regional and market dynamics (Burkhardt, 2023; Chua, Lee, Goh, & Han, 2015).
Each reinforcing loop serves as a strategic lever telecom providers can harness to deepen customer engagement and enhance competitive advantage.
6.2. Balancing Feedback Loops (B1–B2)
In contrast to the reinforcing loops, the balancing loops illustrate self-regulating forces that temper unchecked growth and introduce competitive tension:
- B1 – Competition Loop: As a telecom provider gains market share, competitive pressure increases. While this often compels innovation, it may also lead to customer fragmentation if emerging needs go unaddressed (Prahalad & Venkat, 2004; Weil, 2023).
- B2 – Price Sensitivity Loop: Elevated pricing can reduce customers’ willingness to pay—particularly among price-sensitive segments—ultimately lowering sales volume and diminishing brand loyalty (Awaad, Kortam, & Ayad, 2024).
These loops emphasize the necessity of maintaining balance between growth-oriented strategies and responsiveness to shifting market dynamics and consumer expectations.
Reinforcing Loop R1: Service Quality Investment Loop Loop Logic: Improved service quality → higher customer satisfaction → increased perceived value → greater willingness to pay → more revenue for reinvestment → further improvement in service quality.
Policy Interpretation: This loop highlights the compounding returns of continuous service enhancement. Telecom providers should focus on long-term quality investments rather than short-term cost reductions. Policymakers can promote these initiatives by enforcing minimum quality-of-service benchmarks and offering incentives such as innovation grants or infrastructure tax credits.
Reinforcing Loop R2: Suitability and Confidence Loop Loop Logic: Service suitability → increased satisfaction → perception of high service quality → enhanced customer confidence and dignity → greater influence on others → broader adoption → increased perception of suitability.
Policy Interpretation: This loop underscores the value of inclusive, needs-driven service design. Providers should tailor offerings to accommodate a wide spectrum of user needs, including those of underserved or marginalized communities. Regulators can encourage this through accessibility mandates and by championing universal design principles in telecom services.
Reinforcing Loop R3: Loyalty to Market Share Loop Loop Logic: Customer satisfaction → loyalty → positive word of mouth → new customer acquisition → increased market share → stronger brand trust → higher willingness to pay → reinvestment in quality → more satisfaction.
Policy Interpretation: Loyalty serves as a key engine for growth. Providers should develop robust loyalty programs and uphold transparent service standards. Regulatory bodies, in turn, should monitor market dominance to prevent monopolistic behavior and ensure that large providers continue delivering value across all market segments.
Reinforcing Loop R4: Usage and Engagement Loop Logic: Customer satisfaction → increased usage → more positive experiences → stronger word of mouth → elevated expectations and trust → higher satisfaction. Policy Interpretation: This loop suggests that usage itself reinforces satisfaction. Providers should emphasize seamless, intuitive user experiences and invest in proactive customer support. Governments can further this momentum by promoting digital literacy and subsidizing digital access to encourage equitable engagement in the telecom ecosystem.
Reinforcing Loop R5: Loyalty and Advocacy Loop Logic: Customer satisfaction → loyalty → advocacy (word of mouth) → new customer trust → increased adoption → more satisfaction. Policy Interpretation: This loop highlights the strength of organic brand advocacy. Providers should foster trust through ethical marketing and consistent service delivery. Regulators can support this dynamic by enforcing truth-in-advertising regulations and creating visibility for verified customer feedback mechanisms.
Reinforcing Loop R6: Value and Price Sensitivity Loop Logic: High service quality → perceived value → willingness to pay → reduced price sensitivity → stable revenue → reinvestment in quality → sustained value perception. Policy Interpretation: This loop demonstrates how perceived value shapes customers’ price tolerance. Telecom providers should ensure that pricing structures reflect service value—particularly in regions marked by economic disparities. Policymakers can promote fairness through tiered pricing models and reinforce accessibility via universal service mandates.
Balancing Loop B1: Competition Loop Logic: Increased market share → attracts competitors → intensified competition → pressure on dominant provider → potential decline in market share. Policy Interpretation: This loop prevents unchecked market dominance. Regulators should ensure a level playing field by discouraging anti-competitive behavior and supporting new entrants via fair spectrum licensing and infrastructure-sharing policies.
Balancing Loop B2: Price Sensitivity Loop Logic: Higher prices → reduced willingness to pay → lower demand → pressure to adjust pricing or improve value → stabilized customer base. Policy Interpretation: This loop illustrates the built-in check on pricing power. Providers must strike a sustainable balance between profitability and affordability. Policymakers can promote price fairness through consumer protections such as caps, subsidies, or collaborative public-private models to maintain essential access for vulnerable segments.
7. Discussion
The findings from this systems-based analysis illuminate the intricate interplay between service quality, customer perception, and market behavior within the telecommunications sector. Unlike traditional linear models, the eight identified feedback loops—six reinforcing and two balancing—reveal a dynamic ecosystem in which customer satisfaction functions both as an outcome and as a driver of broader systemic change.
The reinforcing loops (R1–R6) demonstrate how incremental improvements in service quality or perceived value can spark self-reinforcing growth. For instance, the Service Quality Investment Loop (R1) shows how reinvesting revenue from satisfied customers into service upgrades can initiate a virtuous cycle. Similarly, the Loyalty to Market Share (R3) and Loyalty and Advocacy (R5) loops emphasize the critical role of emotional variables such as trust, confidence, and social endorsement in stimulating adoption and retention. These findings reinforce the notion that customer loyalty is not merely transactional—it is rooted in nuanced social and experiential dynamics.
In contrast, the balancing loops (B1 and B2) introduce moderating forces that counter unrestrained momentum. The Competition Loop (B1) serves as a market-stabilizing mechanism by checking excessive dominance and encouraging innovation. The Price Sensitivity Loop (B2) functions as a fiscal regulator, ensuring that perceived value aligns with pricing or risks alienating cost-sensitive segments. Importantly, contextual factors such as geographic region and market saturation further complicate customer response patterns. Value, as perceived by consumers, varies widely across contexts—suggesting the need for differentiated, locally tailored strategies.
From a managerial standpoint, the CLD offers telecom providers a diagnostic framework to identify high-leverage intervention points. Leveraging reinforcing loops that align with organizational strengths—whether in innovation, personalized service, or community engagement—can deliver exponential returns. From a policy perspective, the system model supports the case for nuanced, equity-minded regulation aimed at fostering inclusivity and safeguarding sustainable competition.
Ultimately, this study reframes customer loyalty as a dynamic, emergent phenomenon shaped by complex interactions rather than a fixed metric. By articulating key feedback loops, the model empowers decision-makers with a deeper systems-oriented lens to navigate the evolving telecommunications landscape.
8. Conclusions and Future Research
This study leveraged systems thinking and Causal Loop Diagrams (CLDs) to illuminate the dynamic structures shaping customer loyalty in the telecommunications sector. Drawing on insights from 1,140 survey responses across diverse regions, the research synthesized key variables into six reinforcing loops and two balancing loops—offering a novel, holistic framework for understanding how service quality, perceived value, user confidence, and market forces interact over time. The findings underscore that customer loyalty is not a static outcome but an emergent property of interconnected feedback systems—shaped as much by emotional factors and trust as by pricing or competition.
These insights offer actionable leverage points for practitioners and policymakers alike. Telecom providers can deploy the model to inform system-level interventions—for example, tailoring services to regional sensitivities or reinvesting in service quality to activate loyalty-driven growth cycles. Policymakers, meanwhile, can calibrate regulatory mechanisms to promote affordability, inclusion, and healthy competition that aligns with public interest.
Future research can extend this model in several promising directions. Longitudinal studies would help validate the temporal evolution of feedback loops in different market contexts. Agent-based simulations could explore how diverse customer segments respond to strategic shifts or disruptions—such as regulatory change or service outages. Region-specific analyses could deepen contextual validity by examining cultural and infrastructural differences in loyalty formation. Finally, qualitative research—through interviews, ethnographies, or digital trace data—could surface the lived experiences and narratives that animate key variables within the system.
By reframing customer loyalty as a dynamic, systems-driven phenomenon, this research establishes a foundation for more adaptive, equity-oriented strategies in managing telecom services within an increasingly complex and competitive global landscape.
References
- Ahmad, A., & Dirbawanto, N. D. (2024). Building Customer Loyalty and Advocacy through Engagement Programs. Strategies for Brand Communications and Management, 148.
- Amerta, L., & Madhavi, I. (2023). Exploring service quality and customer satisfaction in the service industry: A mixed-methods analysis. Journal on Economics, Management and Business Technology, 2(1), 1-16.
- Anderson, E. W. (1998). Customer satisfaction and word of mouth. Journal of service research, 1(1), 5-17.
- Arnold, R. D., & Wade, J. P. (2015). A definition of systems thinking: A systems approach. Procedia Computer Science, 44, 669–678. [CrossRef]
- Awaad, S. A., Kortam, W., & Ayad, N. (2024). Examining the impact of price sensitivity on customer lifetime value: Empirical analysis. Cogent Business & Management, 11(1), 2366441.
- Awuku, E., Agyei, P. M., & Gonu, E. (2023). Service innovation practices and customer loyalty in the telecommunication industry. Plos one, 18(3), e0282588.
- Azen, R., & Walker, C. M. (2021). Categorical data analysis for the behavioral and social sciences. Routledge.
- Baehre, S., O'Dwyer, M., O'Malley, L., & Story, V. M. (2022). Customer mindset metrics: A systematic evaluation of the net promoter score (NPS) vs. alternative calculation methods. Journal of Business Research, 149, 353-362.
- Bankole, F. O., & Bankole, O. O. (2017). The effects of cultural dimension on ICT innovation: Empirical analysis of mobile phone services. Telematics and Informatics, 34(2), 490-505.
- Baumann, C., Elliott, G., & Burton, S. (2012). Modeling customer satisfaction and loyalty: survey data versus data mining. Journal of services marketing, 26(3), 148-157.
- Berggren, K., & von Schreeb, I. (2024). Leveraging Customer Care to Enhance Retention and Organizational Success.
- Bhattacharyya, J., & Dash, M. K. (2021). Investigation of customer churn insights and intelligence from social media: A netnographic research. Online Information Review, 45(1), 174-206.
- Burkhardt, M. L. (2023). Effects of Perceived Service Quality, Customer Satisfaction, Perceived Switching Costs, and Price Sensitivity on Personal Automobile Policy Continuance Intention. Trident University International.
- Calvo-Porral, C., & Lévy-Mangin, J. P. (2015). Switching behavior and customer satisfaction in mobile services: Analyzing virtual and traditional operators. Computers in Human Behavior, 49, 532-540.
- Chaudhuri, A., & Holbrook, M. B. (2001). The chain of effects from brand trust and brand affect to brand performance: the role of brand loyalty. Journal of marketing, 65(2), 81-93.
- Chua, B. L., Lee, S., Goh, B., & Han, H. (2015). Impacts of cruise service quality and price on vacationers’ cruise experience: Moderating role of price sensitivity. International Journal of Hospitality Management, 44, 131-145.
- Creately. (2024, October 3). Causal loop diagram: How to visualize and analyze system dynamics. https://creately.com/guides/causal-loop-diagram/.
- Dawes, J. G. (2024). The net promoter score: What should managers know? International Journal of Market Research, 66(2-3), 182-198.
- Felicetti, A. M., Linzalone, R., Filippelli, S., & Bigliardi, B. (2024). Connecting the dots in green food purchasing behavior literature: A system thinking approach for systematic literature reviews. Business Ethics, the Environment & Responsibility.
- Forbus, K. D. (2011). Qualitative modeling. Wiley Interdisciplinary Reviews: Cognitive Science, 2(4), 374-391.
- Freed, L. (2013). Innovating analytics: How the next generation of net promoter can increase sales and drive business results. John Wiley & Sons.
- Gerpott, T. J., Rams, W., & Schindler, A. (2001). Customer retention, loyalty, and satisfaction in the German mobile cellular telecommunications market. Telecommunications policy, 25(4), 249-269.
- Hajar, M. A., Alkahtani, A. A., Ibrahim, D. N., Al-Sharafi, M. A., Alkawsi, G., Iahad, N. A., ... & Tiong, S. K. (2022). The effect of value innovation in the superior performance and sustainable growth of telecommunications sector: Mediation effect of customer satisfaction and loyalty. Sustainability, 14(10), 6342.
- Hijazin, A., Tamayo-Torres, J., & Nusairat, N. (2023). Moderating the synergies between business intelligence and strategic foresight: Navigating uncertainty for future success through knowledge management. Sustainability, 15(19), 14341.
- Hoang, D., Kousi, S., Martinez, L. F., & Kumar, S. (2023). Revisiting a model of customer engagement cycle: a systematic review. The Service Industries Journal, 43(9-10), 579-617.
- Hogreve, J., Iseke, A., & Derfuss, K. (2022). The service-profit chain: reflections, revisions, and reimaginations. Journal of service research, 25(3), 460-477.
- Jen, W., Tu, R., & Lu, T. (2011). Managing passenger behavioral intention: an integrated framework for service quality, satisfaction, perceived value, and switching barriers. Transportation, 38, 321-342.
- Jones, P. H. (2014). Systemic design principles for complex social systems. Social systems and design, 91-1.
- Kim, J., & Yum, K. (2024). Enhancing Continuous Usage Intention in E-Commerce Marketplace Platforms: The Effects of Service Quality, Customer Satisfaction, and Trust. Applied Sciences, 14(17), 7617.
- Koskela, H. (2002). Customer satisfaction and loyalty in after sales service: Modes of care in telecommunications systems delivery. Helsinki University of Technology.
- Kumar, S., Verma, A.K., Mirza, A. (2024). Digital Transformation and Knowledge Economy. In: Digital Transformation, Artificial Intelligence and Society. Frontiers of Artificial Intelligence, Ethics and Multidisciplinary Applications. Springer, Singapore. [CrossRef]
- Liao, S. H., Chung, Y. C., Hung, Y. R., & Widowati, R. (2010, December). The impacts of brand trust, customer satisfaction, and brand loyalty on word-of-mouth. In 2010 IEEE international conference on industrial engineering and engineering management (pp. 1319-1323). IEEE.
- Lottu, O. A., Ezeigweneme, C. A., Olorunsogo, T., & Adegbola, A. (2024). Telecom data analytics: Informed decision-making: A review across Africa and the USA. World J Adv Res Rev, 21(1), 1272-1287.
- Luna-Reyes, L. F., & Andersen, D. L. (2003). Collecting and analyzing qualitative data for system dynamics: methods and models. System Dynamics Review: The Journal of the System Dynamics Society, 19(4), 271-296.
- Maani, K. (2016). Multi-stakeholder decision making for complex problems: A systems thinking approach with cases. World Scientific.
- Marcos, A. M. B. D. F., & Coelho, A. F. D. M. (2022). Service quality, customer satisfaction and customer value: holistic determinants of loyalty and word-of-mouth in services. The TQM Journal, 34(5), 957-978.
- Markus, M. L., Majchrzak, A., & Gasser, L. (2002). A design theory for systems that support emergent knowledge processes. MIS quarterly, 179-212.
- Mauri, A. G., Minazzi, R., & Muccio, S. (2013). A review of literature on the gaps model on service quality: A 3-decades period: 1985–2013. International Business Research, 6(12), 134-144.
- Octabriyantiningtyas, D., & Suryani, E. (2019). The effect of service quality on t-cash customer satisfaction using system dynamics framework. Journal of Information Systems Engineering and Business Intelligence, 5(1), 76-84.
- Owen, R., & Brooks, L. L. (2008). Answering the ultimate question: How net promoter can transform your business. John Wiley & Sons.
- Pagani, M., & Fine, C. H. (2008). Value network dynamics in 3G–4G wireless communications: A systems thinking approach to strategic value assessment. Journal of Business Research, 61(11), 1102-1112.
- Parasuraman, A., Zeithaml, V. A., & Berry, L. L. (1988). SERVQUAL: A multiple-item scale for measuring consumer perceptions of service quality. Journal of Retailing, 64(1), 12–40.
- Peres, R., Muller, E., & Mahajan, V. (2010). Innovation diffusion and new product growth models: A critical review and research directions. International journal of research in marketing, 27(2), 91-106.
- Prahalad, Coimbatore Krishna, and Venkat Ramaswamy. The future of competition: Co-creating unique value with customers. Harvard Business Press, 2004.
- Qiu, R. G. (2009). Computational thinking of service systems: Dynamics and adaptiveness modeling. Service Science, 1(1), 42-55.
- Rebs, T., Brandenburg, M., & Seuring, S. (2019). System dynamics modeling for sustainable supply chain management: A literature review and systems thinking approach. Journal of cleaner production, 208, 1265-1280.
- Reichheld, F. F. (2003). The one number you need to grow. Harvard Business Review, 81(12), 46–54.
- Sabharwal, R. (2025). Introduction to System Dynamics. Educohack Press.
- Saravanan, R., & Rao, K. S. P. (2007). Measurement of service quality from the customer's perspective–an empirical study. Total Quality Management and Business Excellence, 18(4), 435-449.
- Shahid, K., Yang, Q., Waheed, A., & Rashid, Y. (2021). The impact of technological alignment and advancement on firms’ project performance with mediating role of technology acceptance model. Human Systems Management, 40(2), 287-298.
- Shukla, P., Gupta, A., KL, M., & Agarwal, R. (2024). Data Driven Customer Relationship Management and Its Impact on Consumers' Net Promotors Score (NPS): An Empirical Investigation. Library of Progress-Library Science, Information Technology & Computer, 44(3).
- SixSigma.us. . (2024, March 29). Causal loop diagram in systems thinking: Everything to know. https://www.6sigma.us/systems-thinking/causal-loop-diagram-in-systems-thinking/.
- Sterman, J. (2002). System Dynamics: systems thinking and modeling for a complex world.
- Sterman, J. D. (2000). Business dynamics: Systems thinking and modeling for a complex world. Irwin/McGraw-Hill.
- Sweeney, J., Payne, A., Frow, P., & Liu, D. (2020). Customer advocacy: A distinctive form of word of mouth. Journal of Service Research, 23(2), 139-155.
- Tam, J. L. (2004). Customer satisfaction, service quality and perceived value: an integrative model. Journal of marketing management, 20(7-8), 897-917.
- Van Geert, P. (2003). Dynamic systems approaches and modeling of developmental proces Goldspink, C. (2002). Methodological implications of complex systems approach to sociality: Simulation as a foundation for knowledge. Journal of Artificial Societies and Social Simulation, 5(1), 1-19.ses. Handbook of developmental psychology, 640-672.28.
- Wang, S., Li, L., & Jones, J. D. (2013). Systemic thinking on services science, management and engineering: Applications and challenges in services systems research. IEEE Systems Journal, 8(3), 803-820.
- Weil, H. (2023). Competitive Dynamics—Winning in Technology Markets. MIT SLOANS.
- Zeithaml, V. A., & Parasuraman, A. (2004). Service quality. Cambridge, MA.
Figure 1.
CLD for Customer loyalty in Telecoms.
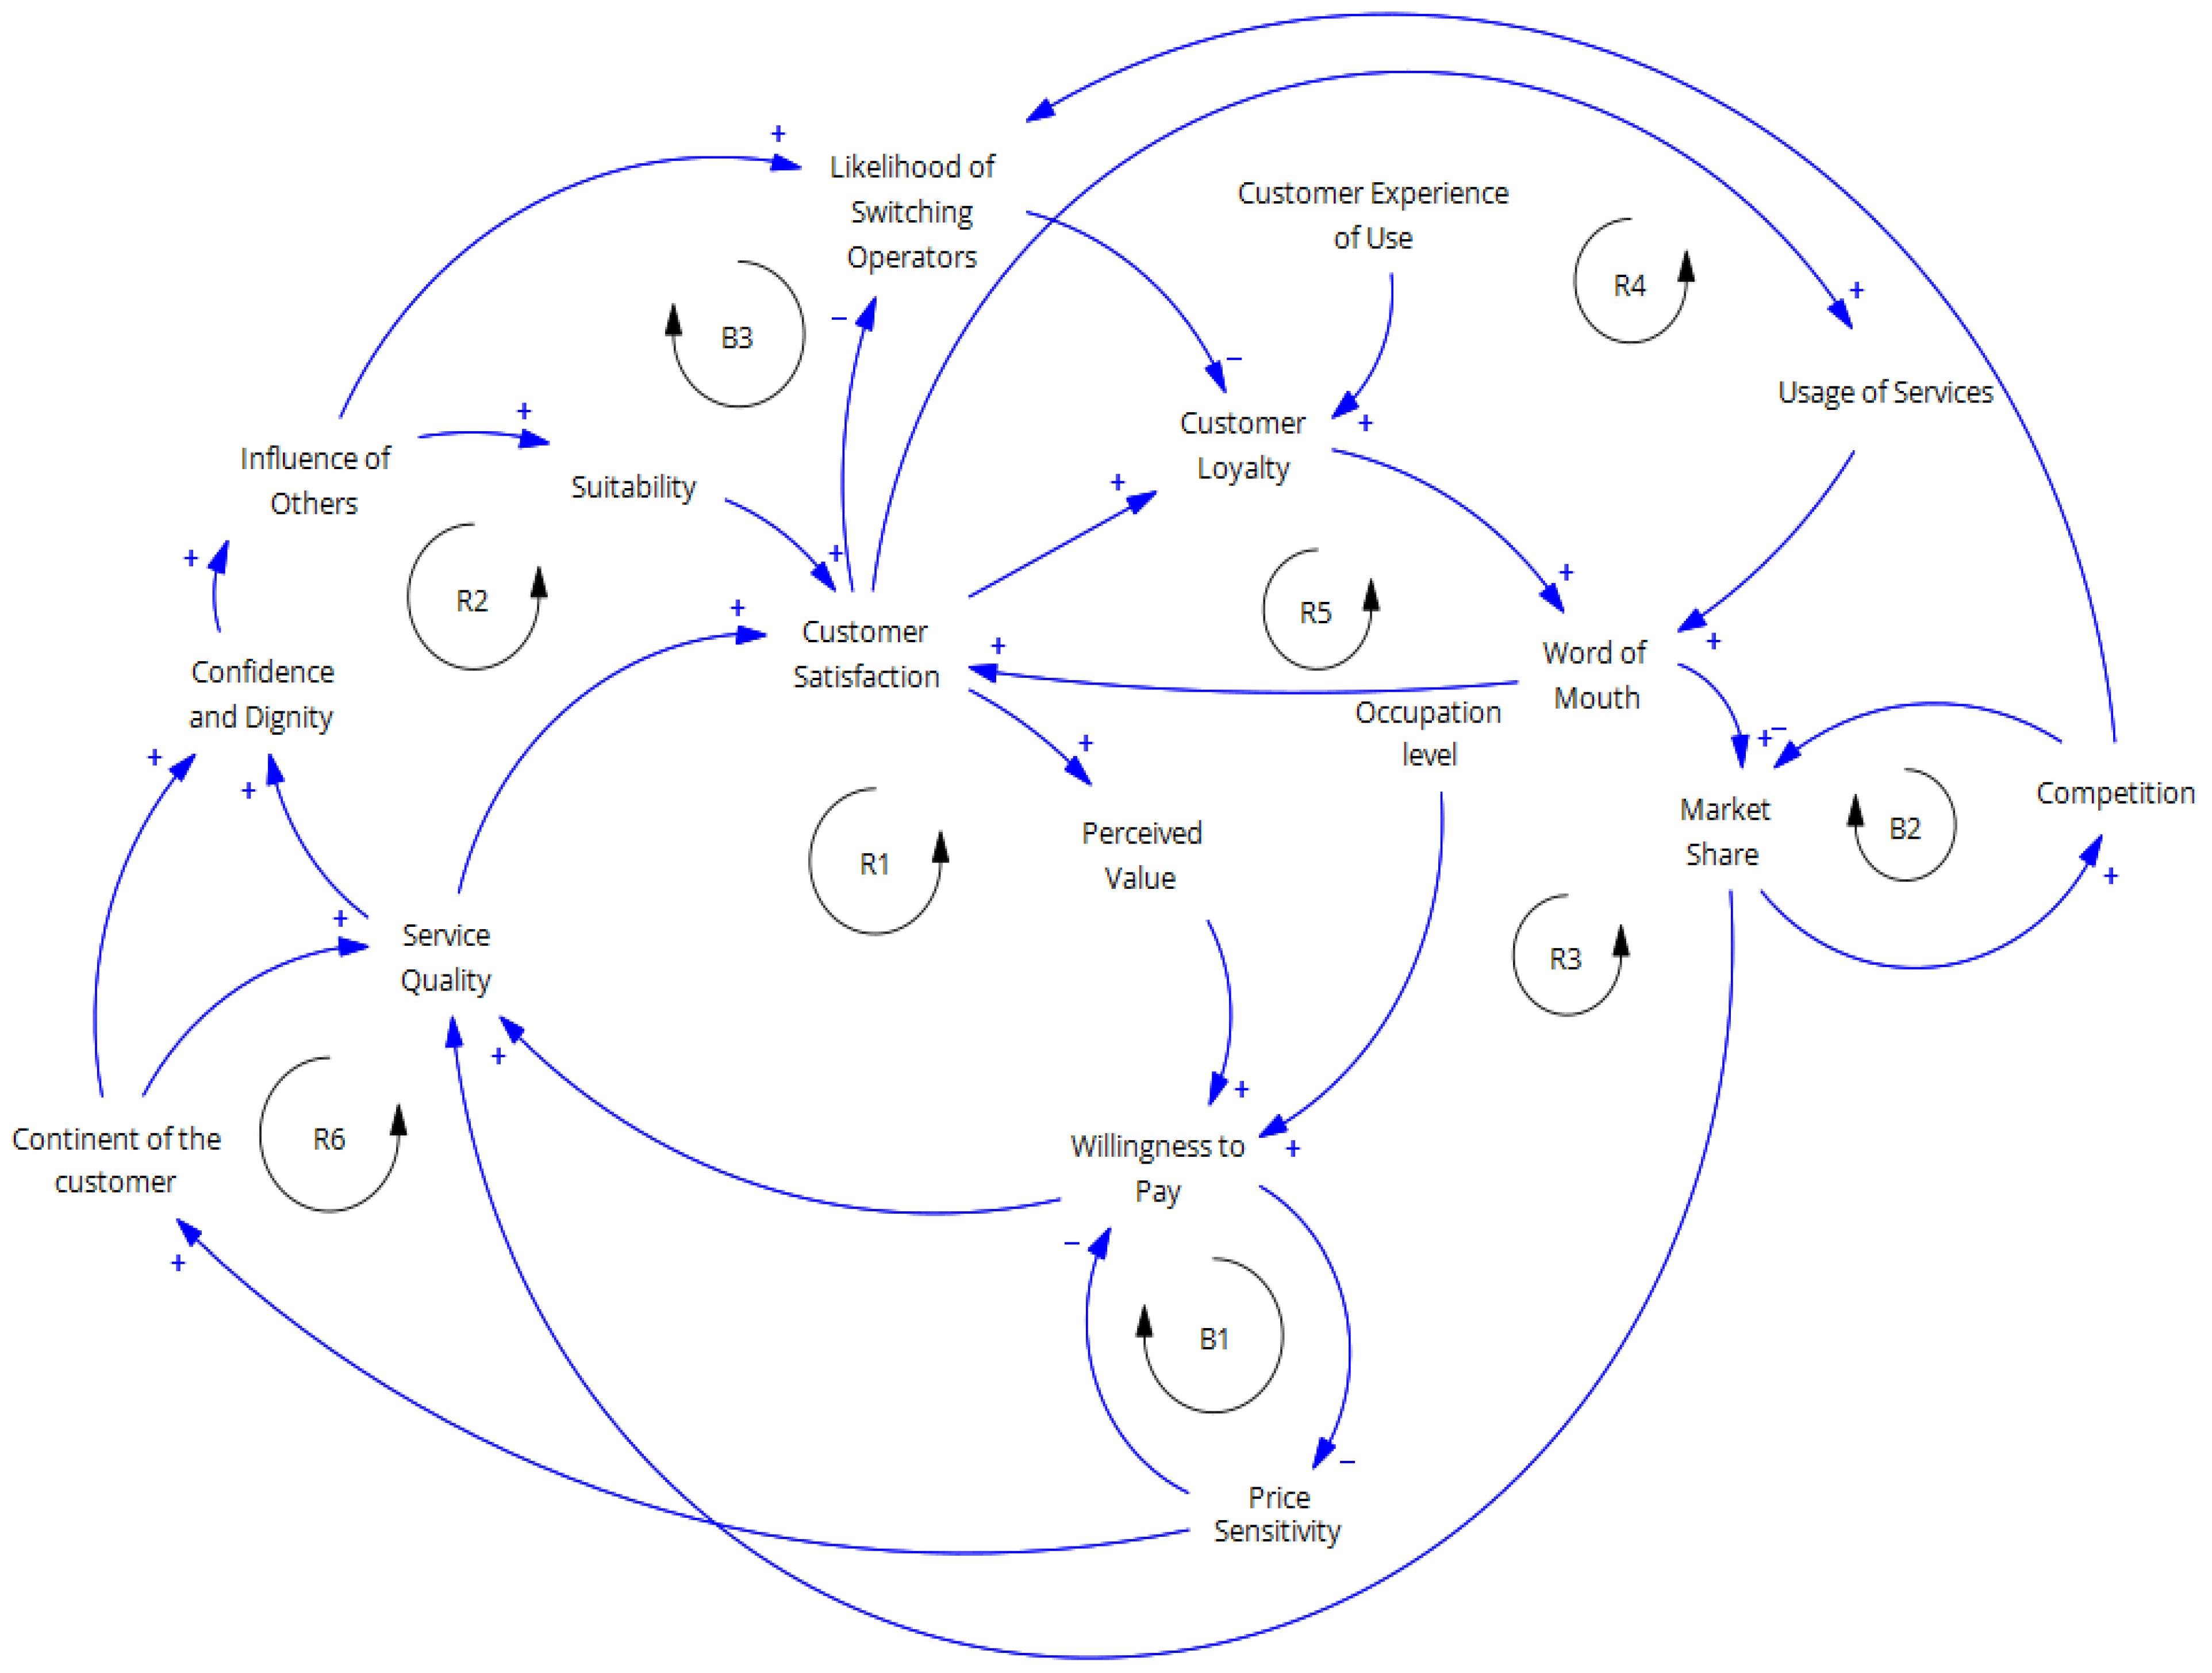
Figure 2.
Reinforcement and Balancing Loops for Customer Satisfaction.
Disclaimer/Publisher’s Note: The statements, opinions and data contained in all publications are solely those of the individual author(s) and contributor(s) and not of MDPI and/or the editor(s). MDPI and/or the editor(s) disclaim responsibility for any injury to people or property resulting from any ideas, methods, instructions or products referred to in the content. |
© 2025 by the authors. Licensee MDPI, Basel, Switzerland. This article is an open access article distributed under the terms and conditions of the Creative Commons Attribution (CC BY) license (http://creativecommons.org/licenses/by/4.0/).
Copyright: This open access article is published under a Creative Commons CC BY 4.0 license, which permit the free download, distribution, and reuse, provided that the author and preprint are cited in any reuse.


