Submitted:
01 August 2025
Posted:
05 August 2025
You are already at the latest version
Abstract
The High Performance Computing (HPC) sector is driving contemporary technological and scientific innovation. However, the increasing demand for computational power and the advent of the exascale era have underscored the urgent need to address the energy, operational, and environmental implications of such growth. In response, the GIANT framework introduces an intelligent and modular solution for the dynamic management of modern datacenter resources. By integrating Artificial Intelligence (AI) and Digital Twin technologies, GIANT enables real-time monitoring, predictive analytics, and adaptive control of HPC infrastructures. The framework’s layered architecture supports the collection and processing of heterogeneous data, allowing for accurate forecasting of workloads and energy consumption, early detection of anomalies, and proactive system optimization. Furthermore, GIANT incorporates dynamic power capping strategies, shifting the paradigm from traditional reactive approaches to proactive, efficiency-driven management. This transition not only enhances system reliability and performance but also contributes to reducing the environmental impact of high-performance datacenters. The proposed solution is scalable, adaptable, and aligned with the growing demand for sustainable and intelligent computing systems in the exascale era.
Keywords:
datacenter
; energy optimization
; twin-based framework
1. Introduction
Supercomputers represent the pinnacle of technological evolution in the field of High Performance Computing (HPC). These systems are characterized by complex architectures composed of hundreds or even thousands of compute nodes operating in parallel, allowing the execution of simulations and calculations that would otherwise be infeasible or prohibitively time-consuming on conventional systems. In the current digital era, the demand for computational resources has followed an exponential growth trend, driven by multiple factors that have radically reshaped the global technological and scientific landscape. The digitalization of production sectors, the expansion of the Internet of Things (IoT), and the rise of data-driven technologies such as Artificial Intelligence and Deep Learning have imposed the need for systems capable of processing, analyzing, and extracting value from vast amounts of data within increasingly tight time constraints. This demand spans a wide range of sectors, from genomics to weather forecasting, from astronomy to pharmaceutical research. The proliferation of IoT and edge computing has further intensified this need, giving rise to distributed ecosystems where billions of connected devices generate continuous data streams requiring real-time processing. In this context, supercomputers have become the computational backbone of Industry 4.0 and 5.0, representing not only an extraordinarily powerful tool but also an increasingly complex system to manage. In 2022, a major milestone in the evolution of the HPC sector was reached with the deployment of Frontier [1], the first exascale supercomputer in the world, developed at the Oak Ridge National Laboratory in the United States. Frontier was the first system to exceed 1.1 exaflops, that is, more than one quintillion (1018) floating-point operations per second. This breakthrough marked the beginning of a new computational era that is expected to revolutionize scientific research and technological innovation. However, the growing complexity and computing power of such systems entail significant implications in terms of energy consumption, environmental impact, and emissions from data centers. The transition toward the exascale era has revealed that the pursuit of increased computational performance can no longer be dissociated from the related energy, operational, and environmental consequences. Nearly all the energy consumed by HPC systems is ultimately transformed into heat; therefore, in addition to the power required to operate the compute nodes, one must also consider the energy consumption of external systems such as cooling units, ventilation, lighting, and water pumping infrastructures [2]. The consumption associated with these auxiliary systems constitutes a critical constraint for the overall energy efficiency of HPC infrastructures and cannot be decoupled, as they are essential to the datacenter’s operational reliability.
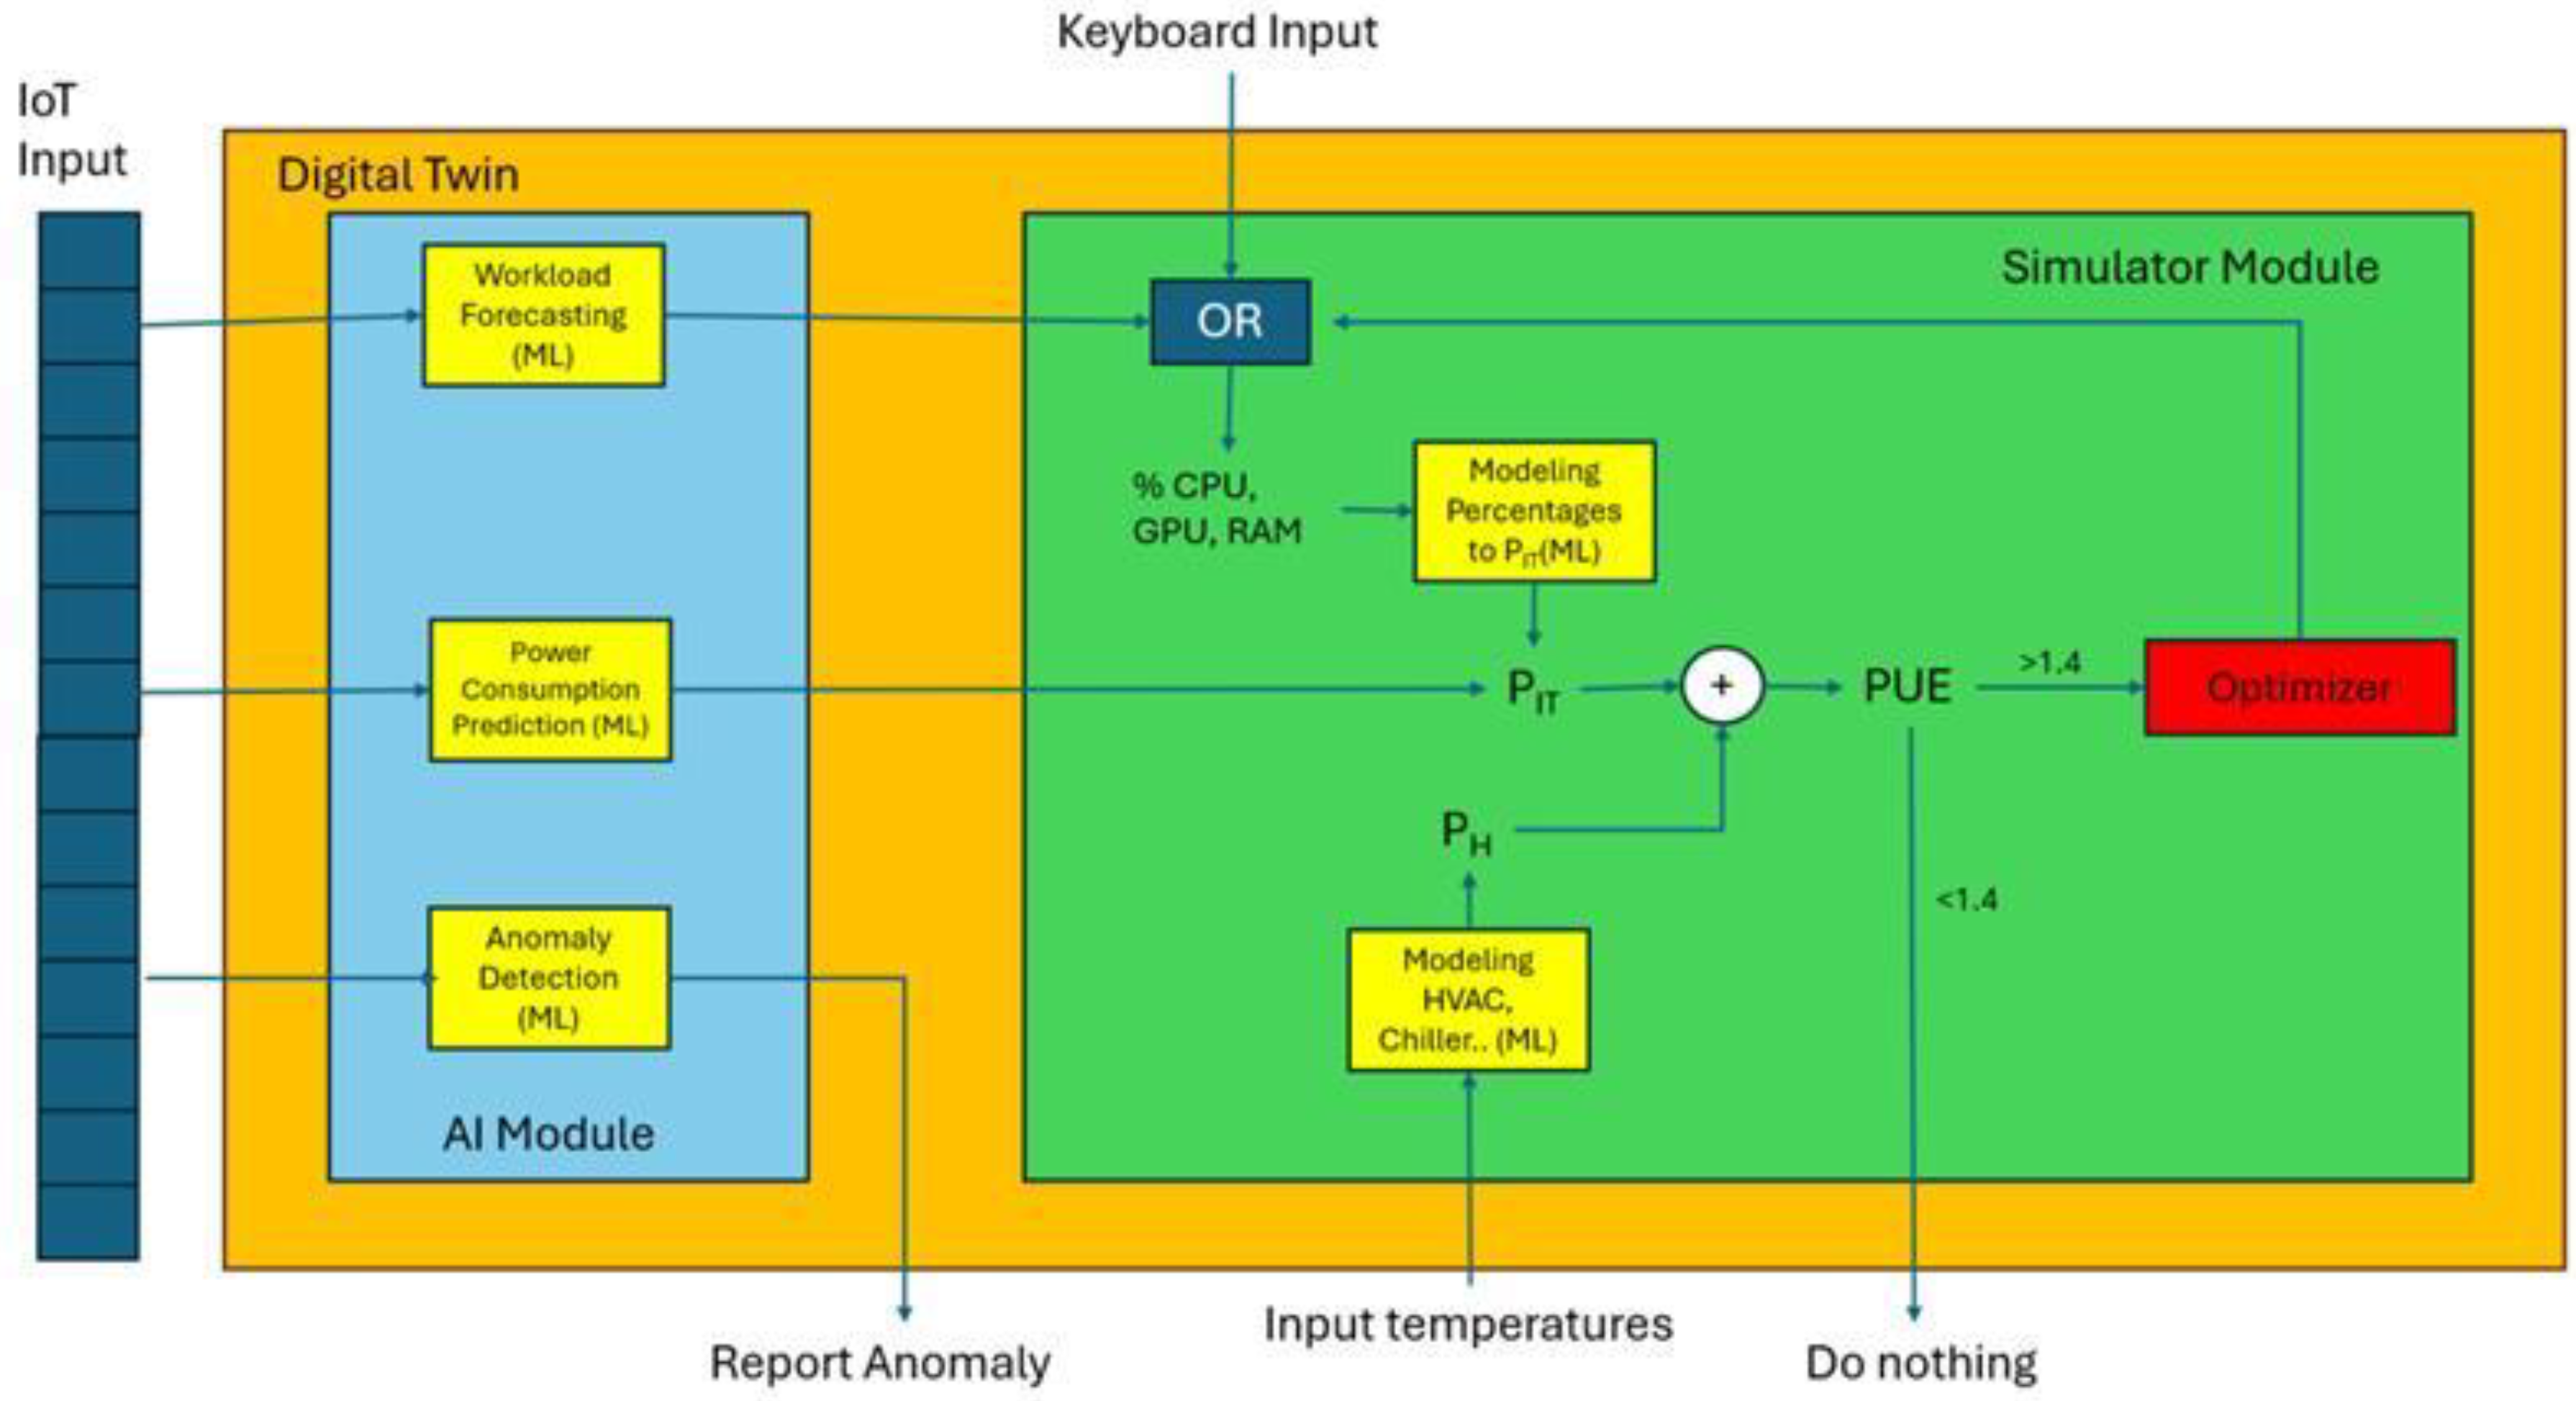
Figure 1.
GIANT Framework Overview: Schematic representation of the GIANT system architecture for intelligent datacenter management. The framework integrates a Digital Twin and an AI module (left), which process real-time IoT and environmental data to perform workload and energy consumption forecasting, as well as anomaly detection. The processed data feed into the Simulator Module (right), which includes data-driven models for both IT and auxiliary components (HVAC, chiller systems). These components compute the total power usage (P_IT + P_H) and evaluate Power Usage Effectiveness (PUE). If PUE exceeds a predefined threshold, the Optimizer is triggered to recommend energy-efficient configurations.
2. Materials and Methods
The GIANT project emerges in direct response to the increasing energy, operational, and environmental complexity of modern high-performance computing infrastructures. The main objective of GIANT is to provide an innovative intelligent system capable of managing resources across heterogeneous and complex HPC environments, with a dual focus on maximizing energy efficiency and minimizing both emissions and resource waste. Leveraging the predictive capabilities of Artificial Intelligence and the modeling power of Digital Twin technology, the framework aims to deliver an integrated solution that dynamically orchestrates the allocation of computational resources in real time, adapting to workload fluctuations and changing operational conditions within the datacenter.
From a technical perspective, the GIANT framework adopts a multi-layered architectural design that separates functional responsibilities while maintaining tight integration between system components. This modular organization enhances maintainability, extensibility, and scalability, making the solution adaptable to a wide range of datacenter types and infrastructure configurations. By combining intelligent forecasting with real-time simulation and optimization, GIANT establishes a proactive and energy-conscious approach to resource allocation in high-performance computing environments.
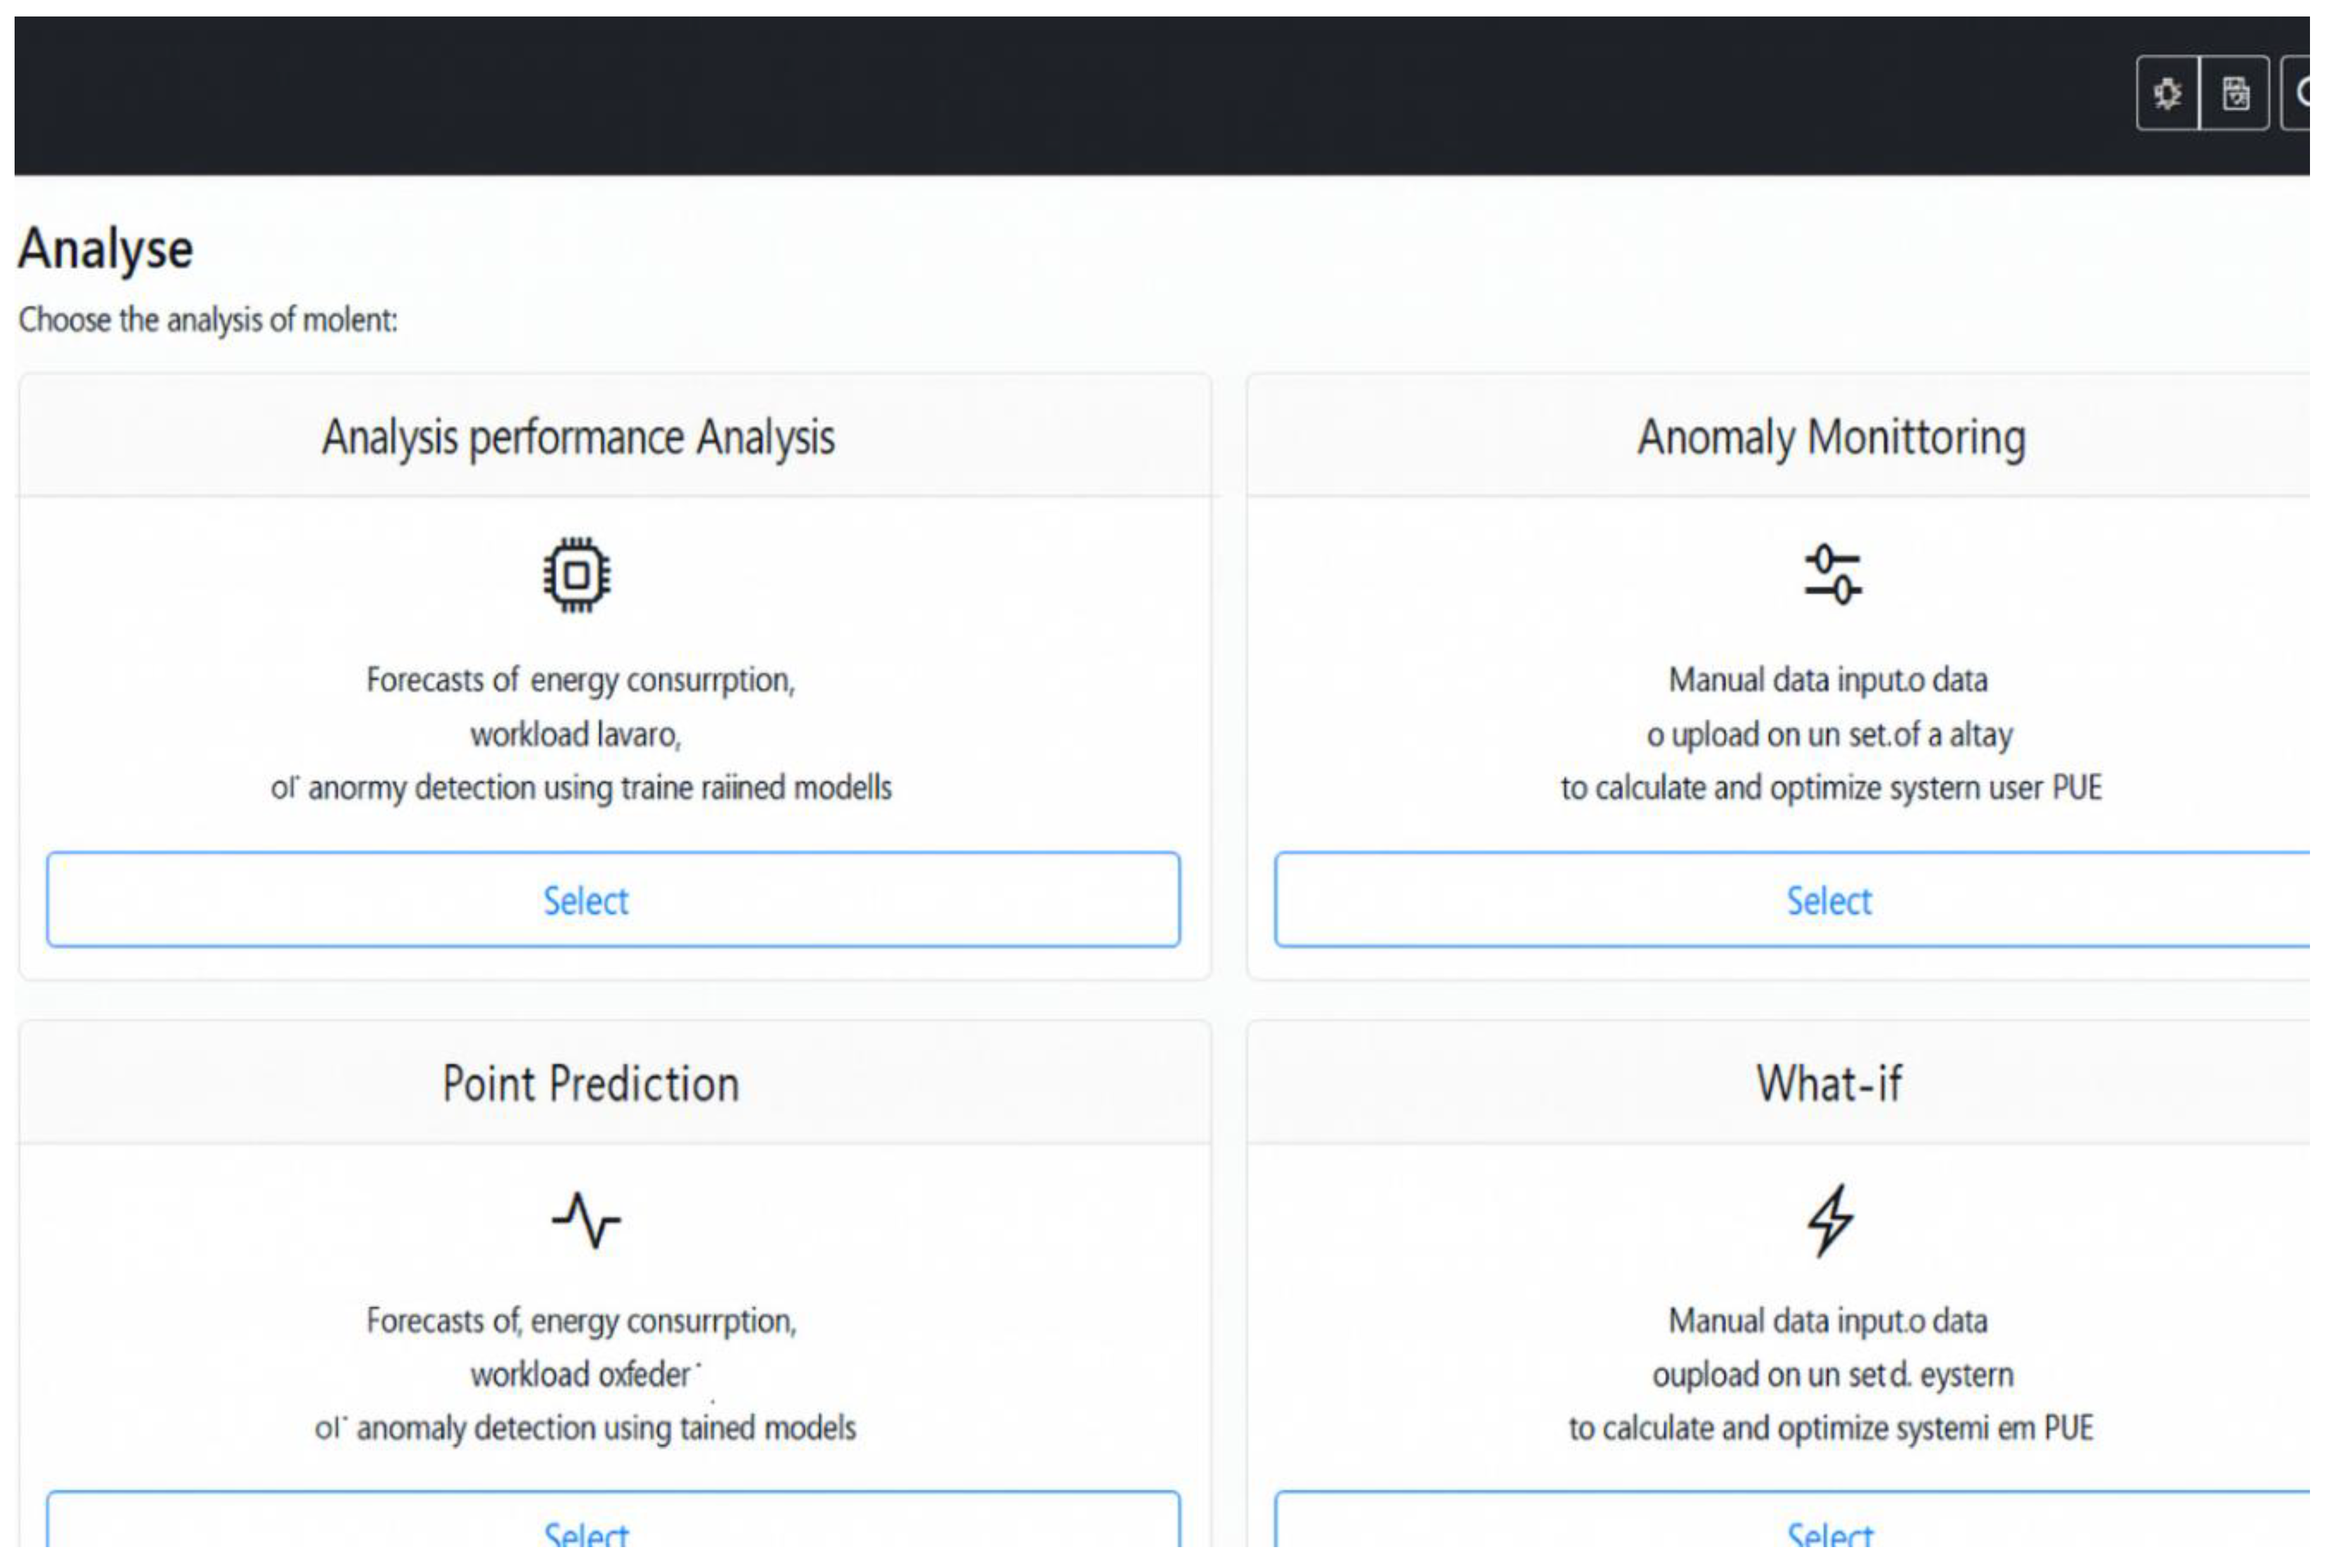
Figure 2.
GIANT platform’s user interface, displaying the main analysis dashboard. The interface offers four primary modules: Model Performance Analysis, Anomaly Monitoring, Point Prediction, and What-if Analysis. Each module allows users to perform specific operations such as forecasting energy consumption and workload, detecting anomalies using trained machine learning models, or simulating system performance scenarios. Manual data input or dataset upload functionalities are supported for PUE calculation and system optimization. The design reflects an intuitive layout with a sidebar for navigation and interactive cards for task selection.
3. Results and Discussion
3.1. Multi-Layer Architecture and Core Components
The GIANT framework is structured around a multi-layer architecture designed to support modularity, scalability, and tight integration between subsystems. This design enables efficient and dynamic orchestration of computational resources across heterogeneous datacenter environments.
The foundational layer, Data Acquisition, is responsible for the continuous collection of data from the physical infrastructure. A network of sensors monitors critical parameters such as processor utilization metrics, power consumption, and environmental conditions. This layer is essential for enabling data-driven technologies downstream, supplying high-resolution input streams to the AI and simulation modules.
Next, the Cloud Layer acts as the central hub for processing and managing data generated by IoT devices. Incoming data is cleaned, stored, and made accessible for predictive and corrective analysis. This layer also interfaces directly with the two core modules of the GIANT framework: the AI module and the Simulator module. The processed data is analyzed by machine learning algorithms based on XGBoost [3] and Long Short-Term Memory (LSTM) neural networks [4], which can detect nonlinear relationships and recurring patterns. These models are used to forecast power consumption trends, predict future workload distributions, and detect anomalies that may indicate impending faults or service interruptions. The Simulator module functions as the system’s digital twin, contextualizing AI-driven predictions to simulate optimal resource configurations.
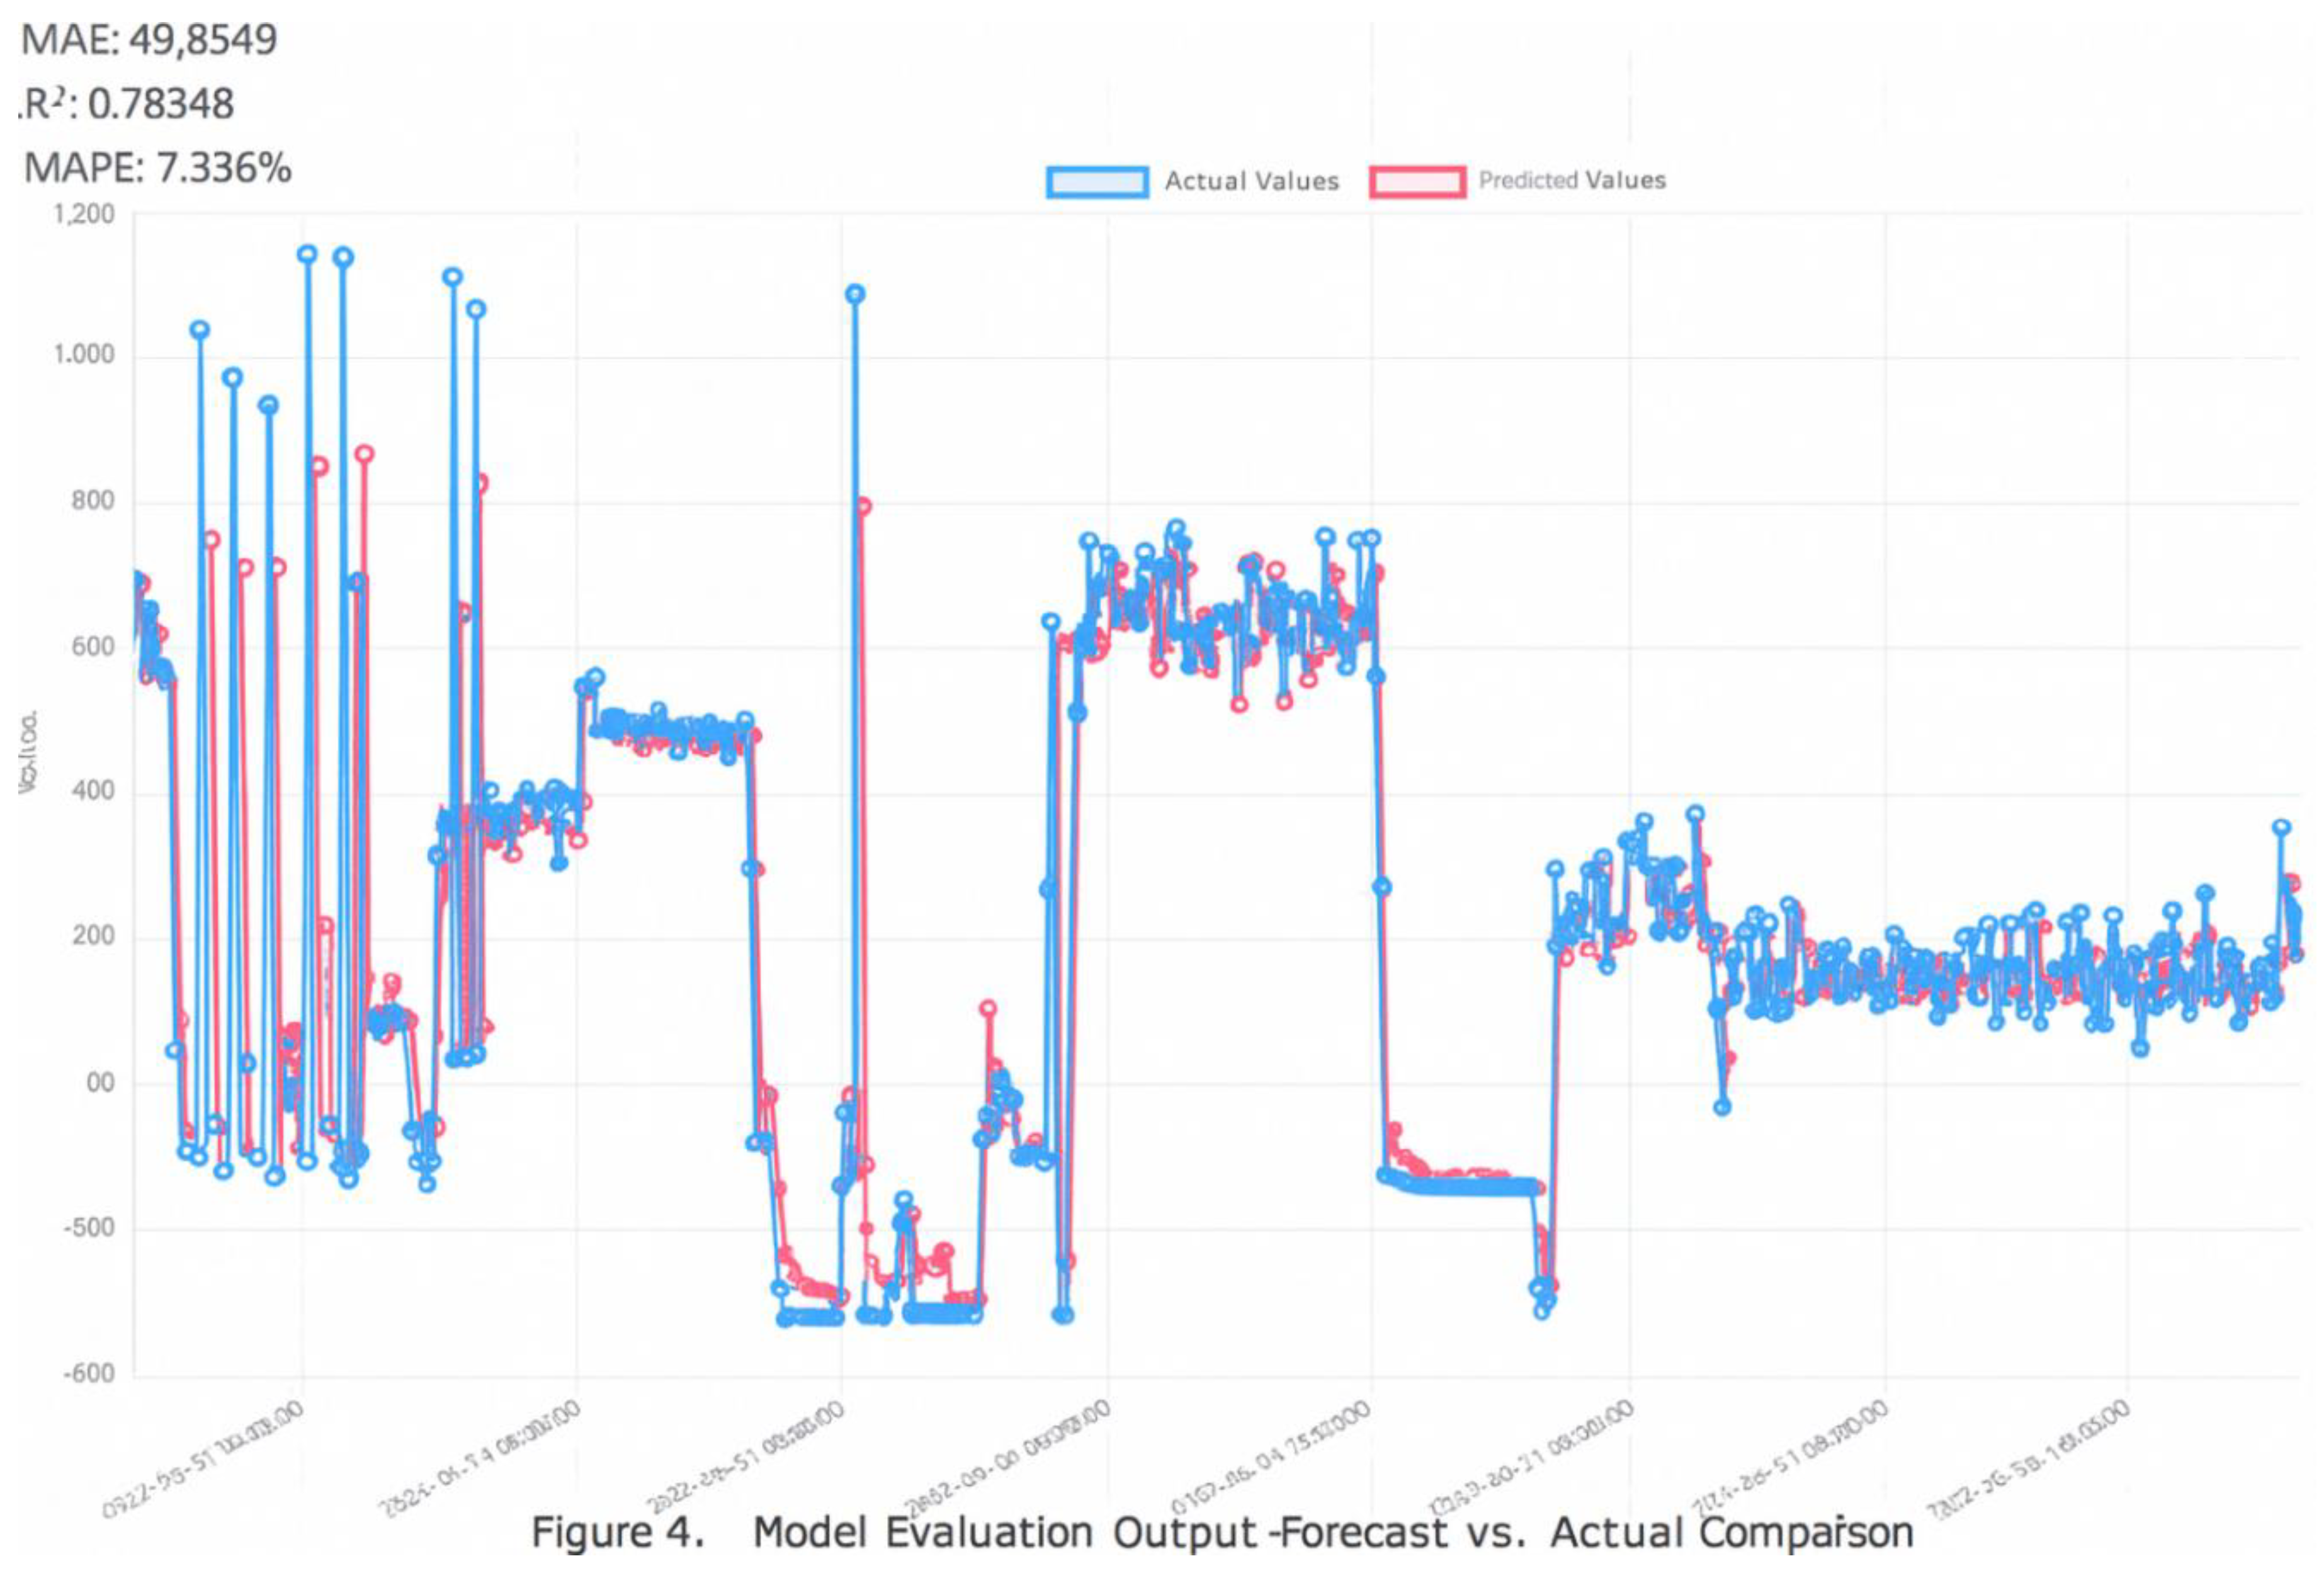
Figure 3.
Model Evaluation Output—Forecast vs. Actual Comparison. Line chart illustrating the comparison between predicted values (red) and actual values (blue) over time, as generated by the GIANT framework’s model evaluation module. The graph includes four key evaluation metrics: Mean Absolute Error (MAE = 49.8549), Coefficient of Determination (R2 = 0.78348), Mean Absolute Percentage Error (MAPE = 7.336%), and Symmetric MAPE (SMAPE = 7.00). The x-axis represents timestamped data input, while the y-axis refers to the target variable being forecast (e.g., energy consumption or workload). The high correlation between predicted and actual values confirms the model’s accuracy and reliability.
3.2. Data-Driven Digital Twin and Optimization Logic
Due to the lack of accurate physical models to describe system dynamics, the Simulator module was implemented using two dedicated data-driven models. These models separately simulate the energy behavior of (i) the IT components of the datacenter and (ii) auxiliary subsystems such as cooling infrastructure, HVAC units, lighting, and water pumps. The simulation results are critical for system-wide optimization. Combining these simulations with advanced optimization algorithms such as Sequential Least Squares Programming (SLSQP) [5], GIANT can automatically determine optimal resource configurations. This enables the system to comply with pre-defined energy constraints while maximizing overall productivity—achieving a dual objective of performance and efficiency.
3.3. User Interface and Proactive Interaction
At the top of the architecture, the Application Layer provides an intuitive user interface for operators and administrators. Users can explore model performance on test datasets through interactive visualizations and anomaly diagnostics. The system offers transparency into which features are contributing most significantly to anomalous behavior, thereby supporting component-level troubleshooting and predictive maintenance.
The interface also enables forward-looking simulations: energy and workload forecasts generated by the AI module are passed to the Simulator, which renders a precise projection of the datacenter’s future energy state. If predicted conditions risk violating operational thresholds, the system can activate the optimization module to compute and suggest an alternative configuration in advance. This closed-loop interaction between prediction, simulation, and control underpins GIANT’s proactive management philosophy, reducing intervention latency and preventing inefficiencies before they manifest.
Furthermore, the platform supports “what-if” scenario exploration, enabling operators to assess the impact of potential configuration changes without applying them to the physical system—thus reducing operational risk and improving planning accuracy.
3.4. Proactive Management and Intelligent Power Capping
The adoption of a proactive control approach represents a paradigm shift from traditional reactive datacenter management strategies. While reactive systems respond only after a problem emerges, GIANT’s predictive logic allows operators to anticipate critical events and implement corrective actions in advance. This eliminates the latency inherent in reactive workflows—where detection, diagnosis, and intervention are sequential and time-consuming—and allows the system to maintain optimal operating conditions continuously.
A key enabler of this proactive strategy is intelligent power capping, which limits the maximum power consumption of hardware components in a dynamic and predictive manner. Conventional power capping mechanisms reactively throttle processing power or deactivate components once consumption exceeds predefined limits. This can lead to abrupt performance drops and operational instability—particularly detrimental in HPC environments requiring consistent performance.
In contrast, GIANT enables gradual and forecast-driven power limitation strategies, which maintain system stability and avoid the pitfalls of reactive throttling. As HPC systems scale to exascale dimensions, this intelligent control becomes crucial for sustainable operation.
From an environmental perspective, enhanced energy efficiency directly correlates with reduced carbon emissions per workload unit. GIANT allows datacenters to achieve lower carbon footprints without compromising computational capabilities, supporting the broader transition to sustainable high-performance computing. The integration of AI and digital twin technologies within this framework demonstrates how next-generation datacenter management can combine predictive intelligence with environmental responsibility.
4. Conclusions
The GIANT framework provides an innovative and timely response to the growing challenges of the exascale era, where the increasing complexity and energy demands of datacenters call for fundamentally new management paradigms. By synergistically integrating Digital Twin and Artificial Intelligence technologies within a modular and scalable multi-layer architecture, GIANT offers a concrete and transformative alternative to traditional reactive approaches. Through intelligent power capping strategies and dynamic resource optimization, the system demonstrates that it is possible to achieve seemingly conflicting goals: maximizing performance while minimizing energy consumption and environmental impact.
Funding
This research was funded within the frame of “Progetto: ECS_00000043—Interconnected Nord-Est Innovation Ecosystem Bando a cascata: CODBAN_000297—SPOKE 9MODELS, METHODS, COMPUTING TECHNOLOGIES FOR DIGITAL TWIN” and Progetto bando a cascata: 2D1C2C7ED7. Funded by PNRR MUR—M4C2—Investimento 1.5. Avviso “Ecosistemi dell’Innovazione”
References
- Atchley, S.; et al. Frontier: Exploring Exascale. In Proceedings of the International Conference for High Performance Computing, Networking, Storage and Analysis, in SC ’23; Association for Computing Machinery: New York, NY, USA, 2023; pp. 1–16. [Google Scholar] [CrossRef]
- Borghesi, A.; Bartolini, A.; Lombardi, M.; Milano, M.; Benini, L. Predictive Modeling for Job Power Consumption in HPC Systems. In High Performance Computing; Lecture Notes in Computer Science; Kunkel, J.M., Balaji, P., Dongarra, J., Eds.; Springer International Publishing: Cham, Swithland, 2016. [Google Scholar] [CrossRef]
- Chen, T.; Guestrin, C. XGBoost: A Scalable Tree Boosting System. In Proceedings of the 22nd ACM SIGKDD International Conference on Knowledge Discovery and Data Mining, in KDD ’16; Association for Computing Machinery: New York, NY, USA, 2016; pp. 785–794. [Google Scholar] [CrossRef]
- Hochreiter, S.; Schmidhuber, J. Long Short-Term Memory. Neural Computation 1997, 9, 1735–1780. [Google Scholar] [CrossRef] [PubMed]
- Nocedal, J.; Wright, S.J. Sequential Quadratic Programming. In Numerical Optimization; Springer: New York, NY, USA, 1999; pp. 526–573. [Google Scholar] [CrossRef]
Disclaimer/Publisher’s Note: The statements, opinions and data contained in all publications are solely those of the individual author(s) and contributor(s) and not of MDPI and/or the editor(s). MDPI and/or the editor(s) disclaim responsibility for any injury to people or property resulting from any ideas, methods, instructions or products referred to in the content. |
© 2025 by the authors. Licensee MDPI, Basel, Switzerland. This article is an open access article distributed under the terms and conditions of the Creative Commons Attribution (CC BY) license (http://creativecommons.org/licenses/by/4.0/).
Copyright: This open access article is published under a Creative Commons CC BY 4.0 license, which permit the free download, distribution, and reuse, provided that the author and preprint are cited in any reuse.


