
Submitted:
31 July 2025
Posted:
01 August 2025
You are already at the latest version
Abstract
The demand for advanced technology and superior quality in the automotive industry has become essential. Continuous evolution requires a rigorous analysis of every step taken. Customers demand high performance in technology, design, digitalization, and, of course, quality at a competitive price. To meet these expectations, engineers ensure transparency and trust at every stage of the project, guaranteeing flawless execution. This paper aims to highlight a clear and transparent approach to the 8D analysis method, demonstrating its effectiveness in identifying and solving engineering problems. Furthermore, quality planning and 8D analysis are fundamental pillars of quality management in the automotive industry. To ensure a comprehensive and well-founded approach, the paper combines several research methods: a review of the specialized literature, a hypothetical case study approach, and comparative analysis. The proposed methodology allows for a deep understanding of the concepts addressed, facilitating their applicability in real situations. The main conclusions drawn from the research are that quality planning in an automotive buckle development project has proven to be an essential and complex process, directly influencing the success of the project, the safety of end users, and their satisfaction. The analysis of the implementation of the quality planning process, as previously described, has highlighted several fundamental aspects that must be considered to ensure the success and performance of such a project.
Keywords:
8D analysis
; quality planning
; sustainability
; quality management practices
1. Introduction
The automotive industry has emerged as one of the world’s most prestigious sectors, characterized by varied and complex requirements. The demand for advanced technology and superior quality has become essential. Continuous evolution requires rigorous analysis of step taken. Customers expect high performance in technology, design, digitalization, and, of course, quality at a competitive price. To meet these expectations, engineers ensure transparency and trust at every project stage, guaranteeing flawless execution.
This paper aims to highlight a clear and transparent approach to the 8D analysis method, demonstrating its effectiveness in identifying and solving engineering problems. Operational management and process optimization seek to increase efficiency, improve the quality of industrial products and components, ensure production safety, and boost employee and customer satisfaction. The research goal is to analyze the concepts and techniques of knowledge use in 8D implementation, as well as the integration of knowledge management for product development and manufacturing in the automotive industry.
8D analysis is a structured problem-solving method used to identify the root cause of defects and to implement corrective and preventive actions, thereby contributing to continuous quality improvement [1,2]. Quality planning is an essential function of quality management that sets objectives, resources, and actions required to ensure product and process quality [3]. Within quality planning, 8D analysis can be integrated as a problem-management tool during manufacturing or testing, thus ensuring compliance with standards and customer requirements [4]. Both processes rely on iterative improvement cycles (PDCA - Plan, Do, Check, Act), where planning provides the framework and 8D analysis offers concrete solutions for identified problems [5].
For example, at the Dacia Automobile Plant, quality planning is supported by a high-performance quality management system that includes process standardization and methods such as PDCA and risk analysis; within this system, 8D analysis is used to solve problems detected during manufacturing, such as optimizing the nut-welding operation on the Dacia Logan range [6].
In the automotive industry, Automotive Core Tools (including APQP, FMEA, and 8D) are used for quality planning and problem management, ensuring compliance with the requirements of IATF 16949 standards [7,8,9].
A research example shows how the 8D analysis is applied to identify and solve issues related to project and product quality in industrial development, integrating knowledge management and risk reduction. Thus, quality planning and 8D analysis are complementary, working together to enhance quality, reduce defects, and increase customer satisfaction in the automotive industry.
In recent years, quality management has become an essential pillar of project management success, regardless of the field of activity. In a globalized economy with fierce competition, the quality of a project’s deliverables represents a significant differentiator. From the perspective of quality management theory, quality planning is a critical phase, an integral part of management processes, alongside resource, cost, and risk planning. Without rigorous planning, projects may face difficulties such as additional costs, missed deadlines, or beneficiary dissatisfaction. Moreover, increasingly strict requirements for sustainability and compliance with international regulations have emphasized the need for clear and well-documented processes for quality management.
Sustainability in the automotive industry involves integrating practices that reduce environmental impact and optimize resource use throughout the product lifecycle. In the context of quality and problem-solving, sustainability is reflected in:
- Reducing waste by identifying and quickly correcting defects (e.g., a defective buckle detected and efficiently remedied);
- Implementing energy-efficient processes and using technologies that minimize resource consumption;
- Promoting sustainable design and green mobility (e.g., recyclable components, reducing emissions in manufacturing).
Automotive companies adopt sustainability strategies to meet regulatory requirements, increase competitiveness, and satisfy environmentally conscious customer demands.
The connection between the three concepts:
8D analysis contributes to quality improvement and defect reduction, thus supporting the objectives of quality planning and sustainability. Efficient quality planning helps prevent problems from occurring, while integrating sustainability principles ensures that the implemented solutions are effective not only economically, but also environmentally and socially.
This paper highlights the applicability of the 8D method in the automotive industry and details the essential steps for process optimization. Key variables in data management and collection, as well as in handling customer complaints, are identified. In the first stage, the customer’s request is promptly addressed through an ERA analysis. Subsequently, the SPD method is used to clearly identify and define the symptom or problem. Once the issue is established, various tools are applied to assess the degree of nonconformity and identify the root cause, using Ishikawa analysis, Pareto diagrams, and graphical evidence based on data obtained from clients and dealers. The paper also aims to contribute to better understanding the complexity of the quality planning process by addressing both theoretical and practical aspects. To achieve this, the following specific objectives are formulated:
- ➢
- Identifying the role of quality in project success, analyzing how quality planning influences project outcomes, considering economic, technical, and organizational dimensions;
- ➢
- Analyzing relevant international standards, with ISO 9001 and PMBOK used as benchmarks for defining best practices in the field;
- ➢
- Studying a generic example by constructing a case study that reflects a real-world scenario, applicable to various industries, to illustrate the quality planning process;
- ➢
- Identifying common challenges—such as lack of resources, resistance to change, and poor communication—which are discussed and addressed from the perspective of the specialized literature.
By achieving these objectives, the paper will provide both theoretical and practical contributions, being useful to project managers and researchers in the field.
2. Literature Review
Literature Review for the 8D Analysis Method
The 8D Method (“Eight Disciplines”) is a structured, team-oriented approach for solving recurring problems, with a focus on identifying root causes and implementing corrective and preventive actions. It was initially developed in the automotive industry but has been widely adopted in various sectors, including manufacturing, healthcare, services, and public administration [10,11,12].
Structure of the 8D Method
The 8D method involves going through eight main steps:
- D0: Planning – Defining the plan of approach for the problem;
- D1: Team Formation – Selecting a multidisciplinary team with relevant expertise;
- D2: Problem Definition & Description – Detailed problem analysis using techniques such as 5W2H (who, what, where, when, why, how, how much);
- D3: Implementation of Containment Actions – Temporary measures to limit the impact of the problem;
- D4: Identification of Root Causes – Use of analysis tools such as “5 Whys” and the cause-effect (Ishikawa/Fishbone) diagram;
- D5: Selection and Verification of Permanent Corrections – Validation of the proposed solutions;
- D6: Implementation and Validation of Corrective Actions – Putting the solutions into practice and evaluating their effectiveness;
- D7: Prevention of Recurrence – Amending procedures to prevent recurrence of the issue;
- D8: Team Recognition – Formal acknowledgment of the collective effort [13].
Results and Demonstrated Benefits in the Literature
Reduced Problem-Solving Time: Case studies in the automotive and manufacturing industries show that after implementing the 8D method and staff training, the time required to identify and resolve problems has significantly decreased in subsequent years, leading to resource savings and reduced scrap rates [14,15,16].
Improved Product and Process Quality: Implementing 8D has led to decreased defects, increased customer satisfaction, and optimized internal processes [17,18].
Systematic and Collaborative Approach: The method promotes teamwork and the use of statistical and analytical tools, increasing the efficiency and robustness of identified solutions [19,20].
Identified Limitations and Challenges
- Need for Training: The effectiveness of the method depends on the team’s training level and discipline in following the steps [21].
- Limited Applicability without Management Support: Long-term success requires active management involvement and the integration of 8D into the organizational culture [22].
- Empirical Evidence: Some of the literature highlights a lack of extensive empirical studies, with much of the body of work focusing on process description and less on statistical result analysis [23].
Conclusion: The 8D method is recognized as an effective tool for solving complex and recurring problems, with proven results in reducing defects and increasing process efficiency. The literature emphasizes the importance of rigorous step-by-step application, team training, and managerial support to fully harness the benefits of this method [24,25,26].
Literature Review: Quality Planning and 8D Analysis in the Automotive Industry
Quality planning is an essential component of quality management in the automotive industry, aimed at ensuring that products and processes conform to customer requirements and international standards. The literature highlights the following key aspects:
- Standardization and Systematic Approach: Quality planning processes are structured based on PDCA (Plan-Do-Check-Act) and SDCA (Standardize-Do-Check-Act) cycles, ensuring continuous improvement of product and service quality [27];
- Core Tools: Essential tools used in quality planning include APQP (Advanced Product Quality Planning), FMEA (Failure Mode and Effects Analysis), MSA (Measurement System Analysis), PPAP (Production Part Approval Process), and SPC (Statistical Process Control) [28];
- Integration of Strategic Objectives: The quality plan is aligned with organizational strategy, deployed at all operational levels and supported by cross-functional actions for continuous improvement [29];
- Management and Multidisciplinary Team Involvement: The success of quality planning depends on active management involvement and collaboration between departments, as well as the ongoing training and education of personnel [30].
8. D Analysis in the Automotive Industry
The 8D (Eight Disciplines) method is recognized as one of the most effective approaches for solving recurring and complex problems in the automotive sector. Key findings from the literature include:
- Origin and Evolution: 8D was initially developed by Ford Motor Company and became a standard approach in the automotive industry for systematically addressing critical nonconformities [31];
- 8D Process Structure: The method involves eight disciplines, from initial planning and team formation to root cause identification, corrective action implementation, and prevention of recurrence. An additional stage, D0 (planning), is considered essential for process success [32];
- Demonstrated Benefits: Studies show that 8D implementation leads to reduced problem-solving times, fewer defects, higher customer satisfaction, and optimized internal processes [33];
- Complementary Tools: In practice, the 8D method is often used alongside other quality tools such as Six Sigma, FMEA, and statistical analysis to ensure a robust and efficient approach to technical and organizational issues [34];
- Challenges and Limitations: The literature points out the need for team training, management involvement, and integrating 8D into the organizational culture to achieve sustainable results [35].
Literature Synthesis and Current Trends
- Integration of Core Tools: The automotive industry uses an integrated set of tools for quality planning and management, and 8D is a key part of this ecosystem [36];
- Focus on Continuous Improvement: Both quality planning and 8D analysis are based on the principle of continuous improvement, aiming to prevent defect recurrence and increase competitiveness [37];
- Recent Case Studies and Research: Recent studies highlight the successful implementation of the 8D method for solving specific issues (e.g., automotive component defects, durability testing optimization) and its role in developing a quality- and innovation-oriented organizational culture [38].
Conclusion: Quality planning and 8D analysis are fundamental pillars of quality management in the automotive industry. The literature underlines the importance of a systematic approach, the use of correlated tools, and involvement at all organizational levels to achieve operational excellence and customer satisfaction.
3. The Concept and Methods
3.1. The Contribution of 8D Analysis to Quality Planning and Sustainability in the Automotive Industry
- ➢
- 8D Analysis and Quality Planning
Integration into Quality Management: The 8D method is an essential tool in quality planning, used for identifying, analyzing, and eliminating the root causes of recurring problems in automotive production processes [39,40].
Structured Approach: Through its clear steps—from problem definition, team formation, and root cause analysis to the implementation and validation of corrective actions—8D ensures a systematic and well-documented resolution of nonconformities, enabling continuous improvement of processes and products [41].
Prevention of Recurrence: One of the key outcomes of the 8D method is the modification of procedures and management systems to prevent problem recurrence, thereby strengthening long-term quality control [42].
Synergy with Other Tools: 8D is often used alongside tools such as FMEA, SPC, or Six Sigma, contributing to robust quality planning and the achievement of performance and reliability objectives [43].
- ➢
- 8D Analysis and Sustainability
Reducing Waste and Scrap: By quickly identifying and correcting defect causes, the 8D method helps to reduce material losses and resources consumed in remediation processes, thus supporting sustainability objectives [44].
Optimizing Resource Use: Implementing permanent corrective actions and preventing defect recurrence leads to more energy-efficient processes and reduced raw material consumption.
Improving Product Reliability: By increasing the quality and reliability of automotive components, the need for repairs and replacements is reduced, which in turn diminishes negative environmental impact [45].
Supporting an Organizational Culture Oriented Toward Continuous Improvement: 8D fosters collaboration, organizational learning, and responsibility for quality and the environment, fundamental elements for long-term sustainability [46].
- ➢
- Demonstrated Benefits in the Automotive Industry
- Reduced costs related to defects and warranties
- Increased customer satisfaction through more reliable products
- Creation of a lessons-learned database, useful for preventing future problems
- Enhanced team ability to efficiently manage nonconformities and make data-driven decisions
Conclusion: 8D analysis is a pillar of quality planning and a catalyst for sustainability in the automotive industry, ensuring not only the efficient resolution of problems, but also their prevention, resource optimization, and the development of an organizational culture oriented toward operational excellence and environmental responsibility.
3.2. Methodology Used
To ensure a comprehensive and well-founded approach, this paper combines several research methods:
- ✓
- Literature Review: A detailed analysis of relevant materials was conducted, including academic works, scientific articles, and internationally recognized standards such as ISO 9001 and PMBOK. This review provides a solid theoretical foundation and outlines the main concepts related to quality planning;
- ✓
- Hypothetical Case Study Approach: A generic scenario, representative of various fields, was created in order to analyze the quality planning process in a practical context. This case study covers all relevant stages, from requirements identification to performance evaluation;
- ✓
- Comparative Analysis: Within the study, best practices identified in the literature are discussed and compared to the challenges and solutions presented in the generic example. The proposed methodology enables a deep understanding of the addressed concepts, facilitating their applicability in real situations. At the same time, the work offers a generalized model that can be adapted according to the specific requirements of a project.
Choosing the Case Study Method
The case study method was chosen because of its relevance for in-depth, contextualized analysis of a specific process—in this case, quality planning in projects. The case study enables detailed exploration of either a hypothetical or real situation, focusing on understanding the complexity of the involved processes and identifying challenges and solutions. This method is suitable for research aimed at applied aspects, such as:
- -
- Testing Theoretical Models: The case study allows for the application of concepts from the literature in a practical context;
- -
- Identifying Problems and Solutions: By simulating a generic project, challenges encountered in quality planning can be analyzed and solutions can be proposed.
To ensure the general relevance of the conclusions, the hypothetical case study was designed to be applicable across multiple industries (construction, IT, manufacturing). For example, in the case of a software application, quality may be defined by a low number of bugs and adherence to delivery deadlines, while for a commercial building, quality is defined by compliance with safety regulations and the client’s aesthetic requirements.
3.2.2. Description of the Tools Used
Document Analysis
Document analysis was employed to understand the concepts, standards, and tools used in quality planning. The sources examined include:
- ISO standards (e.g., ISO 9001): These provide a basis for defining and assessing quality requirements;
- Manuals and best practice guides (e.g., PMBOK): These were analyzed to identify relevant processes and tools.
- Previous studies: Published research offered perspectives on challenges and solutions applied in real projects.
For example, the PMBOK guide suggests the use of benchmarking to compare a project’s performance with industry best practices—an instrument that will be illustrated in the case study.
Hypothetical Interviews
To simulate the validation of proposed solutions, hypothetical interviews were conceived with three categories of experts:
- Project managers: to understand the practical perspective on challenges in quality planning.
- Quality control specialists: to identify preferred methods for quality monitoring and evaluation.
- Stakeholders: to assess how project deliverables’ quality and value are perceived.
The interviews included open-ended questions such as: What are the most frequent obstacles encountered in implementing the quality plan? What tools do you consider most effective for defect prevention? How do you evaluate the success of a project from a quality perspective?
3.2.3. Research Limitations
As with any methodological approach, this research presents several limitations that should be considered:
Generalizability of Conclusions
The case study is hypothetical, which limits the direct applicability of the conclusions to real projects. For example, the specifics of an automotive project may differ significantly from those of an IT project, even if both follow similar quality planning principles.
Subjectivity of Hypothetical Interviews
The hypothetical interviews reflect general expert perspectives but cannot fully capture the complexity of real-life situations. This may influence the validity of the proposed solutions.
Limited Access to Real Data
For the purposes of the case study, although real data from a specific project was used, the analysis is limited by a lack of additional concrete examples from documentation or project reports.
Lack of Quantitative Evaluation
The research focused on qualitative methods, without detailed statistical analysis of the results. For example, the cost of quality was not directly evaluated, which reduces the ability to quantify the benefits of quality planning.
3.3. Example of a Gantt Chart for Quality Planning in an Automotive Project (Automotive Buckle)
A Gantt chart is an essential tool for planning and monitoring activities in automotive projects, including the development and quality assurance of components such as automotive buckles. It allows for a clear visualization of project phases, responsibilities, dependencies, and deadlines, facilitating team coordination and compliance with quality requirements. The main stages of quality planning for an automotive buckle project, Figure 1.
Benefits of Using a Gantt Chart
- -
- Project Visibility: All team members clearly see the steps, responsibilities, and deadlines;
- -
- Identification of Dependencies: The chart makes it easy to observe activities that depend on each other and which may cause delays;
- -
- Progress Monitoring: Regular updates enable quick correction of deviations from the plan;
- -
- Improved Collaboration: Facilitates communication among design, quality, production, and management teams.
This example is simplified but can be detailed and expanded to include more activities. Such a chart helps the team understand specific steps in the quality planning process and track progress visually.
3.4. Example of a Quality Requirements Matrix
A quality requirements matrix is useful for organizing and visualizing the specific requirements that must be fulfilled within the project, Figure 2. It can include standards related to safety, reliability, and performance for auto components such as automotive buckles.
This matrix can be extended to include other specific requirements for automotive components. It helps the project team clearly understand quality expectations and standards to be followed. For research methodology in the automotive field, the quality standards that should be included are those that ensure product and process compliance with customer requirements, legal regulations, and international best practices. These standards are classified according to their level of application (national, European, international) and by the type of product or service.
This matrix can be extended to include other specific requirements for automotive components. It helps the project team clearly understand quality expectations and standards to be followed. For research methodology in the automotive field, the quality standards that should be included are those that ensure product and process compliance with customer requirements, legal regulations, and international best practices. These standards are classified according to their level of application (national, European, international) and by the type of product or service.
4. Case Study: Quality Planning in the Automotive Buckle Manufacturing Process - 8D Analysis
This subsection presents the applicability of 8D in the automotive field and the delineation of stages for process optimization. The best variables in the process of managing and collecting data and customer complaints are identified. In the first phase, the customer’s request is urgently addressed through an ERA analysis. SPD is used to identify and define the symptom/problem. Once the problem is identified, tools were used to measure the degree of defectiveness, identify and verify the root cause using Ishikawa analysis, Pareto, and graphical evidence based on data collected from customers and dealers. 8D Analysis (Eight Disciplines Problem Solving) is a structured methodology used to identify, correct, and prevent recurring problems in industrial and business processes.
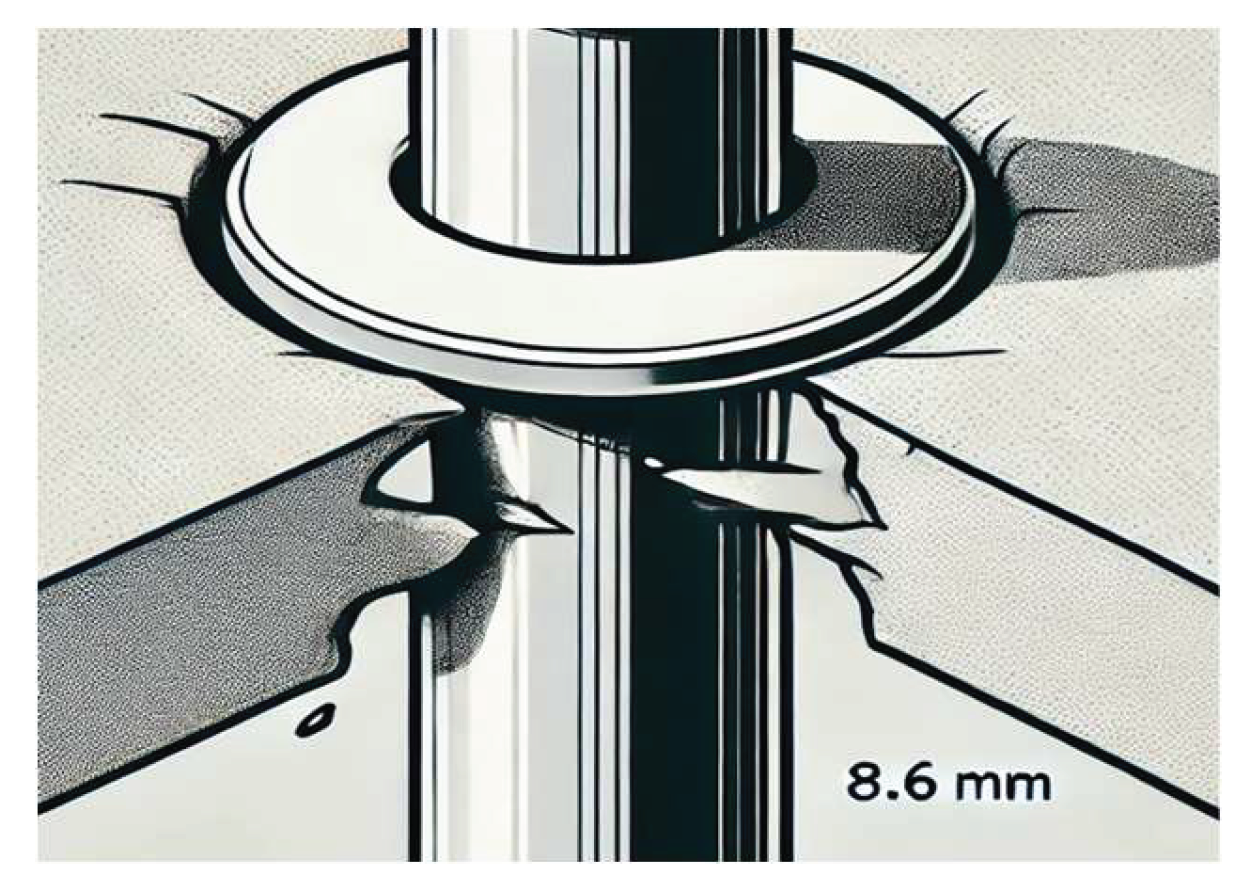
The problem symptom generates an unwanted effect and was identified using necessary information regarding functionality effects and extended ones. On May 16, a customer reported insufficient riveting on a buckle compared to the required standard for seat belt assembly, on part number 63266666 E – buckle subassembly for rear, exterior. The rivet diameter is smaller than the standard specification, non-conforming dimension (NOK): 8.6 mm versus conforming dimension (OK): 12.3 mm [47].
An urgent response action was developed to protect the customer and initiate the 8D process.
Specifications and Steps of the 8D Method:
D1 - Team Formation
The 8D approach requires the formation of a well-organized team, equipped with the knowledge and resources necessary to identify the root cause of the problem. Members of this team must be familiar with the process, as well as with the specific tools and techniques to efficiently solve the identified problem. An interdisciplinary team with relevant expertise for the problem is assembled. The responsibilities of each member are defined.
a. Objective:
- A team of experts is formed who have the necessary knowledge about the product, process, and problem;
- The responsibilities of each member are defined;
- It is ensured that all team members have a common understanding of the 8D methodology.
b. Selection of Team Members:
The team must be formed of people with relevant competencies, including:
- Quality manager – expert in defect analysis and quality requirements;
- Process engineer – understands the production flow and can identify potential causes;
- Product/design engineer – knows technical specifications and can verify if the problem is design-related;
- Operators and technicians – have practical experience with the product and can provide information about encountered problems;
- Supplier manager (if applicable) – analyzes if the problem comes from the supply chain;
- Manager or team leader – coordinates the process and ensures methodology compliance.
c. Team Structure and Organization:
- A team leader is designated, responsible for managing the investigation and facilitating discussions;
- Clear communication channels are established between members;
- Necessary resources for investigation are defined (time, equipment, data access, etc.);
- Regular meetings are planned to monitor analysis progress.
d. Tools Used in D1:
- RACI Matrix (R (Responsible) – the person who actually performs the task or activity, A (Accountable) – the person who has final responsibility and approves the result, C (Consulted) – people who provide consultation or expertise, being consulted during the process, I (Informed) – people who need to be informed about the progress and results of the activity) – helps clarify the responsibilities of each member;
- Skills map – to ensure a well-balanced team;
- Communication plan – establishing meeting and reporting frequency.
e. The Importance of a Well-Structured Team:
When the team is not well-formed, problems can arise: lack of necessary expertise → difficulties in identifying the cause, process delays → inefficient or incomplete solutions, lack of collaboration → corrective measures are not implemented correctly.
Therefore, the following team is formed: Engineer who interfaces with the customer, quality engineer, manufacturing process engineer, maintenance engineer, maintenance and manufacturing coordinator who is also the team leader.
D2 - Problem Description
a. Purpose of D2:
- To describe the problem clearly and in detail;
- To eliminate assumptions and base the analysis on concrete data;
- To establish the impact of the problem on the product, process, and customer.
b. Problem Identification:
In a clear manner, using techniques such as “5W2H” (Who, What, Where, When, Why, How, How Much), the team must systematically answer fundamental questions related to the problem, thus facilitating the identification of the root cause and establishing efficient corrective actions. The 5W2H method, applied for a complete and objective description, answers the following, Figure 3:
c. Data Collection and Analysis
To better understand the problem, detailed information is gathered:
- Production data: Lots, serial numbers, involved suppliers;
- Process parameters: Temperature, pressure, operating time, etc.;
- Historical data: Previous similar problems, corrective actions applied;
- Customer complaints: Feedback and defect reports.
d. Tools Used in Stage D2
- Pareto Diagram: To identify the most frequent cause;
- Ishikawa (Fishbone) Diagram: To analyze possible causes;
- Check Sheet: For systematic data collection;
- Photos and samples: To clearly illustrate the defect.
For the case study under discussion, in the D2 problem description we have:
- Report date: 16.05.2023
- Client: Fisker Inc.
- Supplier: Norma (an industrial supplier specialized in components for various industries)
- Problem: Insufficient riveting on the buckle, delivered by Autoliv Rovinari (Romania Rovinari Seatbelts – RRS), and Norma for seatbelt assembly.
- Part number: 63266666 E – rear buckle subassembly, exterior.
- Affected model: Fisker 2332
- Production date: 30.03.2023 (manufactured in the plant)
- Detection: The problem was discovered by Fisker
- Defect description: The rivet diameter was smaller than the standard specification, Figure 4.
- NOK (nonconforming) dimension: 8.6 mm / OK (conforming) dimension: 12.3 mm
- Date of part receipt in the plant: 24.05.2023
- Confirmation of NOK dimension in the plant: 8.57 mm
D3 – Immediate Corrective Actions
Temporary measures are implemented to minimize the impact of the problem on production and customers, and to stop the defect from spreading in the process until the root cause is identified and eliminated. This ensures that the problem does not worsen before a complete solution is found.
Containment actions are temporary steps taken to prevent the delivery or use of defective products until the root cause is found and eliminated:
Identification and Isolation of Nonconforming Parts
- Parts produced on 30.03.2023 were isolated and blocked at the supplier;
- Visual and dimensional inspection was performed to separate NOK parts from OK parts;
- Previous and subsequent batches were checked to assess if the issue was widespread.
Notification of Involved Parties
Norma was informed by Fisker about the detected issue. The notification was received and an action plan was initiated.
Supplementary Inspections and Temporary Checks
- Dimensional measurements on suspect parts:
- NOK dimension: 8.6 mm (confirmed 8.57 mm) / OK dimension: 12.3 mm;
- Implementation of a 100% filter for parts in stock;
- Additional checks in production to prevent new defect occurrences.
Stopping the Affected Deliveries
- Parts in stock and in transit were blocked until a solution was identified;
- Ford Saarlouis was notified to take action for parts already assembled.
Additional Short-Term Controls
- Adjustment of the riveting equipment parameters to improve pressure;
- Training operators to visually inspect the rivet before use;
- Use of a checking template for more precise measurements.
Validation of the Effectiveness of Containment Actions
- Continuous monitoring of parts in production;
- 100% visual and dimensional inspection to prevent the delivery of nonconforming products;
- Customer confirmation that temporary actions are effective.
D4 – Identification of the Root Cause
Applying the 5 WHY Method:
Problem identified: The rivet has a smaller diameter than specified, which reduces mechanical strength.
- Why does the rivet have a smaller diameter?
- Because the riveting process does not apply enough pressure.
- Why does the riveting process not apply enough pressure?
- Because the equipment settings are incorrect.
- Why are the equipment settings incorrect?
- Because proper calibration of the riveting force was not performed.
- Why was calibration of the riveting force not performed correctly?
- Because there is no clear standard for regular checks.
- Why is there no clear standard for regular checks?
- Because the preventive maintenance procedure is incomplete or not followed.
Identified Root Cause:
Lack of a strict calibration and maintenance procedure for the riveting equipment.
The actual root cause is then confirmed by tests and data analysis. After reviewing the process and inspecting the equipment:
- It was confirmed that the riveting equipment settings were incorrect, which led to inadequately deformed rivets and thus a smaller final diameter;
- Additionally, the lack of regular inspections allowed this problem to go undetected for some time.
Conclusion: The main cause of the problem is defective calibration and lack of periodic maintenance of the riveting equipment. This led to insufficient riveting, resulting in parts with a smaller diameter that could not withstand the required forces, see Figure 5.
The chart clearly shows that the rivet with a diameter of 8.6 mm (NOK) has significantly lower strength compared to the 12.3 mm (OK) rivet. The strength is proportional to the cross-sectional area of the rivet, which explains the large difference in capacity between the two variants. This confirms that the smaller rivet is not able to withstand the same forces, which can lead to assembly failure.
Moreover, the process is completely incapable, with a very low Cpk. Most parts are below the minimum allowable limit (12.3 mm), resulting in a high percentage of rejects, see Figure 6.
Possible solutions: Increasing the process average and reducing variation to bring the distribution into the acceptable area.
Bolt shear stress:
- NOK bolt diameter: 8.6 mm;
- Maximum acceptable force: 20 kN;
- Measured force distribution (realistic example for a non-capable process);
- LSL (Lower Specification Limit) and USL (Upper Specification Limit) for capability.
Figure 7.
Tearing under stress.
A normal distribution of the measured forces is considered, and we will calculate Cp and Cpk:
Cp = (USL - LSL)/6σ; Cpk = min ((USL - μ)/3σ, (μ - LSL)/3σ)
where: - μ is the mean of the measured forces;
- σ is the standard deviation.
The calculation results show that this process is NOK (not capable):
Cp = 0.67 → The variability of the process is too high compared to specifications. A capable process must have Cp ≥ 1.33.
Cpk = 0.67 → The mean is too close to LSL or USL, which confirms that the produced parts 598 are not reliable;
Probability of failure = 97.7% → Almost all produced pieces have forces below 20 kN, which is unacceptable.
This result demonstrates that the smaller diameter rivet cannot provide the minimum necessary force, confirming the conclusions from the previous chart.
Description of the Riveting Process
The riveting process illustrated in the image is carried out by an orbital riveting machine, which ensures the controlled deformation of the rivet to fix the assembled components, Figure 8.
1. Key components of the process:
- Riveting controller, the electronic equipment that controls the parameters of the riveting process, such as force, duration, and position.
- Orbital assembly group, the physical mechanism that applies the necessary pressure and movement for the deformation of the rivet.
- Riveting station, the structure where the parts are positioned and where the actual process takes place.
2. Stages of the riveting process:
a) Positioning the parts – The components that need to be fixed are placed in the supporting device;
b) Placing the rivet – The rivet is inserted into the hole of the components.
c) Activating the riveting group – The system applies controlled pressure to the end of the rivet.
d) Controlled deformation of the rivet – The rivet is pressed and shaped in such a way as to create a solid joint.
e) Parameter verification – The riveting controller monitors the process and confirms whether the force and deformation are within acceptable limits.
A correct riveting process must ensure that the rivet is sufficiently deformed to provide a secure joint without damaging the components.
D5 – Development and Selection of the Permanent Solution
At this stage, permanent corrective measures were established to eliminate the root cause. The feasibility and effectiveness of the proposed solutions are evaluated.
The D5 stage includes:
- Evaluation of possible solutions – analyze various corrective action options, taking into account costs, required resources, and the impact on the process;
- Implementation of the corrective action – after selecting the solution, ensure that everyone involved in the process understands and follows the new procedure or practice;
- Monitoring the effectiveness of the corrective action – continuously assess whether the corrective measure has had the desired impact and if the problem has truly been resolved.
Proper implementation of this stage is essential for the success of the 8D process, because without effective corrective actions, the problem may recur.
Identification and selection of solutions:
- The collected data is analyzed to understand the root cause of the problem;
- Effective solutions are chosen to eliminate or reduce the impact of the defect.
2. Implementation of corrective actions:
- Process parameters are defined and adjusted based on experimental analysis;
- Specifications are set according to clear objectives, such as stroke depth (S), process time (T), applied force (F), height after deformation (H), and total length before deformation (U).
In Figure 9 the comparison is shown between the initial parameters (at the time the complaint was reported) and those adjusted after analysis.
Verificarea eficienței măsurilor:
-Se analizează rezultatele pentru a vedea dacă schimbările au rezolvat problema;
- Se asigură că soluțiile implementate nu generează efecte negative în alte părți ale procesului.
D6 - Implementation and Validation of the Solution
The permanent solution is implemented and its impact is monitored. The effectiveness of the solution is verified through tests and comparisons with initial data.
- Verification of Corrective Action Implementation:
After corrective actions have been implemented (in D5), the first step is to ensure that these measures have been carried out correctly and completely. The problem-solving team must inspect whether all actions are performed according to the established plan. It is also important to check if the resources and people involved have followed the defined procedures and instructions.
Examples of specific actions:
- Checking that work instructions have been updated;
- Evaluating implemented process changes (e.g., new quality control steps or changes in the production flow);
- Reviewing the training plan and assessing whether employees have been properly trained.
- 2.
- Measuring the Effectiveness of the Corrective Action
Once the corrective measure has been implemented, it is essential to measure its impact. The team should establish performance indicators to evaluate whether the corrective measure is effective. These measurements should be objective and quantifiable.
Examples of performance indicators:
- Reduction in the number of similar incidents that occurred in the past;
- Decrease in the level of variability in the production process;
- Improvement in quality test results;
- Reduction in customer complaints.
It is important to carry out these measurements over a sufficiently long period to observe trends and to ensure that the corrective measure has the desired effect. Sometimes, corrective actions may require a longer period to yield clear results.
- 3.
- Testing the Sustainability of the Corrective Measure
Another part of D6 involves testing the long-term sustainability of the corrective measure. Corrective actions should not only resolve the immediate issue, but must also work effectively in the future, maintaining process stability and preventing recurrence. Testing for sustainability involves continuously monitoring the process and maintaining constant vigilance to ensure that the measure does not have unforeseen negative long-term effects.
Examples of activities for sustainability testing:
- Conducting periodic process audits to check ongoing compliance;
- Ongoing monitoring of process performance for any fluctuations or new issues;
- Collecting continuous feedback from operators or employees involved in implementing the corrective measure.
- 4.
- Documentation and Reporting of Results
Once the corrective measure has been verified and validated, the team must document all results obtained. This information will be useful in the future to ensure process transparency and to create a history that can help identify potential improvements in the case of similar problems.
Documentation should include:
- Details about the corrective measure implemented;
- Data and results of effectiveness measurements;
- Feedback from the teams involved in implementation;
- Analysis of sustainability and possible future adjustments.
- 5.
- Correcting or Adjusting the Corrective Measure, If Necessary
If the corrective actions have not proven effective or have not achieved the desired impact, the team must take further steps. These adjustments may include reviewing the initial corrective measure, making additional changes, or implementing an alternative action plan. It is important to avoid temporary or superficial solutions, as these could only postpone the problem.
- 6.
- Communication with Stakeholders
Finally, the team must communicate all results and actions taken to stakeholders (including customers, suppliers, and internal departments), to ensure transparency and reconfirm that the problem has been fully resolved. This helps strengthen trust in the organization’s ability to efficiently manage quality issues.
The D6 step of the 8D analysis is crucial to ensure that corrective actions are not only implemented, but will also remain effective in the long term. It is important for problem-solving teams to be committed to continuous verification of these measures and be ready to adjust the process if necessary. Through this step, the 8D process is concluded, and the solution becomes sustainable and continuously applicable, thus improving the quality and reliability of processes.
D7 – Preventing Recurrence of the Problem
Procedures, documentation, and training were modified to prevent recurrence of the problem. Additional preventive measures are implemented (e.g., Poka-Yoke, FMEA).
Purpose: FMEA (Failure Mode and Effects Analysis) is carried out to determine any remaining risks. The multidisciplinary team is involved to propose robust solutions. Other locations and similar processes are reviewed to extend preventive measures.
Implementation of Preventive Actions:
To ensure the effectiveness of the measures, it is necessary to allocate resources (time, people, budget); define clear responsibilities (who implements each measure?); set a completion deadline; and monitor progress to avoid delays.
Concrete example of a preventive action:
- Problem: The diameter of a rivet does not meet specifications.
- Root cause: Die wear in the manufacturing process.
- Corrective action (D6): Replacement of the worn die.
- Preventive action (D7): Introduction of a predictive maintenance plan so that the die is replaced before defects occur.
Validation and Effectiveness of Preventive Actions
Once implemented, preventive measures must be validated to confirm that they are effective and sustainable.
Validation example:
The process Cpk is analyzed after implementing the measures. If it remains above 1.33 for three consecutive months, the preventive measure is considered effective.
Standardization and Extension of Preventive Measures
Example of extension:
If a rivet problem was resolved on one production line, the measure can be applied to other lines or factories to prevent the issue elsewhere.
Documentation and Closure of D7 Stage
After validating the solutions, the official documentation for D7 is completed:
- Report on actions implemented and their effectiveness;
- Records of data demonstrating process improvement;
- Revised control plans;
- Feedback from production and quality teams.
Conclusion: The D7 stage is an essential step in the 8D analysis because it prevents recurrence of the problem. If not implemented correctly, the issue may reappear, causing production losses, additional costs, and customer dissatisfaction.
Specific actions implemented in D7:
- Review of the P-FMEA (Process Failure Mode and Effects Analysis), taking into account the reported issues. Updating the PLM database to reflect the new revision. Responsible: process engineer, deadline: week 24.
- Updating the control plan to include the defined actions and updating the P-FMEA. Updating the PLM database with the new revision. Responsible: quality engineer, deadline: week 24.
- Issuing a Global Quality Alert for the rivet problem—a Global Quality Alert is created and recorded for the identified issue in the riveting process (item no. 237 / record no. 10922 in the QA database). Responsible: quality engineer, status: completed.
- Implementing a global Read Across for the review of the riveting process, ensuring extension of preventive measures at a global level to avoid recurrence in other locations or similar processes. Responsible: process engineer, deadline: week 23.
Conclusion: The actions implemented in D7 ensure effective prevention of recurrence through:
- -
- Updating process documentation (P-FMEA, Control Plan)
- -
- Distribution of information via a Global Quality Alert
- -
- Standardization and extension of measures at a global level (Read Across)
D8 – Team Recognition and Lessons Learned
The contribution of the team is recognized, and lessons learned are documented. Best practices are implemented in other parts of the organization.
Purpose: To verify the effectiveness of the implemented solutions, document conclusions and lessons learned, recognize the team’s efforts, and disseminate knowledge.
- Confirmation of Problem Elimination:
Before closing the 8D analysis, it must be checked if the problem has been completely eliminated and has not reoccurred. This is done using:
- Statistical data – Monitoring key indicators (e.g., defect rate, Cpk, number of complaints);
- Internal audits – Checking the implementation of procedures and process control;
- Feedback from the production and quality teams – Confirming the stability of the process;
If the problem persists, the analysis is resumed and measures from D6 and D7 are adjusted.
- 2.
- Final Documentation and Standardization of Improvements
All implemented actions must be officially documented to prevent the recurrence of the problem in other products, processes, or locations.
Items included in the final documentation:
- The final 8D report, with a description of the problem, root cause, and implemented actions
- Updated P-FMEA and Control Plan, reflecting new risks and preventive measures
- Organizational learning by extending solutions to other processes (Read Across)
For example: If a riveting process was optimized to prevent defects, this know-how is transferred to other production lines using the same technology.
- 3.
- Team Recognition and Lessons Learned:
Emphasis is placed on motivating the team and recognizing their efforts. Ways to recognize contributions include:
- Official acknowledgment at an internal meeting;
- Certificates of appreciation or symbolic awards;
- Communication within the organization via the internal newsletter, appreciation email, or internal platforms.
- 4.
- Official Closure of the 8D Analysis
The team and management confirm that all actions have been implemented and validated. The 8D report is archived in internal systems (PLM, QA database). The issue is officially closed, and the team can focus on further improvements.
In conclusion: The D8 stage is a critical step for process stabilization, knowledge sharing, and recognition of the team’s contribution. A well-implemented D8 stage ensures the problem is definitively eliminated, lessons learned are integrated into processes, and the team is motivated for future improvements.
Main advantages of the 8D method:
- Identifies and eliminates the root cause of problems;
- Reduces costs associated with defects and repairs;
- Improves product and process quality;
- Increases customer satisfaction and organizational trust;
- Helps develop a culture based on continuous improvement.
5. Results and Discussion
5.1. Analysis of the Implementation of Quality Planning
The implementation of quality planning was a critical and continuous process throughout the project. This stage not only ensured compliance with legal and safety requirements but also contributed significantly to the improvement of manufacturing processes, cost optimization, and the creation of a product that meets user expectations.
5.1.1. Initial Planning
In the initial phase of the project, the quality planning process was structured on several levels, including both quality management and technical activities for testing and product prototyping. After the general quality requirements were established, process monitoring procedures and quality control were implemented throughout the entire product lifecycle.
Quality planning was supported by the following essential activities, Figure 10:
5.1.2. Implementation and Monitoring
After the completion of planning, its implementation was an essential phase in ensuring the quality of both the development process and the final product. The quality management team closely monitored each stage of development to ensure that all quality requirements were met.
- Monitoring of impact and reliability tests: Impact tests with simulated vehicles were implemented to evaluate the behavior of the buckles under extreme conditions. All tests were recorded and analyzed to identify any deficiencies or areas needing improvement;
- Implementation of modern computer-aided manufacturing technologies (CAQ, SPC): These led to increased process capability for automotive components, including buckles, by reducing variation and optimizing process parameters;
- Virtual analysis and testing of the minimum functional force of automotive buckles: The use of multi-axial simulations and real operating conditions enabled the validation of improvements and rapid identification of potential weaknesses in the process.
5.2. Benefits of Improved Process Capability Analysis
- Reduction of scrap/rejects and quality-related costs;
- Increased reliability and customer satisfaction;
- Continuous process improvement through monitoring and statistical feedback;
- Compliance with the strict requirements of the automotive industry and international standards (e.g., IATF 16949).
Discussion: The analysis of the capability of an improved process for automotive buckles is an essential tool for ensuring product quality and competitiveness. Through continuous monitoring, the use of SPC, and statistical validation of improvements, companies can guarantee that their processes consistently deliver products that meet the specifications and expectations of the automotive market.
Data were generated with a new mean of 22.5 kN and a smaller standard deviation (0.5 kN) to reduce process variation, Figure 11.
Thus:
- The red line on the left (LSL - 20 kN) is the lower specification limit (LSL). The process must not produce values below this limit;
- The red line on the right (USL - 25 kN) is the upper specification limit (USL), representing the maximum acceptable value;
- The green line (the process mean) indicates the mean of the measured forces after optimization (approximately 22.5 kN), which is more centrally located with respect to the specification limits.
An improved Cpk (> 1.33) is noted, due to decreased variability and better centering of the process. Cpk has increased beyond 1.33, which means the process is now capable and consistently produces forces within the specified limits.
Conclusion: In the initial scenario, Cpk was below 1.33, indicating an issue with process capability. By adjusting the mean and reducing variation, we have improved the distribution so that the process is more stable and capable. This chart confirms that the forces are now well distributed between the specification limits, reducing the risk of defects.
Moreover, the process for achieving the rivet diameter has also been optimized, as shown in Figure 12, reducing the standard deviation of the rivet diameters to obtain a Cpk greater than 1.33.
The process variation was reduced (lower σ), resulting in a more concentrated distribution and an improved Cpk. The mean diameter (~12.5 mm) is stable, and the distribution is well placed between the specification limits. Cpk is now above 1.33, which means the process is fully capable and produces rivets within the specified limits with a very low probability of defects.
- Verification of electronic components: The team continuously monitored the reliability of the electronic components involved in the function of the buckle, performing periodic checks to ensure they meet safety and performance standards;
- Review and adjustment of processes: During implementation, some discrepancies arose between initial expectations and prototype performance. These differences led to a review of the manufacturing processes and adjustments to the design in order to achieve a more reliable product.
Final Quality Assessment
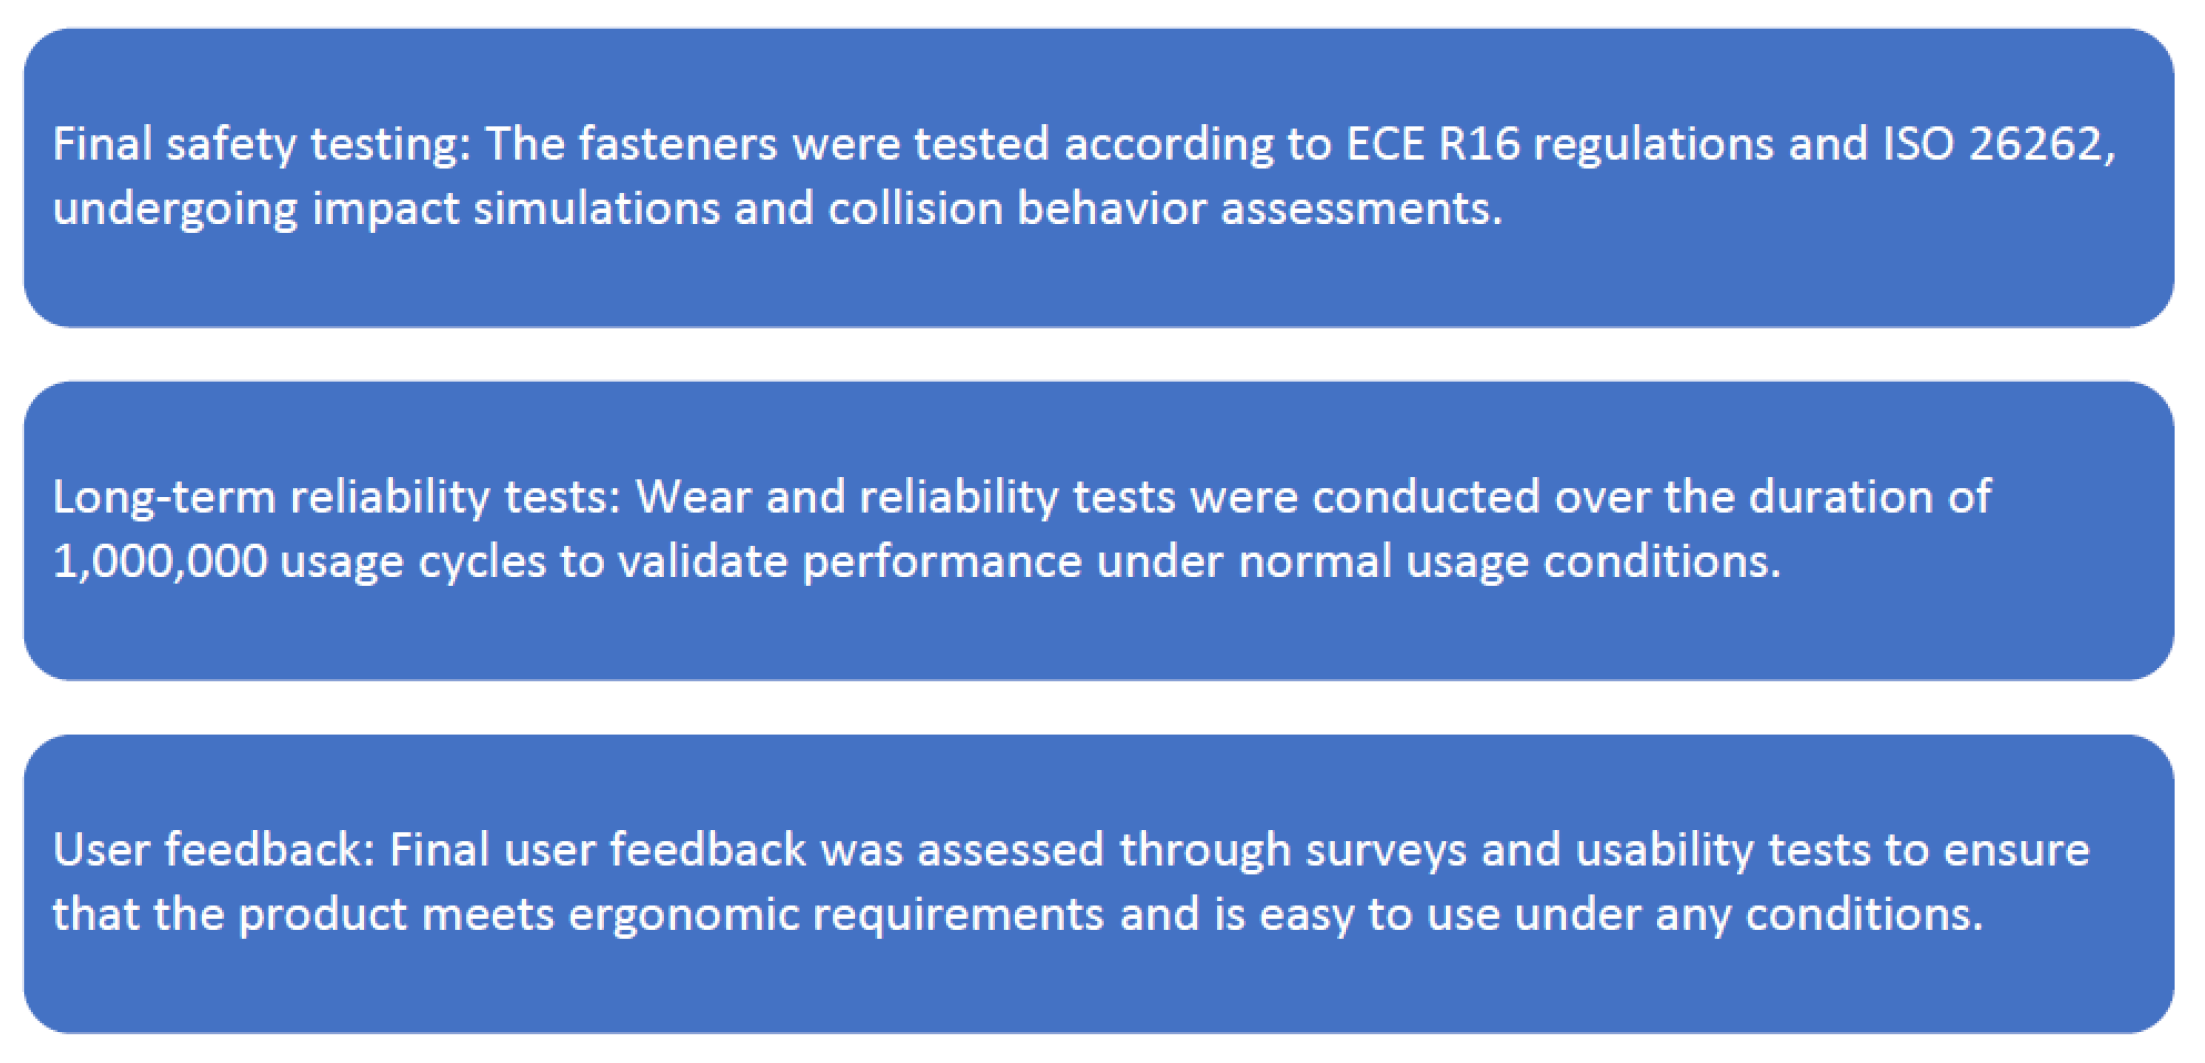
At the completion of the project, the team conducted a quality assessment based on final tests and user feedback. The final assessment followed the stages shown in Figure 13.
5.3. Impact of Quality Planning on Project Outcomes
The impact of implementing quality planning was significant across all aspects of the project, from costs to performance and end-user satisfaction. In the following subsections, we will analyze in detail the impact on the key outcomes of the project.
5.3.1. Reduction of Risks and Defects
Rigorous quality planning and exhaustive testing contributed to identifying and eliminating many risks and defects in the early phases of the project. For example, identifying strength issues in prototypes led to design modifications, thereby preventing possible failures in mass production. These early interventions avoided additional costs associated with correcting defects at later stages, when such errors would have had a much bigger impact on the budget and timelines.
5.3.2. Increased Reliability and Durability
Detailed quality planning had a direct impact on improving the reliability and durability of the final product. Performance and reliability tests allowed the team to optimize materials and manufacturing processes to ensure that the automotive buckles would withstand long-term usage conditions.
Moreover, the quality planning process allowed the team to anticipate and address environmental and wear-related issues, ensuring that the final product meets durability standards, even under extreme conditions.
5.3.3. Cost Reduction
By identifying and correcting defects in the early stages, quality planning contributed significantly to reducing production costs. Ongoing testing and evaluation enabled the team to avoid additional costs associated with late design changes, which would have involved reworking already produced parts or altering the production flow. Furthermore, optimizing the manufacturing process based on continuous quality analysis led to long-term cost savings by increasing resource efficiency.
5.3.4. User Satisfaction
The implementation of quality planning had a direct impact on end-user satisfaction. Ergonomic tests and user feedback contributed to the creation of a product that was easy to use, with an intuitive locking mechanism and a design that did not cause discomfort. End users appreciated these improvements, and the product achieved a high satisfaction rate among consumers.
5.4. Lessons Learned and Best Practices
Following the implementation of quality planning in this project, several valuable lessons and best practices have been identified that can be applied to future automotive component development projects.
5.4.1. Importance of a Detailed Testing Plan
One of the most important aspects of quality planning was the creation of a detailed testing plan that included both standard tests and extreme condition tests. This detailed plan ensured that all critical aspects of the buckle were thoroughly tested before entering production.
5.4.2. Close Collaboration Between Engineering and Quality Management Teams
To achieve optimal results, close collaboration between technical and quality management teams was essential. The teams worked together to anticipate risks and implement timely solutions. This collaboration had a significant impact on reducing development times and improving product performance.
5.4.3. Early Testing for Risk Identification
Another important aspect of quality planning was early testing and risk assessment as the project progressed. Identifying risks and potential failures in the early development stages helped the team take corrective action before these could affect delivery deadlines or the project budget.
5.4.4. Adopting a Systematic Approach to Quality Management
Applying a systematic approach to quality throughout the project was an essential practice. This involved continuous evaluation of processes and products, as well as incorporating feedback from testing and end users to improve the product throughout the development process.
6. Conclusions and Recommendations
In this section, we will synthesize the main conclusions drawn from the conducted research, present recommendations for future projects and studies in the field of quality planning in projects, and discuss prospects for the development of this domain, with a focus on technological advancements and changes in the automotive industry.
6.1. Main Conclusions of the Study
Quality planning in an automotive buckle development project proved to be an essential and complex process that directly influences the success of the project, the safety of end users, and their overall satisfaction. The analysis of the quality planning process implementation, as previously described, highlighted several fundamental aspects that must be considered to ensure the success and performance of such a project.
- Quality Planning Ensures Long-term Project Success
One of the key aspects identified in this study was that rigorous and systematic quality planning—rooted in sustainability principles—plays a crucial role in the long-term success of a project. For automotive buckles, which are critical components for passenger safety, the quality planning process had a direct impact not only on the reliability and performance of the final product but also on its sustainability throughout its life cycle. Rigorous, sustainability-oriented testing and evaluations enabled the anticipation of problems before they turned into major risks and ensured that the product complies with all legal regulations, international standards, and sustainability criteria required by the modern automotive sector.
- Continuous Quality Monitoring is Essential
Another significant aspect revealed by the research was the importance of ongoing monitoring of manufacturing and testing processes from an operational sustainability perspective. An effective quality plan goes beyond the planning phase; it must be supported by active and continuous monitoring of all project stages, including assessment of environmental impact and efficient use of resources. Quality and sustainability management teams need to be actively involved throughout the development process, intervening quickly when deviations from established quality and sustainability standards occur.
- Integration of User Feedback is Critical
Another important finding highlighted by the study is the integration of end-user feedback into the development process, as an essential factor in improving product sustainability. In this case study, usability tests and ergonomic evaluations—with a focus on sustainable and eco-friendly solutions—enabled the identification of possible product improvements. As a result of these evaluations, the team adjusted the design and functionality of the buckle not only to meet consumer requirements but also to reduce environmental impact and enhance product sustainability.
- Adopting a Global Regulatory Framework
The study results also emphasized the importance of complying with international regulations and global quality and sustainability standards, such as ECE R16, ISO 26262, and other relevant sustainability regulations within the automotive industry. Compliance with these standards was essential not only to meet safety requirements but also to ensure that the product can be distributed and marketed in international markets, meeting all road safety, environmental sustainability, and environmental protection requirements.
6.2. Recommendations for Future Projects and Research
Based on the conclusions drawn from the case study and the obtained results, several valuable recommendations can be made for future projects in the automotive field and for research in quality planning.
- Developing a More Adaptable Quality Planning Framework
Given the automotive industry’s continuously changing environment, with rapidly evolving requirements and technologies, it is essential that future projects implement a more flexible and adaptable quality planning framework. This framework must be able to quickly respond to changing market demands, emerging technologies, and environmental or regulatory challenges. Such a framework should include change management methods and integrate real-time monitoring technologies for both manufacturing processes and the final product.
- Encouraging Interdisciplinary Collaboration
Another important aspect for developing future projects is encouraging close collaboration between engineering teams, quality management, and research and development teams. Interdisciplinary approaches are essential for identifying the best solutions to optimize quality, comply with safety requirements, and improve product performance. Collaboration across various departments can lead to innovative solutions that efficiently and sustainably address market demands and international regulations.
- Investing in Continuous Staff Training
An essential recommendation for future projects is continuous investment in training personnel involved in quality planning and sustainability. In a dynamic field like the automotive industry, ongoing employee training not only improves performance but also significantly contributes to implementing the latest practices, quality standards, and sustainability principles. Training must also include education on safety norms, international regulations, emerging technologies, and sustainability strategies that can influence the automotive product development process. Thus, the staff becomes a primary driver not only for continuous quality improvement but also for long-term sustainability promotion within the organization.
- Exploring New Technologies for Testing and Quality Validation
Another recommendation for future research and projects in quality planning and sustainability is to explore emerging technologies that can enhance testing, validation, and environmental impact assessment processes. For instance, the use of virtual reality (VR) and advanced simulations not only reduces the costs and time required for prototype testing but also optimizes resource use, supporting sustainability objectives. In addition, artificial intelligence (AI) applications can help rapidly identify defects, automate test processes, and monitor key sustainability parameters such as energy consumption or pollutant emissions. By integrating these technologies, the automotive industry can progress both in terms of higher quality and greater sustainability, responding more efficiently to market requirements and environmental regulations.
Author Contributions
Conceptualization, L.M.C. and A.D.E.; methodology, D.C. and C.R.; interpreted the results, created tables and figures A.M.T. and C.L.M.; investigation, I.L.; resources, M.M.P. and A.N.; data curation, I.L.; writing—original draft preparation, R.D. and A.N. All authors have read and agreed to the published version of the manuscript.
Funding
This research received no external funding.
Institutional Review Board Statement
Not applicable.
Informed Consent Statement
Not applicable.
Data Availability Statement
This study focuses on qualitative and quantitative research using interviews and historical data results from the Romania Rovinari Seatbelts - RRS company. The company’s data is confidential. Therefore, it cannot be put on any open public platform. On the other hand, the profile of this company can be seen at this link https://careerromania.autoliv.com/locations/romania-rovinari-seatbelts-rrs.
Conflicts of Interest
The authors declare no conflict of interest.
References
- Ciobanu M,ş,a, Ingineria Calităţii, Ed.Printech 1999.
- Tiuc, D., Drăghici, G., Pârvu, A., & Enache, B. (2015). Consideration about the Determination and Control of the Key Character-istics as Part of Planning Quality of the Product Development Process. Applied Mechanics and Materials Vols. 809-810, pg. 1269-1274. [CrossRef]
- Sanjuan, A. G., & Froese, T. (2012). The Application of Project Management Standards and Success Factors to the Development of a Project Management Assessment Tool. 26th IPMA World Congress, 91-100. [CrossRef]
- Tiuc D., & Drăghici G. (2015). Quality Project Plan Documentation Analysis in Automotive. Power Electronics and Energy Engi-neering (pg. 83-89). Lancaster: DESTECH PUBLICATIONS.
- Raţă V. Raţă D. Ciobanu M “Calitatea produselor industriale” Editura Bren Bucuresti 2002.
- Tiuc, D., & Drăghici, G. (2016). TRIZ Model Used for Complaint Management in the Automotive Product Development Process. 3th International Symposium in Management: Management During and After the Economic Crisis. 221, pg. 414–422. Procedia - Social and Behavioral Science. [CrossRef]
- C. Fragassa and A. Pavlocic (2014). Using a Total quality strategy in a new practical approach for improving the product reliabi-lity in automotive industry, International Journal for Quality Research, 8(3) 297-310, ISSN 1800-6450.
- C. A. Riesenberger and S. D. Sousa (2010). The 8D Methodology: An Effective Way to Reduce Recurrence of Customer Complaints? Proceedings of the World Congress on Engineering, Vol III, WCE 2010. iuc, D., & Drăghici, G. (2016). TRIZ Model Used for Complaint Management in the Automotive Product Development Process. 3th International Symposium in Management: Man-agement During and After the Economic Crisis. 221, pg. 414–422. Procedia - Social and Behavioral Science.
- Sharma, K.D.; Srivastava, S. Failure Mode and Effect Analysis (FMEA) Implementation: A Literature Review. Copyr. J. Adv. Res. Aeronaut. Sp. Sci. J. Adv. Res. Aero SpaceSci. 2018, 5, 2454–8669.
- https://asq.org/quality-resources/eight-disciplines-8d.
- https://www.mobile2b.com/blog/8d-methodology-guide-quality-management-eight-disciplines-problem-solving.
- https://sixsigmadsi.com/8d/.
- https://quality-one.com/8d.
- https://www.qip-journal.eu/index.php/QIP/article/download/1839/1371/8050.
- https://www.ijert.org/research/application-of-8d-methodology-for-minimizing- the-defects -in- manufacturing- process -a- case-study-IJERTV6IS090053.pdf.
- https://www.qipjournal.eu/index.php/QIP/article/view/1839/1371.
- https://www.fosunm.si/media/pdf/RUO_2012_15_Krajnc_Marjanca.pdf.
- https://automotive.upit.ro/index_files/2019/2019_5.pdf.
- https://www.sciencedirect.com/science/article/abs/pii/S2214785321038669.
- https://www.irjet.net/archives/V4/i4/IRJET-V4I4106.pdf.
- https://ca.indeed.com/career-advice/career-development/8d-problem-solving.
- https://www.ijsronline.org/issue/20230303-015555.647.pdf.
- https://www.ijsronline.org/issue/20230303-015555.647.pdf.
- www.ijirem.org/DOC/17- 8D Approach to Improve Productivity for Manufacturing Industry.
- https://www.mahle.com/media/global/purchasing/supplier-portal/8d-e-learning/manual_8d-process_en-ex.pdf.
- https://www.compliancequest.com/quality/8d-problem-solving.
- https://ro.scribd.com/document/463122686/09-L22Managementul Calitații in Industria de Automobile | PDF.
- https://bfk.ro/seminarii/automotive-core-tools-act-pentru-managementul-calitatii-in-industria-automotive/30.
- http://www.imst.pub.ro/Upload/Sesiune/ComunicariStiintifice/Lucrari_2015/06.09/09_L22.pdf.
- https://pt.scribd.com/presentation/397206139/Calitatea-Fabricatiei-Metoda-8D.
- https://ro.wikipedia.org/wiki/8D.
- https://virtualboard.ro/rezolvarea-problemelor/metoda-8d-rezolvarea-problemelor-organizationale/.
- https://docs.upb.ro/wpcontent/uploads/2022/03/TD_Rezumat-RO_DD.pdf.
- Baptista, A.; Silva, F.J.G.; Campilho, R.D.S.G.; Ferreira, S.; Pinto, G. Applying DMADV on the industrialization of updatedcom-ponents in the automotive sector: A case study. Procedia Manuf. 2020, 51, 1332–1339. [CrossRef]
- Jirasukprasert, P.; Garza-Reyes, J.A.; Kumar, M.K.; Lim, V. A Six Sigma and DMAIC Application for the Reduction of Defects in aRubber Gloves Manufacturing Process. Int. J. Lean Six Sigma 2014, 5, 2–21. [CrossRef]
- Telsang, M.T. Industrial Engineering and Production Management, 3rd ed.; S. Chand Publishing: New Delhi, India, 1998.
- Marin-Garcia, J.A.; Garcia-Sabater, J.J.; Bonavia, T. The impact of Kaizen Events on improving the performance of automotive components’ first-tier suppliers. Int. J. Automot. Technol. Manag. 2009, 9, 362–376. [CrossRef]
- E. Shevtshenko (2014). Quality improvement methodologies for continuous improvement of production processes and product quality and their evolution, 9th International DAAAM Baltic Conference Industrial Engineering 24-26 April.
- Olafsdottir, A.H.; Ingason, H.T.; Stefansson, G. Defining the variables for a dynamic model of quality management in the con-struction industry: Results from stakeholder group model-building sessions. Int. J.Prod. Qual. Manag. 2016, 19, 157. [CrossRef]
- Wu, X.; Zhao, W.; Ma, T. Improving the impact of green construction management on the quality of highway engineering projects. Sustainability 2019, 11, 1895. [CrossRef]
- Vukomanovic, M.; Radujkovic, M.; Nahod, M.M. EFQM excellence model as the TQM model of the construction industry of South-eastern Europe. J. Civ. Eng. Manag. 2014, 20, 50–81. [CrossRef]
- Watt, A. Project Management; BCampus: Victoria, BC, USA, 2014; ISBN 978-1-77420-013-1.
- C.V. Kifor (2006). Book: Quality engineering: 6 sigma improvement (Ingineria calităţii: îmbunătăţirea 6 sigma), University Lucian Blaga, ISBN 9737390350.
- Doskoˇcil, R.; Lacko, B. Risk Management and knowledge management as critical success factors of sustainability projects. Sus-tainability 2018, 10, 1438. [CrossRef]
- Kazaz, A., Birgonul, M.T. The evidence of poor quality in high rise and medium rise housing units: A case study of mass housing projects in Turkey. Building and Environment 2005, 40(11), 1548–1556. [CrossRef]
- Ljevo, Z.; Vukomanovi’c, M.; Rustempaši’c, N. Analysing significance of key quality factors for management of construction projects. Grad¯evinar 2017, 2017, 359–366. [CrossRef]
- https://careerromania.autoliv.com/locations/Romania Rovinari Seatbelts - RRS - Autoliv Romania.
Figure 1.
The stages of quality planning for an automotive closure project.
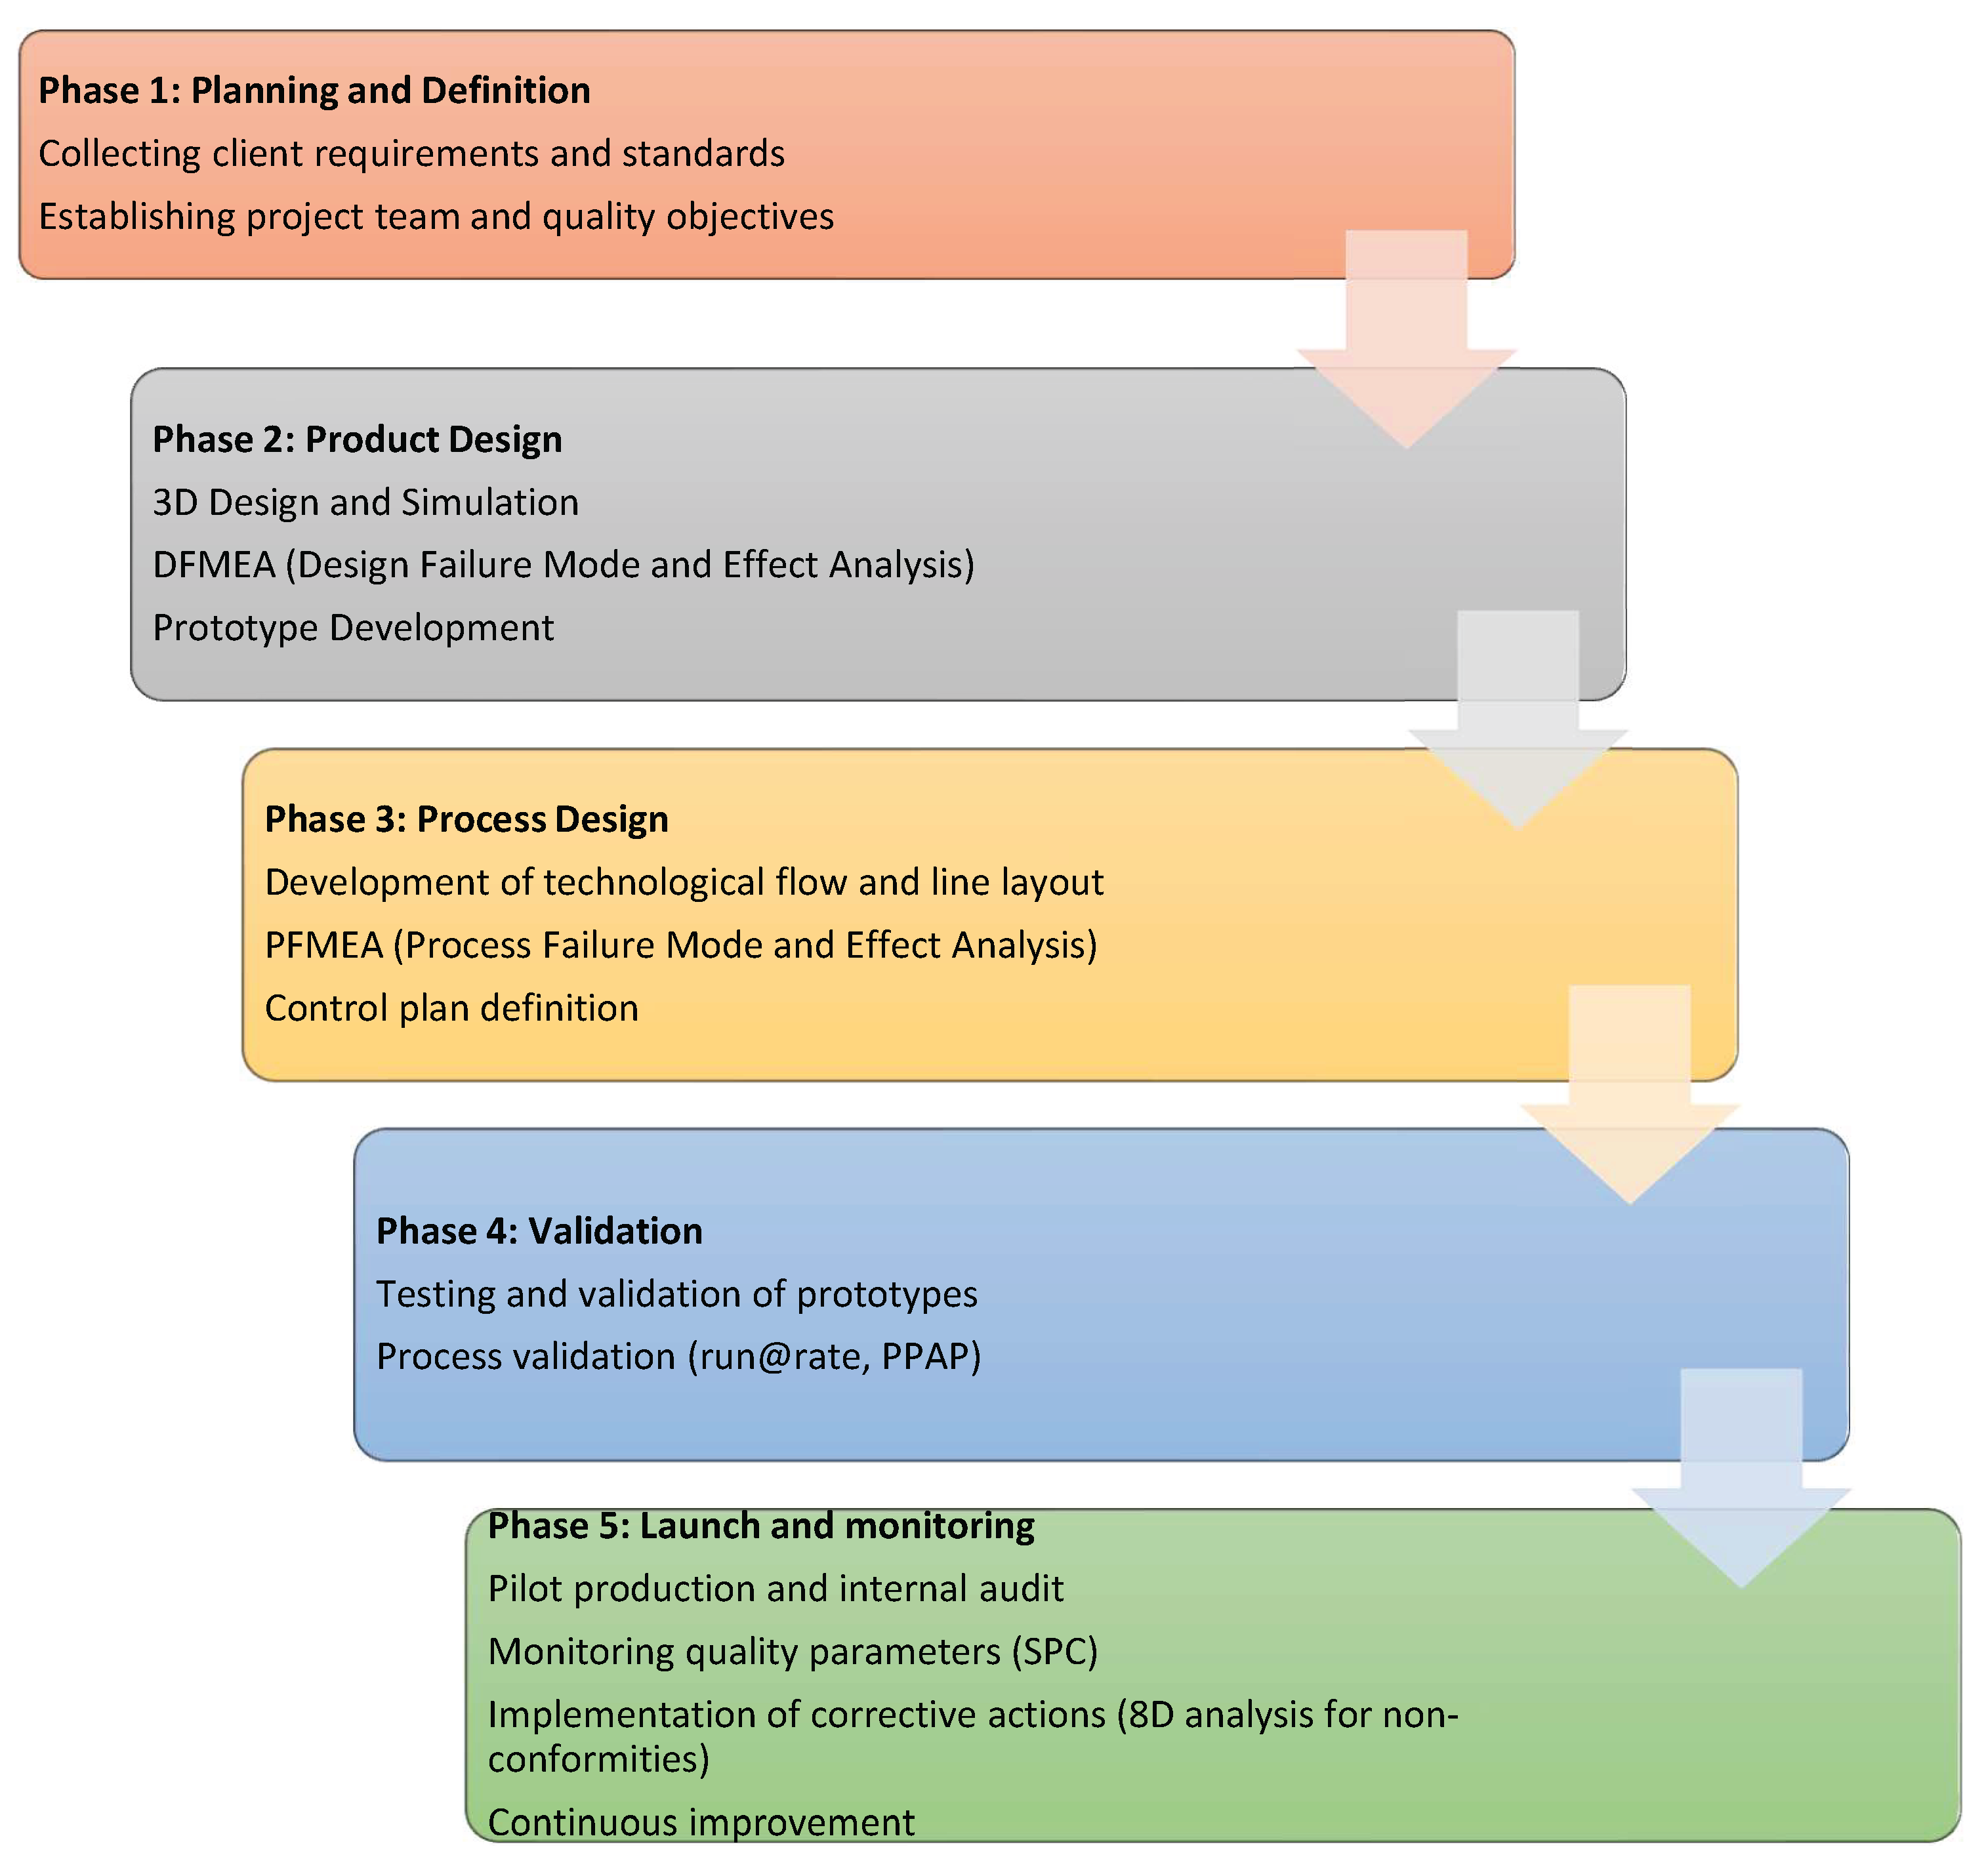
Figure 2.
Figure 2. Quality Requirements Matrix for Automotive Buckles.
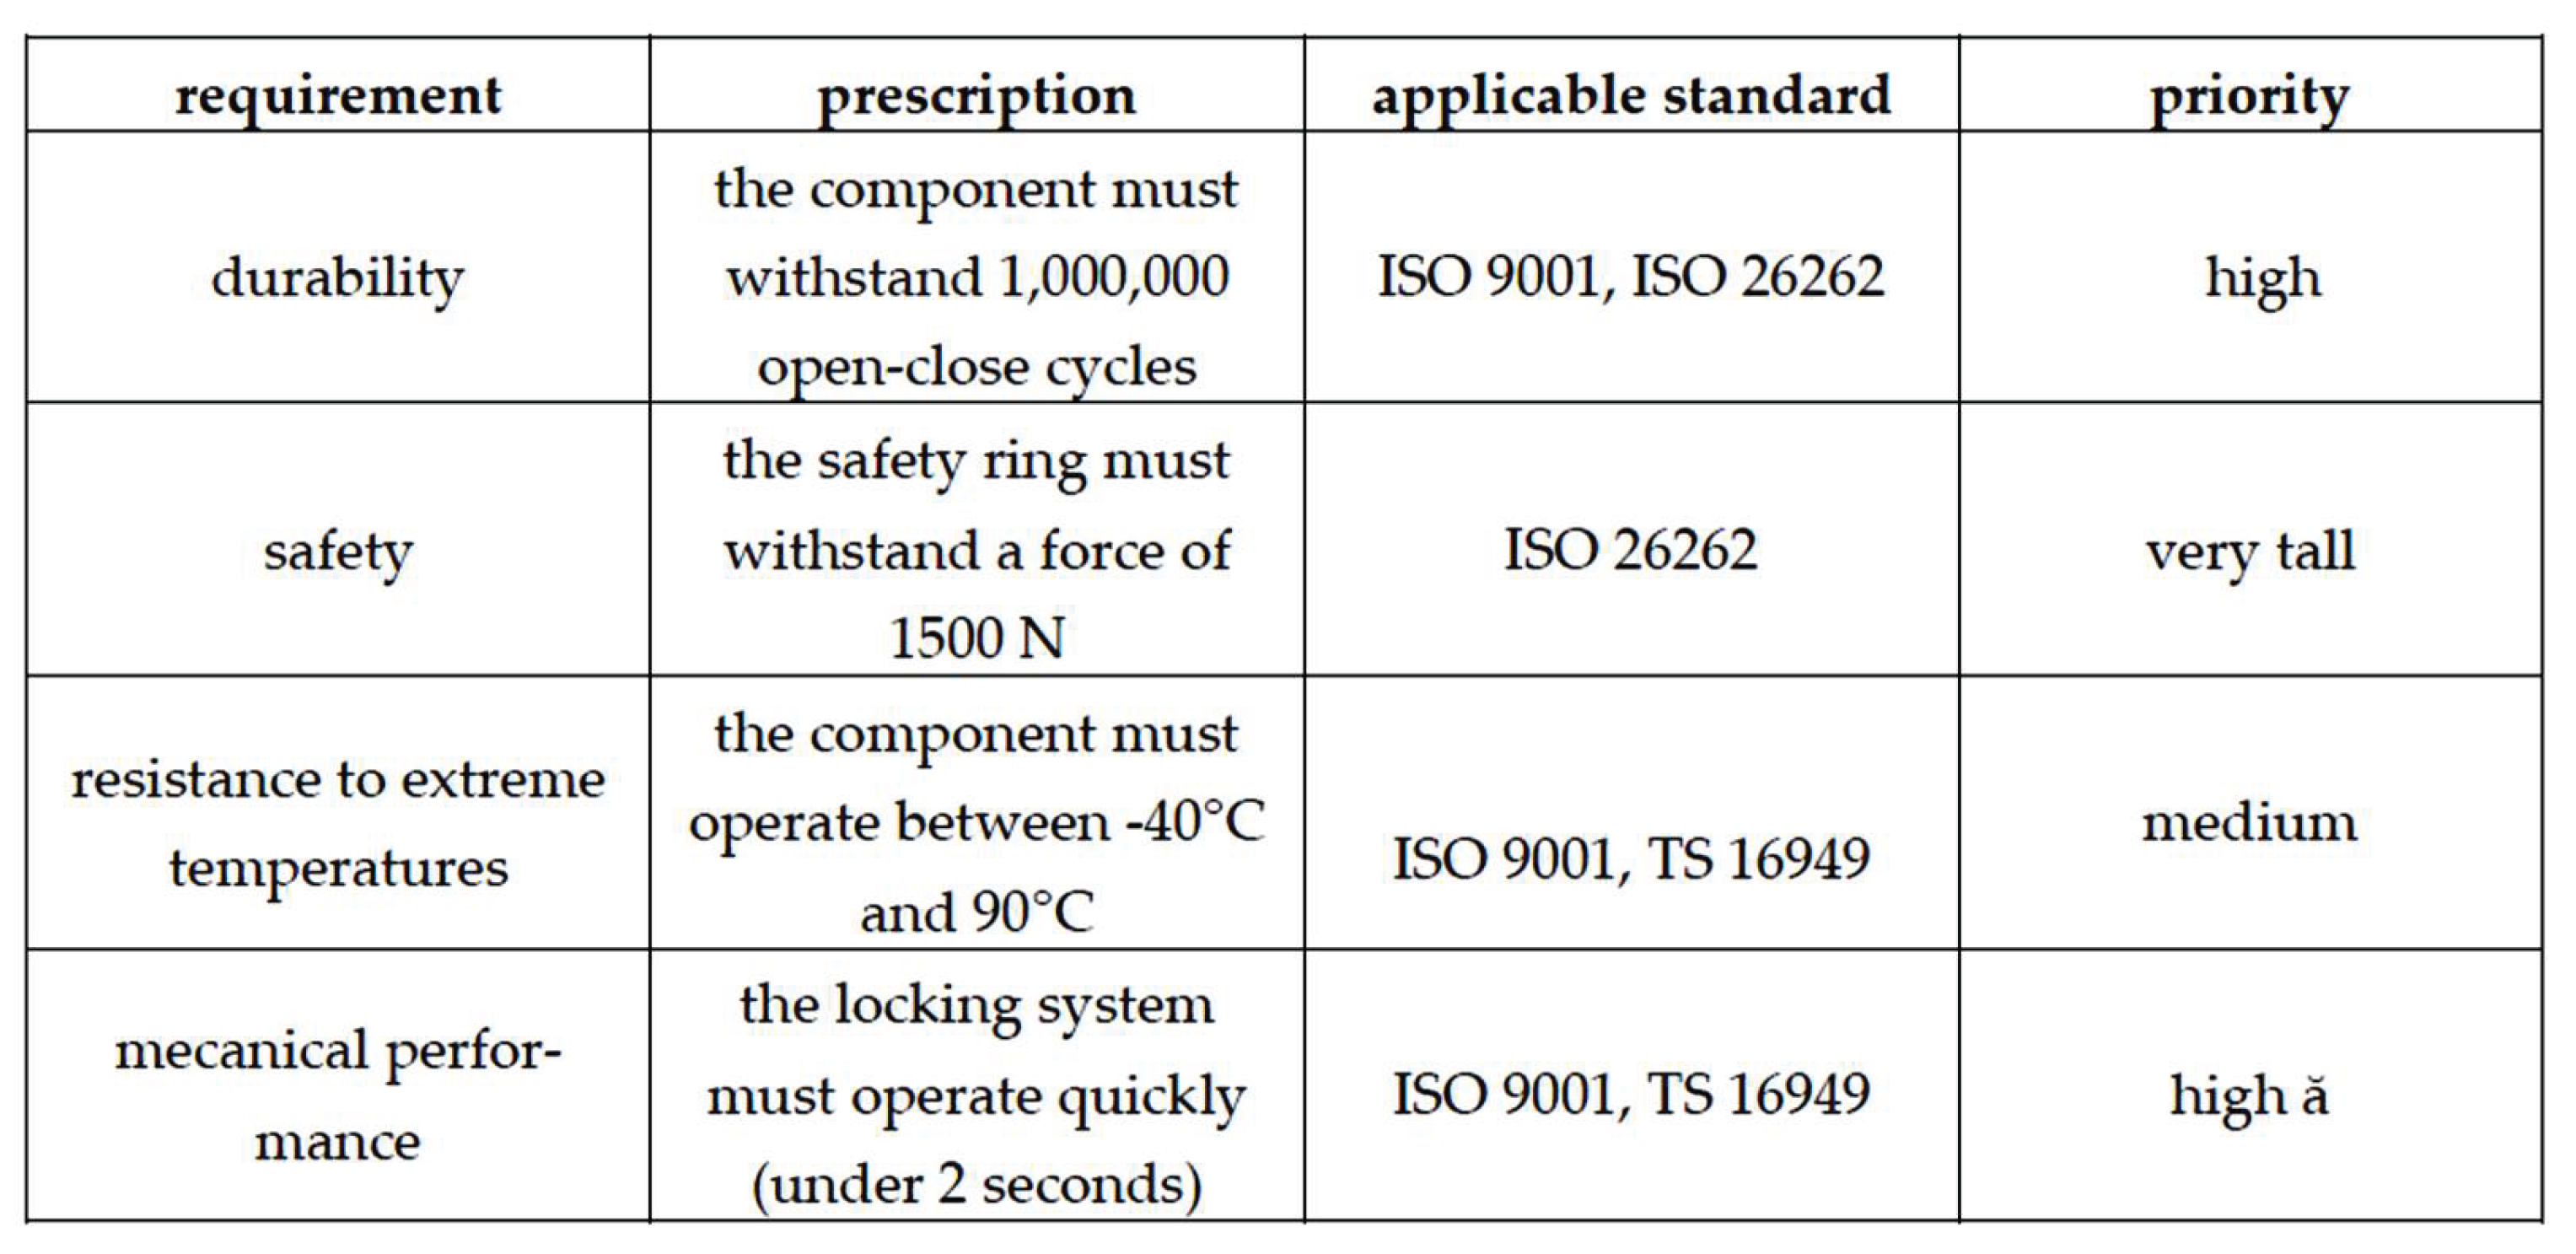
Figure 3.
The 5W2H method, applied for a complete description.
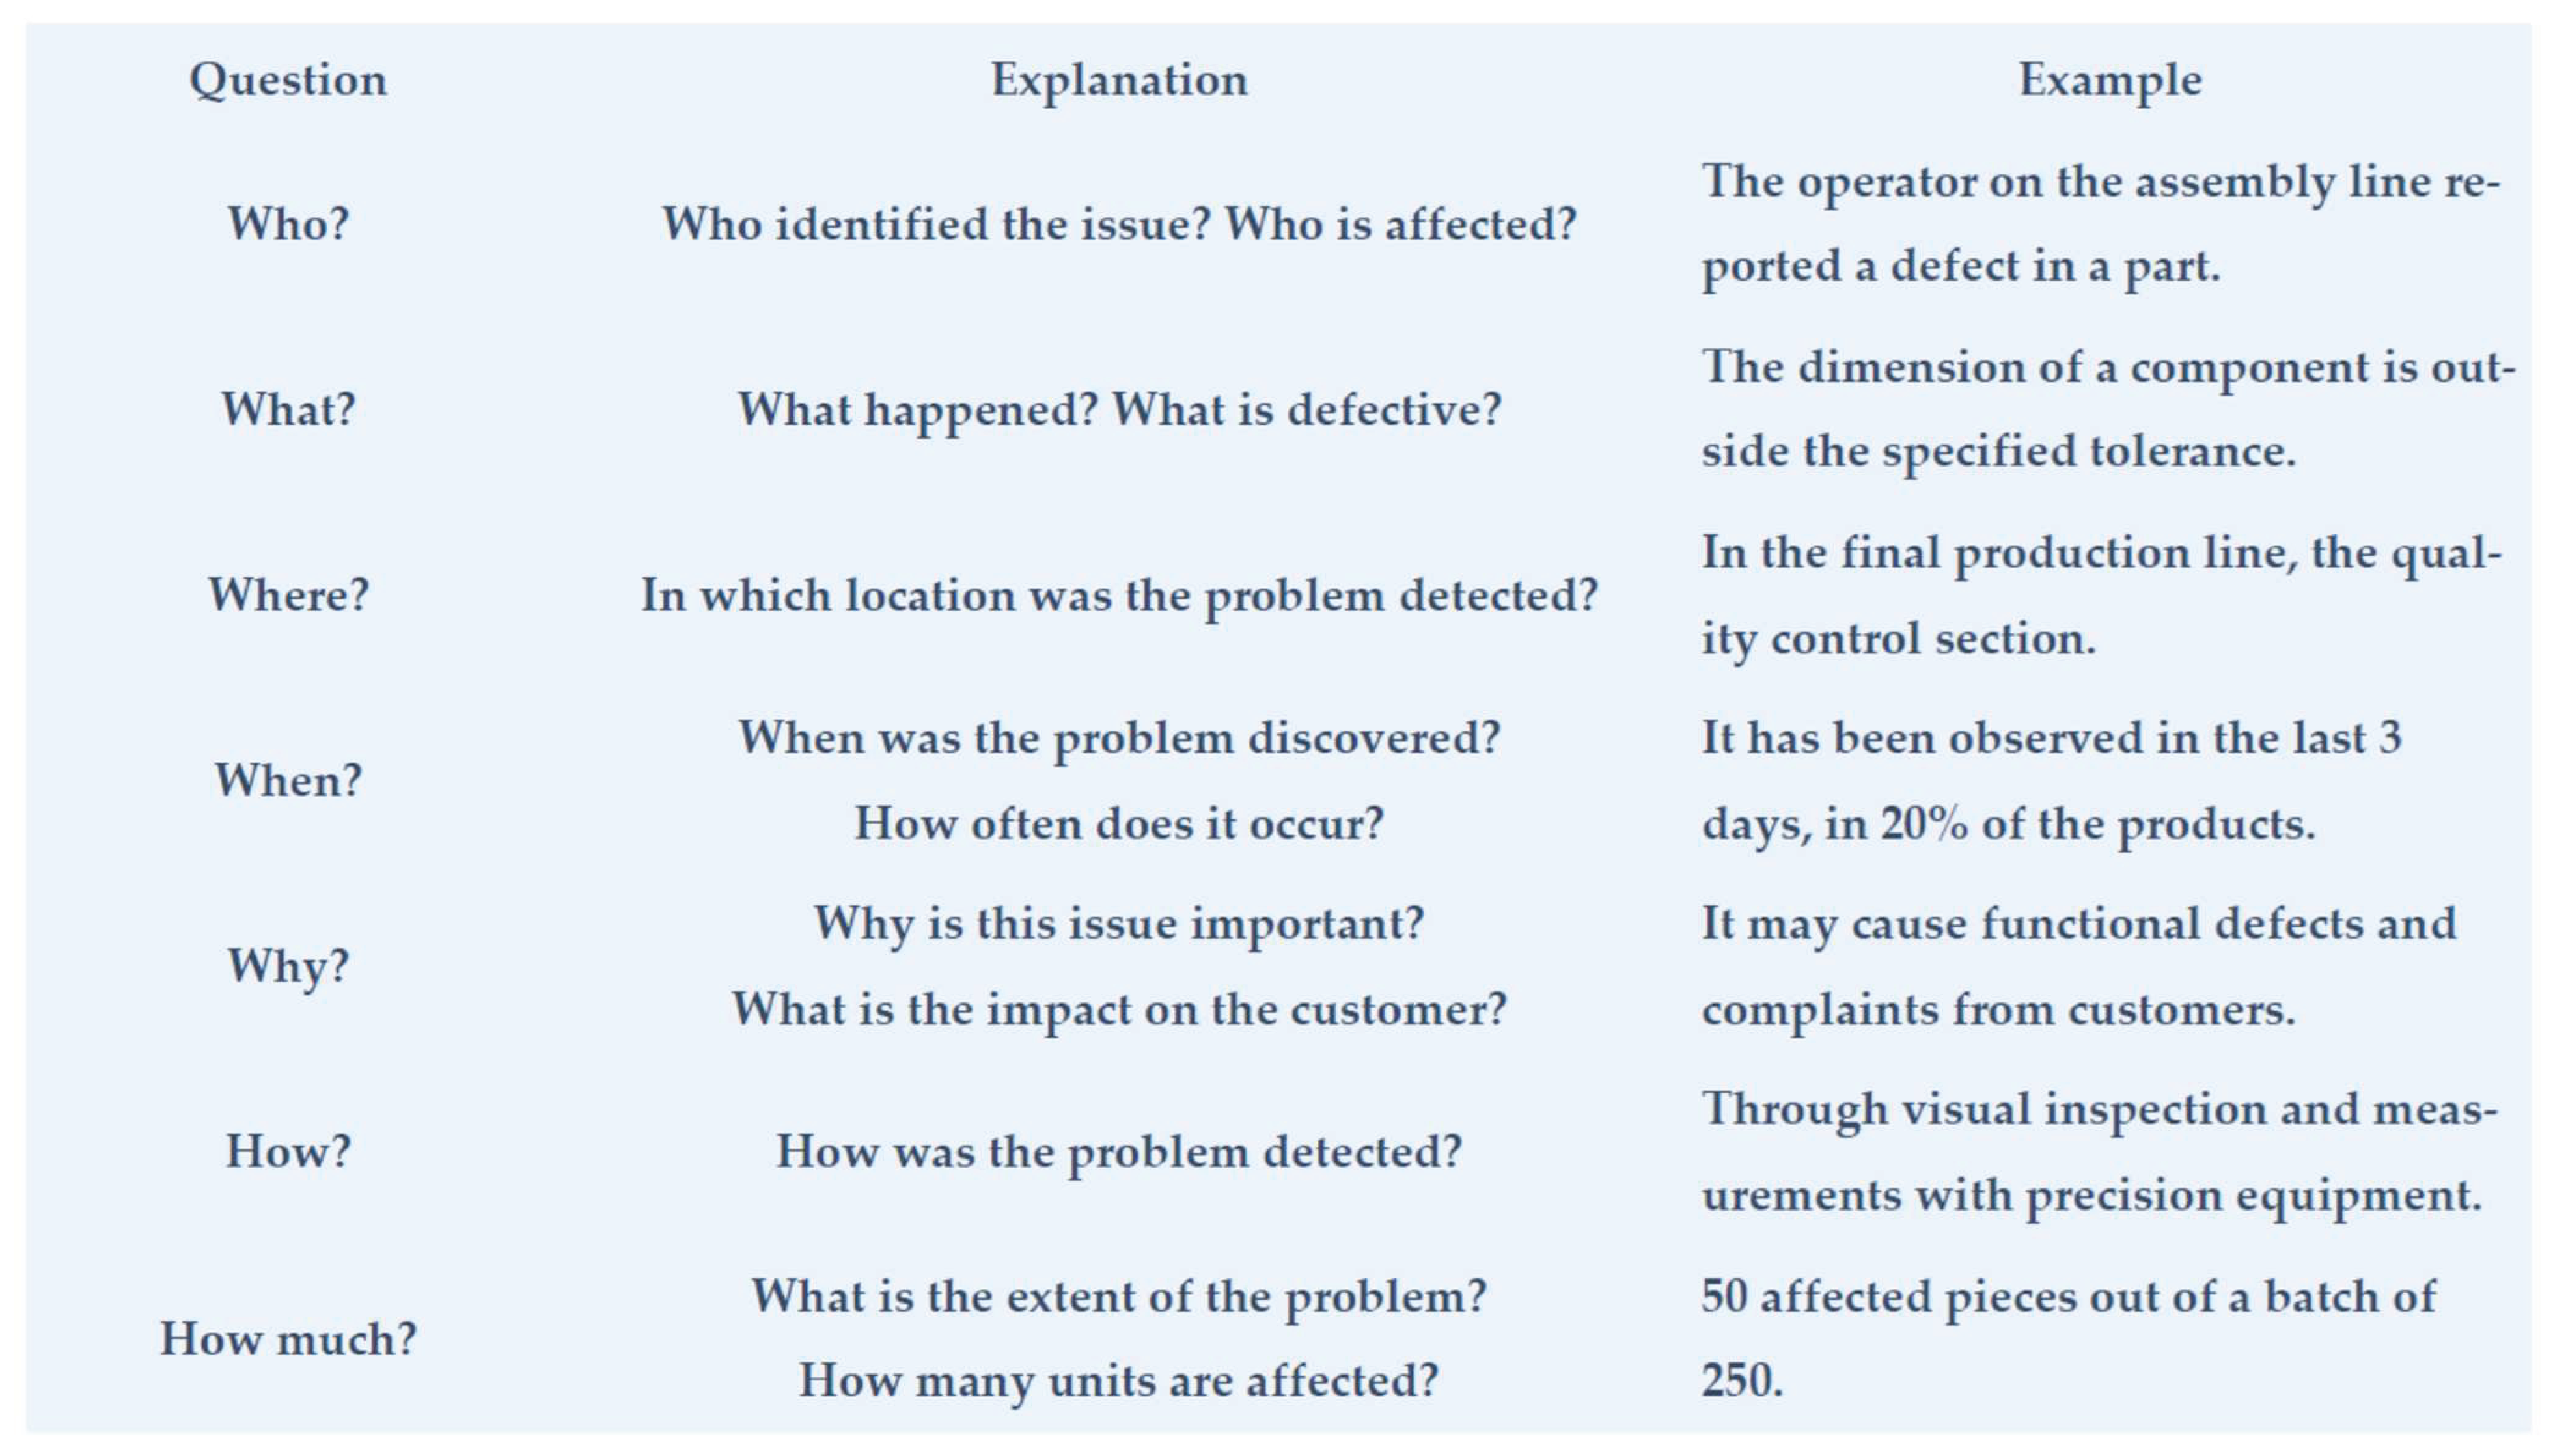
Figure 4.
The rivet diameter—NOK (nonconforming) dimension: 8.6 mm / OK (conforming) dimension: 12.3 mm.
Figure 4.
The rivet diameter—NOK (nonconforming) dimension: 8.6 mm / OK (conforming) dimension: 12.3 mm.
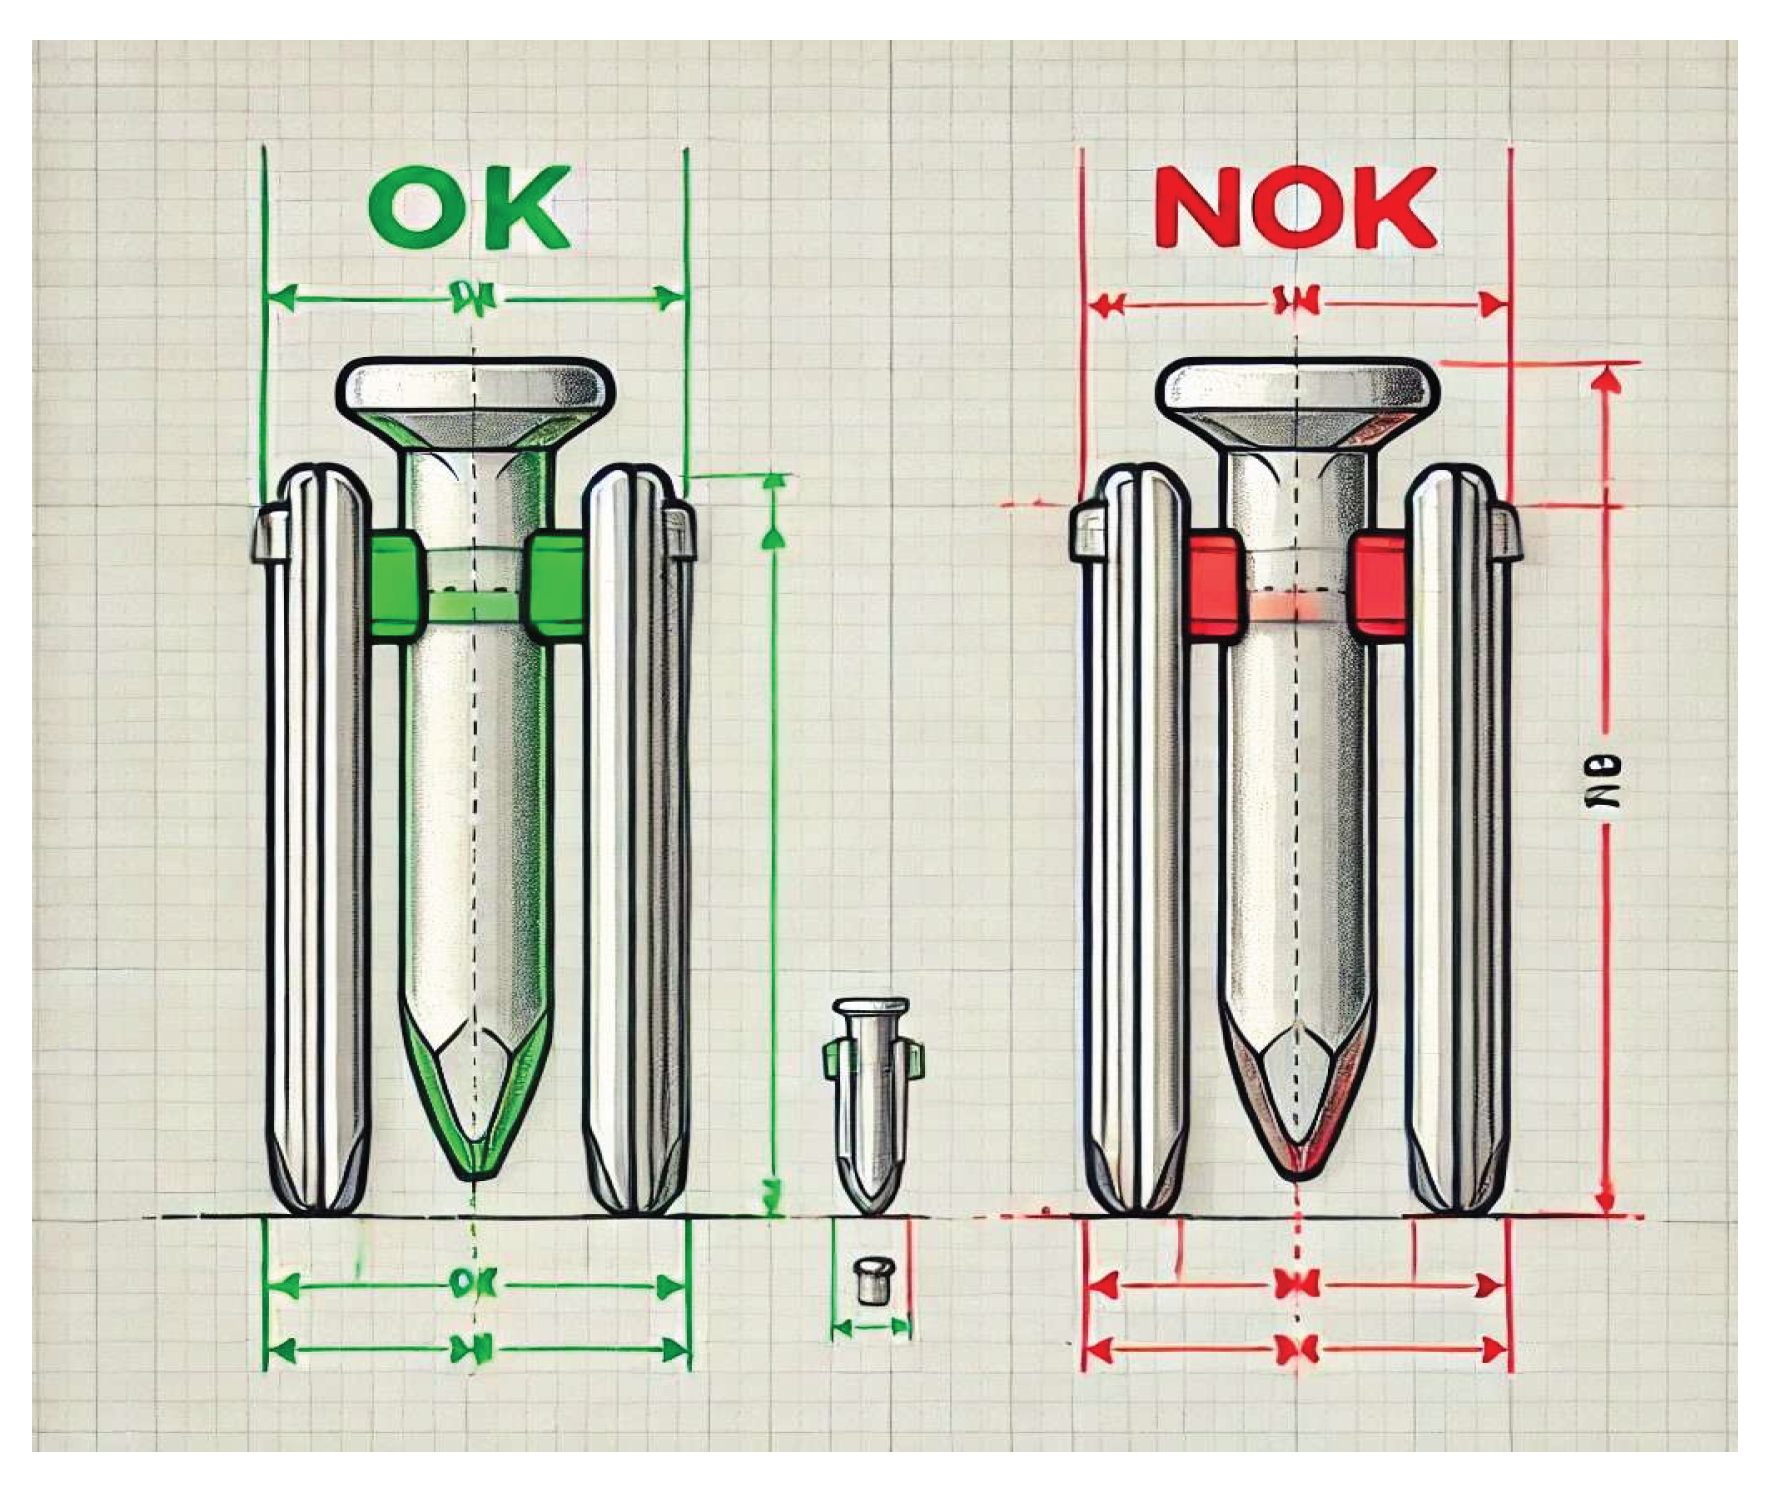
Figure 5.
The strength is proportional to the cross-sectional area of the rivet.
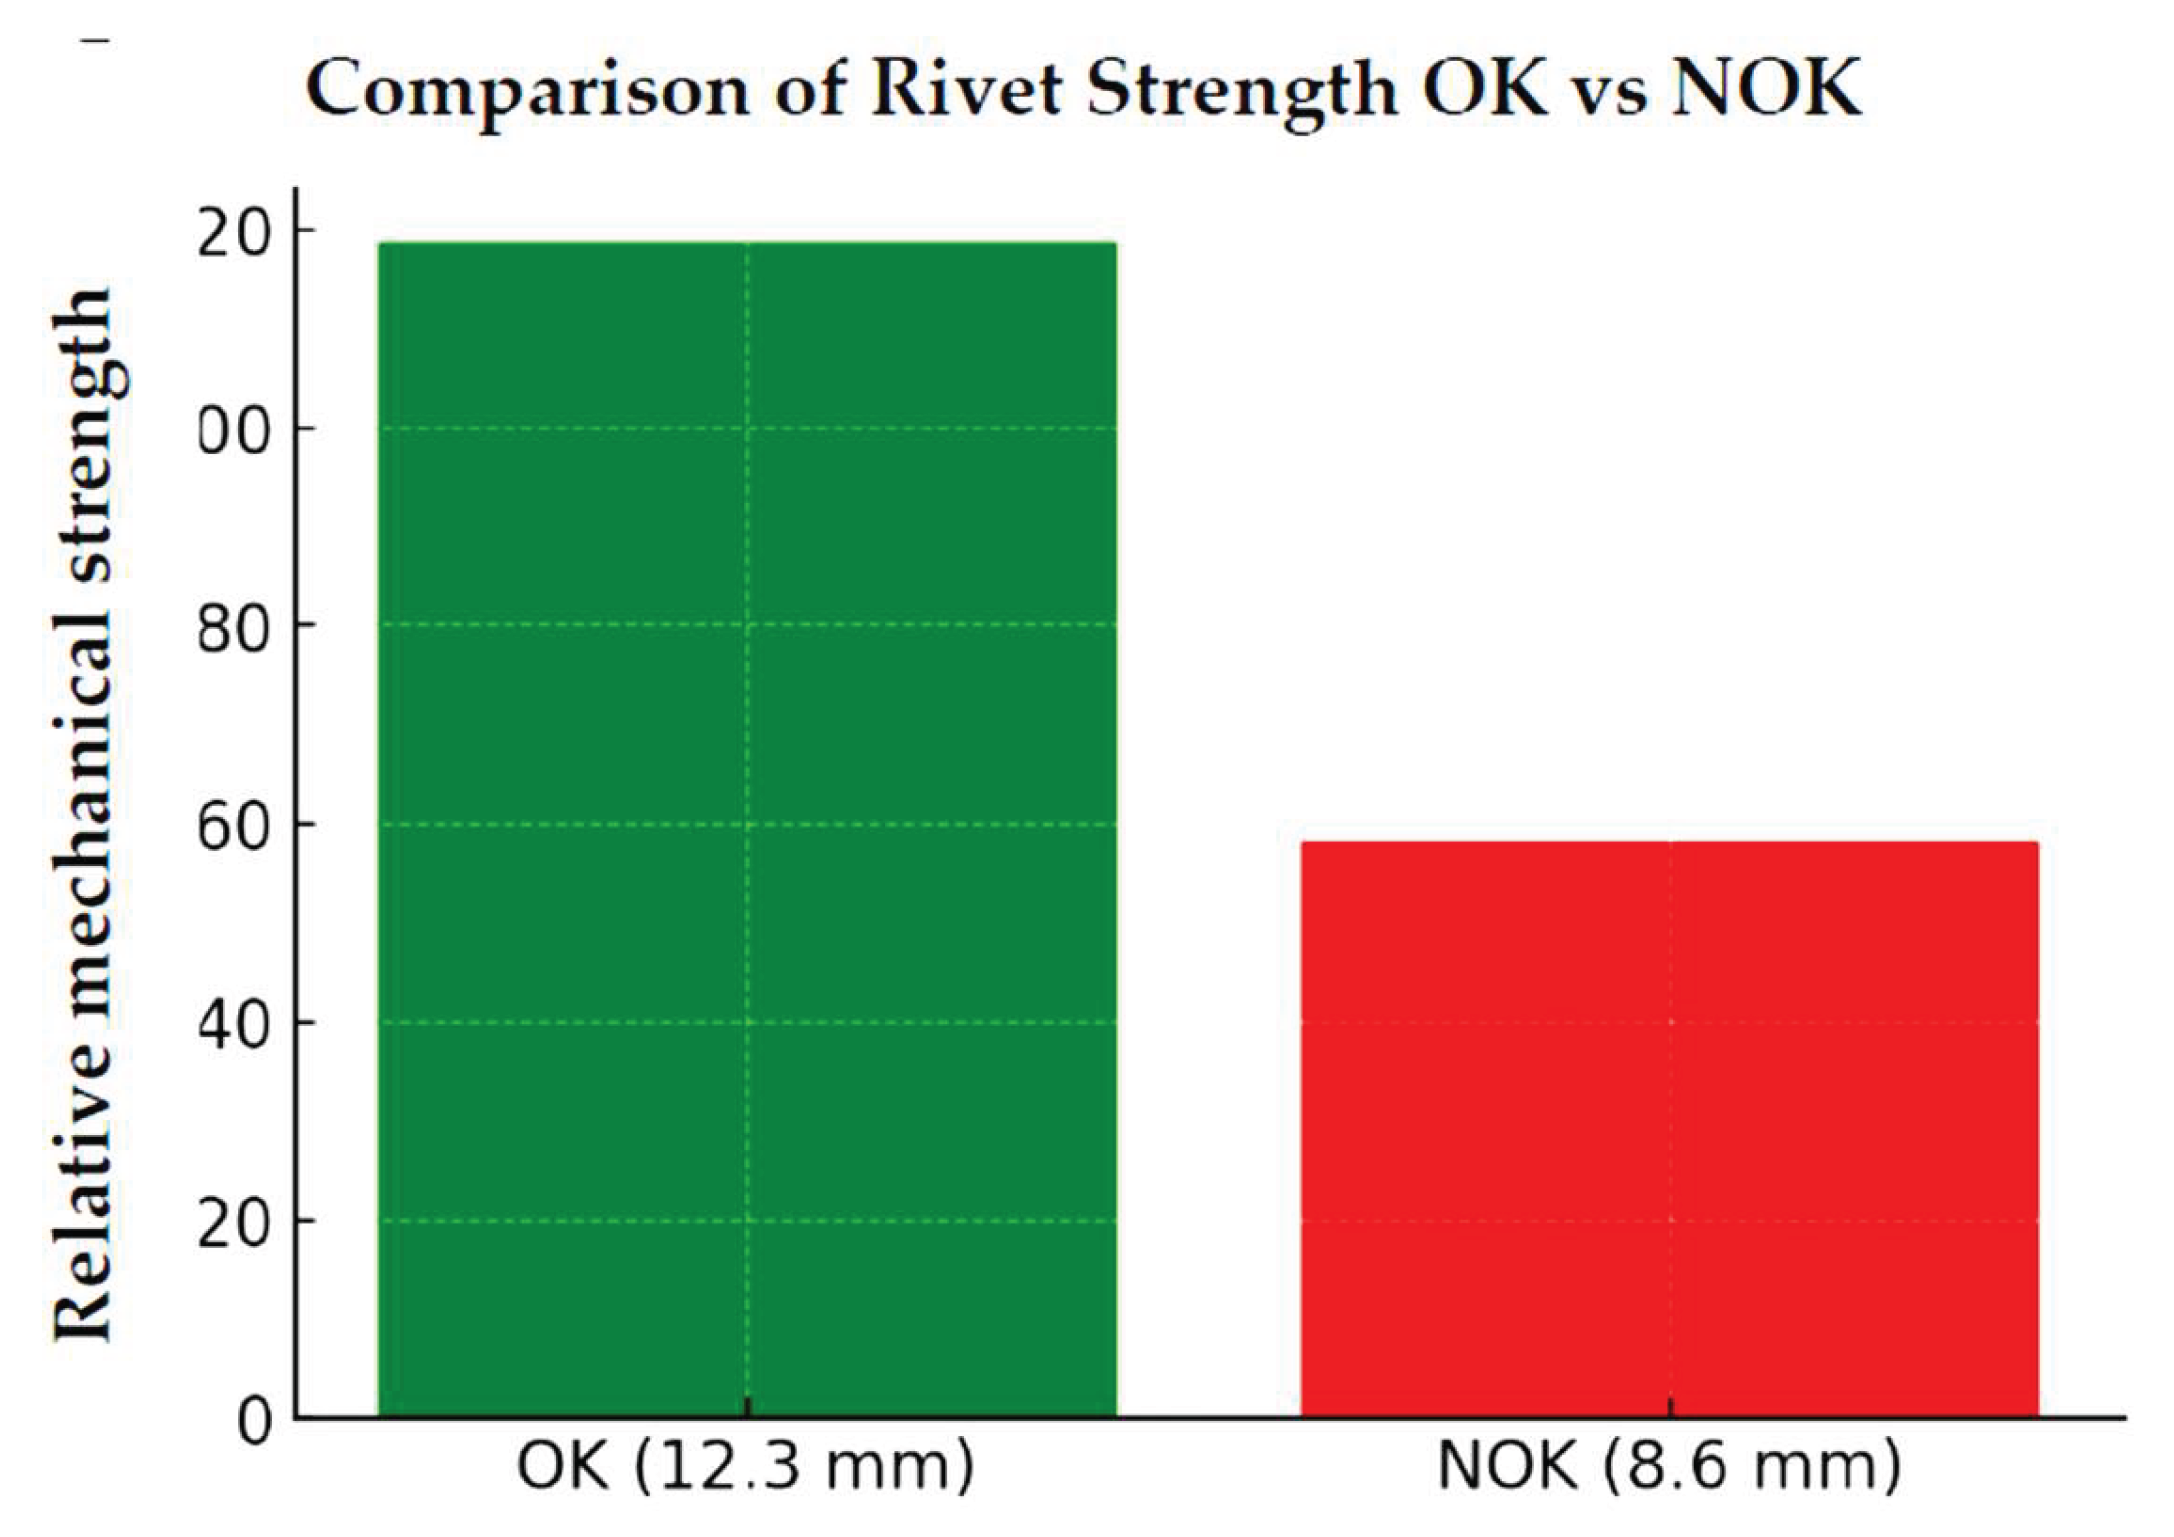
Figure 6.
The capability of the riveting process.
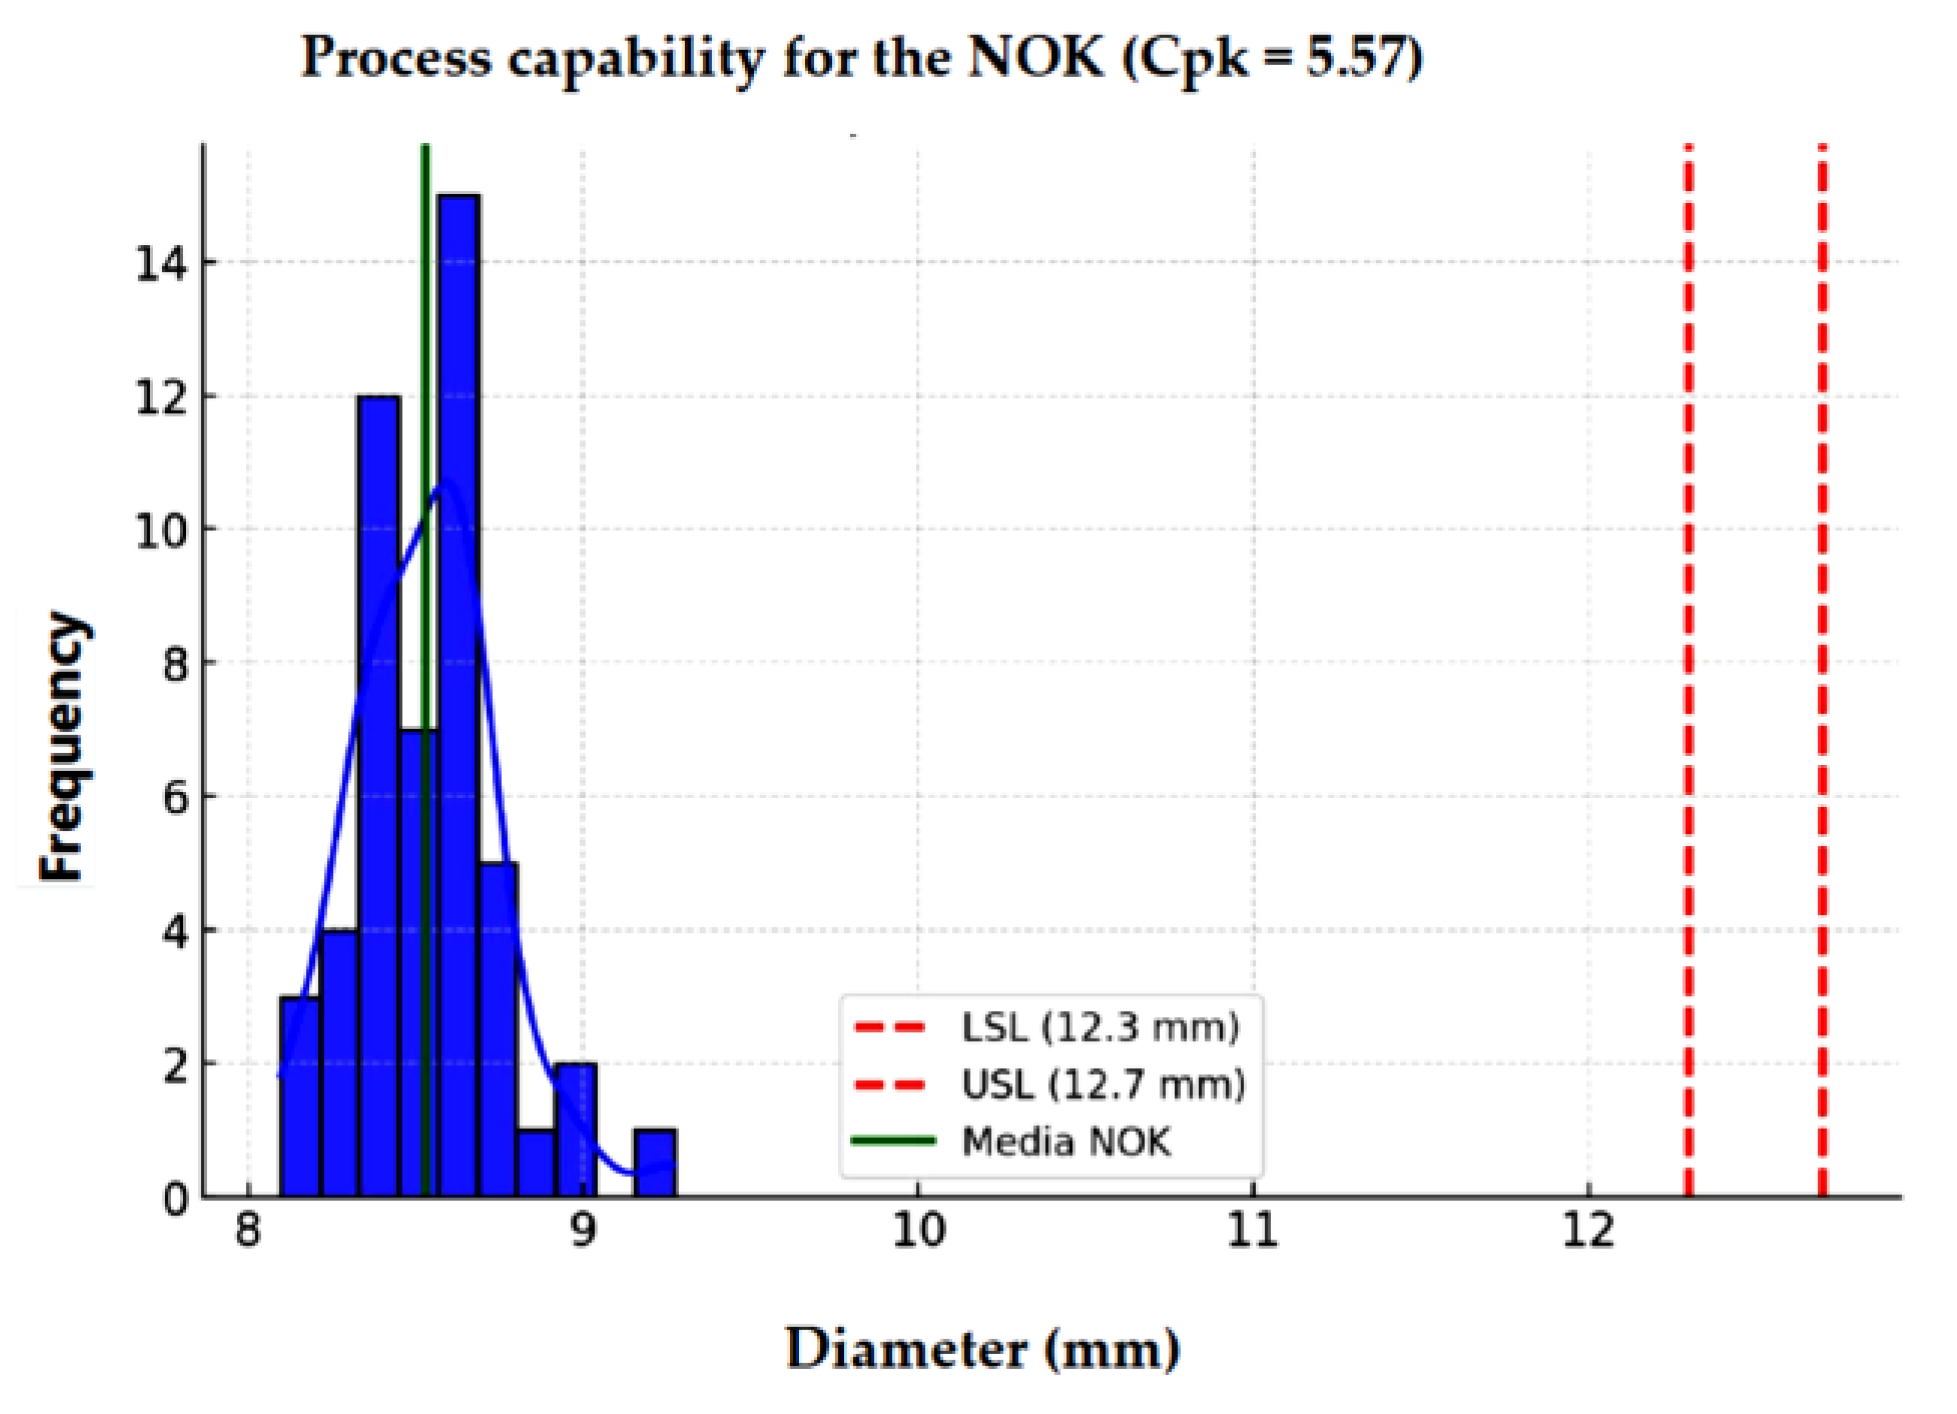
Figure 8.
The riveting processes.
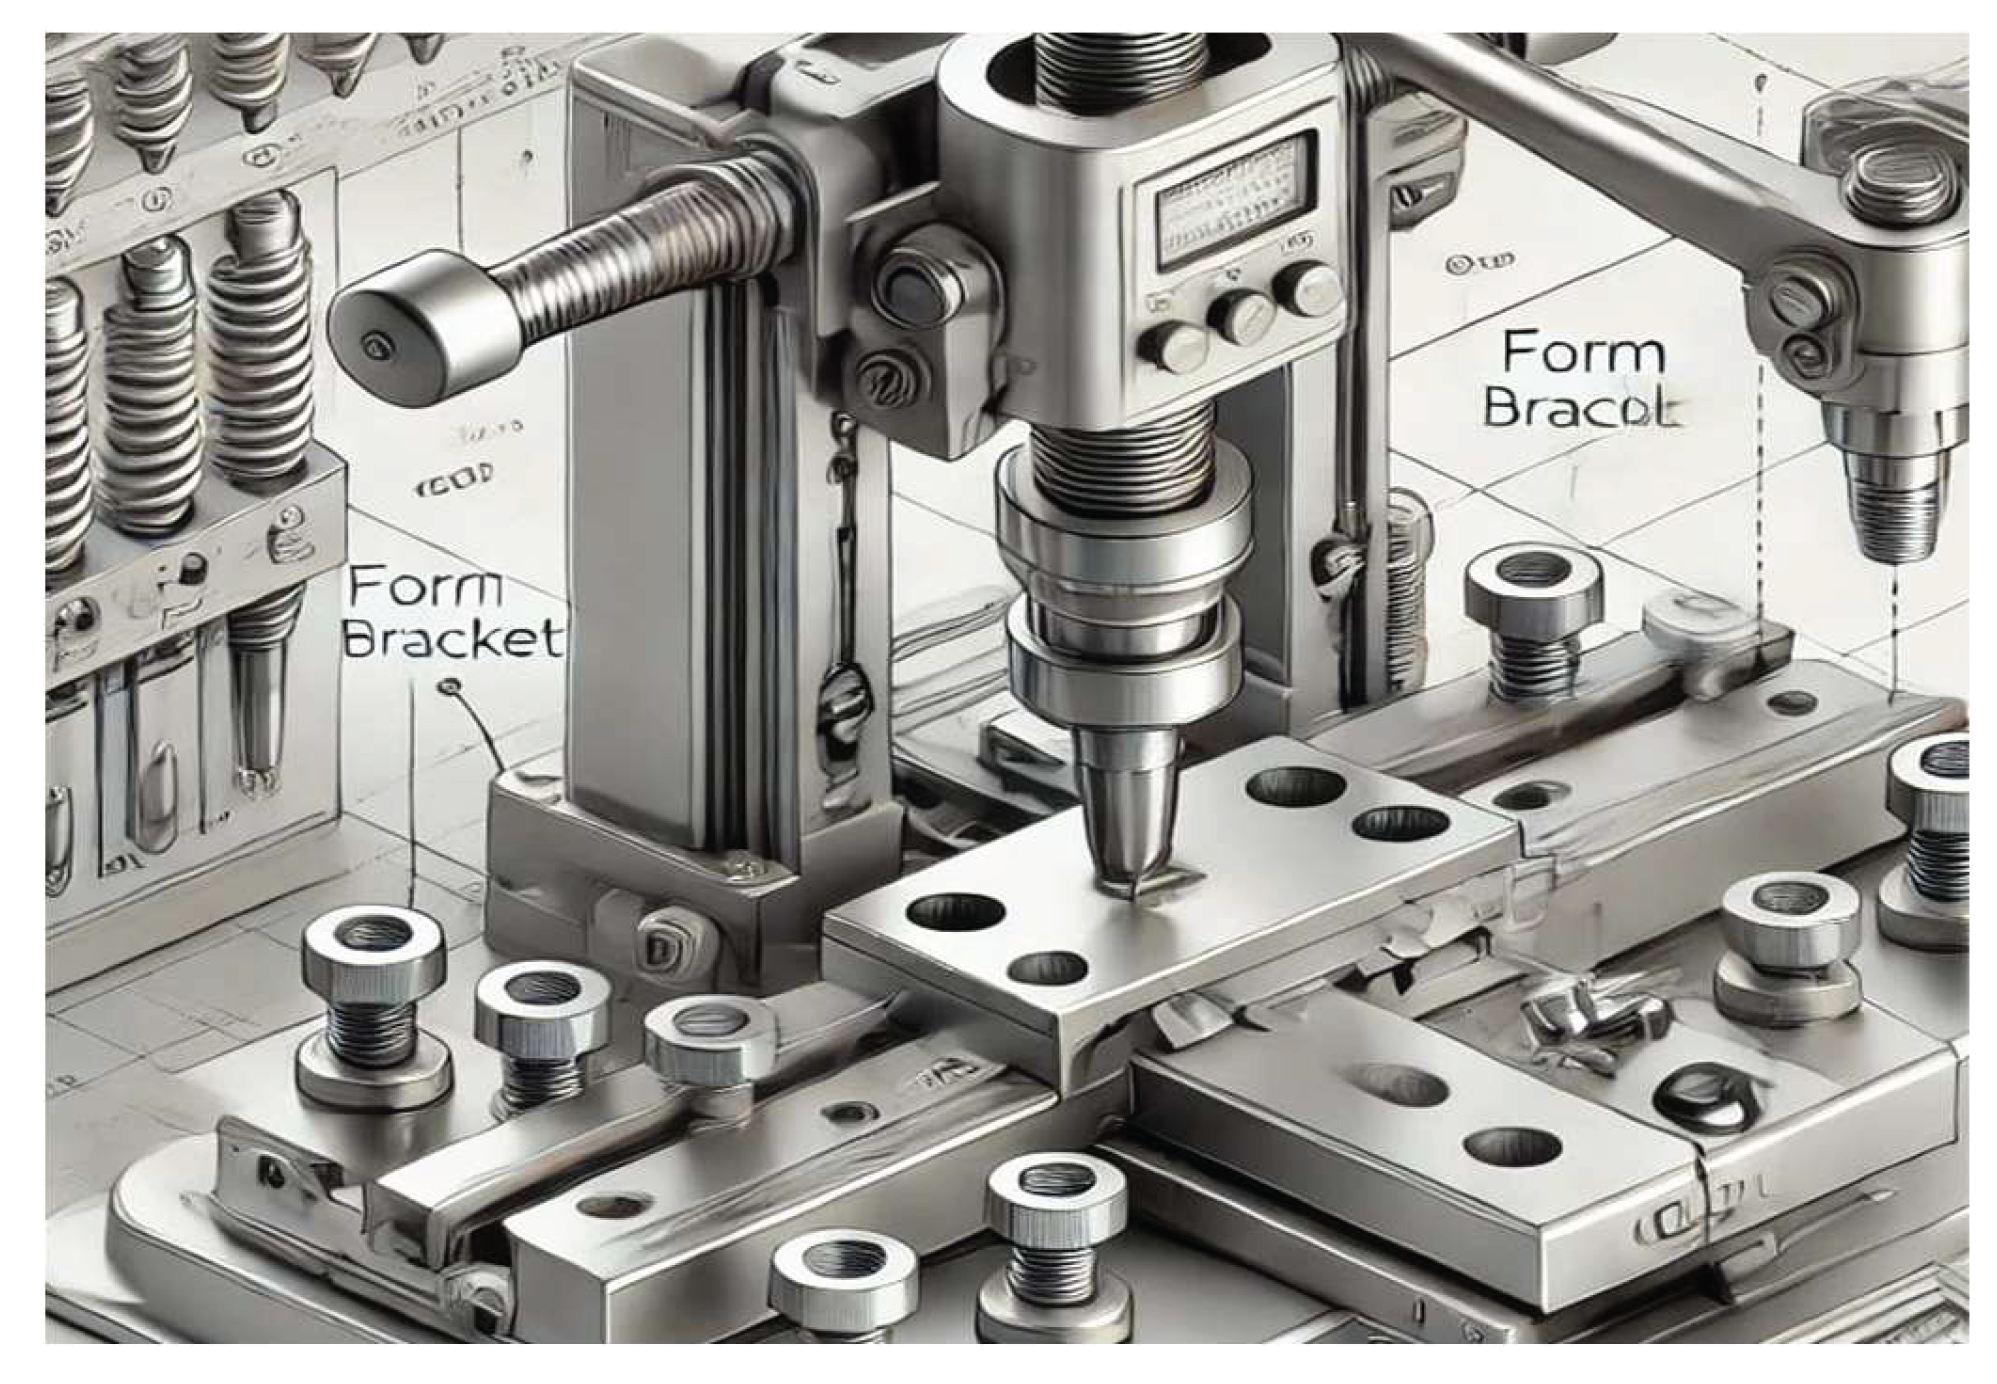
Figure 9.
The comparison between the initial parameters and those adjusted after analysis.
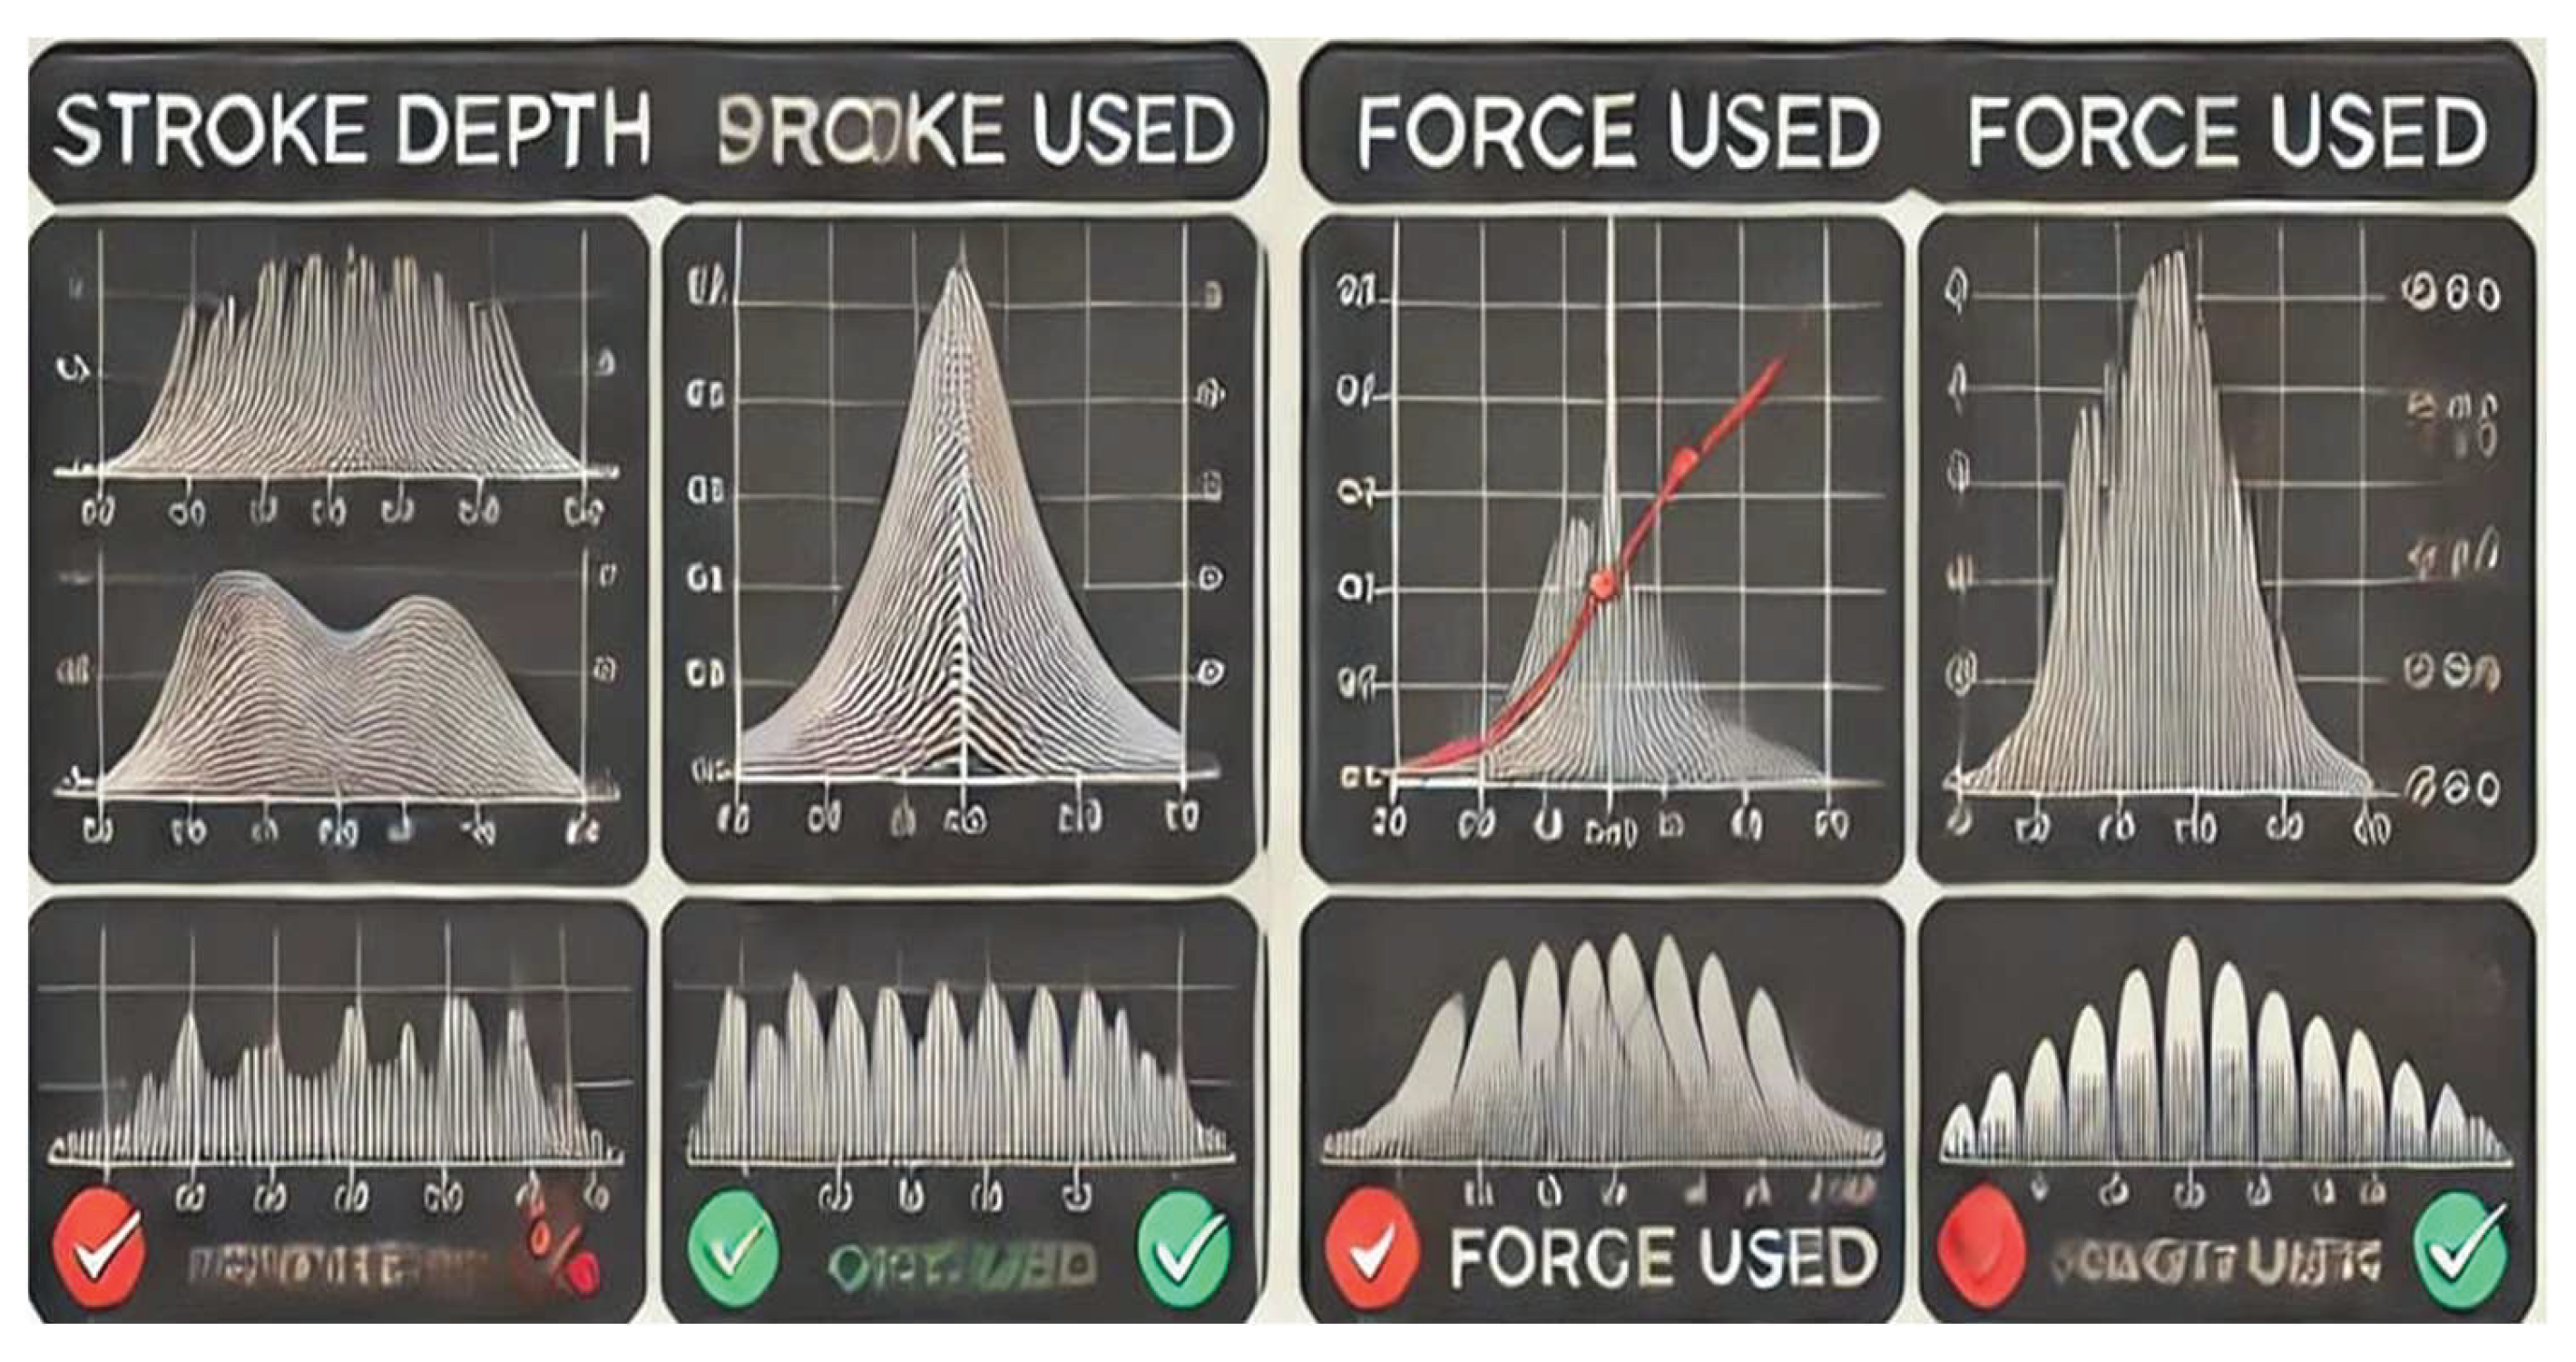
Figure 10.
The essential activities in quality planning.
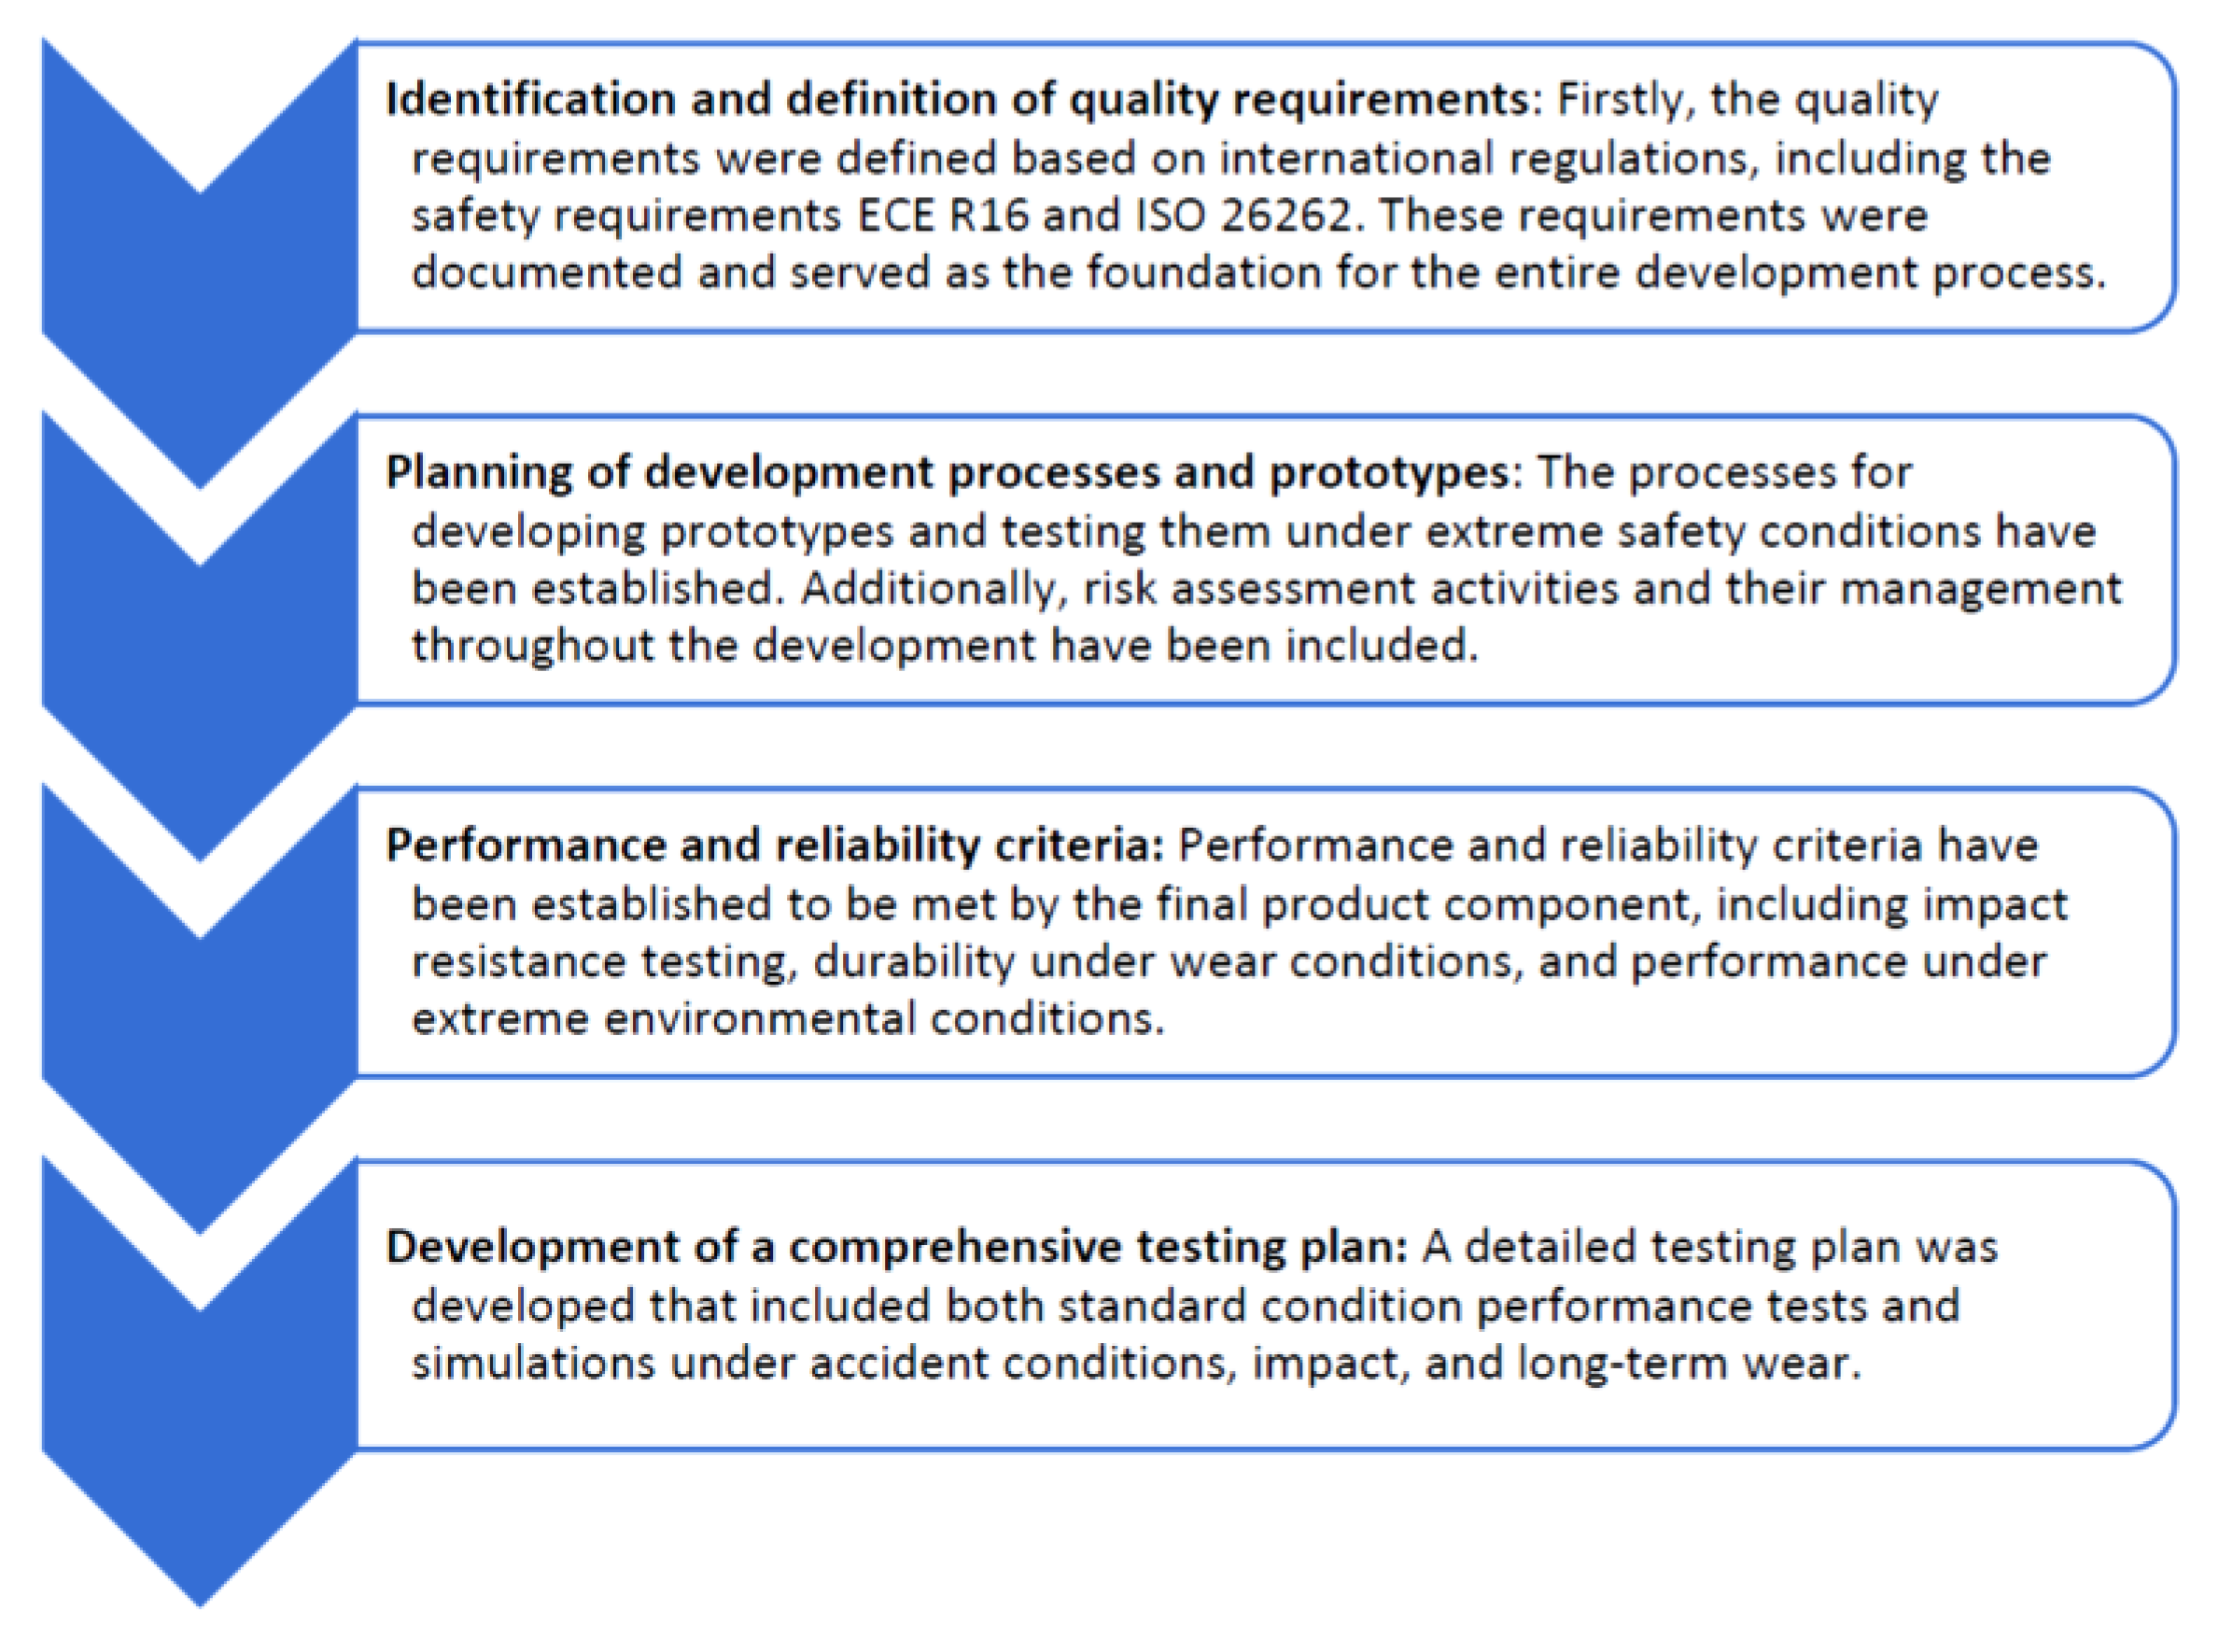
Figure 11.
The distribution of forces measured in the process, with adjustment of the mean and standard deviation to improve capability.
Figure 11.
The distribution of forces measured in the process, with adjustment of the mean and standard deviation to improve capability.
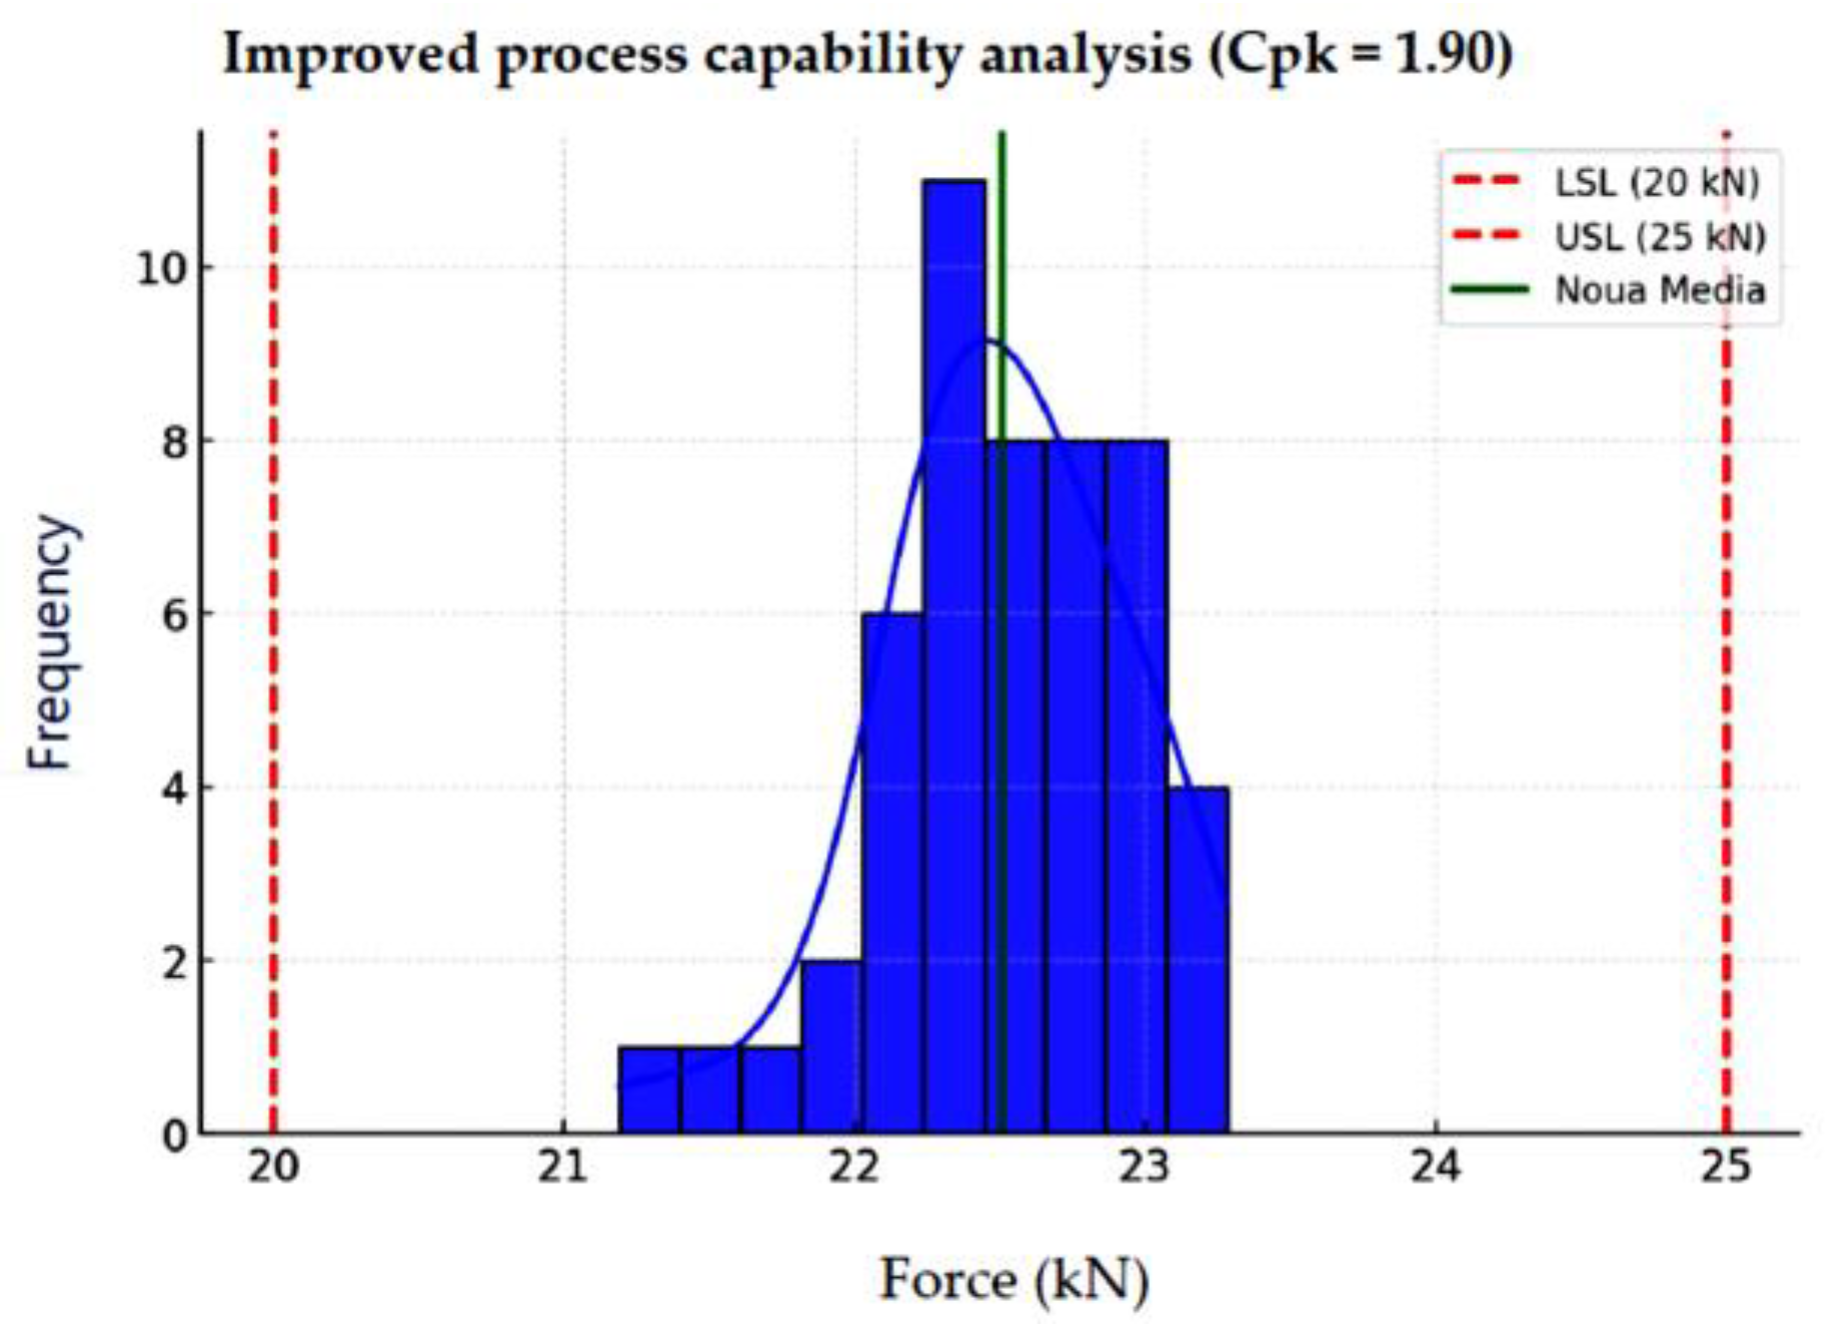
Figure 12.
The distribution of the diameter of the bolt measured after optimization.
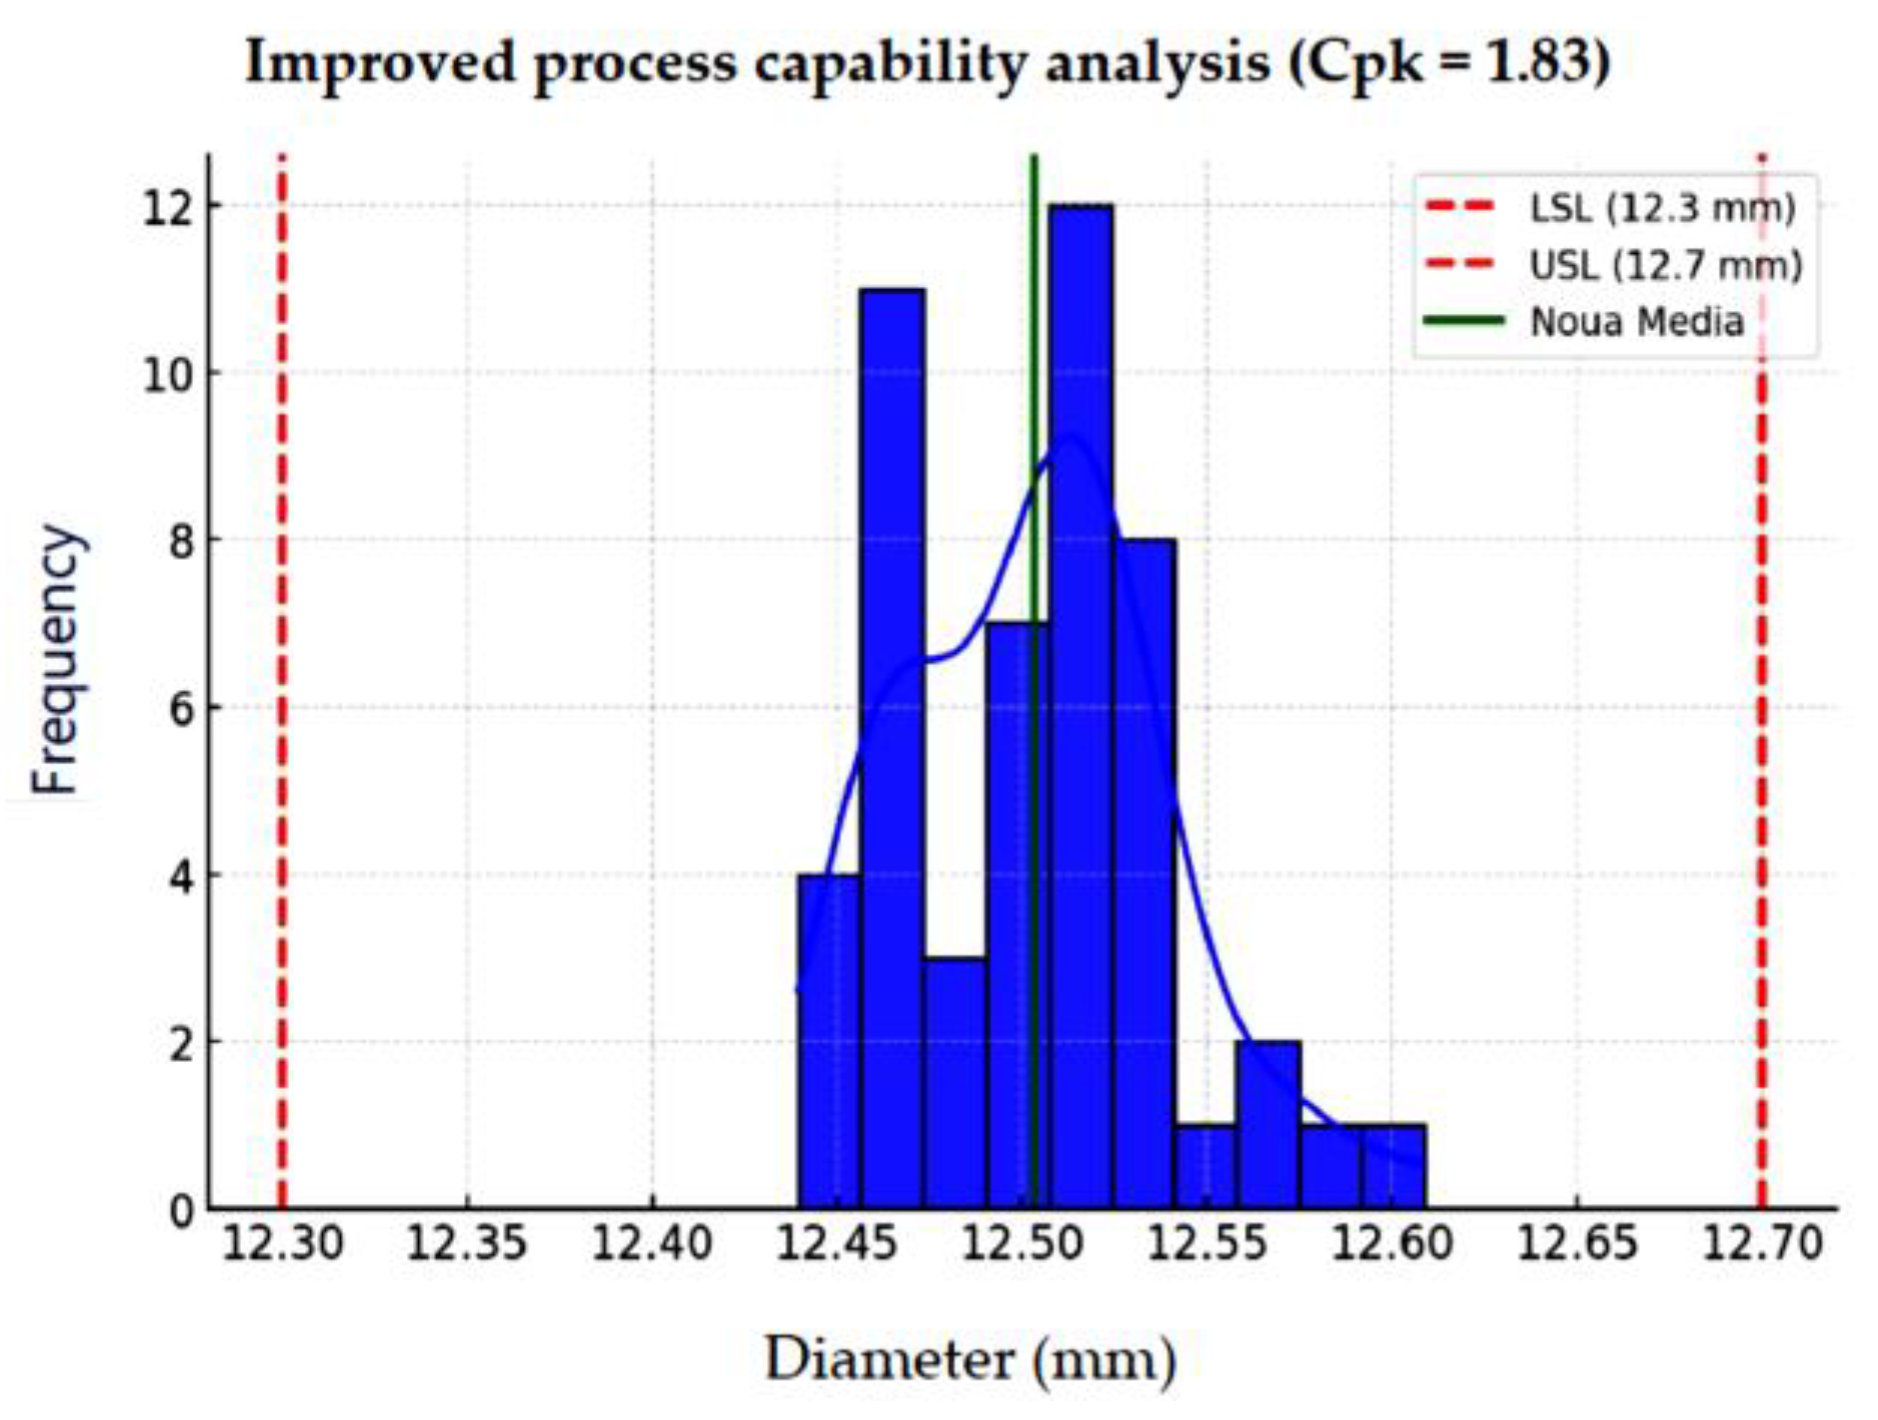
Figure 13.
Quality Evaluation.
Disclaimer/Publisher’s Note: The statements, opinions and data contained in all publications are solely those of the individual author(s) and contributor(s) and not of MDPI and/or the editor(s). MDPI and/or the editor(s) disclaim responsibility for any injury to people or property resulting from any ideas, methods, instructions or products referred to in the content. |
© 2025 by the authors. Licensee MDPI, Basel, Switzerland. This article is an open access article distributed under the terms and conditions of the Creative Commons Attribution (CC BY) license (http://creativecommons.org/licenses/by/4.0/).
Copyright: This open access article is published under a Creative Commons CC BY 4.0 license, which permit the free download, distribution, and reuse, provided that the author and preprint are cited in any reuse.


