
Submitted:
31 July 2025
Posted:
31 July 2025
You are already at the latest version
Abstract
Organ-on-a-chip (OoC) technology seeks to replicate the functions of human organs and tissues. This study investigates a flexible microfabrication method based on femtosecond laser micromachining (FLM) as an alternative for producing membranes of controlled porosity for OoCs. Polydimethylsiloxane (PDMS) membranes with various thicknesses were microdrilled. The influence of laser parameters such as pulse energy and exposure time on microhole geometry was evaluated. Pulse energy was found to significantly affect hole diameter, whereas exposure time played a comparatively minor role. Increasing pulse energy or number of pulses always led to greater microhole taper angles. Prediction models based on experimental data were developed for setting up operating parameters the laser-based ablation process. To provide a more in-depth understanding of the physics underlying the PDMS ablation, a numerical model incorporating plasma shielding effects and energy-dependent material removal was developed. Membrane biocompatibility was assessed by seeding human mesenchymal stem cells on them after assembling into an OoC device. Strong cell adhesion and the rapid formation of a homogeneous cell monolayer across all types of microdrilled membranes confirmed their suitability for bioengineering applications. Overall, FLM offers a flexible and precise approach to microdrilling PDMS membranes, highlighting its potential for integration into the fabrication of OoC platforms.
Keywords:
femtosecond laser micromachining
; polydimethylsiloxane
; microdrilling
; organ-on-a-chip
; laser ablation
; mathematical modeling
1. Introduction
In bioengineering research, organ-on-a-chip (OoC) is a cutting-edge technology to replicate structural and functional aspects of human organs on microfluidic devices. OoCs seek to overcome the limitations of both traditional in vitro 2D cell culture and animal models [1]. OoCs combine channels, chambers, and porous membranes with living cells to biomimic human organ and tissue functionality [2]. Microfabrication techniques are essential for developing these miniaturized platforms known as OoCs. In particular, the capacity to create a complex network of microfluidic channels and porous membranes is critical for potentially emulating nutrient circulation and other physiological systems [3].
Microfabrication plays a central role in the development of OoC, offering advanced technologies to build them. OoC components are typically made of optically transparent polymers and fabricated using well-established techniques such as replica molding and dry etching. The basic OoC structure comprises two or more substrates bonded to intermediate frames of varying shapes and designs that can contain channels and chambers. These substrates are essentially thin membranes with controlled porosity that enable selective substance exchange or mixing within the OoC [4]. The idea is to mimic human vessel permeability and tissue porosity. Depending on the intended application, these membranes may serve as substrates for cell co-cultures, artificial barriers, or filtration interfaces [5]. Materials such as polyethylene terephthalate and polycarbonate are employed due to their low cost and scalability [6]. However, despite its higher cost, the most widely used material is polydimethylsiloxane (PDMS), a biocompatible silicone that exhibits excellent optical and thermal properties, and easiness to handle at room temperature [7].
PDMS membranes with controlled porosity are usually produced using various microfabrication techniques [6]. One is replica molding, a soft lithography method that uses a mold with micropillars; the diameter and height of the pillars determine the micropore size and the thickness of the porous membrane [8]. To replicate the pattern, the process consists of pouring uncured PDMS over the mold, followed by curing and peeling it off [9]. Another technique is dry etching, an adaptation from the fabrication process of microelectromechanical systems (MEMS). It uses oxygen plasma or reactive gases to selectively etch PDMS through a metal mask—typically made of aluminum—to form micropores [6,10]. Although these methods are optimized for simplicity and efficiency, they present some limitations. Despite its high resolution and widespread use, replica molding requires manual steps that may introduce deformation of the pattern or various membrane defects, such as warping or pore blockage caused by micropillar breakage during the de-molding step [8]. High-aspect-ratio micropillars are especially susceptible to detachment and obstruction. Moreover, it lacks flexibility, as each new design requires a custom-fabricated mold. In the case of dry etching, the need for expensive equipment is a significant limitation, as is the existence of safety concerns due to the use of plasma and reactive gases. This method also demands precise process control and may yield non-uniform pore geometries.
To address the limitations of conventional approaches, microfabrication using ultrafast laser ablation has emerged as a promising alternative. This technique employs laser pulses lasting from picoseconds to femtoseconds, delivering extremely high peak power within short timescales and localized regions. The resulting ablation, known as cold machining, enables precise material removal with minimal secondary thermal diffusion [11]. In contrast to conventional longer pulse lasers, which primarily induce thermal effects, ultrafast pulses (typically < 20 ) initiate nonlinear optical processes, including multiphoton absorption, electron avalanche, and plasma formation [12,13,14]. In dielectric materials like PDMS, which lack conduction band electrons, ablation begins with multiphoton ionization, whereby multiple photons excite electrons across the bandgap. These free electrons initiate an avalanche process, further ionizing the material through collisions. Once electron density surpasses a critical threshold, plasma forms and ablation occurs before significant heat diffusion can take place [12,13,14]. This mechanism supports accurate micromachining with reduced collateral damage, making it ideal for fabricating sensitive microstructures.
The ultrafast laser ablation technique used in this work is femtosecond laser micromachining (FLM), which offers high resolution, minimal thermal impact, and greater flexibility and operational simplicity compared to traditional methods. FLM can process a wide range of materials, including metals and polymers, without the need for molds, masks, or additional components. It also lowers the risk of defects by reducing manual intervention. Compared to dry etching, FLM eliminates the need for controlled atmospheres and complex mask fabrication, thereby reducing equipment complexity and minimizing the number of operational parameters. It has been widely applied in micro- and nanostructuring, not only for metals but also for dielectrics such as PDMS and polymethyl methacrylate. The technique enables control over surface geometry to tailor properties like wettability, refractive index, and light propagation [15]. Laser power, pulse duration, and beam polarization are the key operating parameters that need to be tuned to achieve specific outcomes. The versatility of FLM has fueled multiple applications in different fields such as photonics, optoelectronics, biomedicine, and microfluidics [16].
Much of the research on picosecond and FLM to date has relied on empirical approaches to characterize material response under various processing conditions. A key observation is the incubation effect, identified by Huang and Guo (2009), in which repeated laser pulses progressively lower the damage threshold of the material [17]. Many studies have been focused on studying the geometry and morphology of diverse laser ablation outcomes. A linear relationship between the number of pulses and channel depth was reported by Darvishi et al. (2012), suggesting a predictable accumulation of material removal [18]. Recent works [19] further demonstrated that channel width and depth produced with FLM are sensitive to beam size and scanning parameters, supporting the idea that channel resolution can be adjusted through process control. During laser drilling of substrates, Zhang et al. (2022) identified a minimum energy threshold for ablation and observed that increasing the scan speed reduces hole diameter but increases the taper angle [11]. These findings highlight a complex trade-off between resolution, aspect ratio, and ablation efficiency. Beyond morphology, researchers have also examined how FLM affects the material chemistry. Alshehri et al. (2016) showed that femtosecond laser irradiation can switch PDMS from hydrophobic to hydrophilic due to both chemical bond rearrangements and changes in surface roughness [20]. Despite these empirical insights, theoretical models of FLM for providing deep insight into the process remain limited. An initial framework was published by Stuart et al.(1996), describing the generation of free electrons through multiphoton ionization and avalanche processes [13]. This model was expanded by Feit et al. (2004) [12], who incorporated electron recombination and laser propagation effects, demonstrating that increasing electron density leads to plasma shielding, which in turn reduces laser penetration depth.
In the present study, arrays of microholes were created on PDMS membranes of 25, 50, and 100 thickness using FLM to create porous membranes for microfluidics applications. The effects of pulse energy, number of pulses, and membrane dimensions on microhole geometry and quality were investigated. Numerical simulations complemented the experimental information by modeling the material removal process. The application of the technique was demonstrated by bonding the laser-drilled membranes into an OoC device and assessing biocompatibility and cell monolayer formation.
2. Materials and Methods
2.1. Materials
PDMS Sylgard 184 (Dow Corning Corporation, USA) was purchased to prepare membranes of varying thicknesses. The kit includes the prepolymer (or base) and the cross-linker (or curing agent). The properties included in the numerical model corresponding to PDMS are summarized in Table 1. Known values for PDMS were used directly, whereas unknown parameters were either estimated or approximated using those of water due to the similarity in their optical properties and dielectric behavior. Similarly, in cases where variations in these parameters had minimal or no impact on the simulation results, reference values for water were also used.
Acrylic plates (Plásticos Durán e Hijos S.L., Spain) with a diameter of 80 and a thickness of 6 were used during the membrane preparation process. In subsequent FLM, the PDMS membranes were supported on 120 -thick cover glasses (Thermo Fisher Scientific, Waltham, MA, USA). The prepared samples were placed on -thick glass slides (Thermo Fisher Scientific, Waltham, MA, USA) for microscopic inspection. The membranes were sputter-coated with Au/Pd (Leica Microsystems, Wetzlar, Germany) for visualization using a scanning electron microscope (SEM).
2.2. PDMS Membrane Preparation
PDMS membranes with controlled and uniform thickness were fabricated via spin coating, following established protocols [21]. The base and curing agent were mixed at a 10:1 weight ratio (as recommended by the manufacturer), degassed using a Thinky Mixer (Thinky, USA), and poured onto a smooth acrylic plate. The mixture spread over approximately two-thirds to three-quarters of the plate and was further spread using a Spin 150i spin coater (SPS, Vaulx-Milieu, France) operating at speeds between 100 and 750 . The spin-coating procedure was conducted for 120 with an acceleration of 20 / until the target speed was reached. The samples were cured in a 80 convection drying oven (Thermo Fisher Scientific, Madrid, SP) at 60 °C for 60 , and stored at room temperature (RT, 25 °C). After cured, the PDMS membranes were detached from the acrylic plates, and small pieces were cut from the edge toward the center. The membrane thickness was measured using SEM.
2.3. Manufacturing of Microholes on PDMS Membrane Using FLM
The FLM technique was used to create microholes in PDMS membranes. The experimental setup is shown in Figure 1. It consists of a chirped pulse amplification (CPA) Ti:Sa femtosecond laser system (Spectra-Physics, California, USA) with a pulse duration of 60 , a wavelength of 800 , a pulse repetition rate of 5 , and a maximum pulse energy of . The number of pulses or exposure time delivered to the PDMS membrane was controlled by an electromechanical shutter (Uniblitz VCM-D1 Shutter Driver, Vincent Associates, Rochester, NY, USA). Pulse energy was adjusted using an attenuator composed by a half wave plate and a linear polarizer (Thorlabs, Newton, NJ, USA). The samples were positioned on a cover glass, and mounted on a motorized translation stage with 3 axes movement capabilities (Physik Instrumente, Eschbach, Germany). The laser beam was focused onto the PDMS surface using a microscope objective (HCX PL Fluotar 10×) with a numerical aperture of 0.30. The spot diameter at the focal plane was estimated to be 7 . A charge-coupled device (CCD) camera, connected to a computer via a beam splitter, was used to monitor the PDMS surface and assist with laser beam focusing.
The detailed processing parameters used for microdrilling the PDMS membranes are listed in Table 2. Two series of experiments were conducted on membranes of varying thicknesses to investigate the relationship between the processing parameters and the resulting hole geometry: (1) the exposure time was held constant while the pulse energy was varied; (2) the pulse energy was held constant while the exposure time was adjusted.
All experiments were performed following the same procedure, which was automated using a single program (script) written in MATLAB© code (version R2025a, MathWorks Inc., Natick, MA, USA) . An array of nine holes was created, with 40 spacing between holes in both directions. Porous PDMS membranes were then fabricated by adjusting the laser operational parameters to the most suitable values based on the experimental data gathered in the previous steps. These membranes feature holes with a diameter of 10 , a vertical spacing of 33 , and a horizontal spacing of 40 . The rows of microholes were arranged in a staggered pattern, and the total microperforated area measured 1 × .
2.4. Direct Optical Microscopy
PDMS membranes were placed on clean glass slides for microscopic observation. A motorized fluorescence microscope, ZEISS AXIO Imager Z1m (University of Salamanca, Spain) equipped with objective lenses of 5×, 10×, 20×, and 50× magnification, was used. Images of the microholes were acquired to evaluate the quality of the fabricated samples and to measure hole diameters.
2.5. Scanning Electron Microscopy Imaging
The quality and dimensions of the microdrilled membranes were assessed using a scanning electron microscope (SEM) Hitachi S4800 (University of Valencia, Spain). Samples were prepared by first being slowly cooled to °C, then immersed in liquid nitrogen for 10 min. After freezing, the samples were cut and coated with Au/Pd. SEM images were acquired under an accelerating voltage of 10 . Microhole diameters were measured from the SEM images using ImageJ software (National Institutes of Health, USA).
2.6. Determination of the Taper Angle of Holes
The taper or conicity angle of the laser-drilled holes was calculated by applying the following equation:
where is the taper angle, D is the entrance diameter, d is the exit diameter and is the membrane thickness.
2.7. Mathematical Modeling of the PDMS Ablation Process
To simulate the interaction between ultrashort pulse lasers and PDMS, a 2D axisymmetric model was developed. The temporal evolution of the electron density in the sample was modeled using the expression proposed by M.D. Feit et al. [12] to describe ablation in dielectric materials. This expression was adapted to include spatial dependence. To simplify the model, the electron spatial diffusion term was neglected:
where n represents the free electron density as a function of time t and spatial coordinates r and z, I denotes the laser intensity while corresponds to the multiphoton ionization process. The third term on the right-hand side of the equation accounts for the recombination of free electrons with available ions, being the recombination coefficient. The term represents the avalanche ionization process that occurs when conduction band electrons absorb energy from the laser, triggering an ionization cascade. To describe this process, the expression proposed by M.D. Feit et al. [12] was employed:
where is the laser frequency, c is the speed of light in vacuum, is the average energy of the free electrons, and is the energy required to overcome the band gap. The function represents the dielectric permittivity of the material, modeled according to Drude´s theory:
where is the collision frequency, is the relative permittivity of the material, and is the critical electron density calculated as:
where is the electron mass, and e is the electric charge.
describes the multiphoton ionization process, in which electrons absorb multiple photons to reach the conduction band. This term was modeled using the equation defined by Keldysh [22]. In a simplified form, the resulting expression is as follows:
where is a constant dependent on the material and the laser, and p is the number of photons that an electron must absorb to transition to the conduction band.
The intensity of the laser pulse was simulated using the following model:
where represents the spatial distribution of the laser energy and describes the temporal evolution of the pulse. It was assumed that the energy supplied by the laser follows a Gaussian distribution with an exponential attenuation as a function of depth. In this context, the spatial distribution of the laser was defined by the following expressions:
where represents the laser fluence, which depends on the pulse energy and the beam radius at the focal plane, . The parameter describes the variation in the beam radius as a function of depth z, which is defined as negative in the downward direction, taking into account the laser wavelength . The absorption coefficient, a, is derived from the ratio between the expression proposed by B.C. Stuart et al. [13] and that of M.D. Feit et al. [12]:
The temporal term , which describes the generation of a Gaussian pulse, is defined by the following function:
where denotes the pulse width and is a temporal offset set equal to in the simulation. Material removal was defined under the condition that the generated plasma reaches the critical density, thus assuming it has absorbed enough energy to be expelled from the system.
For the simulation, a rectangular geometry was defined with its left edge aligned with the axis of revolution of the beam. The dimensions are a width of 50 , greater than the typical distance between the holes used in the fabrication of the membrane and a depth of 25 , comparable to the thickness of the PDMS membranes used. To ensure adequate resolution in the calculations, the geometry was discretized using a structured quadrilateral mesh with a maximum element size of . The simulation was carried out using COMSOL Multiphysics (version 6.2, COMSOL Inc., Burlington, MA, USA, 2023).
2.8. Cleaning and Assembling of OoC with Microdrilled PDMS Membranes
To clean the PDMS membranes, an ultrasonic cleaner was used at a frequency of 40 for 15 using a solution (in a 1:1 volume ratio) of ethanol and acetone. Then membranes were washed 5 times with 1x phosphate-buffered saline (PBS), soaked in 70% ethanol for 10 , and left to dry in petri dishes overnight at RT. Membranes were observed under a scope to detect potential damage and check the status of both surfaces. After cleaning, samples were handled exclusively with forceps or gloved hands, taking care to touch only the edges of the membranes (undrilled areas).
PDMS drilled membranes and OoC were dried with an air gun before bonding to remove any debris on the surface. The surfaces to be exposed to plasma were free of any material or cover before moving into the glass chamber of the plasma machine. The bonding step was performed by using a plasma machine (Diener Nano) using as plasma settings a duration of 60 with 20 power and pressure lower than . A double cell chamber and two fluid channels OoC device was selected for the experimental validation [23]. This OoC has an upper and lower cell chamber. The microdrilled membrane is located at the interface of both chambers. After plasma treatment, the membrane were gently laid on the plasma-treated side of the frame, as centered as possible. Every PDMS part was carefully aligned with the others to ensure uniform contact, and steps were taken to prevent air entrapment between the layers.
2.9. Cell Culture
Human adipose-derived mesenchymal stem cells (hASCs) from healthy donors aged 18–35 were graciously provided by Dr. Escobedo-Lucea at Fundación de Investigación del Hospital General de Valencia, Spain. hASCs were seeded in culture flasks containing growth medium—Dulbecco’s Modified Eagle’s Medium (DMEM, Invitrogen)—supplemented with mesenchymal stem cell-qualified bovine serum (Gibco, Grand Island, NY), and maintained in a humidified atmosphere of 95% air and 5% at 37 °C. The medium was replaced every three days [24]. Upon reaching confluency, cells were enzymatically detached using TrypLE© (Invitrogen) and transferred into the microfluidic devices containing fresh growth medium. Three OoC devices per membrane thickness (n = 3) were seeded at density 8000 cells. OoC were kept in the incubator for more than 24 without flow stimulation to guarantee cell adhesion and monolayer formation over the PDMS membranes. Unprocessed membranes and glass cover slips were employed as controls.
2.10. Cell Staining
For cell staining, the samples were fixed with 4% PFA in PBS, followed by three washing steps of at least 5 . Actin filaments were stained by incubation with Phalloidin Alexa 488 (dilution 1:100; Thermo Scientific) at RT for 15 and washed three times with PBS. The nuclei were counterstained with DAPI (Sigma–Aldrich).
2.11. Inverted Optical and Confocal Microscopy
Inverted optical microscopy Leica DMi8 (University of Valencia, Spain) was employed to monitor multiple steps of the experimental work, such as the ablation procedure, cell seeding, monitoring of cell monolayer, surface morphology characterization, and finding potential defects.
Confocal microscopy was used to provide detailed pictures and cross sections (image stacks) of the hASCSs monolayer over the samples. Fluorescent images were captured using a ZEISS LSM 980 confocal microscope (University of Valencia, Spain). The samples were kept in darkness during the whole procedure. The situation of the microdrilled membranes during confocal imaging of OoC samples was determined by adding a transmitted PMT (T-PMT) to visualize the location of the holes.
2.12. Statistical Analysis
Statistical analysis was performed using MATLAB©. For each set of experimental conditions, the mean, standard deviation (SD), and standard error were calculated from individual measurements obtained under identical conditions. For graphical representation and empirical modeling, linear regression analysis was applied to evaluate the relationships between variables. The models were expressed using fitted equations and coefficients of determination () to describe trends and assess the goodness of fit.
3. Results and Discussion
3.1. Exploration of the Capabilities of FLM for Drilling PDMS Membranes
To investigate the influence of pulse energy and drilling time on microhole geometry, a series of experiments were conducted on PDMS membranes of varying thicknesses. The results are presented in two complementary phases: the first examines the effect of pulse energy under fixed exposure durations, while the second evaluates the influence of exposure time at constant energy levels.
To elucidate the influence of the laser operational parameters on the ablation dynamics and geometric precision of microholes produced in PDMS membranes, a systematic set of experiments was performed on films of three distinct thicknesses. In the first experimental set, the pulse energy ranged from 4 to 20 under three exposure-time conditions: 600, 1000, and 1400 . In the second set, the pulse energy was fixed at 4, 10, and 16 , while the exposure time was adjusted between 800 and 1800 . For each condition, a nine-hole array was manufactured. The entrance and exit diameters of the perforations were subsequently measured to assess the ablation efficiency and the geometrical quality of the resulting micro-patterns.
3.1.1. Effect of Drilling Time and Pulse Energy on Microholes Dimensions Using FLM
Pulse energy and drilling time seem to be the most influential parameters when determining microholes geometry [11]. A series of experiments were conducted on PDMS membranes of varying thickness to clarify material response under different processing conditions. The effect of pulse energy was first examined under fixed exposure durations, followed by a second experimental phase that evaluated the response under varying exposure times at constant energy levels.
A linear relationship between the number of pulses and ablation depth has already been reported [18]. Figure 2a,c,e illustrates the evolution of entrance and exit hole diameters in three PDMS membrane thicknesses as a function of pulse energy under constant pulse duration. The results revealed a strong positive linear relationship between pulse energy and both entrance and exit diameters, with the lowest value being 0.8864 and all other regression values exceeding 0.9334. The rate of increase differs significantly: entrance diameters expand more rapidly with increasing pulse energy, whereas exit diameters display a more gradual change. This divergence became more pronounced as membrane thickness increased, suggesting a more severe attenuation of the laser beam, enhanced plasma shielding effects, and a potential geometrical influence, whereby the laser pulse may be diffracted by the hole boundaries, thereby reducing the energy reaching the bottom of the membrane. In the 25 thick membranes, slope values reached up to 0.8305 for entry holes, while for exit holes, the lowest slope was 0.6046. The 50 thick membranes reached slope values of 0.7805 for entry holes, while the exit slope remained nearly constant at 0.50. In the case of the 100 membrane, the entrance diameter slope reached up to 1.2471, while the exit slope remained stable around 0.6.
For thin membranes, as shown in Figure 2a, the exit diameter remained relatively stable across all exposure times and varied primarily with pulse energy. This may be attributed to the ablation threshold of PDMS and the divergence of the laser beam during propagation in the membrane. Both parameters can limit the pulse energy reaching the exit surface of the membrane. Regions where the absorbed energy exceeded a critical threshold exhibited increased exit diameters. Under constant pulse energy, longer exposure times did not significantly affect the exit size due to the capacity of the material to dissipate energy. In contrast, entrance diameters displayed a modest but noticeable dependence on drilling time. As shown in Figure 2a, at a exposure time of 600 , entrance diameters were at least 12% smaller compared to those produced with longer exposures, particularly at pulse energies below 12 . The largest difference was observed at 12 , with a 40% increase in entrance diameter between 600 and 1400 . This trend is attributed to the incubation effect, which refers to the permanent modification of the material in regions where ablation was not initially achieved but where chemical damage occurred. As a result, material properties, such as absorption, were enhanced, and ionization during subsequent pulses became more readily attainable, thereby facilitating ablation. When individual pulses fell below the threshold fluence, the excitation induced by successive pulses gradually led to the incubation effect, ultimately resulting in a reduction of the ablation threshold. At very low energies, such as 4 , this effect was barely noticeable, as the energy was insufficient to induce cumulative damage on the material. At pulse energies higher than 12 energies, the entrance diameter did not change across different exposure times. This indicates that at an exposure time of 600 , direct ablation had already been completed, and the incubation effect had occurred in all regions where it was feasible. Consequently, further increases in exposure time did not result in significant changes to the final geometry. According to Figure 2c, a similar trend was found in membranes of 50 thickness, with entrance diameters exhibiting a strong time-dependent increase at lower energies but diminishing at high energy levels. Exit diameters remained relatively constant, reinforcing the conclusion previously drawn for thin membranes: the entrance diameter is more sensitive to variation in exposure time than the exit diameter, as the laser is focused on this plane, delivering more energy at this point, and phenomena such as incubation occur more effectively in this region.
We wondered whether the divergence between entrance and exit diameters would become more pronounced in 100 membranes. Entrance diameters increased sharply with pulse energy and showed strong dependence on the number of pulses. Surprisingly, exit diameters exhibited behavior similar to that observed in 25 membrane: they depended primary on pulse energy and remained relatively insensitive to exposure time. Entrance diameters reached up to 25 under the highest energy pulse and exposure conditions, whereas those in 25 and 50 membranes did not exceed 20 . This trend may reflect the combined effects of plasma shielding, which blocks or absorbs subsequent pulses, and increased energy attenuation within the bulk material [25]. Both effects can reduce the energy transmitted to the back surface of the membrane, and consequently, laser energy will become increasingly confined at the entry region, intensifying surface-level ablation and limiting laser penetration depth.
Studies on the effect of the number of pulses on the response of the material have primarily focused on identifying a relationship between the size of the permanently damaged area and the number of pulses, as well as on investigating the incubation effect [17]. Other studies have examined this effect indirectly by controlling the laser scanning speed or the number of passes, both of which are directly related to the amount of energy absorbed by different regions of the material along the laser path [11,19]. In the second experimental phase, the effect of the number of incident pulses on the resulting geometry was directly investigated. Figure 2b,d,f presents the results obtained from this experiment, showing that, with exposure times varying at fixed pulse energy levels, entrance diameters exhibited a slight linear increase again, with the steepest slope being / for thin membranes, while exit diameters remained largely unchanged. The almost negligible slope of the exit diameters in Figure 2b,d,f indicates a clear independence from processing time. The increase in entrance diameter with longer exposure times may be attributed to the accumulation of damage and energy in peripheral regions, where the extended exposure duration enabled these initially sub-threshold areas to eventually reach the ablation threshold and undergo material removal. This entrance diameter increment due to incubation phenomena was especially prominent in thick membranes, where energy delivery was reduced due to beam divergence and plasma shielding. Finally, it was shown that exposure time played a less significant role than pulse energy in determining the geometric dimensions of the hole, producing negligible changes in exit diameter for exposure time increases from 800 to 1800 , while the most pronounced increases in entrance diameter occurred at energy levels up to 16 , likely due to the incubation effect in peripheral regions.
Thickness is considered by many researchers a critical factor in micromachining materials [16]. Our results in Figure 2 indicate that membrane thickness was a key factor when setting up the processing parameters to achieve a particular hole geometry. At pulse energies above 12 and for high number of pulses—particularly at exposure times of 1000 or longer—entrance diameters for membranes of 100 thickness were larger than those observed in thinner membranes, indicating a greater capacity for energy absorption. In contrast, exit diameters varied little with thickness, exhibiting similar growth trends across all samples. Another parameter, exposure time, has also emerged as crucial to precise control of hole geometry. Short exposure durations (< 1000 ) tended to yield smaller holes at fixed pulse energy, while longer than 1000 produced nearly identical diameters. A saturation effect in PDMS ablation appears consistent with prior findings in other materials [26]. Given its dominant influence on hole diameter across both experimental phases, pulse energy must be carefully optimized with respect to membrane thickness, exposure time, and the intended geometric outcome.
3.1.2. Influence of the Main Process Parameters on Picrohole Quality
The production of high-quality laser-drilled microholes is essential for ensuring the structural and functional performance of PDMS membranes in OoC devices. Imperfections introduced during laser processing—such as thermal damage or non-uniform geometry—can significantly affect membrane behavior, particularly fluid transport. A critical aspect in this context is the geometry of the holes, since theoretical and computational models often assume perfectly cylindrical channels to predict flow behavior accurately. We assessed microhole quality by two variables: (i) the heat-affected zone (HAZ) and (ii) the taper angle.
Figure 3 and Figure 4 show optical microscopy images of microholes obtained under varying pulse energy and exposure time, respectively. These results reveal clear trends in the extent and distribution of the HAZ as a function of membrane thickness.
As shown in Figure 3, at a constant exposure time of 1000 , increasing the pulse energy from 8 to 20 resulted in negligible variations in the heat-affected zone (HAZ) across all three membrane thicknesses. However, differences in HAZ morphology were observed among the different thicknesses. In 25 membranes, the HAZ appeared as a darkened region surrounding both the entry and exit holes, extending to approximately twice the hole diameter. In 50 membranes, the HAZ retained similar dimensions at the entry site but was significantly reduced at the exit, showing less pronounced darkening. In 100 membranes, the HAZ was notably reduced, with a dimension reduction of 50% extension at the entry hole and negligible thermal effects at the exit. These observations suggest a direct relationship between membrane thickness and thermal damage. Thinner membranes are more susceptible to heat accumulation, resulting in more extensive HAZ formation, whereas thicker membranes dissipate heat more effectively, limiting thermal effects. Additionally, laser fluence decreases as the beam propagates through the material due to absorption, scattering, and divergence, reducing the energy available to affect deeper layers.
Figure 3 also confirms conclusions drawn in the previous section and, as demonstrated in Figure 2a,c,d shows that increasing the pulse energy consistently enlarged hole diameters across all membrane thicknesses. However, the size of the HAZ remained nearly constant for each thickness. This may be attributed to the fixed laser beam diameter of 7 , which constrained the irradiated area. Although the pulse energy increased significantly from the initial value, the beam footprint remained unchanged, resulting in higher fluence and more efficient ablation without significantly increasing lateral thermal diffusion. Consequently, the HAZ did not expand proportionally with the hole size.
A similar pattern was observed in Figure 4, where the pulse energy was held constant at 10 while the exposure time was varied from 800 to 1800 . The extent and distribution of the HAZ varied markedly with membrane thickness. In 25 membranes, the HAZ remained pronounced and homogeneously distributed around hole openings. This is consistent with the limited heat diffusion capacity, which resulted in thermal accumulation even under moderate exposure times. As thickness increased to 50 , the HAZ became asymmetric—expanding significantly around the exit hole (up to three times its diameter) while diminishing near the entry. This effect could be attributed to laser beam attenuation and divergence, which may enlarge the interaction volume at the distal surface and promote sub-threshold heating in surrounding regions without triggering ablation. For 100 membranes, HAZ formation was minimal at both entry and exit sites. The greater material volume enhanced thermal dissipation near the entry, and beam attenuation–particularly as thickness approached or exceeded the Rayleigh length–limited energy delivery to the exit surface, reducing thermal effects.
The taper angle of the microholes is a key indicator of geometric quality—particularly in applications requiring precise control of fluid flow-and serves as an important metric alongside thermal effects. Minimizing the taper angle is essential for maintaining consistent cross-sectional geometry. Conicity in microholes fabricated by FLM arises from fundamental optical and thermal mechanisms. As the laser propagates into the material, the beam diverges beyond its focal point, leading to broader interaction zones at greater depths. Simultaneously, the effective laser fluence decreases with depth due to scattering, absorption, diffraction on the hole walls, and plasma shielding, which restricts ablation primarily to the laser-receiving region. These combined effects result in conical holes with narrower exits. Figure 5 shows that the taper angle increases directly with pulse energy under different laser conditions. In contrast, increasing the exposure time only produced a moderate increase, suggesting a potential saturation effect where longer exposures add little to entrance widening beyond a certain threshold. These geometric changes aligned with the diameter trends shown in Figure 2, where the entrance diameter grew more rapidly than the exit as energy or exposure time increased. This effect was more noticeable in thick membranes, where attenuation prevented the exit from expanding proportionally. Thus, the taper angle served as a reliable indicator of energy distribution and ablation dynamics along the depth of the hole.
We conclude that HAZ and taper angle are strongly influenced by membrane thickness and laser operating parameters. While pulse energy was the dominant factor in determining hole morphology and thermal effects, exposure time and membrane thickness modulated these responses by affecting heat accumulation and energy propagation. A fine-tuning of these parameters is therefore essential to achieving high-quality microholes tailored to specific application requirements.
3.2. Numerical Simulation of Femtosecond Laser Pulse and PDMS Interaction
3.2.1. Temporal Evolution of the Electron Density for a Single Laser Pulse
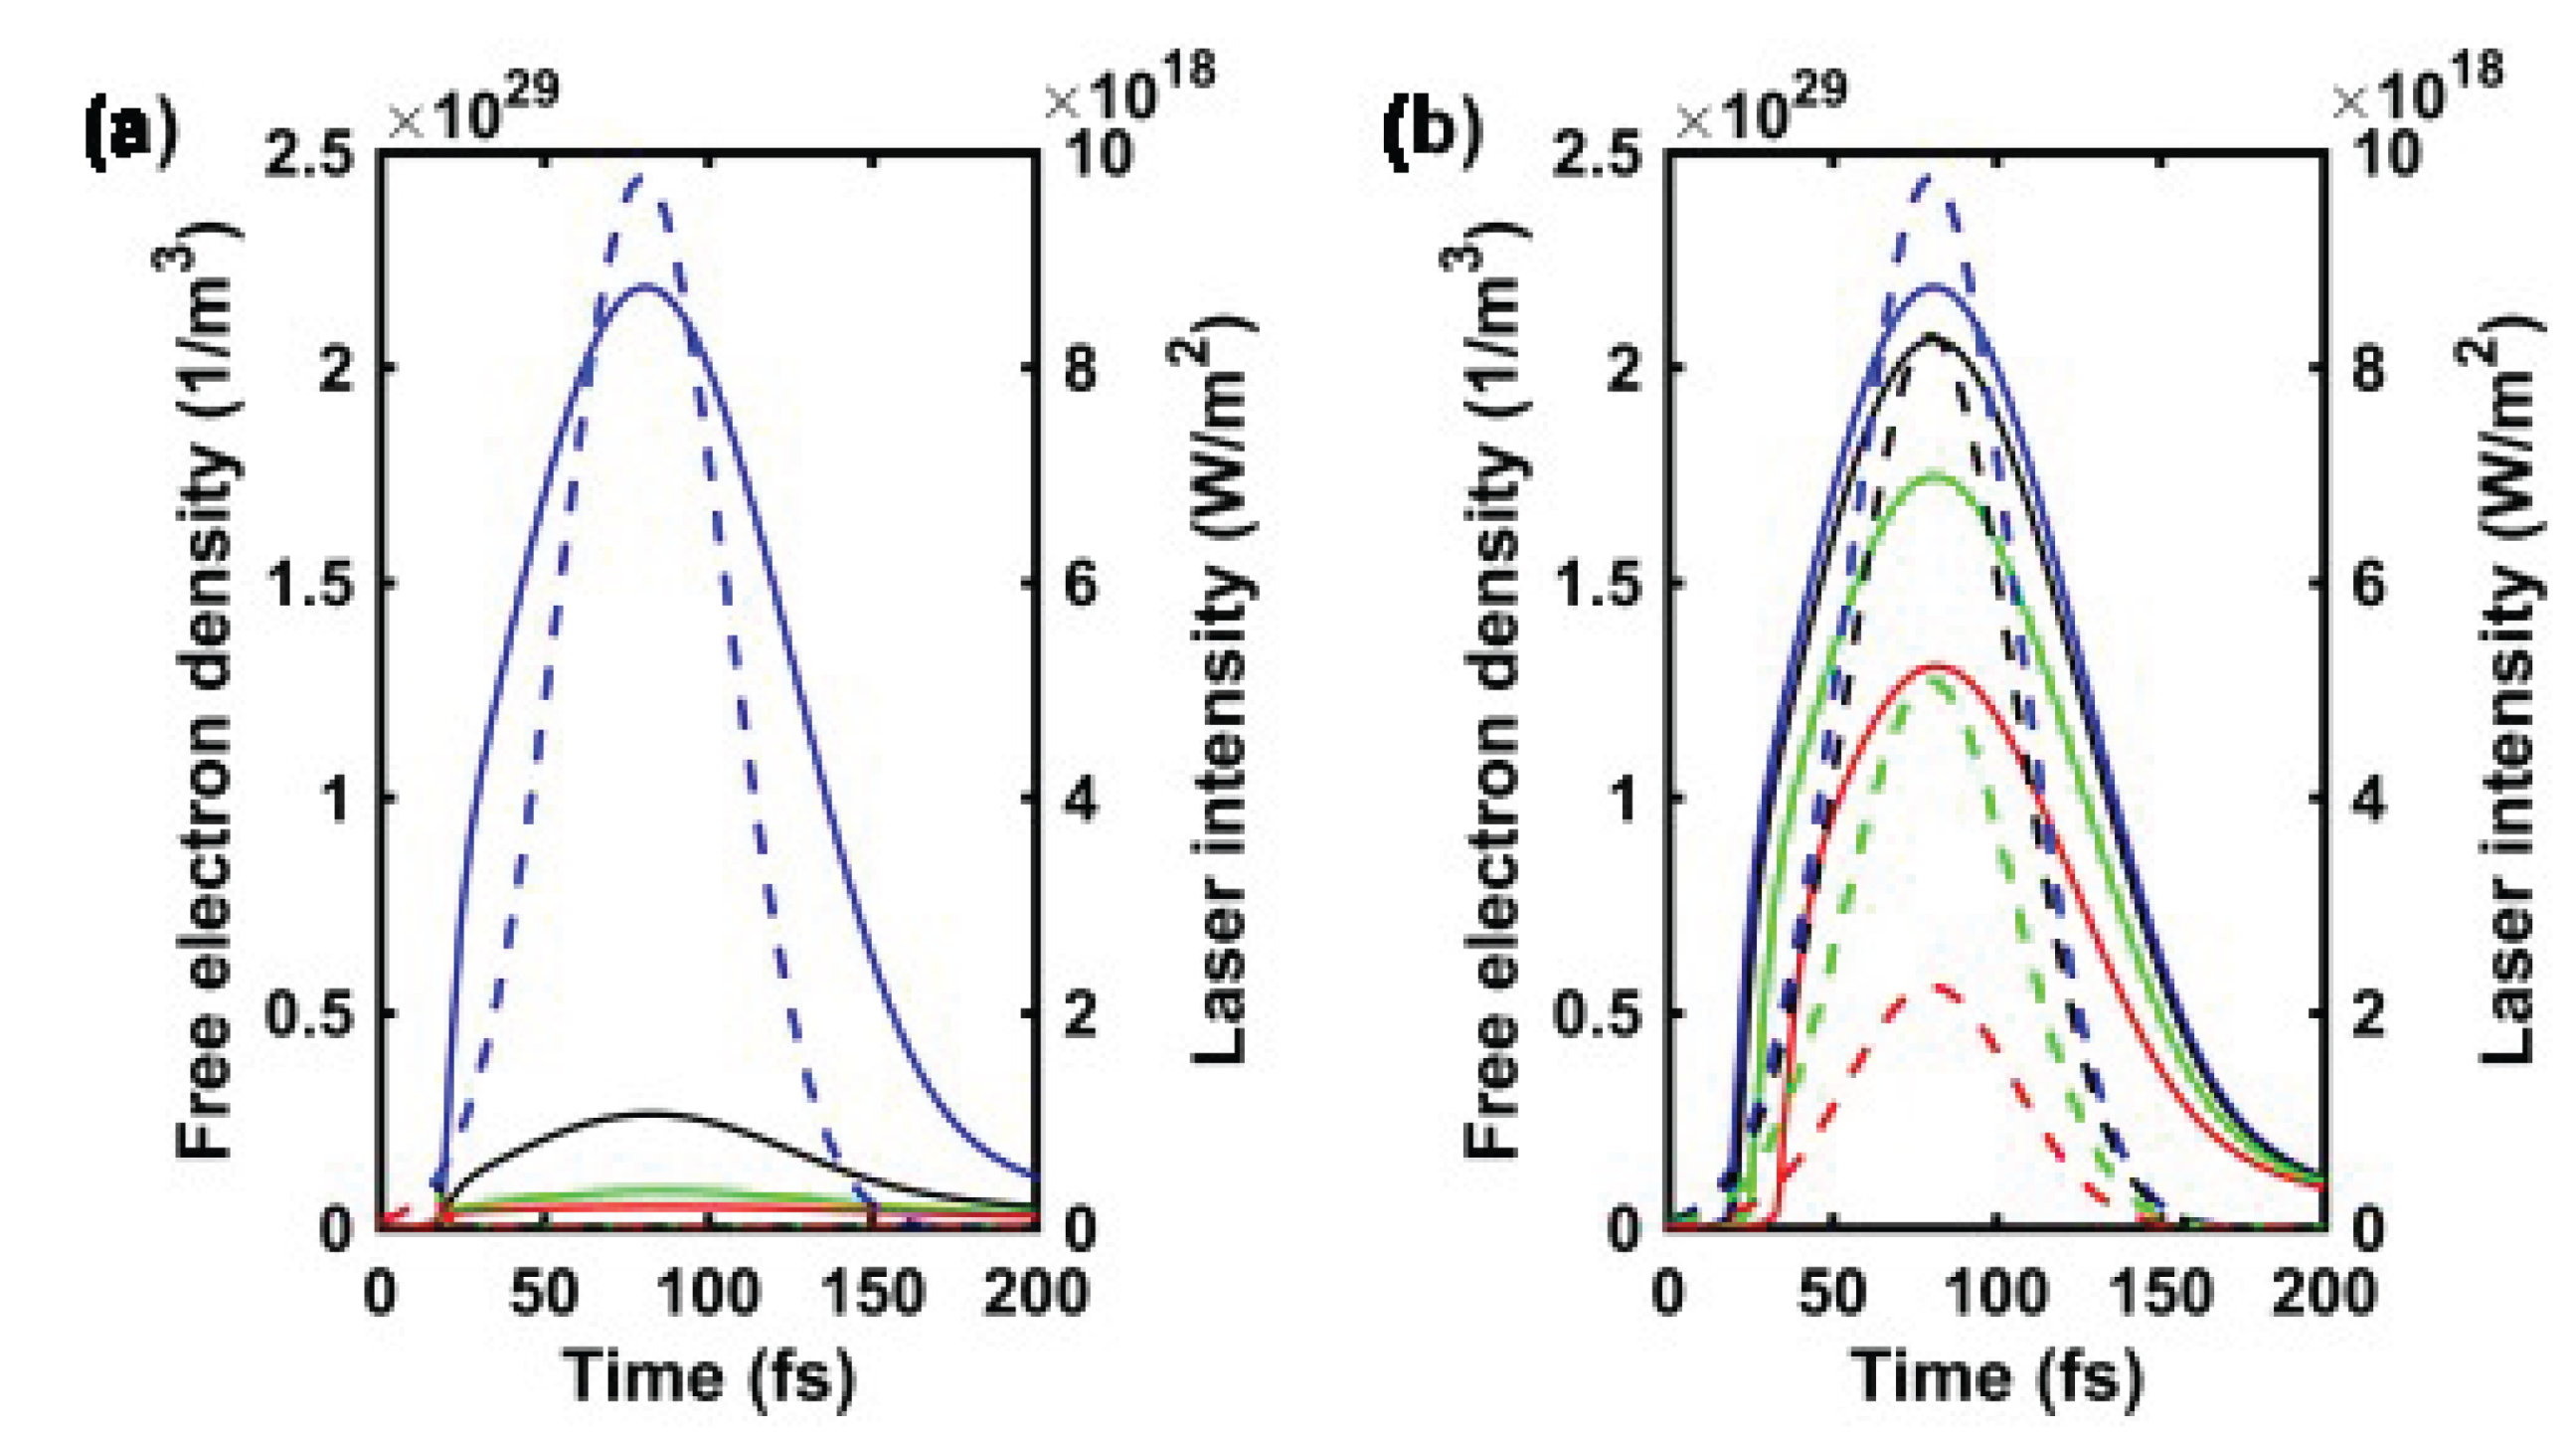
The ultrashort timescales, confined spatial domains, and intense energy levels characteristic of FLM give rise to a range of complex optical, thermodynamic, chemical, and mechanical phenomena [27]. To gain deeper insight into the response of PDMS under exposure to ultrashort laser pulses, the simulation was performed for a pulse energy of 4 . This energy level proved sufficient to induce significant changes in the free electron density (n) throughout the simulation. Figure 6a illustrates the spatiotemporal evolution of the free electron density at selected time intervals during the simulation. Within the first 15 , a generalized increase in n was observed across the simulated depth as the laser propagated through the material with minimal absorption. In this early stage, PDMS behaved as a transparent medium, since laser absorption depends on both the free electron density—which remained low at this point—and the laser intensity, which was still relatively weak. As the laser intensity rose, multiphoton ionization became increasingly significant, leading to a rapid increase in free electron generation and the onset of an avalanche ionization process. This resulted in a progressive accumulation of free electrons near the surface (t = 25 ), indicating increasingly localized energy deposition. Two key phenomena emerged from this behavior: (1) a sustained increase in absorption and free-electron generation in the superficial layers, driven by a positive feedback loop between these processes; and (2) a progressive reduction in free-electron density growth in the deeper regions, particularly beyond 25% of the laser wavelength. This attenuation was attributed to a screening effect that became more pronounced as the electron density approached the critical plasma density (t = 25 ). At this point, the plasma absorbed and reflected most of the incoming radiation, significantly limiting the energy that penetrated deeper into the material.
Figure 6b,c further quantify the temporal evolution of both the free electron density n and the laser intensity I at various spatial coordinates within the simulation domain, both in depth (z) and radial distance from the beam axis (r). Figure 6b presents these variables at the surface and at three increasing depths, spaced apart. During the first 20 , n and I exhibited similar behavior across all depths. However, after this point, the surface electron density reached , causing a steep decline in laser intensity at depths beyond a quarter of the wavelength. This effect was particularly evident at z = , where a significant drop in intensity slowed the local increase in free electron density compared to the surface. These observations reinforced the earlier conclusion: once the surface plasma reaches critical density, a strong screening mechanism arises, confining further increases in n to a sub-wavelength layer near the surface. In contrast, Figure 6c depicts the same variables as a function of radial position at the surface. Here, electron density growth became progressively more gradual with increasing radial distance, reflecting the Gaussian intensity profile of the laser beam. At the beam periphery, where intensity was lower, ionization was less efficient and n increased at a reduced rate. Since the analysis is restricted to the surface, the screening effect was absent in this case. Notably, the radial variations in n and I revealed a proportional relationship, whereby a decrease in local laser intensity was accompanied by a corresponding decrease in free electron density along the radial direction.
These results aligned well with previous findings by M.D. Feit et al. [12], who reported that once the critical density is reached, the plasma acts as an optical barrier, preventing further penetration of the laser energy. Furthermore, the simulation outcomes showed good consistency with experimental observations made by H. Huang and Z.X. Guo [17], who investigated the damage threshold of PDMS under femtosecond laser irradiation. They found that ablation from a single pulse was confined strictly to the material’s surface, a behavior fully consistent with the results of the simulation presented.
3.2.2. Effect of Pulse Energy on the Electron Density
A laser pulse with an energy of 4 has been shown to be sufficient to induce a material response characterized by the generation of plasma and the attainment of critical free electron density. It follows that higher pulse energies are expected to produce similar or enhanced effects. To investigate how the material response evolves with increasing pulse energy, two additional simulations were performed with pulse energies of 8 and 12 . This approach enabled an evaluation of whether the observed increase in electron density followed a linear trend or if nonlinear mechanisms, such as saturation effects or threshold-dependent behavior, began to dominate the interaction.
Figure 7a provides color maps showing the evolution of electron density at 15 and 30 for 8 and 12 pulse energy, allowing direct comparison with Figure 6. Additionally, Figure 7b,c presents the same types of plots as those shown previously for the 4 case, now with results corresponding to the 8 . For 12 plots are provided in Figure B1 in Appendix B. The analysis of Figure 7b revealed that the increase in free electron density was not proportional to the increase in pulse energy. This was clearly evident in the evolution of n at the surface: while a peak density of / is reached for 4 , the values for 8 and 12 rise to / and /, respectively. Similarly, at z = , little variation was observed among the three simulations, which was consistent with the fact that, once the critical density is reached, deeper growth is hindered by the screening effect. As a result, the internal regions of the simulated material experienced minimal changes in response to increasing pulse energy.
On the other hand, analysis of the system’s response to increased energy showed that higher-energy pulses triggered earlier onset of multiphoton ionization and the subsequent electron avalanche. This behavior was expected: during the initial phase of the pulse—when the laser intensity had not yet reached 15% of its peak value due to its Gaussian temporal profile—higher pulse energy accelerated the generation of free electrons. Figure 6c, Figure 7c and Figure B1b exhibited similar behavior, confirming that increasing the pulse energy led to higher electron densities. More importantly, a key aspect emerged: as the pulse energy increases, a larger surface area reaches the critical electron density. Consequently, the laser-affected zone expands, exceeding the ablation threshold in regions farther from the beam center. These observations were further corroborated by the density maps in Figure 7a. Compared with Figure 6a, it was evident that at t = 15 , the material still retained some transparency at 4 , whereas at 8 and 12 , plasma-induced screening had already begun. At t = 30 , the region of plasma generation clearly expanded radially with increasing pulse energy, in agreement with previous findings.
Although increasing the pulse energy did not produce a proportional rise in the maximum free electron density—according to the simulation results—it had a pronounced effect on the spatial extent of the modified region. This trend was consistent with experimental observations, where higher pulse energies led to a clear increase in the diameter of the ablation craters. These findings underscored the role of pulse energy as a key factor governing the lateral expansion of laser-induced damage in PDMS. This behavior was further supported by the work of H. Huang and Z.X. Guo [17], who, based on the empirical relation initially proposed by S. Baudach et al. [28] for polyamide and later extended to PDMS, reported that the diameter of the laser-affected zone scales with the incident pulse fluence.
3.2.3. Simulation of Material Removal by Laser Ablation
Predicting the amount of ablated material remains one of the major challenges in simulating ultrashort laser pulse interactions [29]. To estimate the quantity of material removed by the pulse, it was assumed that when the free electron density reaches the critical value (), irreversible changes at the atomic level occur, leading to material ablation. This evaluation was carried out at t = 130 , a time point at which the remaining laser energy is negligible compared to its peak value, and electron recombination becomes the dominant physical process.
Figure 7d presents the results of this evaluation for the three simulations. It was observed that the ablated surface area increased with pulse energy. However, this growth was not proportional: between 4 and 12 , the pulse energy was tripled, yet the amount of material removed increased by less than 50%. For a 4 pulse, the estimated crater depth was , with a radius of . In the case of 8 , the depth reaches and the radius , while for 12 , the values are and , respectively. This indicated that increasing the pulse energy did not produce a corresponding increase in the amount of material removed, neither in depth nor in diameter. While the variation in depth was on the order of , the affected diameter exhibited an increase approximately three times greater.
These findings suggest that, as the pulse energy increases, the lateral expansion of the crater tends to dominate over the material removal in depth. This observation aligns with the trends discussed in previous sections, where the screening effect appears to promote energy accumulation at the surface, thereby limiting laser penetration into deeper layers. Such behavior may account for the relatively low variability observed in crater depth. Conversely, the increase in crater diameter was consistent with the earlier analysis of the simulations, where it was shown that higher pulse energies lead to peripheral regions reaching the critical electron density, resulting in irreversible changes over larger areas. This finding implies that, in microhole FLM, the pulse energy becomes a key parameter for controlling the geometric dimensions of the resulting feature, as was shown in previous sections.
3.3. Scalability of the FLM for Large PDMS Membranes
Achieving industrial scalability in FLM requires overcoming the high cost and low throughput typically associated with processing at kilohertz repetition rates [30]. In this study, we investigated strategies to scale up the fabrication of microperforated PDMS membranes for OoC applications. For membranes intended for culturing human mesenchymal stem cells, we determined that a controlled-porosity design should incorporate a staggered matrix of holes with an exit diameter of 10 . This value represents the minimum achievable size due to limitations imposed by the conicity of the laser-drilled holes. To minimize variability in the material response, a constant exposure time of 1000 was selected, resulting in a total fabrication time of approximately five hours per membrane. The pulse energy used for FLM across all membrane types was set to 12 , corresponding to the average value derived from a previously developed linear regression model (Appendix B): , , and for the 25 , 50 , and 100 membranes, respectively.
Figure 8a illustrates the fabricated membranes, highlighting the differences between entrance and exit microhole diameters across the three membrane thicknesses. Experimental and model-predicted diameters were compared to assess predictive accuracy. As summarized in Table 3, the linear model showed excellent agreement with the experimental entrance diameters for the 25 membranes, yielding a relative error below 1% (n = 6). However, prediction accuracy declined substantially for thicker membranes, with relative errors exceeding 17%. In contrast, the model performed better in predicting exit diameters, with relative errors below 6.5% for all thicknesses. The lowest error (1.08%) was observed for the thickest membrane, suggesting that the model may more accurately capture the ablation behavior at greater depths. These results suggest that the regression models offer a reasonable first-order approximation for estimating pulse energy required to achieve target hole diameters, particularly for exit dimensions. However, limited accuracy for entrance diameters in medium and thick membranes highlights the need for refined—potentially nonlinear—modeling approaches in applications requiring high geometric fidelity.
Confocal microscopy images in Figure 8a and SEM images in Figure 8b,c provide a detailed evaluation of the fabricated microholes. The replicated microstructures exhibit a high degree of uniformity, confirming the absence of cross-interference between adjacent holes during laser processing. Additionally, some residual material is observed on the membrane surface in Figure 8b. This material corresponds to ablation debris generated during the laser drilling process, which was expelled from the holes and subsequently redeposited due to interactions between the plasma plume and the surrounding surface. The characteristic conical morphology of the microholes, consistent with the expected tapering effect, is clearly visible in Figure 8c.
The successful fabrication of functional membranes highlights several advantages of the laser micromachining process. Notably, the technique exhibited excellent uniformity and repeatability. An additional advantage is the fully automated nature of the fabrication workflow, which eliminates manual intervention during processing. This minimizes operator-induced variability and improves the reproducibility and reliability of the method. Moreover, autonomous operation facilitates efficient experimental planning by enabling unattended processing under controlled conditions.
3.4. Effectiveness of Debris Removal from Processed Membranes
Material ablation lead to the formation of debris and surface contamination. These particles, varying in size, can potentially interfere with subsequent microfabrication steps. To address this issue, the cleaning protocol described in Section 2.8 was implemented to remove both surface-adhered residues and debris lodged within the microholes. The cleaning procedure was consistently applied to multiple PDMS membrane samples of varying thicknesses (25, 50, and 100 ). In all cases (n = 5 per thickness), the protocol yielded satisfactory results without inducing visible damage. SEM images in Figure 8d-e illustrate the condition of the PDMS surface before and after the cleaning process. Figure 8d shows a membrane immediately following the FLM with substantial debris accumulation, particularly around the microhole edges. Notably, debris was not confined to the perforated regions; it was observed as fas as 150– 180 from the outermost holes.
Following the cleaning process, debris was effectively removed from both the membrane surface and the interior of the microholes. Figure 8e shows a membrane after cleaning, demonstrating the effectiveness of the protocol. Light-toned regions around the hole edges indicate areas thermally affected but not ablated. Nevertheless, the laser energy absorbed in these zones was sufficient to induce thermal degradation of the PDMS. All cleaned samples were subsequently ready for the next fabrication step: bonding with the remaining chip components.
3.5. In vitro Experimental Validation of the Assembled Membranes
Validation of the PDMS membranes was conducted on the microdrilled PDMS membrane in the two-chamber OoC device selected (Figure 9a). Phosphate-buffered saline (PBS) was first perfused through one of the inlet ports, and membrane functionality was evaluated by monitoring fluid flow crossing the membrane and leaving the OoC through the opposing outlet port. The PBS flowing through the mentioned port was the confirmation that FLM enabled the fabrication of a functional membranes with user-defined porosity. Porosity was not predetermined but could be easily estimated by quantifying the total number of microholes and measuring their average diameter on the exit surface. Alternatively, this diameter could also be inferred based on the pulse energy used during fabrication (Figure 2).
Biocompatibility assessment is a fundamental step in the preliminary evaluation of any material intended for cell culture. The membranes were evaluated for their ability to support the adhesion and growth of hASCs, chosen for their relevance in tissue engineering. A consistent cell seeding density was used that produced confluence in the controls within 48 hours (Figure 9b-c). After seeding hASC in the OoCs (Figure 9d), cell cultures behaved in a very similar way to the controls, and formed a homogeneous monolayer across all three membrane thicknesses within the same time. Multilayered cell growth (Figure 9d) were found in some areas of the membranes with 25 thickness. Cell migration through the micropores of the membranes was examined. In several instances, hASCs were observed occupying pores within the membrane (Figure 9d), although the number of migrating cells was markedly lower in the 25 membrane than in the case of the 100 . This difference in migration is attributed to the increased maximum pore diameter at the top surface of thicker membranes, resulting from higher energy per pulse during FLM, as discussed earlier. These observations supported the idea that the membranes were biocompatible.
Phalloidin, which binds specifically to filamentous actin (F-actin), helped to visualize the organization of the actin filaments of cells. hASCs cultured on microdrilled PDMS membranes (Figure 9d) showed similar intensity and organization to that of cells grown on non-perforated PDMS membranes (Figure 9c). In contrast, cells seeded on glass coverslips (Figure 9b) exhibited more intense filament labeling than in the other cases. The literature attributes this finding to the higher stiffness (Young’s modulus) of glass (70 GPa is a typical estimate) compared to PDMS, which typically ranges from 100 kPa to 3 MPa. Importantly, no regions devoid of cells or exhibiting disrupted cytoplasmic actin structures were observed, indicating effective adhesion of hASCs to all membranes. Therefore, we can conclude that FLM fabrication for creating porous PDMS membranes showed signs of biocompatibility, and the microdrilled surfaces allowed hASCs to adhere, migrate, and potentially proliferate over them.
4. Conclusions
The influence of the laser operating parameters involved in FLM of PDMS membranes was analyzed, demonstrating that pulse energy is the most critical factor for controlling microhole diameter. Exposure time and membrane thickness were identified as secondary ones. The quality of the resulting microholes showed a strong dependence on the pulse energy delivered for the conicity parameter, with high pulse energies leading to sharply increased taper angles. This is mainly due to greater material removal at the entrance, while diffraction and attenuation reduce ablation efficiency near the exit, leading to non-uniform depth profiles. The extent of the heat-affected zone, however, was primarily influenced by the laser beam size and membrane thickness.
The role of pulse energy was further explored through a numerical model developed in COMSOL Multiphysics, which provided deeper insight into the laser–material interaction. The simulations revealed effects such as plasma shielding and its influence on crater formation and hole diameter. Additionally, a linear regression model was proposed and used to guide the fabrication of membranes in batch production, proving to be a suitable first-order approximation for selecting the optimal pulse energy to achieve a desired diameter.
The effectiveness of the cleaning protocol was demonstrated through SEM inspection and the subsequent cell culture. Cell culture confirmed the biocompatibility of the produced membranes, showing strong cell adhesion and metabolic activity.
Finally, the study demonstrated key advantages of laser micromachining over traditional techniques, including its flexibility to generate a wide range of patterns and geometries, as well as its fully autonomous operation, which enhances process repeatability and reduces the potential for human error.
Author Contributions
Conceptualization, C.B., D.S.G., J.R.V.A. and A.S.G.; methodology, C.B., D.S.G., J.R.V.A. and A.S.G.; software, C.B., D.S.G., J.R.V.A. and A.S.G.; validation, C.B., D.S.G., J.R.V.A. and A.S.G.; formal analysis, C.B., D.S.G., J.R.V.A. and A.S.G.; investigation, C.B., D.S.G., J.R.V.A. and A.S.G.; resources, C.B., D.S.G., J.R.V.A. and A.S.G.; data curation, C.B., D.S.G., J.R.V.A. and A.S.G.; writing—original draft preparation, C.B., D.S.G., J.R.V.A. and A.S.G.; writing—review and editing, C.B., D.S.G., J.R.V.A. and A.S.G.; visualization, C.B., D.S.G., J.R.V.A. and A.S.G.; supervision, C.B., D.S.G., J.R.V.A. and A.S.G.; project administration, C.B., D.S.G., J.R.V.A. and A.S.G.; funding acquisition, C.B., D.S.G., J.R.V.A. and A.S.G. All authors have read and agreed to the published version of the manuscript.
Funding
This research was funded by Consejería de Educación, Junta de Castilla y León (SA136P20, SA108P24); Ministerio de Ciencia, Innovación y Universidades y Agencia Estatal de Investigación (PID2023-149836NB, PLEC2022-009392 and FPU22/03616).
Institutional Review Board Statement
Not applicable.
Data Availability Statement
Dataset available on request from the authors.
Acknowledgments
This work was supported by Consejería de Educación, Junta de Castilla y León (SA136P20, SA108P24); Ministerio de Ciencia, Innovación y Universidades y Agencia Estatal de Investigación (PID2023-149836NB, PLEC2022-009392 ). D.S.G. would like to thank the Ministerio de Ciencia, Innovación y Universidades for the personal grant and FPU22/03616. We would like to express our sincere gratitude to Dr. Carmen Escobedo, Valencia, Spain for graciously providing the cell line and and her valuable expert assistance and advice on immunofluorescence staining methods, which significantly contributed to the successful completion of our research. The authors also acknowledge the use of QuillBot for style, and spelling purposes; and ChatGPT -4o (OpenAI, San Francisco, CA, USA) for English grammar correction. All substantive content and interpretations were developed by the authors.
Conflicts of Interest
The authors declare no conflicts of interest.
Abbreviations
The following abbreviations are used in this manuscript:
| OoC | Organ-on-a-chip |
| PDMS | Polydimethylsiloxane |
| MEMS | Microelectromechanical systems |
| FLM | Femtosecond laser micromachining |
| SEM | Scanning electron microscope |
| RT | Room temperature |
| CPA | Chirped Pulse Amplification |
| CCD | Charge-coupled device |
| PBS | Phosphate-buffered saline |
| SD | Standard deviation |
| Coefficients of determination | |
| HAZ | Heat-affected zone |
Appendix A. Results of the linear regression analyses of the experimental data
Table A1 and Table A2 summarize the linear regression results corresponding to the two experimental sets presented in Figure 2. Table A1 includes the linear fits obtained from the experiments where pulse energy was varied at fixed exposure time, while Table A2 presents the fits for experiments where exposure time was varied at fixed pulse energies.

Table A1.
Linear regression results for hole diameters as a function of pulse energy for three values for the exposure time.
Table A1.
Linear regression results for hole diameters as a function of pulse energy for three values for the exposure time.
| Thickness | Exposure time | Diameter | Equation | R2 |
|---|---|---|---|---|
| 25 | 600 | Upper | 0.9741 | |
| Lower | 0.9650 | |||
| 1000 | Upper | 0.9605 | ||
| Lower | 0.9789 | |||
| 1400 | Upper | 0.9526 | ||
| Lower | 0.9714 | |||
| 50 | 600 | Upper | 0.9861 | |
| Lower | 0.9835 | |||
| 1000 | Upper | 0.8864 | ||
| Lower | 0.9659 | |||
| 1400 | Upper | 0.9409 | ||
| Lower | 0.9353 | |||
| 100 | 600 | Upper | 0.9677 | |
| Lower | 0.9953 | |||
| 1000 | Upper | 0.9593 | ||
| Lower | 0.9239 | |||
| 1400 | Upper | 0.9850 | ||
| Lower | 0.9334 |
Table A2.
Linear regression results for hole diameters as a function of exposure time for three pulse energies.
Table A2.
Linear regression results for hole diameters as a function of exposure time for three pulse energies.
| Thickness | Pulse Energy | Diameter | Equation | R2 |
|---|---|---|---|---|
| 25 | 4 | Upper | 0.9714 | |
| Lower | 0.9278 | |||
| 10 | Upper | 0.9616 | ||
| Lower | 0.9641 | |||
| 16 | Upper | 0.9857 | ||
| Lower | 0.9233 | |||
| 50 | 4 | Upper | 0.8520 | |
| Lower | 0.9335 | |||
| 10 | Upper | 0.7831 | ||
| Lower | 0.8031 | |||
| 16 | Upper | 0.9447 | ||
| Lower | 0.4810 | |||
| 100 | 4 | Upper | 0.5122 | |
| Lower | 0.9550 | |||
| 10 | Upper | 0.8748 | ||
| Lower | 0.9559 | |||
| 16 | Upper | 0.8912 | ||
| Lower | 0.8792 |
Each table reports the regression equation (in the form ) and the coefficient of determination () for both upper and lower hole diameters. The regressions were calculated separately for each membrane thickness (25, 50, and 100 ), providing a quantitative representation of the trends observed in the figure. In the first set of experiments, denotes the pulse energy in , while in the second set, denotes the exposure time in . In both cases, D represents the measured hole diameter in micrometers.
These linear models support the qualitative trends discussed in the main text and highlight the degree of correlation between FLM parameters and the resulting hole dimensions.
Appendix B. Additional Simulation for 12 μJ pulse energy
Figure B1 presents an additional simulation corresponding to a pulse energy of 12 . This case complements the results discussed in Section 3.2.2, where the temporal evolution of the free electron density and laser intensity was shown for pulse energies of 4 and 8 .
Figure B1.
Temporal evolution of the free electron density n and laser intensity I for a pulse energy of 12, evaluated at different depths (a) and radial positions (b). The solid line represents the electron density, while the dashed line indicates the laser intensity.
Figure B1.
Temporal evolution of the free electron density n and laser intensity I for a pulse energy of 12, evaluated at different depths (a) and radial positions (b). The solid line represents the electron density, while the dashed line indicates the laser intensity.
The simulation data shown here have already been referenced in the main results section, and are included for completeness and comparison. The Figure B1 displays two curves: the temporal evolution of the free electron density n and the laser intensity I, evaluated at various depths and radial positions within the material. The solid line represents the electron density, while the dashed line indicates the laser intensity.
This additional case illustrates the enhanced ionization dynamics associated with increased pulse energy, and helps confirm the trends identified at lower energy levels.
References
- Tajeddin, A.; Mustafaoglu, N. Design and Fabrication of Organ-on-Chips: Promises and Challenges. Micromachines 2021, 12. [Google Scholar] [CrossRef]
- Sung, J.H.; Esch, M.B.; Prot, J.M.; Long, C.J.; Smith, A.; Hickman, J.J.; Shuler, M.L. Microfabricated mammalian organ systems and their integration into models of whole animals and humans. Lab Chip 2013, 13, 1201–1212. [Google Scholar] [CrossRef] [PubMed]
- Huh, D.; Kim, H.J.; Fraser, J.P.; Shea, D.E.; Khan, M.; Bahinski, A.; Hamilton, G.A.; Ingber, D.E. Microfabrication of human organs-on-chips. Nature Protocols 2013, 8, 2135–2157. [Google Scholar] [CrossRef]
- Mosadegh, B.; Agarwal, M.; Torisawa, Y.s.; Takayama, S. Simultaneous fabrication of PDMS through-holes for three-dimensional microfluidic applications. Lab Chip 2010, 10, 1983–1986. [Google Scholar] [CrossRef]
- Huh, D.; Matthews, B.D.; Mammoto, A.; Montoya-Zavala, M.; Hsin, H.Y.; Ingber, D.E. Reconstituting Organ-Level Lung Functions on a Chip. Science 2010, 328, 1662–1668. [Google Scholar] [CrossRef]
- Quirós-Solano, W.F.; Gaio, N.; Stassen, O.M.J.A.; Arik, Y.B.; Silvestri, C.; Van Engeland, N.C.A.; Van der Meer, A.; Passier, R.; Sahlgren, C.M.; Bouten, C.V.C.; et al. Microfabricated tuneable and transferable porous PDMS membranes for Organs-on-Chips. Scientific Reports 2018, 8, 13524. [Google Scholar] [CrossRef]
- Mata, A.; Fleischman, A.J.; Roy, S. Characterization of Polydimethylsiloxane (PDMS) Properties for Biomedical Micro/Nanosystems. Biomedical Microdevices 2005, 7, 281–293. [Google Scholar] [CrossRef] [PubMed]
- Gale, B.K.; Jafek, A.R.; Lambert, C.J.; Goenner, B.L.; Moghimifam, H.; Nze, U.C.; Kamarapu, S.K. A Review of Current Methods in Microfluidic Device Fabrication and Future Commercialization Prospects. Inventions 2018, 3. [Google Scholar] [CrossRef]
- Qin, D.; Xia, Y.; Whitesides, G.M. Soft lithography for micro- and nanoscale patterning. Nature Protocols 2010, 5, 491–502. [Google Scholar] [CrossRef] [PubMed]
- Hwang, S.J.; Oh, D.J.; Jung, P.G.; Lee, S.M.; Go, J.S.; Kim, J.H.; Hwang, K.Y.; Ko, J.S. Dry etching of polydimethylsiloxane using microwave plasma. Journal of Micromechanics and Microengineering 2009, 19, 095010. [Google Scholar] [CrossRef]
- Zhang, X.; Yao, Z.; Hou, Z.; Song, J. Processing and Profile Control of Microhole Array for PDMS Mask with Femtosecond Laser. Micromachines 2022, 13. [Google Scholar] [CrossRef]
- Feit, M.; Komashko, A.; Rubenchik, A. Ultra-short pulse laser interaction with transparent dielectrics. Applied Physics A 2004, 79, 1657–1661. [Google Scholar] [CrossRef]
- Stuart, B.C.; Feit, M.D.; Herman, S.; Rubenchik, A.M.; Shore, B.W.; Perry, M.D. Nanosecond-to-femtosecond laser-induced breakdown in dielectrics. Phys. Rev. B 1996, 53, 1749–1761. [Google Scholar] [CrossRef]
- Liu, X.; Du, D.; Mourou, G. Laser ablation and micromachining with ultrashort laser pulses. IEEE Journal of Quantum Electronics 1997, 33, 1706–1716. [Google Scholar] [CrossRef]
- Vorobyev, A.Y.; Guo, C. Direct femtosecond laser surface nano/microstructuring and its applications. Laser & Photonics Reviews 2013, 7, 385–407. [Google Scholar] [CrossRef]
- Alnaser, A.S.; Khan, S.A.; Ganeev, R.A.; Stratakis, E. Recent Advances in Femtosecond Laser-Induced Surface Structuring for Oil–Water Separation. Applied Sciences 2019, 9. [Google Scholar] [CrossRef]
- Huang, H.; Guo, Z. Ultra-short pulsed laser PDMS thin-layer separation and micro-fabrication. Journal of Micromechanics and Microengineering 2009, 19. [Google Scholar] [CrossRef]
- Darvishi, S.; Cubaud, T.; Longtin, J.P. Ultrafast laser machining of tapered microchannels in glass and PDMS. Optics and Lasers in Engineering 2012, 50, 210–214. [Google Scholar] [CrossRef]
- Hsieh, Y.K.; Chen, S.C.; Huang, W.L.; Hsu, K.P.; Gorday, K.A.V.; Wang, T.; Wang, J. Direct Micromachining of Microfluidic Channels on Biodegradable Materials Using Laser Ablation. Polymers 2017, 9. [Google Scholar] [CrossRef] [PubMed]
- Alshehri, A.M.; Hadjiantoniou, S.; Hickey, R.J.; Al-Rekabi, Z.; Harden, J.L.; Pelling, A.E.; Bhardwaj, V.R. Selective cell adhesion on femtosecond laser-microstructured polydimethylsiloxane. Biomedical Materials 2016, 11, 015014. [Google Scholar] [CrossRef]
- Torino, S.; Conte, L.; Iodice, M.; Coppola, G.; Prien, R.D. PDMS membranes as sensing element in optical sensors for gas detection in water. Sensing and Bio-Sensing Research 2017, 16, 74–78. [Google Scholar] [CrossRef]
- Keldysh, L. Ionization in field of a strong electromagnetic wave. Journal of Experimental and Theoretical Physics 1965, 20, 1307–1314. [Google Scholar] [CrossRef]
- Özkayar, G.; Lötters, J.C.; Tichem, M.; Ghatkesar, M.K. Toward a modular, integrated, miniaturized, and portable microfluidic flow control architecture for organs-on-chips applications. Biomicrofluidics 2022, 16, 021302. [Google Scholar] [CrossRef]
- Escobedo-Lucea, C.; Bellver, C.; Gandia, C.; Sanz-Garcia, A.; Esteban, F.J.; Mirabet, V.; Forte, G.; Moreno, I.; Lezameta, M.; Ayuso-Sacido, A.; et al. A Xenogeneic-Free Protocol for Isolation and Expansion of Human Adipose Stem Cells for Clinical Uses. PLOS ONE 2013, 8, 1–12. [Google Scholar] [CrossRef]
- Gaudiuso, C.; Giannuzzi, G.; Volpe, A.; Lugarà, P.M.; Choquet, I.; Ancona, A. Incubation during laser ablation with bursts of femtosecond pulses with picosecond delays. Opt. Express 2018, 26, 3801–3813. [Google Scholar] [CrossRef]
- Chuang, M.; Tam, A.C. On the saturation effect in the picosecond near ultraviolet laser ablation of polyimide. Journal of Applied Physics 1989, 65, 2591–2595. [Google Scholar] [CrossRef]
- Cheng, J.; Perrie, W.; Edwardson, S.; Fearon, E.; Dearden, G.; Watkins, K. Effects of laser operating parameters on metals micromachining with ultrafast lasers. Applied Surface Science 2009, 256, 1514–1520. [Google Scholar] [CrossRef]
- Baudach, S.; Bonse, J.; Kautek, W. Ablation experiments on polyimide with femtosecond laser pulses. Applied Physics A 1999, 69, S395–S398. [Google Scholar] [CrossRef]
- Peng, L.; Li, M.; Wang, P.; Li, X.; Zhang, Y.; He, M.; Zhou, C.; Zhang, H.; Chen, S. Numerical simulation and investigation of ultra-short pulse laser ablation on Ti6Al4V and stainless steel. AIP Advances 2023, 13, 065018. [Google Scholar] [CrossRef]
- Holder, D.; Hagenlocher, C.; Weber, R.; Röcker, C.; Abdou Ahmed, M.; Graf, T. Model for designing process strategies in ultrafast laser micromachining at high average powers. Materials & Design 2024, 242, 113007. [Google Scholar] [CrossRef]
Figure 1.
Schematic illustration of the setup employed for PDMS membrane production with femtosecond laser ablation.
Figure 1.
Schematic illustration of the setup employed for PDMS membrane production with femtosecond laser ablation.
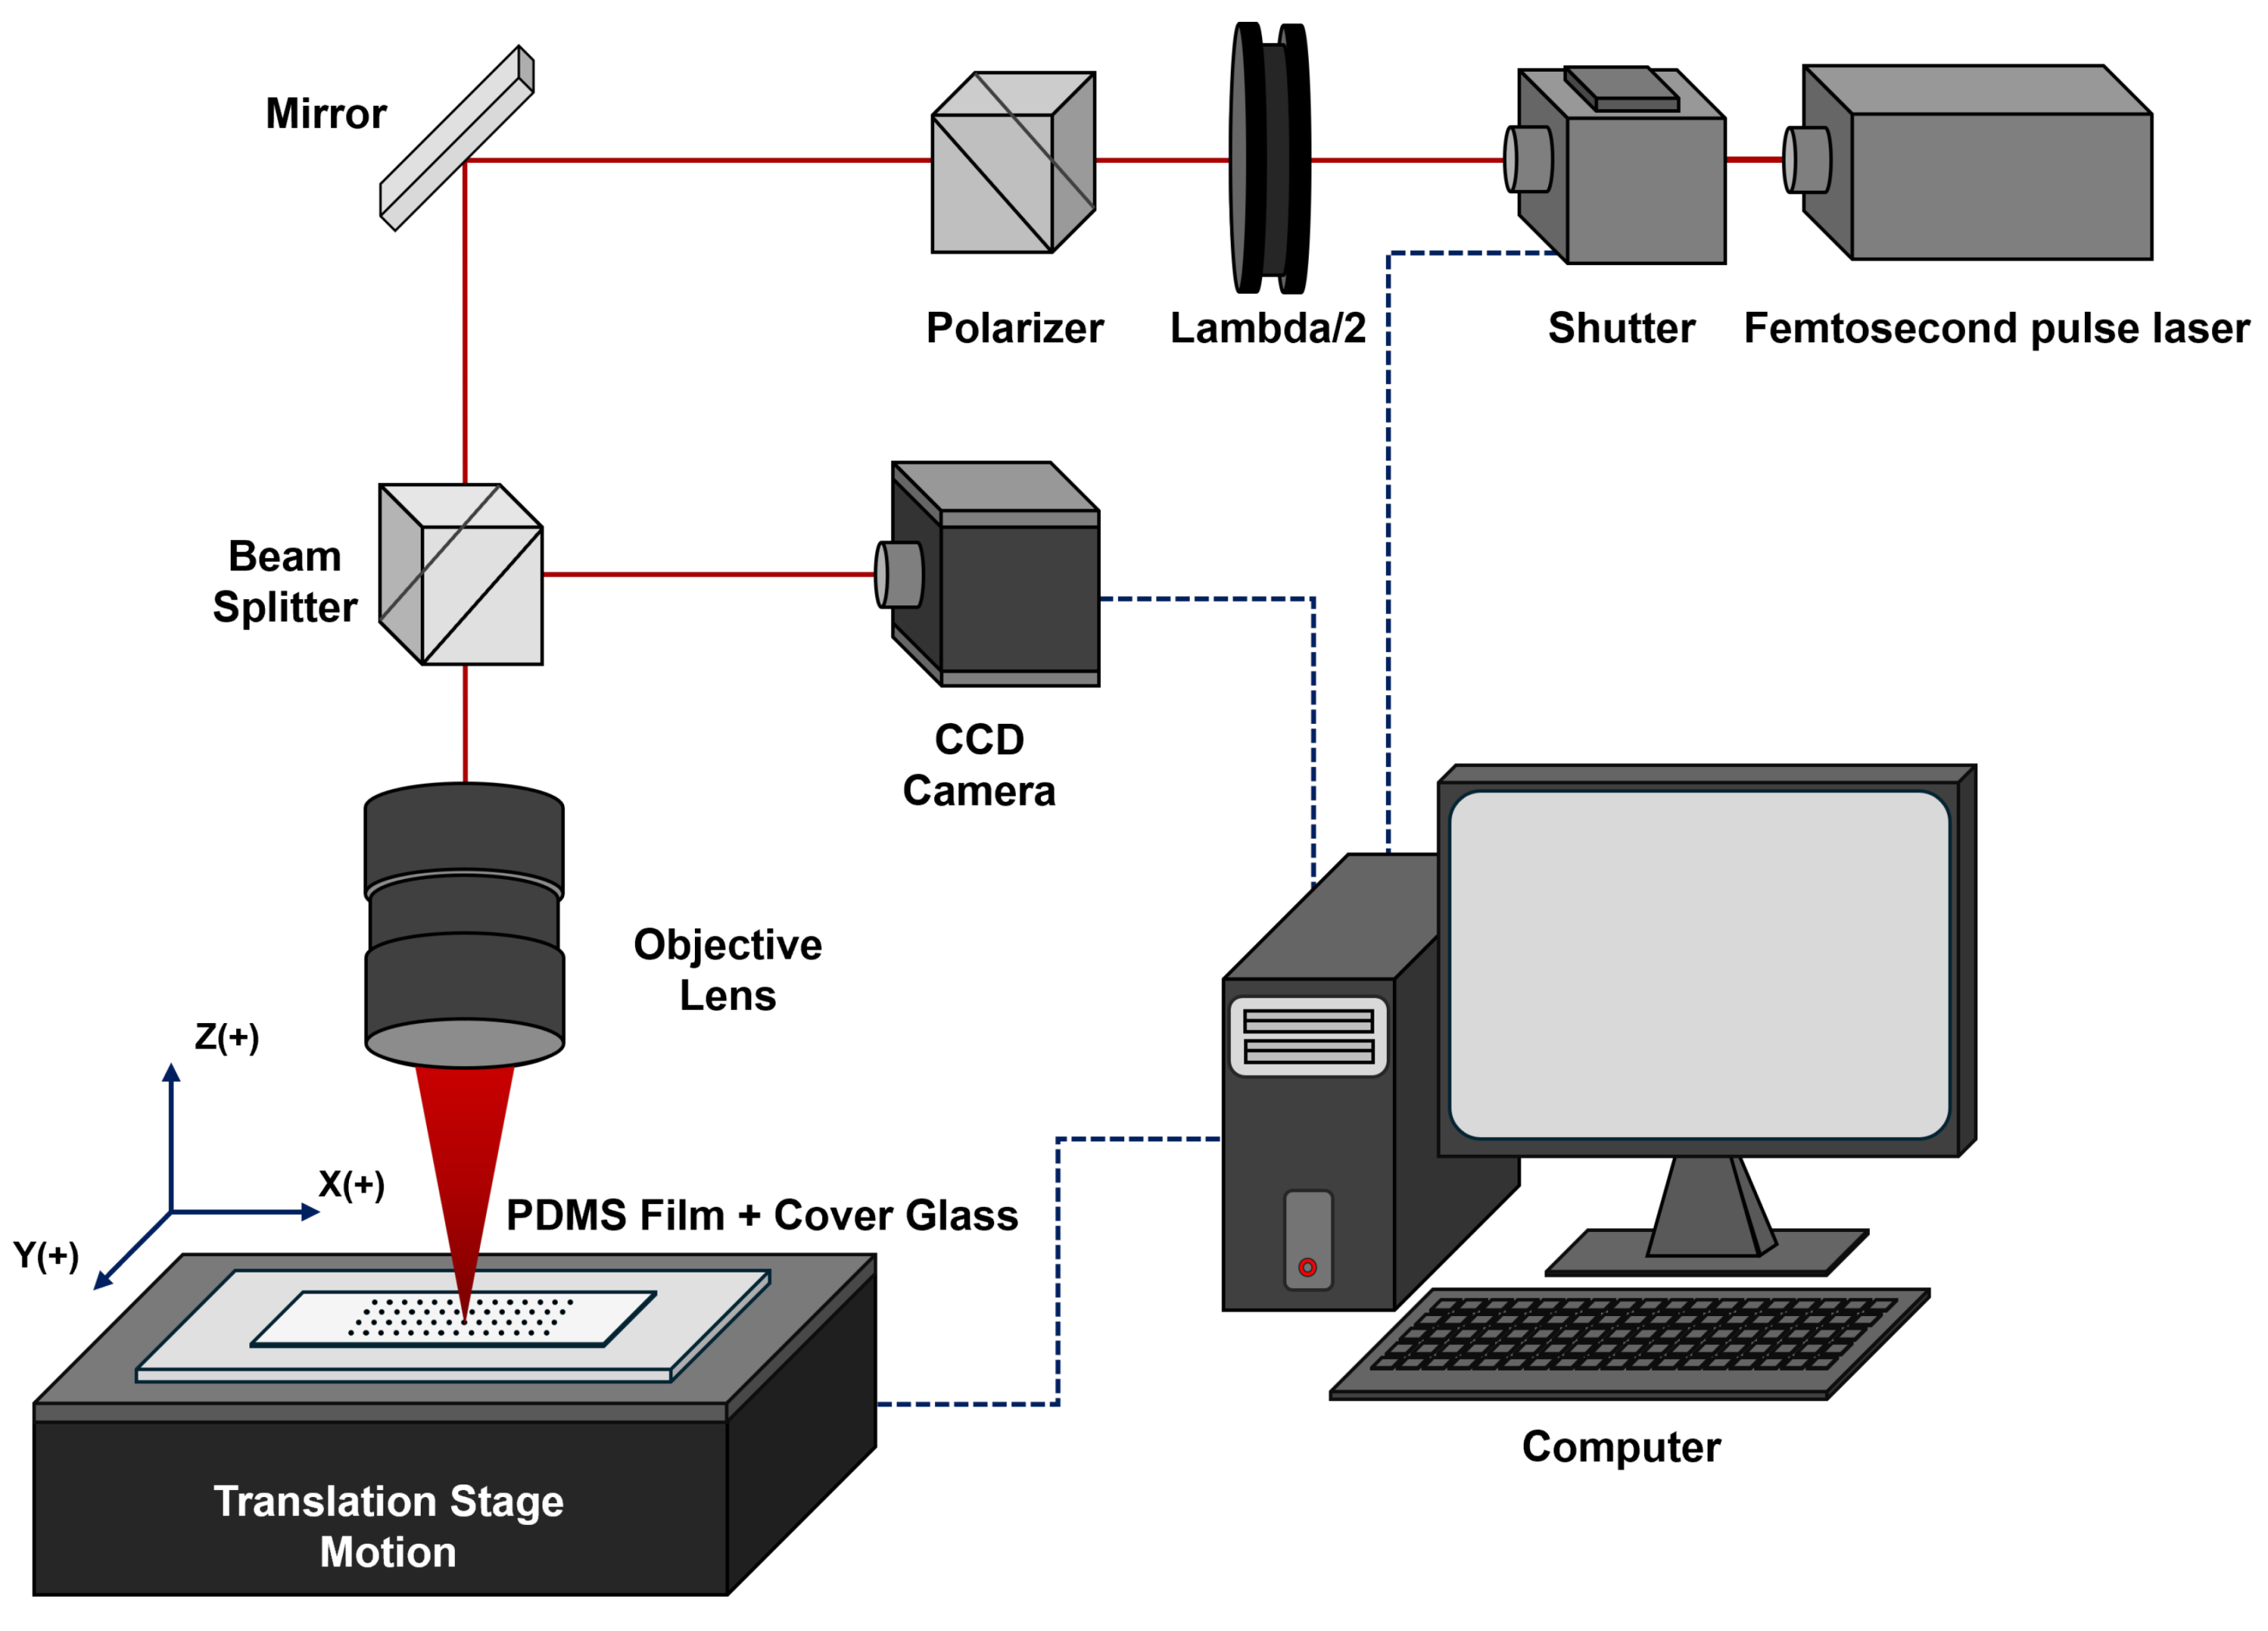
Figure 2.
Evolution of upper and lower hole diameters as a function of pulse energy (left) and exposure time (right) for membrane thicknesses of 25 (a, b), 50 (c, d), and 100 (e, f). Circular markers and solid lines represent entrance diameters, while triangular markers and dashed lines indicate exit diameters.
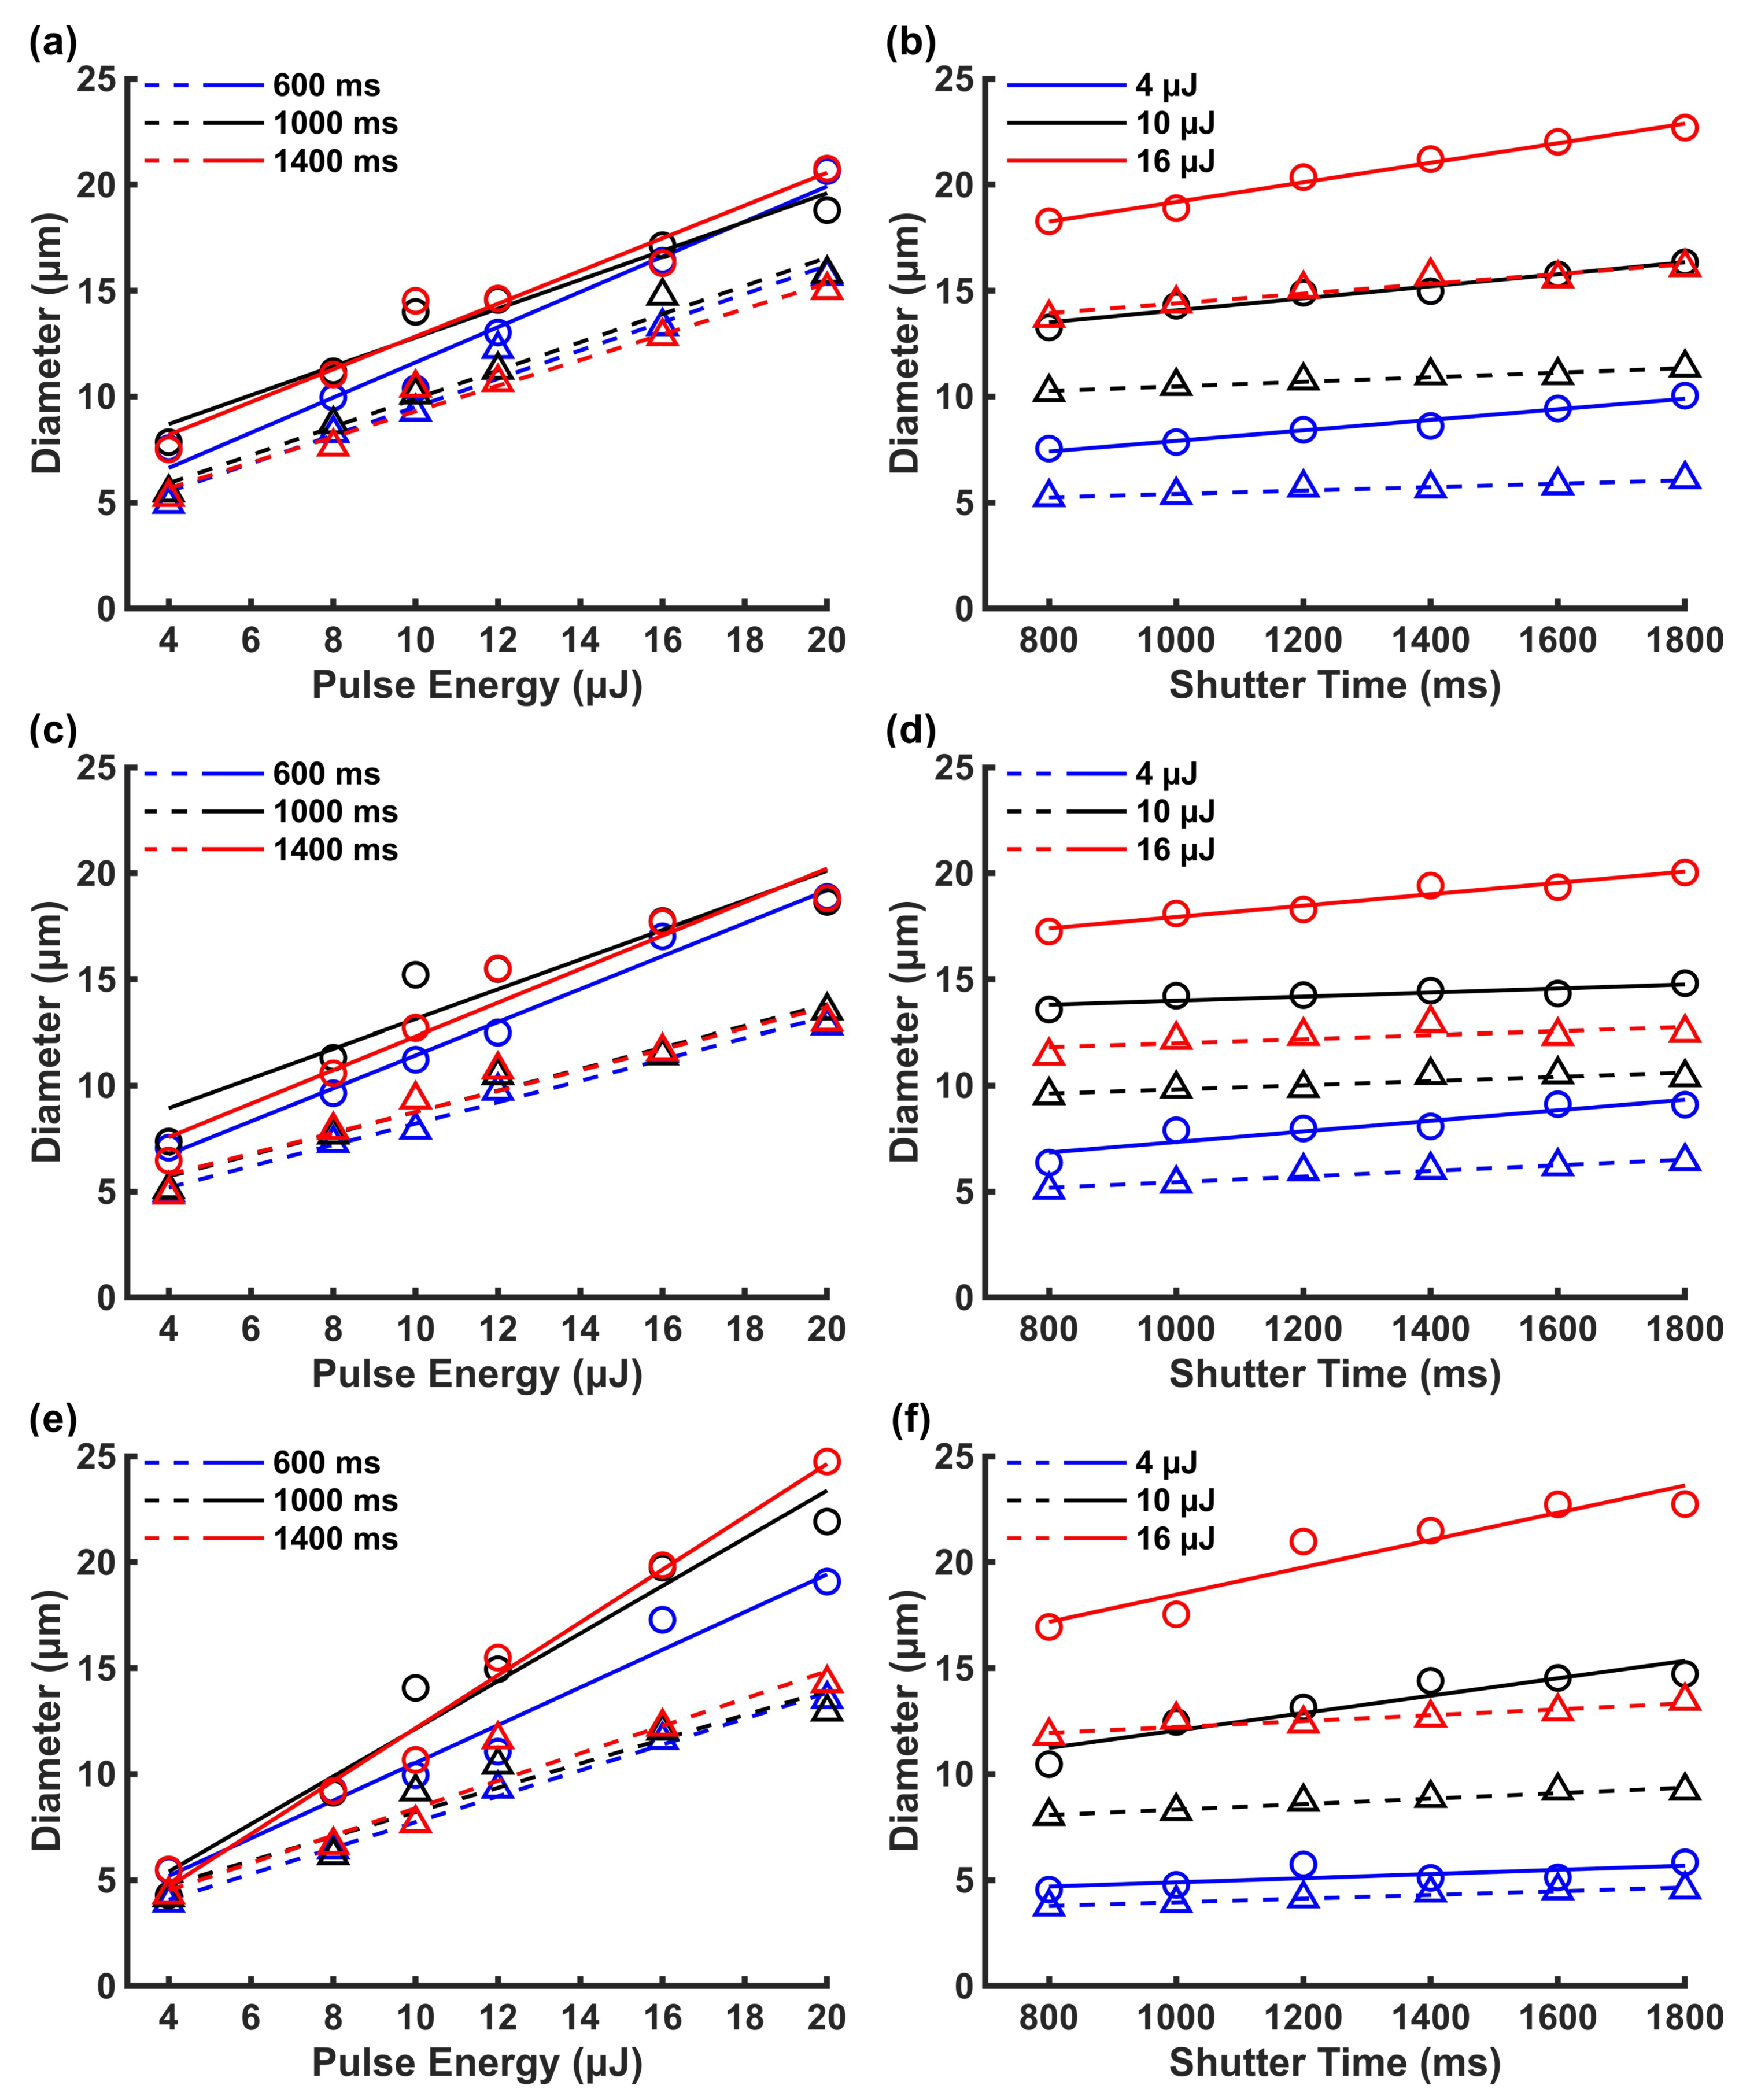
Figure 3.
Microhole quality and geometry of micromachined PDMS membranes processed at a constant exposure time of 1000 and pulse energy varying from 4 to 20. Optical microscopy images were taken of entry and exit holes for (a) 25, (b) 50, and (c) 100 membrane thickness. 20 bar scale.
Figure 3.
Microhole quality and geometry of micromachined PDMS membranes processed at a constant exposure time of 1000 and pulse energy varying from 4 to 20. Optical microscopy images were taken of entry and exit holes for (a) 25, (b) 50, and (c) 100 membrane thickness. 20 bar scale.
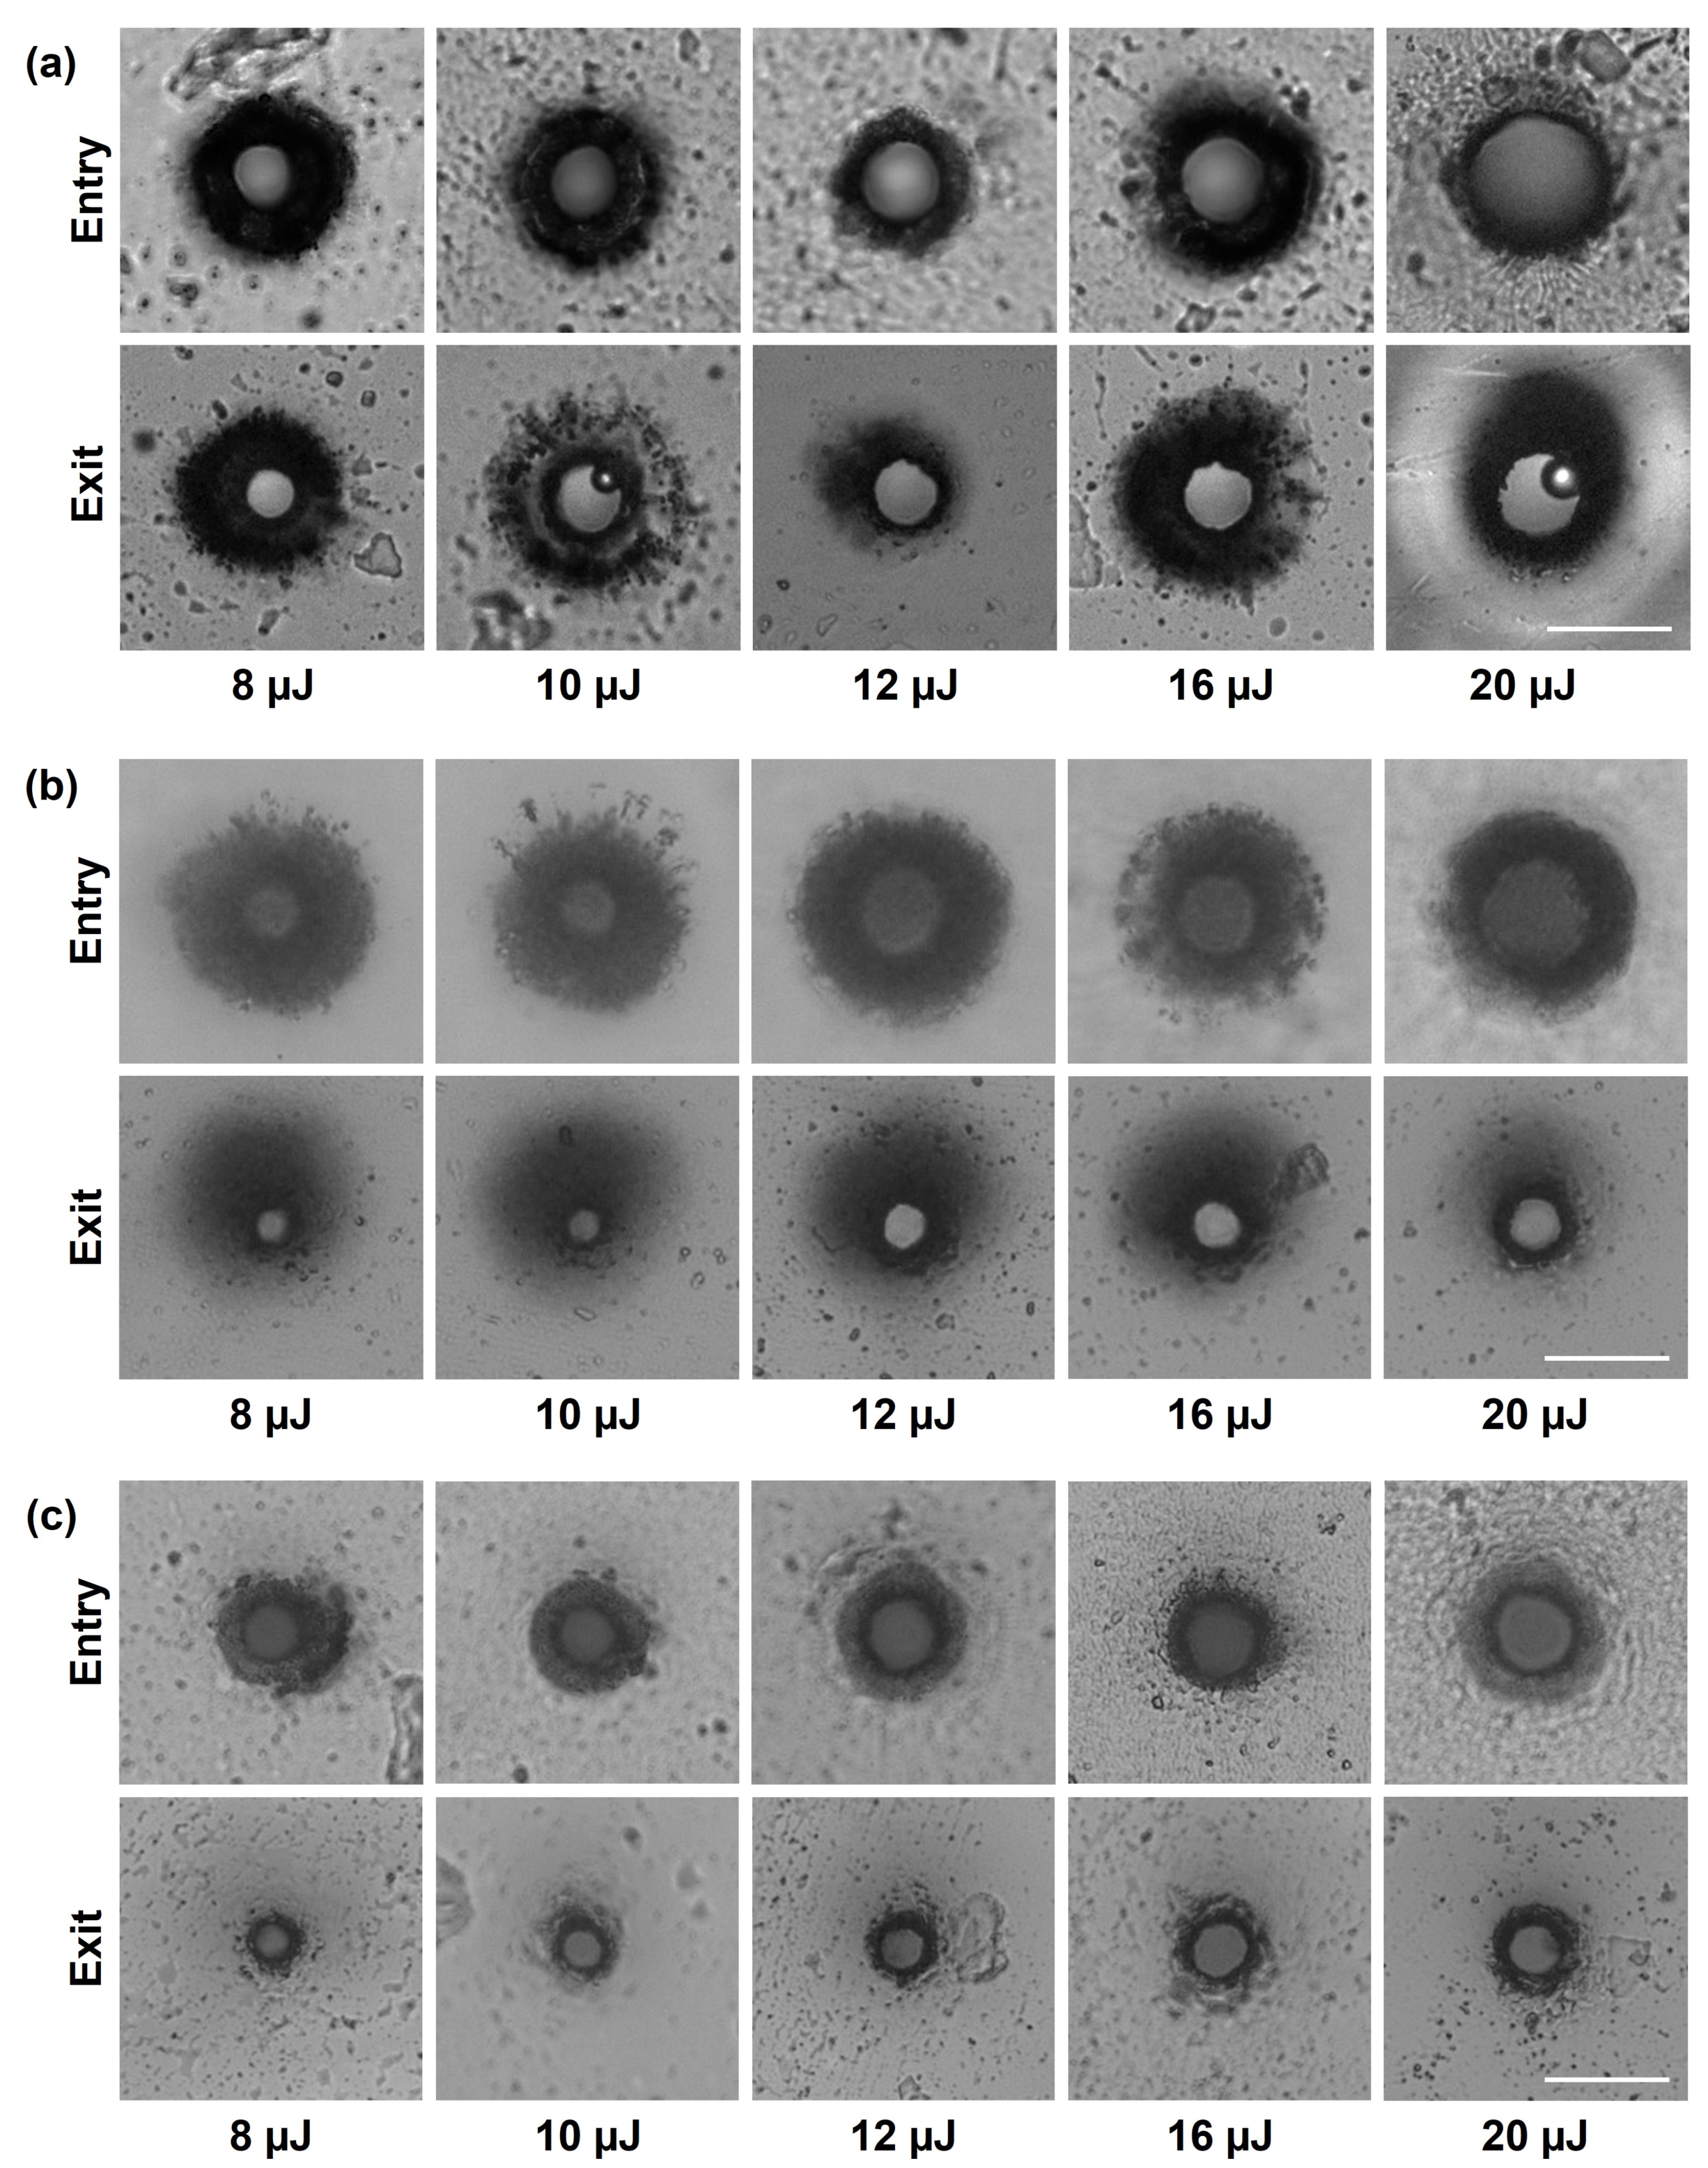
Figure 4.
Optical microscopy images of micromachined samples processed at a constant pulse energy of 10 while varying the exposure time (800– 1800). Comparison of geometry, quality, and dimensions for different membrane thicknesses. Entry and exit holes for (a) 25, (b) 50, and (c) 100 thick membranes. 20 bar scale.
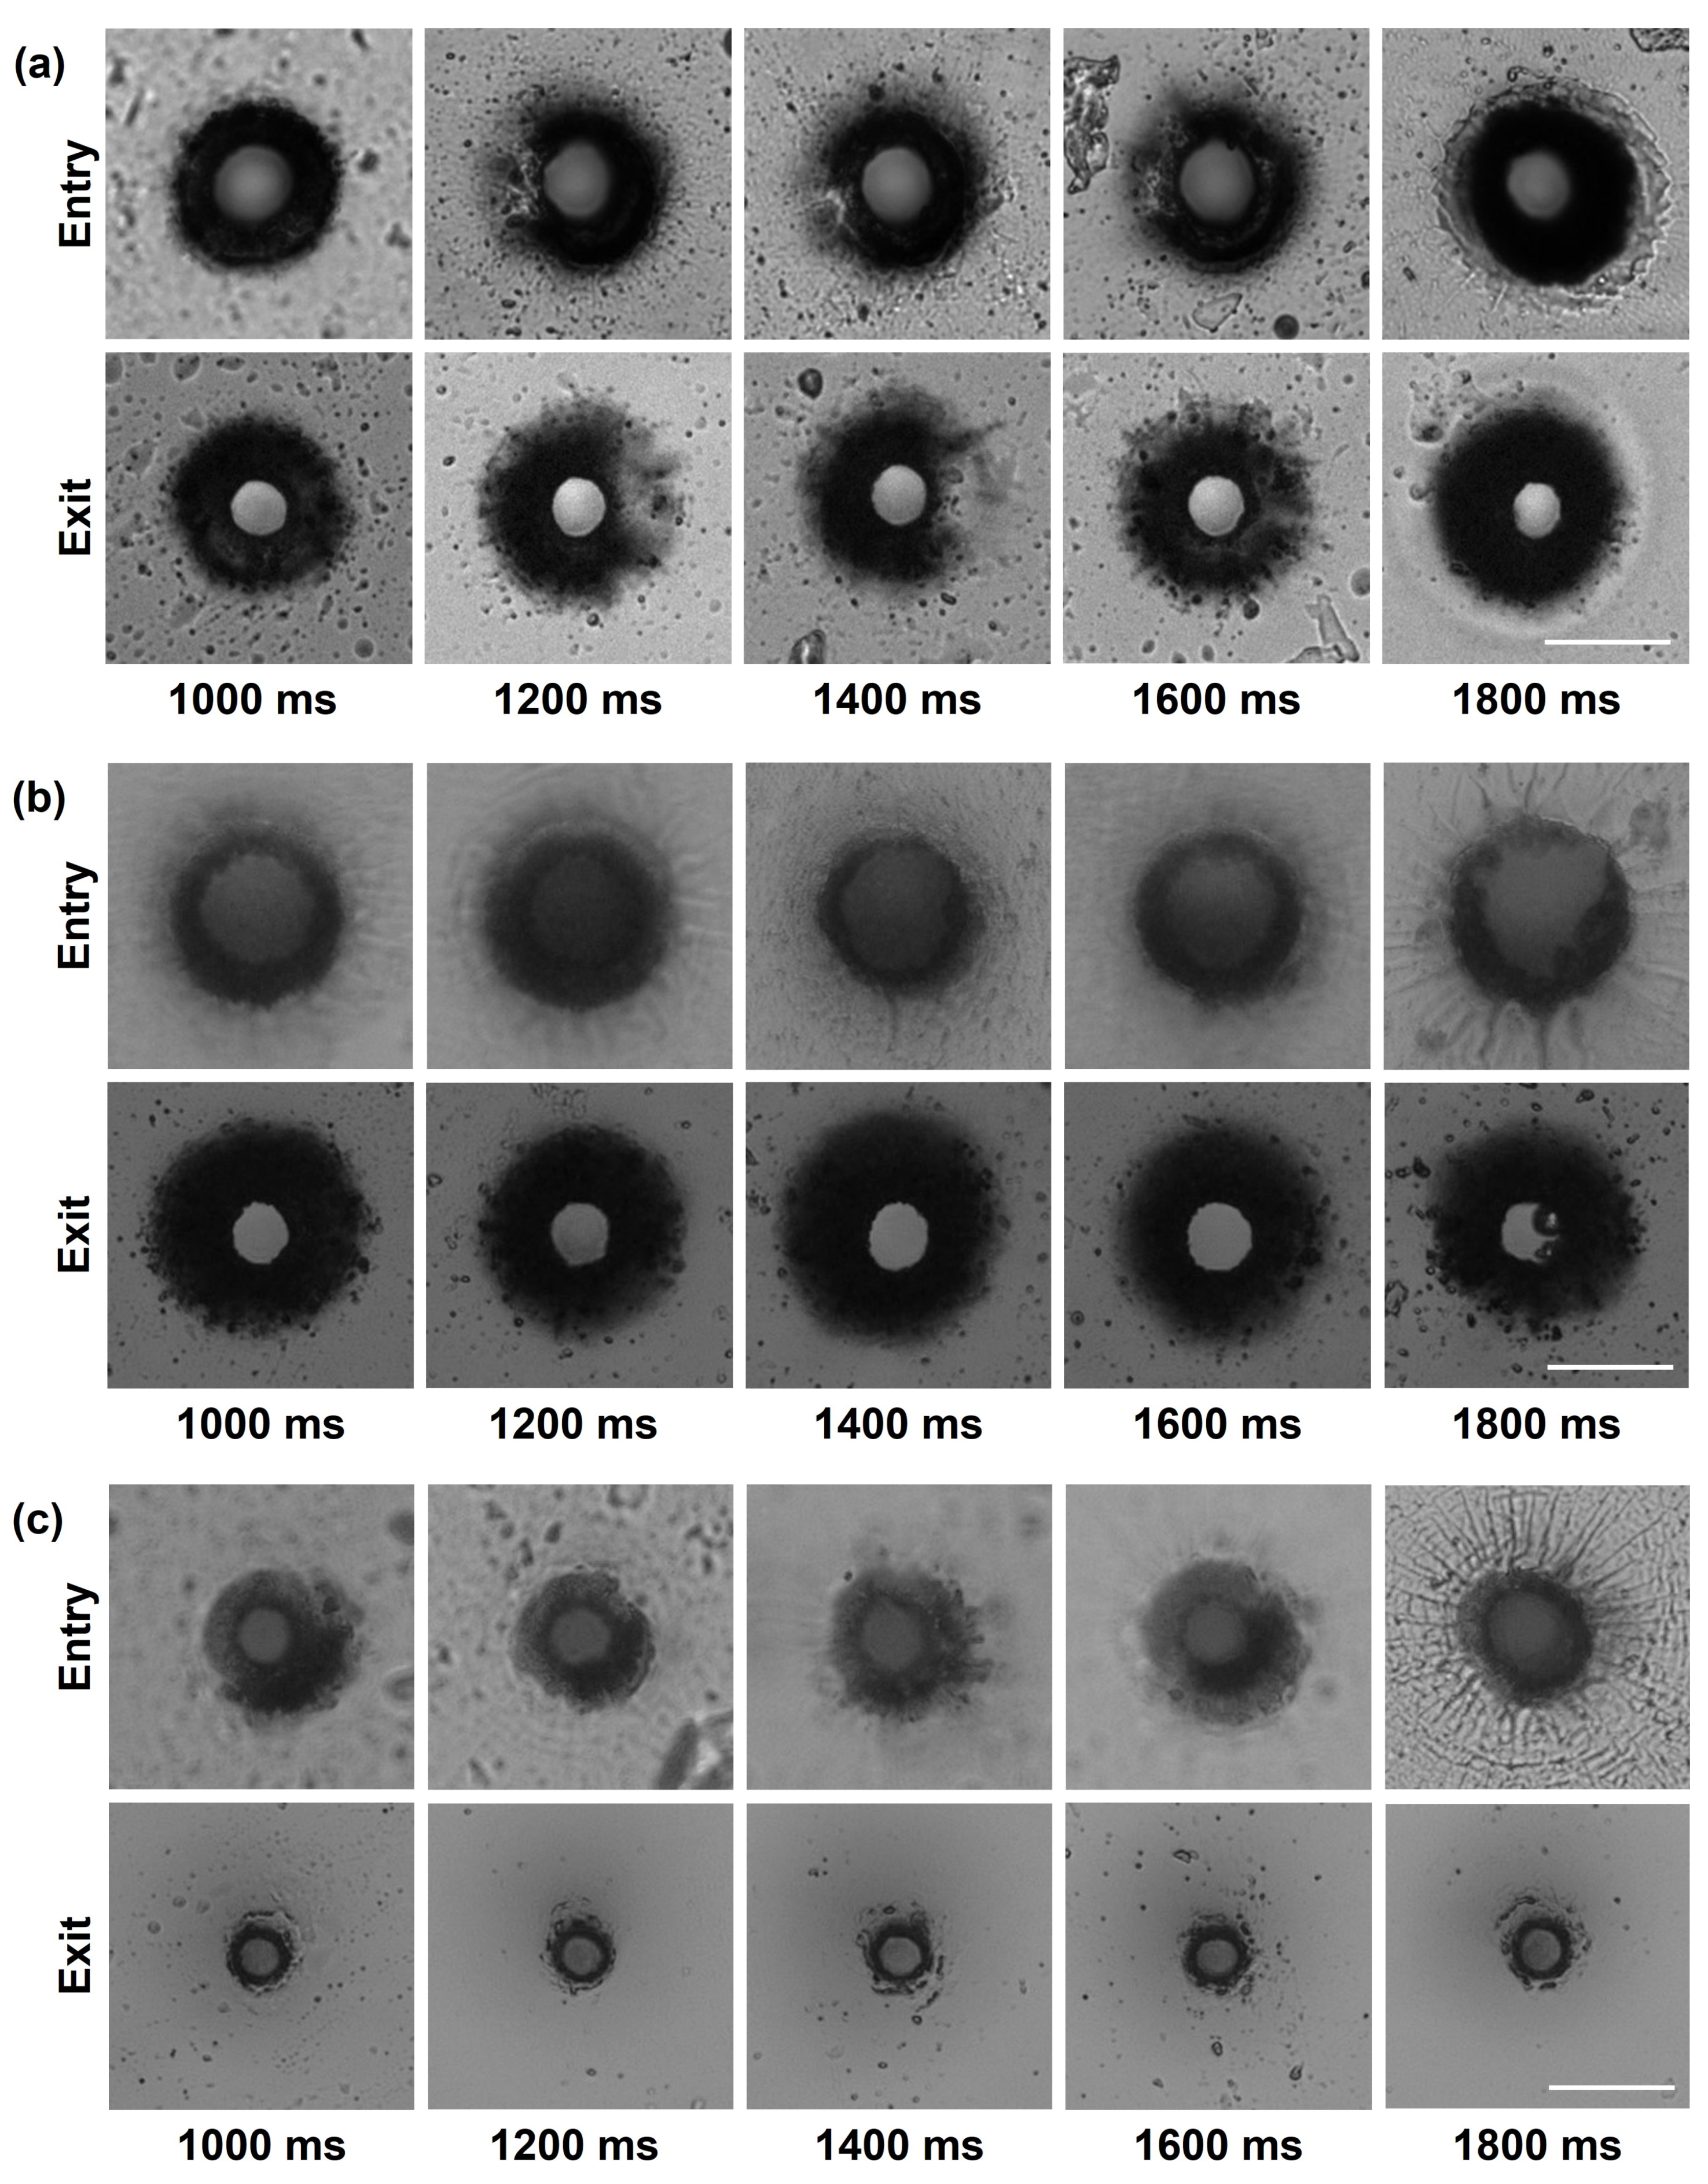
Figure 5.
Evolution of taper angle as a function of pulse energy (left) and exposure time (right) for membrane thicknesses of 25 (a, b), 50 (c, d), and 100 (e, f).
Figure 5.
Evolution of taper angle as a function of pulse energy (left) and exposure time (right) for membrane thicknesses of 25 (a, b), 50 (c, d), and 100 (e, f).

Figure 6.
Temporal evolution of the free electron density n induced by a 4 laser pulse. (a) Spatial distribution and growth. (b, c) Free electron density n and laser intensity I for a pulse energy of 4, evaluated at different depths and radial positions. The solid line represents the electron density, while the dashed line indicates the laser intensity.
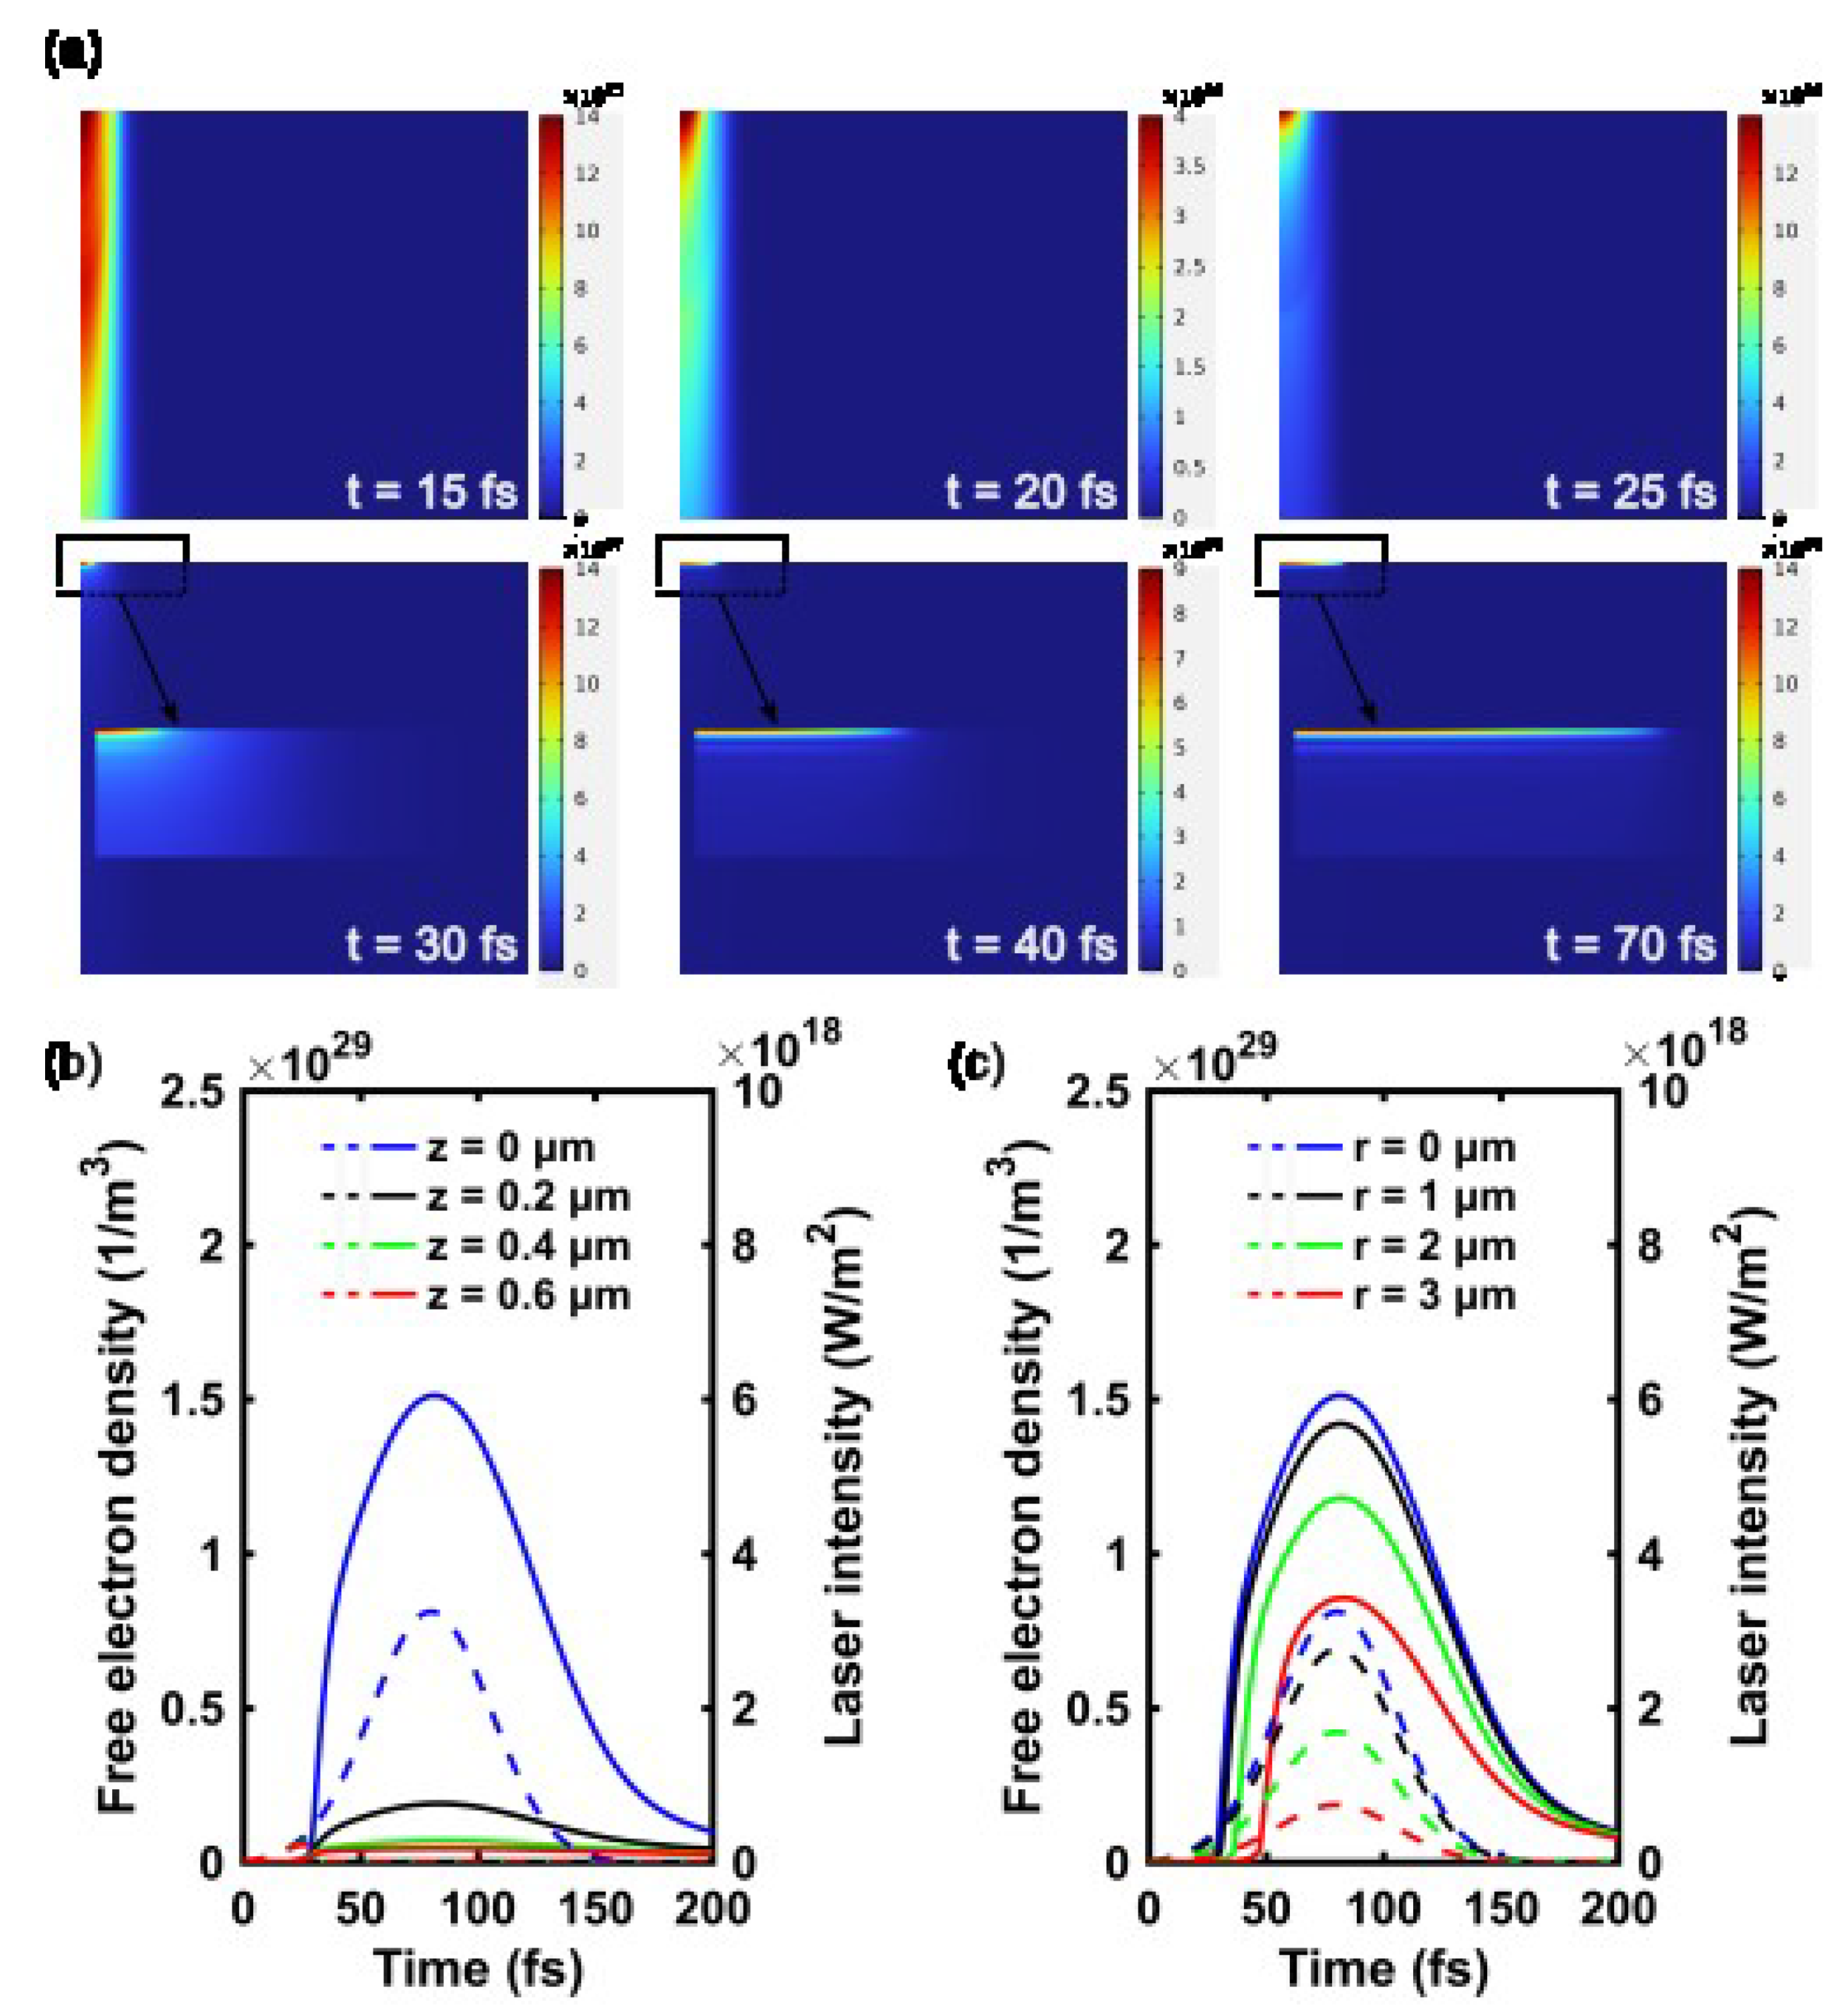
Figure 7.
Effect of the increment of pulse energy on the electron density; (a) Spatial distribution of the free electron density n, shown as color maps at two time points: t = 15 and t = 30; (b, c) Temporal evolution of the free electron density n and laser intensity I for a pulse energy of 8, evaluated at different depths and radial positions. The solid line represents the electron density, while the dashed line indicates the laser intensity; (d) Ablated material and dimensions of the resulting modified geometry following exposure to different laser pulse energies. Scale bar: 1.
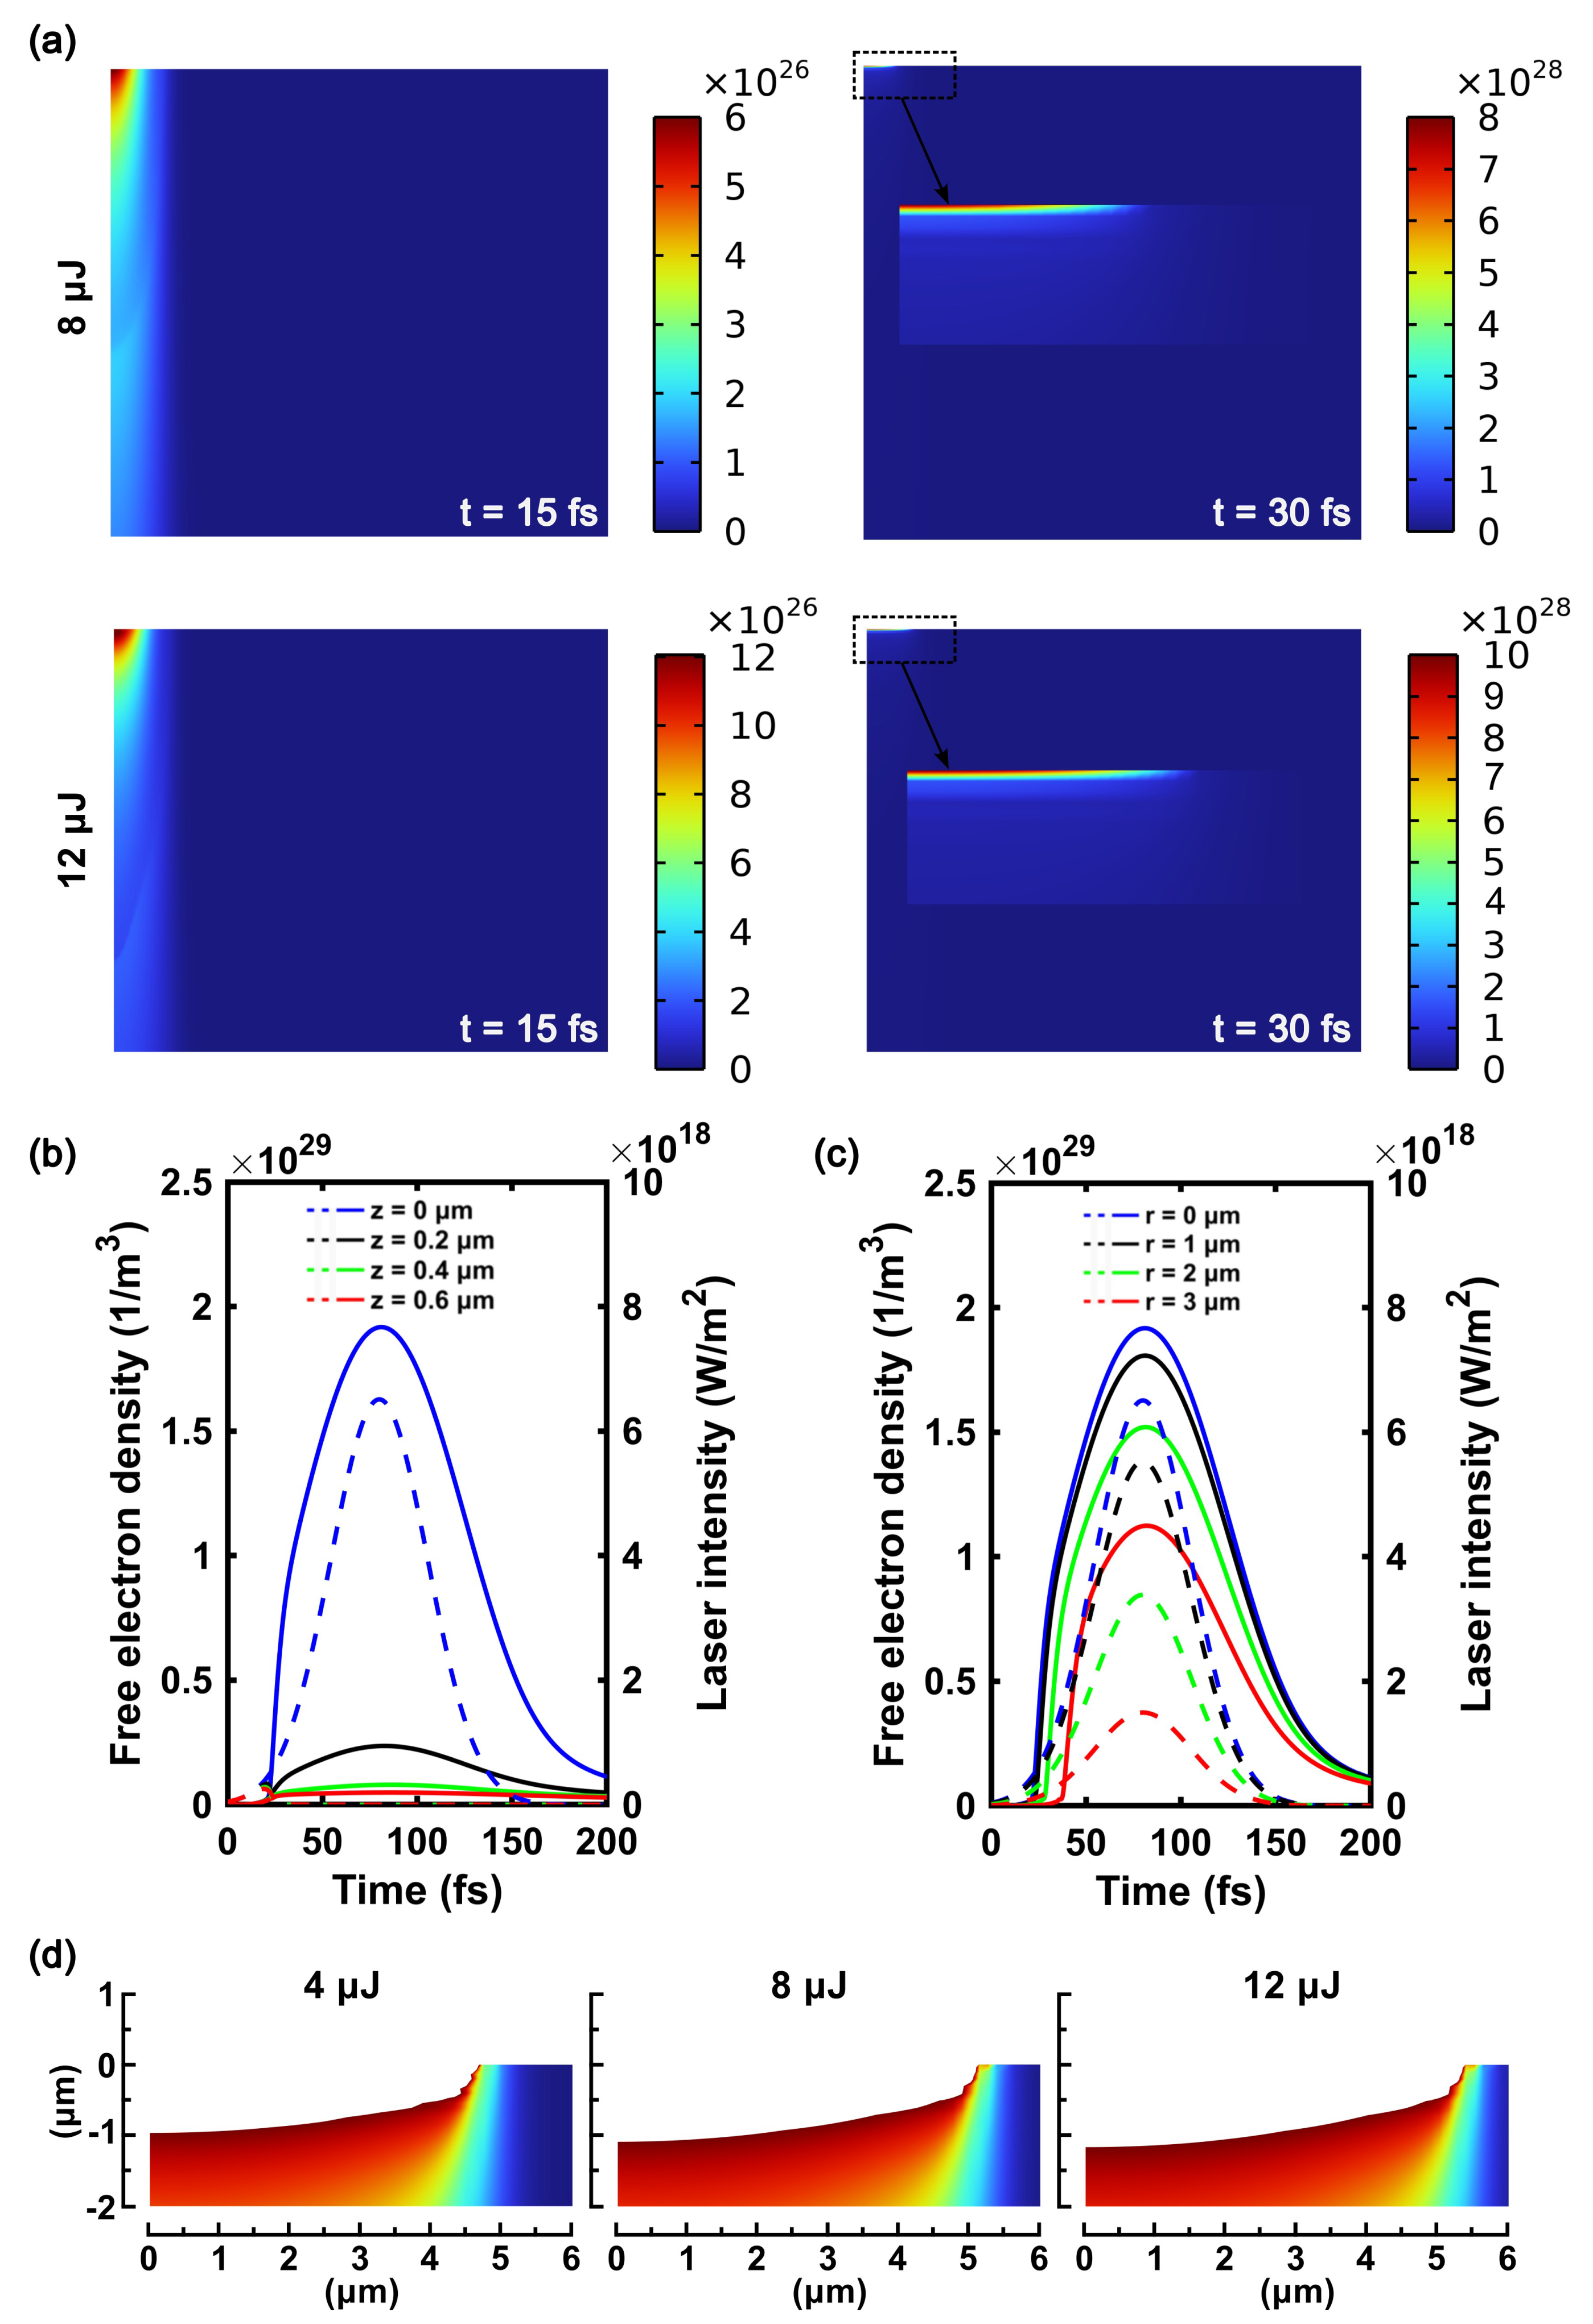
Figure 8.
Microdrilled PDMS membranes fabricated using a pulse energy of 12 and a exposure time of 1000. (a) Confocal microscopy images of the three types of membranes detailing entry and exit holes. Scale bar: 50; (b) SEM images showing ablation-induced residues and hole matrix; (c) Detail of the taper angle of holes in a 100 thick membrane; (d) Laser-drilled PDMS membrane before the cleaning procedure; (e) Laser-drilled PDMS membrane after the cleaning procedure.
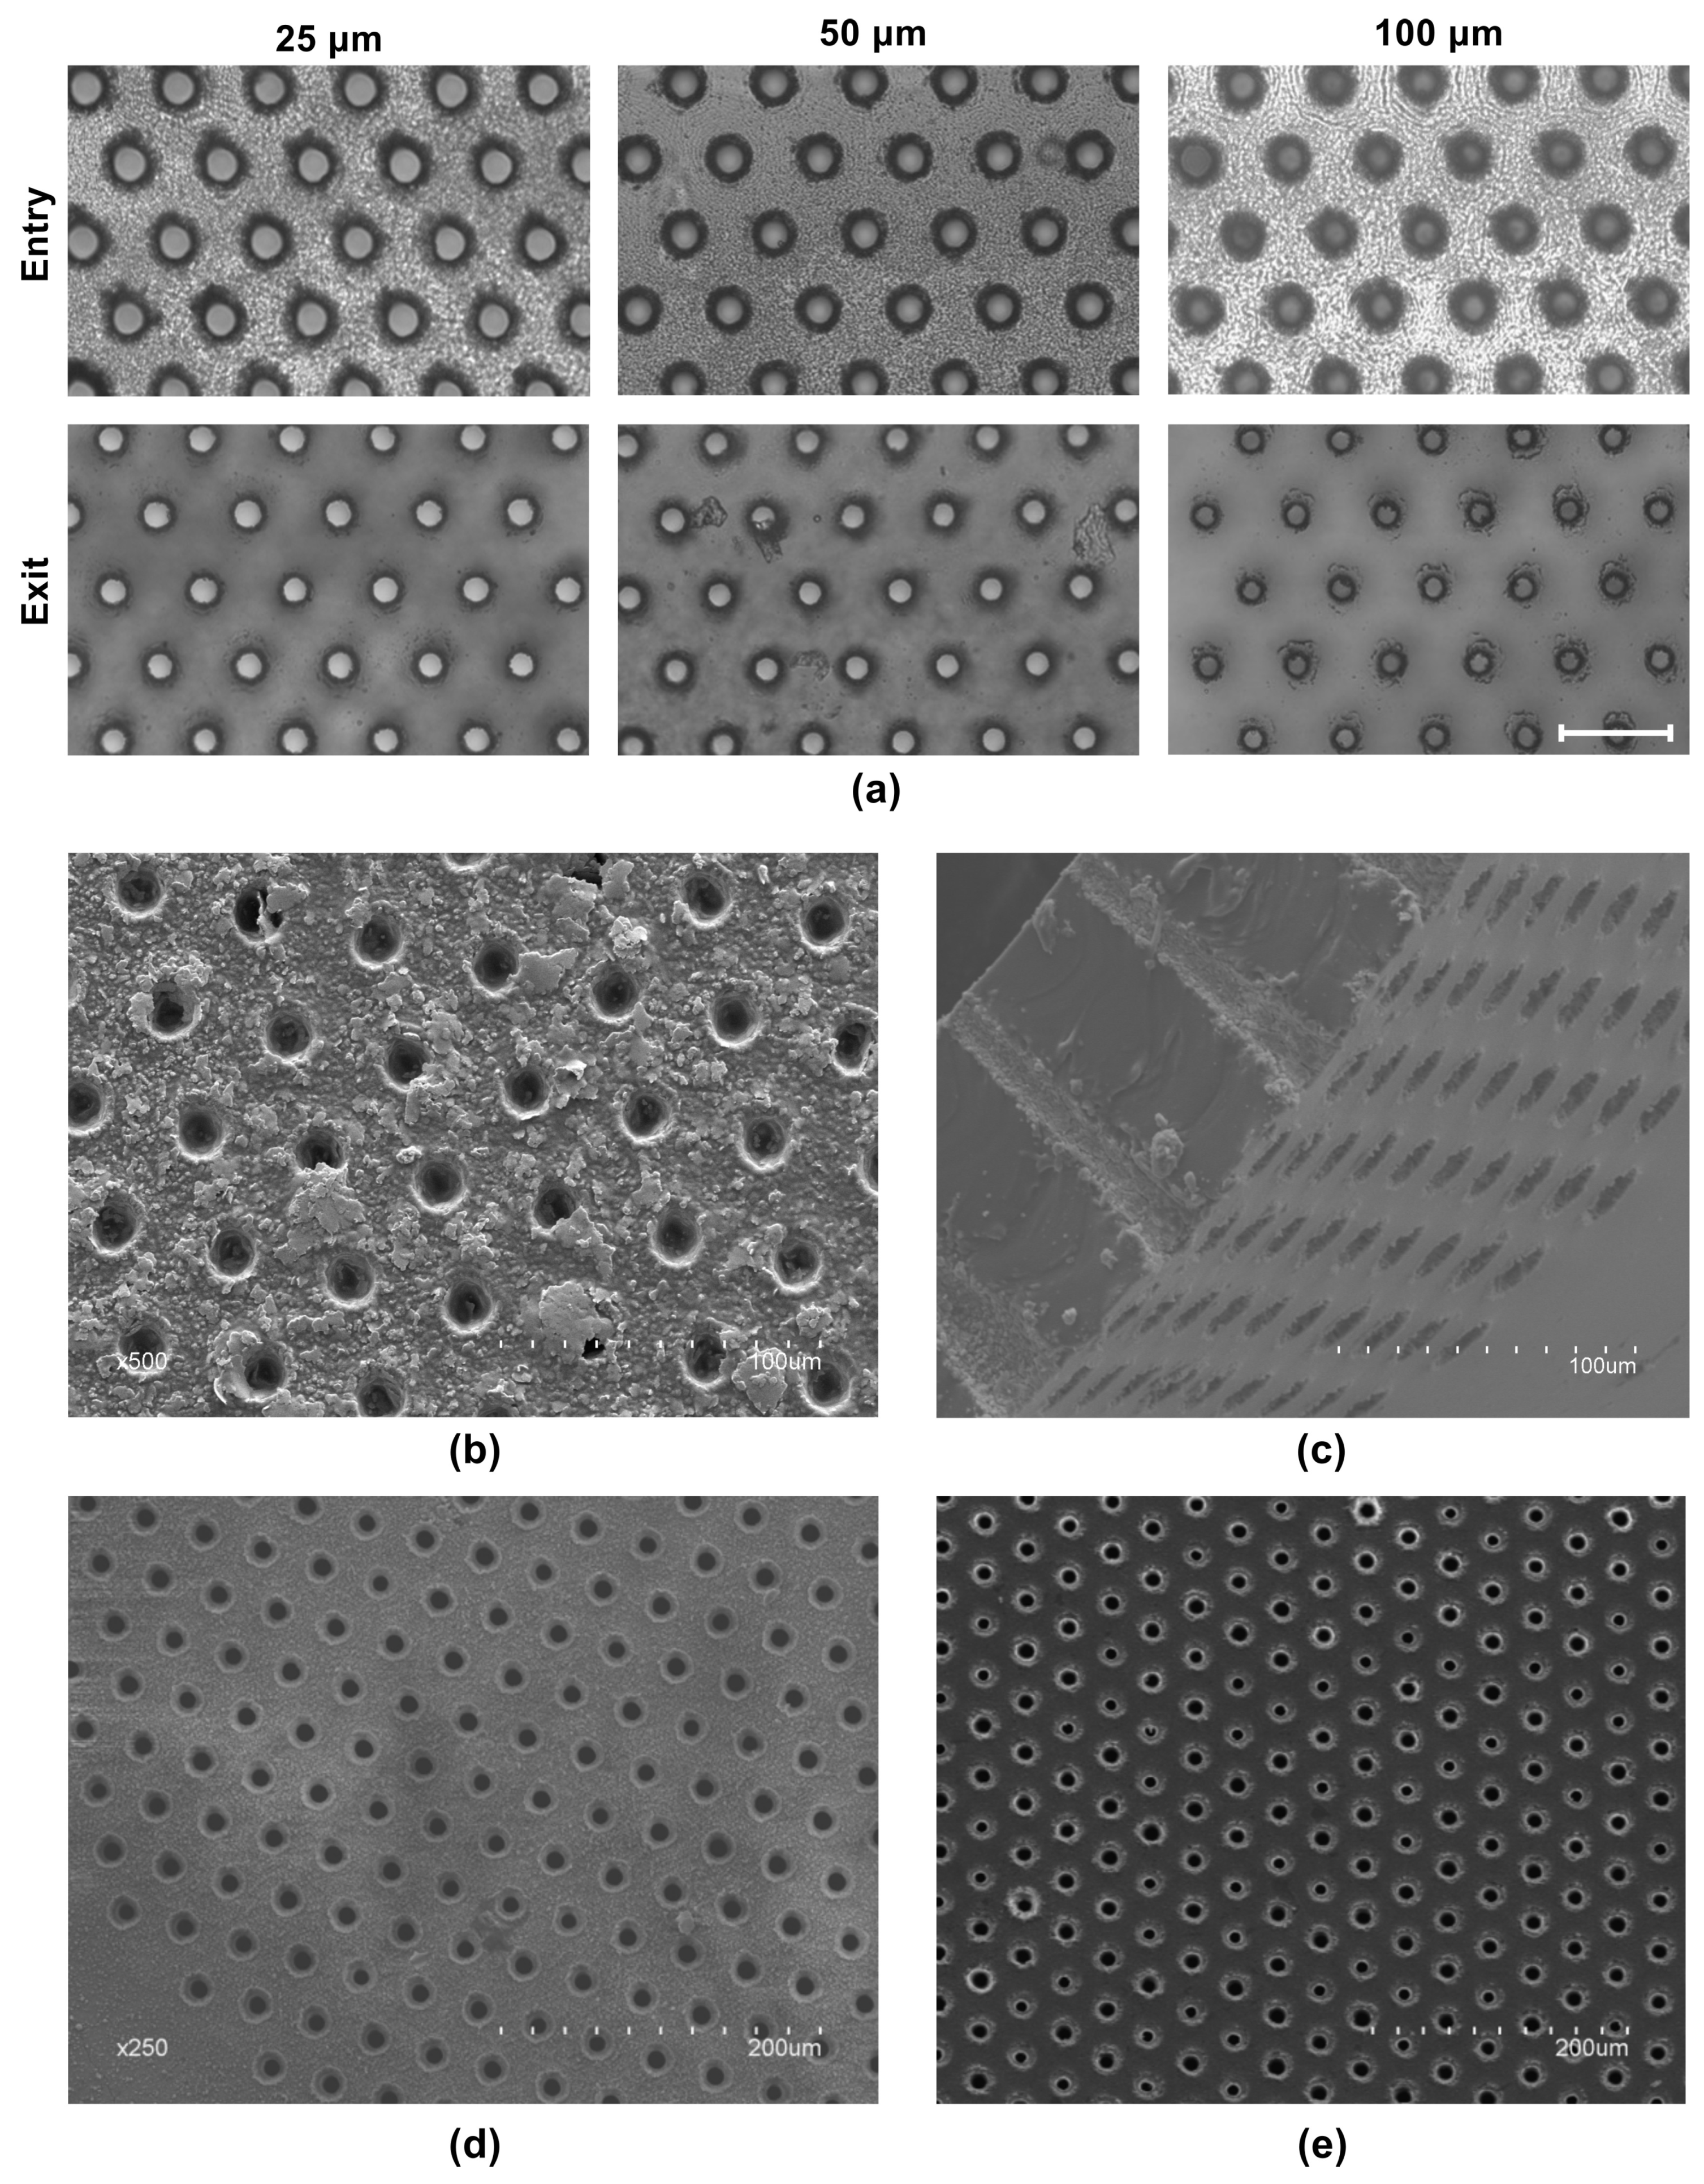
Figure 9.
(a) Schematic of the two-chamber OoC device selected with the flexible microdrilled membrane. (b-d) Confocal fluorescence images of in vitro hASCs seeded on: (b) glass coverslip; (c) undrilled PDMS membrane; (d) microdrilled PDMS membrane of 25, 50, and 100 assembled in the OoCs. Left images represent the membranes imaged with PMT in transmitted mode. hASCs stained with phalloidin (green) and DAPI (magenta). Scale bars = 50 um.
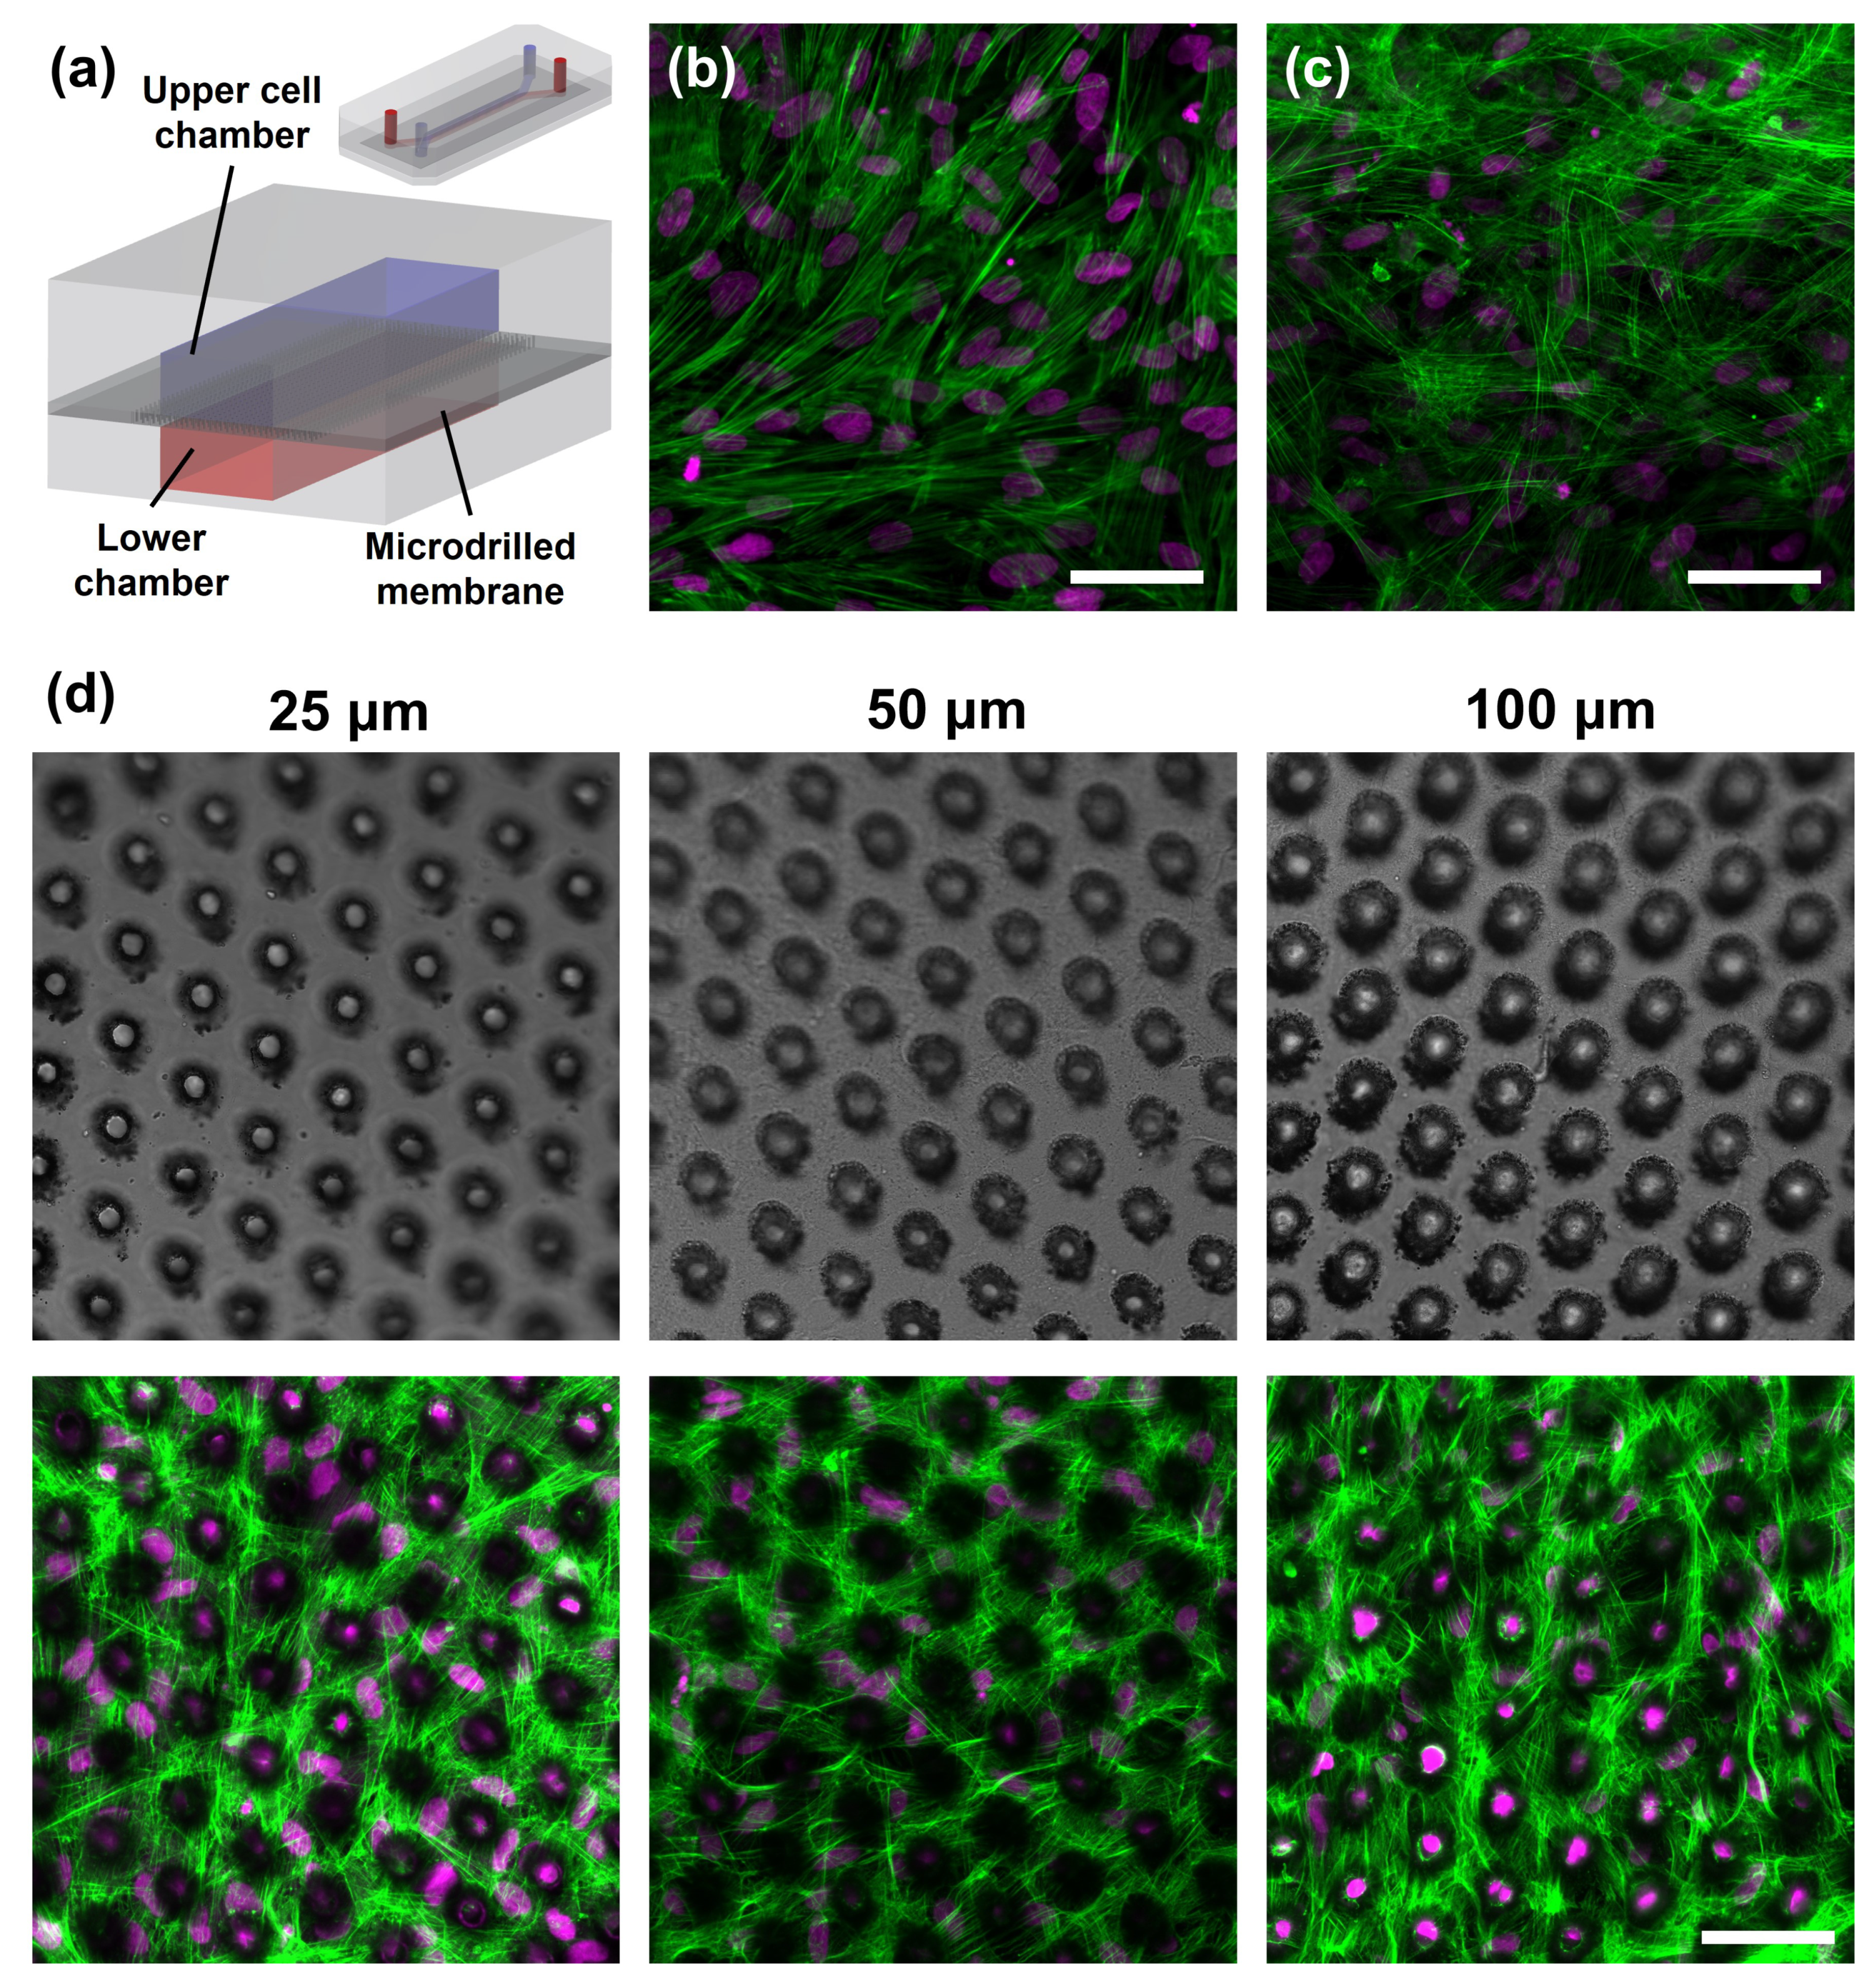
Table 1.
Material parameters for PDMS used in the developed numerical model.
| Parameter | Value | Units |
|---|---|---|
| Collision factor, 1 | 1/s | |
| Bandgap of PDMS, | 4.2 | eV |
| Free electron energy, | 0.5 | eV |
| Refractive index of PDMS, | 1.4235 | - |
| Relative permittivity of PDMS, | - | |
| Critical electron density, | 1/m3 | |
| Recombination coefficient, 1 | cm3/s | |
| 1 Reference values for water. |
Table 2.
Operational parameters and main characteristics of the ablation process, the PDMS membranes, and the femtosecond pulse laser.
Table 2.
Operational parameters and main characteristics of the ablation process, the PDMS membranes, and the femtosecond pulse laser.
| Parameter | Value | Units |
|---|---|---|
| Laser wavelength, | 800 | |
| Pulse duration, | 60 | |
| Repetition rate, f | 5 | |
| Laser spot diameter, | 7 | |
| Thickness of PDMS membranes, | 25, 50, 100 | |
| Exposure time, | 800, 1000, 1200, 1400, 1600, 1800 | |
| Pulse energy, | 4, 8, 10, 12, 14, 16, 18, 20 |
Table 3.
Comparison between experimental results and linear model predictions for entrance and exit diameters at different membrane thicknesses. Units in .
Table 3.
Comparison between experimental results and linear model predictions for entrance and exit diameters at different membrane thicknesses. Units in .
| Thickness | Entrance Diameter | Exit Diameter | ||||
|---|---|---|---|---|---|---|
| Experimental | Model | Experimental | Model | |||
| 25 | 14.02 ± 0.15 | 14.15 | 0.93% | 10.83 ± 0.09 | 11.24 | 3.79% |
| 50 | 12.41 ± 0.12 | 14.53 | 17.08% | 10.44 ± 0.10 | 9.77 | 6.42% |
| 100 | 12.28 ± 0.22 | 14.39 | 17.18% | 9.25 ± 0.07 | 9.35 | 1.08% |
Disclaimer/Publisher’s Note: The statements, opinions and data contained in all publications are solely those of the individual author(s) and contributor(s) and not of MDPI and/or the editor(s). MDPI and/or the editor(s) disclaim responsibility for any injury to people or property resulting from any ideas, methods, instructions or products referred to in the content. |
© 2025 by the authors. Licensee MDPI, Basel, Switzerland. This article is an open access article distributed under the terms and conditions of the Creative Commons Attribution (CC BY) license (http://creativecommons.org/licenses/by/4.0/).
Copyright: This open access article is published under a Creative Commons CC BY 4.0 license, which permit the free download, distribution, and reuse, provided that the author and preprint are cited in any reuse.


