
Submitted:
29 July 2025
Posted:
01 August 2025
You are already at the latest version
Abstract
Thermoset fibre-reinforced composites are increasingly used in high-end industries such as aerospace or autosport. As the demand for more sustainable materials strengthens, thermoplastics have emerged as one key focal point due to their potential recyclability, and for more efficient and sustainable applications. To change, replace, or expand the use of thermoplastic composites, new approaches to their manufacture and mechanical performance must be tackled and tailored to each application, structure or engineering challenge. The present study is focused on design, manufacture and test of advanced multi-layer laminated composites made by thermoplastic polypropylene (PP) prepreg matrix reinforced with continuous woven fibreglass. The composite laminate was subjected to interlayer toughening through thermoplastic polyurethane elastomer (TPU) layers manufactured by Fused Filament Fabrication (FFF). The manufacturing process was iteratively optimized, resulting in successful adhesion between layers. Three composite configurations were produced: baseline Glass Fiber Prepreg with Polypropylene (GFPP); and two multi-layer composites, GFPP with solid TPU layers (GFPP-TPU) and GFPP with honeycomb structured TPU layers (GFPP-TPU-HC). Thermogravimetric and Differential Thermal Analysis were also conducted on the specimens. TPU layers contributed to increase the thermal decomposition temperature of the specimens in which it is included. Specifically, the GFPP-TPU and GFPP-TPU-HC composites exhibited higher thermal stability compared to the baseline GFPP, attributed to the stabilizing effect of the TPU layers. Tensile testing was conducted on FFF additively manufactured TPU specimens, while all laminated composites were tested in three-point bending. The results demonstrated the potential of the developed composites. The addition of solid TPU layers to GFPP decreased the flexural modulus but limited the plastic deformation in the specimens that did not undergo delamination during the testing. In contrast, GFPP-TPU-HC exhibited improved geometric consistency and, on average, a less variable and increased flexural modulus.
Keywords:
thermoplastic composites
; thermoplastic polyurethane elastomer (TPU)
; fused filament fabrication (FFF)
; polypropylene (PP)
; fiberglass
; interlayer toughening
1. Introduction
Long fibre-reinforced thermoplastics composites (LFTC) have grown interest in research and applicability due to their promising balance of mechanical performance and processability. They are increasingly used in sectors such as aerospace and automotive, offering advantages such as high specific strength, excellent corrosion resistance, recyclability, low density, good vibration damping, and infinite shelf life [1].
To strengthen the competitiveness of LFTCs over traditional non-recyclable thermoset composites several research directions are being explored. Among these, interlayer toughening has emerged as a promising strategy to enhance interlaminar strength, a known weak point for laminate composites. The interlaminar regions are thin polymer rich zones with relatively weak mechanical properties. This makes toughening the interlaminar region an interesting strategy to bring substantial value to thermoplastic composites by improving damage tolerance, delamination resistance, and strength-to-weight ratio. The interlaminar region behaviour depends on the mechanical properties of the matrix phase as well as the interaction of the two subsequent plies affected by the fibre architecture, orientation, and lamination sequence [2]. Within interlayer toughening mechanisms we find several solutions such as: Particle/filler-based interlaminar toughening; film interleaving methods; Nanofibrous interlayers toughening and Interlaminate reinforcement (e.g. Glare).
The present study investigates interlaminate reinforcement using additively manufactured thermoplastic elastomeric layers to improve the delamination resistance of thermoplastic fibre composites. Previous research has shown that thermoplastic polymers applied to resin-based composites can enhance delamination toughness and impact performance [3,4].
In recent years, Additive Manufacturing (AM) has emerged as a transformative technology across multiple industries, enabling new approaches to general design, material design, prototyping, and production [5]. Among the various additive techniques, Fused Filament Fabrication (FFF) has gained prominence due to its accessibility and versatility. FFF is already recognized for its low and competitive manufacturing and equipment costs, its ability to produce complex 3D components with good mechanical properties, and its broad selection of available materials [6]. Additionally, FFF supports a wide range of sizes, from desktop machines with a manufacturing volume between 200×200×200mm to industrial-scale systems that can reach up to 12,190×4,570×1,520mm [7].
FFF encompasses variations tailored to different materials, being the majority geared toward thermoplastic polymers. Since the emergence of FFF, ABS- and PLA-based thermoplastics have been the most widely studied [8]. FFF adaptability allows for continuously research on material design, with both low to high grade engineering materials such as PEEK [9], continuous carbon fibre reinforced PLA composites [10], and to viscoelastic materials, namely Thermoplastic Elastomers (TPE).
TPEs are defined as a branch of elastomeric polymers that, unlike vulcanized rubber, can be processed and recycled like thermoplastics. Most TPEs are phase-separated systems with rigid and elastomeric phases. These phases are often chemically linked through block or graft polymerization, although in some cases, a fine dispersion of phases suffices [11]. This results in a unique non-linear viscoelastic stress-strain mechanical response together with a very high deformation degree before failure, ideal for energy-absorbing and damage-mitigating applications [12,13].
Among TPEs, the Thermoplastic Polyurethane (TPU) is known for its high ductility, excellent abrasion resistance, and good biocompatibility. TPUs offer a wide range of mechanical properties by changing the soft to hard segment ratio. This ratio largely determines TPU's elastic and low-temperature behaviour being able to exhibit shore hardness from soft 70A to hard 74D, tensile strength from 20 to 50 MPa, and elongation at break between 400 to 700% [11,12,14]. This versatility positions TPU as a unique bridge between rubber-like and structural polymers. When combined with the design flexibility of FFF, TPUs present new opportunities for creating structural components with tailored mechanical behaviour for various fields such as non-pneumatic tyres [15] and medical devices [16].
This study investigated interlayer toughening of Glass Fiber reinforced thermoplastic Polypropylene (GFPP) laminates using additively manufactured thermoplastic polyurethane (TPU) layers in both bulk and honeycomb configurations. FFF was chosen among the various AM techniques due to its accessibility and versatility on layer design, enabling tailored TPY payer for the intended laminate composite under study. Intensive tensile testing was conducted to bulk and honeycomb TPU specimens under various FFF printing parameters. Followed by TPU mechanical characterisation, three combinations of GFRP composites, two with TPU interlayer reinforcement -bulk and honeycomb shaped- were tested under three point bending test. To further understand the toughening mechanisms and interfacial interactions, surface morphology and thermal analyses were also carried out.
2. Materials and Testing Procedure
The present section details the materials, testing methods and specimen production employed in this research. The TPU specimens and testing are first specified, followed by the laminated composite Glass Fiber Prepreg with Polypropylene (GFPP) with and without the TPU reinforced layers.
2.1. TPU
TPU specimens and interlayer reinforcing layers were manufactured using Creality Ender 3 S1 equipped with a direct drive extrusion system coupled with a 0.4 mm nozzle. The material used was TPU95A Ultrafuse. Table 1 and Table 2 summarize filament's key mechanical and thermal properties, as specified by the manufacturer.
FFF printing of elastomeric materials like TPU as proven challenging due to their flexibility and sensitivity to process settings. In particular, extrusion temperature strongly affects print quality and mechanical performance [17]. To characterize its impact, TPU was printed at three temperatures, 215 °C, 225 °C and 235 °C, covering and slightly exceeding the processing range (Table 2) to observe variations in mechanical and thermal behaviour. PrusaSlicer software was used to generate all G-code files for FFF. All samples were manufactured with 0.2 mm layer height; printing speed of 10 mm/s; no top or bottom layers; filament extrusion multiplier of 1.4; heat bed temperature of 60ºC.
TPU was tested in bulk and with the cellular honeycomb structure intended for interlayer reinforcement. Tensile testings were conducted on an Universal Testing Machine (Instron 5966) equipped with a 10 kN load cell. All tensile specimens were conducted at a speed of 10 mm/min. Specimens were designed according to ASTM D638 ‘Standard Test Method for Tensile properties of Plastics’ [18]. The standard provides multiple specimen geometries: Type IV (Figure 1.A) was used for bulk TPU, as it is recommended for elastomeric materials, while Type I (Figure 1.B) was chosen for cellular samples. The change in specimen type was made to take advantage of its larger constant cross-sectional area, which allows more cells to be engaged under load. Previous studies have shown that specimens with fewer cells tend to underpredict stiffness and effective modulus compared to larger, more representative samples [19,20]. The change in specimen type will therefore improve the mechanical response, accuracy and consistency representation of cellular structure under load. A total number of 15 sets of specimens were tested: 9 sets of bulk Type IV (Figure 1.A) specimens and 6 sets of honeycomb cellular Type 1 (Figure 1.B).
Since FFF manufactures by placing filaments at each layer, the results have proven to be anisotropic. Therefore, the filament alignment direction to the load as direct impact on both the rigidity and strength. Several published research in tensile and compressive testing have shown the anisotropic behaviour both for thermoplastic and elastomeric FFF printed materials [9,12,21]. The proven anisotropic behaviour needs therefore to be characterized. Accordingly, specimens were manufactured with different filament orientations. Bulk specimens were manufactured with filaments aligned (0º), transverse (90º) and at a (45º) angle in respect to the load direction. A total of 9 sets of bulk Type IV (Figure 1.A) specimens were manufactured, combining all six parameters under study: 3 extrusion temperatures (215ºC, 225ºC and 235ºC) and three load filament alignments (0º, 45º and 90º).
The honeycomb structure is established as an in-plane orthotropic cellular structure. To characterize such behaviour two different directions were tested, cell separation wall aligned with the load (0º) and transverse with the load (90º). Additionally, three different relative densities were tested (20%, 30% and 40%). A total of 6 sets of honeycomb Type I (Figure 1.B) specimens were manufactured, combining 3 relative densities and 2 load direction parameters. The honeycomb structure was applied only in the constant cross-section area region of the specimen with 57 mm in length. Figure 2 illustrates the 0º and 90º difference for the three relative densities tested.
Elastomeric materials, such as TPU, have a complex non-linear response to load [11]. To characterize mechanically their strength and stiffness in tensile testing three parameters were computed: the initial elastic modulus between 1% to 5% strain (Ei); elongation at break (fractured strain εf) and tensile strength (rupture stress Sr). The initial elastic modulus is calculated based on the mean linear slope between nominal strain and nominal stress of all points between 1% to 5 % strain. Several authors have utilized this method to define the elastic response of elastomeric materials [12,13,14].
2.2. Composite
Glass Fiber Reinforced Polymer (GFRP) of Polypropylene thermoplastic (PP) Prepreg details and laminate manufacture with and without FFF TPU are now discussed. Three composite configurations were produced: a baseline and two multi-layer composites:
baseline Glass Fiber Prepreg with Polypropylene (GFPP).
GFPP with solid TPU layers (GFPP-TPU).
GFPP with honeycomb structured TPU layers (GFPP-TPU-HC).
The prepreg was the WG1-PP-700 black weave twill 2/2, which properties are presented in Table 3. In all composite laminates 3 twill 2/2 prepreg layers were applied. TPU interlayer reinforcements with 0.4 mm thickness each were placed in/between the prepreg layers. The shaped honeycomb cellular structures had a 25% relative density infill. A representative sequence of GFPP and the two interlayered reinforced composites are:
GFPP: [(0/90)3];
GFPP-TPU and GFPP-TPU-HC: [0/90/TPU/0/90/TPU/0/90]
The standard ASTM D790-17 ‘Standard Test Methods for Flexural Properties of Unreinforced and Reinforced Plastics and Electrical Insulating Materials’ [22] outlines the method for determining the flexural properties in three-point bending of unreinforced and reinforced plastics. Figure 3 shows the specimen geometry according to the ASTM D790-17 standard and the final measured thickness of the three composite configurations. All three-point bending tests were conducted at an Universal Testing Machine (Instron 5966) equipped with a 10 kN load cell and a 100 mm distance between supports. All GFPP laminates were manufacture in vacuum bag with a curing temperature of 200ºC. Afterwards reaching the curing temperature they were gradually cooled to room temperature with oven door opened and later machined by CNC followed by edge polishing.
From laminate thickness measurements (Figure 3.B) an interesting conclusion was achieved. The composite with TPU honeycomb layers (GFPP-TPU-HC) proved significantly less thickness variability. This might indicate that the honeycomb layer can help to achieve a more uniform composite laminate. The mechanical tests reinforce this conclusion, as GFPP-TPU-HC presented an overall equal or even lower variability on all results. This behaviour could be attributed to the high deformation and adaptability of the TPU honeycomb layer, enabling a more uniform pressure distribution being applied to the laminate across the curing process.
3. Results Analysis
3.1. Thermal Characterization
3.1.1. Differential Scanning Calorimetry Analysis (DSC)
For the TPU thermal analyses, some DSC experiments were performed using temperature range from room temperature to 220 °C with a heating rate of 10 °C/min using nitrogen flow rate of 50 ml/min. All samples were subjected to a thermal cycle consisting of heating followed by cooling, as illustrated in the thermograms presented in Figure 4.
TPU results indicate that - even when following the testing procedure recommended by the manufacturer of the TPU 95A filament - the glass transition temperature (Tg) was not detected in any of the samples. In contrast, the melting temperatures (Tm) were successfully identified for all tested samples, revealing significant differences among them. Specifically, a variation of approximately 20 °C was observed between the highest and lowest melting temperatures, as presented in Table 4
The results presented in Table 4 shows that Tm of the FFF samples is different from the TPU95A filament and decreases with the samples extrusion temperature. It may result from the different cooling speeds of samples, which is lowest for the samples extruded at 215ºC in comparison with the remaining ones, which increases the crystallinity degree of polymer and consequently its melting temperature. The FFF samples extruded at 235ºC presents the lowest Tm probably due to its lower crystallinity degree that contributes to a decrease in the polymer performance that can be correlated with the mechanical testing results.
3.1.2. Differential Thermal Analysis (DTA) / Thermogravimetric Analysis (TG)
DTA/TG studies were carried out using the samples cut (7-10mg) from the produced composite specimens. The trials were carried out from the room temperature (25ºC) until 550ºC (heating rate 10ºC/min) using alumina crucibles and nitrogen atmosphere (200 ml/min) to avoid the occurrence of oxidation reactions.
Figure 5 shows the behaviour of the three different types of composites manufactured, GFPP, GFPP-TPU and GFPP-TPU-HC, under DTA analysis.
The first peaks across Figure 5 voltage (identified by a.) corresponds to the melting of PP matrix present in all three composite samples (melting temperature at this range). Around 300°C, there is a steady increase in voltage, peaking at around 350°C, suggesting an exothermic event. The sharp peak could be related with a decay of the PP.
The later curve peaks at around 400°C can be attributed to the bonding between different materials (glass fibre, PP, and TPU). It is also important to highlight the differences in the degradation temperatures of PP and TPU. These variations correspond to the sharper, upward-facing peaks, which indicate exothermic reactions occurring during the degradation of the polymers. The degradation temperature of PP is lower (350ºC), while TPU degrades at a higher temperature (400ºC), which explains the distinct thermal behaviour and the shape of the curves after the peak.
TG analysis allowed to experimentally determine the percentage (in weight) of polymers (PP only and PP+TPU, depending on the samples type) and glass fibres present in the three different composite specimen types. Table 5 presents the referred results of fibre and polymer mass and volume content (neglecting the existence of voids)
The results presented in Table 5 shows, as expected, that the glass fibre mass fraction is higher for the sample GFPP than for the TPU reinforced and in these two samples, the TPU with a honeycomb cellular geometry present a lower polymer content that the sample produced with solid TPU.
3.2. Surface Morphology
After bending, all tested laminates were examined using optical microscopy. Figure 6 presents representative microscopic images of important examples for the different laminated composites across the thickness surface.
In some GFPP laminates without reinforcement (Figure 6a), defects such as voids between layers were observed. In contrast, TPU-reinforced laminates (GFPP-TPU and GFPP-TPU-HC) did not exhibit these voids. However, some TPU-reinforced specimens showed regions with TPU accumulation (Figure 6c) or poor adhesion between the TPU and the PP matrix. In such cases, delamination occurred at the TPU–PP interface during three-point bending tests, as shown in Figure 6b.
Specimens with good interface adhesion between TPU and PP exhibited no delamination. Microscopic analysis revealed that in these cases TPU effectively surrounded and even partially embedded into the glass fibre bundles (Figure 6c, 6d, and 6e), indicating a strong bonding. Notably, the honeycomb (HC) structure appeared to enhance the uniformity and distribution of the TPU within the laminate, promoting better integration with the PP matrix. These observations are consistent with the bending test results, which showed no visible delamination in any of the GFPP-TPU-HC specimens.
3.3. Tensile Testing
As previously described in section 2.1, both bulk and cellular structure TPU specimens were submitted to tensile testing. The results of the main mechanical properties for bulk specimens are presented and compared in Figure 7.
The results reveal the expected anisotropic behaviour inherent of the FFF manufacturing process. The most pronounced differences appear in parameters related to plastic deformation and failure - tensile strength and elongation at break. In contrast, the initial elastic modulus shows minimal variation, being in general higher at an extrusion temperature of 225ºC. These findings indicate that filament and layer fusion did not introduce significant anisotropy in the elastic region, regardless of build orientation or extrusion temperature. However, anisotropy becomes much more evident in the plastic and fracture regimes.
Transverse specimens (90º) exhibited the lowest tensile strength and elongation at break, clearly demonstrating this effect. In 90° build orientation filament and fusion regions experience an iso-stress condition where both are subjected to the same stress. These weld regions often contain defects, voids, and altered polymer crystallinity, all of which contribute to premature failure and reduced mechanical performance. An equivalent conclusion was taken by Sardinha [13] where voids in FFF TPU are aligned with the infill filament deposition direction. This translated to transverse TPU specimens present lower tensile strength.
Following this concept, the extrusion temperature proved a notable influence on the mechanical performance of the 90° and 45° specimens, particularly in terms of tensile strength and elongation at break. The most significant change was observed in 90° specimens, where tensile strength decreased by 29.4% when the extrusion temperature increased from 225 °C to 235 °C. Such might indicate that higher temperatures have poorer quality filament welded regions or lead to a polymer with lower crystallinity degree as result of its higher cooling speed during the extrusion due to the higher temperature gradient between the extruded polymer and the heating bed (at 60º). Several studies have shown that increasing extrusion temperature generally reduces void size and frequency, likely due to decreased melt viscosity and improved interlayer and filament fusion [13,21]. It is therefore expected that higher temperatures would result in improved mechanical properties as perceived by the referenced studies. The unforeseen result could therefore be associated with polymeric temperature gradients that result in lower crystallinity degree as proven by the DTA results.
When comparing the results with the manufacturer mechanical properties data shown in Table 1, there is a general lower value. The lowest to biggest differences in each mechanical property are: 5.6% to 29.7% in elongation at break; 10.9% to 43.2% in tensile strength and 9% to 17.9% for the initial Young modulus. Again, the plastic deformation parameters present the biggest variation and difference.
The tensile testing results of the honeycomb geometry TPU specimens are presented and compared in Figure 8.
As expected, all three computed parameters increase in value with the increase of relative density. A general decrease in mechanical properties is also visible between 0º towards 90º. Additionally, a general higher variability of results was obtained with 90º aligned structures. Similar to bulk specimens, the initial Young’s modulus had the lowest variability between the three computed parameters.
Specimens fractured region was between the honeycomb to bulk section and in the honeycomb itself. A significant difference between 0º and 90º fracture location was visible. While 0º specimens transition from the connection region towards the cellular structure as the relative density increased, the 90º presented the opposite behaviour. Figure 9 shows fractured specimens. The relative density with both types of fracture has a higher result variability in the plastic deformation mechanical properties, having a possible reduction of when it transitions from cellular to the cellular-bulk region. This is visible when comparing 90º cellular structure between 20% and 30%, where there is even a reduction on elongation at break.
The failure region change appears to be associated with the combining factors of the structure relative density, the cell deformed shape at high deformation, and how the cells are connected to the bulk. It is possible to perceive how the load transmission in the cellular-bulk may affect the change in fracture location when observing cellular-bulk region at high deformation, as shown in Figure 10.
In 0° specimens with 20% relative density, a pronounced “C-shape” is visible, which indicates asymmetric deformation where the outermost cells carry most of the tensile load. As the cell infill increases the curvature diminishes, suggesting a more uniform load distribution which coincides with all fractures shifting to the honeycomb rather than at the interface. In contrast, 90° specimens do not display the C-shaped distortion. The honeycomb cells align with the tensile axis at high deformation, forming straighter load paths and promoting more balanced load distribution from bulk to cellular. This likely explains why 90° specimens at 20% showed greater elongation at break than their 0° counterparts.
Even with the high deformation alignment, 90º honeycomb fracture shifted to the cellular-bulk regions at higher relative densities. This shift may be due to weaker bonding quality due to the printing sequence, or stress concentration when the cell ends at specific connection regions. In the 0°and 20% specimens, fracture consistently initiated on the same interface where the contact area between honeycomb and bulk was visibly reduced. In the remaining specimens the connection was made approximately equal, resulting in alternate fractures between cellular-bulk sides.
In future cellular specimen design, the connection must be studied to reduce fracture in this region as much as possible, enabling more cohesive and true plastic deformation parameter characterization.
The cellular specimens’ results were then compared with the bulk specimens. Representative stress-strain results between all TPU tensile tested specimens, bulk and honeycomb, are presented in Figure 11. Figure 12 correlates the percentage of relative density with the three main parameters under discussion.
A clear and predictable increasing trend of the three properties is visible in Figure 12. The results proved a good correlation to the analytical solution for the effective moduli determined by Ashby and Gibson [23] considering the coefficients C1 and n equal to 1. The aligned cellular structure 0º shows higher moduli than predicted. The results showcase the orthotropic behaviour of the honeycomb structure.
3.4. Bending Testing
Following the TPU mechanical tensile analysis, all three composite laminates were subjected to three-point bending tests. Representative stress-strain results of the referred tests are presented in Figure 13.
From direct mechanical force-displacement and stress-strain analysis there is a clear distinction between the three laminates. GFPP has the highest bending strength, however, reaching plastic deformation there is a clear uneven loss of strength with sudden force drops related to fibre and inter-ply failure. GFPP-TPU has the highest deformation before loss of strength, associated with the TPU layer ability to deform in shear. However, GFPP-TPU has the lowest flexural modulus, bending strength, and like unreinforced GFPP, most specimens presented sudden drops of strength, and thus who did show a predominantly inter-ply failure (visible in the microscopy analysis Figure 6.d).
Figure 14 shows examples of all three manufactured laminated under three point bending test. GFPP has fibre and layer breakage (Figure 14.a), GFPP-TPU (Figure 14.b) has a clear delamination, while GFPP-TPU-HC does not show any visible damage (Figure 14.c). The visible results under and after testing have corresponding patterns with Figure 13 results.
GFPP-TPU-HC laminates showed the most interesting results. The plastic deformation was even with a slow and progressive loss of strength. No delamination was visible in the microscope with one exception; no clear damage was visible after test. The specimens presented a high recoverability after test almost returning to the original shape.
From strain-stress diagrams four mechanical parameters were computed and compared between the three laminates: Flexural Modulus Ef; Maximum tensile stress; strain at maximum tensile stress and the ratio between the maximum and the final tensile stress. All computed results are presented and compared in Figure 15.
4. Conclusions
This study explored the use of additively manufactured thermoplastic polyurethane (TPU) sheet layers, in bulk and in honeycomb forms, to enhance the mechanical performance of glass Fiber reinforced polypropylene (GFPP) laminates. Through mechanical, surface morphological, and thermal analyses, the work aimed to evaluate the potential of TPU as an interlayer toughening material, manufactured by Fused Filament Fabrication (FFF), and applied in vacuum bag oven cure.
Three-point bending revealed significant differences between the various laminated composites configurations. Laminates incorporating a honeycomb TPU interlayer (GFPP-TPU-HC) exhibited the highest resistance to delamination and fibre breakage, attributed to improved adhesion between the TPU and the polypropylene matrix. In addition, the honeycomb reinforcement contributed to increased bending deformation in the interlayer region and overall ductility, displayed by the higher elastic recovery and the lower maximum to final nominal stress ratio across the bending tests. enhancing the
The present study methodology provides a promising foundation for further research and development of advanced laminate composites and interlayer elastomeric toughening. Future studies should continue to explore and optimize the integration of FFF elastomers for multifunctional applications, leveraging their inherent properties such as vibration damping, impact resistance, and high elastic recovery. Ongoing optimization of FFF parameters for elastomeric materials like TPU will lead to improved and more consistent print quality and mechanical performance, making them increasingly viable for structural applications such as the interlayer toughening of thermoplastic composites. Furthermore, exploring variations in honeycomb relative density or alternative cellular architectures may enable fine-tuning of interlayer behaviour, allowing for tailored mechanical performance to meet specific application requirements.
Acknowledgements
This work was supported by the Portuguese Foundation for Science and Technology, I.P. (FCT, I.P.) FCT/MCTES through national funds (PIDDAC) under the R&D Unit C-MAST, Center for Mechanical and Aerospace Science and Technologies, reference: Projects UIDB/00151/2020 (https://doi.org/10.54499/UIDB/00151/2020)
References
- Jiang, L.; Zhou, Y.; Jin, F.; Hou, Z. Influence of Polymer Matrices on the Tensile and Impact Properties of Long Fiber-Reinforced Thermoplastic Composites. Polymers (Basel) 2023, 15. [Google Scholar] [CrossRef] [PubMed]
- Bilge, K.; Papila, M. Interlayer Toughening Mechanisms of Composite Materials. In Toughening Mechanisms in Composite Materials; Elsevier Inc., 2015; pp. 263–294 ISBN 9781782422914.
- Boyd, S.E.; Bogetti, T.A.; Staniszewski, J.M.; Lawrence, B.D.; Walter, M.S. Enhanced Delamination Resistance of Thick-Section Glass-Epoxy Composite Laminates Using Compliant Thermoplastic Polyurethane Interlayers. Compos Struct 2018, 189, 184–191. [Google Scholar] [CrossRef]
- Tsotsis, T.K. Interlayer Toughening of Composite Materials. Polym Compos 2009, 30, 70–86. [Google Scholar] [CrossRef]
- Abdulhameed, O.; Al-Ahmari, A.; Ameen, W.; Mian, S.H. Additive Manufacturing: Challenges, Trends, and Applications. Advances in Mechanical Engineering 2019, 11. [Google Scholar] [CrossRef]
- Li, N.; Huang, S.; Zhang, G.; Qin, R.; Liu, W.; Xiong, H.; Shi, G.; Blackburn, J. Progress in Additive Manufacturing on New Materials: A Review. J Mater Sci Technol 2019, 35, 242–269. [Google Scholar] [CrossRef]
- Vicente, C.M.S.; Sardinha, M.; Reis, L.; Ribeiro, A.; Leite, M. Large-Format Additive Manufacturing of Polymer Extrusion-Based Deposition Systems: Review and Applications. Progress in Additive Manufacturing 2023, 8, 1257–1280. [Google Scholar] [CrossRef]
- Dave, H.K.; Davim, J.P. Fused Deposition Modeling 3D Printing; Harshit, K. Dave, J. Paulo Davim, Eds. 2021. [Google Scholar]
- Pulipaka, A.; Gide, K.M.; Beheshti, A.; Bagheri, Z.S. Effect of 3D Printing Process Parameters on Surface and Mechanical Properties of FFF-Printed PEEK. J Manuf Process 2023, 85, 368–386. [Google Scholar] [CrossRef]
- Tian, X.; Liu, T.; Yang, C.; Wang, Q.; Li, D. Interface and Performance of 3D Printed Continuous Carbon Fiber Reinforced PLA Composites. Compos Part A Appl Sci Manuf 2016, 88, 198–205. [Google Scholar] [CrossRef]
- A. Harper, C. A. Harper, C. Handbook of Plastics, Elastomers & Composites, 2002. [Google Scholar]
- Xu, T.; Shen, W.; Lin, X.; Xie, Y.M. Mechanical Properties of Additively Manufactured Thermoplastic Polyurethane (TPU) Material Affected by Various Processing Parameters. Polymers (Basel) 2020, 12, 1–16. [Google Scholar] [CrossRef] [PubMed]
- Sardinha, M.; Ferreira, L.; Diogo, H.; Ramos, T.R.P.; Reis, L.; Vaz, M.F. Material Extrusion of TPU: Thermal Characterization and Effects of Infill and Extrusion Temperature on Voids, Tensile Strength and Compressive Properties. Rapid Prototyp J 2025. [Google Scholar] [CrossRef]
- Arifvianto, B.; Nur Iman, T.; Tulung Prayoga, B.; Dharmastiti, R.; Agus Salim, U.; Mahardika, M. Tensile Properties of the FFF-Processed Thermoplastic Polyurethane (TPU) Elastomer. The International Journal of Advanced Manufacturing Technology 2021, 117, 1709–1719. [Google Scholar] [CrossRef]
- Tomé, P.; Sardinha, M. ; M. Vaz, F.; Reis, L. Design and Stiffness Assessment of Non-Pneumatic Bicycle Tyres with Latticed Cores Produced by Fused Filament Fabricationsite) Journal Name. Journal of Materials: Design and Applications.
- Mian, S.H.; Abouel Nasr, E.; Moiduddin, K.; Saleh, M.; Alkhalefah, H. An Insight into the Characteristics of 3D Printed Polymer Materials for Orthoses Applications: Experimental Study. Polymers (Basel) 2024, 16. [Google Scholar] [CrossRef] [PubMed]
- Sardinha, M.; Ferreira, L.; Ramos, T.; Reis, L.; Vaz, M.F. Challenges on Extrusion-Based Additive Manufacturing of Thermoplastic Polyurethane. Engineering Manufacturing Letters 2024, 2, 45–52. [Google Scholar] [CrossRef]
- ASTM International D638 - 14 Standard Test Method for Tensile Properties of Plastics. 2014. [CrossRef]
- Pham, R.D.; Hütter, G. Influence of Topology and Porosity on Size Effects in Stripes of Cellular Material with Honeycomb Structure under Shear, Tension and Bending. Mechanics of Materials 2021, 154. [Google Scholar] [CrossRef]
- Jin, T.; Zhou, Z.; Liu, Z.; Shu, X. Size Effects on the In-Plane Mechanical Behavior of Hexagonal Honeycombs. Science and Engineering of Composite Materials 2016, 23, 301–307. [Google Scholar] [CrossRef]
- Elhattab, K.; Bhaduri, S.B.; Sikder, P. Influence of Fused Deposition Modelling Nozzle Temperature on the Rheology and Mechanical Properties of 3D Printed β-Tricalcium Phosphate (TCP)/Polylactic Acid (PLA) Composite. Polymers (Basel) 2022, 14. [Google Scholar] [CrossRef] [PubMed]
- ASTM International D790-17 Test Methods for Flexural Properties of Unreinforced and Reinforced Plastics and Electrical Insulating Materials 2017.
- Gibson J., Lorna; Ashby, F. Michael Cellular Solids Structure and Properties; second. 1997. [Google Scholar]
Figure 1.
TPU tensile speciments following ASTM D638 [18]: [A] Type 4 for bulk; [B] Type 1 for cellular structure.
Figure 1.
TPU tensile speciments following ASTM D638 [18]: [A] Type 4 for bulk; [B] Type 1 for cellular structure.
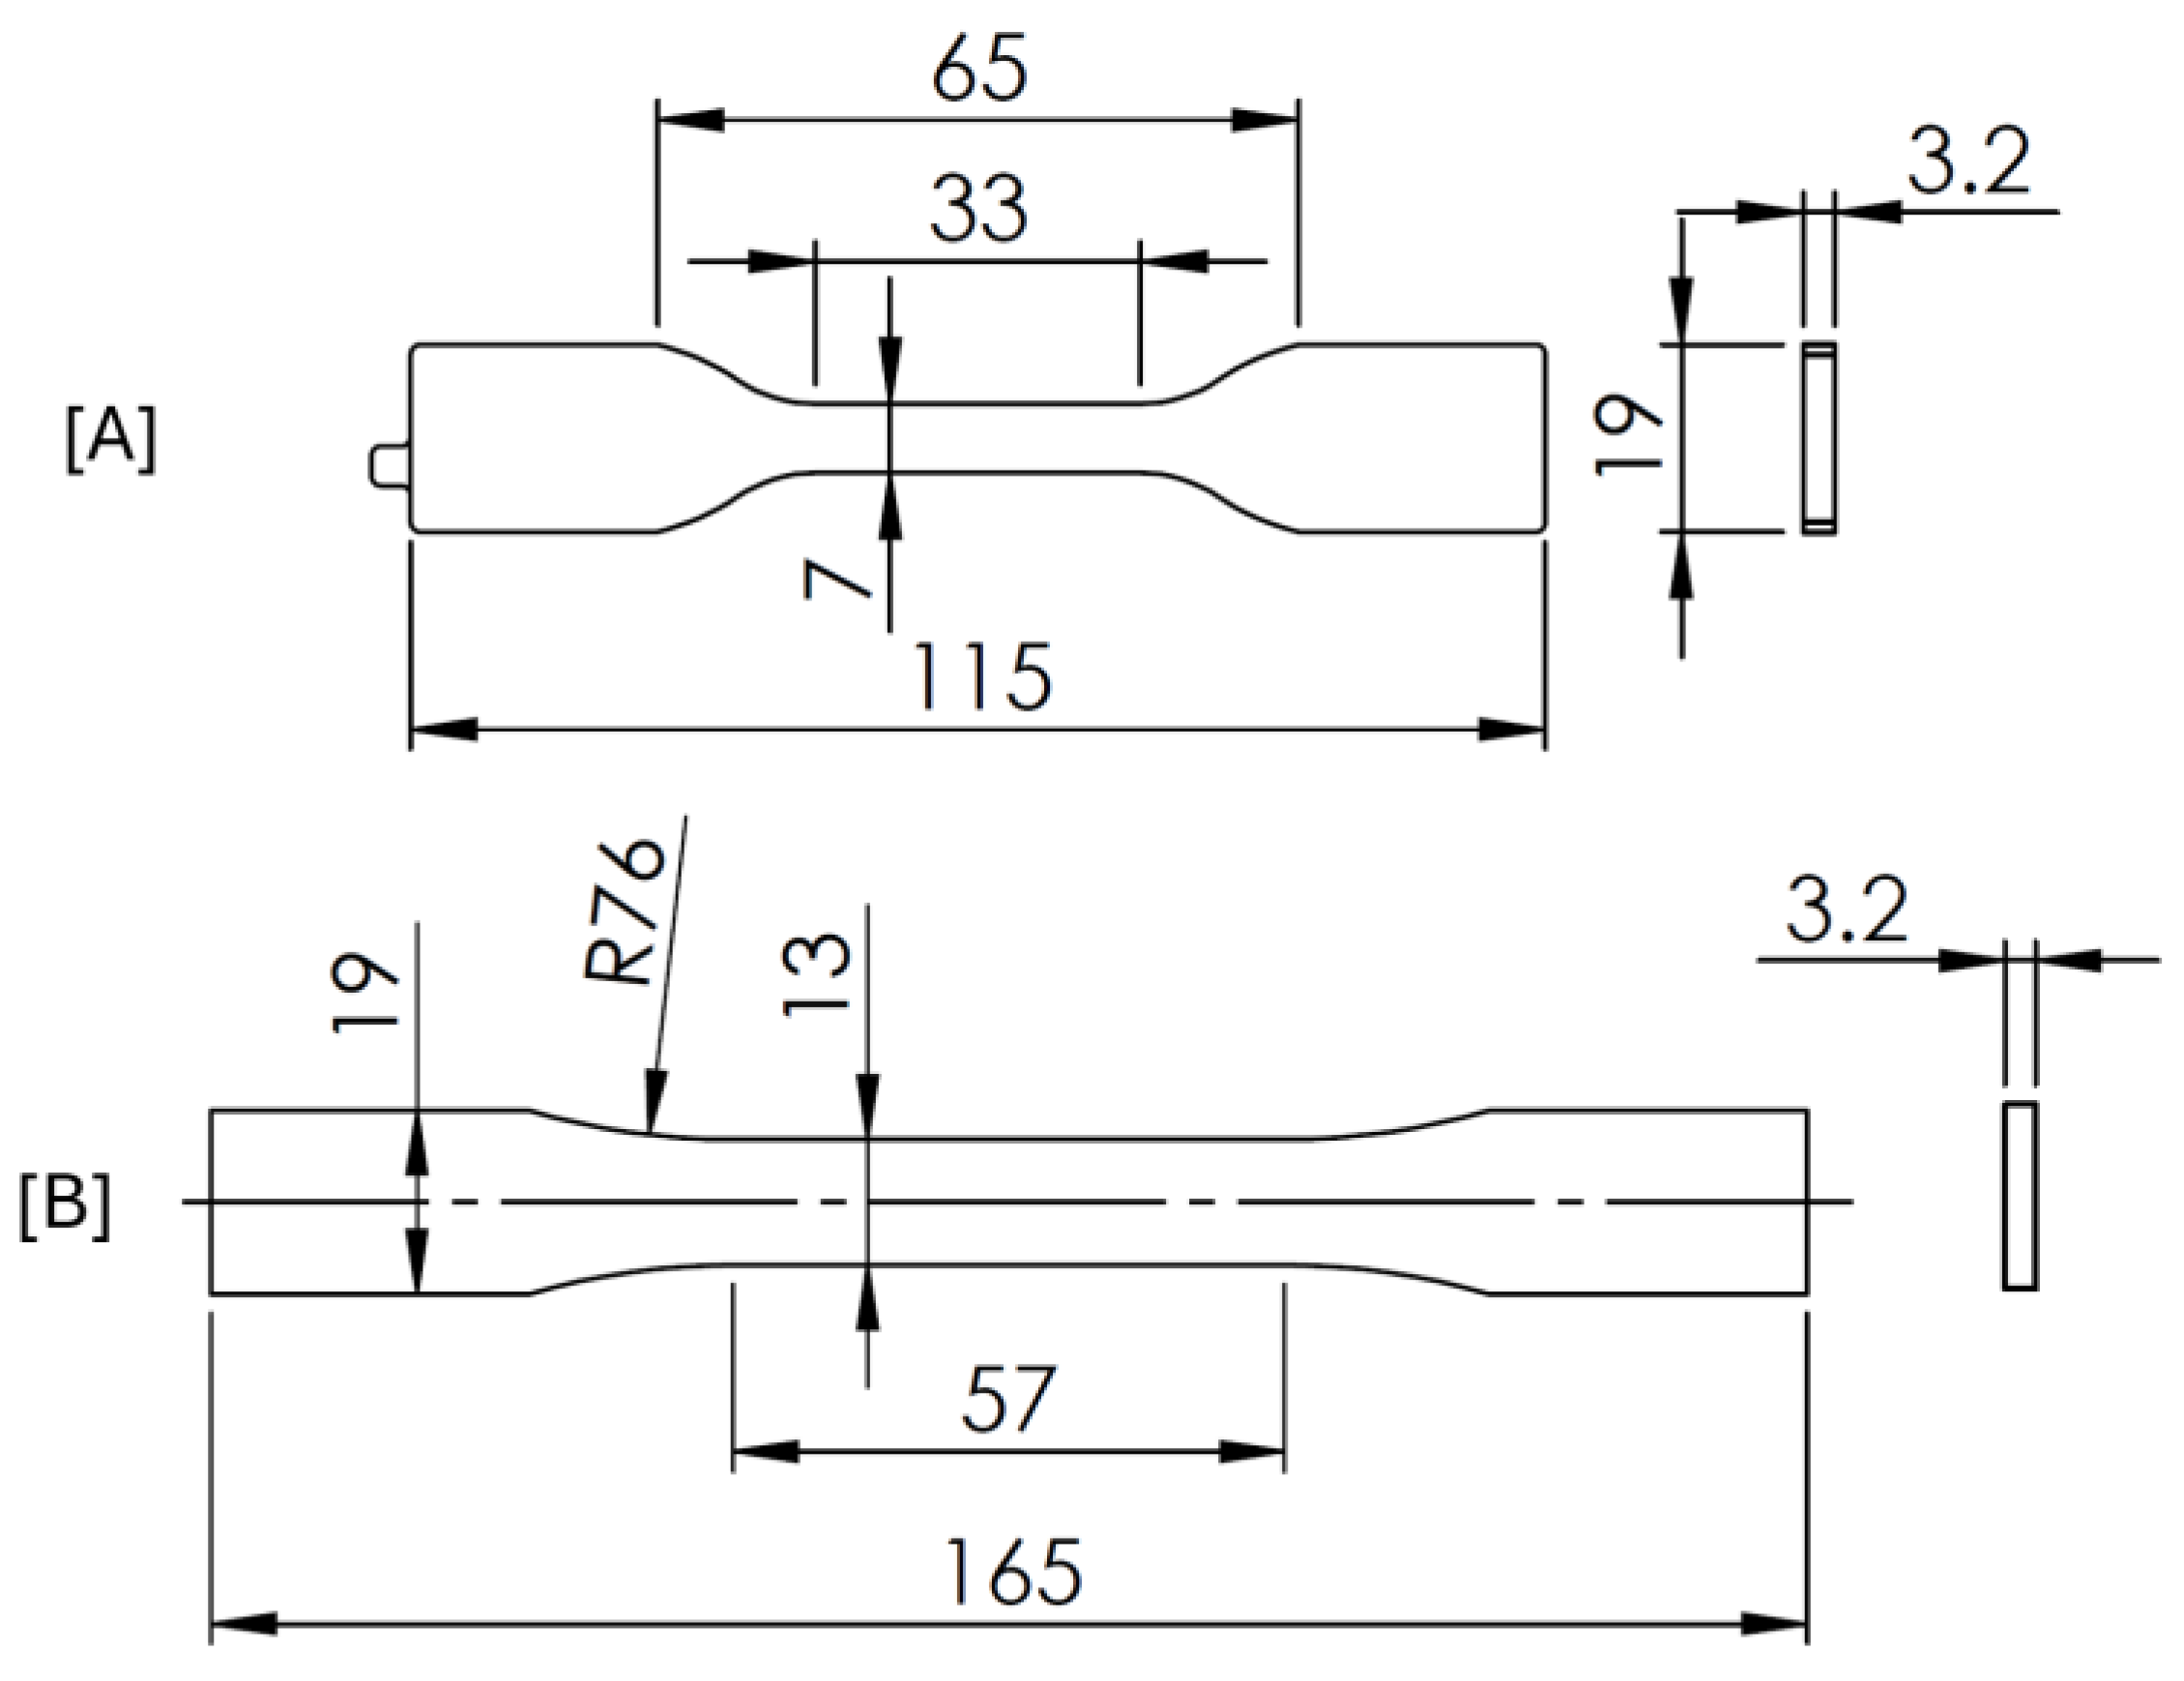
Figure 2.
Illustration of the three relative densities tested for: [A] load alinged (0º); and [B] Transverse to the load (90º) TPU specimens. [C] Photo of honeycomb TPU Type I specimens with load aligned with the structure (0º).
Figure 2.
Illustration of the three relative densities tested for: [A] load alinged (0º); and [B] Transverse to the load (90º) TPU specimens. [C] Photo of honeycomb TPU Type I specimens with load aligned with the structure (0º).
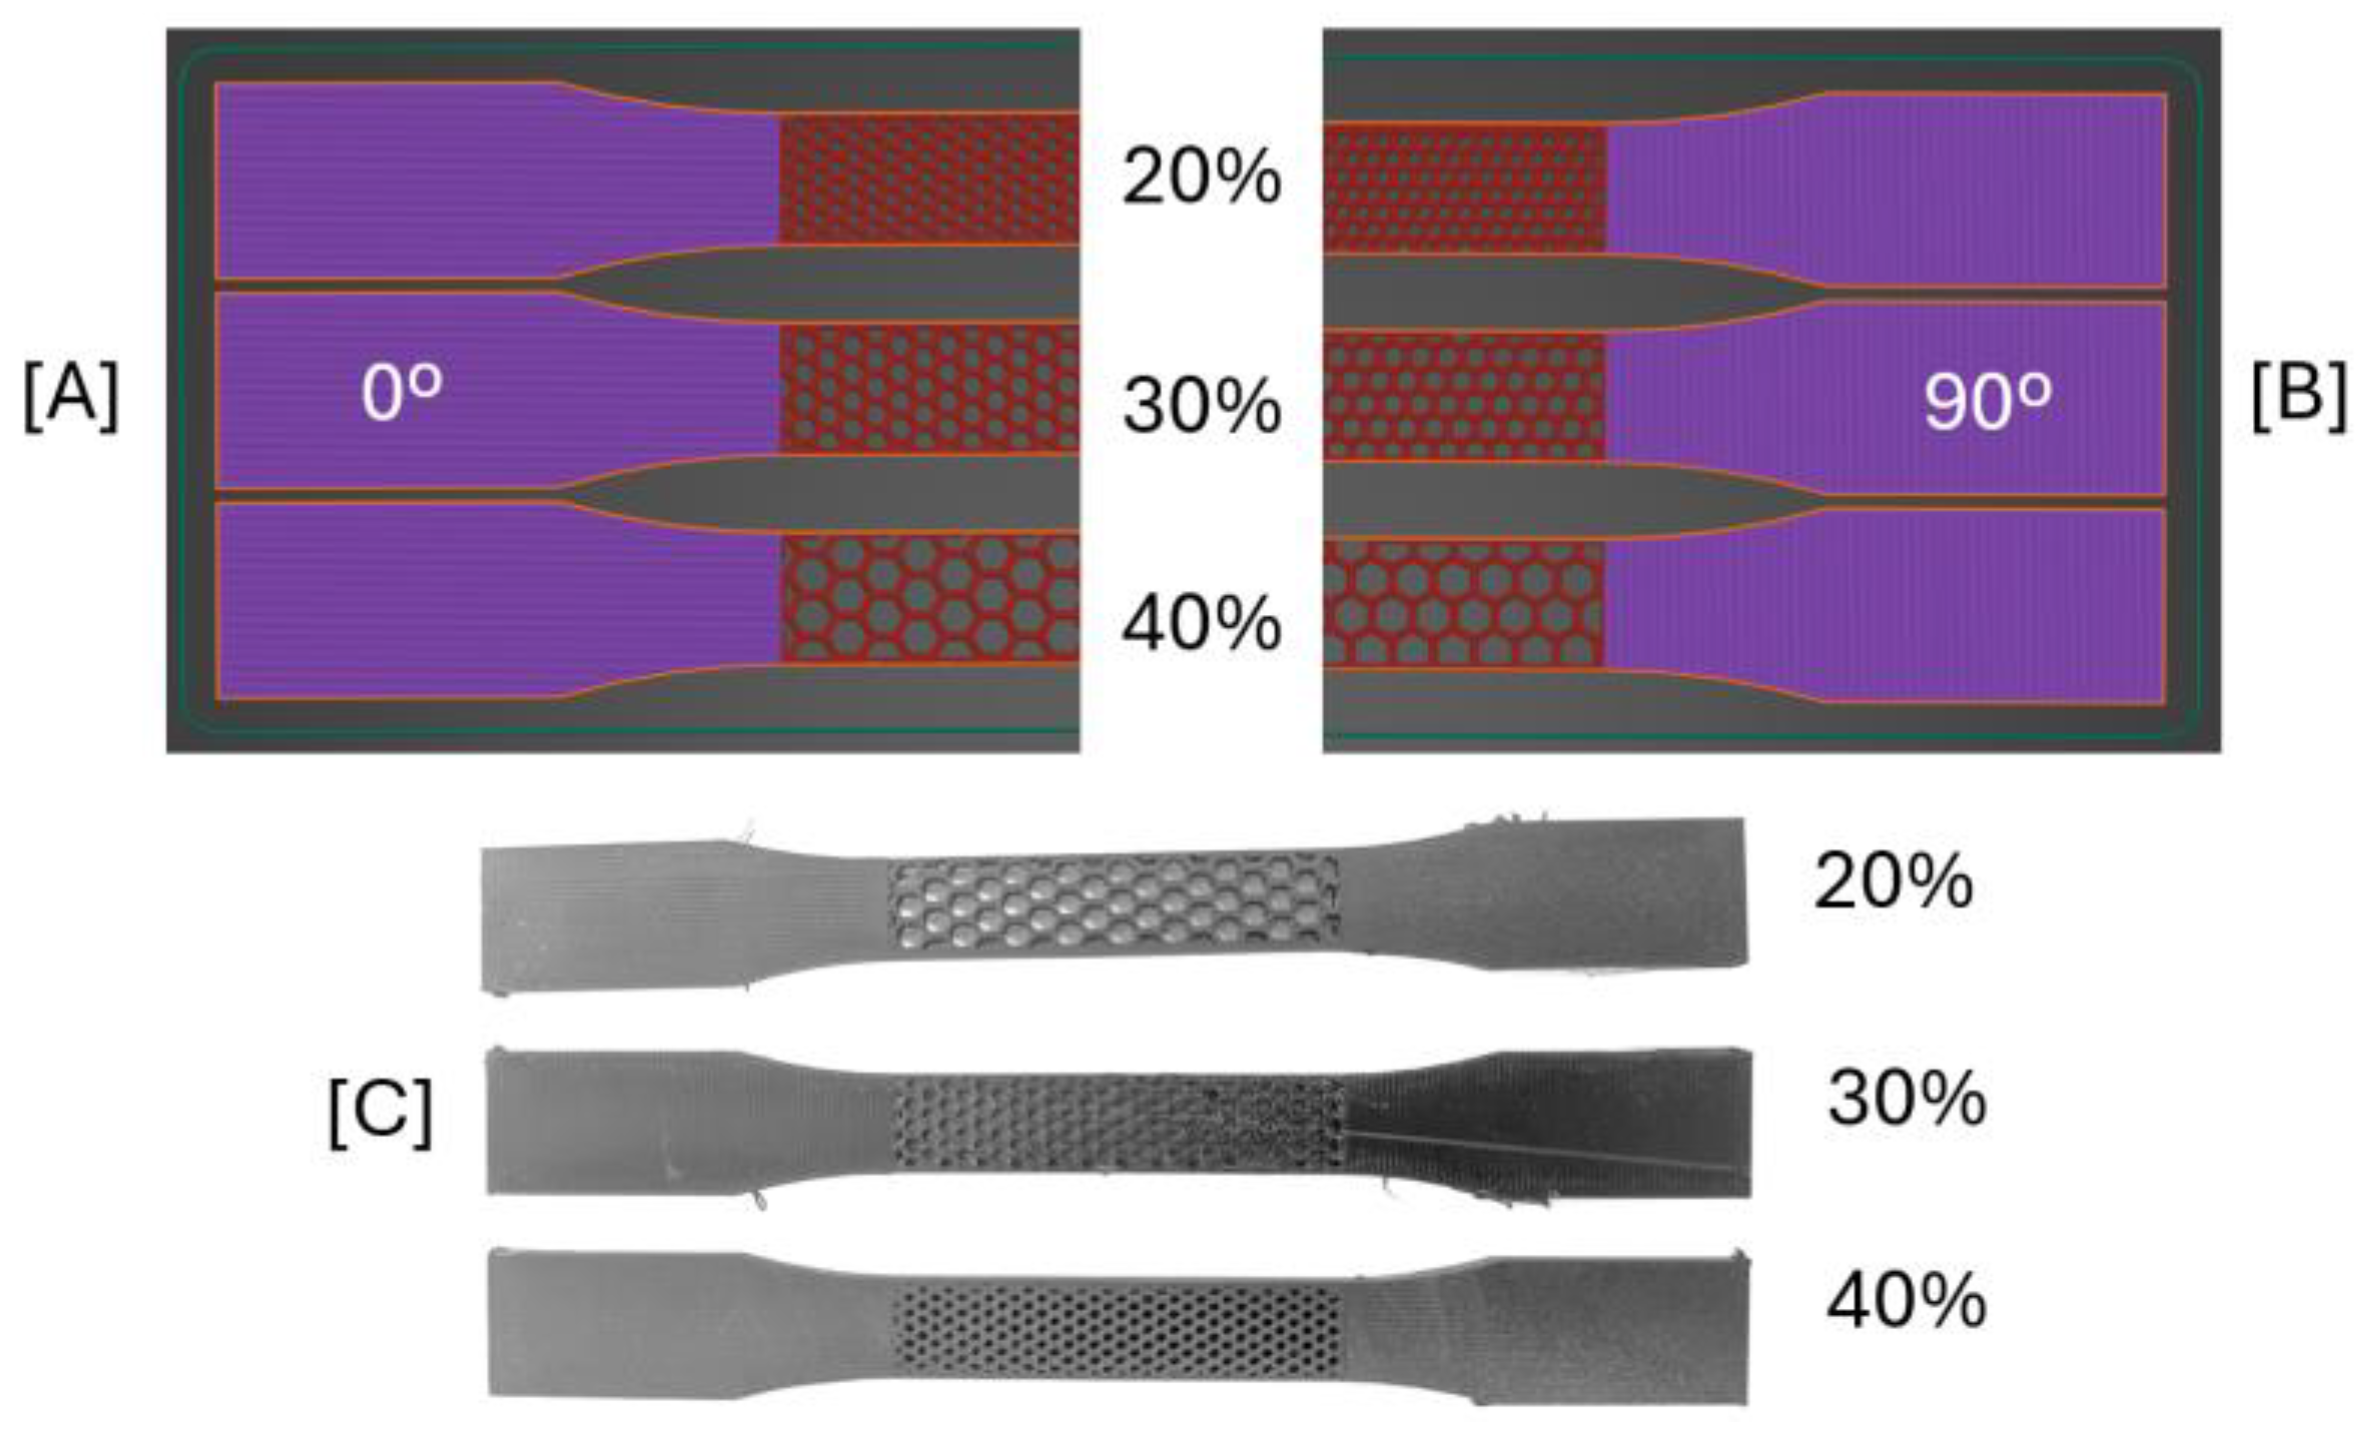
Figure 3.
[A] Composite flexural specimen geometry (mm); and [B] measured average thickness for different specimen configurations.
Figure 3.
[A] Composite flexural specimen geometry (mm); and [B] measured average thickness for different specimen configurations.
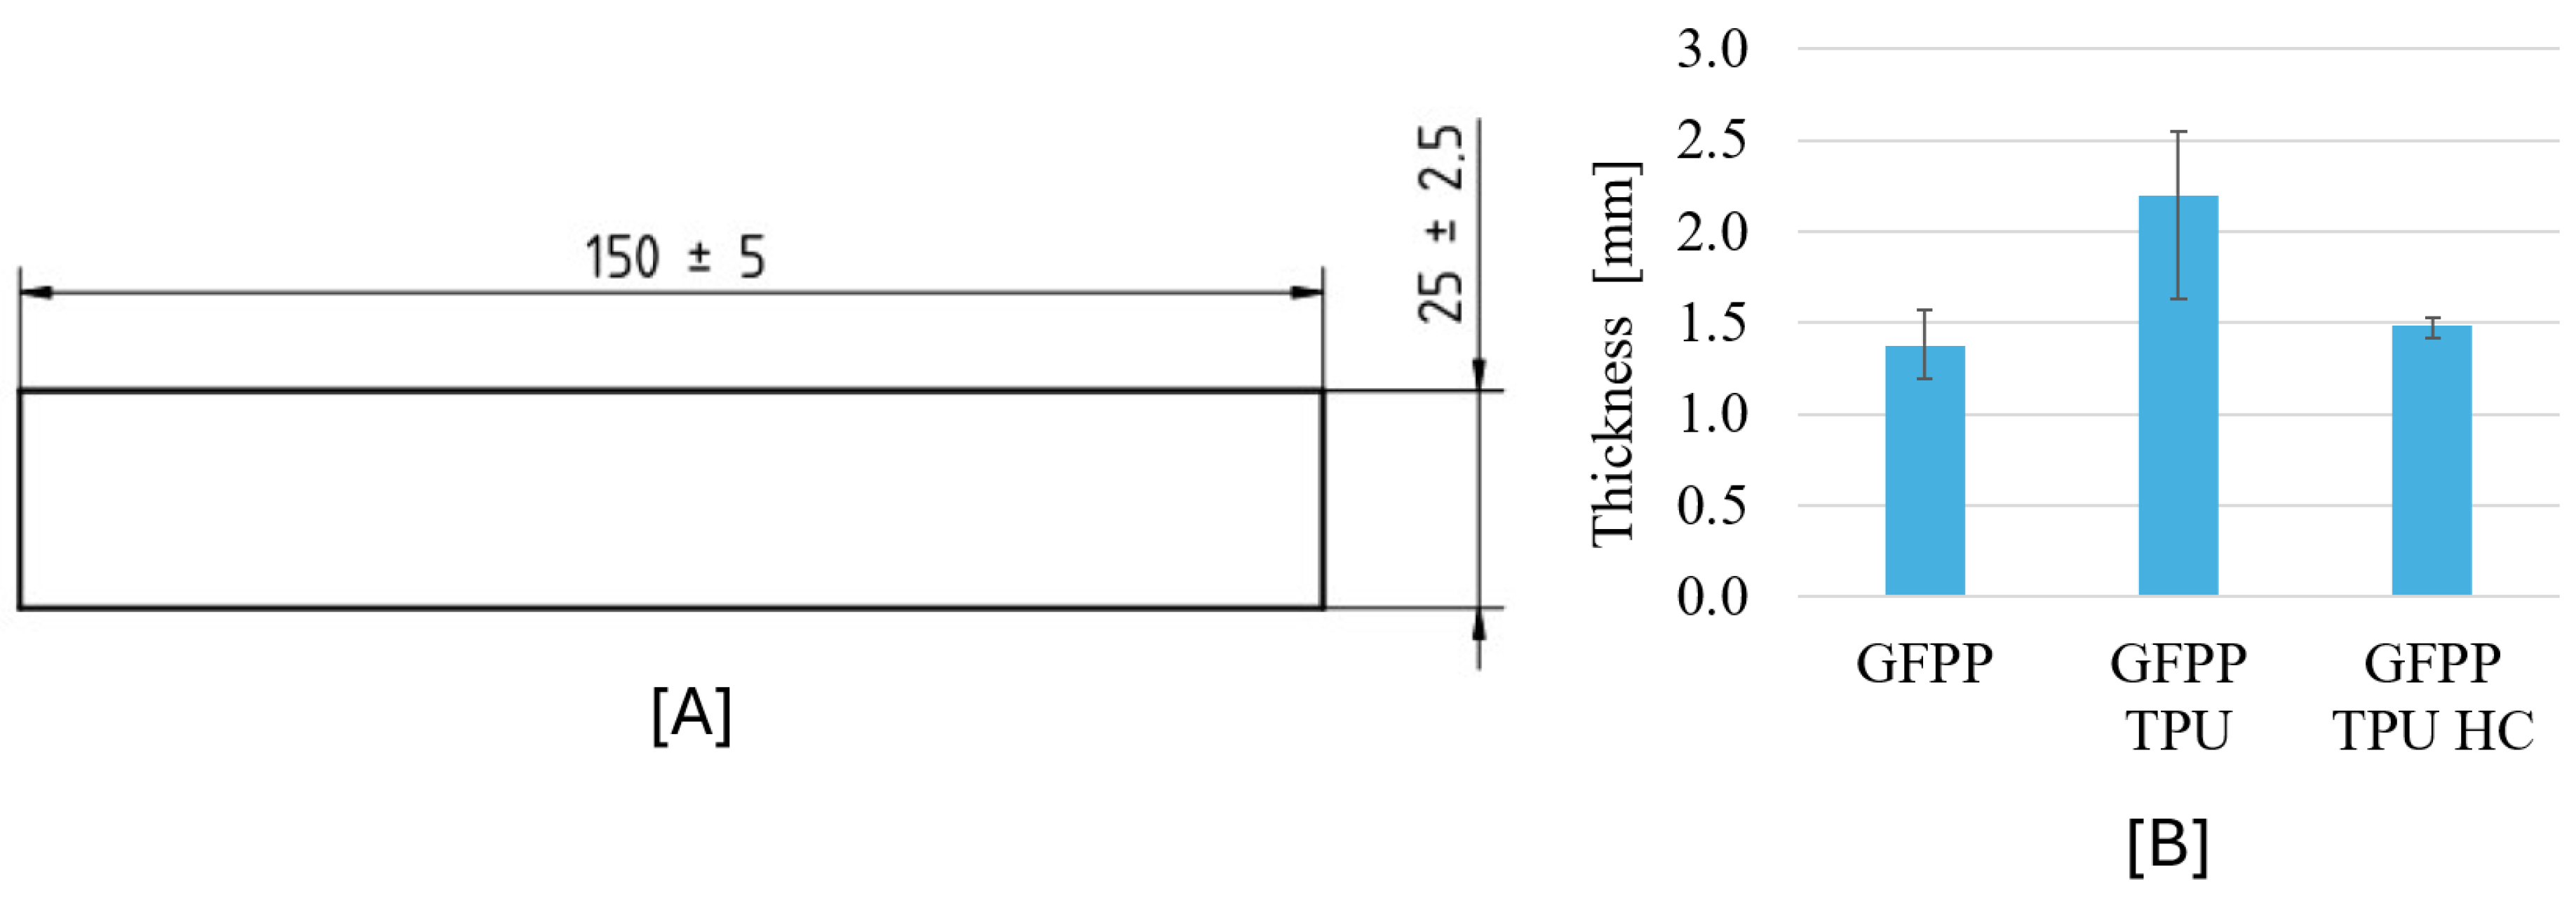
Figure 4.
DSC curve of TPU filament and TPU samples extruded at different temperatures.
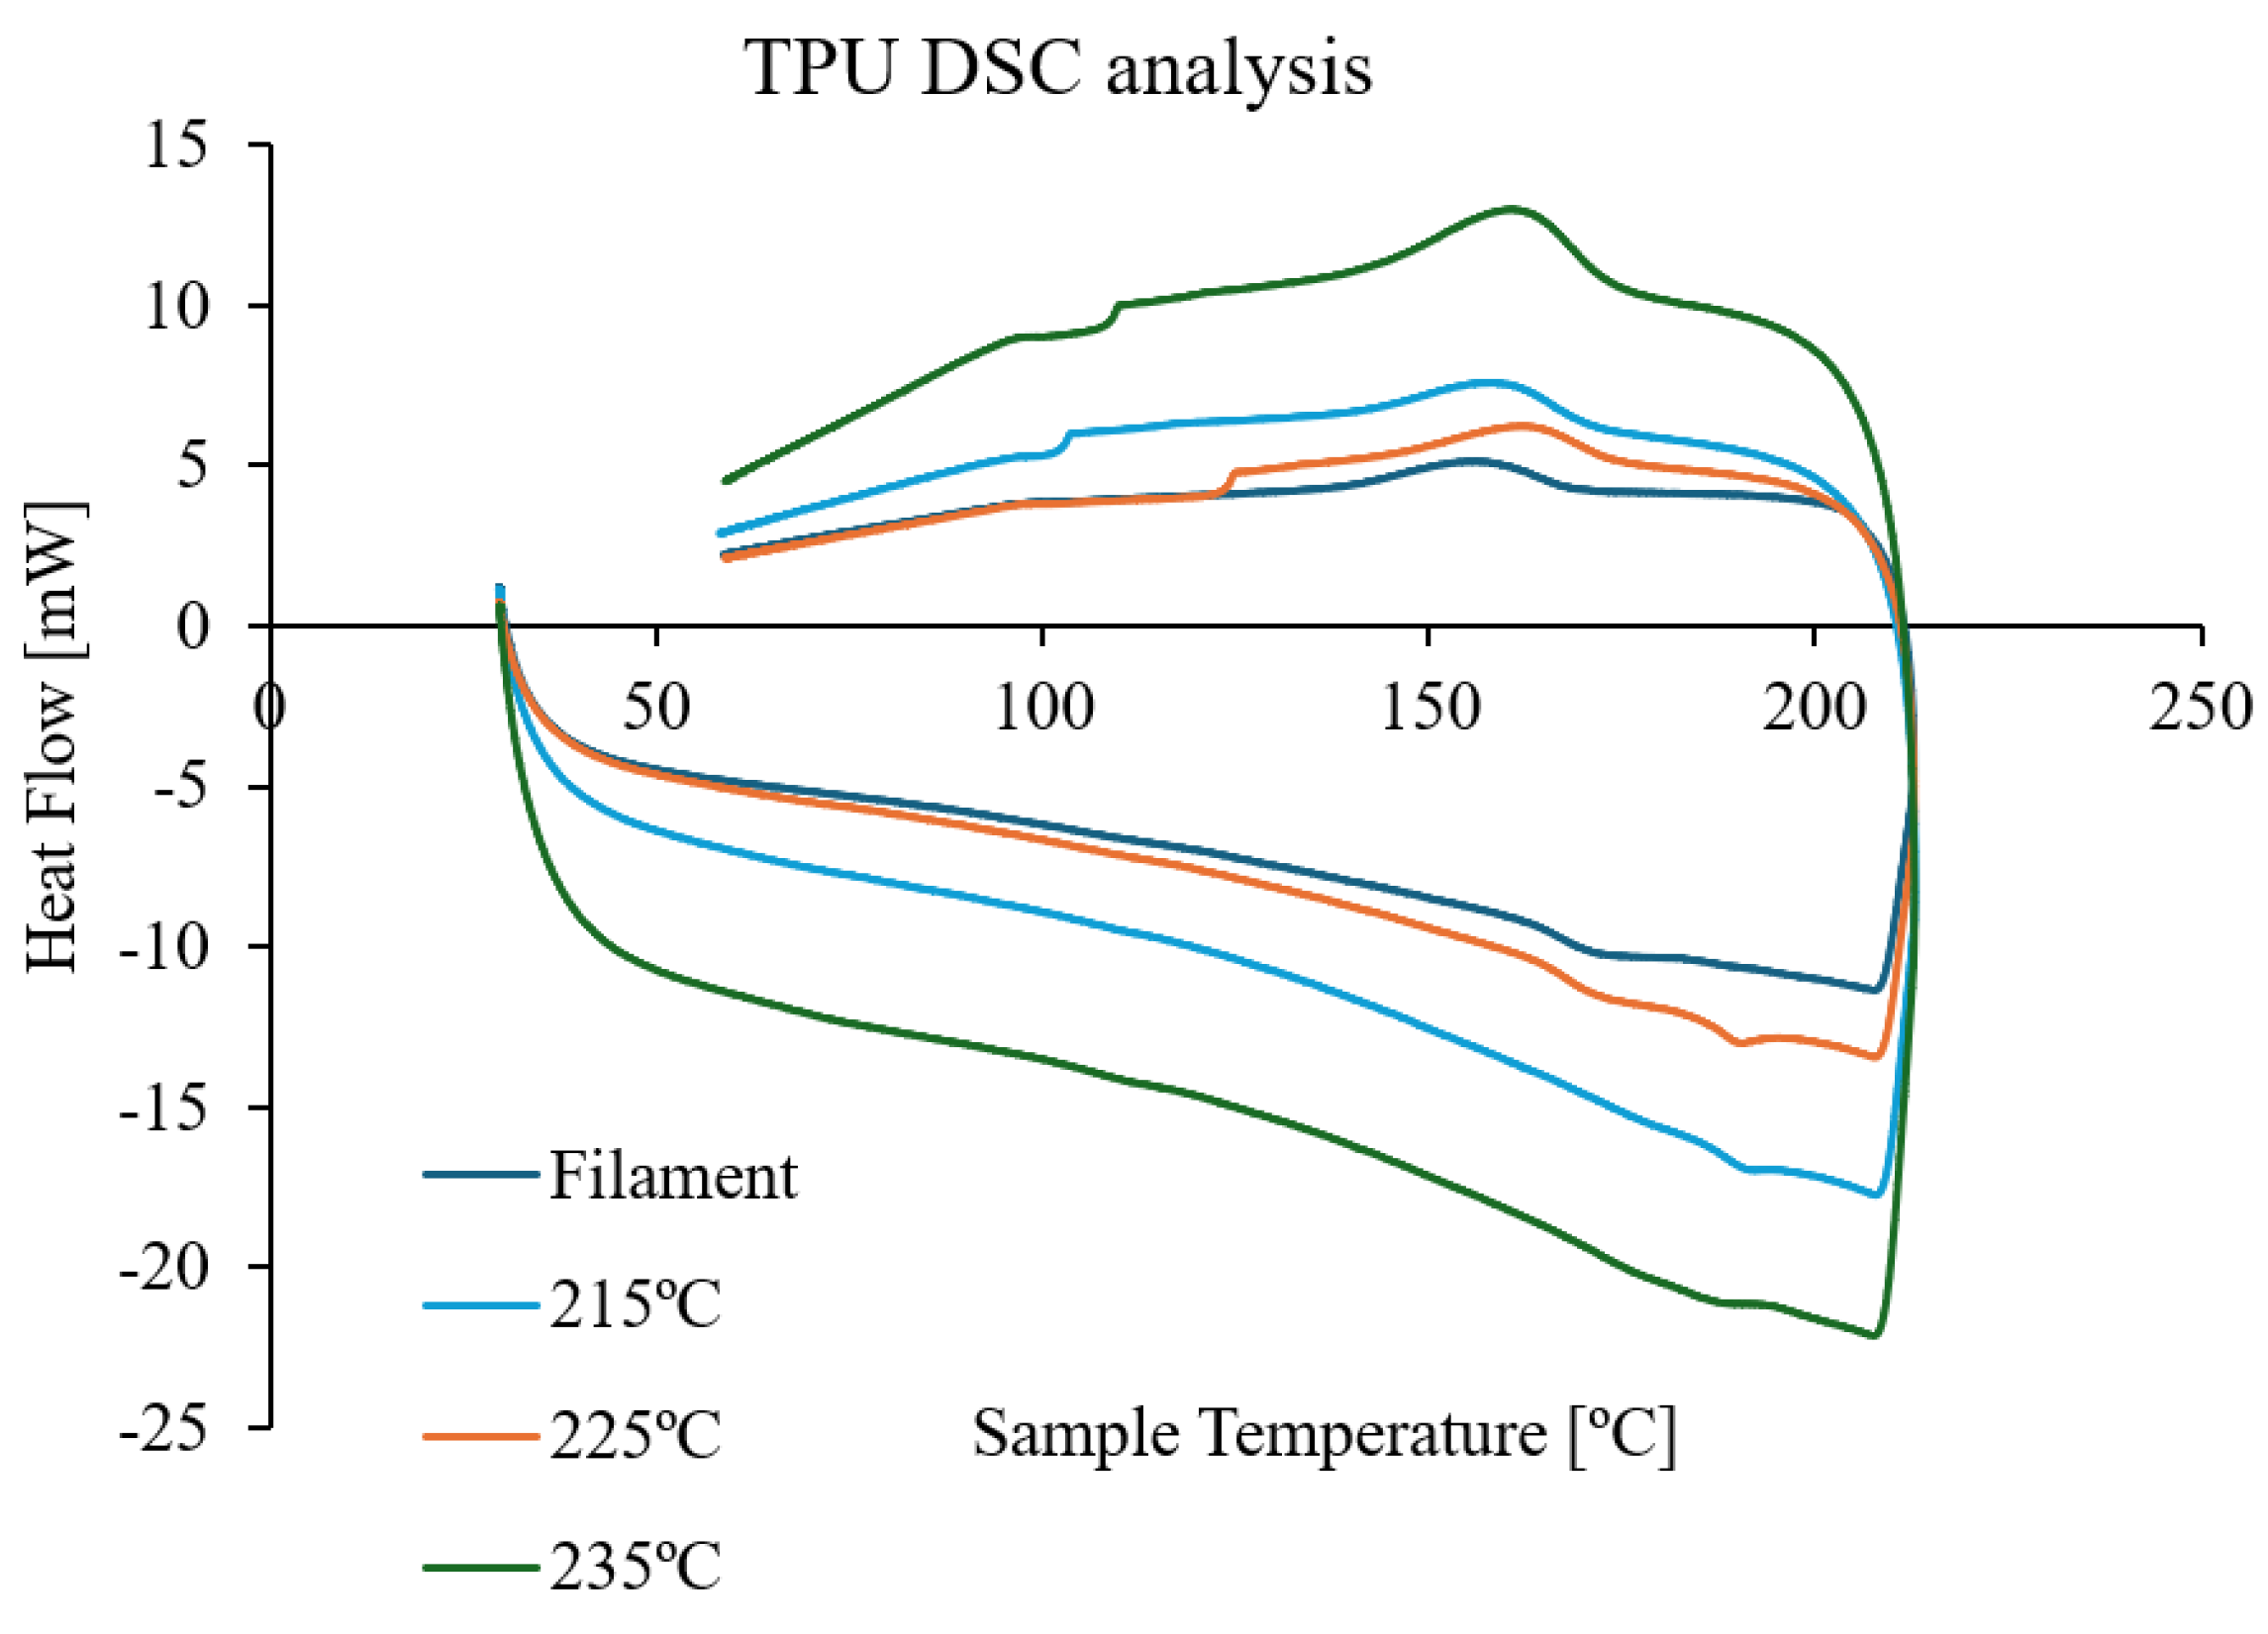
Figure 5.
DTA curve of three types of composite samples produced.
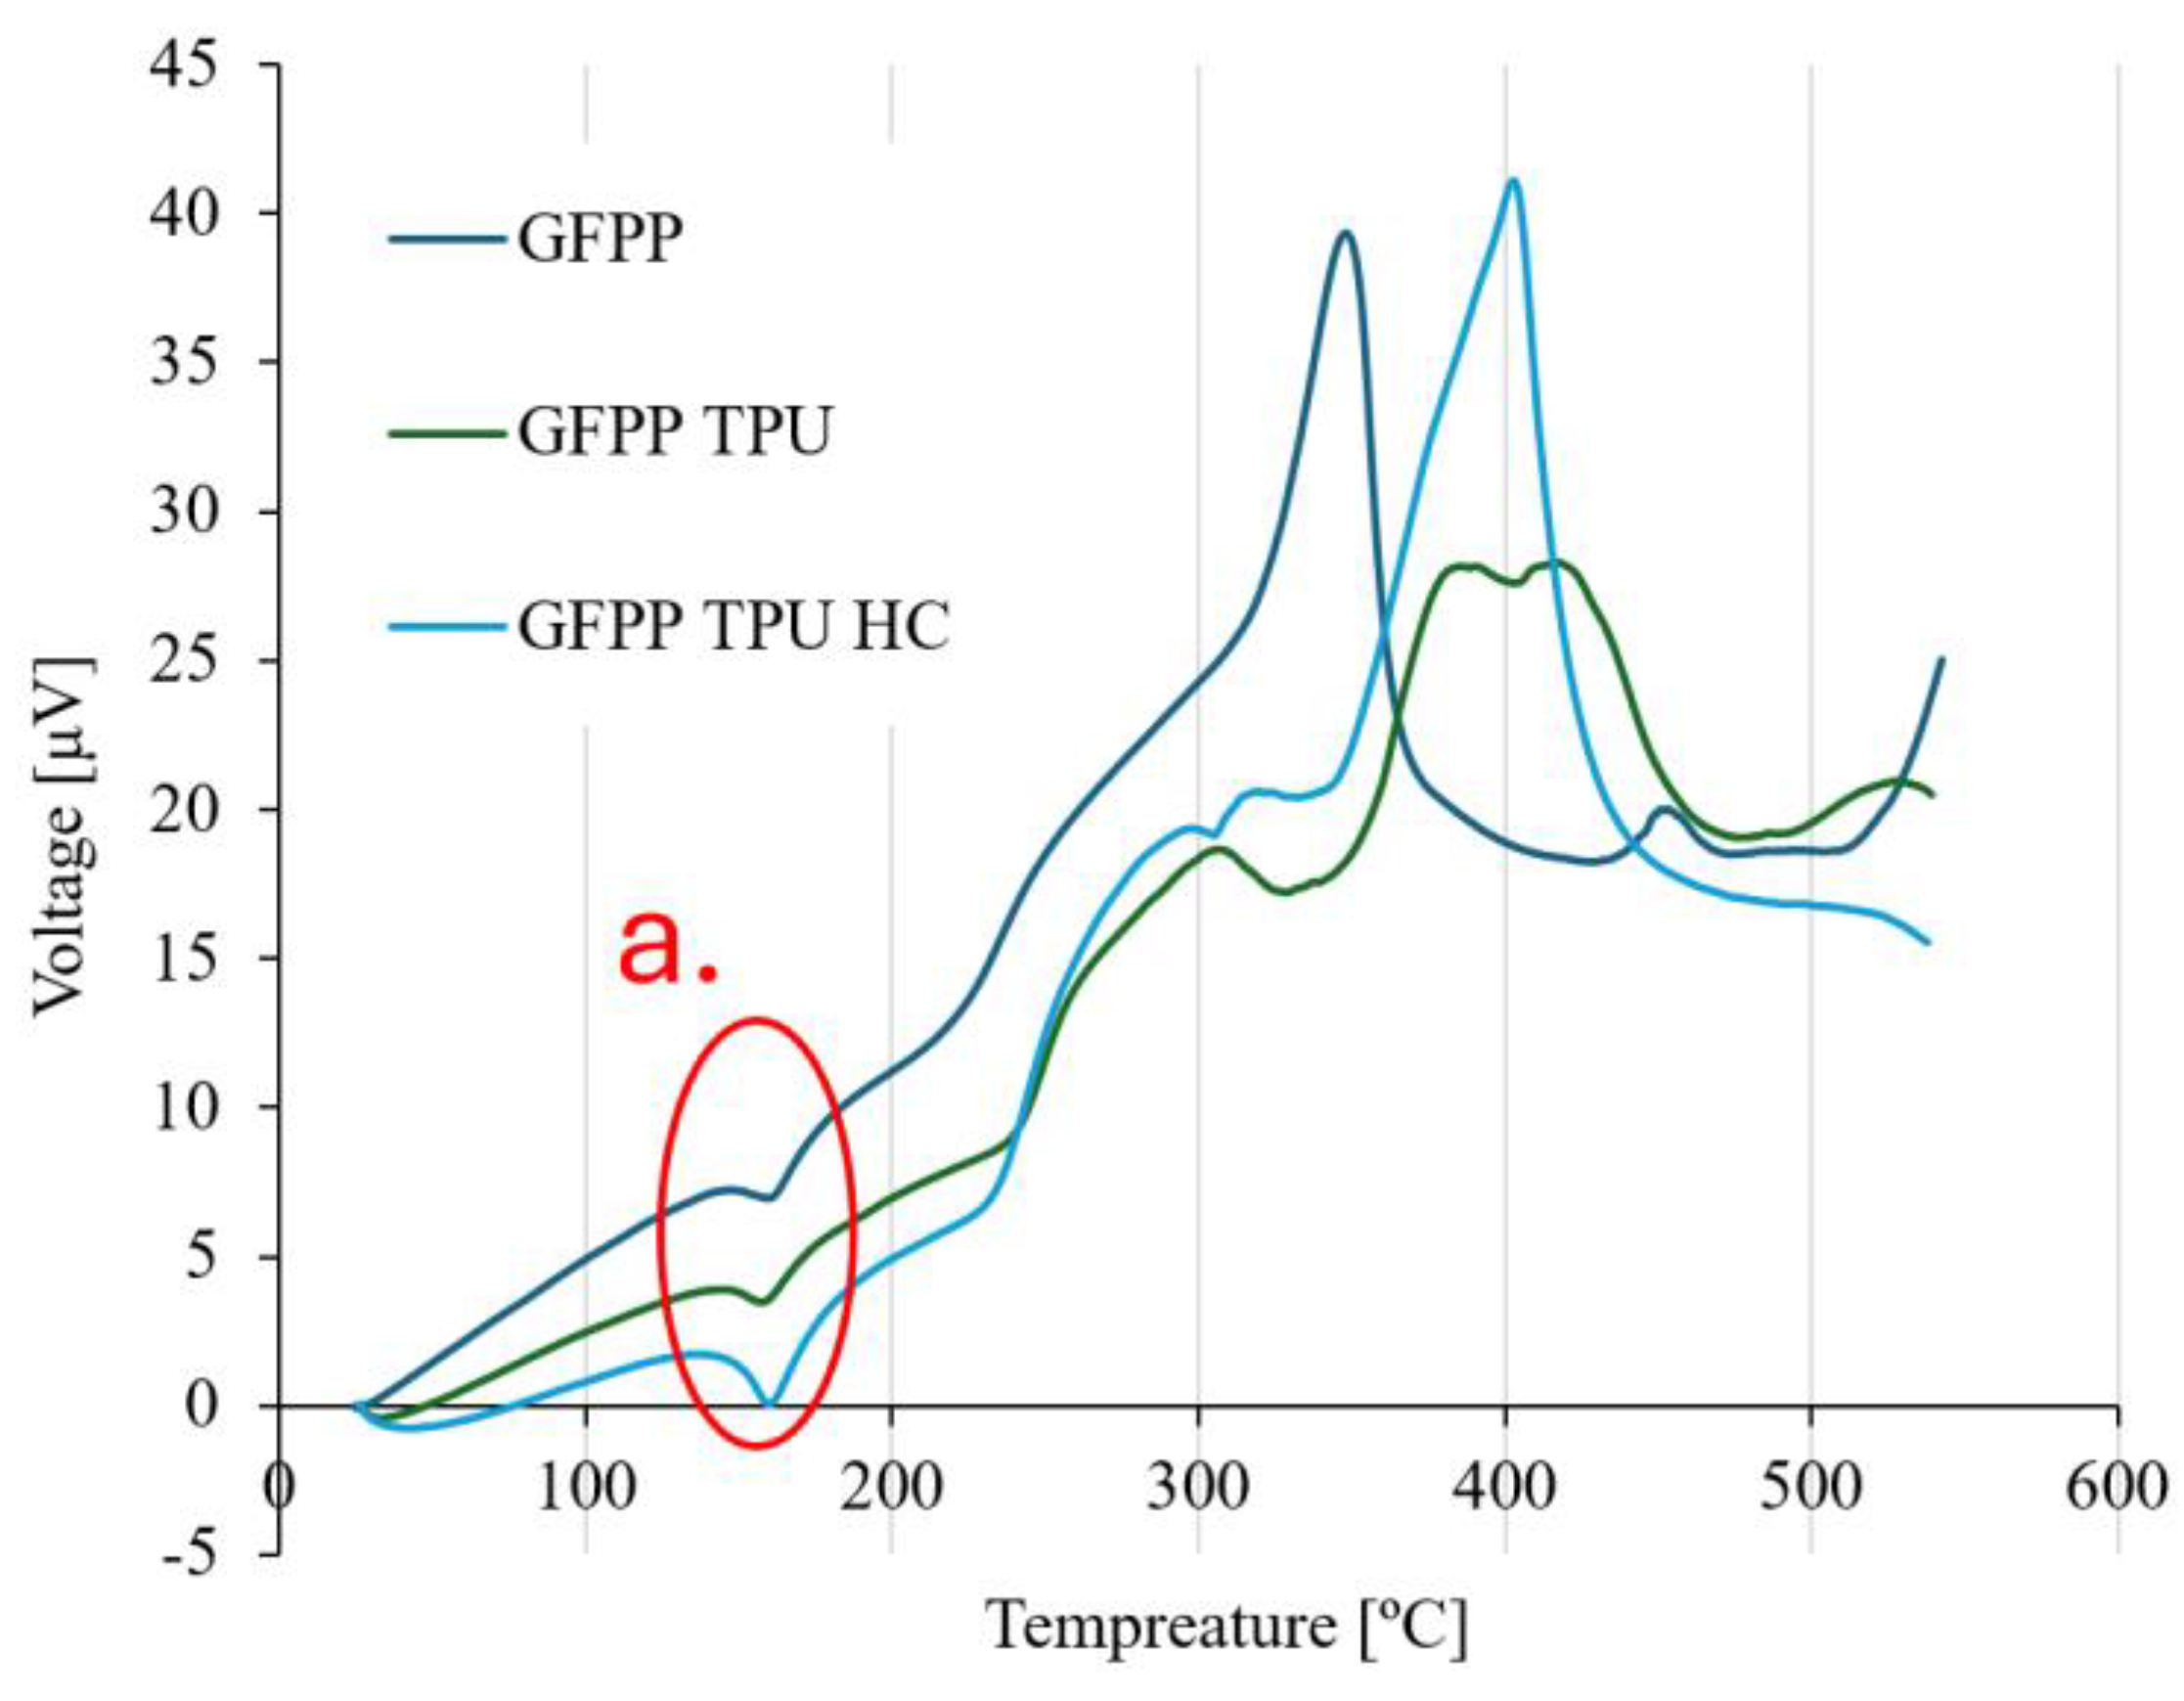
Figure 6.
Microscopic thickness surface analysis: (a) GFPP laminate showing defects; (b) GFPP-TPU laminate with poor TPU–PP adhesion leading to delamination; (c) GFPP-TPU with concentrated TPU layer; (d) GFPP-TPU-HC with good TPU integration into the glass fibre structure; (e) GFPP-TPU-HC showing uniform TPU dispersion and strong interfacial adhesion.
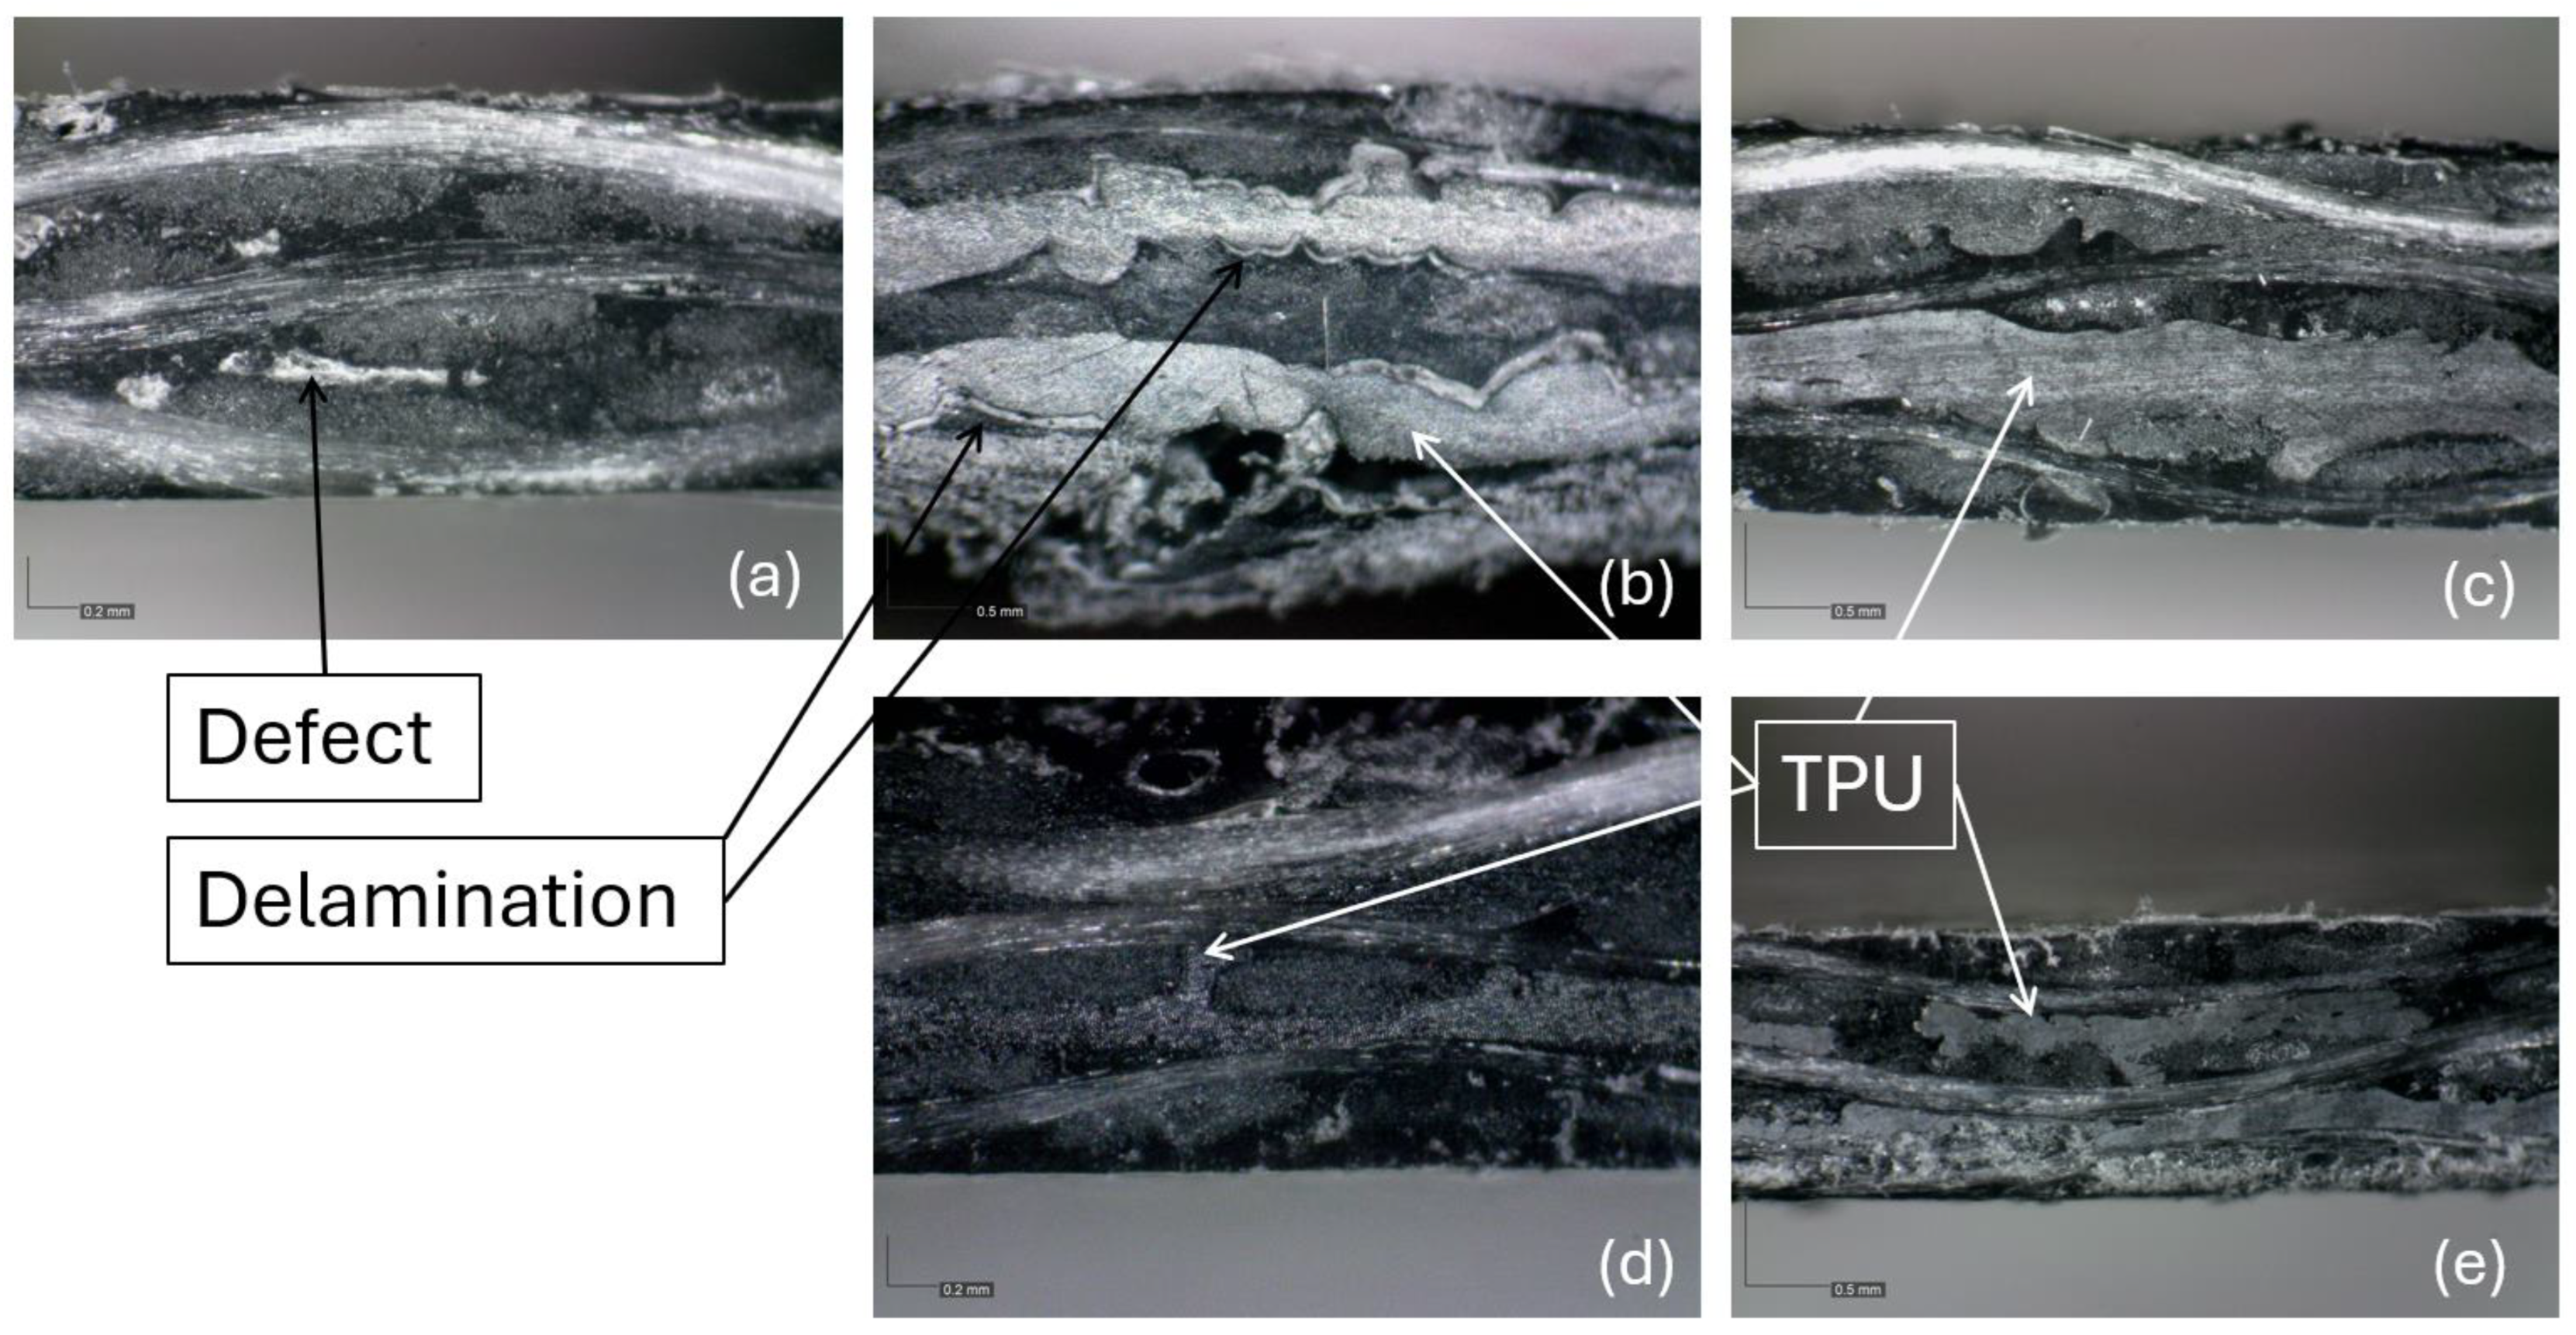
Figure 7.
TPU bulk tensile test results for: Initial Young Modulus (Ei 1% to 5%); Tensile Strength and Elongation at Break.
Figure 7.
TPU bulk tensile test results for: Initial Young Modulus (Ei 1% to 5%); Tensile Strength and Elongation at Break.
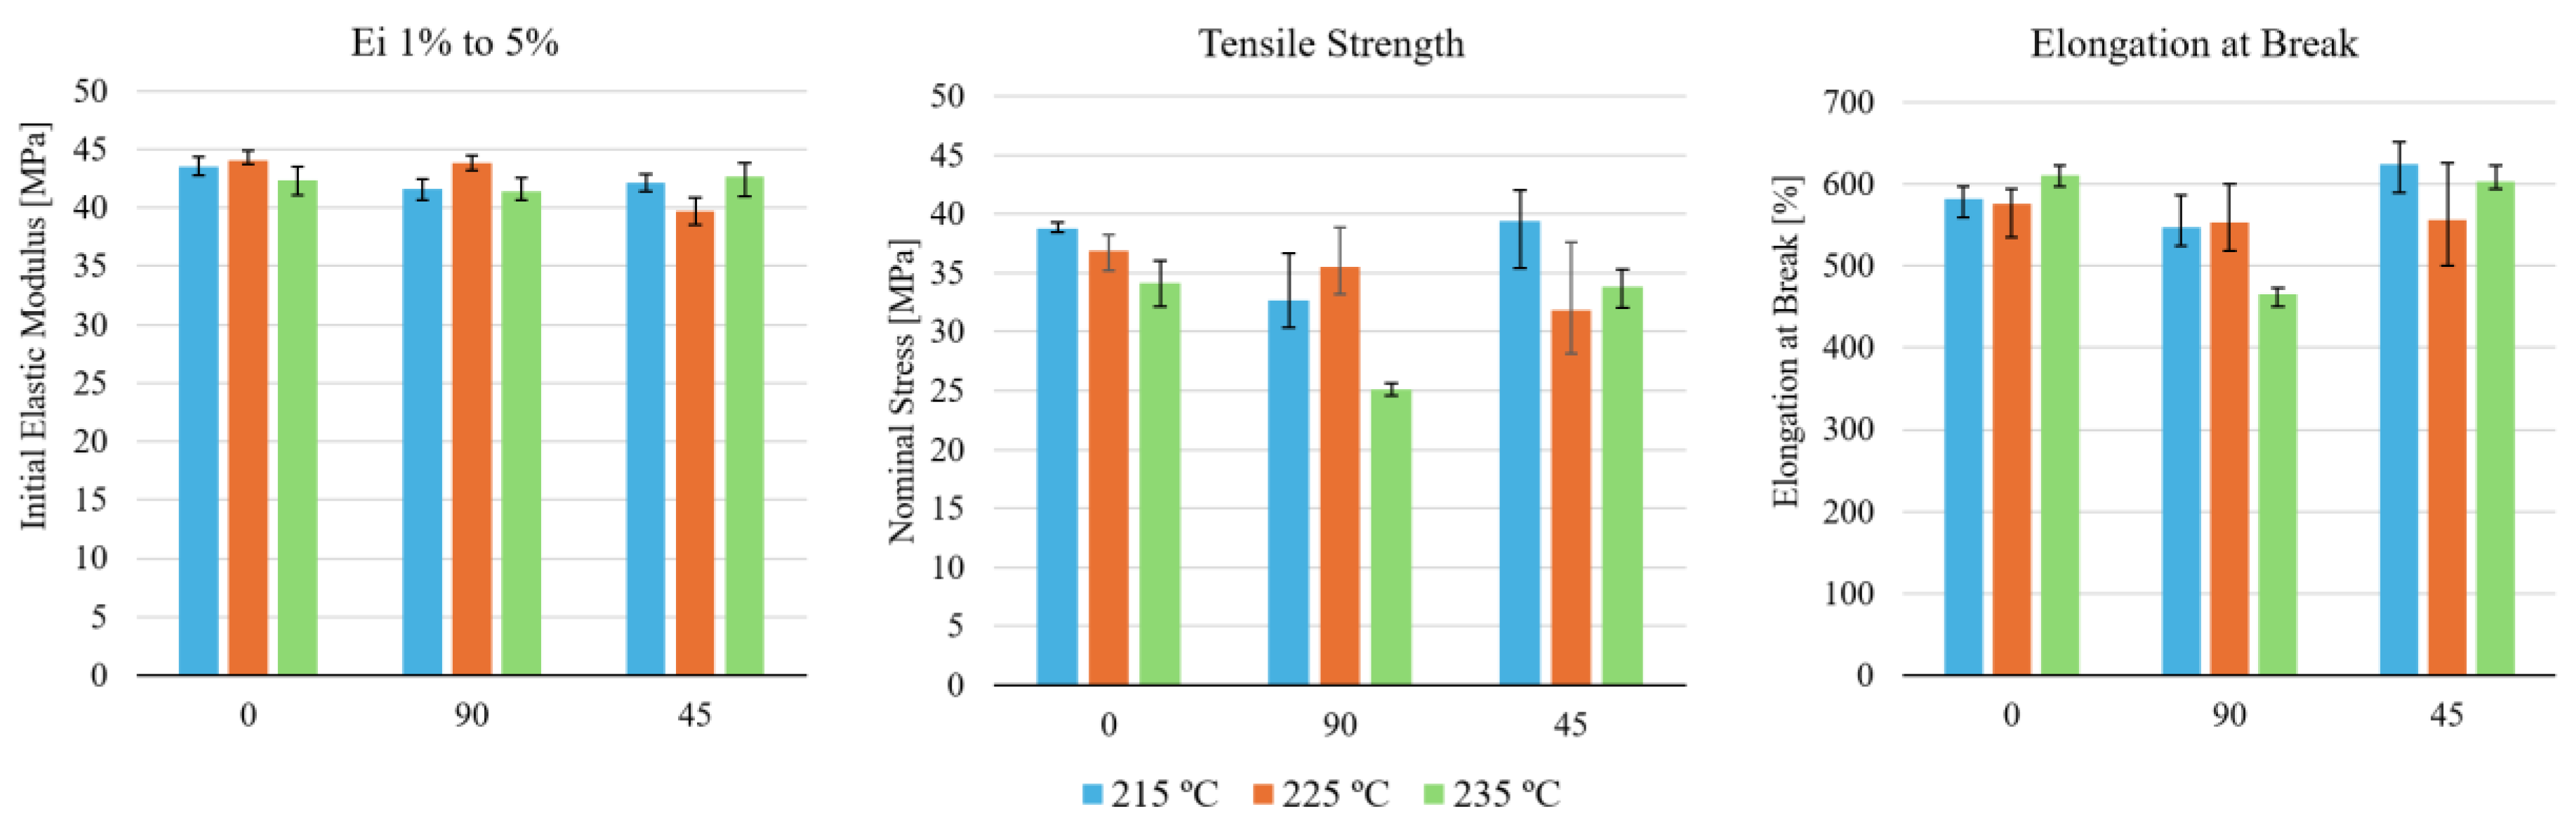
Figure 8.
TPU honeycomb tensile test results for: Initial Young Modulus (Ei 1% to 5%); Tensile Strength and Elongation at Break.
Figure 8.
TPU honeycomb tensile test results for: Initial Young Modulus (Ei 1% to 5%); Tensile Strength and Elongation at Break.
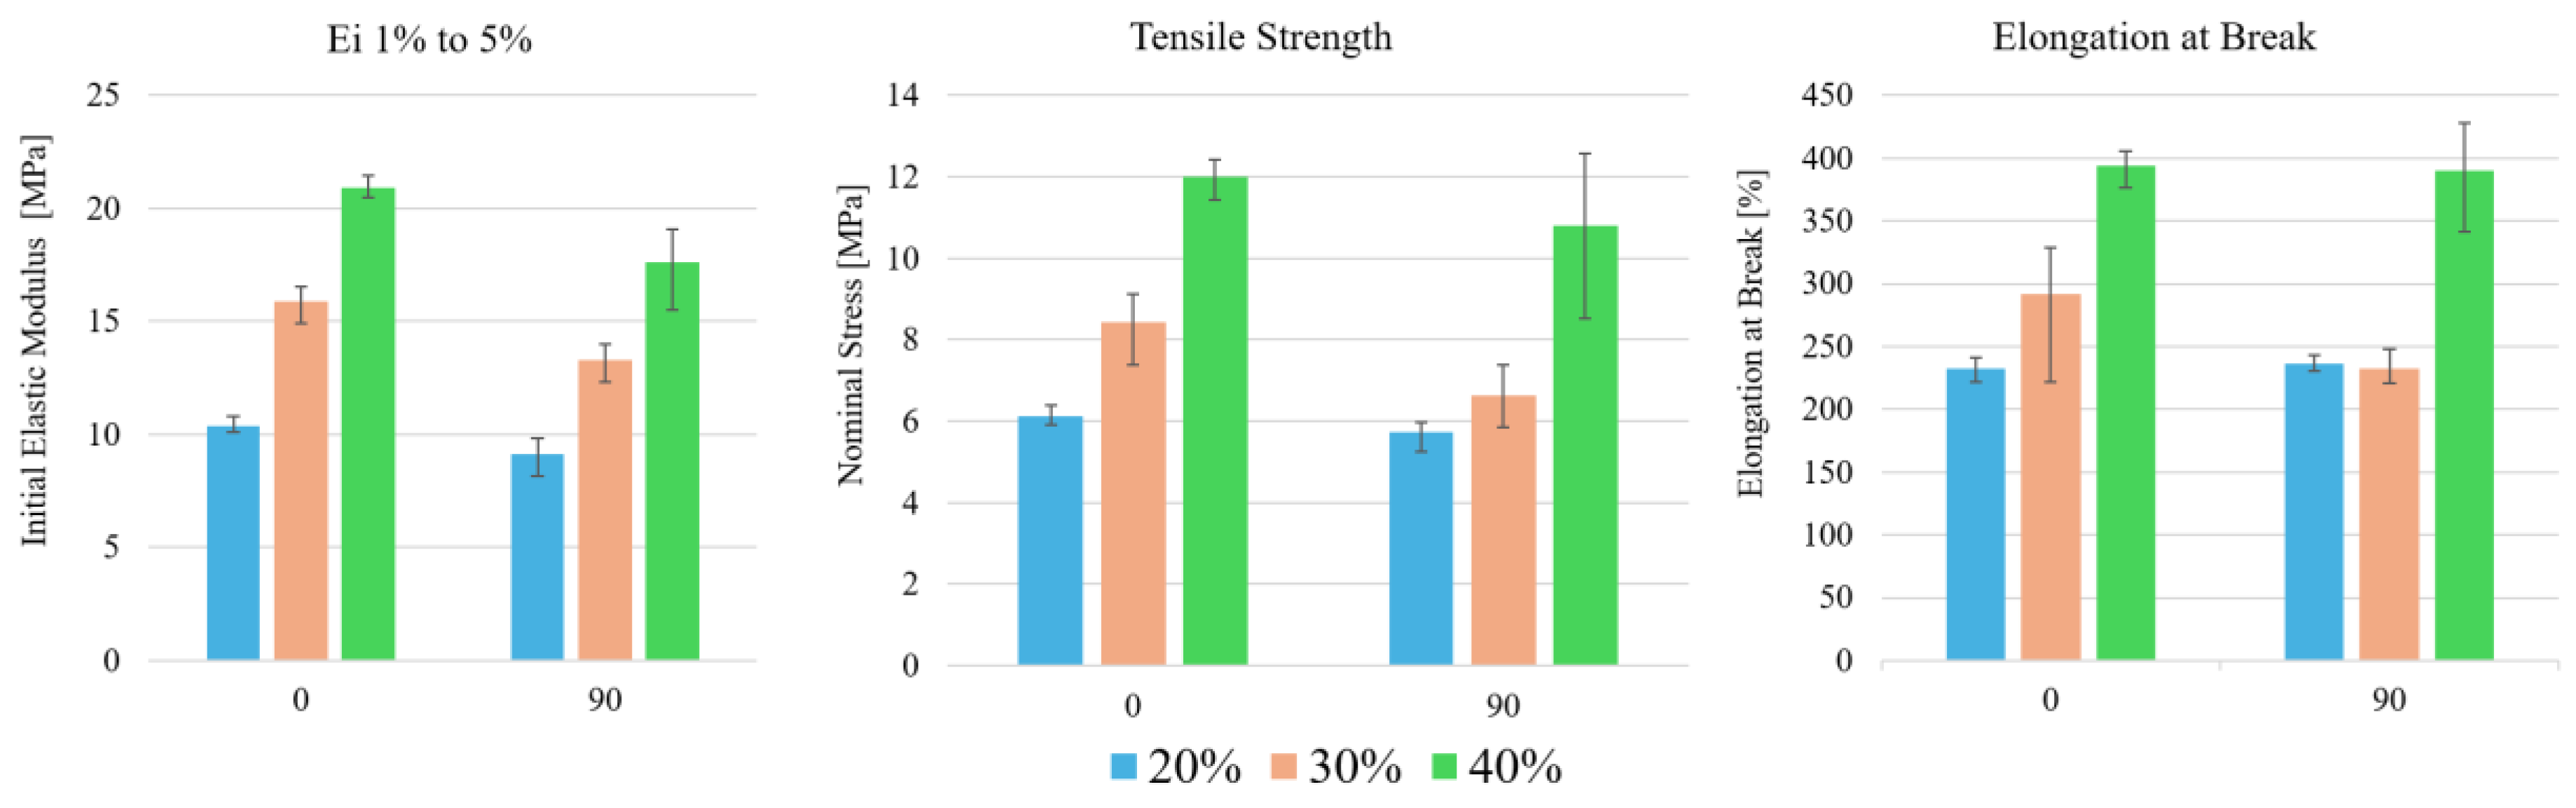
Figure 9.
Tensile fracture of honeycomb TPU specimens.
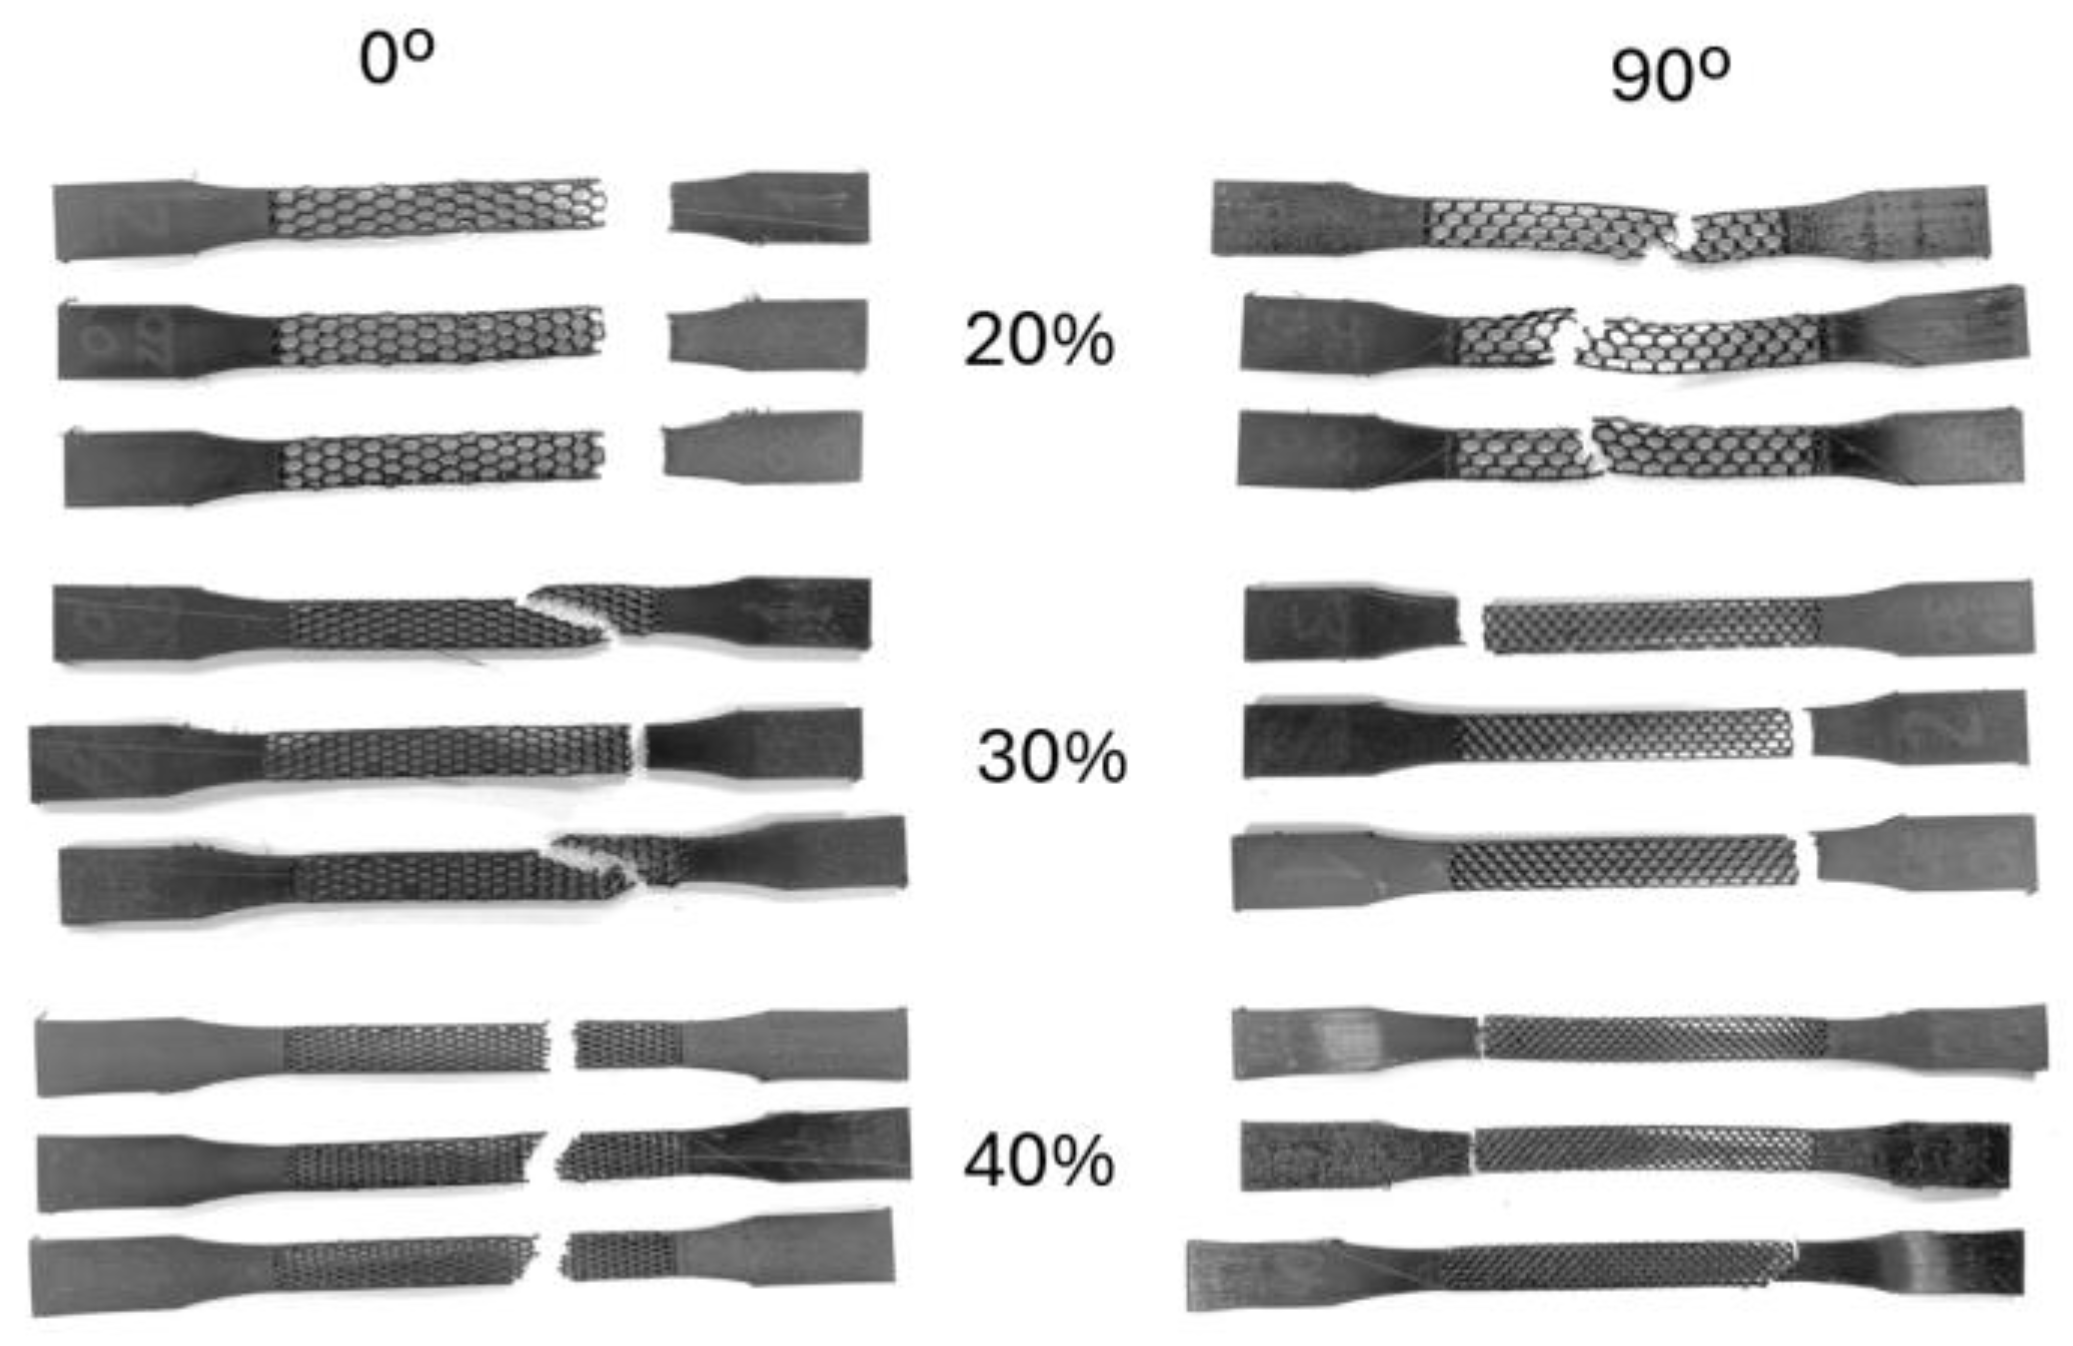
Figure 10.
cellular-bulk region for all types of honeycomb TPU specimens at a high deformation instant.
Figure 10.
cellular-bulk region for all types of honeycomb TPU specimens at a high deformation instant.

Figure 11.
Nominal Stress-Strain diagram for both bulk and honeycomb TPU tensile test results.
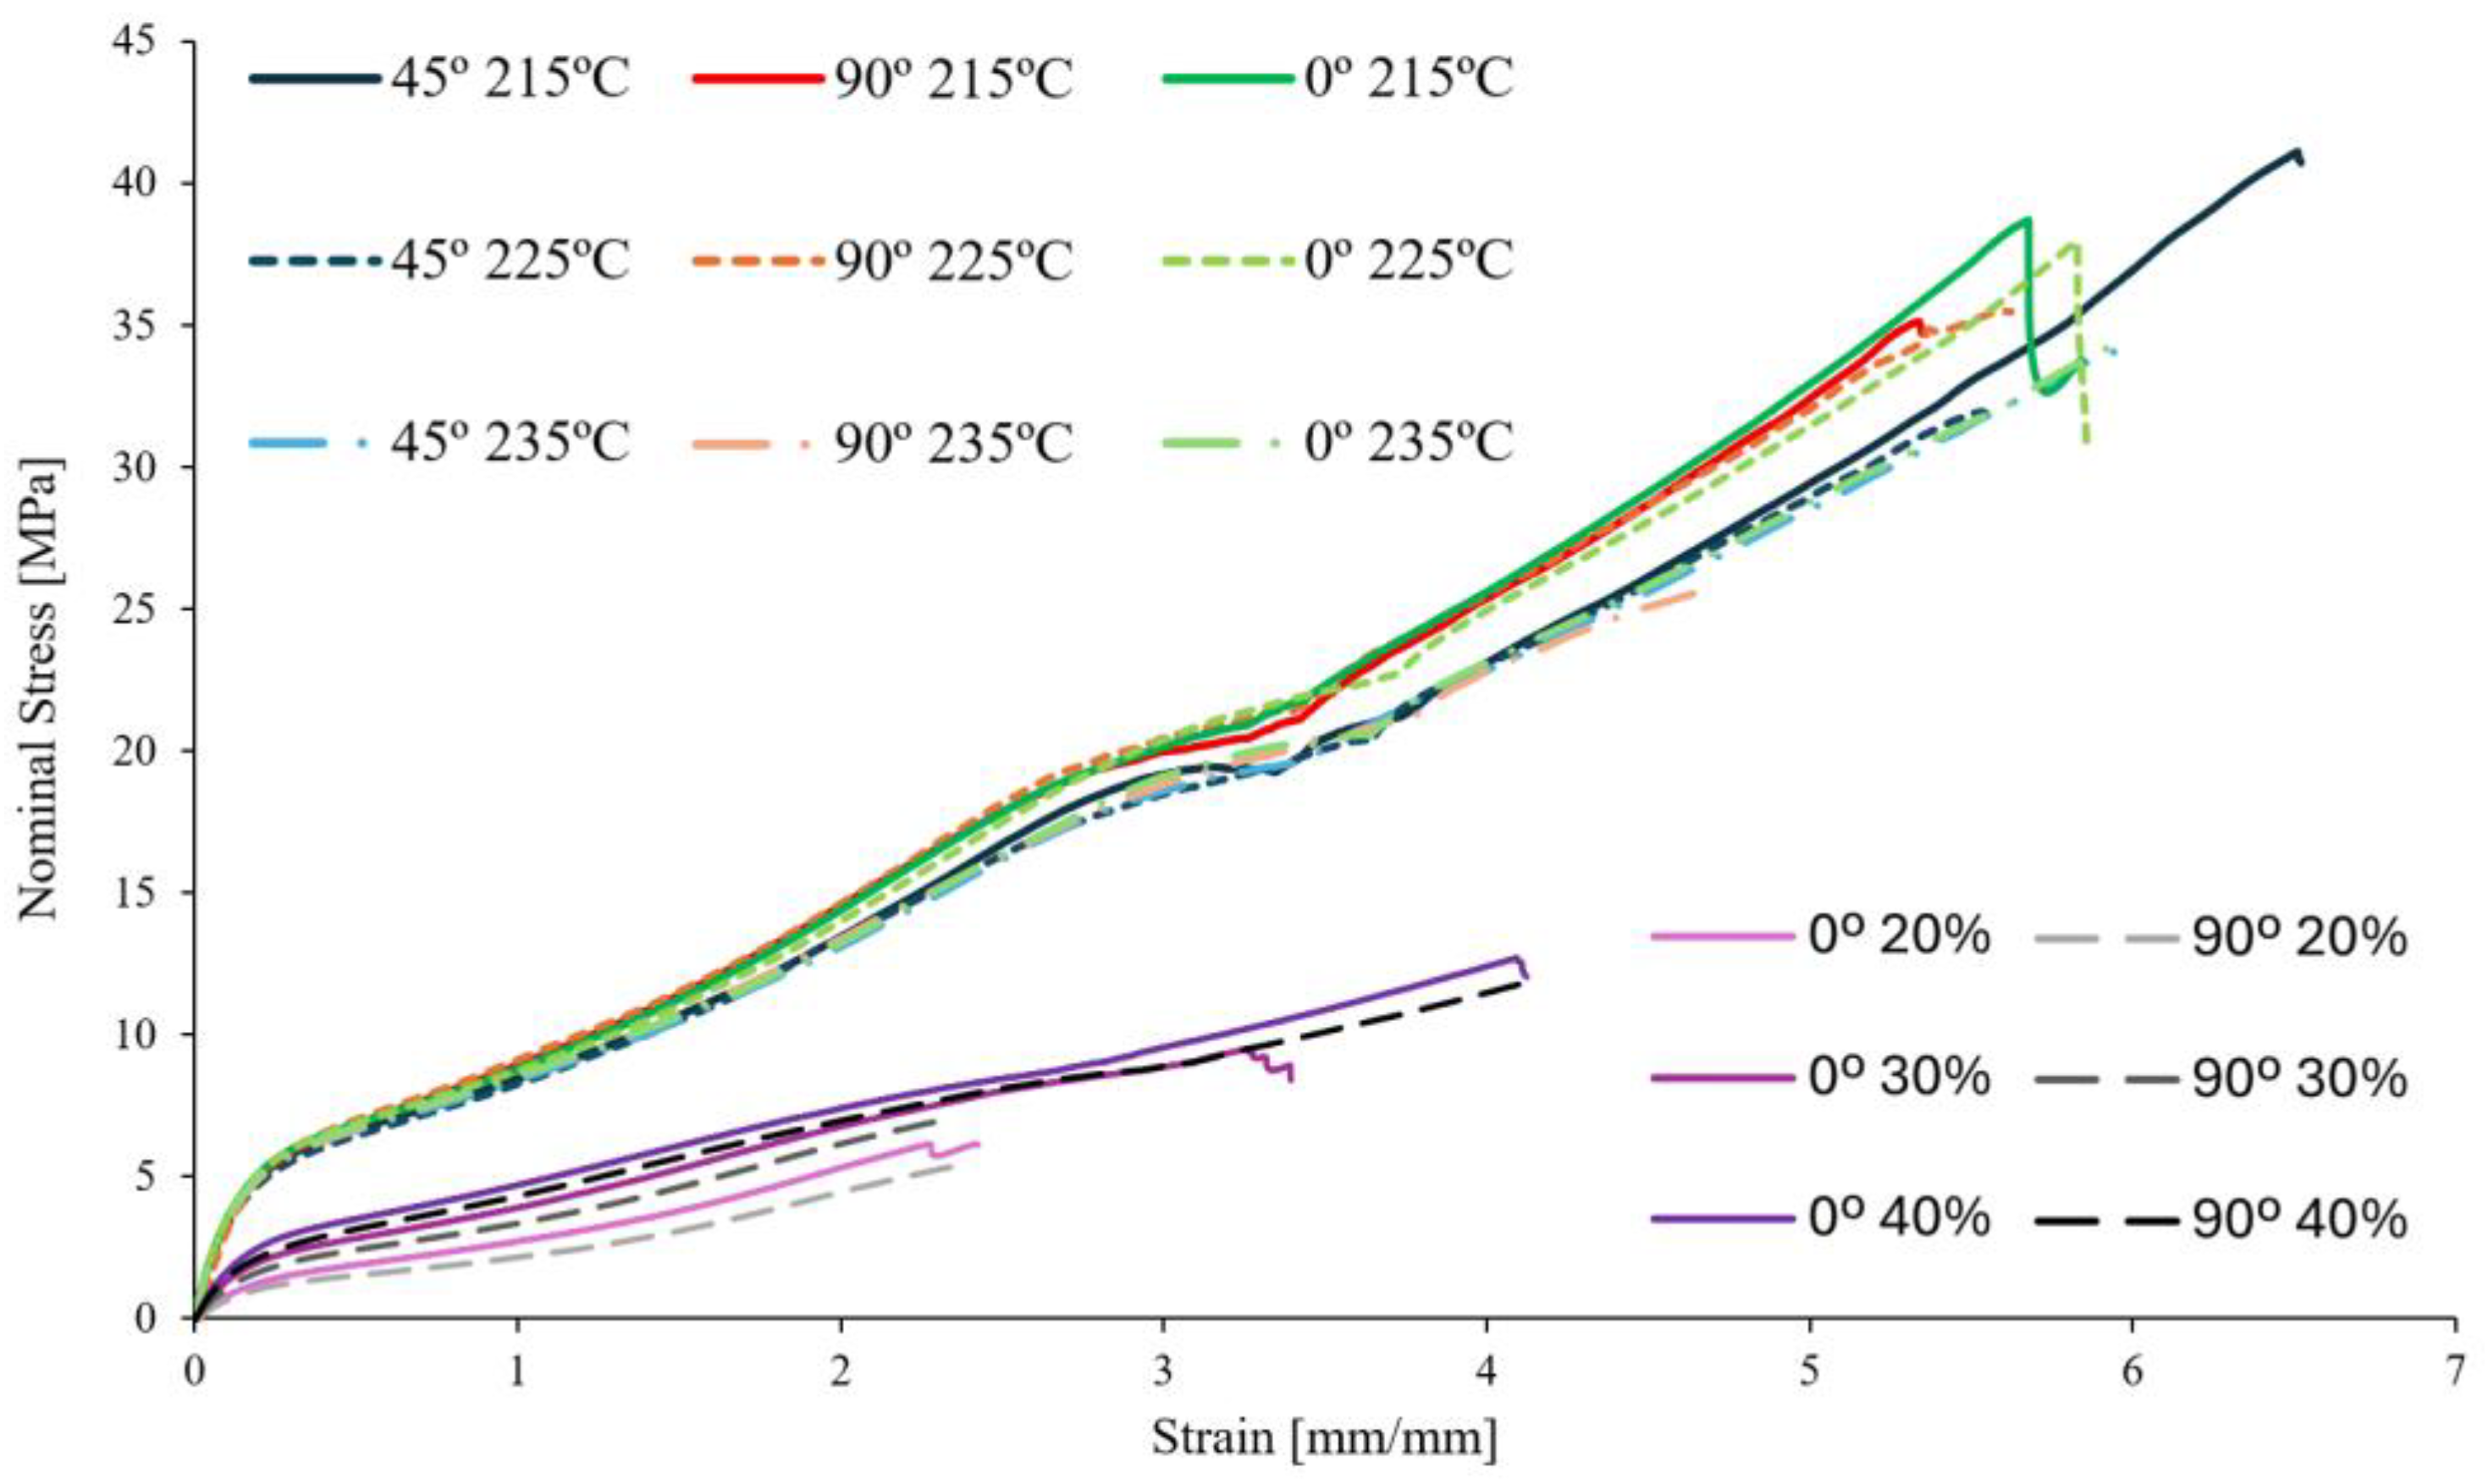
Figure 12.
Initial Young Modulus (Ei 1% to 5%); Tensile Strength and Elongation at Break relative to the relative density percentage.
Figure 12.
Initial Young Modulus (Ei 1% to 5%); Tensile Strength and Elongation at Break relative to the relative density percentage.
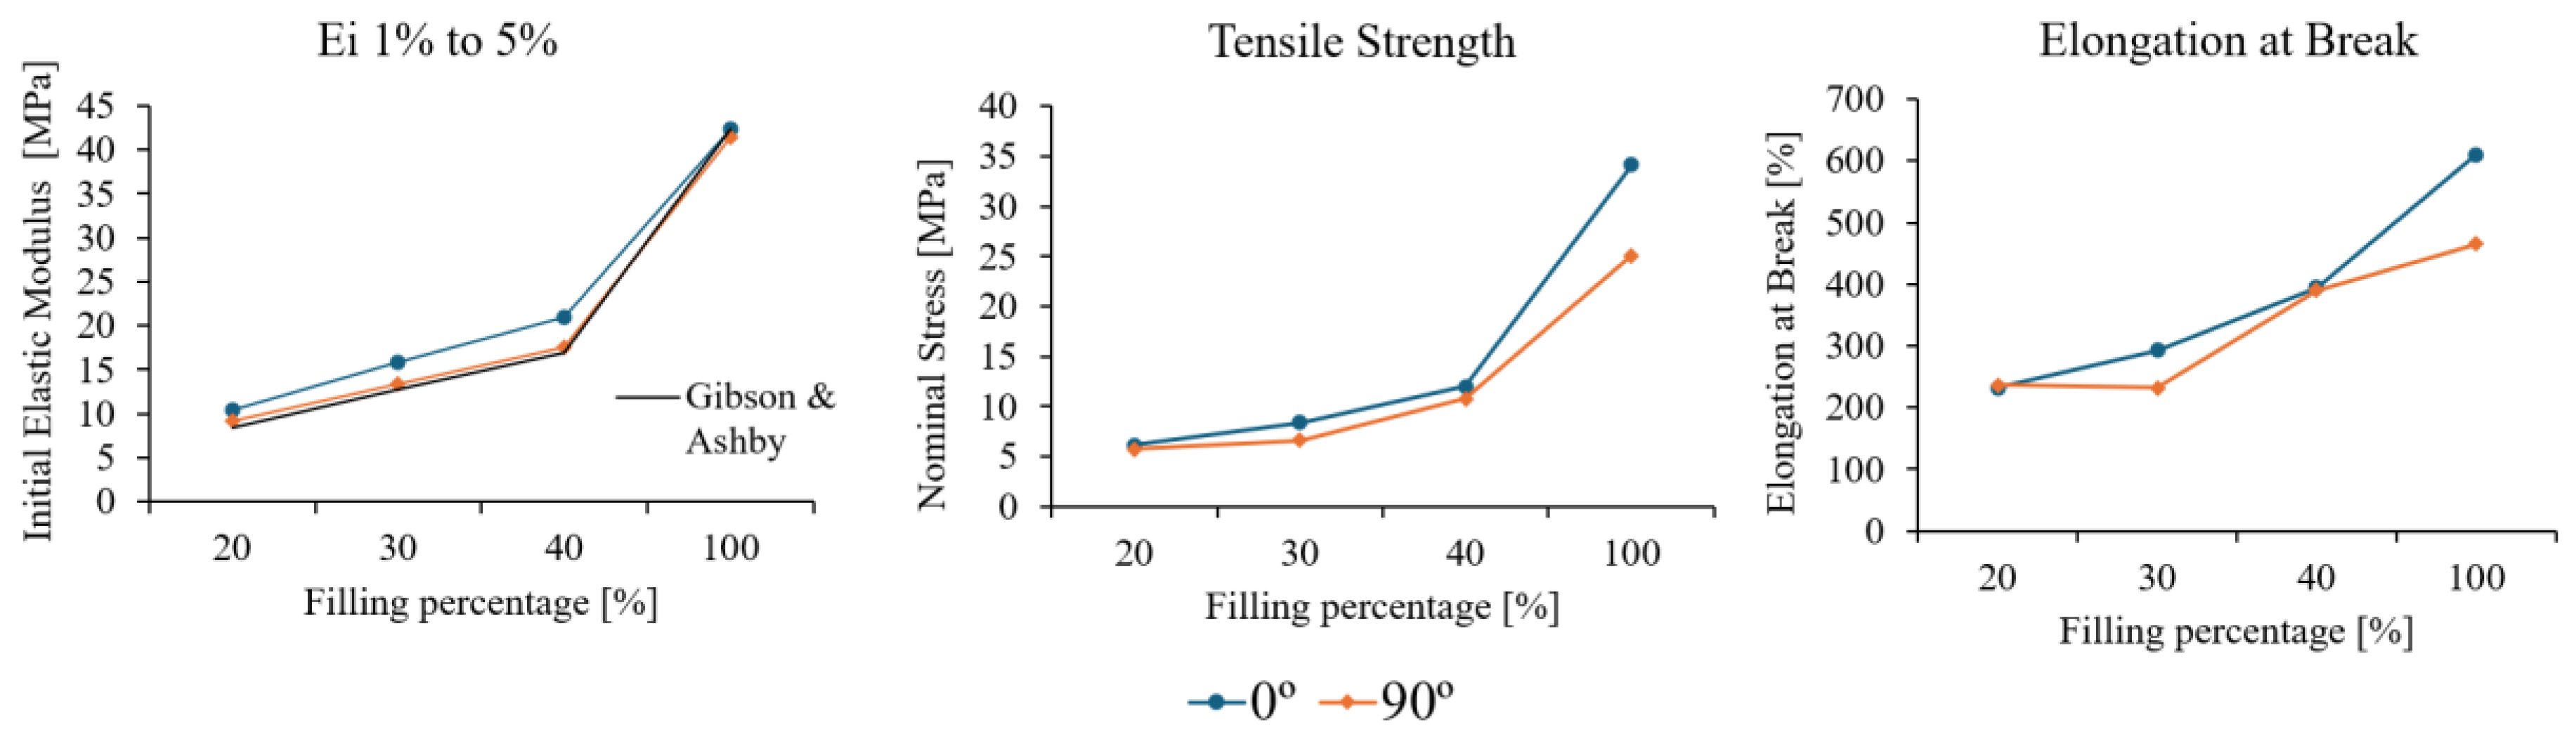
Figure 13.
Representative 3 point bending Nominal Stress – Strain and Force - Displacement diagrams for the three tested laminated composites.
Figure 13.
Representative 3 point bending Nominal Stress – Strain and Force - Displacement diagrams for the three tested laminated composites.
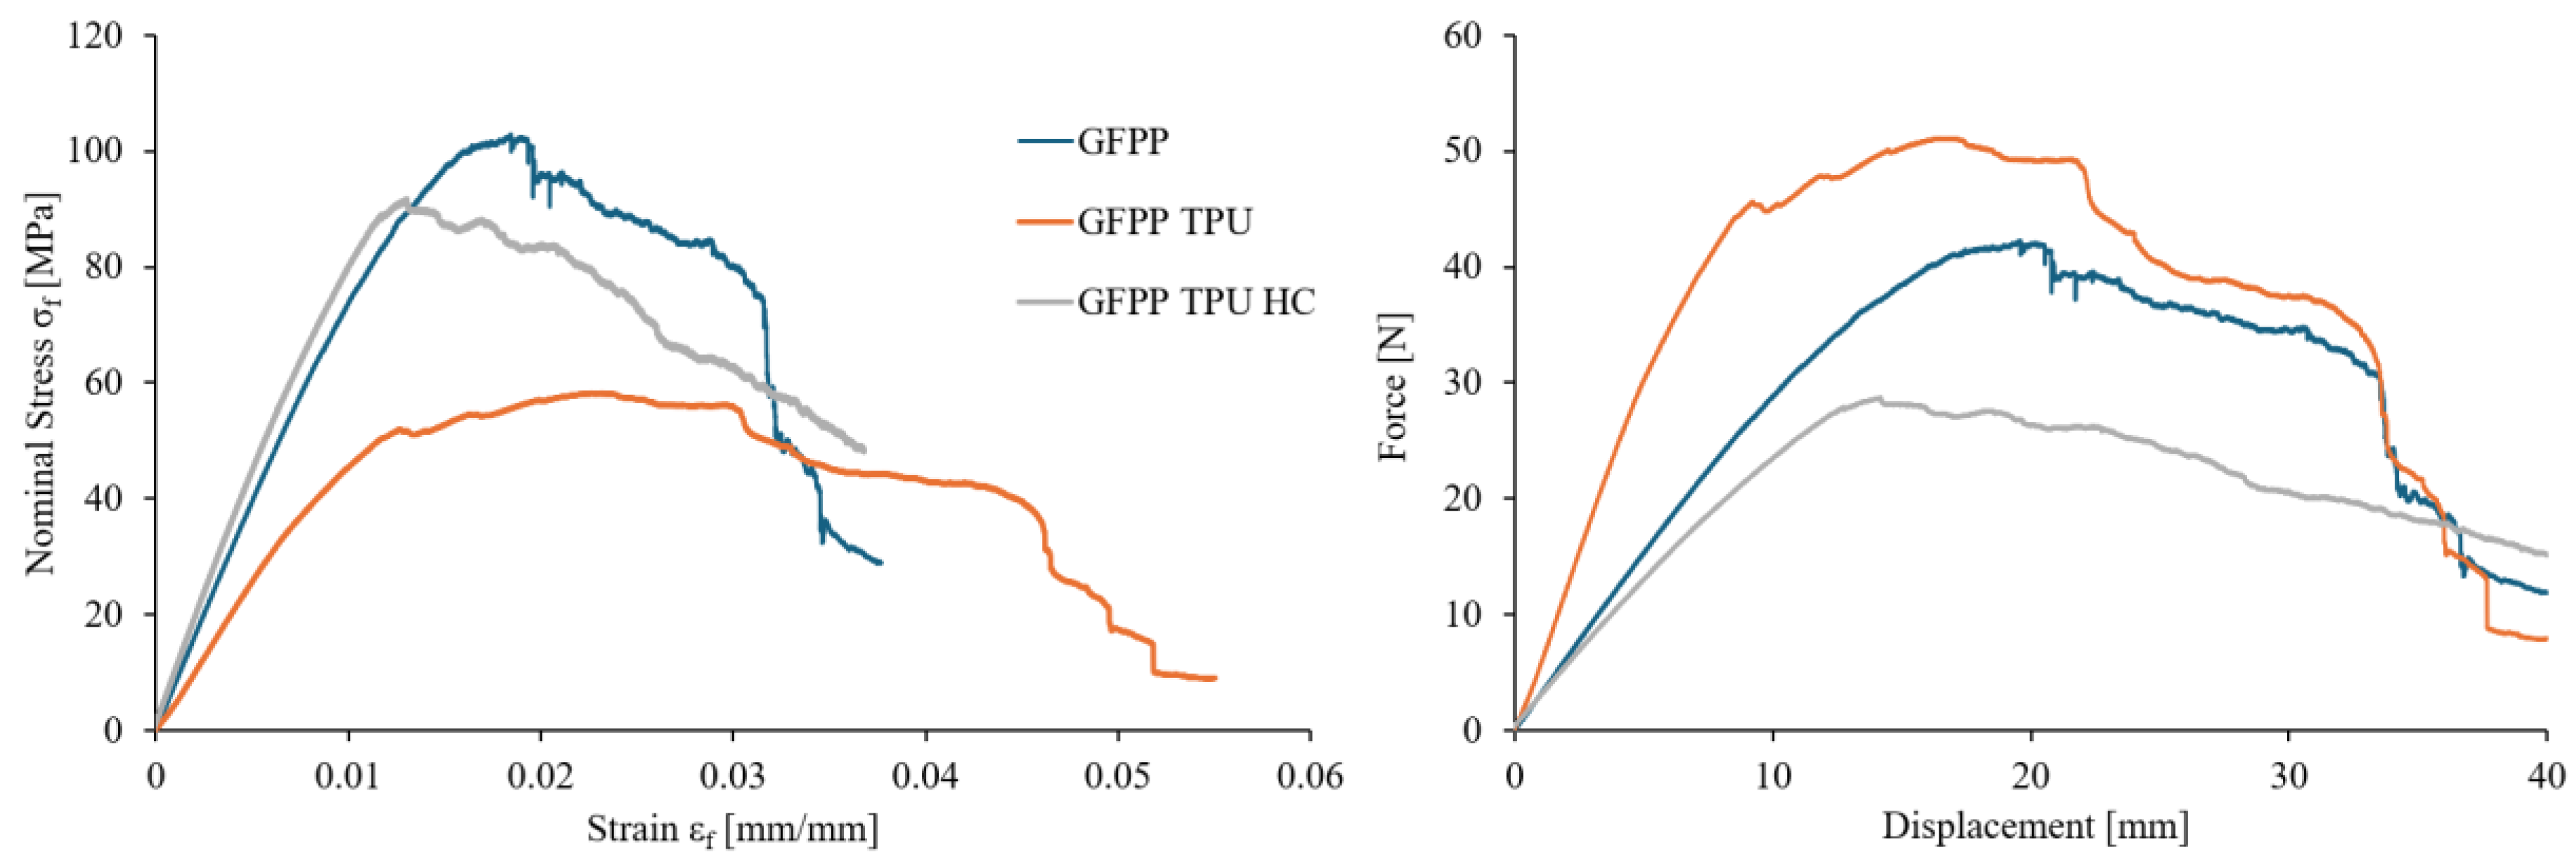
Figure 14.
Three points bending experiments: [A] GFPP; [B] GFPP-TPU; [C] GFPP-TPU-HC.
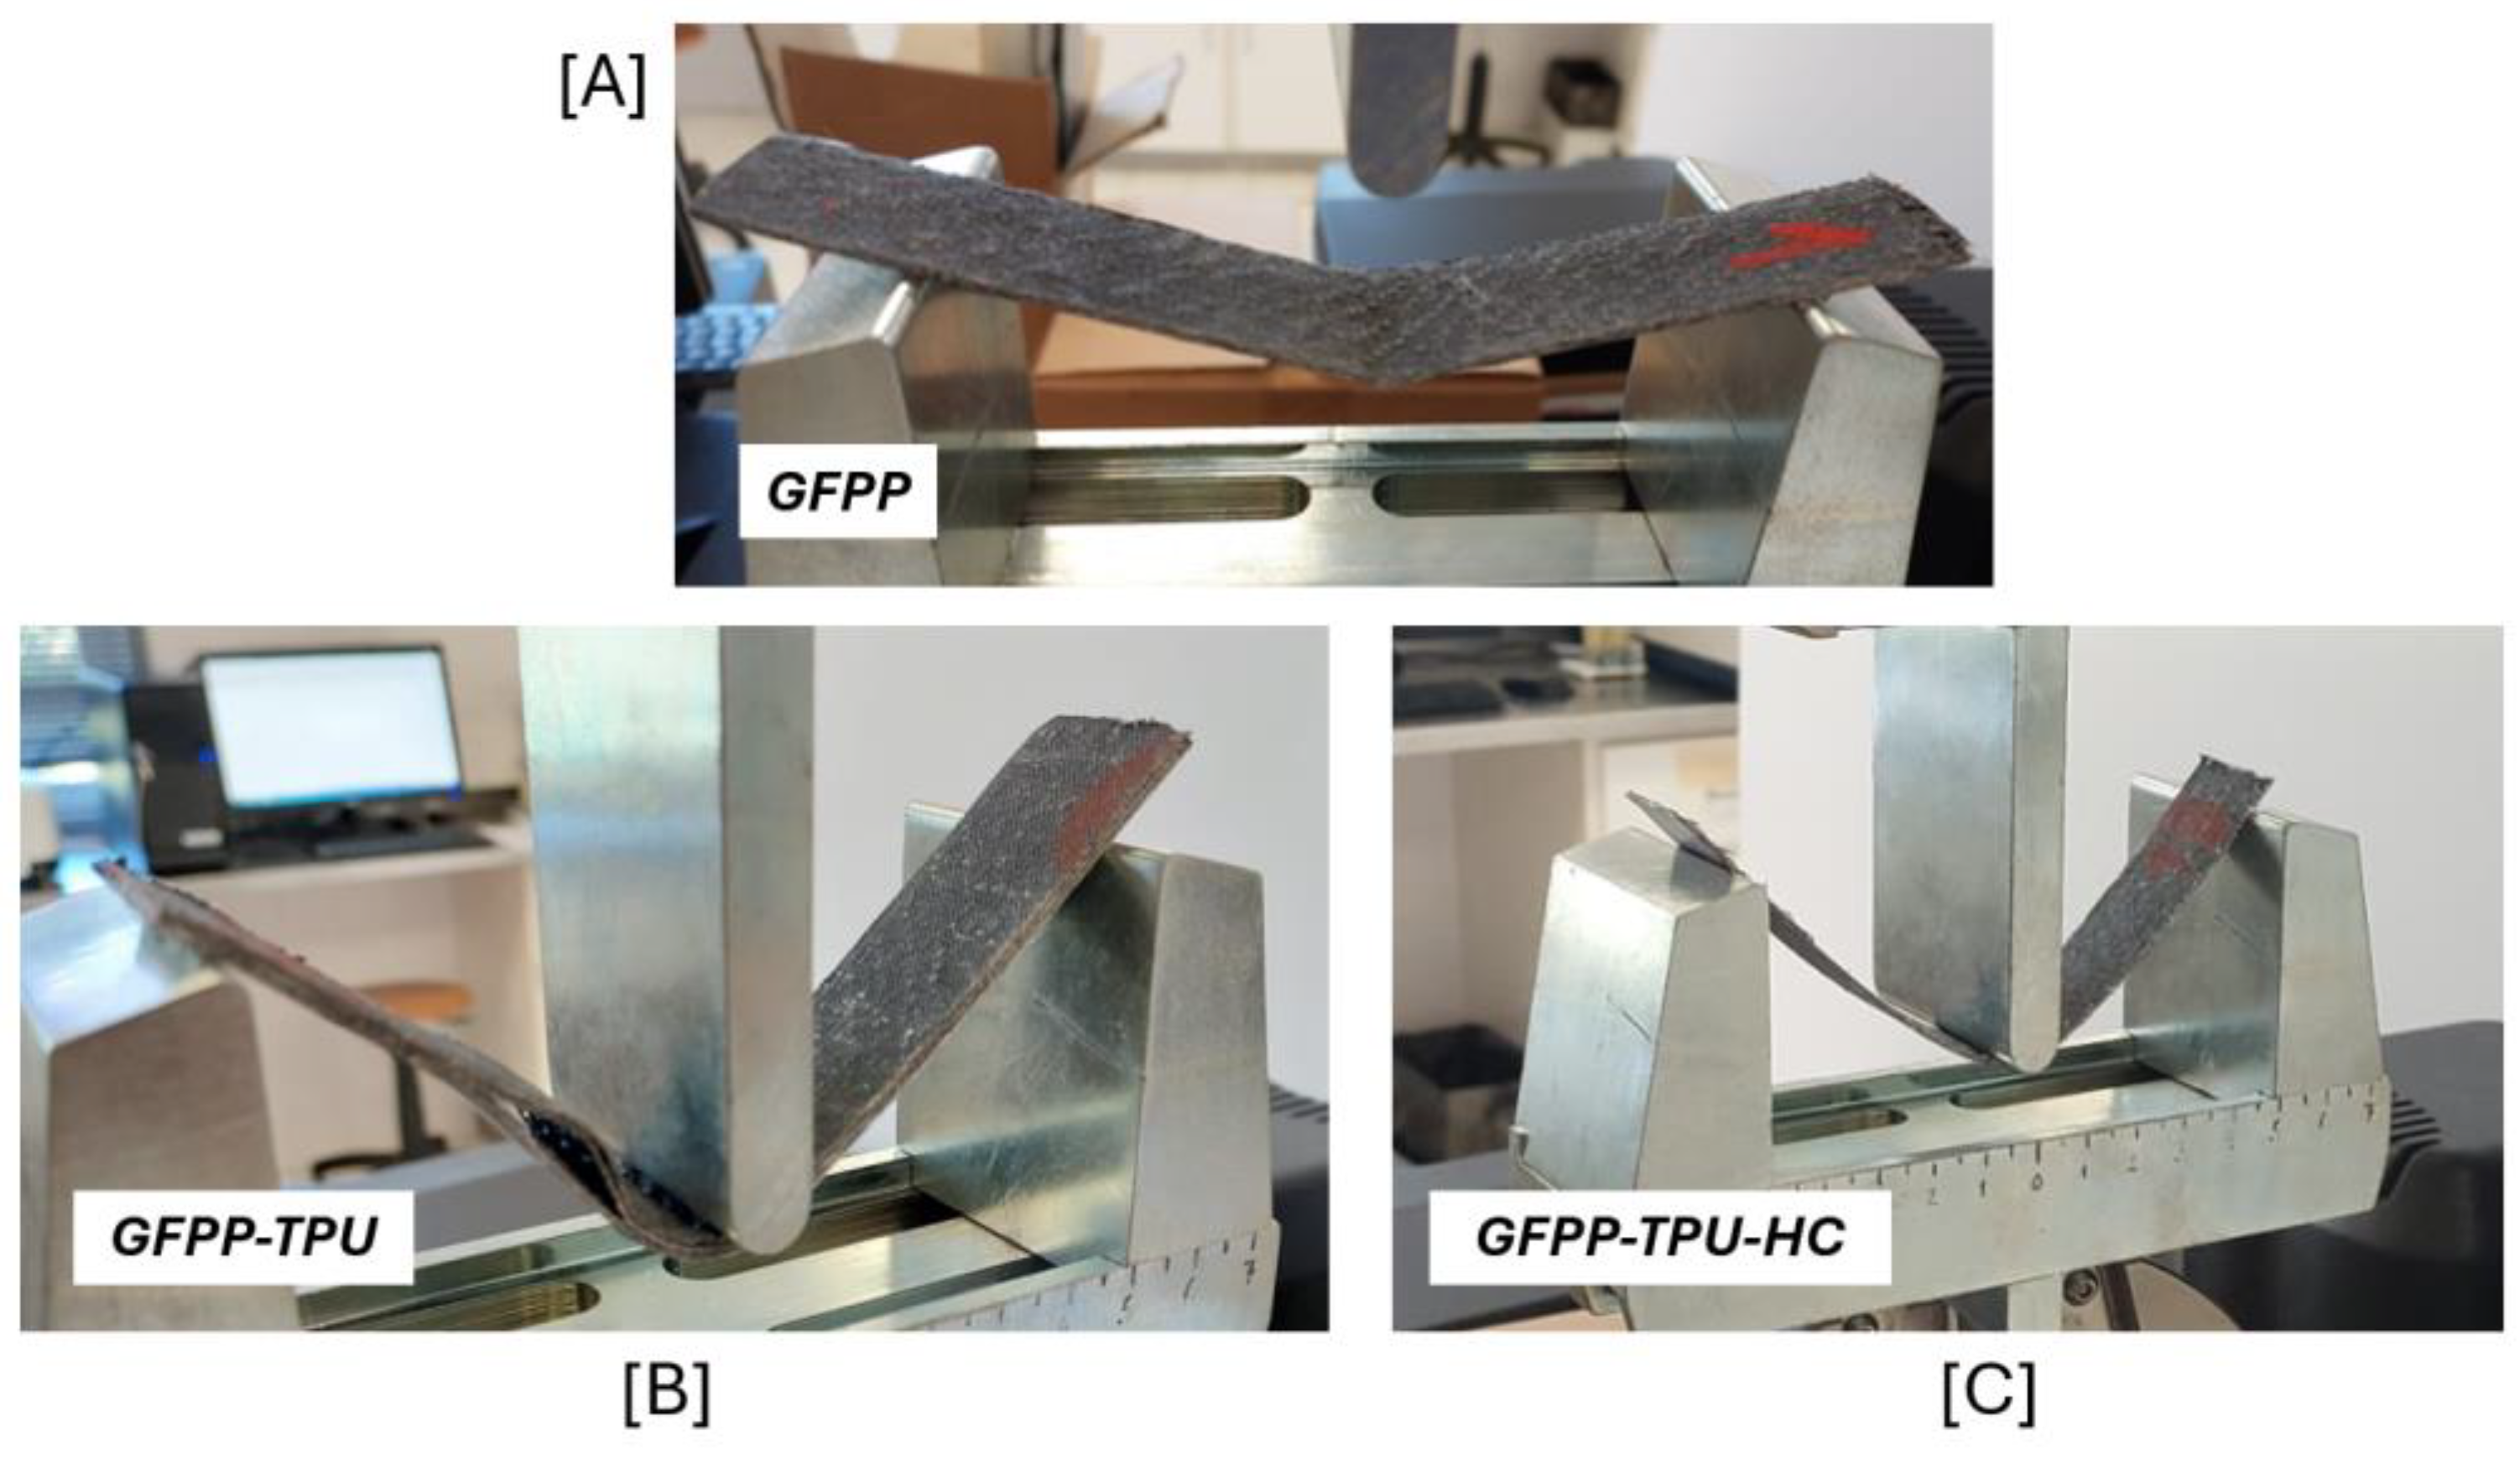
Figure 15.
Flexural Modulus Ef; Maximum tensile strength; Strain at maximum tensile stress and the ratio between the maximum and the final tensile stress for the laminated composites produced.
Figure 15.
Flexural Modulus Ef; Maximum tensile strength; Strain at maximum tensile stress and the ratio between the maximum and the final tensile stress for the laminated composites produced.
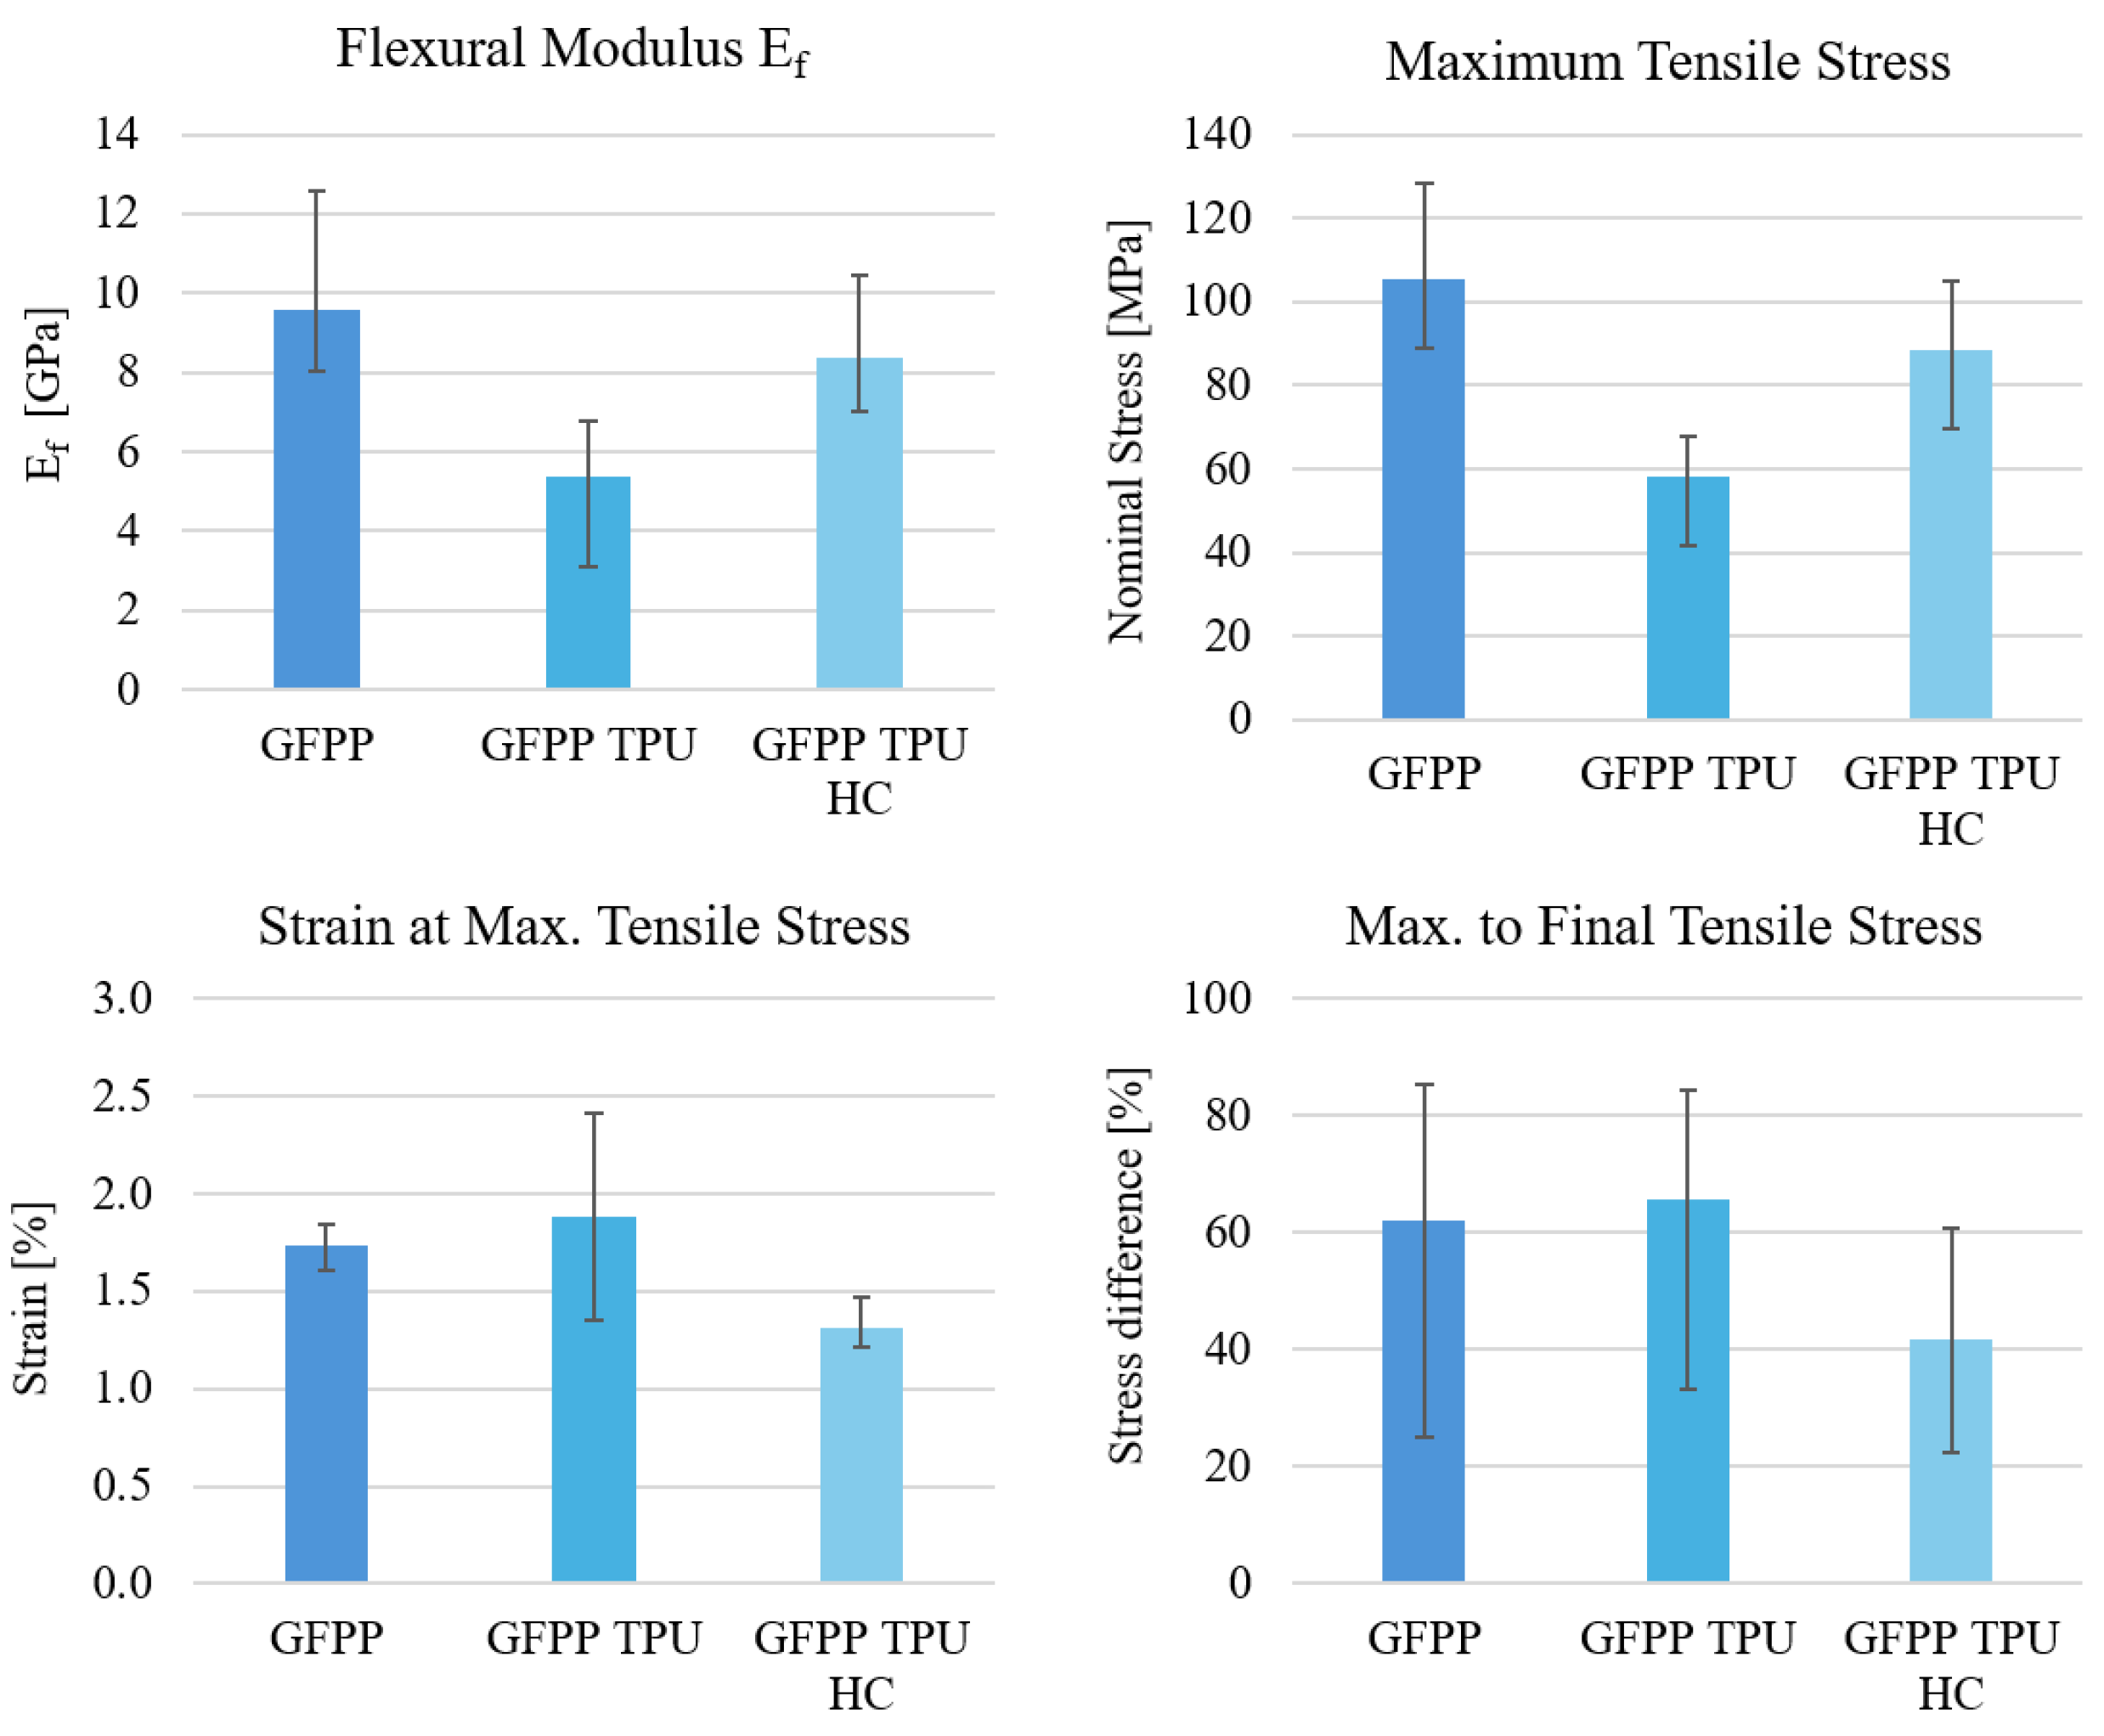

Table 1.
Mechanical properties of the TPU filament provided by the manufacturer.
| Shore Hardness |
Density [kg/m3] |
Tensile Strength [MPa] |
Elongation at Break [%] | Young Modulus [MPa] |
|---|---|---|---|---|
| 92A | 1149 | 44.2 | 661 | 48.4 |
Table 2.
Thermal properties of the TPU filament provided by the manufacturer.
| Glass Transition Temperature [ºC] | Melting Temperature [ºC] | Recommended Nozzle Temperature [ºC] |
|---|---|---|
| -25 | 144 | 210-230 |
Table 3.
WG1-PP-700 black weave twill 2/2 thermoplastic prepreg properties provided by the manufacturer.
Table 3.
WG1-PP-700 black weave twill 2/2 thermoplastic prepreg properties provided by the manufacturer.
| Consolidation Temperature [ºC] | Glass fibre content by volume [%] | Nominal Weight [g/m2] |
Density [kg/m3] |
Thickness of fully consolidated ply [mm] |
|---|---|---|---|---|
| 190-230 | 35% | 700 | 1560 | 0.47 |
Table 4.
DSC Melting temperature of TPU filament and samples produced at different temperatures.
| Tested Material | Melting Temperature Tm |
|---|---|
| Filament TPU95A Ultrafuse | 172.1 ºC |
| FFF extruded at 215ºC | 191.0 ºC |
| FFF extruded at 225ºC | 190.1 ºC |
| FFF extruded at 235ºC | 185.1 ºC |
Table 5.
Fibre glass and polymer mass and volume fractions in composite specimens.
| Mass Fraction [%] | Volume Fraction [%] | |||
|---|---|---|---|---|
| Samples | Fibre Glass | Polymer | Fibre Glass | Polymer |
| GFPP | 62.5 | 37.5 | 37.7 | 62.3 |
| GFPP-TPU | 51.4 | 48.6 | 25.9 | 74.1 |
| GFPP-TPU-HC | 56.9 | 43.1 | 35.4 | 64.6 |
Disclaimer/Publisher’s Note: The statements, opinions and data contained in all publications are solely those of the individual author(s) and contributor(s) and not of MDPI and/or the editor(s). MDPI and/or the editor(s) disclaim responsibility for any injury to people or property resulting from any ideas, methods, instructions or products referred to in the content. |
© 2025 by the authors. Licensee MDPI, Basel, Switzerland. This article is an open access article distributed under the terms and conditions of the Creative Commons Attribution (CC BY) license (http://creativecommons.org/licenses/by/4.0/).
Copyright: This open access article is published under a Creative Commons CC BY 4.0 license, which permit the free download, distribution, and reuse, provided that the author and preprint are cited in any reuse.


