
Submitted:
18 June 2025
Posted:
19 June 2025
You are already at the latest version
Abstract
The thermal, thermomechanical, and viscoelastic properties of continuous unidirectional (UD) glass fiber/high-density polyethylene (GF/HDPE) and ultra-high molecular weight polyethylene/high-density polyethylene (UHMWPE/HDPE) tapes were systematically characterized to support their use in extreme environments. Unlike prior studies focusing on short-fiber composites or limited thermal conditions, this work examines continuous fiber architectures under five operational environments derived from Army Regulation 70-38, reflecting realistic defense-relevant extremes. Differential scanning calorimetry (DSC) identified melting transitions,127.8 ± 0.2 °C for GF/HDPE and 128.3 ± 0.2 °C for UHMWPE/HDPE, that guided the selection of test conditions for thermomechanical analysis (TMA) and dynamic mechanical analysis (DMA). TMA revealed anisotropic thermal expansion consistent with fiber orientation, while DMA, via temperature ramp, frequency sweep, and stress relaxation, quantified the temperature- and time-dependent viscoelastic behavior. The frequency-dependent storage modulus highlighted multiple resonant modes, and stress relaxation data fitted with high accuracy (R² > 0.99) to viscoelastic models, offering parameters for predictive modeling. By integrating thermal and viscoelastic characterization across realistic operational profiles, this study provides a foundational dataset for the application of continuous fiber thermoplastic tapes in structural components exposed to harsh thermal and mechanical conditions.
Keywords:
fiber-reinforced composites
; material characterization
; extreme environments
; thermomechanical properties
; viscoelastic properties
; HDPE
; UHMWPE
1. Introduction
Polymer composites are widely used in aerospace and automotive sectors primarily because of their high strength-to-weight ratios. Recently, there has been increasing interest in extending their application to extreme environments such as space exploration, superconducting magnet systems, and advanced electronics [1]. Typical uses include liquid propellant tanks, satellite components, aircraft structural elements, electrical insulation in superconducting magnets, and infrastructure for Arctic operations [2]. The viscoelastic behavior of polymers results in properties that are sensitive to variables like temperature, deformation rate, and frequency, directly influencing the mechanical performance and structural integrity of components over time [3]. Gaining insight into material responses under extreme thermal conditions is vital for accurately predicting mechanical failures and designing for reliable service life [4]. The multifunctional requirements of polymers in these demanding environments often need robust thermomechanical performance, especially at low temperatures where materials usually fall below their glass transition or melting points and exhibit reduced viscoelastic effects [5].
The coefficient of thermal expansion (CTE) plays a critical role in anticipating thermal stresses that arise when different materials are combined and subjected to varying temperatures [1]. In continuous fiber composites, both fiber and matrix materials contribute to dimensional changes, with anisotropic behavior commonly observed in fiber CTE [6]. For example, glass fibers contract upon cooling in both directions [7], whereas ultra-high molecular weight polyethylene (UHMWPE) can demonstrate a negative CTE, expanding with decreasing temperature [8,9]. Such discrepancies in thermal expansion can lead to complex internal stress states within the composite, potentially affecting interfacial adhesion and overall durability, particularly when considering thermal cycling histories [2].
Material microstructure significantly affects temperature-dependent polymer properties. Generally, polymers become stronger and stiffer while losing ductility at reduced temperatures due to restricted chain mobility and enhanced intermolecular forces [2,10,11]. Stress relaxation behavior also slows significantly as temperature decreases, imposing limitations on the use of polymers where toughness and ductility are critical [12]. Additionally, polymers exhibit rate- and frequency-dependent mechanical responses; higher frequencies often correspond to increased stiffness and unique vibrational characteristics such as natural frequencies and damping ratios, which introduce nonlinearities in material behavior [3,13,14]. Thermal lag during cyclic heating further influences measured thermomechanical properties, underscoring the need to account for these effects in realistic applications [14]. Given their time-dependent nature, understanding the long-term performance and dimensional stability of polymers under extreme environmental exposures remains a key research focus [15]. Factors like prolonged deformation lead to stress relaxation phenomena, which are also affected by environmental conditions and significantly influence polymer flow mechanisms, especially at low temperatures [4].
While prior studies have examined the thermal and mechanical characteristics of polymer composites, many have focused on short fiber reinforcements or standard laboratory environments rather than application-relevant extreme conditions [16,17]. Research on HDPE-based systems using techniques such as DSC, DMA, or TMA often lacks comprehensive evaluation under these realistic environmental stresses [18]. Continuous unidirectional fiber-reinforced thermoplastics like GF/HDPE and UHMWPE/HDPE tapes remain understudied with respect to standardized extreme environmental test protocols [19]. Although dynamic mechanical analysis has provided valuable insights into storage modulus and frequency dependence, integration with formal environmental standards such as Army Regulation 70-38 is uncommon [20]. Furthermore, existing literature rarely employs fitted viscoelastic models, such as Prony series, to capture long-term relaxation behavior and improve predictive capability for continuous fiber systems [21].
This work forms part of a broader initiative to characterize polymer composite behavior under harsh environmental conditions, defined by exposure to extreme stresses that challenge material performance, stability, and longevity [22]. The present study aims to (1) introduce materials tailored for extreme environment applications, (2) characterize thermomechanical properties of continuously reinforced HDPE tapes under these conditions, (3) assess storage modulus across varying environmental factors, (4) evaluate viscoelastic stress relaxation behavior for long-term performance prediction, (5) examine frequency effects on mechanical response, and (6) fit predictive viscoelastic models to experimental data. Five operational conditions derived from Army Regulation 70-38 ensure that testing and analysis reflect realistic environmental influences affecting equipment globally [23]. Key measurements include thermal expansion coefficients, elastic moduli, and viscoelastic responses, complemented by viscoelastic modeling to capture complex time-dependent behavior. This study provides a comprehensive evaluation of continuous HDPE fiber-filled composites under relevant extreme conditions, offering valuable material information for their deployment in demanding applications.
2. Materials and Methods
2.1. Materials and Operational Conditions
This study utilized two types of unidirectional (UD) tapes made from fiber-reinforced high-density polyethylene (HDPE). HDPE, chosen as the matrix material, offers excellent moisture resistance and is known for being a cost-effective thermoplastic [24]. Its ability to perform across a wide temperature range makes it well-suited for use in demanding or extreme environments. In addition to being lightweight and durable, HDPE exhibits strong resistance to chemicals and ultraviolet (UV) radiation [25]. The reinforcement fibers used in this work were glass fiber (GF) and ultra-high molecular weight polyethylene (UHMWPE). Both composite tape materials were procured from A+ Composites GmbH (Weselberg, Germany). Technical specifications for these materials are presented in Table 1.
Composite materials are increasingly used in the design of structures intended for extreme environments, including cold, hot, humid, tropical, and arid regions. Table 2 outlines the selected temperature conditions, along with the associated design types and daily cycle classifications, based on the Army Regulation 70-38 [19]. To characterize the HDPE materials, a temperature range encompassing all five daily cycles was chosen. In this study, achieving and maintaining the specified target temperatures was a primary objective.
2.2. Material Characterization Overview
The material characterization scheme for this work is extensive. This section summarizes the material characterization techniques in this work. Figure 1 shows a diagram indicating the techniques used, the reasoning and objective behind each method, and the procedure used. For more information on the characterization techniques, refer to Section 2.3 for Differential Scanning Calorimetry (DSC) testing, Section 2.4 for Thermomechanical Analysis (TMA) testing, and Section 2.5 for Dynamic Mechanical Analysis (DMA) testing.
2.3. Differential Scanning Calorimetry (DSC)
Thermal characterization of the materials was conducted using a DSC2500 Differential Scanning Calorimeter (TA Instruments, New Castle, DE, USA). Tzero aluminum pans and lids were used for all measurements. Each material was tested using four replicate samples, and the results were averaged. A heating and cooling rate of 10 °C/min was applied, in accordance with ASTM standards E793–24, D3418–21, and E1269–11. The DSC procedure followed a standard heat–cool–heat cycle. The first heating run captures the thermal behavior of the as-received material, effectively documenting its original state. The controlled cooling step establishes a consistent thermal history across samples, and the second heating run enables direct comparison of different materials and processing conditions [26]. The measured melting temperature (Tm) was used to determine appropriate upper limits for subsequent TMA, DMA, and processing parameters. DSC tests were conducted on both the raw (as-received) materials and the consolidated panels to verify that the processing did not alter the material’s microstructure.
2.4. Thermo-Mechanical Analysis (TMA)
Thermomechanical properties were evaluated using a TMA Q400 Thermomechanical Analyzer (TA Instruments, New Castle, DE, USA). The instrument measures dimensional changes in response to temperature, allowing for the calculation of the coefficient of thermal expansion (CTE) based on the sample’s initial length. In accordance with ASTM E831-25, specimen lengths were kept below 10 mm. CTE values for the HDPE systems were determined over a temperature range of –50 °C to 50 °C. For each material, a minimum of three specimens were tested in each principal direction. All tests were conducted using a heating rate of 5 °C/min.
2.5. Dynamic Mechanical Analysis (DMA)
Dynamic mechanical analysis was conducted using a DMA850 (TA Instruments, New Castle, DE, USA) to evaluate both composite materials. Testing included strain sweep, temperature ramp, frequency sweep, and stress relaxation experiments on the HDPE-based systems. Input parameters were selected with guidance from ASTM standards D5023-23, D7028-07(2024), E1640-23, and D2990-17. A three-point bending fixture with a 50 mm span was used to minimize clamping artifacts and ensure accurate mechanical response. Specimens were machined in both the fiber direction (1-direction) and transverse direction (2-direction), as illustrated schematically in Figure 2.
2.5.1. Strain Sweep Test
Strain sweep experiments were carried out on specimens in both the fiber (1 dir) and transverse (2 dir) directions. Tests were run at 1 Hz and 10 Hz, while the strain amplitude was stepped from 0.001 % up to 0.1 %. Sweeps were performed isothermally at −50 °C, 30 °C, and 110 °C to establish a strain level that stayed within the linear viscoelastic region (LVR) for all three temperatures. The 10 Hz sweep was conducted only at −50 °C.
2.5.2. Temperature Ramp Test
Temperature ramp tests were conducted on specimens oriented in both the 1 dir and 2 dir. To evaluate the influence of frequency, tests were performed at 1 Hz and 10 Hz. A temperature ramp rate of 5 °C/min was applied, spanning from −70 °C to 140 °C to encompass the five operational conditions listed in Table 2, and to extend beyond the material’s melting temperature (Tm). Strain levels were set at 0.005 % for 1 dir specimens and 0.01 % for 2 dir specimens, as determined from prior strain sweep results. Prior to testing, a 15 minute dwell at the starting temperature ensured thermal equilibrium across all specimens.
2.5.3. Frequency Sweep Test
Frequency sweep tests were carried out on specimens oriented in both the 1-dir and 2-dir to assess the material response under dynamic loading conditions relevant to civil and mechanical structures, where operating frequencies can span from a few hertz to several hundred hertz [27]. The tests were conducted over a frequency range of 0.1 Hz to 150 Hz, constrained by the instrument’s capabilities. A 15-minute thermal soak was applied prior to testing to ensure uniform specimen temperature. Strain levels of 0.005 % and 0.01 % were used for the 1-dir and 2-dir specimens, respectively, based on results from the strain sweep tests. Frequency sweeps were performed at −70 °C, −25 °C, 0 °C, 30 °C, and 60 °C.
2.5.4. Stress Relaxation Test
Stress relaxation tests were conducted on specimens oriented in 2 dir. Specimens were thermally equilibrated with a 15 minute soak period to ensure uniform temperature throughout before testing. Each relaxation test was run for a duration of 30 minutes. The test conditions, including temperature and applied strain, are summarized in Table 3. The strain value was selected based on equipment limitations, particularly due to the high stiffness of the GF/HDPE material at lower temperatures, while still enabling a valid comparison between both material systems.
A master curve was generated using the time–temperature superposition (TTS) principle to estimate the long-term performance of the materials. The shift factors were determined using an Arrhenius model.
2.6. Manufacturing of Specimens
Nominal two-inch-wide tapes (50.8 mm) were manually laid up to fabricate panels measuring 355.6 mm × 355.6 mm (14 in × 14 in). For DMA testing, a [0₁₅] layup was used, while a [0₂₅] layup was selected for TMA testing, in accordance with the relevant ASTM standards. The panels were consolidated using a Monarch compression molding press (model CMG30H 15 CPX, Carver Inc., Wabash, IN, USA). Differential scanning calorimetry (DSC) results were used to establish a suitable processing temperature range. A series of trial runs were conducted to determine the optimal combination of temperature, dwell time, and pressure that produced high-quality consolidation. After each trial, interlayer bonding was visually inspected to confirm uniform consolidation throughout the panel. The final processing parameters for both material systems are summarized in Table 4, with English units (psi and °F) reported as required by the Monarch press system.
2.7. Conditioning of Specimens
Prior to testing, all specimens were conditioned for a minimum of 40 hours at 23.0 ± 2 °C and 50 ± 10% relative humidity, in accordance with Procedure A of the ASTM D618-21 standard.
2.8. Modeling the Viscoelastic Behavior
Polymer materials can exhibit either liquid-like or solid-like behavior at a given temperature, depending on the time scale or rate of deformation [28]. This behavior is known as viscoelasticity. The present work focuses on linear viscoelastic behavior, which applies to materials subjected to small deformations. Within this framework, concepts such as stress relaxation and the time–temperature superposition (TTS) principle are commonly used to describe how polymers respond to mechanical loading over time.
2.8.1. Time-Temperature-Superposition (TTS) Principle
The time–temperature superposition (TTS) principle describes the relationship between time scale and temperature, enabling the prediction of long-term material behavior from short-term tests. In stress relaxation experiments, TTS allows data collected at different temperatures to be collapsed into a single master curve at a chosen reference temperature, Tref. This is accomplished by selecting one temperature curve as the reference and horizontally shifting the other curves along the time axis until their ends align, effectively superimposing them. Because density changes during these tests are typically minimal, corrections are generally unnecessary.
The amount each curve is shifted is quantified using a shift factor, which can be plotted as a function of temperature relative to Tref. Various models exist for determining shift factors; in this work, the Arrhenius model was used, as all test temperatures were below the material’s melting temperature (Tm). The Arrhenius shift factor is defined as shown in Equation 1.
where Ea is the apparent activation energy, R is the universal gas constant, T is the absolute temperature, and Tref is the reference temperature, both temperatures in kelvins. For TTS to be valid, the material must exhibit linear viscoelastic behavior and be homogeneous, isotropic, and amorphous under the conditions tested. In this study, TTS was applied to specimens aligned in the 2-direction, where the mechanical response is assumed to be dominated by the polymer matrix, to estimate long-term performance.
2.8.2. Modeling Stress Relaxation
In a stress relaxation test, the material is subjected to a constant strain, and the resulting decrease in stress over time is measured. This behavior is quantified by the stress relaxation modulus, defined in Equation 2.
where Er is the relaxation modulus, εo is the applied constant strain, and σ(t) is the stress as a function of time.
The stress relaxation behavior of polymer materials is both time- and temperature-dependent. Relaxation time—the duration required for stress within the material to significantly decay—varies with temperature. At low temperatures, relaxation occurs slowly and over longer periods, while at higher temperatures, it happens more rapidly due to increased molecular mobility.
Various viscoelastic models are available to describe stress relaxation under constant strain. In this study, the Prony series was used to model the relaxation behavior [29]. The Prony series expresses the stress response as a sum of exponential decay functions, as shown in Equation 3.
where σ(t) is the stress at time t, σi represents the stress coefficients, and λi are the relaxation times, typically defined as the ratio of viscosity to storage modulus (μ/E). The experimental data were fit using Prony series models with three and five terms, referred to as Prony3 and Prony5, to evaluate the model accuracy and capture the relaxation behavior of the materials.
3. Results and Discussion
3.1. DSC Results
3.1.1. Raw Material
Figure 3 shows the heat flow as a function of temperature for the heat, cool, and heat cycles of the raw materials. Table 5 and Table 6 show the melting temperature and enthalpy for the heat-cool-heat cycle. The melting temperature of the HDPE composites is according to the values found in the literature for similar material systems [30,31]. However, the measured values are lower compared to those of pure HDPE, with values ranging from 130oC and 135oC [32,33,34].
Table 5 and Table 6 show that the melting temperatures of the HDPE materials are within the same order of magnitude for both heating cycles. The melting temperature of the UHMWPE is according to values found in the literature [35,36,37,38]. The heat of fusion (ΔHfusion) and the enthalpy of crystallization (ΔHcrystallization) of both material systems are different. The difference in magnitude can be attributed to the fiber systems’ influence on the heat of fusion [39]. Some studies have shown that Tm can decrease with increased fiber content [40]. This behavior is partly due to nucleation effects, fiber loading, and fiber morphology. Fiber surfaces provide nucleation sites where crystal growth can begin, decreasing the melting temperature [40]. Moreover, increased fiber loading can lead to more nucleation sites [39]. The shape, size, and surface properties have also been shown to influence the nucleation effects impacting the heat of fusion and melting temperature of semi-crystalline materials [41]. When comparing the ΔHfusion of both heating cycles, it can be observed that the ΔHfusion values of the second heating cycle are higher in magnitude for both materials. The increase in ΔHfusion results from the increase in crystallinity produced by the controlled cooling. The change in crystallinity is further discussed in Section 4.1.3.
Significant changes are observed when comparing the first and second heating cycles of the UHMWPE/HDPE material (Figure 3a and Figure 3c, respectively). The fiber and matrix materials’ melting temperatures (peaks) are present in the first heating cycle. For the second heating cycle, only one peak is present, which may correspond to the mixing of the matrix and fiber material. The first heating cycle provides the properties resulting from the manufacturing process of the material (“as received” raw material). Since the temperature of the first heating cycle surpasses Tm of both materials, the microstructure may have changed due to the material reaching these higher temperatures [42]. At higher temperatures, the crystalline regions can partially melt and rearrange, impacting the overall material properties [42,43]. The high temperature reached in the first heating cycle could have changed the crystallinity of the UHMWPE fiber, shifting its peak value to the left (lower temperature). For this reason, temperature is an essential parameter if the properties of the fiber material are to be kept constant. As a result, the processing window for the UHMWPE/HDPE material is narrow to avoid changing the microstructure of the fiber material, as shown by the results. For this, a processing range of 125oC to 145oC is recommended to process the UHMWPE/HDPE material.
3.1.2. Consolidated Panels
The consolidated panels were subjected to a DSC test to study any change in microstructure resulting from the manufacturing process.
Figure 4 shows the UHMWPE/HDPE DSC results for the raw and consolidated panels. Table 7 and Table 8 show the melting temperature and enthalpy of fusion and crystallization for the heat-cool-heat cycle of the consolidated panels, respectively.
The DSC results of the first heating cycle show that the heat of fusion is higher for the raw material. The decrease in value may be partly due to another thermal cycle on the material during the composite panel’s processing. For the UHMWPE/HDPE material, the heat of fusion is lower for the consolidated panel, with a percentage difference of 4 % for the matrix and 12 % for the fiber material.
The first heating cycle of the consolidated panel showed that the structure of the matrix and fiber matrix did not change, as shown in Figure 4a. Two peaks were observed for the consolidated panel, similar to the raw material, showing that the processing temperature selected did not significantly change the microstructure of the composite material. Like the raw material, exceeding the melting temperature changed the micro-structure, as observed by the heat flow data of the second heating cycle in Figure 4b.
3.1.3. Crystallinity Percentage Calculation
Equation 4 was used to calculate the crystallinity percentage of the HDPE matrixes using the first heating cycle, while Equation 5 was used to calculate the crystallinity percentage of the UHMWPE fiber material.
Where χ_c is the degree of crystallinity, ΔH_m is the melting enthalpy of the material, ΔH_100 is the enthalpy of melting for 100 % crystallinity and w_f is the fiber weight percentage. The ΔH_100 value for HDPE and UHMWPE is 293 J/g [32,44] and 291 J/g [45] respectively. The fiber volume percentage shown in Table 1 was converted to a fiber weight percentage (wt.%) using the density of the fiber and polymer matrix materials. A density of 2.57 g/cm3 [46,47], 0.97 g/cm3 [48], and 0.95 g/cm3 [49] was used for the glass fiber, UHMWPE fiber, and HDPE matrix material.
Table 9 shows the calculated fiber wt. % and the degree of crystallinity for all the materials and fiber systems.
Table 9 show an increase in crystallinity for the GF/HDPE and a decrease for UHMWPE/HDPE material when comparing the consolidated and raw material results. The crystallinity percentage for the UHMWPE/HDPE matrix and fibers stayed within the same order of magnitude for both raw material and consolidated panel. The increase in crystallinity of the GF/HDPE may be due to the controlled cooling process during the consolidation of the panels. It has been shown for other semi-crystalline polymers that the crystallization temperature increases with decreasing cooling rates [50,51].
3.2. TMA Results
A temperature ramp was performed in all principal directions to calculate the dimension change as a function of temperature. Figure 5 shows the TMA data for the GF/HDPE and UHMWPE/HDPE materials. The coefficient of thermal expansion (CTE) was computed using a linear regression from -50 oC to 50 oC (below Tm).
Table 10 shows the average CTE and standard deviation for all principal directions and material systems. In principle, all fibers should be oriented in the 1-dir. However, due to flow-induced alignment during manufacturing, the fibers can shift, causing the orientation of fibers within the composite panel [52]. The average CTE in the 2-dir and 3-dir are within the same magnitude for both material systems. The slight difference between the 2-dir and 3-dir can be attributed to the flow-induced alignment resulting from the manufacturing process and variability of properties within the composite panels.
For the GF/HDPE material, the CTE in the 1-direction corresponds to that of the glass fiber [53]. The CTE in the 2-dir and 3-dir corresponds to that of the HDPE matrix [54,55]. For UHMWPE/HDPE material, the CTE in the 1-direction corresponds to that of the UHMWPE fiber material [56,57]. The CTE in the 2-dir and 3-dir results from the combination of the CTE of the HDPE [55] matrix material and the UHMWPE [58] fiber material suggested by the increase in value when compared to the GF/HDPE material. The experimental results in the 2-dir and 3-dir were compared with calculated values using the rule of mixture, assessing the agreement of results.
3.3. DMA Results
3.3.1. Strain Sweep
A three-point bending strain sweep test was performed on both materials to identify the linear viscoelastic region. Due to the equipment limitations and stiffness of the specimens in the 1-dir, these could not deform above 0.01 strain %. The storage modulus was used as a reference for selecting the linear viscoelastic region. Figure 6 and Figure 7 show the strain sweep results for the GF/HDPE and the UHMWPE/HDPE materials, respectively. The influence of fiber orientation on the material’s storage modulus can be seen from both figures. Here, in the 1-dir, the storage modulus is significantly higher than in the 2-dir. For specimens in the 2-dir, the storage modulus is primarily of the matrix material, while for specimens in the 1-dir, it is represented by the fiber material.
Figure 6 shows the storage modulus in the 1-direction as a function of strain for both materials and three temperatures. For all three temperature values, the modulus increases with oscillation strain. When comparing the temperatures, the storage modulus decreases with an increase in temperature. At the same time, an increase in frequency results in an increase in storage modulus, as observed for a temperature of -50 oC. Figure 7 shows the storage modulus in the 2-direction as a function of strain percentage. The storage modulus behaves mostly linearly over the strain range. It can be observed that temperature influences the storage modulus. The storage modulus increases as temperature decreases, becoming stiffer. As temperature increases, the modulus decreases. This behavior is expected and goes according to what is found in the literature. Using the storage modulus as the reference property, the strain percentage selected is 0.01 % and 0.005 % for the 2-dir and 1-dir, respectively. These values were input parameters for the temperature ramp, frequency sweep, and stress relaxation test.
3.3.2. Temperature Ramp Test
A three-point bending temperature ramp test was performed to measure the temperature-dependent modulus. The flexural modulus is used as a proxy to compare material properties to tensile properties [59]. Figure 8 shows the temperature ramp test result for both material systems. The temperature ramp was performed from -70 oC to 140 oC. The storage modulus decreases with temperature. The increase in modulus as temperature decreases can be attributed to the increase in stiffness and brittleness due to the extremely low temperatures, as shown for other polymer materials [11]. The modulus steadily decreased up to the Tm. After Tm, the modulus decreases significantly due to the phase change of the matrix material going from a solid elastic to a viscous state. At ambient temperatures (15–25 °C), the magnitudes of values for both the strain sweep and temperature ramp tests are consistent between the 1-dir and 2-dir. These values align well with those reported in the material datasheet and literature [34,60]. Moreover, the storage modulus was predicted using composite analysis, which yielded similar results for both specimen orientations. The storage modulus also increases with input frequency value, as seen by others for other polymer systems [13,22]. The results presented in this section show the input frequency and temperature dependency on the storage modulus of polymer materials, specifically the two material systems studied in this work.
3.3.3. Frequency Sweep Test
A three-point bending frequency sweep test was performed on all material systems to measure the HDPE material systems’ frequency- and temperature-dependent properties. A strain percentage of 0.005 % and 0.01 % was used for specimens in the 1-dir and 2-dir, respectively. Figure 9, Figure 10, Figure 11, Figure 12, Figure 13 and Figure 14 shows the storage modulus, loss modulus, and tanδ as a function of the frequency for GF/HDPE and UHMWPE/HDPE materials, respectively. Similar to the temperature ramp results, the storage modulus increases with a decrease in temperature. The storage modulus is observed to increase with input frequency for all the temperatures and directions tested, as seen for pure HDPE material [61] and other composite systems [22,62]. These results align with expectations. As the input frequency increases, the material has less time to relax to its initial state. The frequency value increases, reducing the loss modulus’s response, as it cannot keep pace with the applied loading. Consequently, the storage modulus dominates the material’s behavior, increasing stiffness with higher frequency loading. The measured storage modulus magnitude of the frequency sweep test aligns with the strain sweep and temperature ramp results.
When comparing the storage modulus in the 1-dir of both material systems, it is apparent that the effect of temperature is higher for the UHMWPE/HDPE material. For the GF/HDPE material, the stiffness of the glass fibers may influence the material’s response. In contrast, the material response for specimens in the 2-dir is dominated by the HDPE matrix, showing the effect of temperature on stiffness. The loss modulus and tanδ results show distinct peaks at multiple frequency values for both materials. These peaks can be attributed to the natural frequencies of the HDPE matrix material. These are frequency values at which the material system tends to vibrate without an input-damping force, leading to excessive vibrations and potential damage to componets. Similar tests have been performed by others, indicating their value. Edinne et al. [63] conducted a modal analysis of a 20 % fiber-filled HDPE measuring five frequency modes. Bharath et al. [64,65] studied the mechanical behavior of HDPE foams, measuring a natural frequency mode. Xing et al. [66] analyzed the vibration transmission properties of an expanded polyethylene (EPE) polymer, yielding a resonance frequency. Natural frequency calculations show predictions for the first modes of vibrations ranging from 34 Hz to 72 Hz and 12 Hz to 38 Hz for GF/HDPE 1-dir and 2-dir, respectively, as temperature increases from -70 oC to 110 oC [67]. In the same way, first-mode natural frequencies are predicted to be 36 Hz to 84 Hz and 12 Hz to 26 Hz for UHMWPE/HDPE 1-dir and 2-dir, respectively. These frequency modes are within the range where peaks are observed in the data and trend as predicted, reassuring that these are, in fact, the natural frequency modes of the GF/HDPE and UHMWPE/HDPE materials.
The results from the frequency sweep tests provide valuable insights into material behavior over a range of frequencies. Evaluating the material response under these conditions enhances our understanding of material performance in varying environmental scenarios. As input frequency increases, properties such as stiffness and damping typically increase. Excessive vibrations—caused by factors like foot traffic, equipment operation, or high winds—can negatively impact component integrity and functional performance.
3.3.4. Stress Relaxation Test
A three-point-bending stress relaxation test was performed on both material systems at a strain % value of 0.01 %. The parameters used for testing are shown in Table 3. Figure 15 shows the stress as a function of time for both material systems, while Figure 16 shows the shift factor as a function of temperature. Results for the stress relaxation test are for specimens in the 2-direction only. Three specimens were tested per temperature value, and outliers were removed from the master curve dataset.
A master curve at a nominal reference temperature of 30 oC was created using the TTS principle. The activation energy, Tref, and R2 values of the Arrhenius model are shown in Table 11.
The stress relaxation test results appear noisy due in part to the low strain values selected for the test. Observing the stress development over time, the stress decreases with increasing time. This behavior is apparent for both materials as the stress relaxes over time. This behavior is expected and aligns with similar material systems [68,69]. The stress relaxation is partially caused by the rearrangement of the entangled polymer chains, where the polymer network reorganizes to minimize the elastic energy [68]. High temperatures lead to small relaxation times, whereas low temperatures cause the material to have larger relaxation times. This behavior results from the free volume between the polymer molecules, which is reduced at low temperatures, restricting their movement [28]. When analyzing the results, it is essential to mention that multiple plates were manufactured for testing. Specimens were selected randomly throughout the plates. During testing, variability was observed in the test results during the shifting of the curves and the creation of the master curve. Variability in stress relaxation test results can be attributed in part to (1) material properties being affected by variability in processing parameters, (2) flow-induced fiber alignment during the manufacturing process, (3) experimental error during the specimen setup, and (4) variability of properties due to the specimen location within the manufactured panel. These factors can influence the test results and how the Arrhenius equation fits the experimental data.
The activation energy is higher for the GF/HDPE material. A higher activation energy lowers the reaction rate as more energy is needed for this reaction to occur. The R2 value is higher for the UHMWPE/HDPE material, suggesting that the Arrhenius regression model fits better than the GF/HDPE material. Prony series were used to predict the material’s stress relaxation response. Table 12 shows the R2 values for the Prony series using three and five terms. The Prony series parameters are shown in Appendix A (Table A1 and Table A2). The Prony series can predict up to 99% of the material response, depending on the number of terms used. The more terms used, the better the prediction, as the model can better capture the complex material response.
The stress relaxation test results can significantly aid in predicting residual stresses on composite material systems. An application would be the prediction of residual stresses due to fixed strains, such as those found in bolted joints and connections. The higher torque of a bolt on a composite part may cause the material to take longer to relax when exposed to extreme conditions. The models used to fit the experimental data can assist designers and modelers in predicting material performance during the manufacturing and deployment of composite structures. For example, designers can predict and mitigate potential issues like warping by understanding how a material relaxes in response to strains caused by thermal events or input stresses. The predictive capabilities can help ensure a composite part can maintain structural integrity and functionality over the intended use.
5. Conclusions
The thermal, thermomechanical, and viscoelastic properties of two HDPE composite material systems were successfully characterized under conditions representative of extreme environments. The measured values align well with those reported in the literature, confirming the reliability of the methods used. DSC analysis revealed that exceeding the melting temperature of the fiber component in the UHMWPE/HDPE system results in a microstructural change, indicating a narrow processing temperature window. The coefficient of thermal expansion was quantified along three principal directions, demonstrating the significant influence of fiber architecture on the material’s thermal response.
The linear viscoelastic region was identified across the relevant temperature range, enabling modulus characterization as a function of temperature and frequency. Frequency sweep results revealed distinct natural frequency modes in both systems. Stress relaxation behavior was evaluated, and master curves were generated for a strain input of 0.01%. A five-term Prony series provided a strong fit (R² = 0.99), effectively capturing the complex time-dependent response. Shift factor analysis indicated potential heterogeneity or anisotropy in the 2-direction, likely attributable to material system characteristics and manufacturing-induced variations. Overall, these findings offer key insights into the performance of continuous fiber-reinforced HDPE systems under extreme conditions and support the development of material characterization protocols essential for engineering applications in harsh environments.
Author Contributions
Conceptualization, J.L.C.Q.; methodology, J.L.C.Q.; validation, J.L.C.Q., S.T., and R.A.L.-A.; formal analysis, J.L.C.Q.; investigation, J.L.C.Q., S.T. and R.A.L.-A.; data curation, J.L.C.Q.; writing—original draft preparation, J.L.C.Q.; writing—review and editing, J.L.C.Q., S.T. and R.A.L.-A.; supervision, S.T. and R.A.L.-A. All authors have read and agreed to the published version of the manuscript.
Funding
This work was funded by the US Army Combat Capability Development Command (DEVCOM Soldier Center) Expeditionary Maneuver Support Directorate (Contract: W911QY-20-C-0053 P00005). The information has been approved for public release (Approval Number: PR2025-2111).
Data Availability Statement
The dataset is available on request from the authors.
Acknowledgments
The authors want to thank Danny Pham for helping with the manufacturing of the compression-molded plates, Wesley Bisson, Richard Lafreniere Jr., and Michael McCarty for helping with the cutting and machining of the specimens, and Ethan Wasylyna, Michael Doucette, and Benjamin Cobb for helping with the testing. During the preparation of this manuscript, the authors used OpenAI’s ChatGPT (GPT-4, 2025) to assist in improving the cohesion and clarity of the manuscript’s introduction and method section. All content was subsequently reviewed and edited by the authors to ensure technical accuracy and alignment with the research narrative. The authors take full responsibility for the content of this publication.
Conflicts of Interest
The authors declare that they have no known competing financial interests or personal relationships that could have appeared to influence the work reported in this paper.
Appendix A
Appendix A.1: Prony Series Parameters for Stress Relaxation Test

Table A1.
Prony series parameters using three terms.
| Parameters | GF/HDPE | UHMWPE/HDPE |
| 0.0809 | 0.1143 | |
| 0.3046 | 0.0470 | |
| 0.0473 | 0.0903 | |
| 0.0099 | 2.58 x 10⁻⁴ | |
| 8.22 x 10⁻⁷ | 3.02 x 10⁵ | |
| 8.3309 | 11.5157 |
Table A2.
Prony series parameters using five terms.
| Parameters | GF/HDPE | UHMWPE/HDPE |
| 0.2713 | 0.0728 | |
| 2.57 x 10⁻⁷ | 0.0491 | |
| 0.0078 | 0.0473 | |
| 0.0543 | 0.0553 | |
| 0.0401 | 0.0476 | |
| 1.72 x 10⁻⁶ | 9.18 x 10⁻⁶ | |
| 0.0389 | 4.36 x 10⁻⁴ | |
| 0.0011 | 4.66 x 10⁴ | |
| 0.0279 | 24.1081 | |
| 2.7118 | 0.0785 |
References
- Yano, O.; Yamaoka, H. Cryogenic properties of polymers. Prog. Polym. Sci. 1995, 20, 585–613. [Google Scholar] [CrossRef]
- Sapi, Z.; Butler, R. Properties of cryogenic and low temperature composite materials – A review. Cryogenics 2020, 111, 103190. [Google Scholar] [CrossRef]
- Bradley Carter, J. VIBRATION AND AEROELASTIC PREDICTION OF MULTI-MATERIAL STRUCTURES BASED ON 3D-PRINTED VISCOELASTIC POLYMERS. Miami, 2021.
- Bonning, B.; Blackburn, C.J.; Stretz, H.A.; Wilson, C.D.; Johnson, W.R. Superposition-based predictions of creep for polymer films at cryogenic temperatures. Cryogenics 2019, 104, 102979. [Google Scholar] [CrossRef]
- Kalia, S.; Fu, S.-Y. Polymers at Cryogenic Temperatures; Springer, 2013. [Google Scholar]
- Slifka, A.J.; Smith, D.R. Thermal expansion of an E-glass/vinyl ester composite from 4 to 293 K. Int J Thermophys 1997, 18, 1249–1256. [Google Scholar] [CrossRef]
- Pan, Z.; Sun, B.; Gu, B. Thermo-mechanical numerical modeling on impact com- pressive damage of 3-D braided composite materials under room and low tem- peratures. Aerosp Sci Technol 2016, 54, 23–40. [Google Scholar] [CrossRef]
- Yamanaka, A.; Kashima, T.; Tsutsumi, M.; Ema, K.; Izumi, Y.; Nishijima, S. Thermal Expansion Coefficient of Unidirectional High-Strength Polyethylene Fiber Reinforced Plastics at Low Temperature. Journal of Composite Materials 2007, 41. [Google Scholar] [CrossRef]
- Hua, Y.; Ni, Q.-Q.; Yamanaka, A.; Teramoto, Y.; Natsuki, T. The Development of Composites with Negative Thermal Expansion Properties Using High Performance Fibers. Advanced Composite Materials 2011, 20, 463–475. [Google Scholar] [CrossRef]
- Nielsen, L.E.; Landel, R.F. Mechanical Properties of Polymers and Composites; Marcel Dekker: New York, 1975. [Google Scholar]
- Kim, Y.; Kim, M.S.; Jeon, H.J.; Kim, J.H.; Chun, K.W. Mechanical Performance of Polymer Materials for Low-Temperature Applications. Applied Sciences 2022, 12, 12251. [Google Scholar] [CrossRef]
- He, Y.; Yang, S.; Liu, H.; Shao, Q.; Chen, Q.; Lu, C.; Jiang, Y.; Liu, C.; Guo, Z. Reinforced carbon fiber laminates with oriented carbon nanotube epoxy nanocomposites: Magnetic field assisted alignment and cryogenic temperature mechanical properties. J. Colloid Interf Sci 2018, 517, 40–51. [Google Scholar] [CrossRef]
- Quintana, J.L.C.; Redmann, A.; Capote, G.A.M.; Perez-Irizarry, A.; Bechara, A.; Osswald, T.A.; Lakes, R. Viscoelastic properties of fused filament fabrication parts. Additive Manufacturing 2019, 28, 704–710. [Google Scholar] [CrossRef]
- Sun, W.; Vassilopoulos, A.P.; Keller, T. Effect of thermal lag on glass transition temperature of polymers measured by DMA. International Journal of Adhesion & Adhesives 2014, 52, 31–39. [Google Scholar]
- Raghavan, J.; Meshii, M. CREEP OF POLYMER COMPOSITES. Composites Science and Technology 1997, 57, 1673–1688. [Google Scholar] [CrossRef]
- Jiang, L.; Zhou, Y.; Jin, F. Design of short fiber-reinforced thermoplastic composites: A review. Polymer Composites 2022, 43, 4835–4847. [Google Scholar] [CrossRef]
- Dasari, S.; Patnaik, S.; Prusty, R.K. Temperature-dependent inter-laminar fracture behavior of waste short carbon fiber embedded glass fiber/epoxy composites. Polymer Composites 2023, 44, 6793–6810. [Google Scholar] [CrossRef]
- Gupta, A.; Hasanov, S.; Fidan, I. Thermal characterization of short carbon fiber reinforced high temperature polymer material produced using the fused filament fabrication process. Journal of Manufacturing Processes 2022, 80, 515–528. [Google Scholar] [CrossRef]
- Qiao, Y.; Fring, L.D.; Pallaka, M.R.; Simmons, K.L. A Review of the Fabrication Methods and Mechanical Behavior of Continuous Thermoplastic Polymer Fiber - Thermoplastic Polymer Matrix Composites. Polymer Composites 2022, 44, 694–733. [Google Scholar] [CrossRef]
- Mortazavian, S.; Fatemi, A. Tensile behavior and modeling of short fiber-reinforced polymer composites including temperature and strain rate effects. Journal of Thermoplastic Composite Materials 2016, 30, 1414–1437. [Google Scholar] [CrossRef]
- Abouhamzeh, M.; Dijk, Y.L.M.; Gratzl, T. Viscoelastic modelling of fibre-reinforced thermoplastics in hygrothermal circumstances. Mechanics of Time-Dependent Materials 2022, 27, 973–987. [Google Scholar] [CrossRef]
- Quintana, J.L.C.; Tomlinson, S.; Lopez-Anido, R.A. Thermomechanical and Viscoelastic Characterization of Continuous GF/PETG Tape for Extreme Environment Applications. Journal of Composites Science 2024, 8, 892. [Google Scholar] [CrossRef]
- McConville, J.C.; Miller, K.S. Research, Development, Test and Evaluation of Material for Worldwide Use; Department of the Army: Washington, DC, 2020. [Google Scholar]
- Common uses of high-density polyethylene. A & C Plastics, Inc., 2024. Available online: https://www.acplasticsinc.com/informationcenter/r/common-uses-of-hdpe[Accessed 2024].
- PolyAlto, G. The advantages and applications of HDPE. Polyalto, 2024. Available online: https://blogue.polyalto.com/en/the-advantages-and-applications-of-hdpe[Accessed 2024].
- A Beginner’s Guide to Differential Scanning Calorimetry DSC. PerkinElmer, 2010. Available online: https://www.s4science.at/wordpress/wp-content/uploads/2018/10/DSC-Beginners-Guide.pdf[Accessed 9 September 2024].
- Clough, R.W.; Penzien, J. Dynamics of Structures; McGraw-Hill, 1993. [Google Scholar]
- Osswald, T.A.; Menges, G. Material Science of Polymers for Engineers; Hanser: Munich, 2012. [Google Scholar]
- Chen, T. Determining a Prony Series for a Viscoelastic material From Time Varying Strain Data. 2000. [Google Scholar]
- Awad, A.H.; El Gamasy, R.; El Wahab, A.A.; Abdellatif, M.H. Mechanical and physical properties of PP and HDPE. Engineering Science 2019, 4, 34–42. [Google Scholar] [CrossRef]
- Anu, M.; Pillai, S.S. Structure, thermal, optical, and dielectric properties of SnO2 nanoparticles-filled HDPE polymer. Solid State Communications 2022, 341, 114577. [Google Scholar] [CrossRef]
- Tarani, E.; Arvanitidis, I.; Christofilos, D.; Bikiaris, D.N.; Chrissafis, K.; Vourlias, G. Calculation of the degree of crystallinity of HDPE/GNPs nanocomposites by using various experimental techniques: a comparative stud. J. Mater Sci 2023, 58, 1621–1639. [Google Scholar] [CrossRef]
- Koffi, A.; Mijiyawa, F.; Koffi, D.; Erchiqui, F.; Toubal, L. Mechanical Properties,Wettability and Thermal Degradation of HDPE/Birch Fiber Composite. Polymers 2021, 13, 1459. [Google Scholar] [CrossRef]
- Ziaee, S.; Kerr-Anderson, E.; Johnson, A.; Eastep, D.; Abdel-Magid, B. Effect of High Fiber Content on Properties and Performance of CFRTP Composites. Journal of Composites Science 2024, 8, 364. [Google Scholar] [CrossRef]
- Rudnik, E.; Dobkowski, Z. Thermal degradation of UHMWPE. Journal of Thermal Analysis 1997, 49, 471–475. [Google Scholar] [CrossRef]
- Khalil, Y.; Hopkinson, N.; Kowalski, A.; Fairclough, J.P.A. Characterisation of UHMWPE polymer poder for laser sintering. Materials 2019, 12, 3496. [Google Scholar] [CrossRef]
- Khasraghi, S.S.; Rezaei, M. Preparation and characterization of UHMWPE/HDPE/MWCNT melt-blended nanocomposites. Thermoplastic Composite Materials 2015, 28, 305–326. [Google Scholar] [CrossRef]
- Roiron, C.; Laine, E.; Grandidier, J.-C.; Garois, N.; Vix-Guter, C. A Review of the Mechanical and Physical Properties of Polyethylene Fibers. Textiles 2021, 1, 86–151. [Google Scholar] [CrossRef]
- Shi, Z.; Zhang, C.; Chen, X.-X.; Li, A.; Zhang, Y.-F. Thermal, Mechanical and Electrical Properties of Carbon Fiber Fabric and Graphene Reinforced Segmented Polyurethane Composites. Nanomaterials 2021, 11, 1289. [Google Scholar] [CrossRef]
- Bahlouli, S.; Belaadi, A.; Makhlouf, A.; Alshahrani, H.; Khan, M.K.A.; Jawaid, M. Effect of Fiber Loading on Thermal Properties of Cellulosic Washingtonia Reinforced HDPE Biocomposites. Polymers 2023, 15, 2910. [Google Scholar] [CrossRef]
- Paul, S.A.; Boudenne, A.; Ibos, L.; Candau, Y.; Joseph, K.; Thomas, S. Effect of fiber loading and chemical treatments on thermophysical properties of banana fiber/polypropylene commingled composite materials. Composites Part A 2008, 39, 1582–1588. [Google Scholar] [CrossRef]
- Deng, B.; Chen, L.; Zhong, Y.; Li, X.; Wang, Z. The effect of temperature on the structural evolution of ultra-high molecular weight polyethylene films with pre-reserved shish crystals during the stretching process. Polymer 2023, 267, 125690. [Google Scholar] [CrossRef]
- Tsinas, Z.; Orski, S.V.; Bentley, V.R.C.; Lopez, L.G.; Al-Sheikhly, M.; Forster, A.L. Effects of Thermal Aging on Molar Mass of Ultra-High Molar Mass Polyethylene Fibers. Polymers 2022, 14, 1324. [Google Scholar] [CrossRef] [PubMed]
- Deepthi, M.V.; Sharma, M.; Sailaja, R.R.N.; et al. Mechanical and thermal characteristics of high density polyethylene-fly ash cenospheres composites. Mater. Des. 2010, 31, 2051–2060. [Google Scholar] [CrossRef]
- Steven, M.K. The UHMWPE Handbook Ultra-High Molecular Weight Polyethylene in Total. 2004. [Google Scholar]
- E-Glass & S-Glass. JPS Composite Materials, [Online]. Available online: https://jpscm.com/products/e-glass-s-glass/[Accessed 2024].
- Barbero, E.J. Introduction to Composite Materials Design 3rd Edition; Taylor & Francis Group: Boca Raton, FL, 2017. [Google Scholar]
- The core differences between UHMWPE & Kevlar. Otex Specialty Narrow Fabrics, [Online]. Available online: https://osnf.com/uhmwpe-vs-kevlar/[Accessed 2024].
- Polyolefins. Plastics Europe, [Online]. Available online: https://plasticseurope.org/plastics-explained/a-large-family/polyolefins/#:~:text=The%20density%20of%20HDPE%20can,and%20tensile%20strength%20than%20LDPE[Accessed 2024].
- Poel, G.V.; Mathot, V.B.F.; Ye, P. Crystallization Temperature vs. Cooling Rate: the Link with “Real-Life” Polymer Processes. PerkinElmer, Shelton, CT, 2011.
- Yu, M.; Qi, L.; Cheng, L.; Min, W.; Mei, Z.; Gao, R.; Sun, Z. The Effect of Cooling Rates on Thermal, Crystallization, Mechanical and Barrier Properties of Rotational Molding Polyamide 11 as the Liner Material for High-Capacity High-Pressure Vessels. Molecules 2023, 28, 2425. [Google Scholar] [CrossRef]
- Song, Y.; Gandhi, U.; Perez, C.; Osswald, T.; Vallury, S.; Yang, A. Method to account for the fiber orientation of the initial charge on the fiber orientation of finished part in compression molding simulation. Composites Part A: Applied Science and Manufacturing 2017, 10, 244–254. [Google Scholar] [CrossRef]
- C-Glass Fiber, Generic. MatWeb - Material Property Data, [Online]. Available online: https://www.matweb.com/search/datasheet.aspx?MatGUID=462fd1da8ad245b2ad40093889016448&ckck=1[Accessed 2024].
- Coefficient of Linear Thermal Expansion. Omnexus, [Online]. Available online: https://omnexus.specialchem.com/polymer-property/coefficient-of-linear-thermal-expansion[Accessed 2024].
- Thermal Properties of Plastic Materials. Professional Plastics, [Online]. Available online: https://www.professionalplastics.com/professionalplastics/ThermalPropertiesofPlasticMaterials.pdf[Accessed 2024].
- Zhang, X.; Wang, Y.; Lu, C.; Cheng, S. Interfacial adhesion study on UHMWPE fiber-reinforced composites. Polym. Bull. 2011, 67, 527–540. [Google Scholar] [CrossRef]
- Physical Properties of Dyneema Fibers. dynamica rope, [Online]. Available online: https://dynamicarope.com/wp-content/uploads/2015/04/Physical-Properties-of-Dyneema-Fibre.pdf[Accessed 2024].
- Sreekanth, P.S.R.; Subramani, K. Influence of MWCNTs and gamma irradiation on thermal characteristics of medical grade UHMWPE. Bull. Mater. Sci. 2014, 37, 347–356. [Google Scholar] [CrossRef]
- Deng, S.; Hou, M.; Ye, L. Temperature-dependent elastic moduli of epoxies measured by DMA and their correlations to mechanical testing data. Polymer Testing 2007, 26, 803–813. [Google Scholar] [CrossRef]
- Kumar, S.D.; Samvel, R.; Aramindh, M.; Vibin, R.A.; Poovarasu, E.; Prasad, M.S.S. Ballistic studies on synthetic fibre reinforced polymer composites and it’s applications –A brief review. materialstoday: Proceedings, 6 April 2023.
- Sahu, S.K.; Badgayan, N.D.; Sreekanth, P.S.R. Rheological Properties of HDPE based Thermoplastic Polymeric Nanocomposite Reinforced with Multidimensional Carbon-based Nanofillers. Biointerface Research in Applied Chemistry 2022, 12, 5709–5715. [Google Scholar]
- Dupaix, R.B.; Boyce, M.C. Finite strain behavior of poly(ethylene terephthalate) (PET) and poly(ethylene terephthalate)-glycol (PETG). Polymer 2005, 46, 4827–4838. [Google Scholar] [CrossRef]
- Edinne, G.D.; Ramdane, Y.; Nouredine, O.; Nadir, B. Modal analysis of biocomposite materials beams reinforced by Washingtonia Filifera natural fibers. Journal of Vibroengineering 2022, 24, 1502–1511. [Google Scholar] [CrossRef]
- Bharath, H.S.; Waddar, S.; Bekinal, S.I.; Jeyaraj, P.; Doddamani, M. Effect of axial compression on dynamic response of concurrently printed sandwich. Composite Structures 2021, 259, 113223. [Google Scholar] [CrossRef]
- Bharath, H.S.; Sawardekar, A.; Waddar, S.; Jeyaraj, P.; Doddamani, M. Mechanical behavior of 3D printed syntactic foam composites. Composite Structures 2020, 254, 112832. [Google Scholar] [CrossRef]
- Xing, Y.; Sun, D.; Deng, Z. An Analysis of the Vibration Transmission Properties of Assemblies Using Honeycomb Paperboard and Expanded Polyethylene. Materials 2023, 16, 6554. [Google Scholar] [CrossRef]
- Young, W.C.; Budynas, R.G. Roark’s Formulas for Stress and Strain; McGraw-Hill: New York, NY, 2002. [Google Scholar]
- Kroon, M.; Gortz, J.; Islam, S.; Andreasson, E.; Petersson, V.; Jutemar, E.P. Experimental and theoretical study of stress relaxation in high-density polyethylene. Acta Mech 2024, 235, 2455–2477. [Google Scholar] [CrossRef]
- Saeed, U.; Al-Turaif, H.; Siddiqui, M.E. Stress relaxation performance of glass fiber-reinforced high-density polyethylene composite. Polymers adn Polymer Composites 2021, 29, 705–713. [Google Scholar] [CrossRef]
Figure 1.
Diagram of material characterization techniques and procedures used in this work.
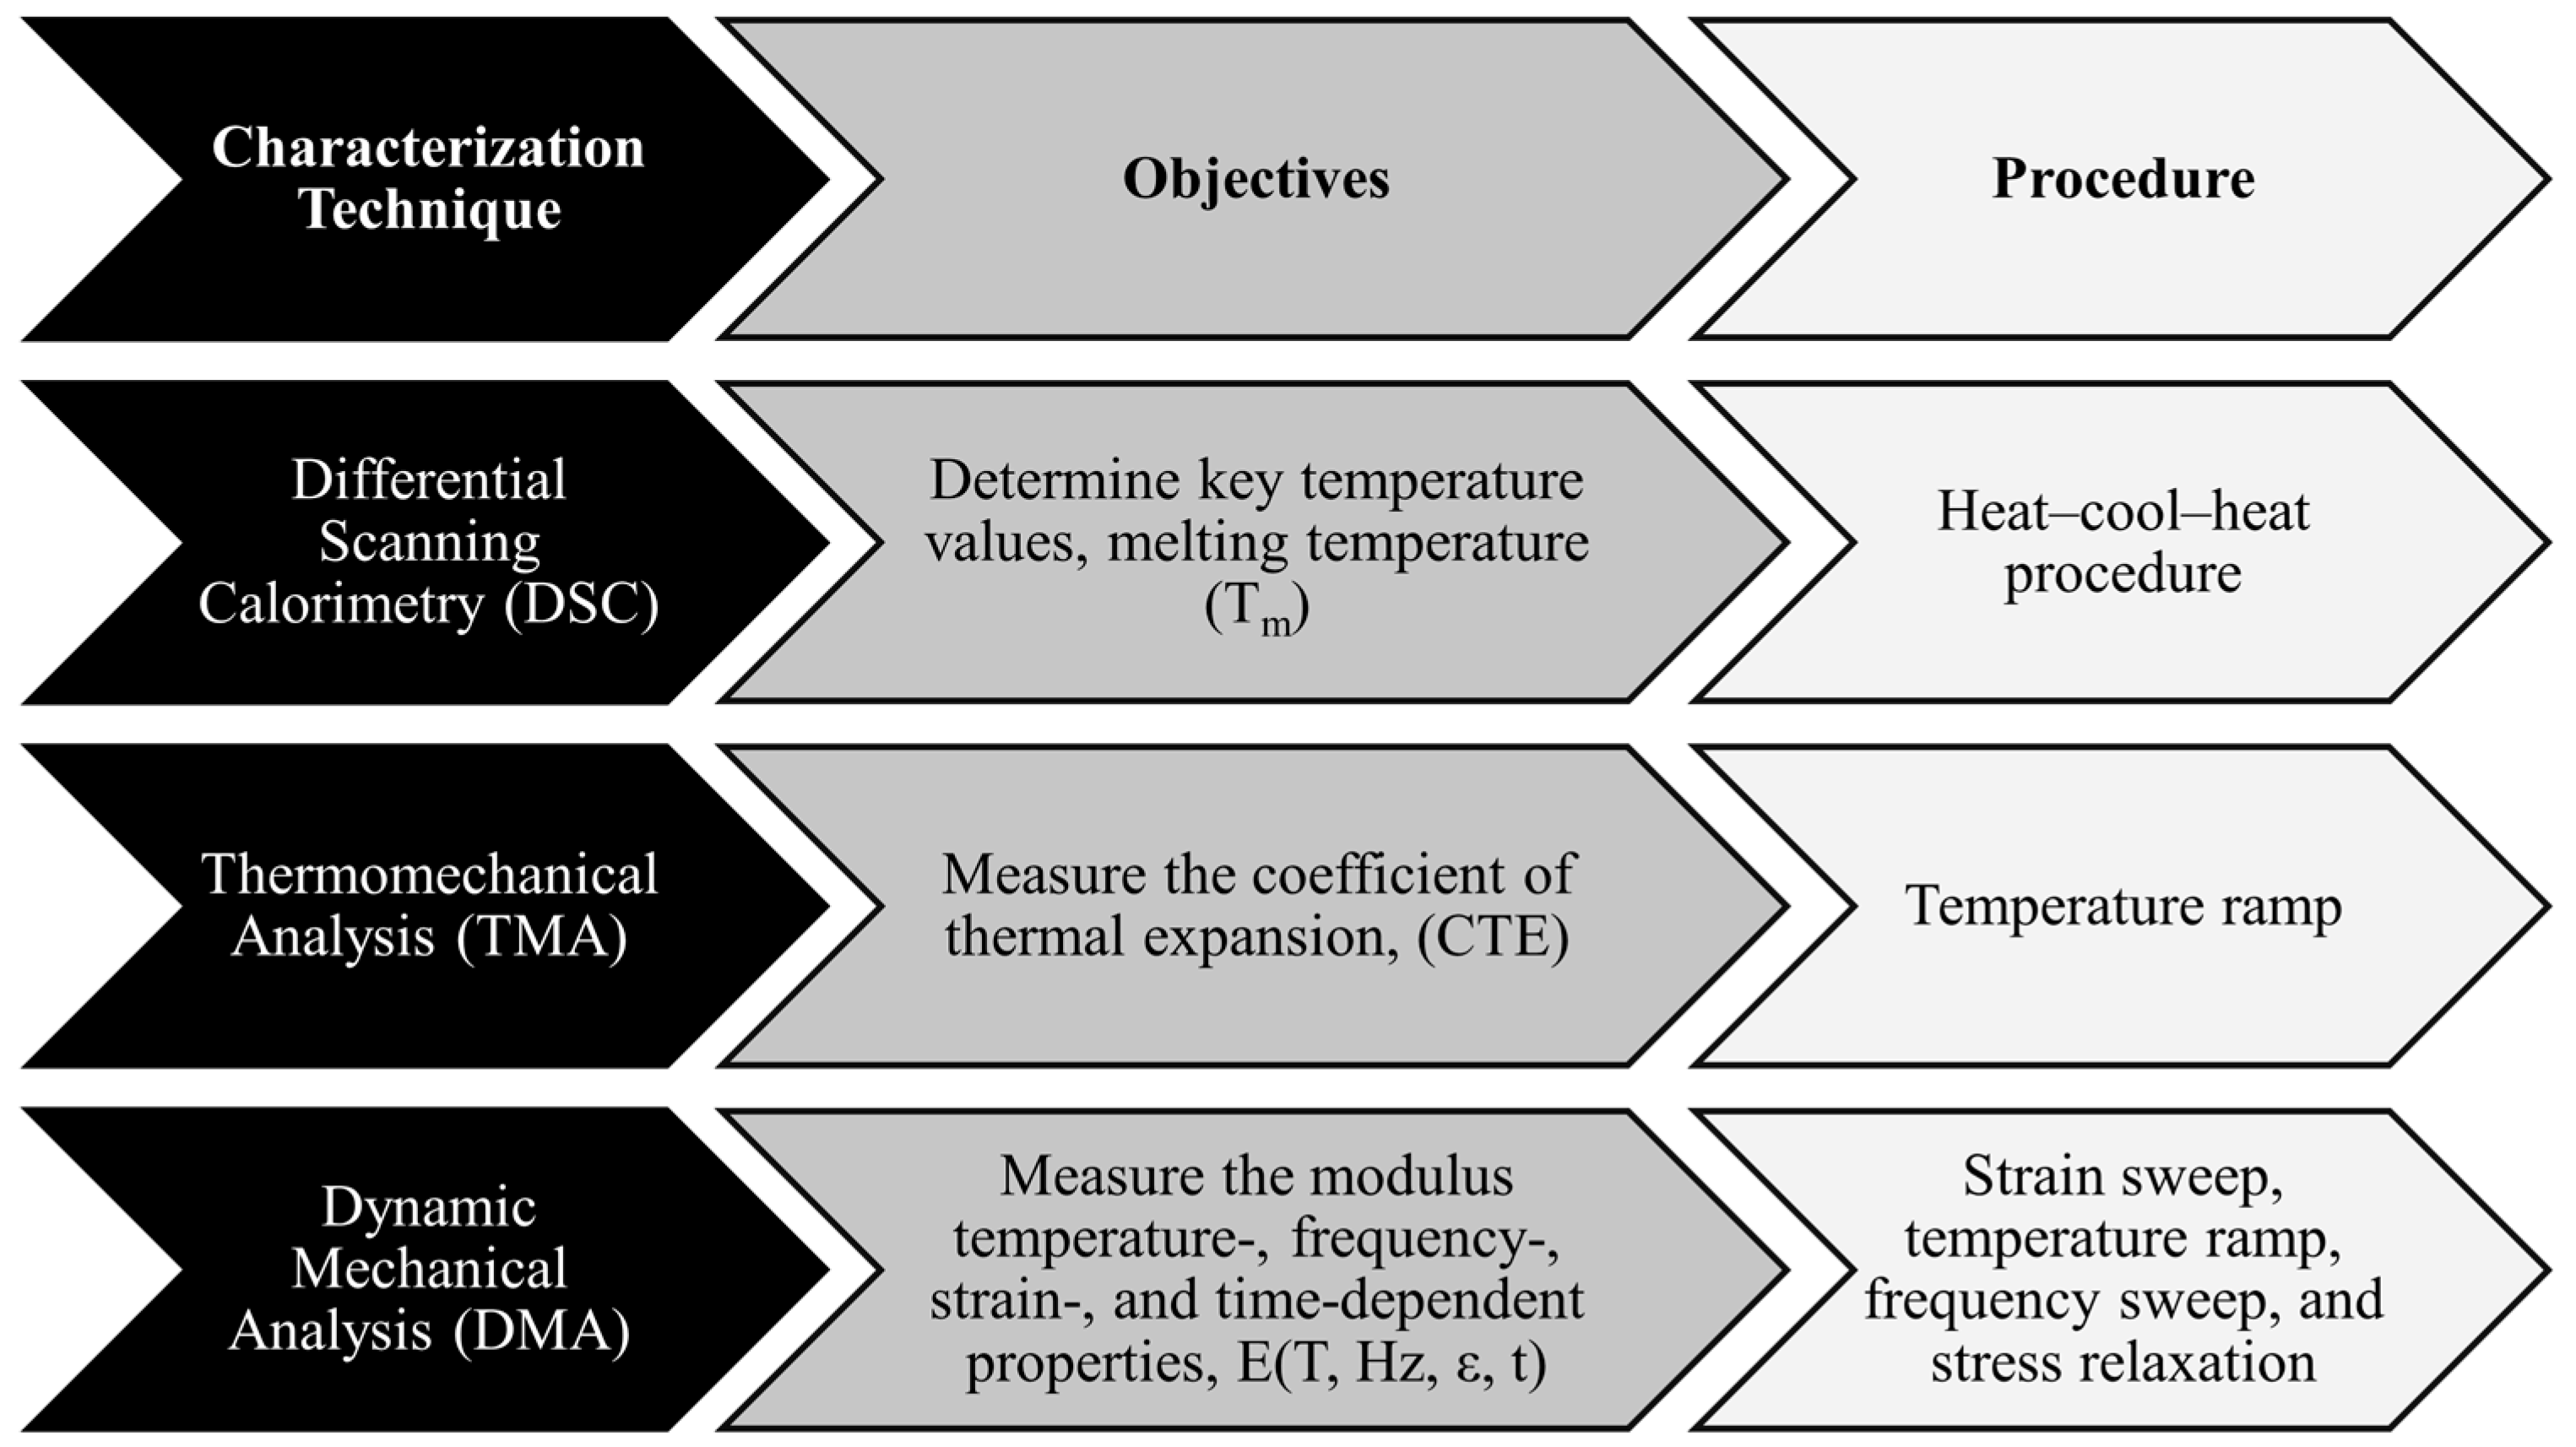
Figure 2.
Schematic of DMA specimen orientation. The lines correspond to the fiber direction.
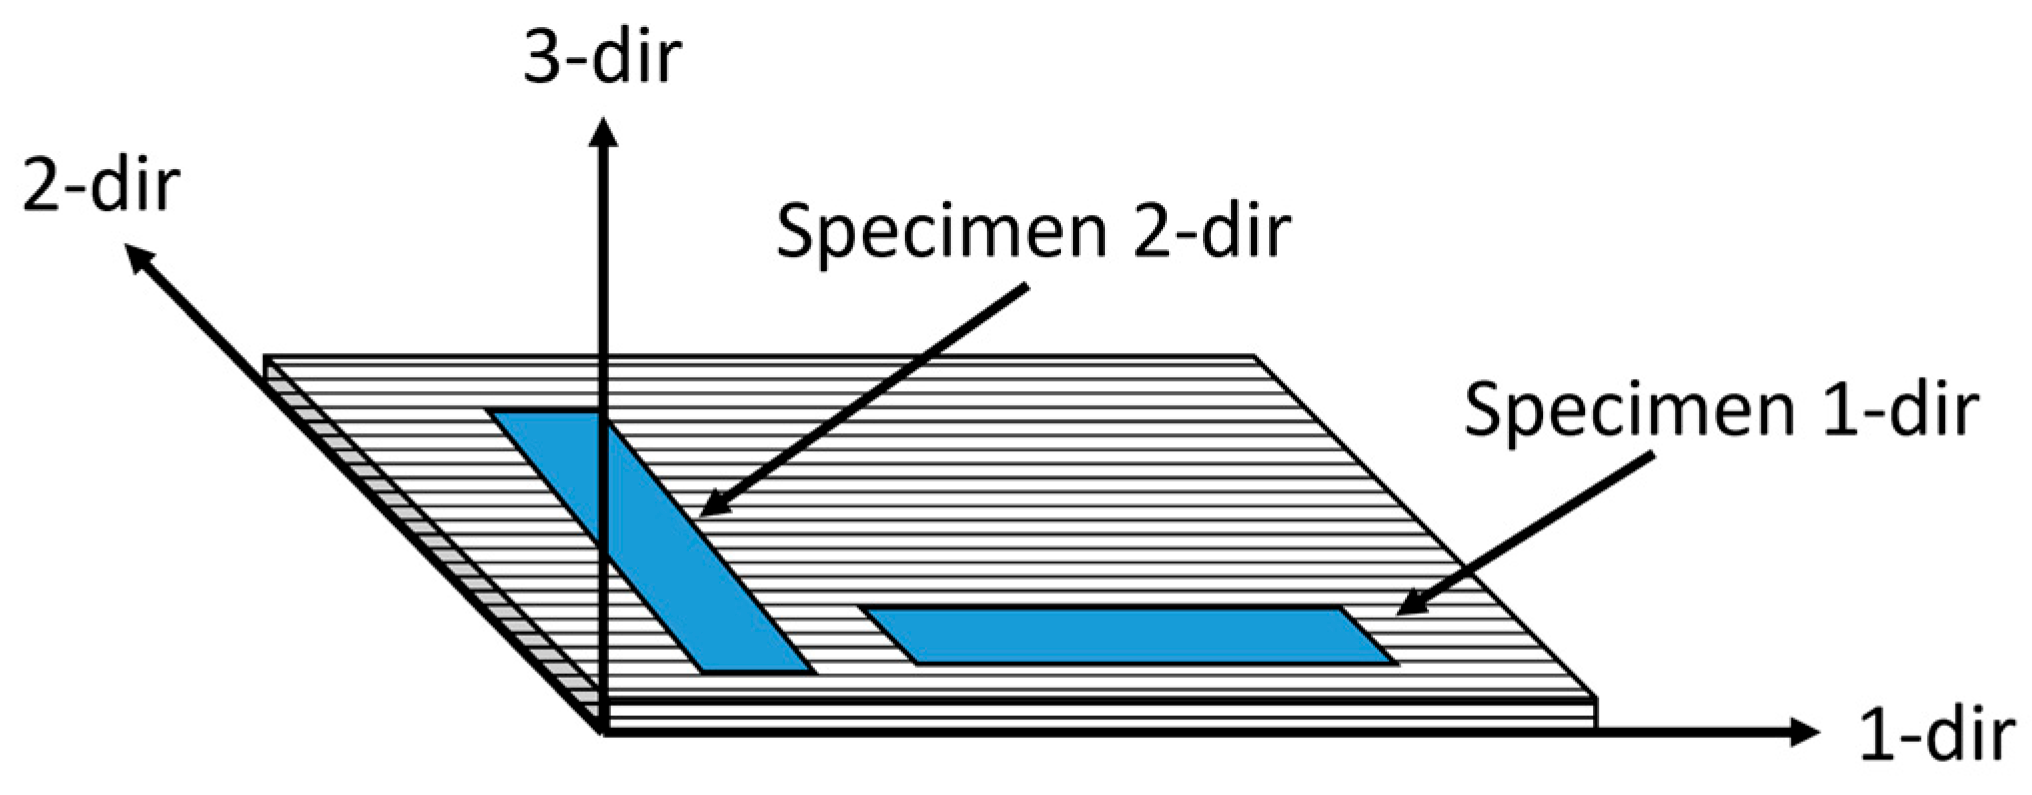
Figure 3.
DSC results of (a) the first heating cycle, (b) the cooling cycle, and (c) the second heating cycle. Each line style represents one specimen tested.
Figure 3.
DSC results of (a) the first heating cycle, (b) the cooling cycle, and (c) the second heating cycle. Each line style represents one specimen tested.
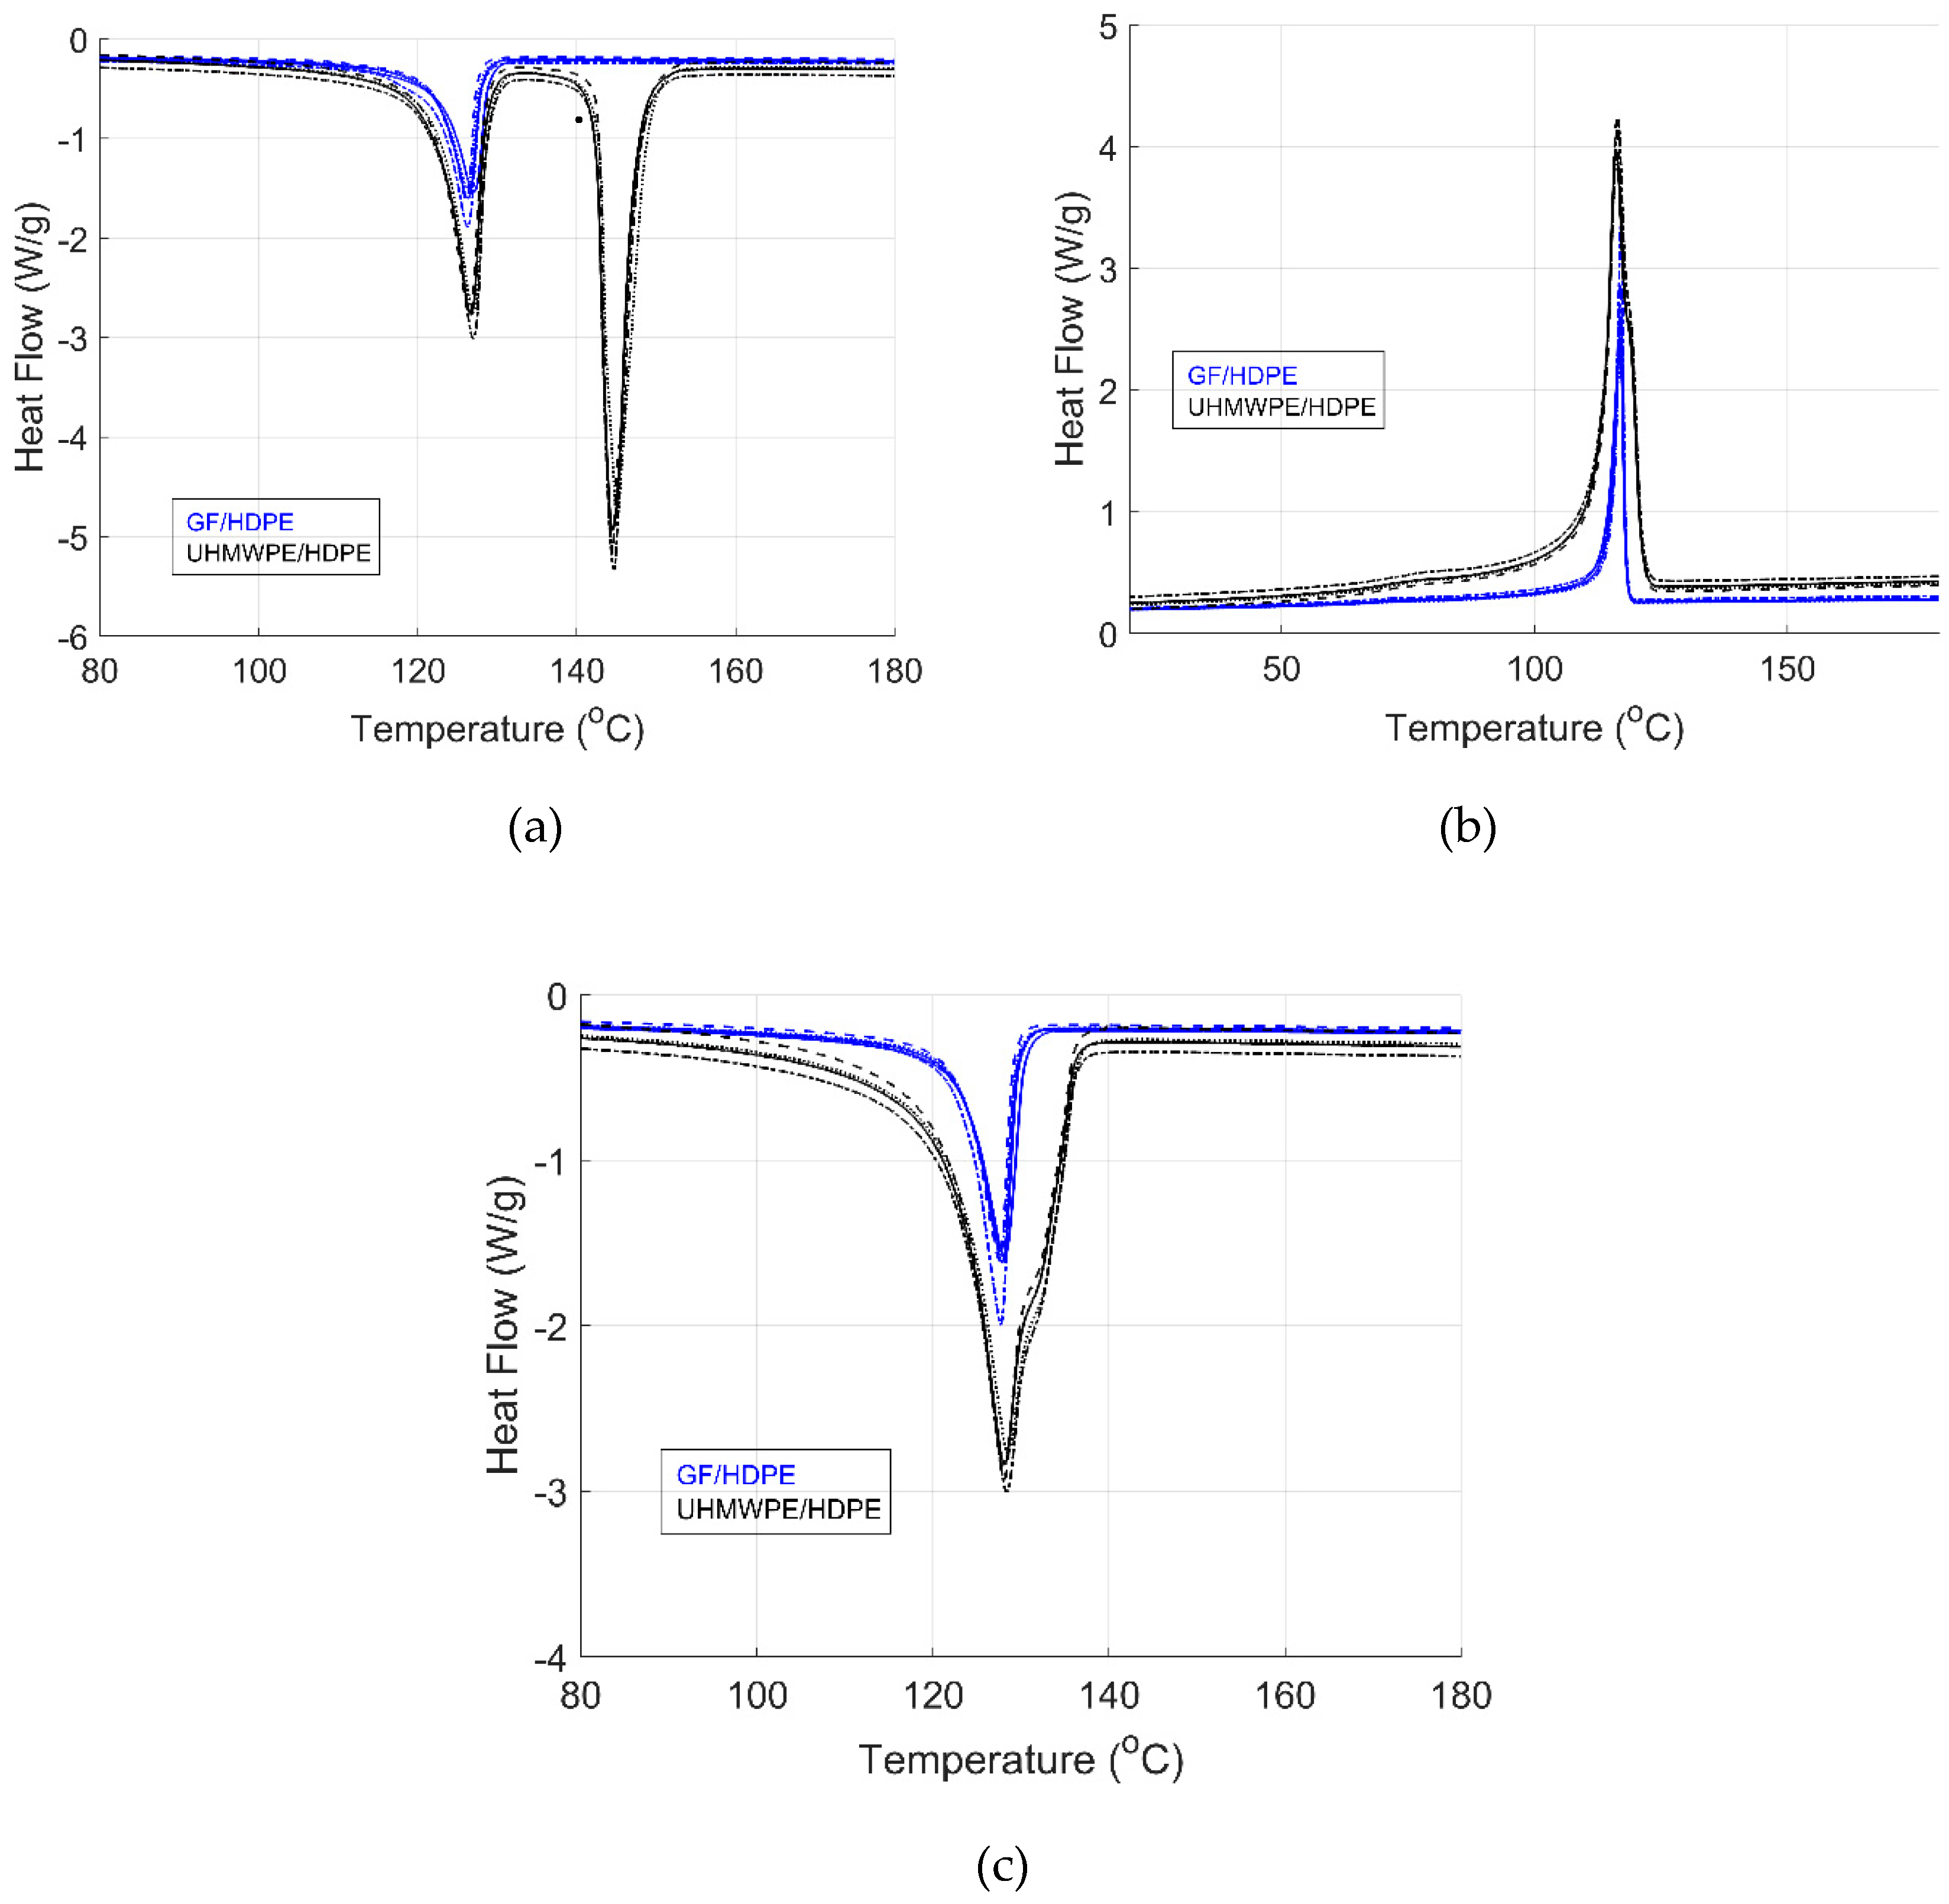
Figure 4.
UHMWPE/HDPE DSC results for (a) raw material and (b) consolidated panel. Each line style represents one specimen tested.
Figure 4.
UHMWPE/HDPE DSC results for (a) raw material and (b) consolidated panel. Each line style represents one specimen tested.
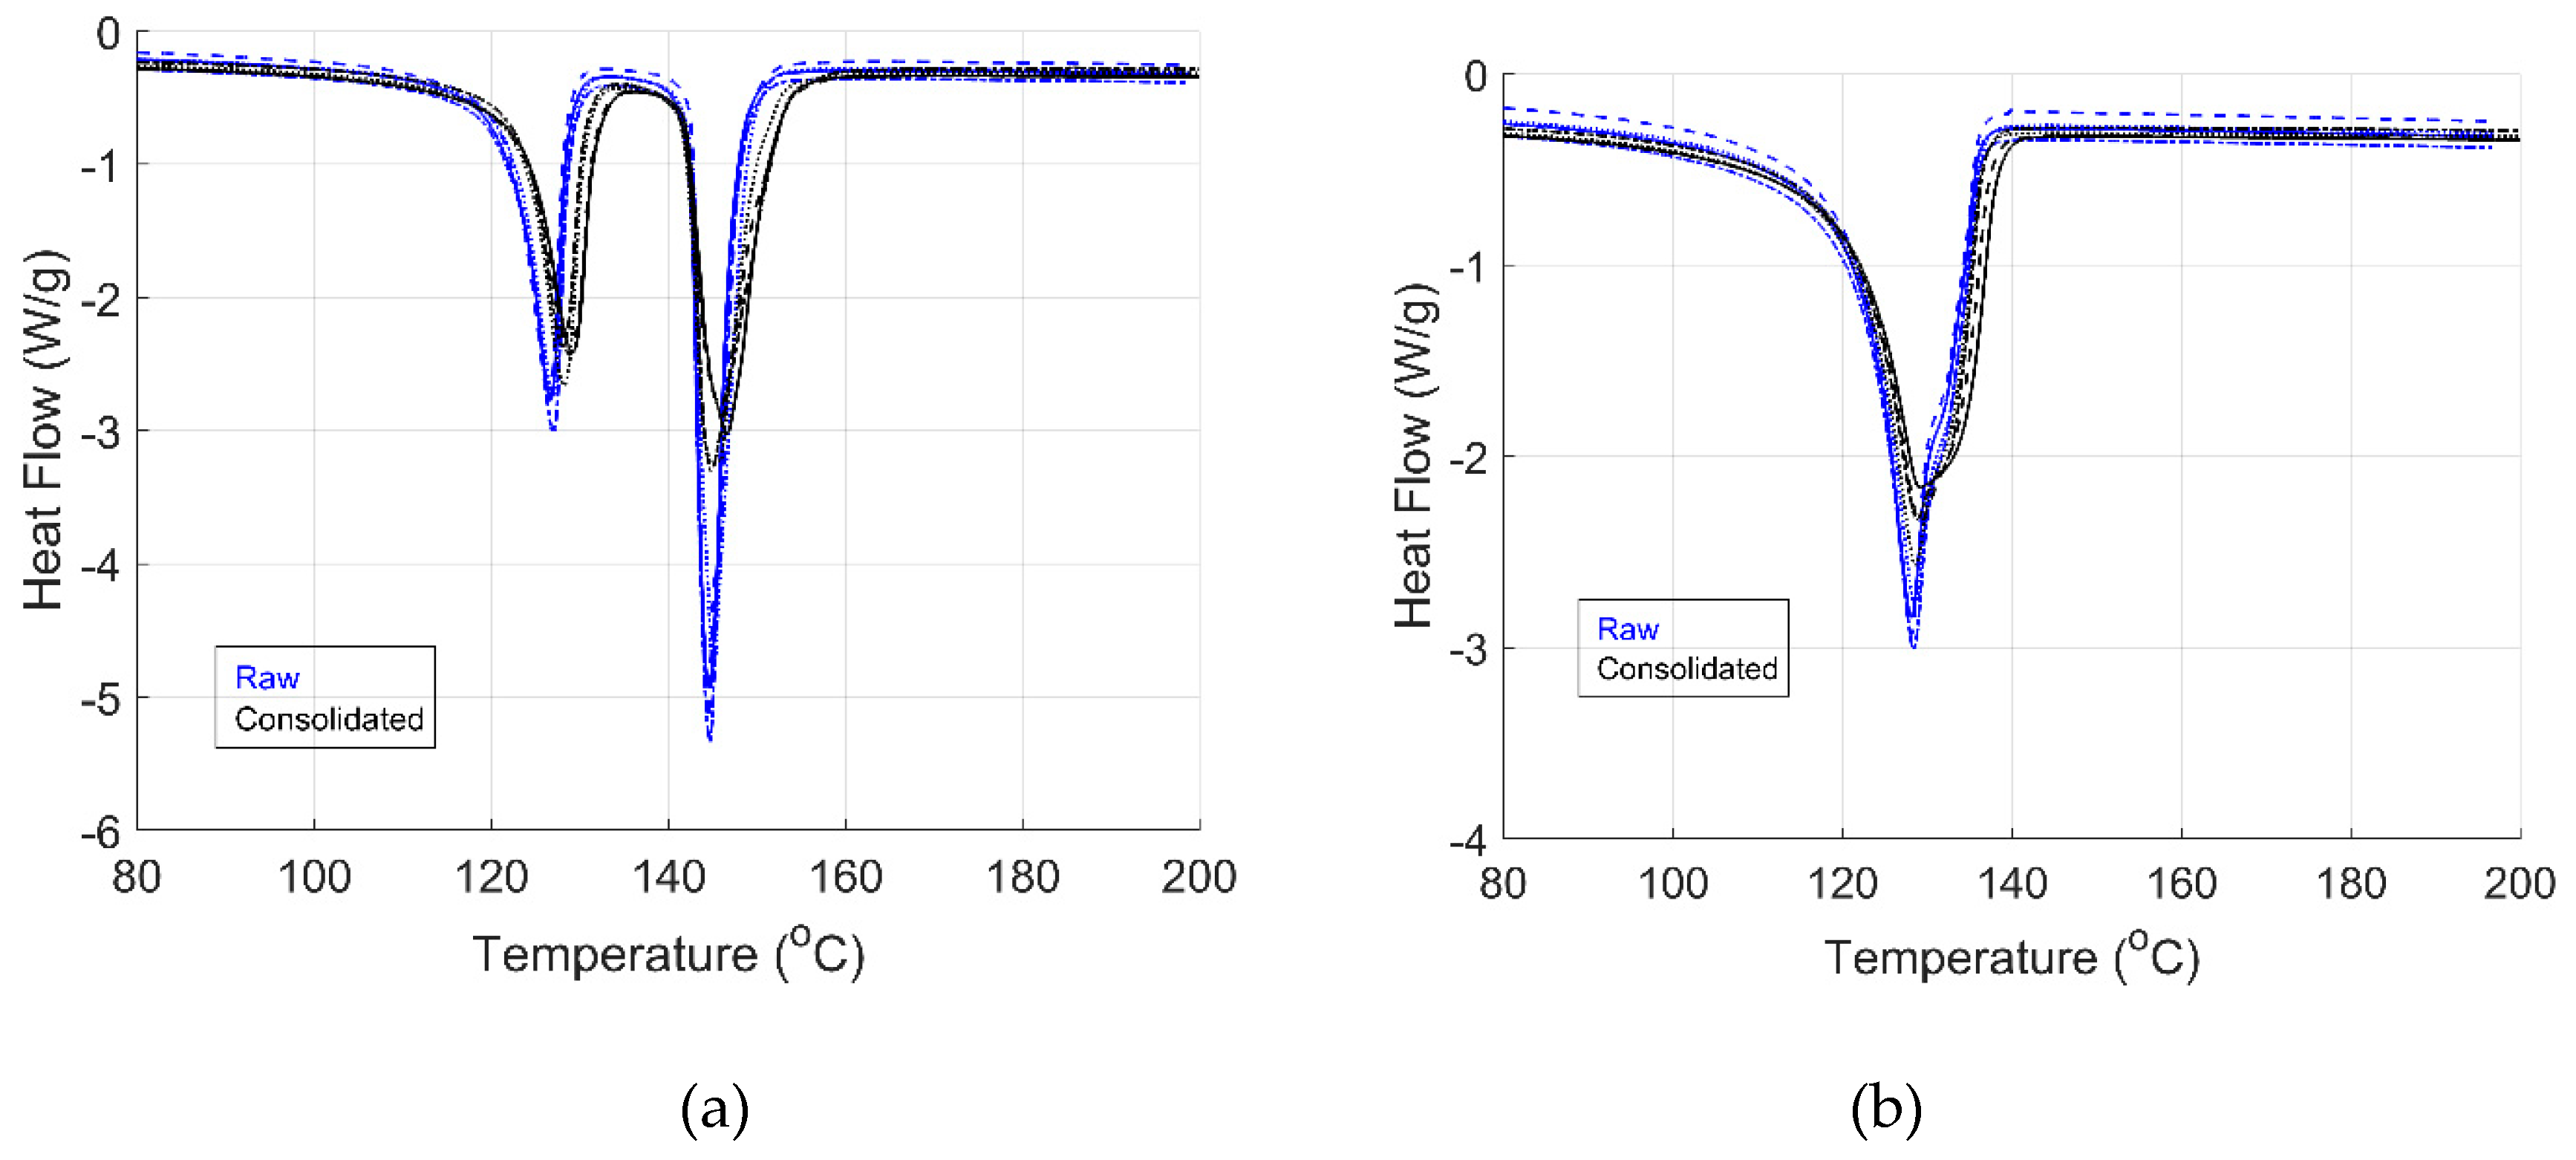
Figure 5.
Strain as a function of temperature for (a) GF/HDPE and (b) UHMWPE/HDPE material. Each line style represents one specimen tested.
Figure 5.
Strain as a function of temperature for (a) GF/HDPE and (b) UHMWPE/HDPE material. Each line style represents one specimen tested.
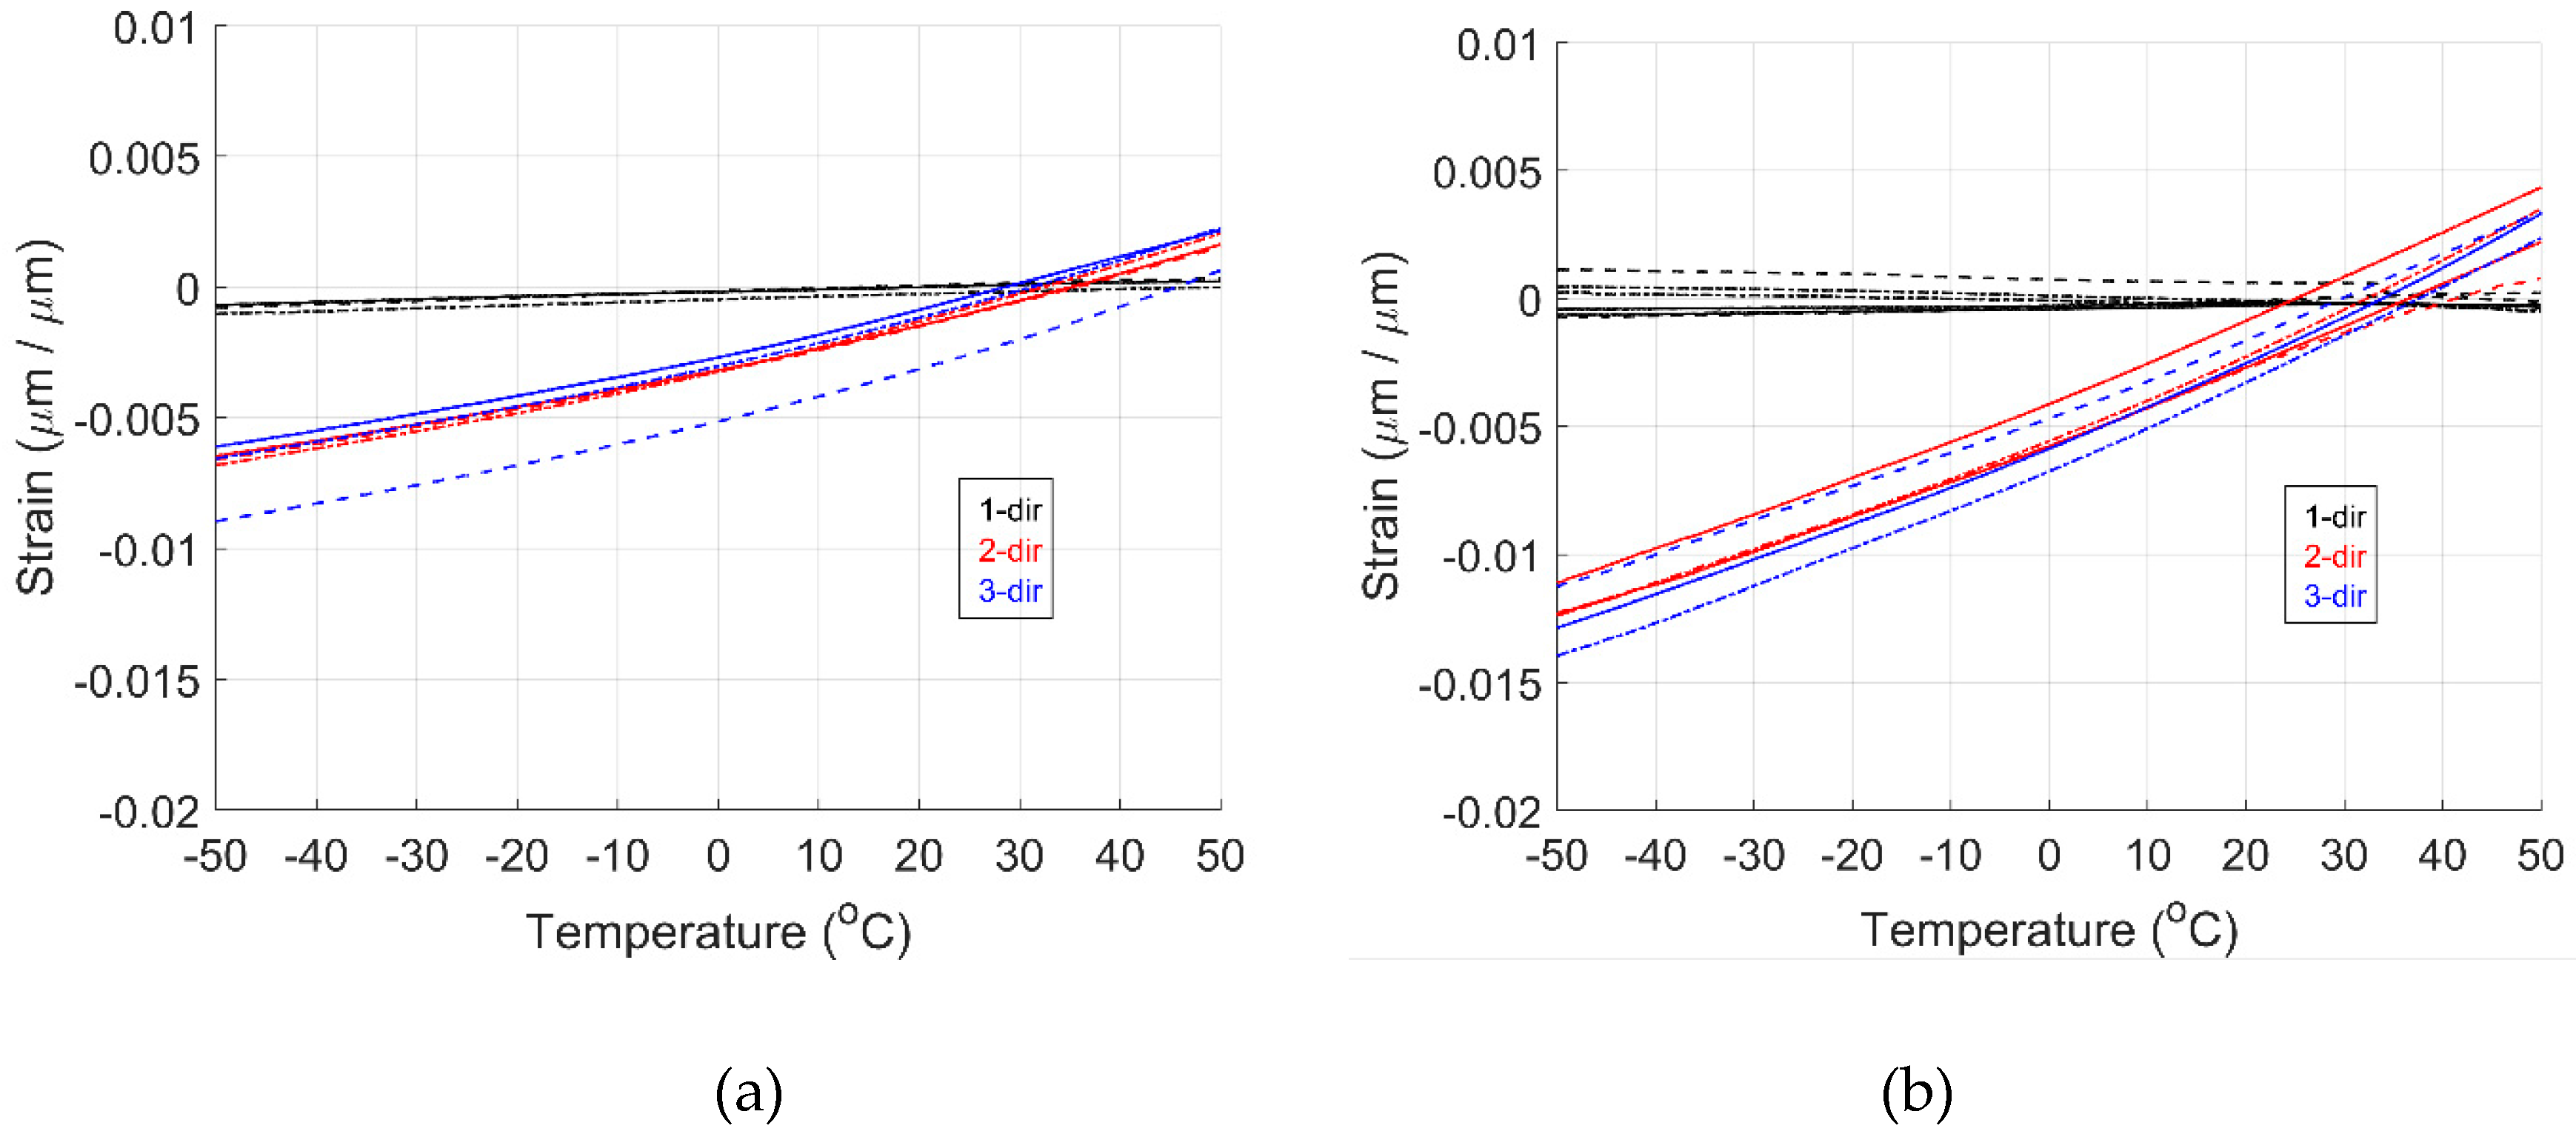
Figure 6.
Strain sweep results in the 1-dir for (a) GF/HDPE and (b) UHMWPE/HDPE. Each line style represents one specimen tested.
Figure 6.
Strain sweep results in the 1-dir for (a) GF/HDPE and (b) UHMWPE/HDPE. Each line style represents one specimen tested.
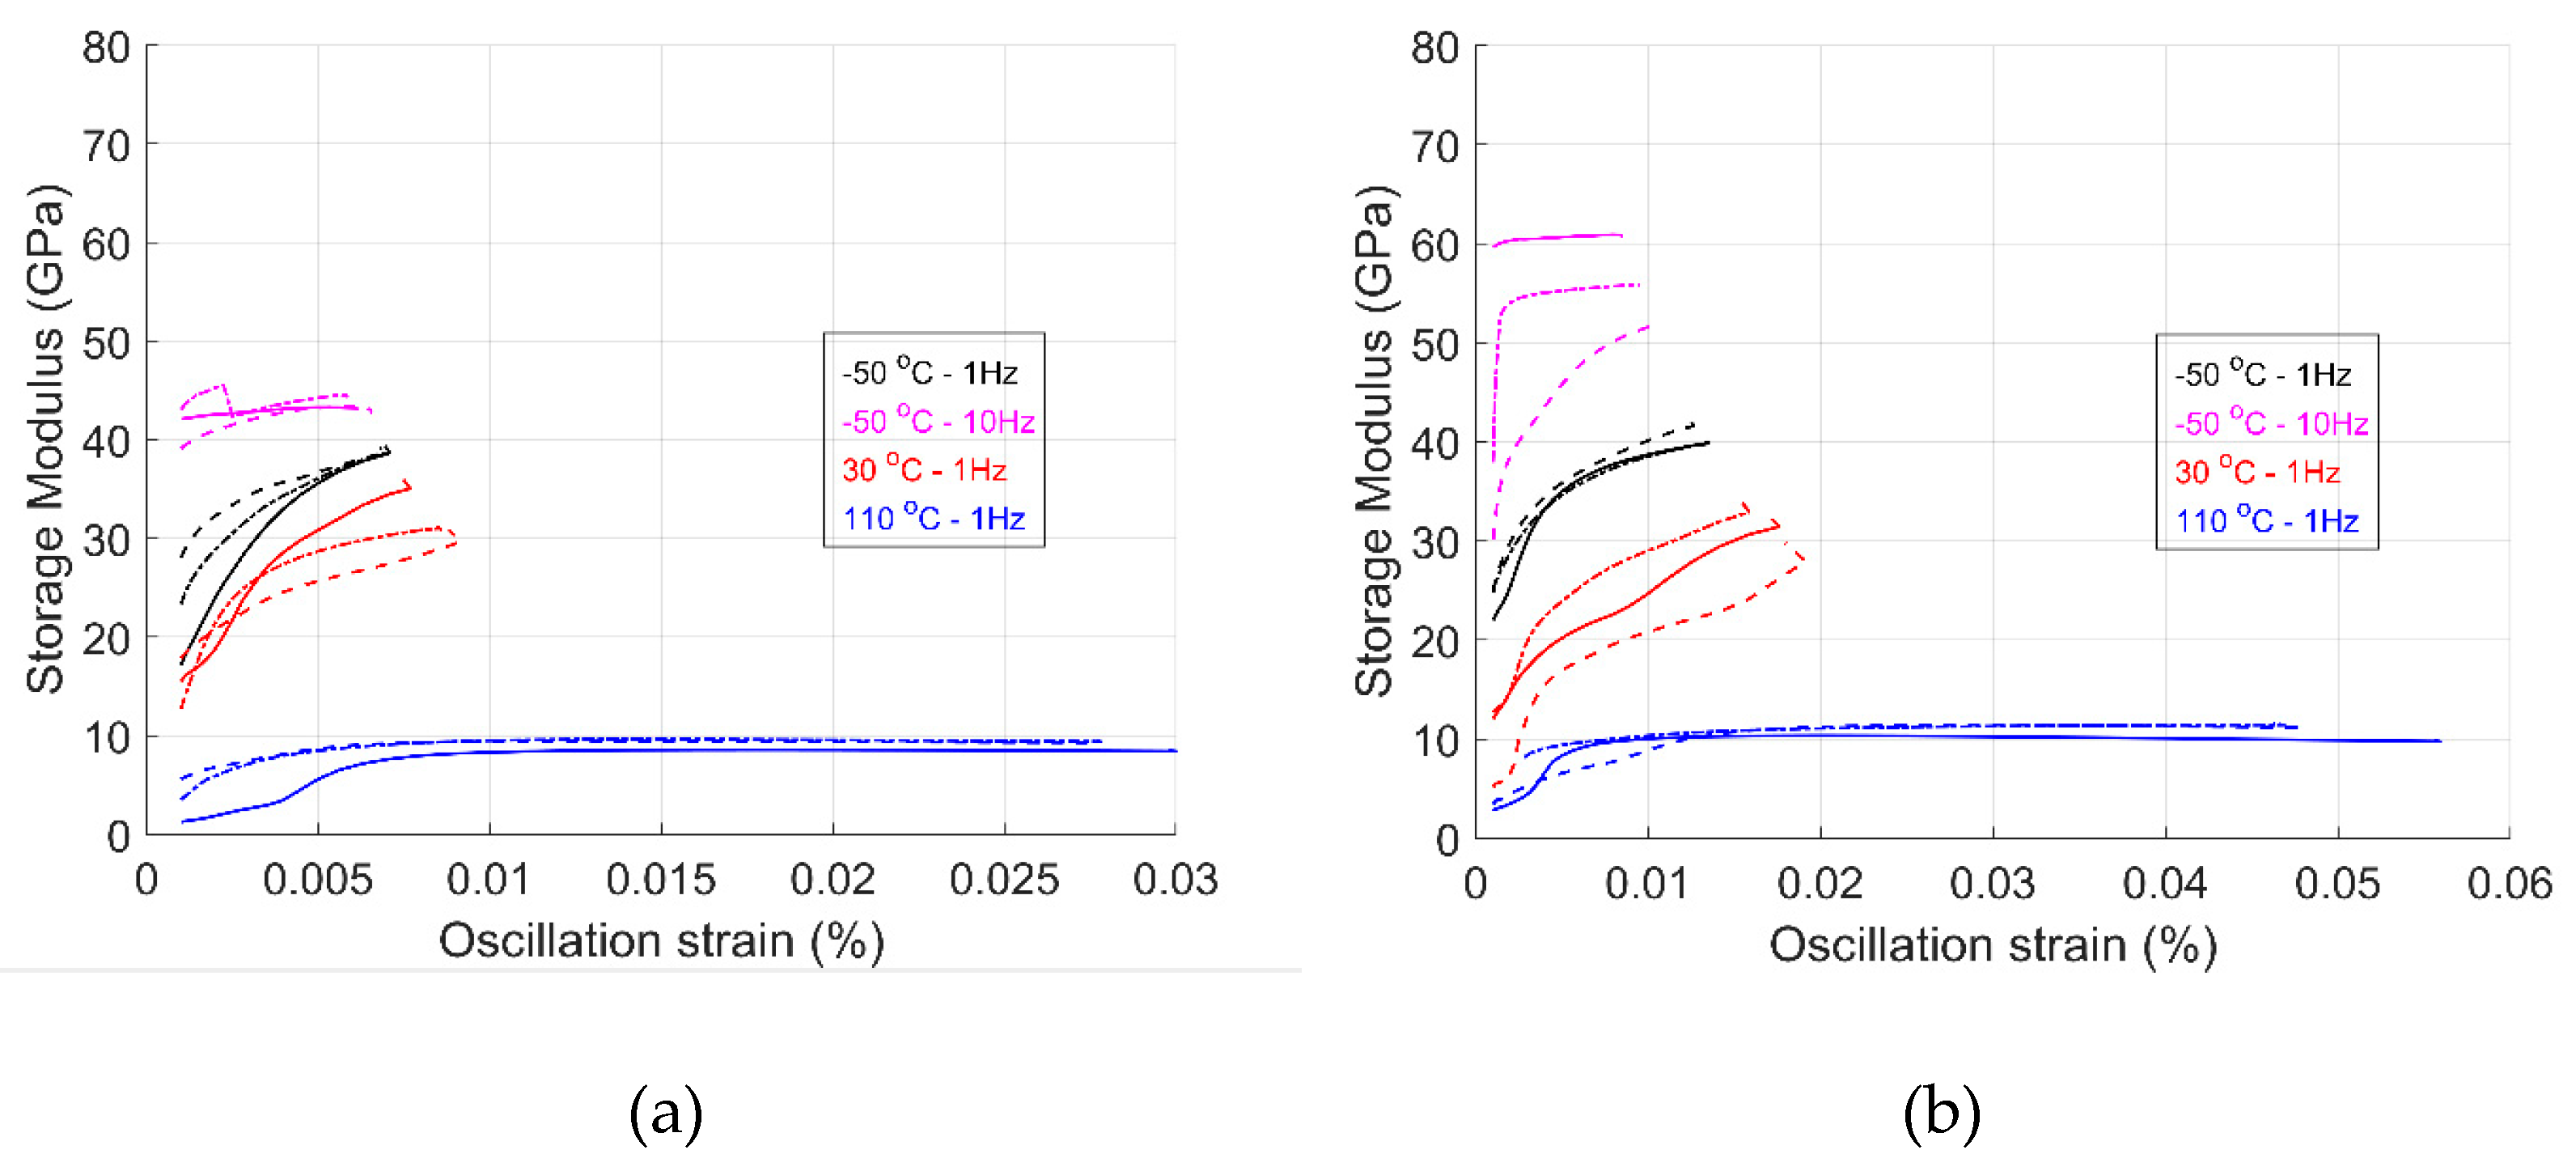
Figure 7.
Strain sweep results in the 2-dir for (a) GF/HDPE and (b) UHMWPE/HDPE. Each line style represents one specimen tested.
Figure 7.
Strain sweep results in the 2-dir for (a) GF/HDPE and (b) UHMWPE/HDPE. Each line style represents one specimen tested.
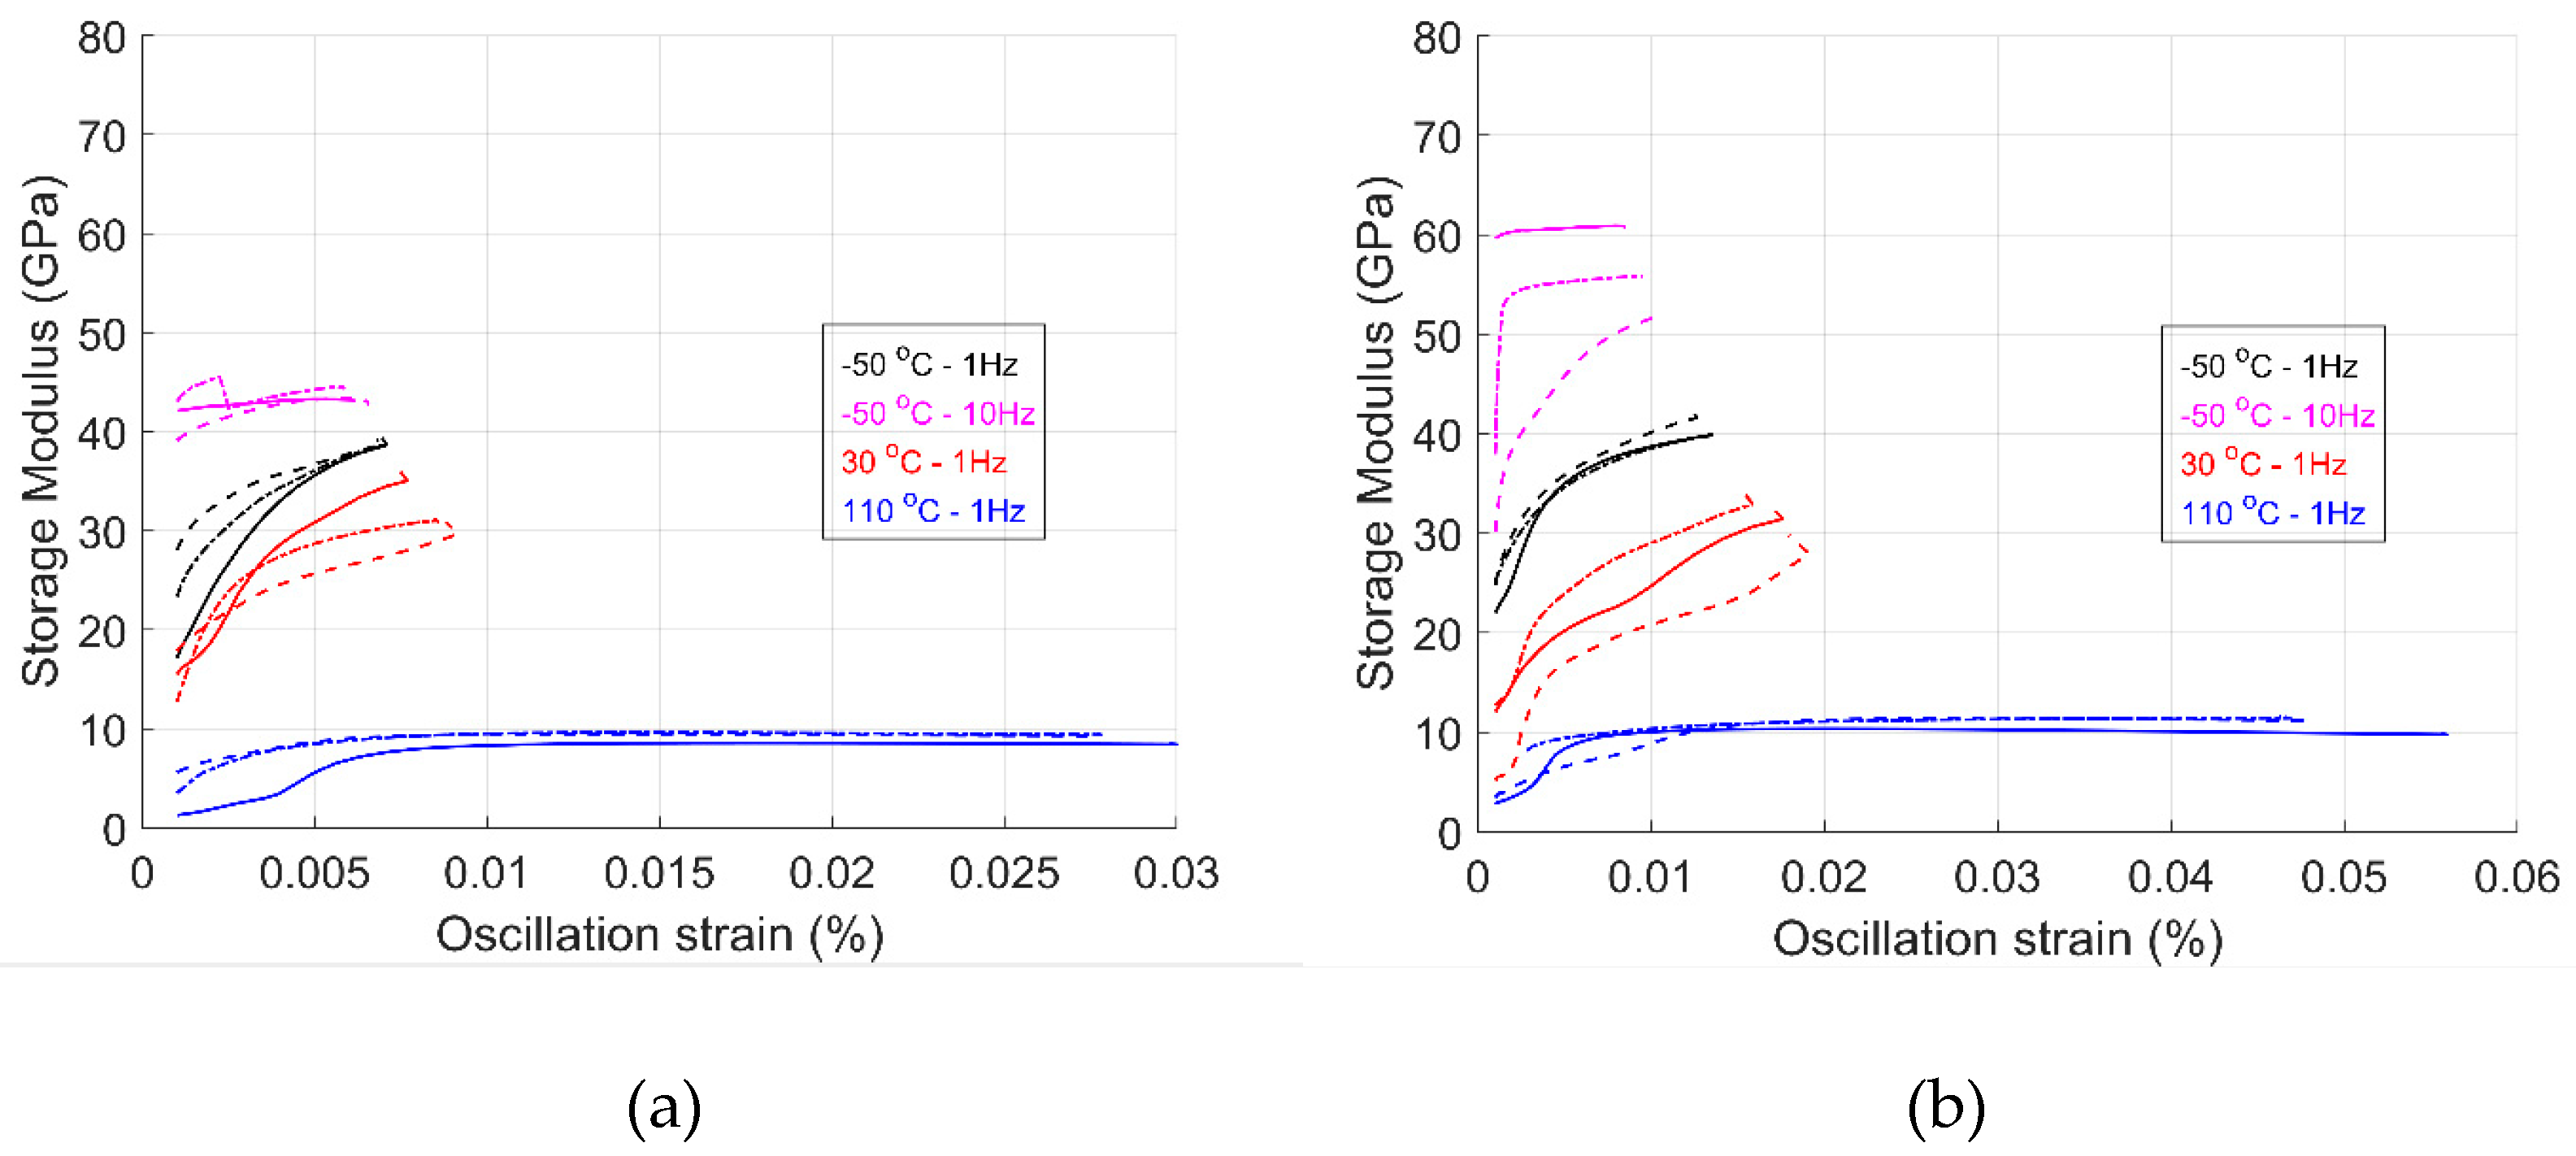
Figure 8.
Storage modulus as a function of temperature for GF/HDPE, UHMWPE/HDPE in the (a) 1-dir and (b) 2-dir. Each line style represents one specimen tested.
Figure 8.
Storage modulus as a function of temperature for GF/HDPE, UHMWPE/HDPE in the (a) 1-dir and (b) 2-dir. Each line style represents one specimen tested.
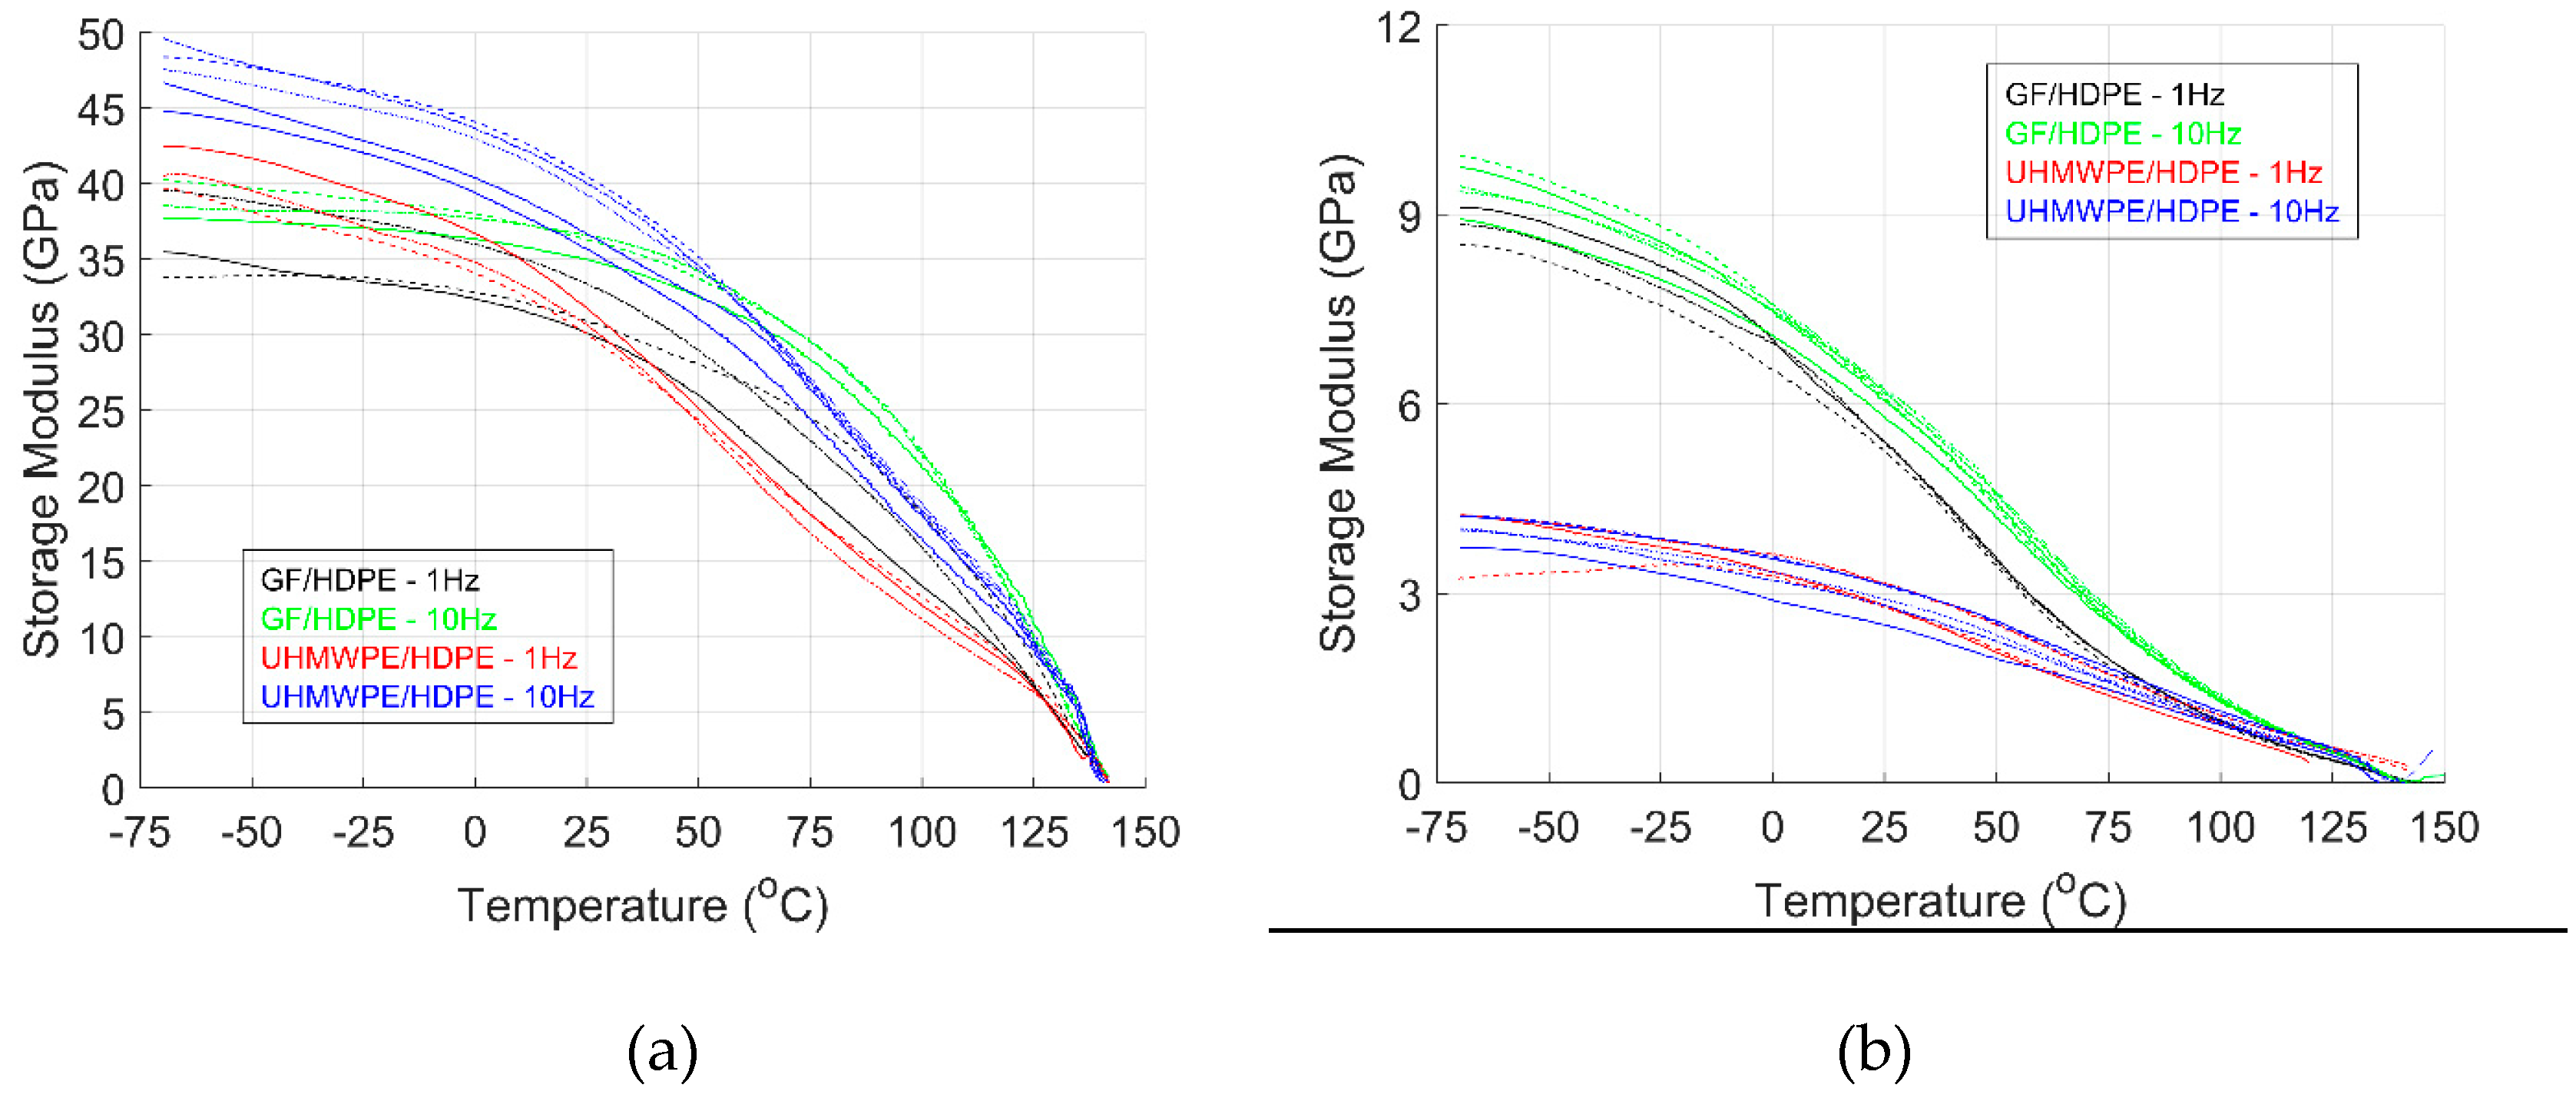
Figure 9.
Storage modulus as a function of frequency for GF/HDPE in (a) 1-dir and (b) 2-dir. Each line style represents one specimen tested.
Figure 9.
Storage modulus as a function of frequency for GF/HDPE in (a) 1-dir and (b) 2-dir. Each line style represents one specimen tested.
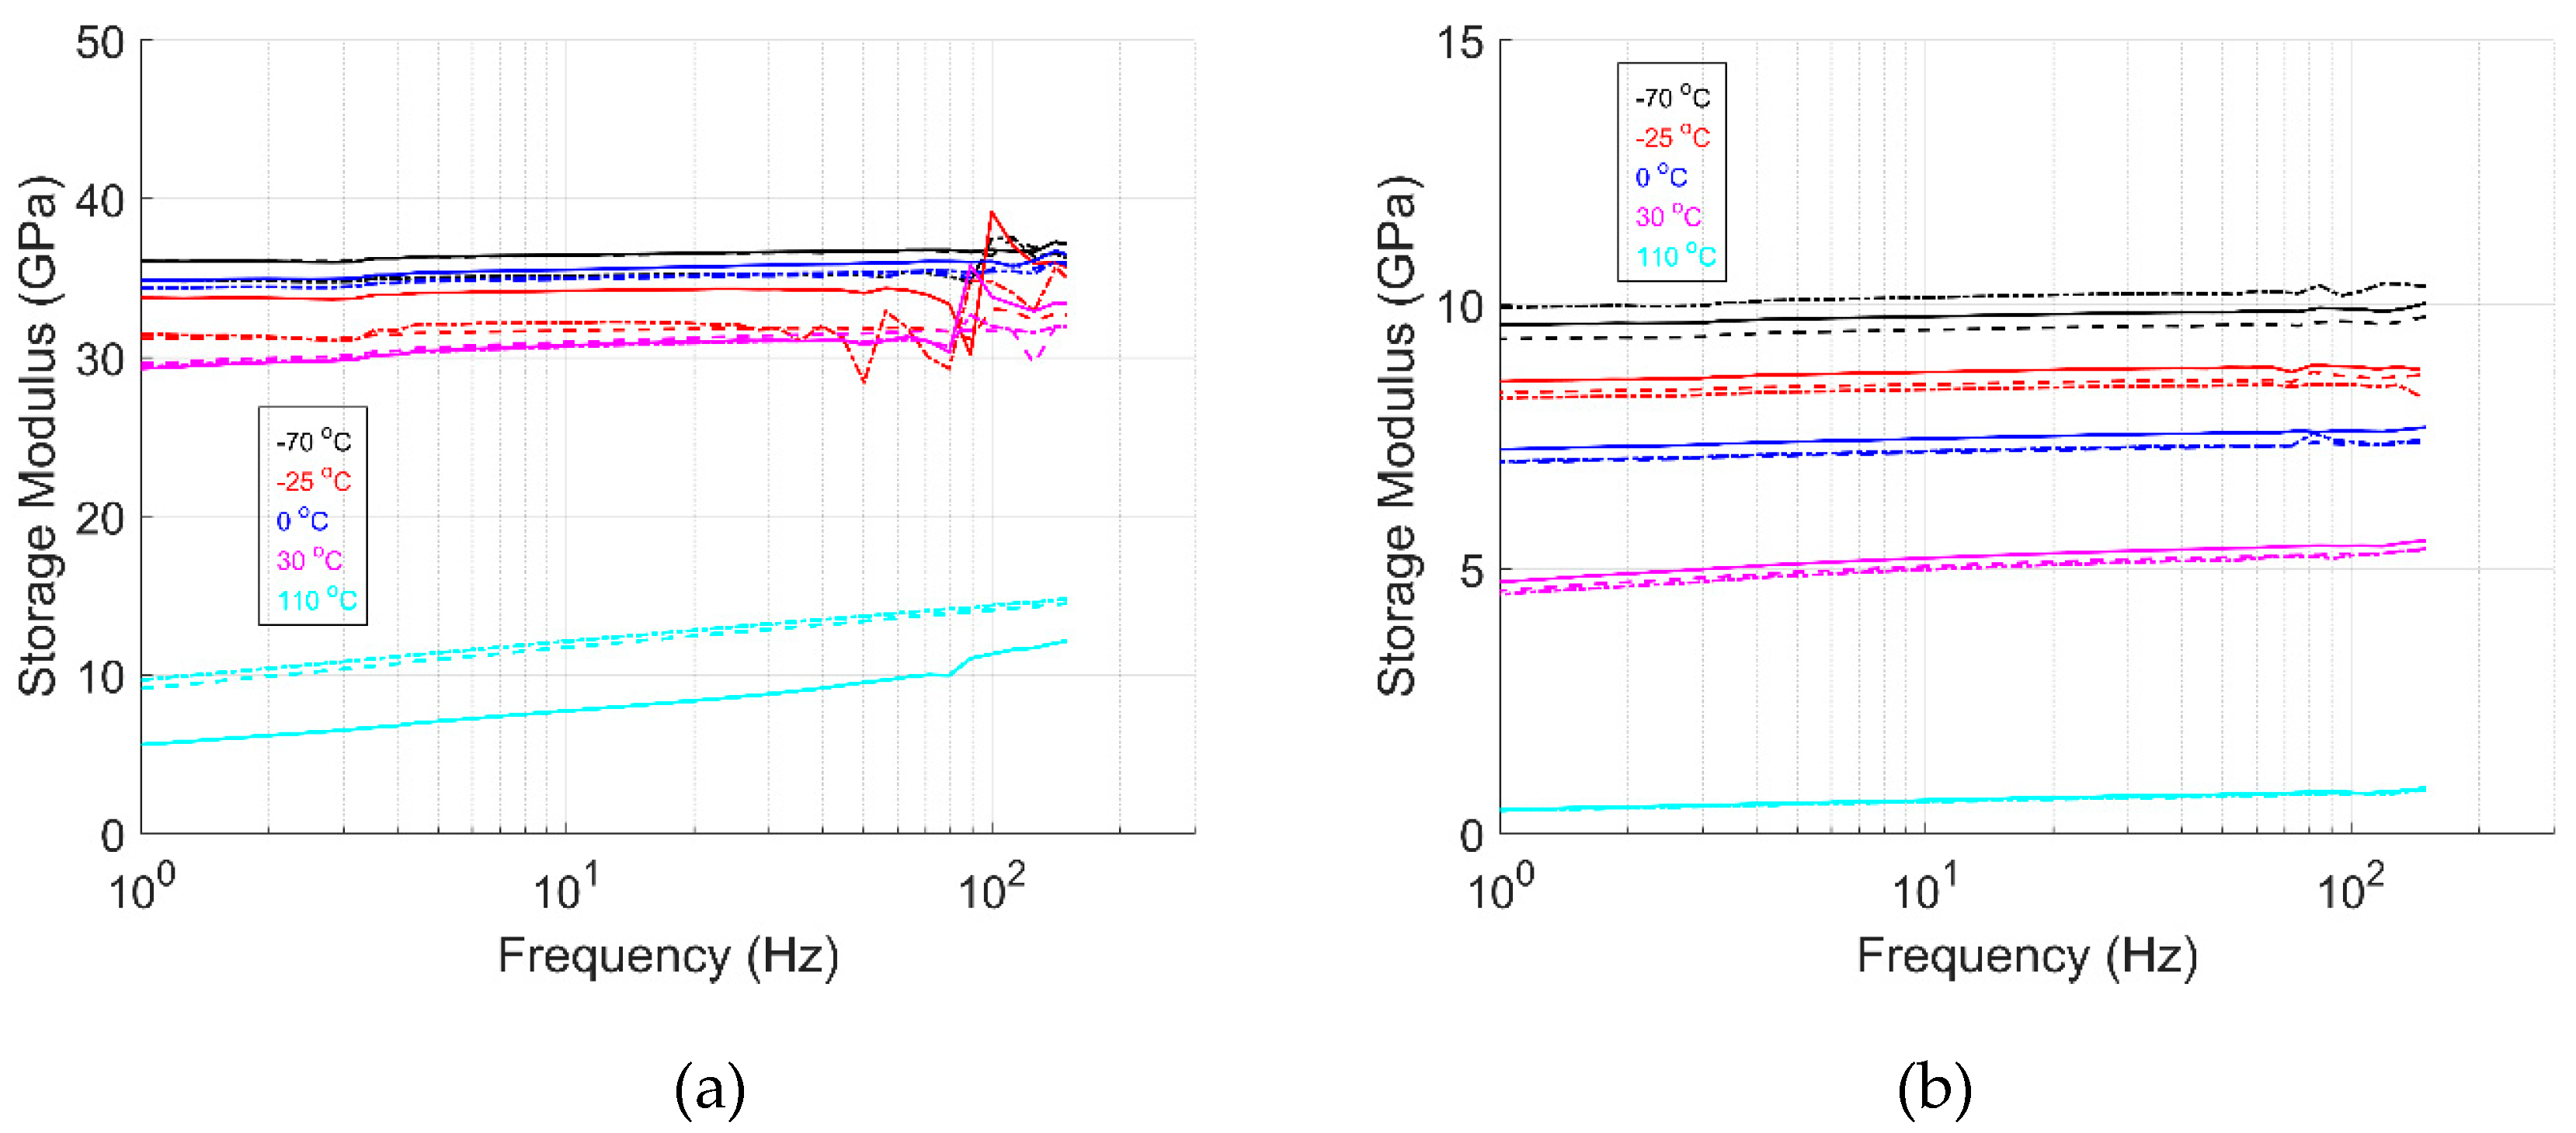
Figure 10.
Loss modulus as a function of frequency for GF/HDPE in (a) 1-dir and (b) 2-dir. Each line style represents one specimen tested.
Figure 10.
Loss modulus as a function of frequency for GF/HDPE in (a) 1-dir and (b) 2-dir. Each line style represents one specimen tested.
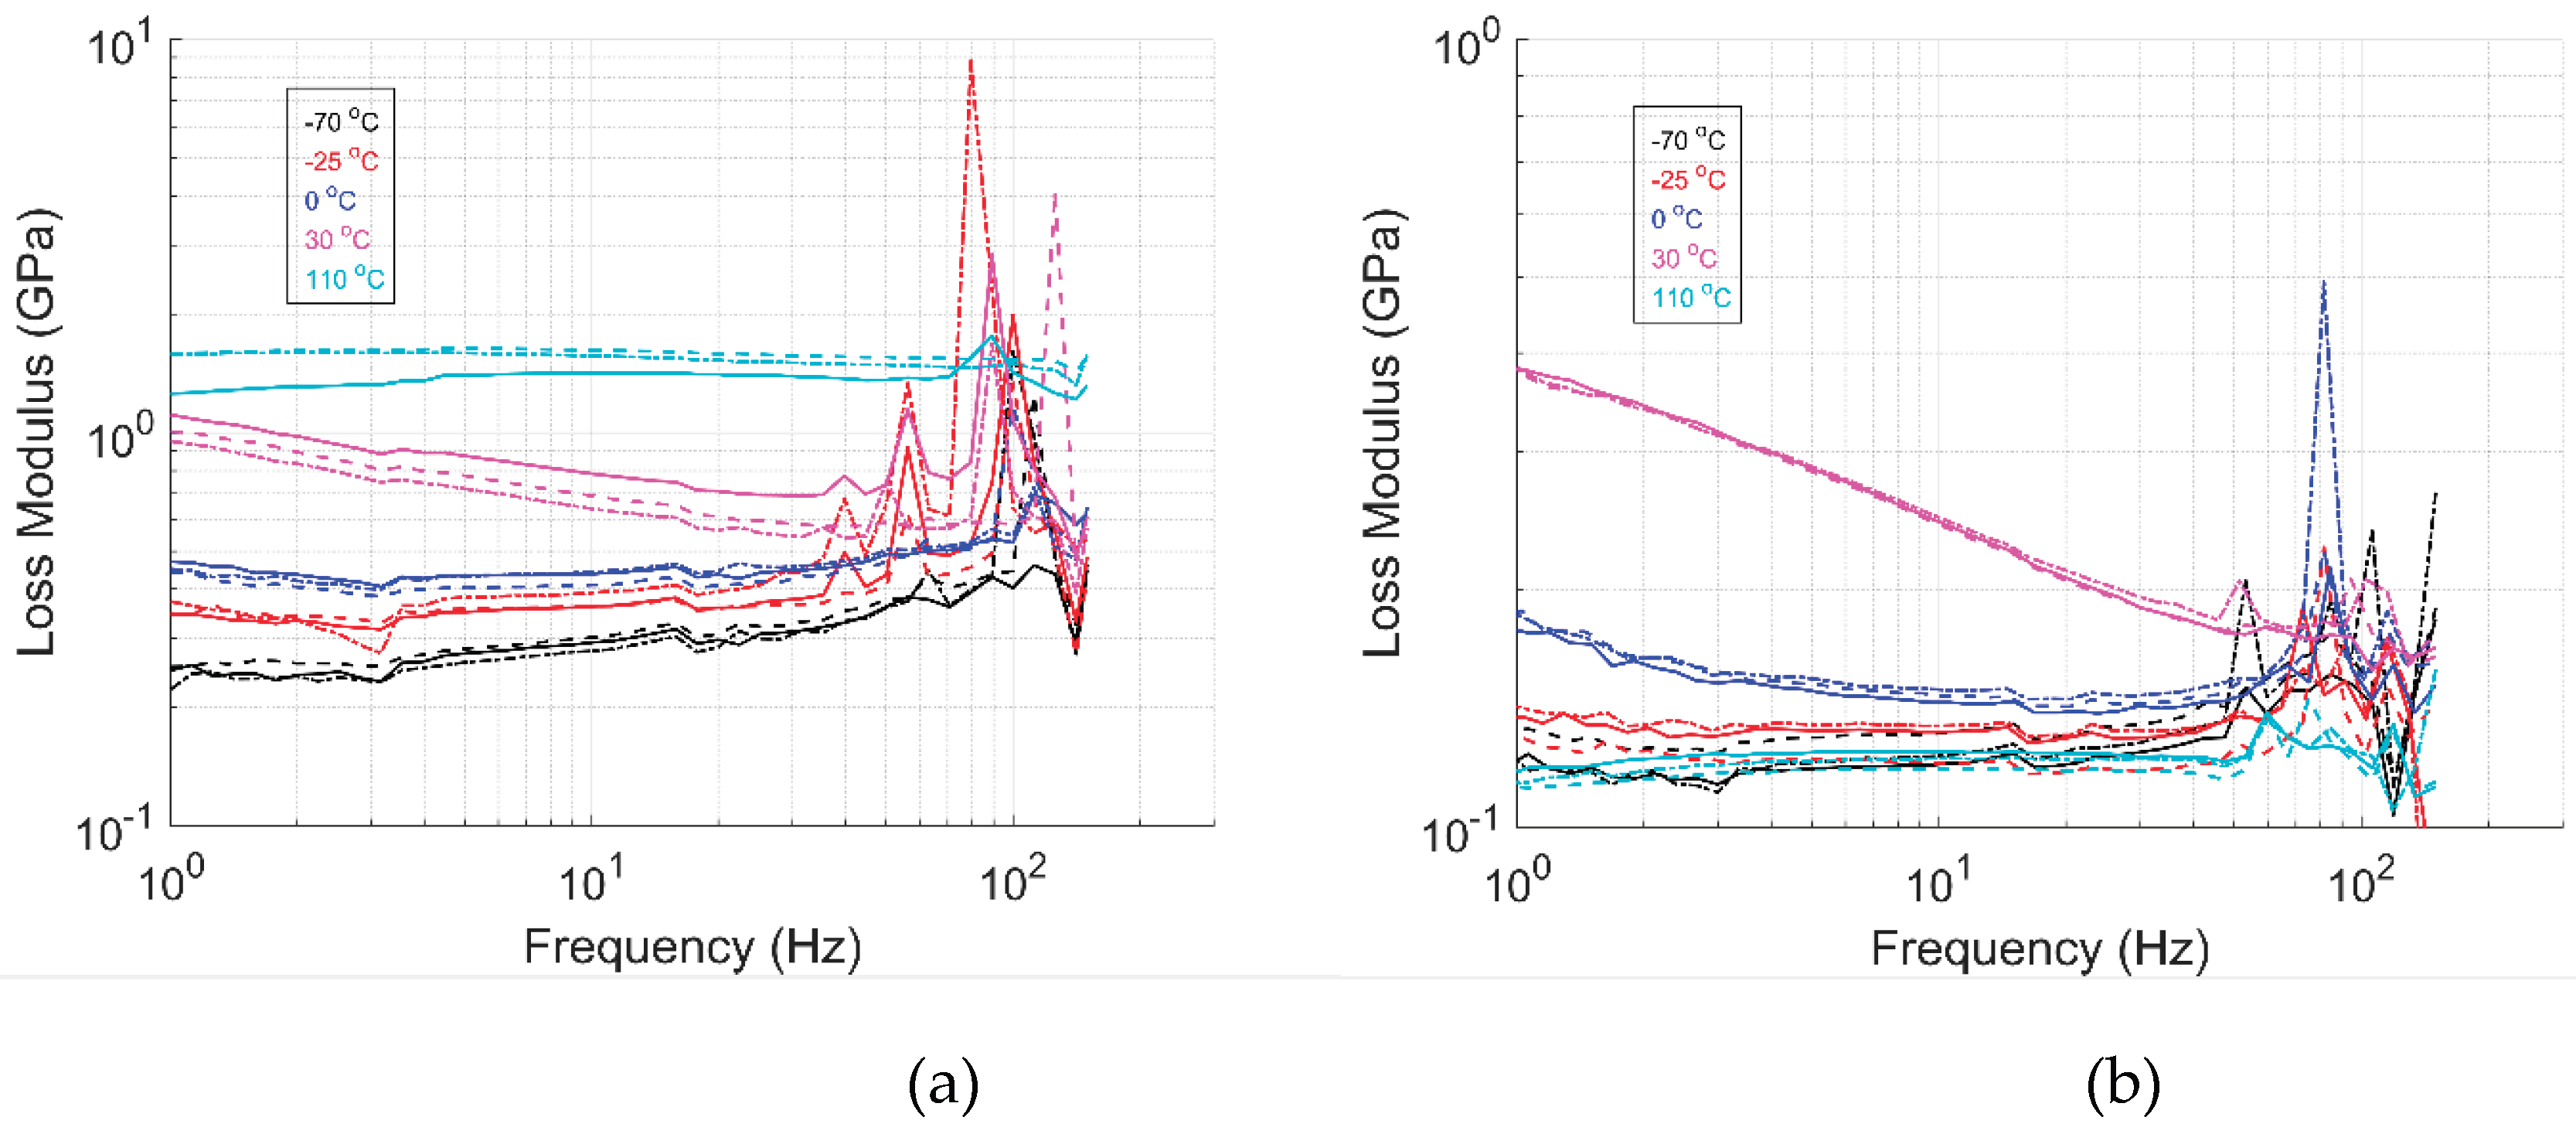
Figure 11.
Tanδ as a function of frequency for GF/HDPE in (a) 1-dir and (b) 2-dir. Each line style represents one specimen tested.
Figure 11.
Tanδ as a function of frequency for GF/HDPE in (a) 1-dir and (b) 2-dir. Each line style represents one specimen tested.
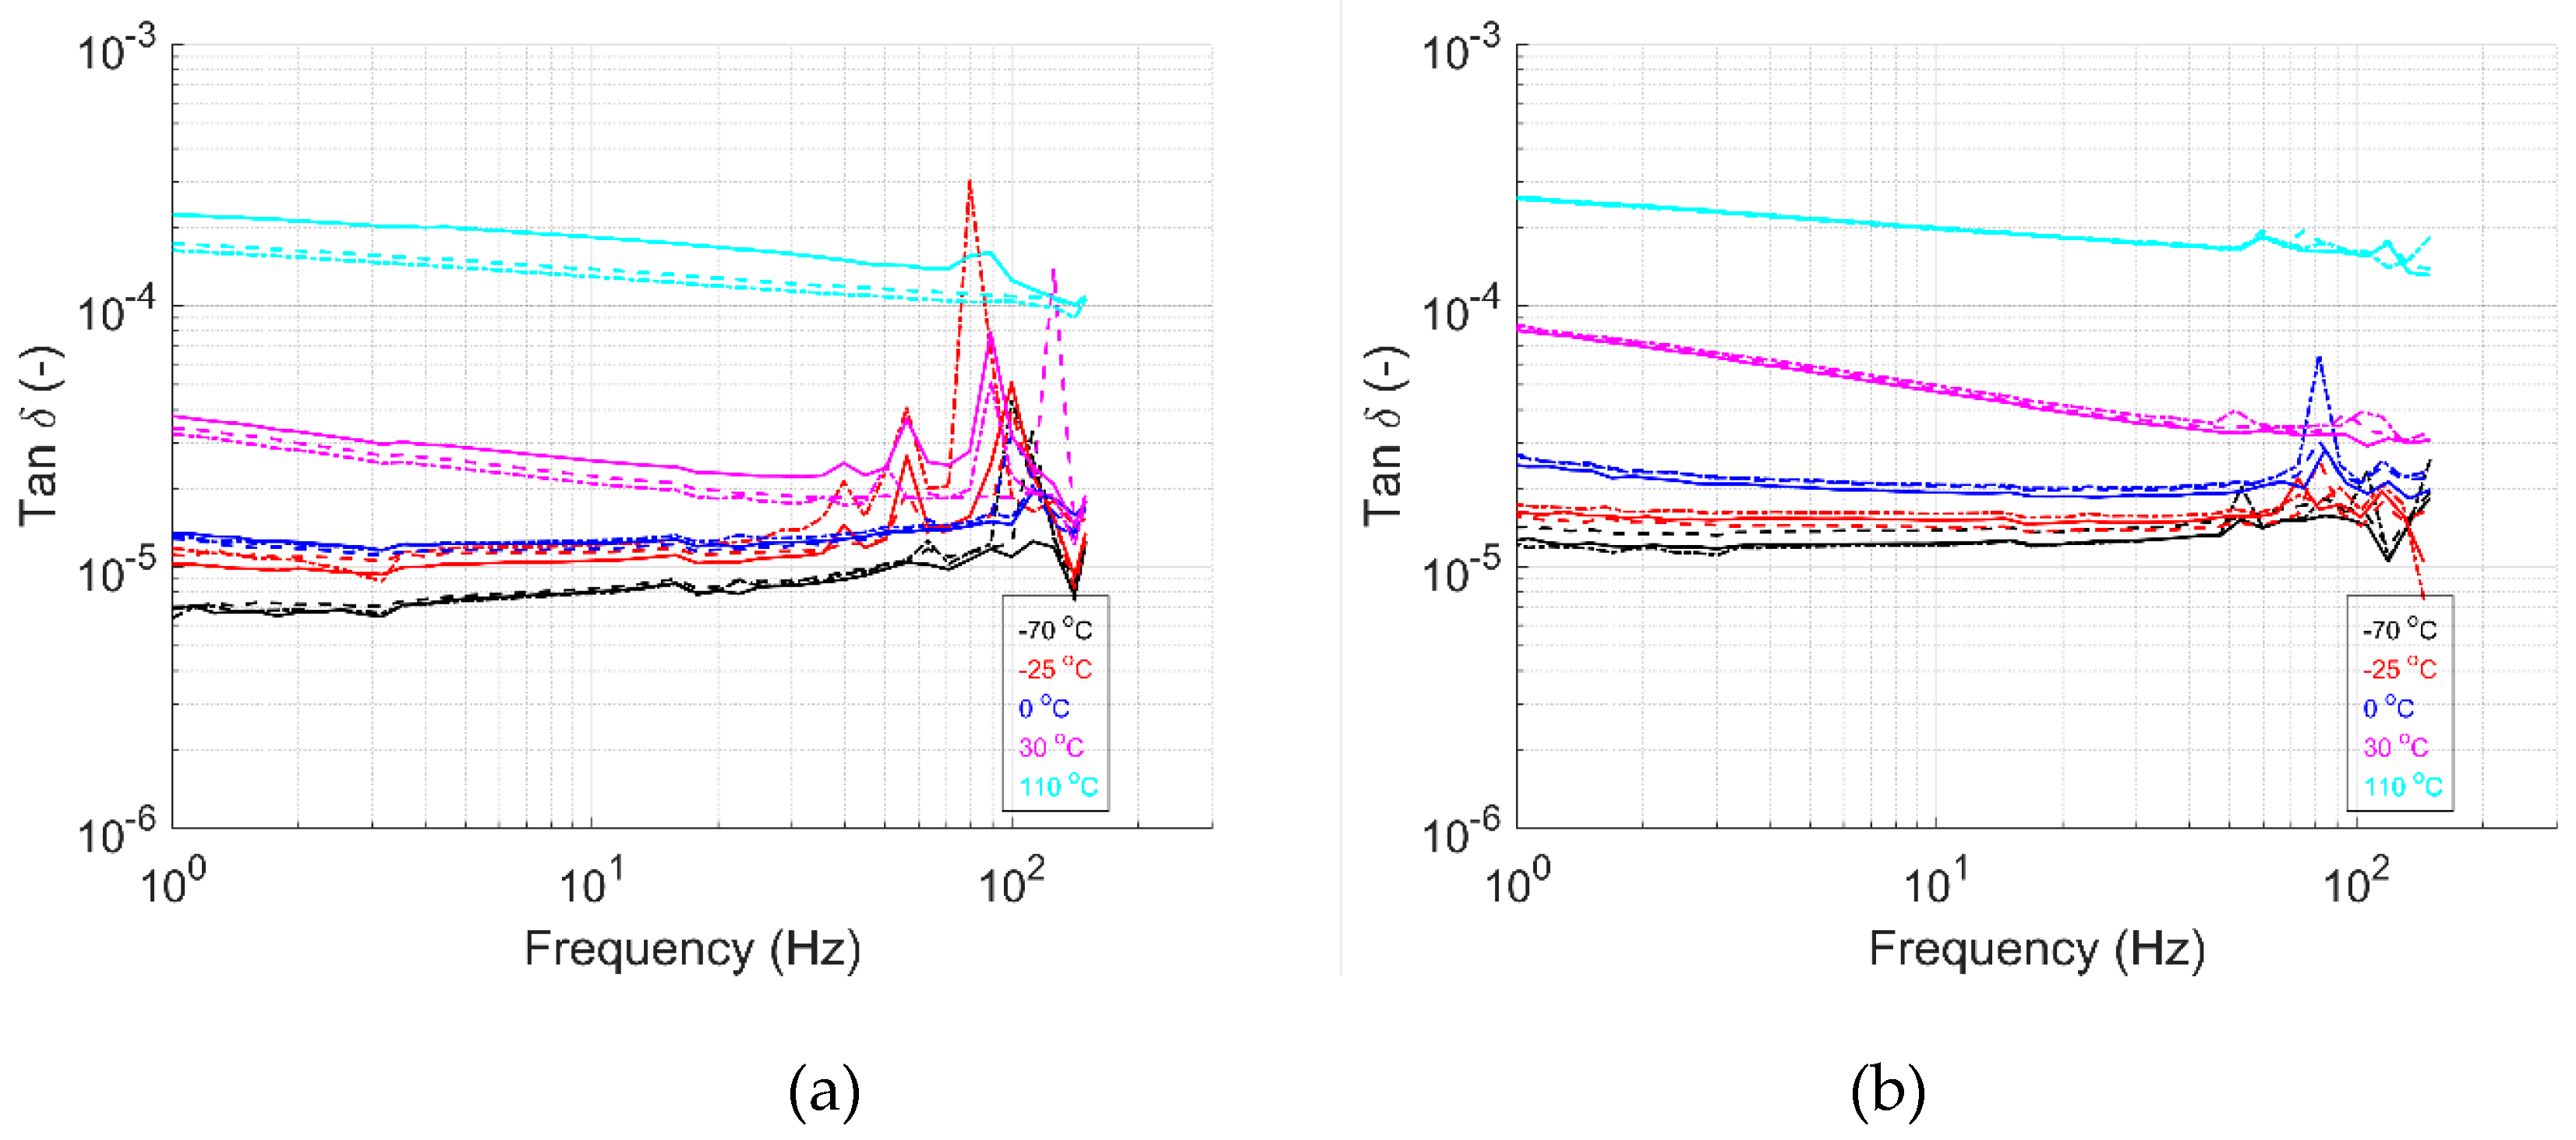
Figure 12.
Storage modulus as a function of frequency for UHMWPE/HDPE in (a) 1-dir and (b) 2-dir. Each line style represents one specimen tested.
Figure 12.
Storage modulus as a function of frequency for UHMWPE/HDPE in (a) 1-dir and (b) 2-dir. Each line style represents one specimen tested.
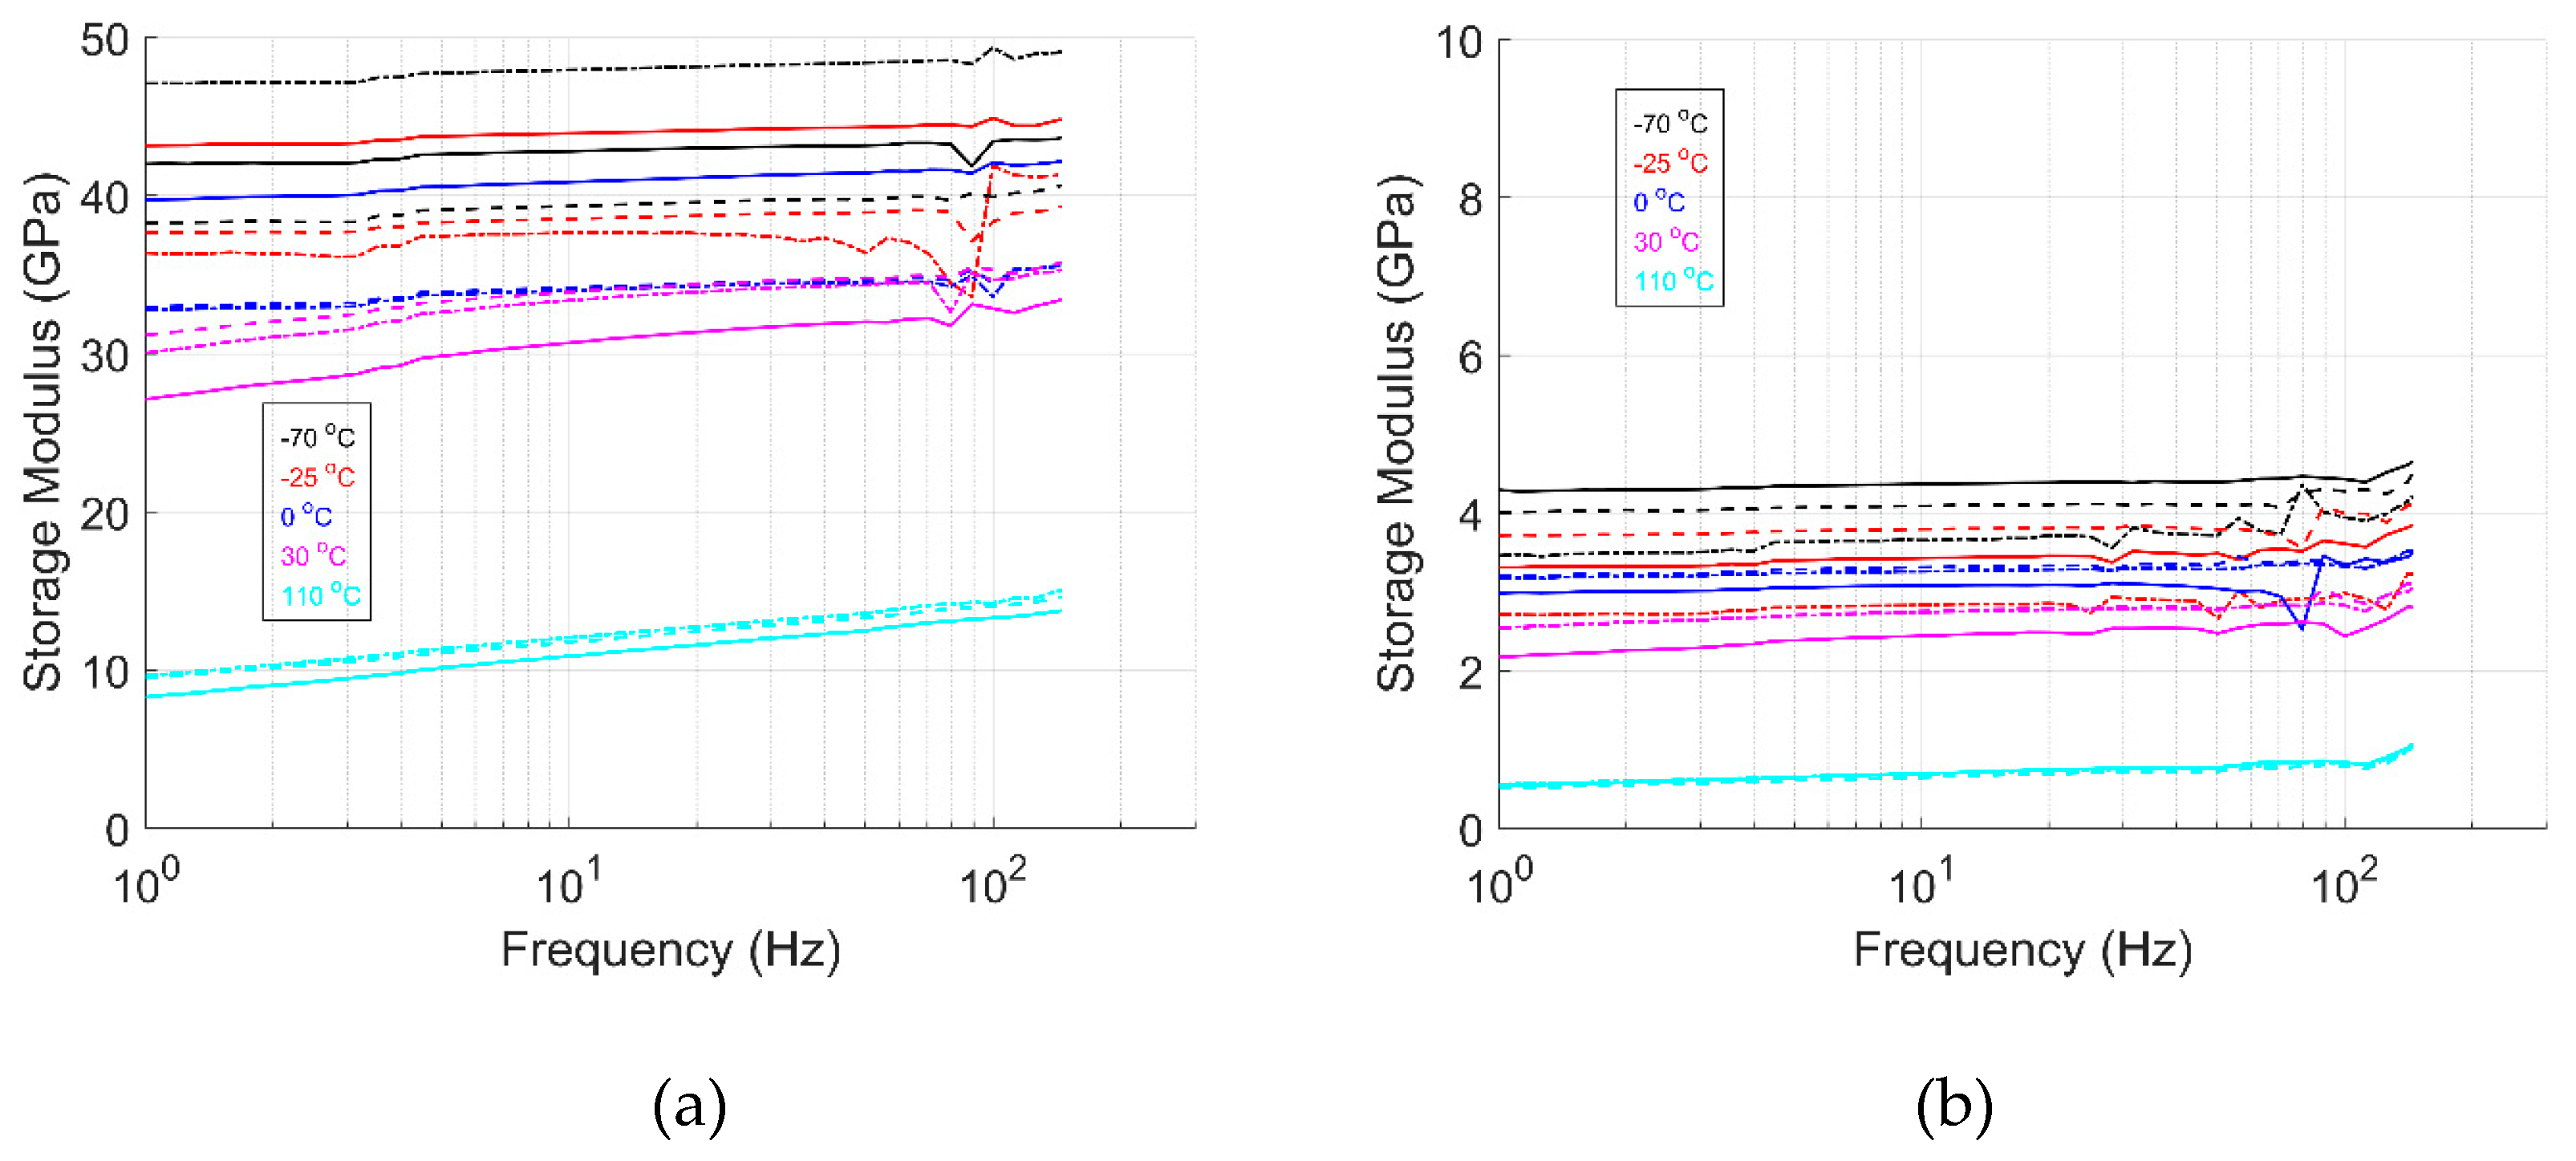
Figure 13.
Loss modulus as a function of frequency for UHMWPE/HDPE in (a) 1-dir and (b) 2-dir. Each line style represents one specimen tested.
Figure 13.
Loss modulus as a function of frequency for UHMWPE/HDPE in (a) 1-dir and (b) 2-dir. Each line style represents one specimen tested.
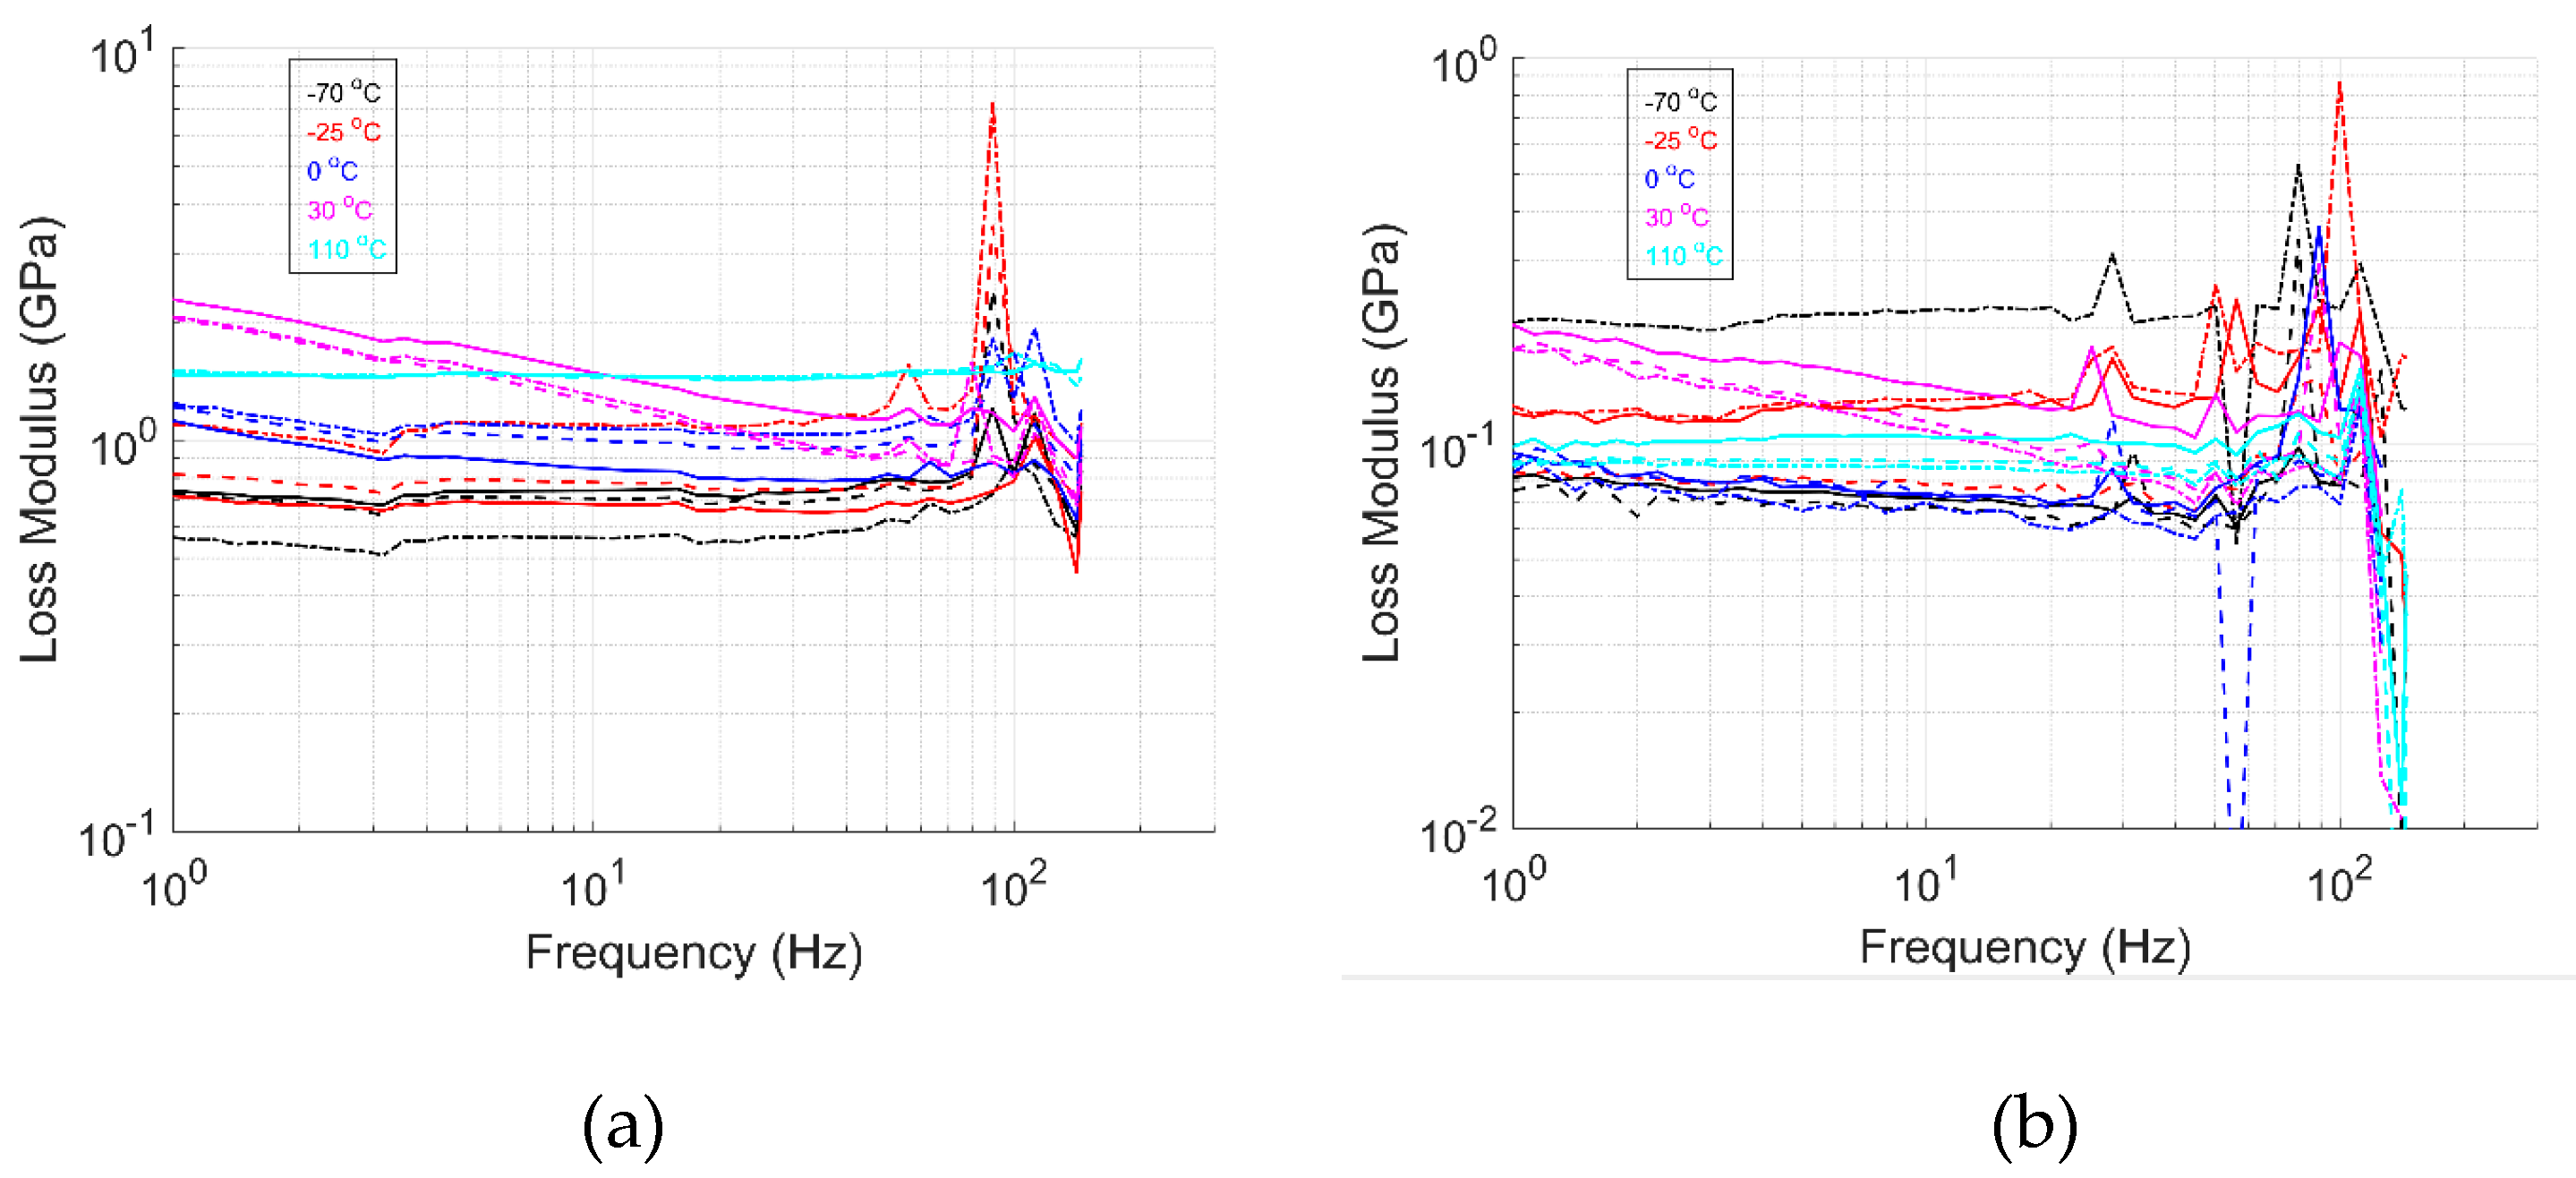
Figure 14.
Tanδ as a function of frequency for UHMWPE/HDPE in (a) 1-dir and (b) 2-dir. Each line style represents one specimen tested.
Figure 14.
Tanδ as a function of frequency for UHMWPE/HDPE in (a) 1-dir and (b) 2-dir. Each line style represents one specimen tested.
Figure 15.
Stress relaxation master curve at 0.01% strain for (a) GF/HDPE and (b) UHMWPE/HDPE created at a reference temperature of 30 oC.
Figure 15.
Stress relaxation master curve at 0.01% strain for (a) GF/HDPE and (b) UHMWPE/HDPE created at a reference temperature of 30 oC.
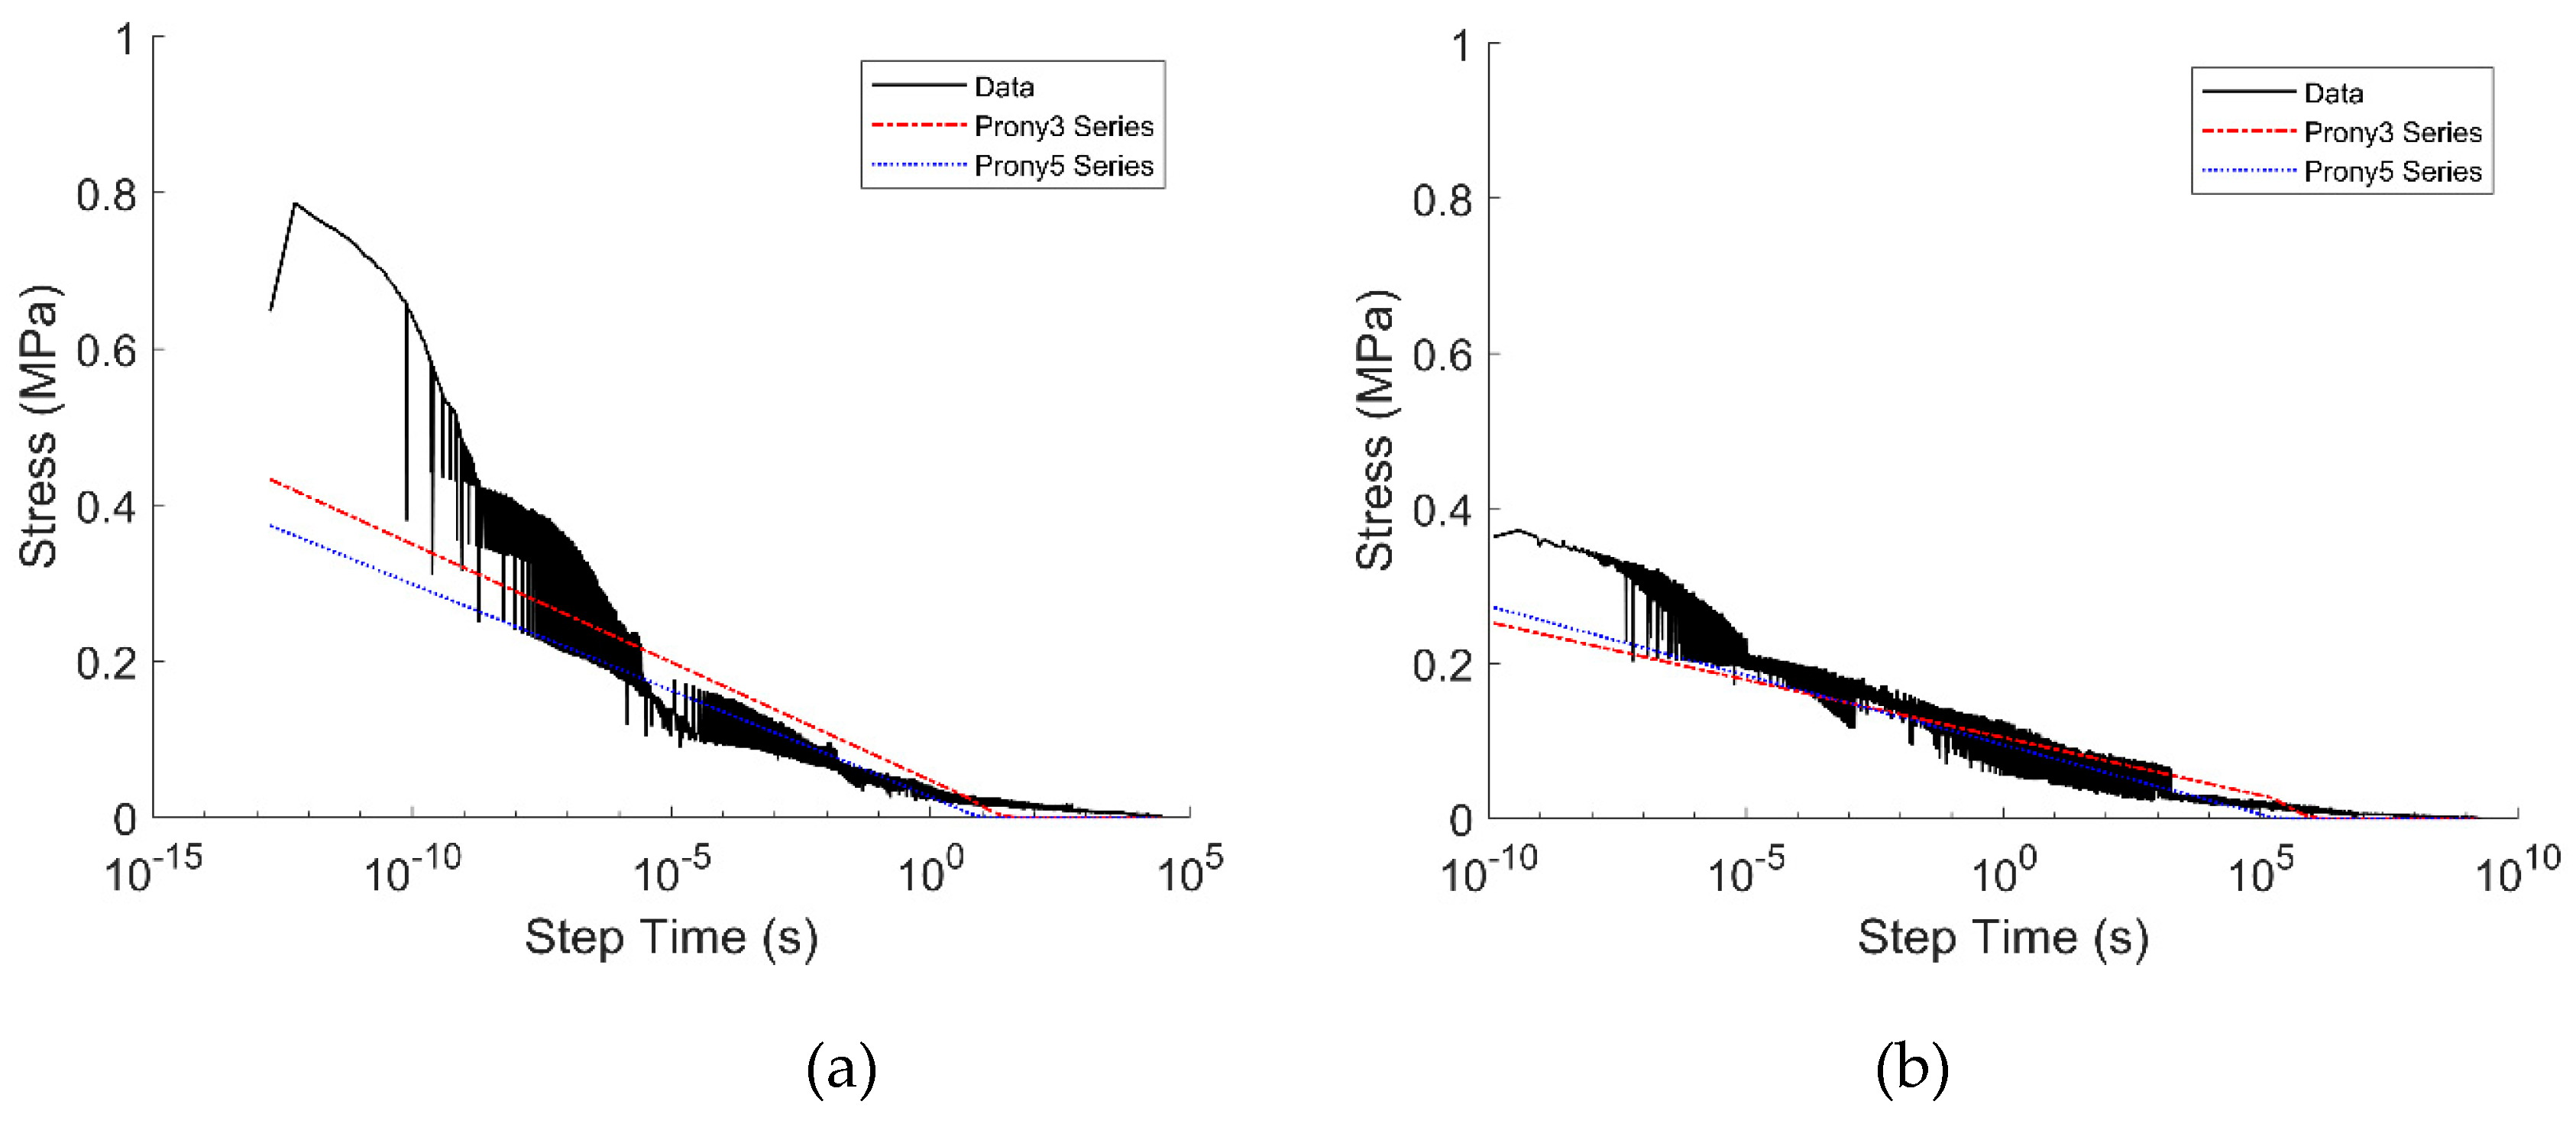
Figure 16.
Stress relaxation master curve shift factor for GF/HDPE and UHMWPE/HDPE materials.
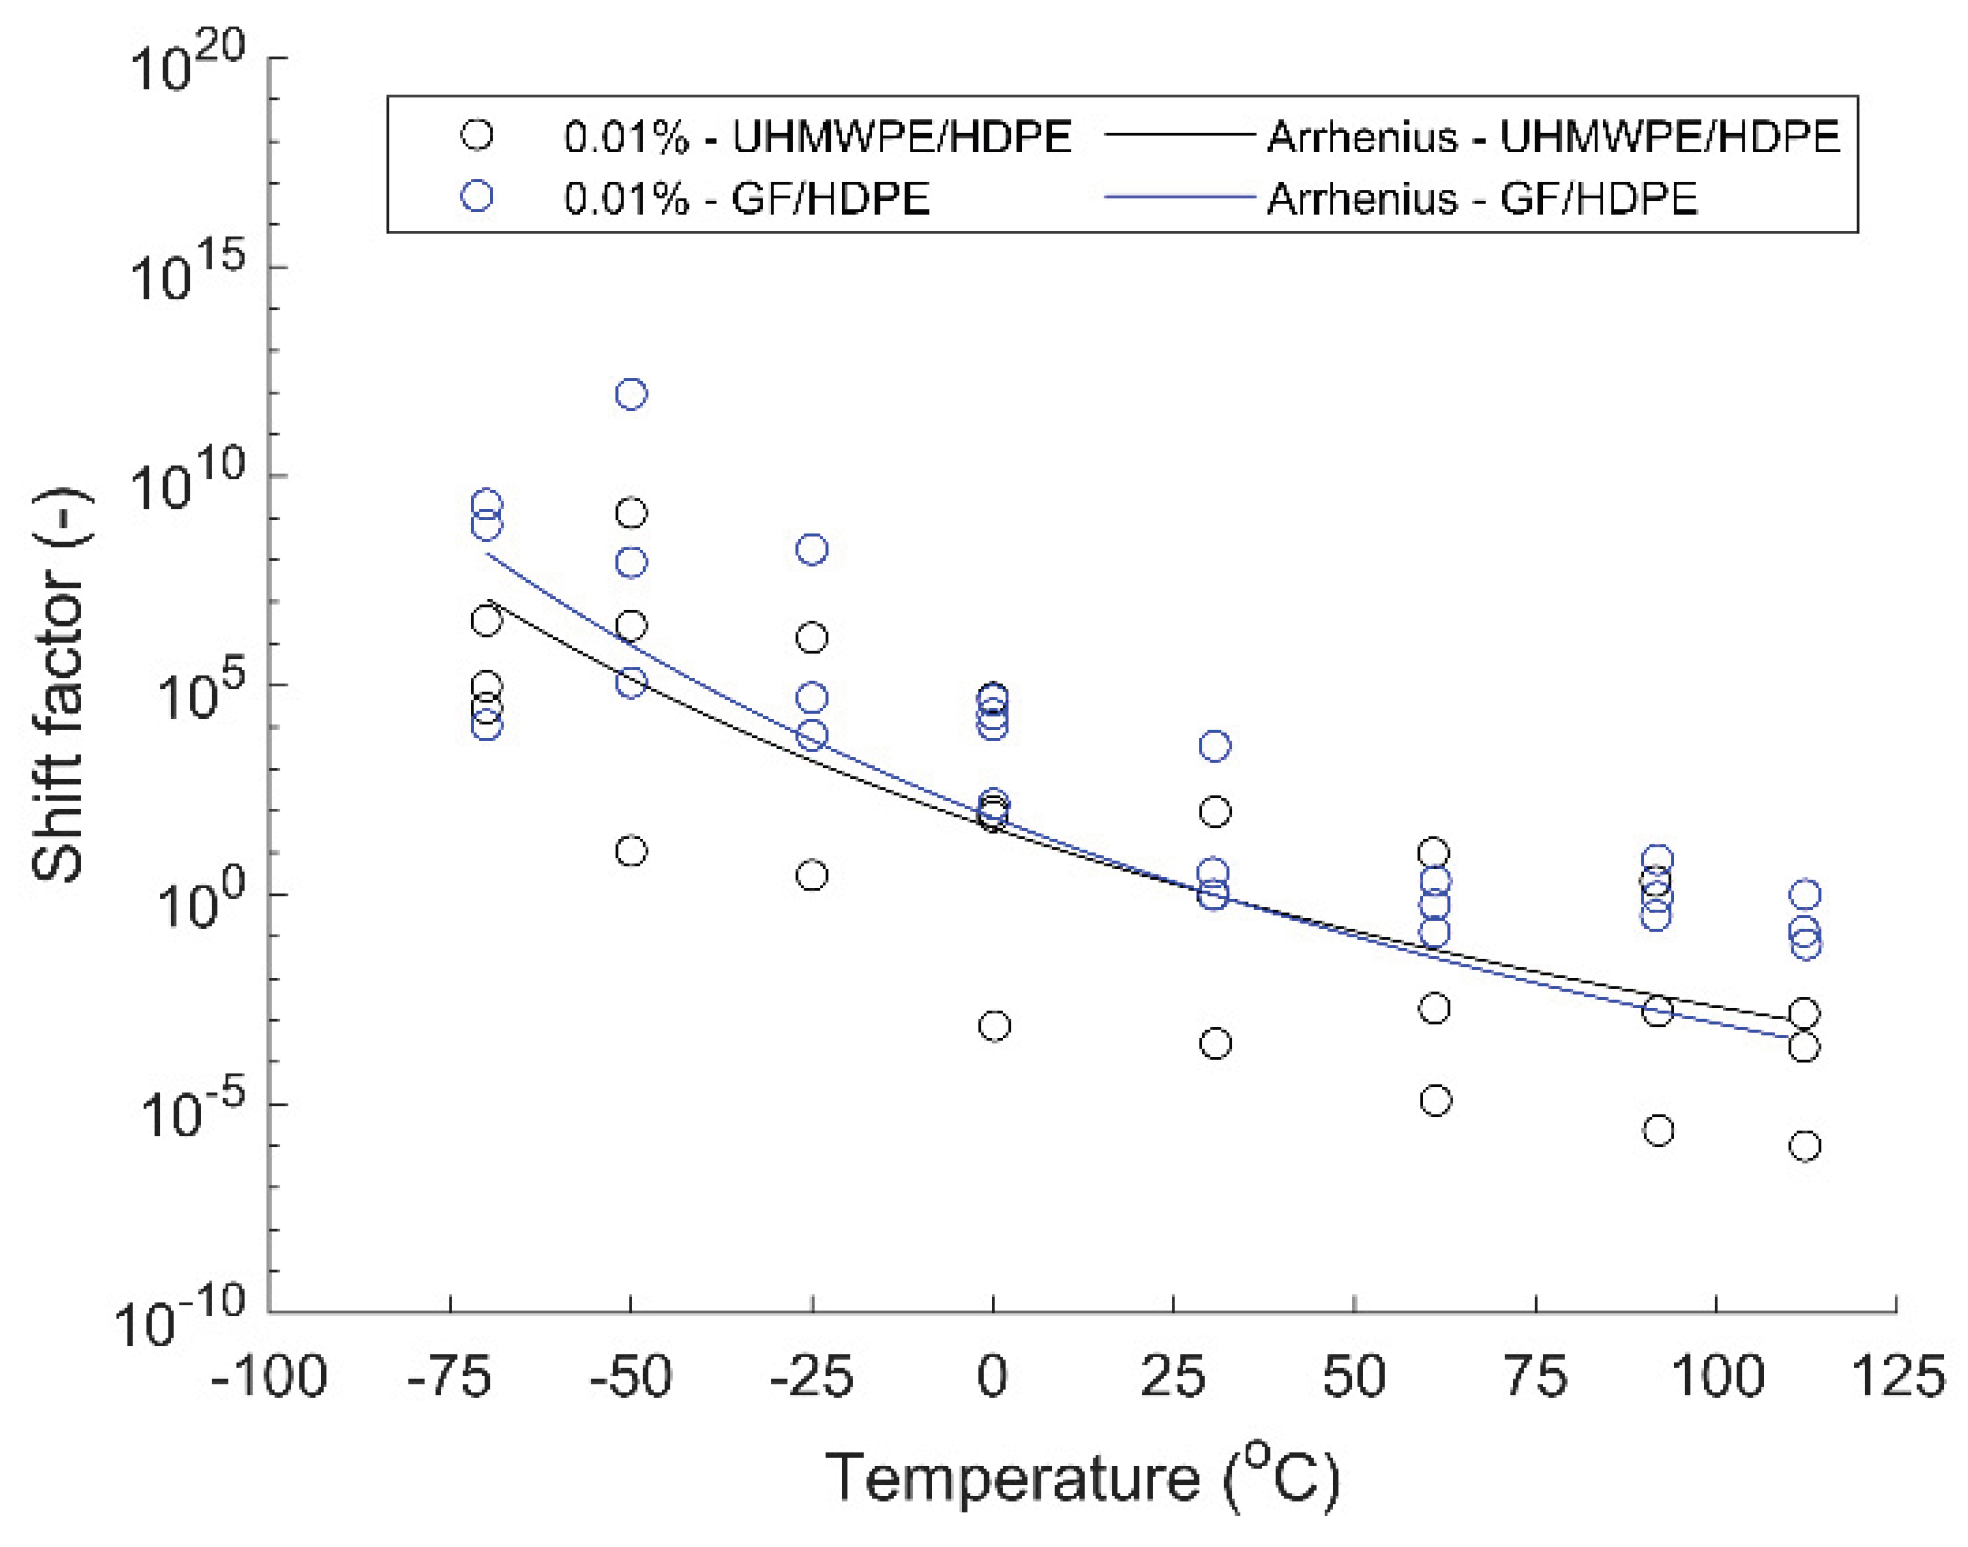
Table 1.
Materials technical information provided by the supplier.
| Material | Name | Manufacturer | Fiber Content |
Thickness (mm) |
| GF/HDPE | GF-HDPE-46-51-296 | A+ Composites | 46 vol. % | 0.205 |
| UHMWPE/HDPE | UHMWPE-HDPE-50-51-235 | A+ Composites | 50 vol. % | 0.235 |
Table 2.
Temperatures selected based on operational conditions using the Army Regulation 70-38 Standard.
Table 2.
Temperatures selected based on operational conditions using the Army Regulation 70-38 Standard.
| Temperature Daily High (oC) |
Design Type | Daily Cycle | Ambient Relative Humidity (%RH) |
| -57 | Extreme Cold | Extreme Cold (C4) | Tending toward saturation |
| -37 | Cold | Cold (C2) | Tending toward saturation |
| -6 | Basic | Mild Cold (C0) | Tending toward saturation |
| 24 | Basic | Constant High Humidity (B1) | 95-100 |
| 49 | Hot | Hot Dry (A1) | 3-8 |
Table 3.
Temperature and strain % values used for stress relaxation tests.
| Test | Temperature (oC) | Strain % | |||||||
| Stress Relaxation | -70 | -50 | -25 | 0 | 15 | 30 | 45 | 60 | 0.01 |
Table 4.
Compression molding processing parameters for the HDPE material systems.
| Material | Pressure, MPa, (psi) | Processing temperature, oC (oF) | Dwell time (min) |
| GF/HDPE | 0.18 (26) | 140 (284) | 3 |
| UHMWPE/HDPE | 0.14 (20) | 135 (275) | 3 |
Table 5.
DSC results of the first heating cycle.
| Material (n**) | Tm- matrix (oC) | ΔHfusion (J/g) | Tm-fiber (oC) | ΔHfusion-fiber (J/g) |
| GF/HDPE (5) | 126.4 ± 0.4 | 45.2 ± 4.9 | - | - |
| UHMWPE/HDPE (4) | 126.8 ± 0.2 | 82.6 ± 2.5 | 144.7 ± 0.3 | 110.4 ± 3.5 |
** n corresponds to the number of specimens used to average the results.
Table 6.
DSC results of the cooling and the second heating cycle.
| Material (n**) | Tcrystallization (oC) | ΔHcrystallization (J/g) | Tm-matrix (oC) | ΔHfusion (J/g) |
| GF/HDPE (5) | 117.0 ± 0.1 | 51.9 ± 5.4 | 127.8 ± 0.2 | 48.3 ± 4.3 |
| UHMWPE/HDPE (4) | 116.3 ± 0.1 | 164.7 ± 4.5 | 128.3 ± 0.2 | 169.8 ± 4.2 |
** n corresponds to the number of specimens used to average the results.
Table 7.
DSC results of consolidated panels (first heating cycle).
| Material (n**) | Tm-matrix (oC) | ΔHfusion (J/g) | Tm-fiber (oC) | ΔHfusion-fiber (J/g) |
| UHMWPE/HDPE (3) | 128.5 ± 0.2 | 79.0 ± 1.0 | 144.9 ± 0.3 | 98.1 ± 3.3 |
** n corresponds to the number of specimens used to average the results.
Table 8.
DSC results of consolidated panels (cooling and second heating cycle).
| Material (n**) | Tcrystallization (oC) | ΔHcrystallization (J/g) | Tm-matrix (oC) | ΔHfusion (J/g) |
| UHMWPE/HDPE (3) | 116.2 ± 0.0 | 159.3 ± 1.8 | 128.4 ± 0.2 | 165.5 ± 1.4 |
** n corresponds to the number of specimens used to average the results.
Table 9.
The degree of crystallinity for all the material systems was determined using the DSC results from the first heating cycle.
Table 9.
The degree of crystallinity for all the material systems was determined using the DSC results from the first heating cycle.
| Material | GF/HDPE | UHMWPE/HDPE |
| Fiber wt.% | 69.7 | 50.2 |
| % (raw material) | 50 | 57 |
| % (raw material) | - | 38 |
| % (consolidated panel) | 59 | 54 |
| % (consolidated panel) | - | 34 |
Table 10.
TMA results of HDPE materials in all principal directions.
| Material (n) | CTE 1-dir (με/C) | CTE 2-dir (με/C) | CTE 3-dir (με/C) |
| GF/HDPE (3) | 10.4 ± 1.1 | 82.7 ± 4.6 | 87.9 ± 5.6 |
| UHMWPE/HDPE (3) | -1.5 ± 8.7 (6) | 148.8 ± 9.1 (4) | 156.1 ± 9.3 |
Table 11.
Arrhenius fitting parameters.
| Material | Strain % | Activation Energy, Ea (kJ/mol) |
Reference Temperature, Tref (oC) |
R2 |
| GF/HDPE | 0.01 | 95.96 | 30.55 | 0.50 |
| UHMWPE/HDPE | 0.01 | 83.24 | 30.35 | 0.62 |
Table 12.
Prony series R2 values for stress relaxation test.
| Material | R2-value Prony3 | R2-value Prony5 |
| GF/HDPE | 0.99 | 0.99 |
| UHMWPE/HDPE | 0.97 | 0.98 |
Disclaimer/Publisher’s Note: The statements, opinions and data contained in all publications are solely those of the individual author(s) and contributor(s) and not of MDPI and/or the editor(s). MDPI and/or the editor(s) disclaim responsibility for any injury to people or property resulting from any ideas, methods, instructions or products referred to in the content. |
© 2025 by the authors. Licensee MDPI, Basel, Switzerland. This article is an open access article distributed under the terms and conditions of the Creative Commons Attribution (CC BY) license (http://creativecommons.org/licenses/by/4.0/).
Copyright: This open access article is published under a Creative Commons CC BY 4.0 license, which permit the free download, distribution, and reuse, provided that the author and preprint are cited in any reuse.


