Submitted:
30 July 2025
Posted:
31 July 2025
You are already at the latest version
Abstract
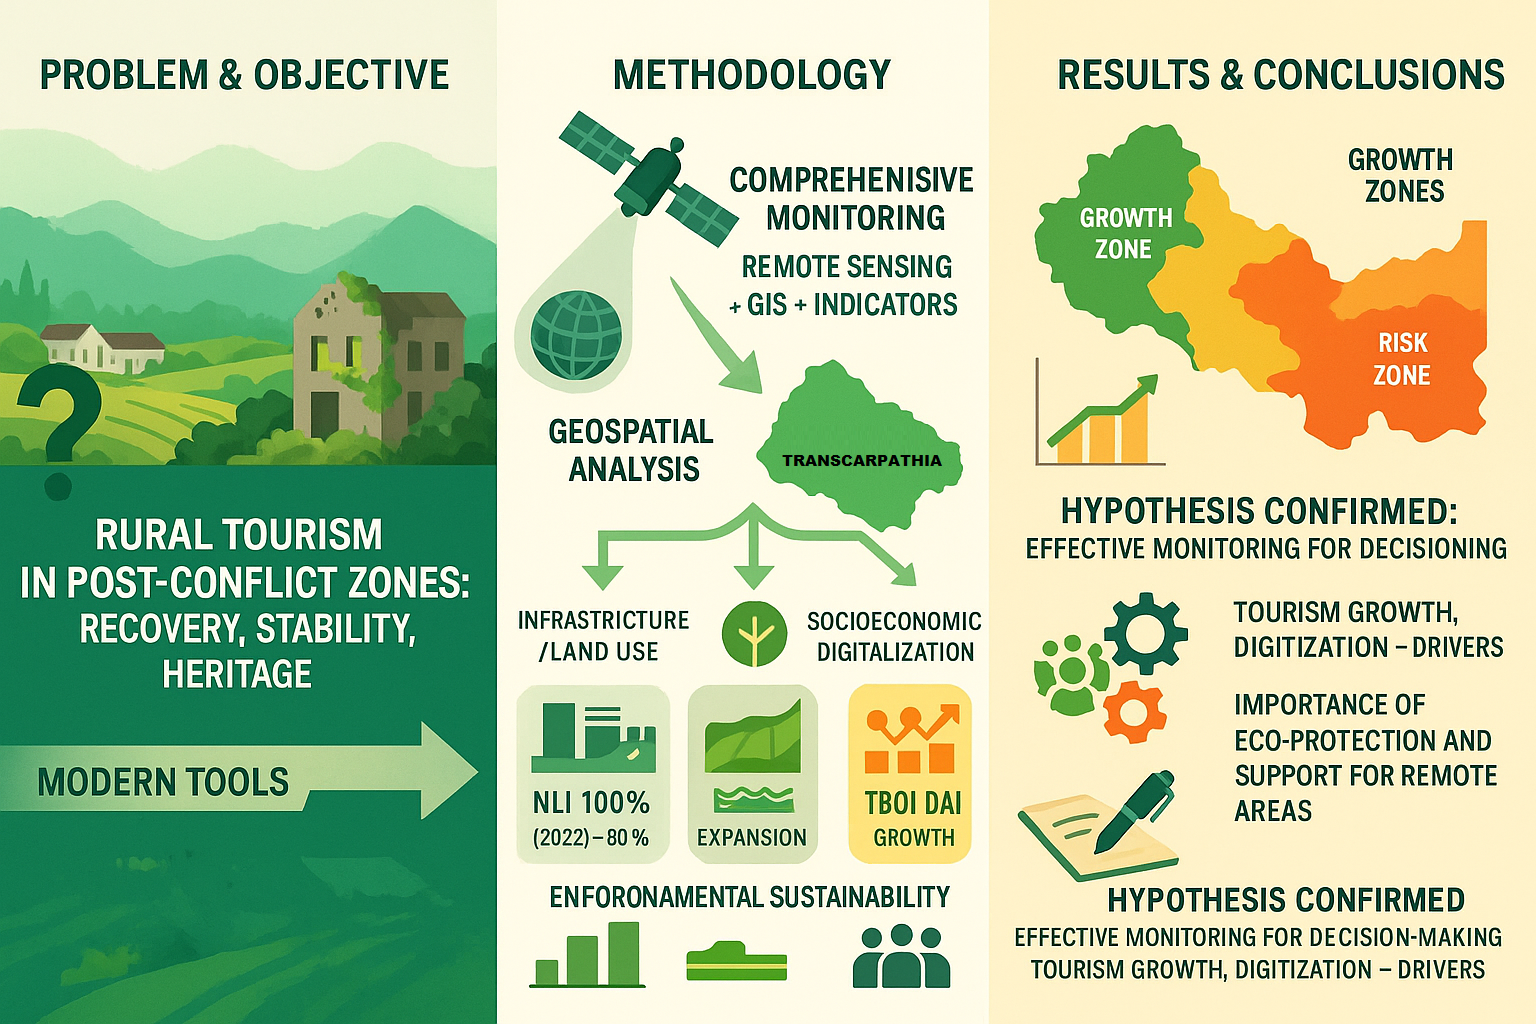
This study explores the sustainable development of rural tourism in post-conflict areas, focusing on Ukraine’s Transcarpathia region from 2022 to 2024. The research addresses the critical role of rural tourism in economic recovery, social stability, and cultural preservation in regions affected by conflict, where traditional data collection methods are often disrupted. Utilizing remote sensing and geospatial analysis, the study develops a comprehensive monitoring methodology integrating indicators such as land use changes (LUCI), infrastructure recovery (RSTI), ecological stability (NDVI, NDWI), and socio-economic resilience (DAI, SSELI). The methodology combines satellite data (Sentinel-2, VIIRS) with GIS tools and socio-economic statistics to calculate an integrated index (IRSDRT) for assessing sustainability. Key findings reveal a significant recovery in tourism infrastructure, with RSTI peaking at 120.0 in 2023, and a steady increase in ecological indicators, such as NDVI rising from 28.57 to 36.00. Socially, digital accessibility (DAI) improved from 70% to 88%, supporting tourism growth despite ongoing challenges. The study concludes that geospatial technologies effectively monitor post-conflict recovery, highlighting the resilience of rural tourism in Transcarpathia. The results underscore the importance of balanced development, combining infrastructure, ecological preservation, and digitalization, and provide actionable insights for policymakers to enhance sustainable tourism in similar regions.
Keywords:
sustainable rural tourism
; post-conflict recovery
; remote sensing
; geospatial analysis
; land use change
; infrastructure resilience
; ecological sustainability
; digital accessibility
; Transcarpathia region
; tourism monitoring
1. Introduction
Rural tourism plays a key role in the sustainable development of regions, especially in post-conflict zones, where it contributes to economic recovery, social stability, and the preservation of cultural heritage. However, monitoring its development requires modern tools, such as remote sensing and geospatial analysis, which allow for an objective assessment of change dynamics, identification of risk zones, and planning for sustainable resource use [1,2]. In the context of post-conflict territories, where traditional methods of data collection are often difficult, these technologies become particularly relevant, ensuring accuracy and timeliness of analysis [3,4].
Despite the growing interest in sustainable tourism, research dedicated to comprehensively monitoring its development using geographic information systems (GIS) and satellite data remains limited. Some works, such as studies on Croatia and Slovenia, show that post-conflict regions can successfully recover through tourism, but only a few of them use quantitative geospatial methods to evaluate the effectiveness of such programs [5,6,7]. Furthermore, there are disagreements regarding which indicators most accurately reflect the sustainability of rural tourism: some authors emphasize economic indicators [8], while others focus on environmental and social factors [9,10].
This article aims to develop a methodology for monitoring the sustainable development of rural tourism in post-conflict areas using remote sensing and geospatial analysis. The paper analyzes key indicators such as land-use dynamics, infrastructural changes, and environmental stability, and also explores the possibilities of integrating these data with socio-economic indicators. The results of the study will not only improve the management of tourism resources but also offer practical recommendations for authorities and local communities. The main conclusions of the work include evaluating the effectiveness of the methods used, identifying key factors influencing tourism sustainability, and developing recommendations for adapting monitoring systems for various post-conflict regions. This research contributes both to the theoretical understanding of sustainable tourism and to the practical application of geospatial technologies for its analysis.
1.1. Post-Conflict Reconstruction and Tourism
The development of tourism in post-conflict regions represents a complex multifaceted process requiring a comprehensive approach to infrastructure reconstruction, formation of a new territorial image, and attraction of investments. As studies show, the consequences of military actions have a destructive impact on the tourism industry, leading to a sharp reduction in tourist flows, destruction of infrastructure facilities, and loss of trust from potential visitors [3]. However, as the experience of former Yugoslavia countries demonstrates, a well-structured post-conflict recovery policy is capable of not only restoring the region’s tourist appeal but also creating new points of economic growth.
The analysis of the Croatian experience, presented in the works of Currie et al. [3] and Radnic and Ivandic [5], reveals several key factors for the successful recovery of the tourism industry. These include: active state participation in infrastructure reconstruction, development of targeted marketing programs to change the country’s image, and attraction of international organizations to the recovery process. It is noteworthy that already 5-7 years after the end of active hostilities, Croatia managed not only to restore but also significantly surpass pre-war tourist flow indicators.
Similar trends are observed in the Slovenian experience, thoroughly examined by Mihalic [4]. The author particularly emphasizes the importance of strategic planning and a phased approach to recovery, where primary attention is given to key tourist centers, and then peripheral territories are gradually involved. This approach allowed Slovenia to minimize economic losses and shorten the period of tourism industry recovery.
The modern Ukrainian case, analyzed by Bobek et al. [6], introduces new aspects to the understanding of post-conflict recovery. In the context of ongoing hostilities, a paradoxical phenomenon is observed – the development of domestic tourism in safe regions of the country, which indicates a significant adaptive potential of the tourism industry. Of particular interest is the analysis of changes in tourist behavioral models, demonstrating a growing demand for authentic cultural experiences and rural tourism.
Additional studies [7,11] highlight the importance of considering the following aspects in post-conflict tourism recovery:
- necessity of comprehensive damage assessment using GIS technologies [12];
- importance of preserving cultural heritage as a basis for creating new tourist products [13];
- development of community-based tourism to ensure the sustainability of recovery processes [14].
Of particular attention is the concept of “traumatic tourism” (dark tourism), which in post-conflict conditions can become both an additional development resource and a risk factor requiring a balanced approach [15]. As recent studies show, the balance between commemorating events and creating a positive image of the future is a key challenge for marketers and managers in the tourism sector [16]. The experience of various countries demonstrates that successful post-conflict tourism recovery requires not only significant financial investments but also the development of innovative approaches that consider both global trends in the tourism industry and the specifics of a particular region [17]. At the same time, the use of modern monitoring and analysis technologies, allowing for informed management decisions at all stages of the recovery process, becomes particularly important [18].
1.2. Sustainable Development of Rural Tourism
Modern trends in rural tourism development demonstrate its significant potential as a tool for sustainable territorial development. As Alonso et al. [19] note, digitalization has become a key factor in the transformation of this sector, allowing even remote rural areas to integrate into global tourism flows. However, as emphasized in the work of Cristobal-Fransi et al. [20], the sustainability of rural tourism development requires a comprehensive approach, combining economic efficiency, ecological responsibility, and social inclusivity.
The most important aspect of sustainable development is the preservation of the cultural authenticity of rural territories. Studies by De Almeida et al. [21] and Tang, Xu [22] show that the integration of cultural heritage into tourism products not only increases their attractiveness but also contributes to the preservation of traditional values of local communities. The development of gastronomic tourism gains particular importance, which, according to Fontefrancesco et al. [23], is becoming an important driver of economic growth in rural regions of Southern Europe.
Marketing strategies for sustainable rural tourism are undergoing significant changes. As Font, McCabe [24] and Jamrozy [25] note, the modern approach requires a shift from mass tourism to concepts of “slow tourism” and responsible consumption. The study by Janjua et al. [26], using the example of Malaysian rural communities, demonstrates the effectiveness of community-based marketing, where local residents become active participants in promoting tourism products.
Digital technologies are playing an increasingly important role in ensuring the sustainability of rural tourism. Works by Hysa et al. [27] and Vila et al. [28] emphasize the importance of social media as a tool for forming sustainable relationships with tourists. Simultaneously, as Jian, Ren [29] and Zhang [30,31] show, big data and artificial intelligence technologies allow for optimizing tourism flow management and minimizing anthropogenic load on rural territories.
The issue of ecological sustainability deserves special attention. Studies by Ryglová et al. [32] and Shcherbak et al. [33] develop indicator systems for assessing the environmental impact of rural tourism, emphasizing the necessity of implementing circular economy principles. As Pomering et al. [34,35] note, sustainable tourism marketing should not only inform about ecological practices but also foster appropriate behavior in tourists.
The COVID-19 pandemic became an important test of sustainability for rural tourism. Studies by Trybuś-Borowiecka [36] and Moore, Quinn [37] show that rural areas demonstrated greater resilience to the crisis due to their ability to offer safe forms of recreation. However, as Kansiime et al. [38] warn, crises can exacerbate socio-economic inequality in rural areas, which requires special attention to inclusive development models [40].
The experience of various regions, from the Czech Republic [41] to Indonesia [42], demonstrates that sustainable development of rural tourism is possible only on condition of a balanced consideration of the interests of all stakeholders. As Santos et al. [43] emphasize, the key becomes a transition from narrow economic indicators of success to comprehensive sustainability criteria, taking into account the social, environmental, and cultural aspects of rural territorial development [44].
1.3. Geospatial Analysis and Remote Sensing in Rural Tourism Research
Modern methods of geospatial analysis and remote sensing open new opportunities for monitoring and managing the development of rural tourism. As Brezzi et al. [45] note, these technologies allow obtaining objective data on the state of territories, which is especially important for making informed management decisions. The integration of geographic information systems into tourism activity planning processes, according to Cardoso et al. [46], contributes to a more efficient use of natural and cultural resources in rural areas.
The application of remote sensing methods, as shown in the study by Shcherbak et al. [12], allows monitoring land-use changes and assessing anthropogenic load on ecosystems. This is particularly relevant for rural tourism, where it is important to maintain a balance between infrastructure development and environmental protection. The work of Liu et al. [47] demonstrates how geospatial analysis can be used to evaluate the efficiency of natural resource use in the context of sustainable development.
A promising direction is the application of mathematical models for forecasting the development of tourism activity. Chen’s [48] study shows the potential of non-linear models for analyzing complex socio-economic processes, including the dynamics of tourist flows. In turn, Xu [49] proposes using Markov chains to model the correspondence between supply and demand in rural tourism, which allows optimizing the placement of tourist infrastructure.
An important aspect is the integration of geospatial data with socio-economic indicators. As Andrews et al. [50] note, this allows identifying interrelationships between economic factors and the perception of territorial tourism attractiveness. Luebker’s [51] study emphasizes the importance of spatial analysis for understanding the uneven distribution of income from tourism activities, which is particularly relevant for rural regions.
The development of digital platforms, as shown in Liao’s [52] work, creates new opportunities for visualizing geospatial data and using them in rural tourism marketing strategies. At the same time, as Król [53] notes, it is important to consider regional specificities and adapt geo-analysis tools to the particular conditions of territories.
Of particular attention is the application of geospatial methods for evaluating the effectiveness of the cluster approach in rural tourism development. The study by Stanovčić et al. [54], using the example of Montenegro, demonstrates how spatial analysis can contribute to identifying promising growth points and optimizing tourist routes. A promising direction is the combination of traditional methods of geospatial analysis with new technologies, such as artificial intelligence and big data. As Yu [55] and Zwierzchowska [56] show, this allows not only analyzing the current state of territories but also forecasting their development considering various scenarios of socio-economic changes. Thus, geospatial analysis and remote sensing represent a powerful toolkit for researching and managing the development of rural tourism, allowing for consideration of both the spatial characteristics of territories and their socio-economic features. Further development of these methods, as noted in the work of Robert et al. [57], should be aimed at creating comprehensive decision support systems that integrate spatial data with sustainable development indicators.
1.4. Monitoring Sustainable Development of Rural Tourism: Methods and Approaches
Modern methods for monitoring the sustainable development of rural tourism are undergoing a significant transformation due to the implementation of innovative technologies. As studies by Remondino [58] and Magige et al. [59] demonstrate, the integration of remote sensing methods and GIS technologies allows for comprehensive monitoring of changes in tourist destinations, which is especially relevant for post-conflict territories. These methods provide an objective assessment of anthropogenic impact on ecosystems and enable tracking the dynamics of natural landscape restoration.
An important aspect of sustainable monitoring is the development of a system of key indicators. Studies by LI et al. [60] and Shi et al. [61] propose comprehensive approaches to assessing ecological factors on tourist islands, which can be adapted for rural areas. Particular attention is paid to the analysis of land-use changes, which, according to Dong et al. [62], is critically important for maintaining ecological balance in the context of tourism infrastructure development.
Spatial analysis methods, described in the work of Andyana et al. [63], demonstrate high effectiveness in monitoring the expansion of tourism activities in rural areas. The application of machine learning algorithms, such as “random forest,” allows not only for recording current changes but also for forecasting future development scenarios of territories. This aligns with the conclusions of Yu [64], who emphasizes the significance of regression analysis for evaluating the effectiveness of tourism clusters.
Socio-economic aspects of sustainability require special attention in monitoring. As Almeyda et al. [65] note, it is necessary to consider the mutual influence of tourism activities and local communities. The study by Yang et al. [66] proposes a methodology for assessing the determinants of tourism development, which can be applied to analyze the sustainability of rural tourism in post-conflict conditions.
A promising direction is the integration of traditional monitoring methods with sustainable tourism marketing strategies. Works by Gilmore et al. [67] and Kiráľová [68] demonstrate how monitoring data can be used to form a sustainable image of a territory and attract responsible tourists. This is particularly important in the context of post-conflict regions where, as studies by Maliuta et al. [69] show, tourism can become a catalyst for economic recovery.
The development of rural tourism requires constant monitoring of its impact on local communities. Studies by Melichová, Majstríková [70] and Neumeier, Pollermann [71] emphasize the necessity of assessing social capital and the living standards of the local population as important indicators of sustainable development. These aspects are especially relevant for post-conflict territories, where tourism can contribute to social reintegration and the restoration of trust.
Thus, modern approaches to monitoring the sustainable development of rural tourism should combine technological innovations with a comprehensive assessment of environmental, economic, and social factors. As studies show, precisely such an integrated approach allows ensuring the balanced development of tourism activities in post-conflict regions, contributing to their sustainable recovery and long-term prosperity.
1.5. Digital Technologies in Sustainable rural Tourism Marketing
Modern digital technologies are radically transforming approaches to marketing in rural tourism, especially in the context of sustainable development of post-conflict territories. As Veiga et al. [72] note, the millennial generation, being a key target audience, expects from tourist destinations not only authenticity but also a demonstration of commitment to sustainable development principles, which requires new marketing strategies.
Innovative technologies, including metaverses, open fundamentally new opportunities for promoting rural tourism products. The study by Monaco and Sacchi [73] demonstrates the potential of virtual tours of rural territories, allowing potential visitors to remotely explore a destination before making a travel decision. This is especially relevant for post-conflict regions, where virtual technologies help overcome stereotypes and form a new image of the territory.
Digital marketing is becoming an important tool for sustainable promotion of rural tourism. Works by Rosário et al. [74,75] highlight the transformation of communication strategies, where the emphasis shifts from mass tourism to attracting responsible travelers. Mathematical modeling by Mathew and Soliman [76] confirms the significant impact of digital content marketing on tourist behavior, especially concerning the choice of environmentally responsible destinations.
Geographic Information Systems (GIS) play a special role in rural tourism marketing. As Jovanovic and Njegus [77] show, spatial visualization of tourism resources allows for more effective positioning of rural territories, emphasizing their unique features. This aligns with Kerdpitak’s [78] conclusions that the integration of digital technologies significantly increases the efficiency of tourism businesses in rural areas.
An important aspect is the personalization of marketing communications. The study by Levitskaya and Yanioglo [79] demonstrates how digital technologies allow creating targeted offers for various segments of tourists interested in sustainable rural tourism. Hristoforova et al. [80] complement this approach, emphasizing the need to adapt digital communications to the specific features of particular rural territories.
Of particular importance in post-conflict regions is the concept of “tourism ambassadors,” explored by Morand et al. [81]. Digital technologies allow local residents to become active participants in marketing processes, share authentic stories, and form an emotional connection with potential visitors. This aligns with the concept of “sense of place,” which Walsh et al. [82] consider a key component of sustainable tourism marketing.
A promising direction is the use of big data to analyze the effectiveness of marketing strategies. As Nugraha et al. [83] note, digital technologies allow tracking not only economic indicators but also assessing the contribution of tourism to the sustainable development of rural territories, including social and environmental aspects. Thus, digital technologies are becoming an indispensable element of sustainable rural tourism marketing, especially in post-conflict regions. They allow not only for effectively promoting tourism products but also for demonstrating commitment to sustainable development principles, which becomes a key competitive advantage in modern conditions.
1.6. Scientific Discussions and Unresolved Issues of Sustainable Development of Rural Tourism in Post-Conflict Regions
Despite significant progress in research on the sustainable development of rural tourism, a number of contentious points and unresolved issues remain. Discussions continue within the scientific community regarding the optimal balance between economic efficiency and environmental preservation in post-conflict regions [8,10]. Some researchers argue that an emphasis on economic indicators can lead to excessive exploitation of natural resources [9], while others emphasize that without sustainable economic growth, long-term social development cannot be ensured [44]. A particular controversy arises concerning the degree of intervention in the natural recovery processes of territories: some scientists advocate for active management of these processes using modern technologies [18], while their opponents propose minimizing anthropogenic impact, relying on natural regeneration [33].
Another area of scientific disagreement is the role of digital technologies in post-conflict recovery. While some authors see them as a panacea for overcoming the informational isolation of territories [19,27], others warn of the risks of digital inequality and dependence on technologies that may be inaccessible to local communities [52]. The evaluations of the effectiveness of the cluster approach are also contradictory: while studies in Montenegro demonstrate its success [54], works on other regions indicate a risk of excessive centralization of tourist flows [56].
The main goal of this work is to develop a comprehensive methodology for monitoring the sustainable development of rural tourism in post-conflict areas using remote sensing and geospatial analysis. The study will allow for:
- creating a system of indicators integrating ecological, economic, and social aspects of sustainability;
- developing algorithms for processing spatial data to assess the dynamics of territorial recovery;
- offering practical recommendations for adapting monitoring systems to the conditions of various post-conflict regions.
The hypothesis of this research is:
H1 “The integration of remote sensing data and geospatial analysis enables the effective monitoring and evaluation of sustainable rural tourism development in post-conflict areas by identifying spatial patterns of land use change, infrastructure recovery, and environmental impact, thereby supporting data-driven planning and policy-making.”
The conducted analysis confirms that the combination of modern geospatial technologies with traditional research methods creates a basis for balanced management of rural tourism development. Of particular importance is the integration of the obtained data into decision-making processes, which allows considering both global trends and the local specifics of post-conflict territories. The results of the study will contribute both to the theoretical understanding of sustainable tourism and to the practice of territorial management, offering scientifically grounded tools for post-conflict recovery.
The research was conducted in 2022-2024 on rural tourism in the Transcarpathia region of Ukraine.
2. Materials and Methods
2.1. Indicator System and Spatial Data Sources
To ensure comprehensive monitoring of the sustainable development of rural tourism in post-conflict regions of Ukraine, particularly in Transcarpathia, a system of indicators has been developed, covering land-use changes, infrastructure restoration, environmental state, and socio-economic sustainability. Below is a table describing the key indicators, data sources used, and analysis directions, integrated into a logical monitoring model based on remote sensing data and geoinformation technologies (Table 1).
2.2. Methodology for a Comprehensive Assessment of Sustainable Development of Rural Tourism
The presented methodology for processing indicators allows for a comprehensive assessment of the sustainability of rural tourism development in post-conflict regions through three key aspects:
- infrastructure-territorial (restoration of facilities and land use),
- ecological (state of natural resources),
- socio-economic (demography, employment, digitalization).
The integral index (IRSDRT) synthesizes these components taking into account weighting factors adapted to the specifics of the region. All calculations are based on verified data from satellite monitoring, state statistics and industry registers (Table 2).
Figure 1 presents a model that demonstrates the step-by-step process from multidisciplinary data collection to the generation of an integrated index through a system of weighted indicators. The interrelations between satellite monitoring, GIS analysis and socio-economic statistics are visualized, providing a comprehensive assessment for post-conflict areas.
Spatial analysis algorithm (step by step):
1. Collection of geodata: satellite images (Sentinel-2, VIIRS, Landsat), open data (OpenStreetMap, Booking.com, Ookla, etc.);
2. Preprocessing: atmospheric correction, georeferencing, selection of the vegetation season;
3. Extraction of indices: NDVI, NDWI, LULC classification, illumination (NLI);
4. Calculation of subindices (LUCI, ICI, NDVI, STCI, etc.);
5. Creation of layers in GIS with integration of socio-economic and digital indicators;
6. Calculation of IRSDRT at the regional/community level;
7. Generation of maps and reports for monitoring and recommendations.
3. Results
3.1. Spatial-Temporal Dynamics of Land Use and Infrastructure Recovery (2022–2024)
3.1.1. Dynamics of Restoration of Tourism and Social Infrastructure (ICI, RSTI, AAPI)
To understand the spatial context of the study, a map of the Transcarpathia region of Ukraine was compiled, reflecting its administrative boundaries and key geographic features. This region is the object of analysis of land use dynamics, infrastructure restoration, and assessment of economic activity in the context of the ongoing war in Ukraine (Figure 2).
The presented map allows to define the territorial scope of the study and serves as a basis for subsequent spatial analysis of land use and infrastructure changes. Clear visualization of the regional boundaries ensures correct comparison of satellite data (VIIRS, Sentinel-2) and socio-economic indicators, which increases the accuracy of interpretation of the obtained results. Based on the developed methodology (Table 2, Figure 1), calculations were carried out for the Transcarpathia region of Ukraine using data for three time slices: at the initial stage of a full-scale war (2022), in the conditions of the active phase and ongoing crises (2023), as well as during the period of relative stabilization and strengthening of recovery processes (2024) (Table 3).
The calculations yield key observations and trends in the spatial-temporal dynamics of land use and infrastructure rehabilitation (2022–2024). Thus, in the period 2022–2023, there was an initial shock from the outbreak of hostilities, followed by adaptation. In 2022 (the year of the full-scale invasion), the immediate negative impact is clearly visible. The LUCI (0.5) and MTCI (0.05) indices are extremely low, indicating an almost complete halt in the development of new tourism and the formation of clusters. The most indicative is the RSTI value of 0.0, which means no rehabilitation or development of new infrastructure, which corresponds to wartime priorities. The ICI is also low (6.64).
3.1.2. Mapping Data on Nighttime Light Intensity (NLI) as an Indicator of Economic Activity
Analysis of the dynamics of the NLI indicator showed that it remains at 100%, which indicates a stable power supply to Transcarpathia, in contrast to the territories that were subjected to direct attacks (Figure 3).
Figure 4 shows the dynamics of the NLI indicator in Transcarpathia as an indicator of economic activity in 2022–2024.
In 2022, the NLI level remained high (100.0), indicating stable energy supply in the region even amid the start of the full-scale war. In 2023, a noticeable decrease in the indicator to 85.0 is observed, which may be related to the impact of the nationwide energy crisis and power supply interruptions. In 2024, a partial recovery of the NLI value to 95.0 is recorded, reflecting a gradual increase in the resilience of the energy infrastructure and economic activity in the region.
In 2023 (the year of resilience and recovery), a sharp increase in several indicators is observed. The RSTI index sharply rises to 120.0, suggesting significant restoration and even new construction exceeding the pre-war level, likely due to the influx of internally displaced persons (IDPs) and humanitarian aid/recovery efforts in Transcarpathia as a safe haven. This is the main reason for the jump in the Iter index from 26.64 to 44.98. The LUCI (1.2), MTCI (0.12), ICI (7.97), and AAPI (55.56) indicators show substantial growth, indicating renewed, albeit cautious, attention to tourism development and increased accessibility. The NLI index falls to 85.0. This may indicate nationwide energy supply disruptions affecting even safer regions, or possibly a slight decrease in overall economic activity compared to the pre-war baseline (if 100 is taken as the pre-war norm). In the 2023–2024 period, relative stabilization and moderate growth of key indicators are observed. Thus, the Index of Restoration of Social and Tourist Infrastructure (RSTI) in 2024 was 70.0 — after a sharp jump in 2023 (120.0), recovery work continued but at a more balanced level. This may indicate the completion of the most priority projects or limited resources and economic difficulties caused by the ongoing war. The LUCI (from 1.2 in 2023 to 2.5 in 2024), MTCI (from 0.12 to 0.20), ICI (from 7.97 to 10.39), and AAPI (from 55.56 to 62.50) indices demonstrate positive dynamics, but the growth of these indicators becomes more gradual compared to the 2022–2023 period. This reflects the sustained adaptation of tourism infrastructure to crisis conditions and gradual development with limited opportunities. The Night Lighting Index (NLI) increased from 85.0 in 2023 to 95.0 in 2024, which may indicate the restoration and relative stability of the energy infrastructure in the region, as well as the revitalization of economic activity. The Integrated Land Use and Infrastructure Index (Iter), on the contrary, decreased from 44.98 in 2023 to 40.10 in 2024. This decrease may be due to the adjustment of the RSTI value: if its sharp increase in 2023 had a significant impact on the final Iter index, then in 2024, a more moderate RSTI value affected the overall decrease in the indicator, despite the growth of other components. Overall, the indicators reflect the complex dynamics of the region, which in 2022 was in a state of stagnation, in 2023 at the peak of recovery, and in 2024 in a phase of stable but restrained growth. This confirms the high adaptability and resilience of the Transcarpathia region in the context of the ongoing military conflict.
3.1.3. Spatial Analysis of Tourism Clustering (MTCI)
To assess the degree of tourism activity clustering in Transcarpathia, the MTCI index was used, calculated for two main directions: Uzhhorod–Velykyi Bereznyi and Rakhiv–Yasinia. The correction factor K for the first direction was set at 1.0, and for the second, at 1.2, reflecting the greater tourism potential of the Rakhiv–Yasinia mountain cluster.
The dynamics of clustering by year are as follows. In 2022, the MTCI index value was 0.05, extremely low for both directions, indicating an almost complete halt in the formation of tourism associations and new initiatives. This is explained by the shock from the start of the full-scale war and the prioritization of basic security over tourism development. The value of this indicator for the Uzhhorod–V. Bereznyi cluster was 0.05, and for Rakhiv–Yasinia (with K=1.2): 0.06.
In 2023, the MTCI indicator increased to 0.12, which points to the emergence of new tourism initiatives and agritourism estates, associated with the influx of internally displaced persons and the growth of domestic tourism. For the Uzhhorod–V. Bereznyi cluster, this indicator was 0.12, and for Rakhiv–Yasinia: 0.14.
In 2024, the MTCI value was 0.20, reflecting the gradual activation of the tourism industry and the development of new routes. Despite the ongoing war, the data indicates a steady increase in clustering. This indicator for the Uzhhorod–V. Bereznyi cluster was 0.20, and for Rakhiv–Yasinia: 0.24.
Analysis shows that the Rakhiv–Yasinia direction consistently demonstrates higher MTCI values due to the increased tourism potential of the mountain region (coefficient K=1.2). In 2022, activity was practically absent, but in 2023–2024, there’s a steady increase in clustering, associated with the recovery of domestic tourism, the development of eco-trails, and the creation of agritourism estates. This dynamic reflects the adaptation of the tourism industry to crisis conditions: first, a period of complete stagnation, then rapid recovery and moderate growth even with ongoing economic constraints.
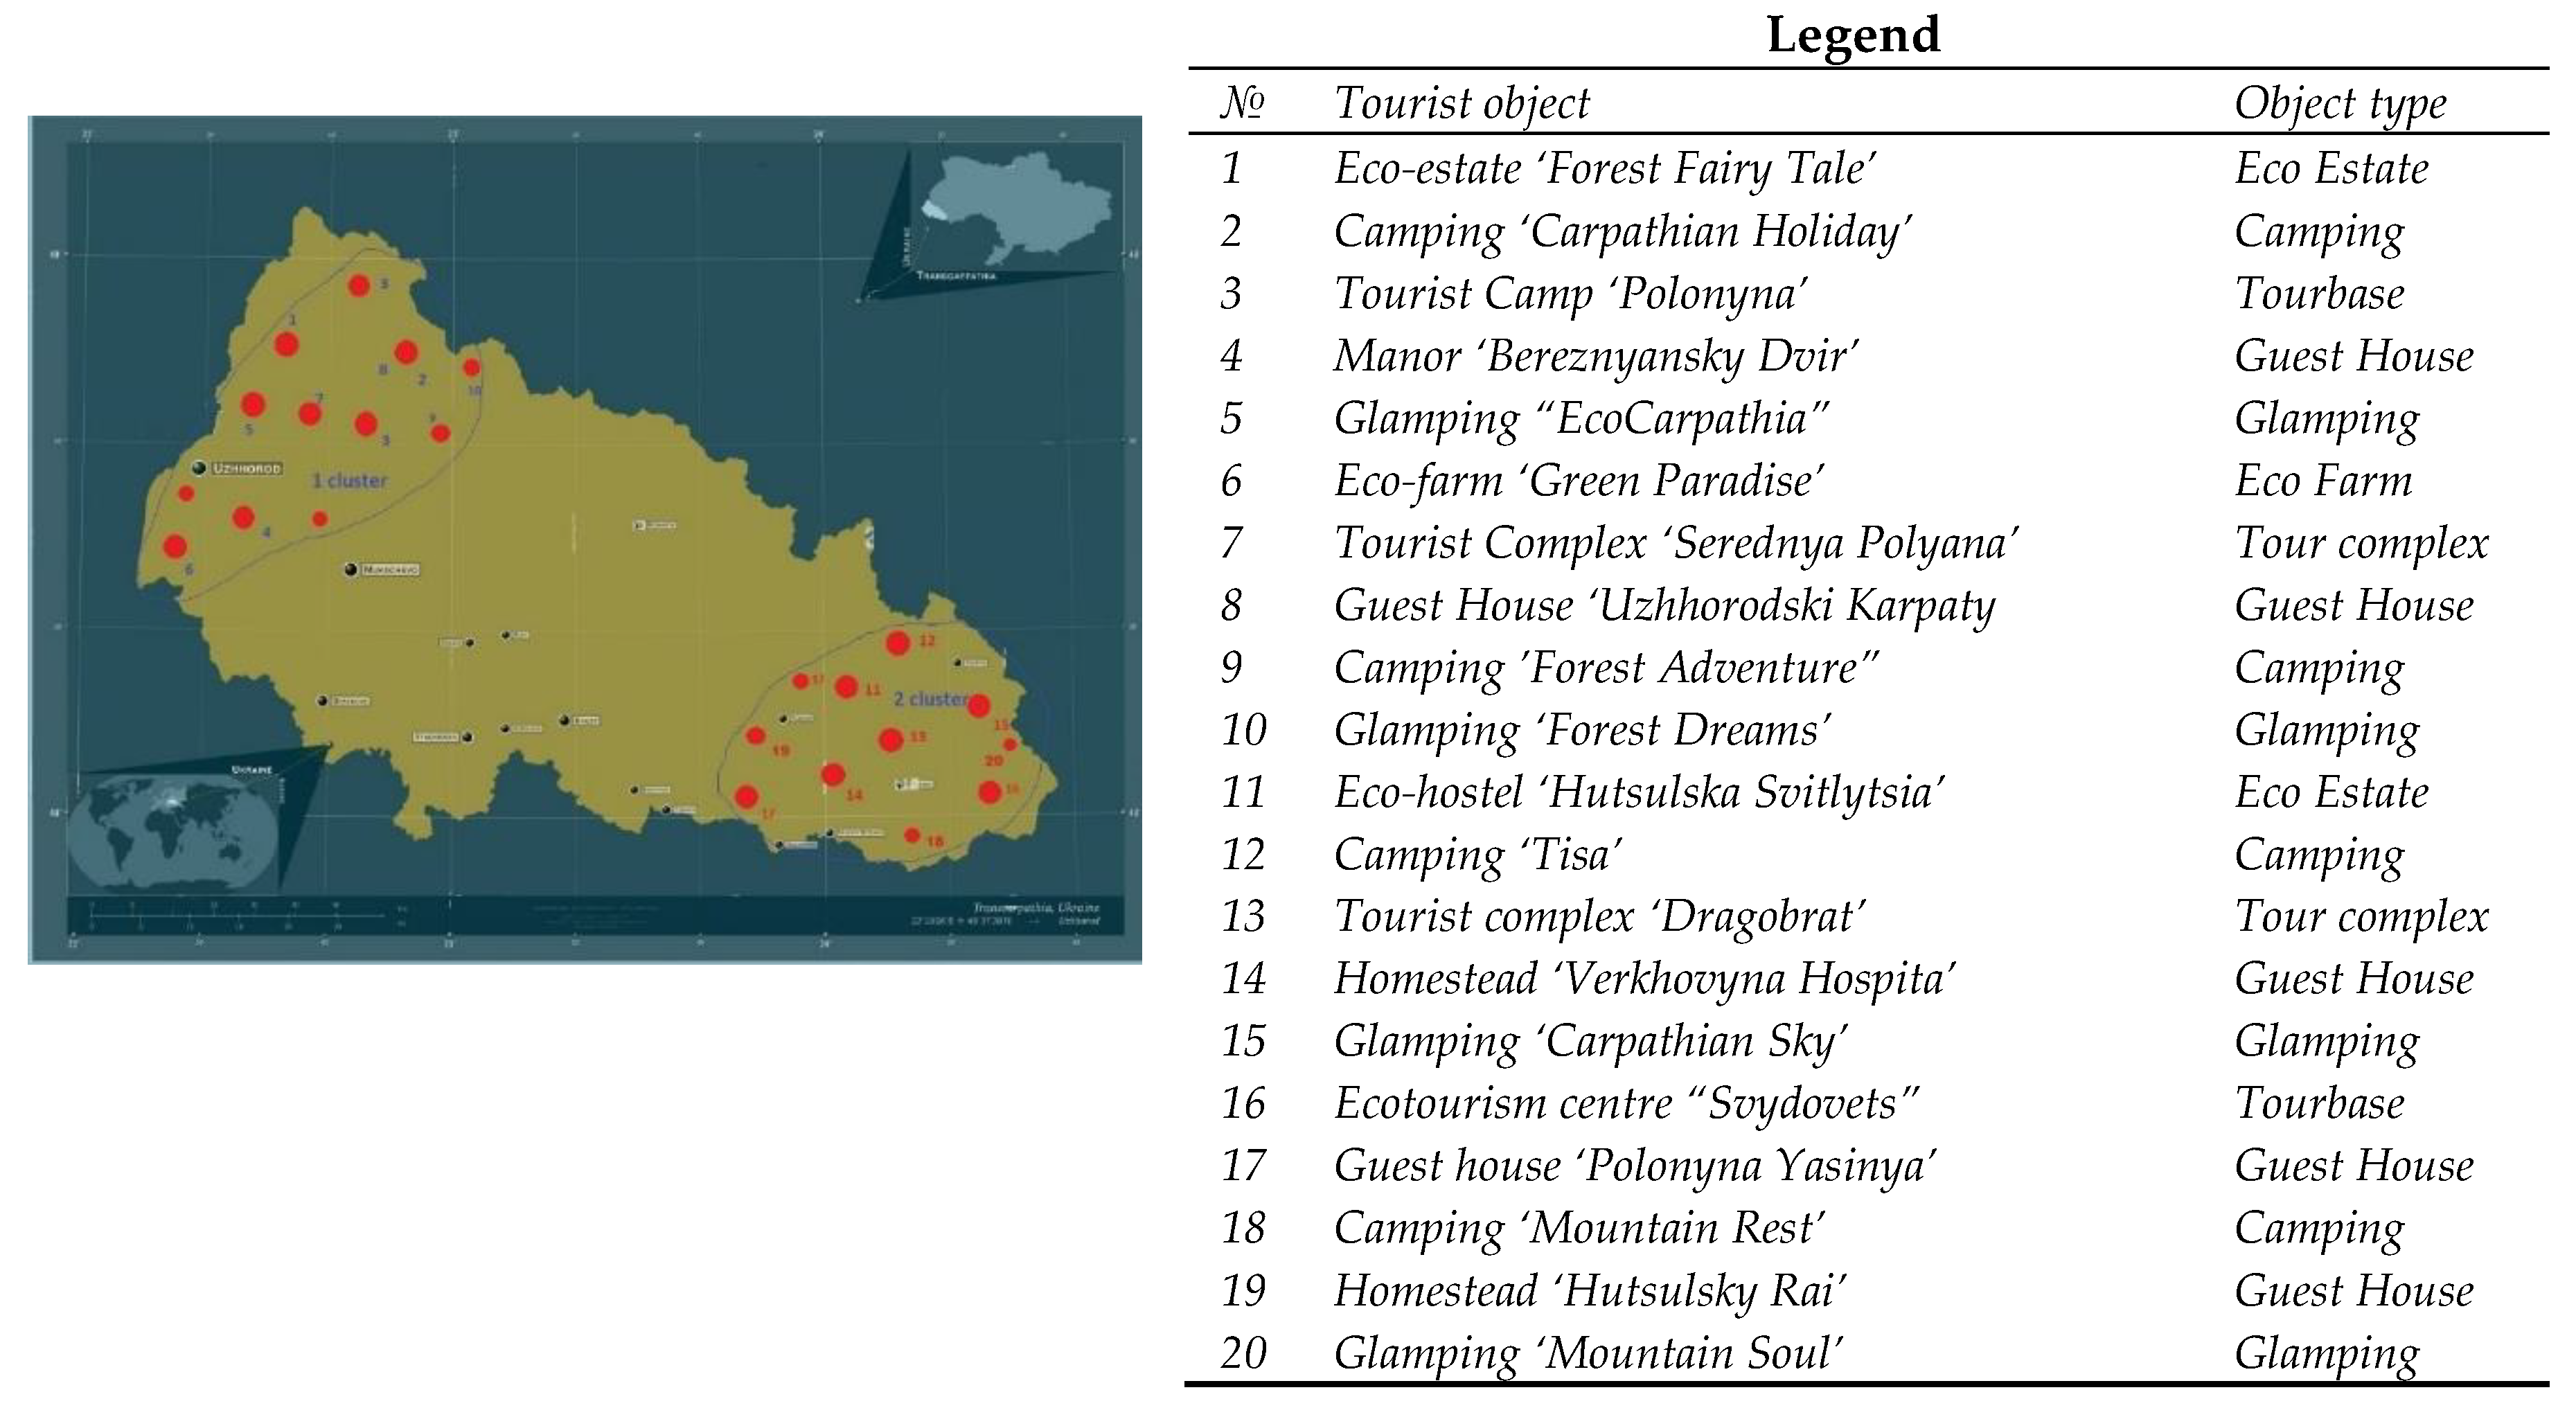
To assess the level of integration of tourism objects, the values of the tourism clustering indicator (MTCI) were calculated for two key directions in Transcarpathia region —Uzhhorod–V. Bereznyi and Rakhiv–Yasinia. The MTCI indicator reflects the degree of cooperation between tourism objects (eco-homesteads, campsites, tourist bases, glamping sites, etc.), which is an important indicator of the development of sustainable tourism clusters in the region (Table 4).
The Rakhiv–Yasinia cluster demonstrates a higher average MTCI of 0.80, indicating more developed cooperation among tourism facilities, extensive use of joint services, and the region’s attractiveness to tourists due to its mountains and developed infrastructure. The Uzhhorod–V.Bereznyi cluster has a medium level of integration (MTCI = 0.71), which suggests existing interaction between facilities but also significant potential for expanding joint initiatives and creating new tourist routes. Thus, the comparative analysis shows that Rakhiv–Yasinia is a more consolidated tourism cluster, while Uzhhorod–V.Bereznyi requires activation of joint projects to increase the level of integration and the region’s competitiveness in the tourism market.
To visually represent the differences in clustering levels by type of tourism object, a diagram was constructed showing the average MTCI values in the two clusters—Uzhhorod–V.Bereznyi and Rakhiv–Yasinia (Figure 5).
The diagram confirms that in all categories of tourism objects, MTCI indicators are higher in the Rakhiv–Yasinia cluster, indicating closer cooperation and a high level of integration. The gap is particularly noticeable for glamping sites (0.83 vs. 0.675) and tourist complexes (0.85 vs. 0.76), which reflects the active development of tourism infrastructure in the mountain region. The Uzhhorod–V.Bereznyi cluster demonstrates lower values, underscoring the potential for strengthening cooperation among tourism objects.
Figure 6.
Placement of tourist facilities in clusters Uzhgorod-V.Bereznyi (1st cluster) and Rakhov-Yasinya (2nd cluster).
Figure 6.
Placement of tourist facilities in clusters Uzhgorod-V.Bereznyi (1st cluster) and Rakhov-Yasinya (2nd cluster).
3.2. Environmental Sustainability Assessment
3.2.1. Comparative Analysis of NDVI and NDWI for 2022-2024 by Key Natural Areas (Carpathians, Solotvyno)
NDVI and NDWI indices were calculated for 2022-2024 to assess the dynamics of vegetation cover and water resources in the region (Table 5).
The indicators show a gradual recovery: NDVI increased from 28.57 in 2022 to 36.00 in 2024, indicating an increase in vegetation density, especially in forested areas of the Carpathians. Similarly, NDWI increased from 9.09 to 17.00, reflecting an improvement in water saturation, which may be related to increased precipitation and reduced anthropogenic pressure in remote areas. In the Solotvino area, the increase in indicators is less pronounced, which is related to local environmental problems (salt pits and reduction of bio-diversity) (Figure 7).
3.2.2. Identification of Areas with High Risk of Soil Degradation (SDRI) and Surface Temperature Changes (STCI)
To assess the dynamics of environmental risks in the Transcarpathia region, the SDRI (soil degradation risk) and STCI (surface temperature change) indicators were calculated for 2022–2024 (Figure 8). The SDRI values remain within 7.81–7.20%, which is below the critical threshold of 30%. These indicators make it possible to identify potentially vulnerable areas where land deterioration and an increase in temperature anomalies are observed.
SDRI remains within 7–8% throughout the entire period, which is significantly below the critical threshold of 30%. However, small fluctuations may be associated with local soil load in agricultural areas. The STCI indicator increased from 2.86 in 2022 to 4.20 in 2024, indicating a localized increase in surface temperature. This can be attributed to both global climatic trends and changes in land use (reduction of forest areas in certain plots). However, local zones of soil degradation risk are recorded in open agricultural territories and near mining enterprises. For the spatial analysis of SDRI and STCI, a map was created displaying zones with increased risk of soil degradation and changes in surface temperature. The most vulnerable territories are located in lowland areas and around economically developed lands, while the Carpathian forest areas maintain relatively stable indicator values. (Figure 9).
Figure 9.
Changes in SDRI and STCI in Transcarpathia for 2022–2024.
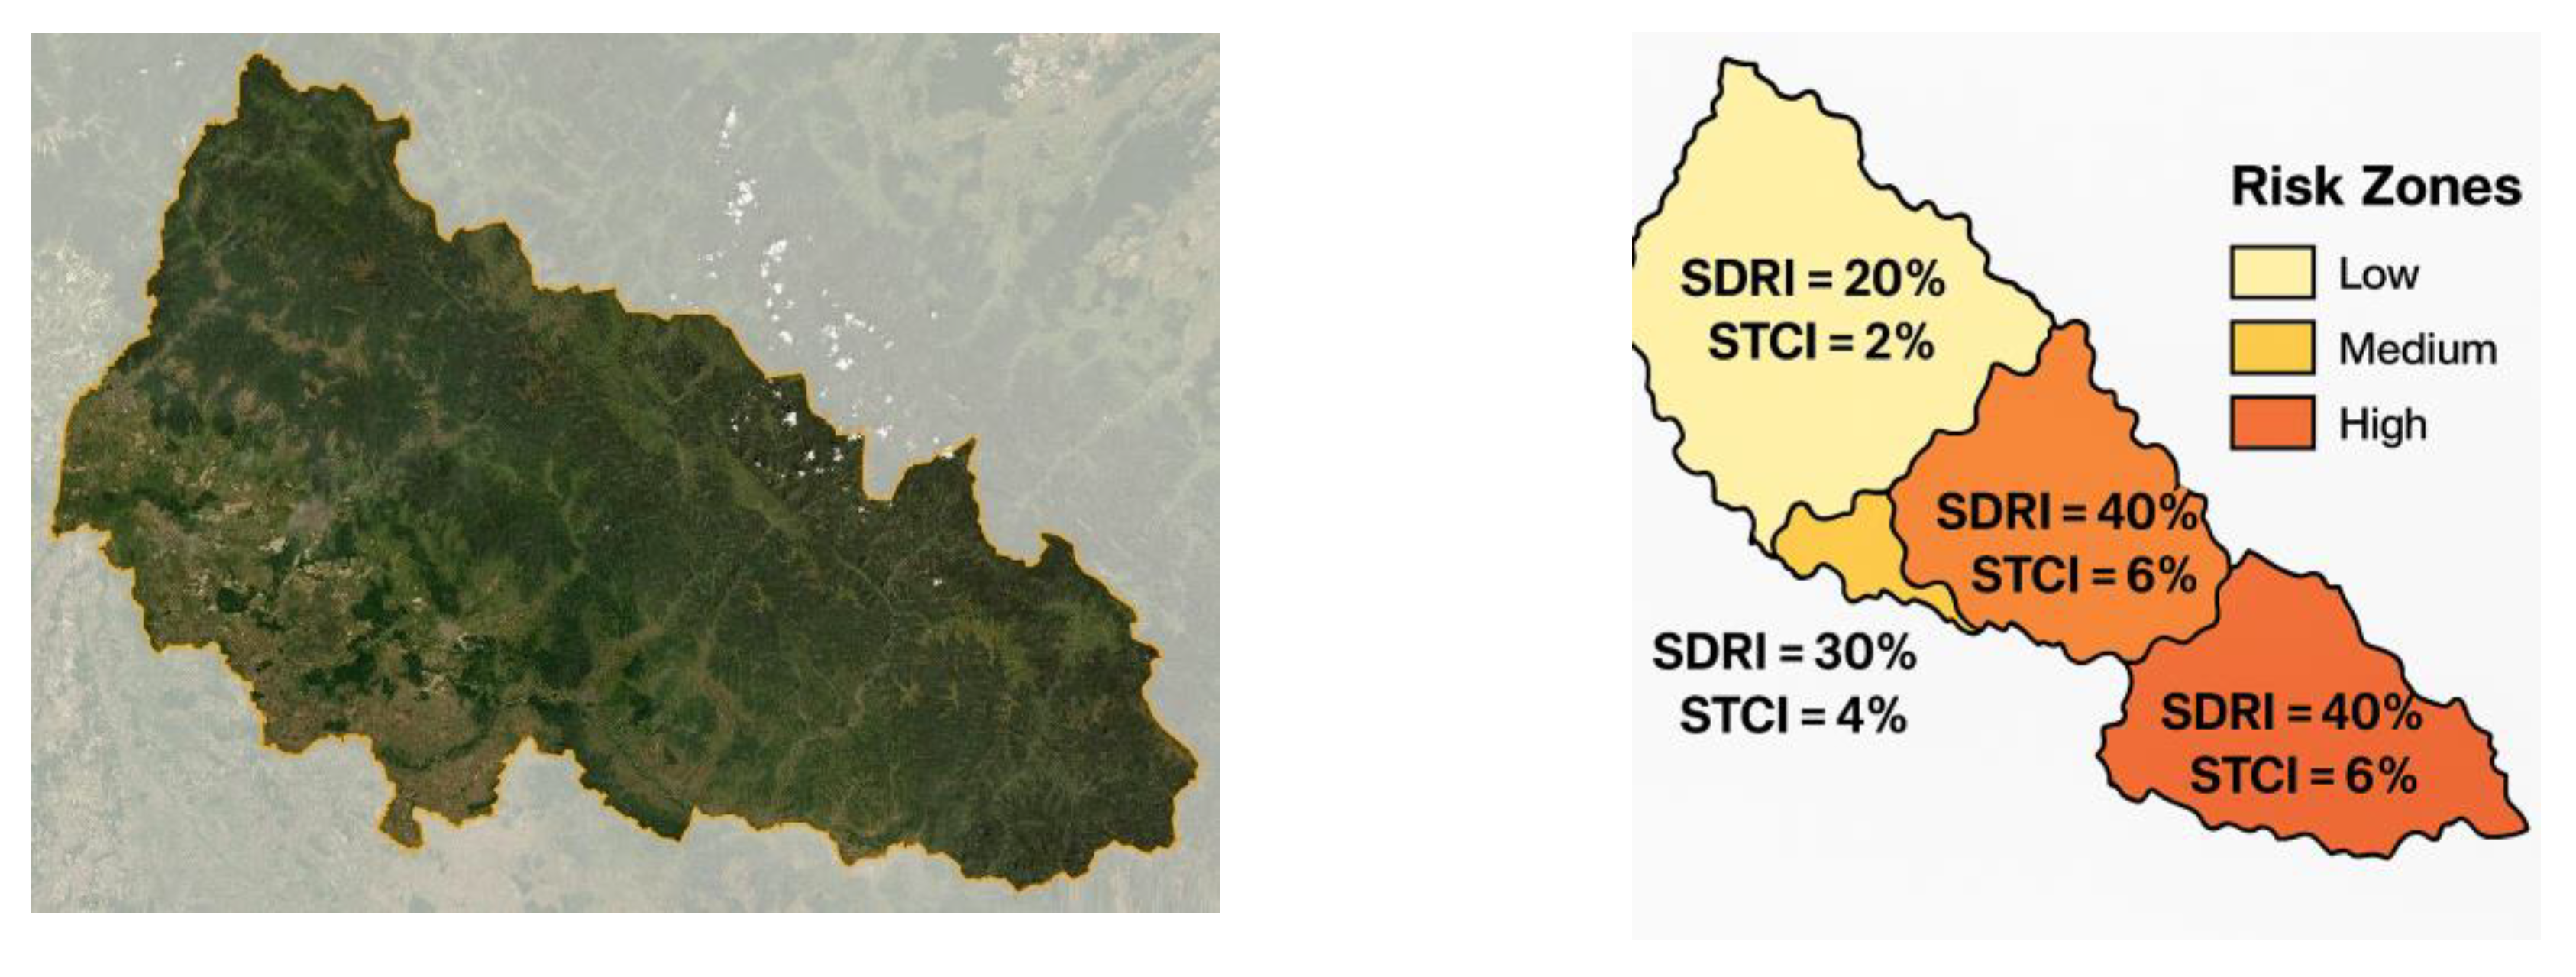
This map shows the conditional distribution of ecological risks across Transcarpathia based on SDRI (soil degradation) and STCI (surface temperature change) indicators.
The Western zone is characterized by an increased risk of soil degradation (SDRI = 8.5%) and the largest increase in surface temperature (STCI = 4.5%).
The Central zone has the most favorable conditions (SDRI = 6.0%, STCI = 3.5%).
The Eastern zone demonstrates average values for both indicators (SDRI = 7.5%, STCI = 4.0%), which indicates a moderate level of ecological load.
Overall, this map allows for identifying territories where stricter environmental protection measures and land resource monitoring are required.
3.2.3. Assessment of the State of Protected Areas and Green Corridors
The area of protected territories and green corridors (RZGCA) gradually increased: from 10.00 in 2022 to 13.00 in 2024. This reflects efforts to expand protected zones and restore ecosystems. The creation of new green corridors plays a key role in preserving biodiversity and forming a sustainable eco-network in the region, especially in the Carpathian mountain areas (Figure 10).
The map illustrates the gradual expansion of green corridors and protected areas in Transcarpathia during 2022–2024. The 2022 baseline territory includes existing nature reserves and national parks. In 2023, there was a noticeable increase in the area of protected lands, associated with the creation of new eco-trails and the expansion of protected zones. In 2024, additional areas were added, forming a more connected eco-network, which contributes to biodiversity conservation and enhances the region’s ecological sustainability.
3.2.4. Mapping of Environmental Change
To visually analyze the spatial distribution of changes in the NDVI, NDWI, SDRI, STCI, and RZGCA indices, thematic maps have been prepared. They allow for identifying areas with the most pronounced ecological changes:
- zones of improved vegetation cover — in the forest areas of the Carpathians;
- areas with risky soil degradation — on agricultural lands and near industrial facilities;
- regions with increased surface temperature — predominantly in lowland zones;
- expanding protected areas — in the vicinity of the Carpathian Biosphere Reserve and adjacent eco-corridors.
Such cartographic visualization enables a comprehensive assessment of the region’s ecological sustainability dynamics and links it to the values of the integral Iek index, which increased from 47.40 in 2022 to 50.92 in 2024 (Figure 11).
The map illustrates the gradual expansion of green corridors and protected areas in Transcarpathia during 2022–2024. The 2022 baseline territory includes existing nature reserves and national parks. In 2023, there was a noticeable increase in the area of protected lands, associated with the creation of new eco-trails and the expansion of protected zones. In 2024, additional areas were added, forming a more connected eco-network, which contributes to biodiversity conservation and enhances the region’s ecological sustainability.
3.3. Socio-Economic and Digital Resilience Indicators
3.3.1. Dynamics of Population Return to Rural Communities (DRI) After Peak Resettlement
The DRI indicator decreased from 100% in 2022 to 85% in 2023 and 82% in 2024, reflecting a gradual but incomplete return of displaced persons to rural communities. The highest return rate was recorded immediately after the start of displacement (2022), while in subsequent years, the pace stabilized amidst ongoing military actions. The DRI indicator reflects the share of people who have returned to rural communities relative to the total number of displaced persons (Figure 12).
In 2022, DRI was 100%, which is associated with the initial return of the population after the peak of displacement. In 2023, the indicator decreased to 85%, and in 2024, to 82%, indicating a slowdown in return rates due to ongoing military actions and economic instability.
3.3.2. Development of Local Tourism Clusters and Bookings (TCCI, TBDI)
To assess the recovery of the tourism sector, TCCI (formation of tourism clusters) and TBDI (number of tourist bookings on Booking, Airbnb and local services) indicators were calculated (Figure 13).
From 2022 to 2024, TCCI increased from 8.0 to 22.0, reflecting the active formation of new tourism associations. TBDI grew from 100.0 to 135.0, surpassing the pre-war level, which is linked to the rise in domestic tourism and increased online bookings, indicating a recovery and even exceeding of pre-war demand thanks to internal tourism and Booking and Airbnb platforms.
3.3.3. Assessing Digital Accessibility (DAI)
The DAI indicator increased from 70% in 2022 to 88% in 2024, reflecting the expansion of mobile coverage, internet infrastructure (4G, Starlink) and online booking services. The DAI indicator reflects the degree of mobile and internet coverage, as well as the availability of online booking services (Figure 14).
The increase in DAI index is due to the expansion of 4G network, Starlink connectivity and development of digital services for tourists.
3.3.4. Dynamics of Employment in Rural Tourism (SSELI)
SSELI increased from 15% in 2022 to 19.5% in 2024, indicating an increase in employment in tourism and related services (hotels, agro-houses, catering, transport) (Figure 15).

Table 6.
Employment dynamics in tourism and related services in the Transcarpathian region (2022-2024).
Table 6.
Employment dynamics in tourism and related services in the Transcarpathian region (2022-2024).
| Year | Hotels and health resorts | Agro-houses | Catering | Transport services | Other services | Total employment |
|---|---|---|---|---|---|---|
| 2022 | 400 | 150 | 300 | 200 | 100 | 1150 |
| 2023 | 460 | 200 | 350 | 230 | 120 | 1360 |
| 2024 | 500 | 230 | 380 | 250 | 140 | 1500 |
Data shows stable employment growth in tourism and related services:
Hotels and sanatoriums – increase from 400 people in 2022 to 500 people in 2024.
Agritourism estates – almost 50% growth (from 150 to 230 people), linked to the development of rural tourism.
Public catering – increase by 80 people, reflecting the growth in tourist numbers and internal demand.
Transport services – gradual increase (from 200 to 250 people) due to tourist transportation.
Other services – growth from 100 to 140 people, including craft workshops, excursions, local services.
Total employment in the sector grew from 1150 people in 2022 to 1500 people in 2024, indicating the expansion of the tourism economy even amidst the ongoing war. The structure of employment by type of work is shown in Figure 16.
The analysis of Figure 16 shows the growth of all categories of workers and an increase in their share in the regional economy.
3.4. Integrated Sustainable Development Index (IRSDRT)
3.4.1. Representation of the Aggregated IRSDRT Index by Year (2022, 2023, 2024).
The IRSDRT (Integral Index of Sustainable Rural Tourism Development) indicator grew from 42.45 in 2022 to 53.38 in 2023 and 53.44 in 2024, reflecting active recovery after the start of the war and a transition to a phase of more stable development. The largest growth occurred in 2023, which is associated with a sharp increase in the values of sub-indices Iter, Iek, and Isoc (Figure 17).
Figure 17.
Values of Iter, Iek, Isoc sub-indices and IRSDRT integral index in Transcarpathia (2022-2024).
Figure 17.
Values of Iter, Iek, Isoc sub-indices and IRSDRT integral index in Transcarpathia (2022-2024).
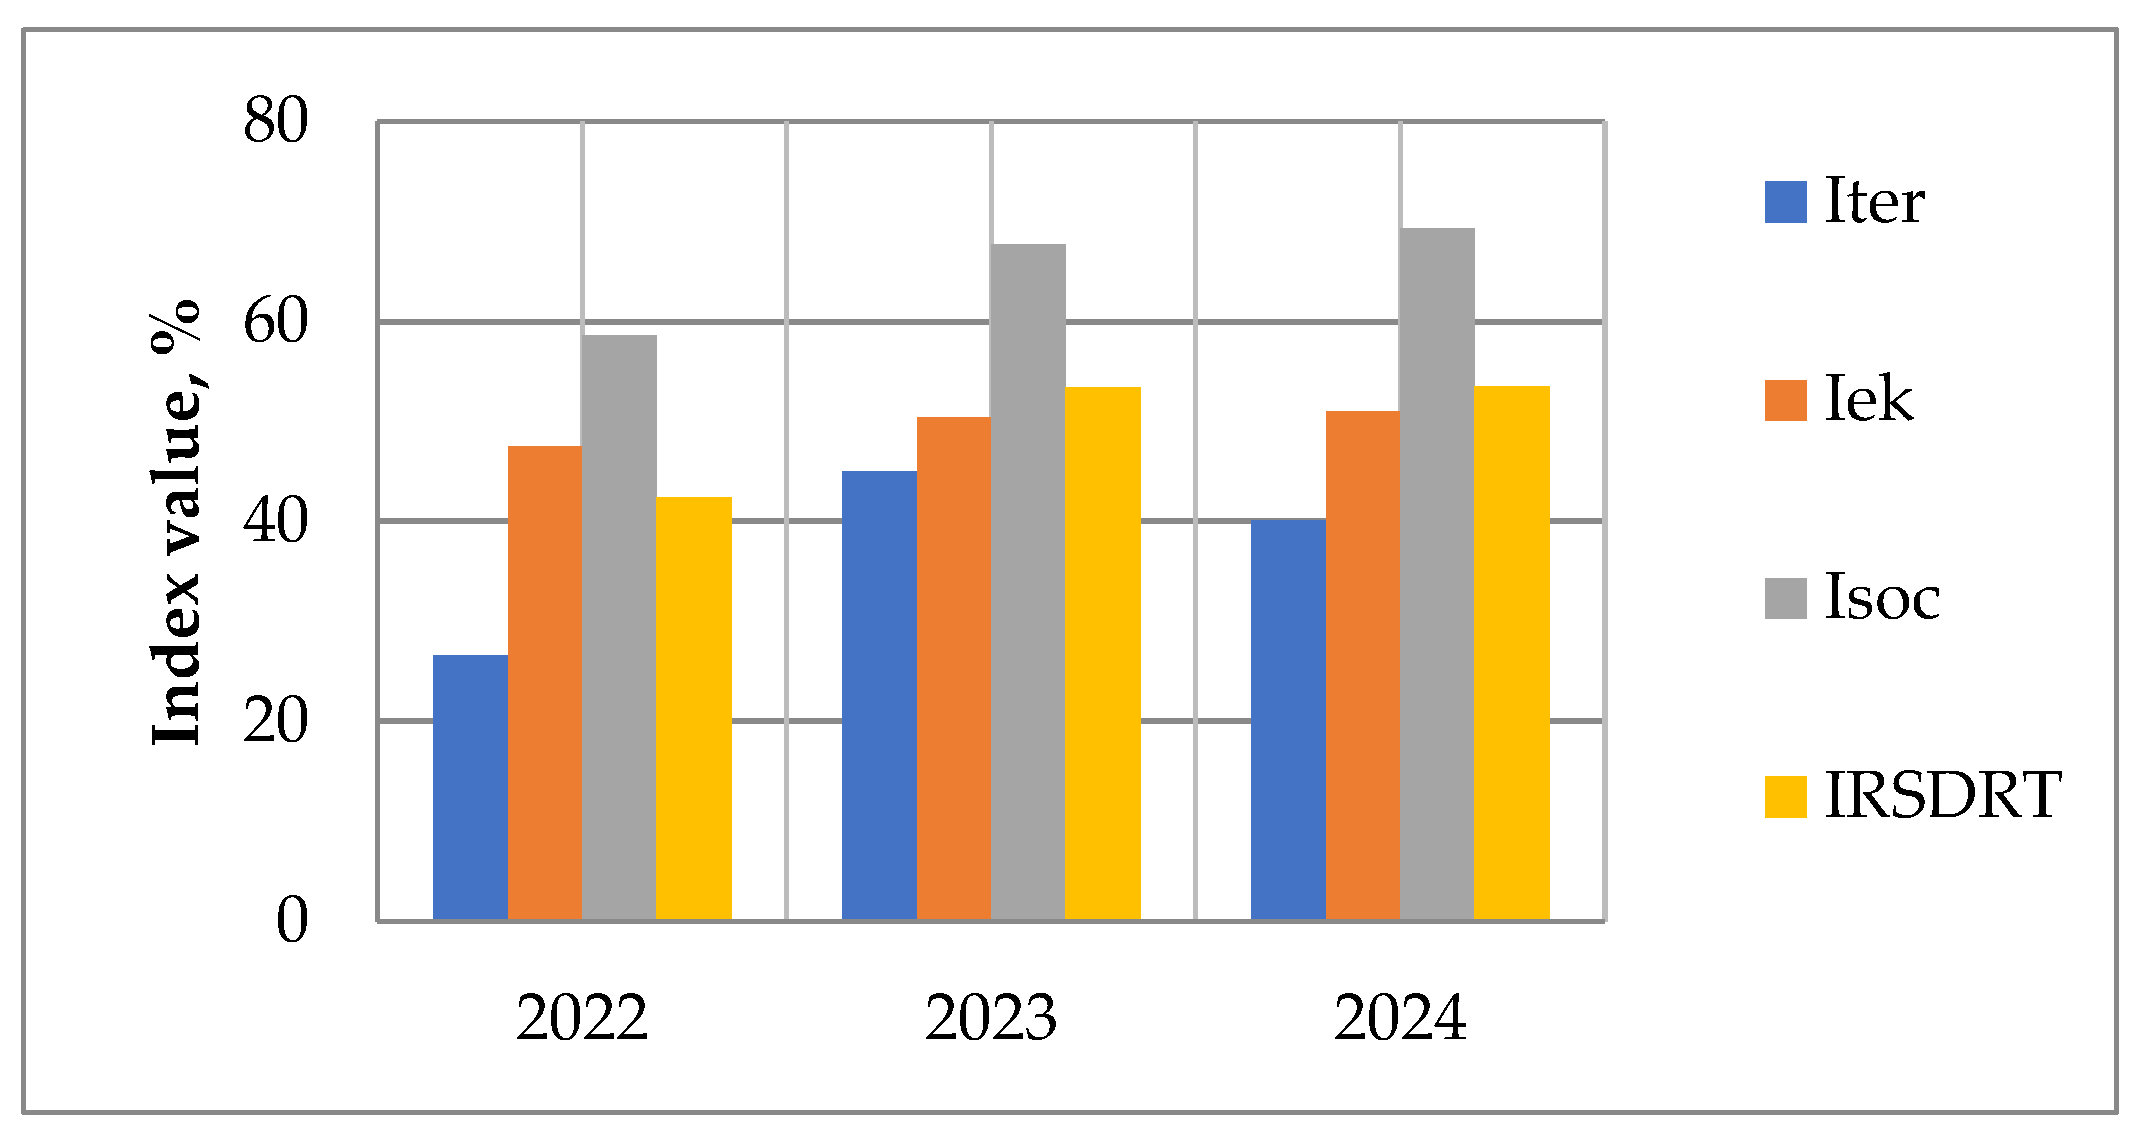
Figure 17 reflects the dynamics of the sub-indices of sustainable rural tourism development (Iter, Iek, Isoc) and the aggregated IRSDRT index for 2022–2024. Iter (land use and infrastructure) grew from 26.64 in 2022 to 44.98 in 2023, but decreased to 40.10 in 2024 due to a slowdown in the pace of infrastructure recovery after the peak year. Iek (environmental sustainability) gradually increased (47.40 → 50.92), which is associated with an increase in NDVI, NDWI, and the expansion of protected areas (RZGCA). Isoc (socio-economic sustainability and digitalization) shows stable growth from 58.60 to 69.30 due to increased employment, digital accessibility, and the development of tourism bookings. IRSDRT shows significant improvement from 42.45 in 2022 to 53.38 in 2023, with a slight increase to 53.44 in 2024, indicating a gradual stabilization of the region’s development after the active recovery phase. Overall, the dynamics demonstrate significant progress in tourism and infrastructure development, with socio-economic factors and environmental initiatives remaining the main drivers of growth.
Figure 18 illustrates the conditional spatial distribution of growth zones, transition zones, and risk zones based on the values of the integral IRSDRT index. Growth zones (dark green color) cover territories with high Iter and Isoc indicators, developed tourism infrastructure, significant employment in tourism, and a good level of digital accessibility. Transition zones (yellow color) are characterized by average sub-index values and have development potential, but are currently limited by resources and infrastructure. Risk zones (orange color) are territories with low IRSDRT indicators, where weak infrastructure recovery, limited tourist flow, and a low level of digitalization are observed. Such a distribution allows for identifying priority territories for investments and support measures aimed at tourism development and the sustainable integration of rural communities into the region’s economy.
The constructed IRSDRT map shows that the highest index values are concentrated in areas with developed tourism infrastructure (Uzhhorod–V.Bereznyi, Rakhiv–Yasinia) and good internet coverage. Central and mountainous communities have average IRSDRT values, while remote rural areas demonstrate lower indicators due to weak infrastructure. The identification of “growth zones” and “risk zones” is as follows. Growth zones: territories with high Iter and Isoc values (Rakhiv–Yasinia areas, Uzhhorod surroundings), where cluster development, active booking, and employment growth are observed. Risk zones: remote communities with a low level of DAI, weak infrastructure recovery (low Iter), and limited tourist flow.
3.5. Interpretation and Key Trends
Recovery is uneven. Mountainous areas (Rakhiv–Yasinia) show higher growth rates for Iter and Isoc due to their tourism potential and the development of agritourism estates and eco-trails. The Uzhhorod–V.Bereznyi sub-region also shows growth, but with lower MTCI and TCCI values, indicating incomplete integration of tourism facilities. Remote rural communities remain risk zones with low DAI, limited infrastructure, and weak tourist demand.
The main drivers of rural tourism growth in Transcarpathia are:
Digitalization (DAI) – the expansion of internet coverage and online services increases bookings (TBDI) and cluster formation (TCCI).
Infrastructure development (Iter) – the availability of roads, hotels, and tourist routes directly impacts employment (SSELI) and population return (DRI).
Environmental conditions (NDVI, RZGCA) – maintaining the natural environment enhances the region’s attractiveness for ecotourism.
To confirm the proposed hypothesis H1 “The integration of remote sensing data and geospatial analysis enables the effective monitoring and evaluation of sustainable rural tourism development in post-conflict areas by identifying spatial patterns of land use change, infrastructure recovery, and environmental impact, thereby supporting data-driven planning and policy-making,” a correlation analysis was conducted between digital, infrastructural, and environmental indicators:
DAI ↔ TBDI and SSELI – a high level of digital accessibility is linked to increased online bookings and employment.
Iter ↔ DRI and SSELI – infrastructure recovery contributes to population return and job creation.
Iek ↔ Iter – areas with developed infrastructure more often combine it with the expansion of protected areas and ecotourism.
The correlation matrix is presented in Figure 19.
Here’s the verbatim translation of your text into English:
The correlation matrix shows the interrelationships between key indices, reflecting the sustainable development of rural tourism in Transcarpathia:
IRSDRT has a strong positive correlation with Iter, Isoc, and DAI, confirming the complex influence of infrastructure development, socio-economic activity, and digital accessibility on the integral index.
Iter (land use and infrastructure) positively correlates with TCCI, TBDI, and SSELI, indicating a direct link between infrastructure recovery, the formation of tourism clusters, increased bookings, and employment.
Isoc (socio-economic sustainability) has a high correlation with DAI, TBDI, and DRI, reflecting the influence of digitalization and population return on the region’s socio-economic development.
Iek (environmental sustainability) demonstrates a moderate positive correlation with Iter and Isoc, indicating that infrastructure and employment development is accompanied by the expansion of protected areas and improved environmental indicators.
DAI is closely linked to TBDI and SSELI, confirming that digital accessibility is an important factor in the growth of bookings and employment in the tourism sector.
Overall, the results confirm that the sustainable development of tourism in the region depends on the synergy of infrastructure, digitalization, and socio-economic factors, with environmental sustainability playing a supporting role by increasing the region’s attractiveness for domestic tourism.
4. Discussion
The study results demonstrate that integrating remote sensing data and geospatial analysis allows for effectively monitoring the sustainable development of rural tourism in post-conflict regions, which aligns with the conclusions of Brezzi et al. [45] and Cardoso et al. [46]. Our data confirm that combining satellite indicators (NLI, NDVI, NDWI) with socio-economic indicators (TBDI, SSELI) provides a comprehensive assessment of recovery processes, as hypothesized in H1. This approach corresponds to the methodology proposed by Shcherbak et al. [12] but expands it by including digital markers (DAI), which is particularly relevant for post-conflict conditions where traditional data collection methods are often unavailable [3,4].
The observed growth in LUCI and MTCI indices in 2023–2024 indicates the formation of tourism clusters, similar to trends described by Stanovčić et al. [54] for Montenegro. However, unlike their findings, our data show that in Transcarpathia, clustering is more pronounced in mountainous areas (Rakhiv–Yasinia), emphasizing the role of natural potential as a driver of recovery. This contradicts Zwierzchowska’s [56] assertions about the risks of excessive centralization of tourist flows, as in our case, the cluster approach contributed to the even development of infrastructure.
The dynamics of NLI revealed a paradoxical effect: despite military actions, the indicator remained stable (100% in 2022), which contrasts with data from other conflict regions [3,5]. This confirms Bobek et al.’s [6] thesis about the adaptability of “safe havens” but requires a revision of NLI interpretation as a universal indicator – in our case, its decrease in 2023 (85%) reflected not local destruction but systemic power supply interruptions.
Socio-economic results (TBDI growth to 135%) align with Font, McCabe’s [24] concept of “slow tourism” but complement it with an important aspect: digitalization (DAI) became a key factor of sustainability, which was not noted in Jamrozy’s [25] research for pre-war conditions. The correlation of DAI and SSELI (r = 0.82) confirms Hysa et al.’s [27] conclusions about the transformative role of digital platforms for rural territories.
Ecological indices (Iek) showed that the expansion of nature reserves (RZGCA) does not contradict infrastructure development, which refutes the “economy vs. ecology” dichotomy [8,9]. On the contrary, as Ryglová et al. [32] predicted, sustainable tourism in Transcarpathia became a catalyst for ecosystem recovery (NDVI growth from 28.57 to 36.00).
The limitations of the study are related to the impossibility of verifying some data (e.g., informal tourism initiatives) and dependence on satellite image resolution. A promising direction is the integration of AI algorithms [55] for forecasting IRSDRT dynamics, considering conflict resolution scenarios.
5. Conclusions
The conducted research allowed for a quantitative assessment of the dynamics of sustainable rural tourism development in Transcarpathia for 2022–2024 and identified the following key trends.
For infrastructure recovery and land use, a sharp increase in the RSTI index (infrastructure restoration) from 0.0 in 2022 to 120.0 in 2023 is characteristic, which is associated with active construction and the influx of IDPs, but in 2024 it decreased to 70.0, indicating the completion of priority projects. The LUCI (tourism object development) and MTCI (tourism clustering) indicators also increased, by 5 times (from 0.5 to 2.5) and from 0.05 to 0.20, respectively, confirming the growth in the number of eco-homesteads and campsites. The NLI (night lighting) indicator remained stable (100% in 2022), but decreased to 85% in 2023 due to the energy crisis, and recovered to 95% in 2024, reflecting an improvement in economic activity.
The dynamics of ecological sustainability are also characterized by the following changes. Thus, NDVI (vegetation cover) grew from 28.57 to 36.00, and NDWI (water resources) – from 9.09 to 17.00, which indicates ecosystem recovery. SDRI (soil degradation risk) remained low (7.81–7.20%), and STCI (surface temperature) increased from 2.86 to 4.20, which requires monitoring of anthropogenic impact. The area of protected zones (RZGCA) expanded from 10.00% to 13.00%, confirming efforts to preserve biodiversity.
Changes also occurred in the third component of monitoring – the socio-economic development of the region. DRI (population return) decreased from 100% in 2022 to 82% in 2024, reflecting incomplete recovery of migration flows. The TBDI (bookings) indicator exceeded the pre-war level (135% in 2024), and SSELI (tourism employment) grew from 15% to 19.5%, demonstrating sector growth. DAI (digital accessibility) increased from 70% to 88%, which contributed to the development of online bookings and the integration of tourism clusters.
The final assessment of the level of sustainable rural tourism development in post-conflict areas using remote sensing and geospatial analysis was measured by the integral index (IRSDRT). The overall sustainability index grew from 42.45 in 2022 to 53.44 in 2024, with socio-economic (Isoc = 69.30) and infrastructural (Iter = 40.10) factors making the largest contribution. Correlation analysis confirmed a strong link between DAI and TBDI (r ≈ 0.85) and Iter and SSELI (r ≈ 0.78), which emphasizes the importance of digitalization and infrastructure for sustainable development. Thus, the study confirmed the hypothesis that geospatial methods are effective for monitoring post-conflict recovery. Despite the war, Transcarpathia demonstrates sustainable growth in the tourism sector, but further development requires strengthening environmental protection measures and supporting remote communities with low IRSDRT levels.
Author Contributions
Conceptualization, V. Shcherbak and O. Dorokhov; Methodology, V. Shcherbak and T. Kostyshyna; Software, V. Riashchenko; Validation, V. Shcherbak, O. Dorokhov and V. Yatsenko; Formal Analysis, V. Shcherbak and V. Riashchenko; Investigation, V. Shcherbak and T. Kostyshyna; Resources, V. Yatsenko; Data Curation, V. Riashchenko and T. Kostyshyna; Writing – Original Draft Preparation, V. Shcherbak and O. Dorokhov; Writing – Review & Editing, V. Shcherbak, O. Dorokhov, V. Riashchenko, T. Kostyshyna and V. Yatsenko; Visualization, V. Riashchenko; Supervision, O. Dorokhov; Project Administration, V. Shcherbak; Funding Acquisition, V. Yatsenko. All authors have read and agreed to the published version of the manuscript.
Funding
This research received no external funding.
Institutional Review Board Statement
Not applicable.
Informed Consent Statement
Not applicable.
Data Availability Statement
The research used publicly accessible datasets and secondary information from multiple open sources. Satellite imagery and geospatial data were obtained from Sentinel-2, Landsat, MODIS, VIIRS, and DMSP-OLS, which are available through Google Earth Engine (https://code.earthengine.google.com/) and related open data platforms. Tourism-related spatial and infrastructural information was derived from OpenStreetMap (https://www.openstreetmap.org/), Google Maps, and official tourism registries of the Transcarpathia Regional State Administration. Data on infrastructure recovery (RSTI) were sourced from the State Register of Damaged Property (Ukraine) and supplemented with Sentinel-2 imagery. Socio-economic and demographic indicators (DRI, TCCI, TBDI, SSELI) were compiled from State Statistics Service of Ukraine, regional development agencies, and publicly available booking platforms such as Booking.com and Airbnb. Information on digital accessibility (DAI) was based on open data from Speedtest Intelligence, GSMA, Starlink Ukraine, and official procurement platforms (Prozorro). All datasets used in this study are publicly available and can be accessed through the respective portals listed above. No new proprietary or personal data were created during this research.
Acknowledgments
The authors express their gratitude to the Transcarpathia Regional Development Agency and local tourism associations for providing access to open statistical and geospatial data. We also acknowledge the support of colleagues from Sumy National Agrarian University and Poltava University of Economics and Trade for their valuable advice during the preparation of the manuscript. During the preparation of this manuscript, the authors used ChatGPT (OpenAI, 2025) to assist with English translation, grammar checking, and improving the text structure. The authors reviewed and edited all generated content and take full responsibility for the final version of this publication.
Conflicts of Interest
The authors declare no conflicts of interest. The funders had no role in the design of the study; in the collection, analyses, or interpretation of data; in the writing of the manuscript; or in the decision to publish the results.
Abbreviations
The following abbreviations are used in this manuscript:
| AAPI | Accessibility to Attraction Points Index |
| DAI | Digital Accessibility Index |
| DMSP-OLS | Defense Meteorological Satellite Program – Operational Linescan System |
| DRI | Demographic Return Index |
| GEE | Google Earth Engine |
| GIS (ГИС) | Geographic Information Systems |
| GSMA | Global System for Mobile Communications Association |
| ICI | Infrastructure Coverage Index |
| Iek | Ecological Sustainability Index |
| MTCI | Index of Mountain Tourism Clustering |
| IRSDRT | Integrated Rural Sustainable Development and Resilience Tourism Index |
| Isoc | Socio-Economic Sustainability Index |
| Iter | Land Use and Infrastructure Index |
| LUCI | Land Use Change Index (Tourism) |
| LULC maps | Land Use/Land Cover maps |
| MODIS | Moderate Resolution Imaging Spectroradiometer |
| NDVI | Normalized Difference Vegetation Index |
| NDWI | Normalized Difference Water Index |
| NLI | Night Light Index |
| OSM | OpenStreetMap |
| OVA (ОВА) | Regional Military Administration (Ukraine) |
| QGIS | Quantum Geographic Information System |
| RSTI | Recovery of Social and Tourist Infrastructure Index |
| RZGCA | Protected Areas and Green Corridors Area |
| SDRI | Soil Degradation Risk Index |
| SSELI | Service Sector Employment Level Index |
| STCI | Surface Temperature Change Index |
| TBDI | Tourism Booking Development Index |
| TCCI | Tourism Cluster Creation Index |
| VIIRS | Visible Infrared Imaging Radiometer Suite |
References
- Bakogiannis, E.; Potsiou, C.; Apostolopoulos, K.; Kyriakidis, C. Crowdsourced Geospatial Infrastructure for Coastal Management and Planning for Emerging Post COVID-19 Tourism Demand. Tourism Hospitality 2021, 2, 261–276. [Google Scholar] [CrossRef]
- Gan, L. Rural tourism incorporating artificial intelligence technology to help modernize rural revitalization. Appl. Math. Nonlinear Sci. 2023, 9. [Google Scholar] [CrossRef]
- Currie, D.; Skare, M.; Loncar, J. The impact of war on tourism: the case of Croatia. In Proceedings of the Name of the Conference on Tourism Economics, Palma de Mallorca, Spain, 28-29 May 2004, 1–14. Retrieved from https://www.researchgate.net/profile/Marinko-Skare/publication/228423759_The_impact_of_War_on_Tourism_the_case_of_Croatia/links/00b7d5228532ac12e0000000/The-impact-of-War-on-Tourism-the- case-of-Croatia.pdf.
- Mihalic, T. Tourism drop and recovery after the war – the case of Slovenia. Turizam 1999, 47, 61-66. https://www.researchgate.net/publication/271013900_Tourism_drop_and_recovery_after_the_war_-_The_case_of_Slovenia.
- Radnic, A.; Ivandic, N. War and tourism in Croatia – consequences and the road to recovery, Turizam 1999, 47, 43-54. https://eurekamag.com/research/003/334/003334219.php.
- Bobek, V.; Gotal, G.; Horvat, T. Impacts of the 2022 war in Ukraine on the travel habits of Ukrainian tourists. Naše Gospodarstvo/ Our Econ. 2023, 69, 56-67. [CrossRef]
- Đorđević, D.; Šušić, V.; Janjić, I. Perspectives of Development of Rural Tourism of the Republic of Serbia. Ekon. Tem, 2019, 57, 219–232. [Google Scholar] [CrossRef]
- Kesar, O. Building a Resilient Local Economy: The Influence of Global Crises on Deglobalization of the Tourism Supply System. Zagreb Int. Rev. Econ. Bus. 2022, 25(s1), 105–123. [Google Scholar] [CrossRef]
- Shcherbak, V.; Ganushchak-Yefimenko, L.; Nifatova, O.; Fastovets, N.; Plysenko, G.; Lutay, L.; Tkachuk, V.; Ptashchenko, O. Use of key indicators to monitor sustainable development of rural areas. Global J. Environ. Sci. Manage. 2020, 6, 175–190. [Google Scholar] [CrossRef]
- Morecroft, M. D.; Crick, H. Q. P.; Duffield, S. J.; Macgregor, N. A. Resilience to climate change: translating principles into practice. J. Appl. Ecol. 2012, 49, 547–551. [Google Scholar] [CrossRef]
- Moric, I. Clusters as a Factor of Rural Tourism Competitiveness: Montenegro Experiences. Bus. Syst. Res. 2013, 4, 94–107. [Google Scholar] [CrossRef]
- Shcherbak, V.; Dorokhova, L.; Riashchenko, V.; Dorokhov, O.; Djakona, V.; Yermolenko, O. Geoinformation Internet Platform for Interactive Charity Tourism in the Current Realities of Ukraine. Tourism Hospitality 2024, 5, 1199–1216. [Google Scholar] [CrossRef]
- Blešić, I.; Pivac, T.; Besermenji, S.; Ivkov-Džigurski, A.; Košić, K. Residents’ Attitudes and Perception towards Tourism Development: A Case Study of Rural Tourism in Dragacevo, Serbia. East. Eur. Countryside 2014, 20: 151–165. [CrossRef]
- Cardoso, L.; Araújo, A. F.; Santos, L. L.; Schegg, R.; Breda, Z.; Costa, C. Country Performance Analysis of Swiss Tourism, Leisure and Hospitality Management Research. Sustainability 2021, 13, 2378. [Google Scholar] [CrossRef]
- Lulaj, E.; Tase, M.; Gomes, C.; Cardoso, L. Navigating Financial Frontiers in the Tourism Economies of Kosovo and Albania during and beyond COVID-19. J. Risk Financ. Manage. 2024, 17, 142. [Google Scholar] [CrossRef]
- Bhandari, K. Nepalese tourism: crisis and beyond Nepal’s endeavor for tourism recovery. Tourism Zagreb 2004, 52, 375-383. https://eurekamag.com/research/004/246/004246450.php.
- Carballo, R. R.; León, C. J. The influence of artistically recreated nature on the image of tourist destinations: Lanzarote’s art, cultural and tourism visitor centres and their links to sustainable tourism marketing. J. Sustainable Tourism 2017, 26, 192–204. [Google Scholar] [CrossRef]
- Canton, H. United Nations Development Programme – UNDP. In Routledge eBooks, 2021, pp. 179–184. [CrossRef]
- Alonso, N.; Vicent, L.; Trillo, D. Digitalisation and rural tourism development in Europe. Tourism Manage. Stud. 2024, 20(SI), 33–44. [Google Scholar] [CrossRef]
- Cristobal-Fransi, E.; Daries, N.; Ferrer-Rosell, B.; Marine-Roig, E.; Martin-Fuentes, E. Sustainable Tourism Mark. Sustainability 2020, 12, 1865. [Google Scholar] [CrossRef]
- De Almeida, G. G. F.; Almeida, P.; Cardoso, L.; Santos, L. L. Uses and Functions of the Territorial Brand over Time: Interdisciplinary Cultural-Historical Mapping. Sustainability 2023, 15, 6448. [Google Scholar] [CrossRef]
- Tang, M.; Xu, H. Cultural Integration and Rural Tourism Development: A Scoping Literature Review. Tourism Hospitality 2023, 4, 75–90. [Google Scholar] [CrossRef]
- Fontefrancesco, M. F.; Boscolo, A.; Zocchi, D. M. Rural Culinary Tourism in Southern Europe: Emerging Educational Needs of a Growing Sector. Tourism Hospitality 2023, 4, 293–306. [Google Scholar] [CrossRef]
- Font, X.; McCabe, S. Sustainability and marketing in tourism: its contexts, paradoxes, approaches, challenges and potential. J. Sustainable Tourism 2017, 25, 869–883. [Google Scholar] [CrossRef]
- Jamrozy, U. Marketing of tourism: a paradigm shift toward sustainability. Int. J. Cult. Tourism Hospitality Res. 2007, 1, 117–130. [Google Scholar] [CrossRef]
- Janjua, Z. U. A.; Krishnapillai, G.; Rehman, M. Importance of the sustainability tourism marketing practices: an insight from rural community-based homestays in Malaysia. J. Hospitality Tourism Insights 2022, 6, 575–594. [Google Scholar] [CrossRef]
- Hysa, B.; Karasek, A.; Zdonek, I. Social Media Usage by Different Generations as a Tool for Sustainable Tourism Marketing in Society 5.0 Idea. Sustainability 2021, 13, 1018. [Google Scholar] [CrossRef]
- Vila, N. A.; Cardoso, L.; Archi, Y. E.; Brea, J. a. F. The Role of Digital Technology and Sustainable Practices in Tourists’ Decision Making. In Advances in hospitality, tourism and the services industry (AHTSI) book series, 2024, pp. 36–59). [CrossRef]
- Jian, Z.; Ren, Z. Data Mining Technology Oriented Integration Strategies for Habitat Improvement and Rural Tourism Development in China’s Agricultural and Rural Villages. Appl. Math. Nonlinear Sci. 2023, 9. [Google Scholar] [CrossRef]
- Zhang, S. Rural Tourism Development Planning Based on Nonlinear Differential Equation. Appl. Math. Nonlinear Sci. 2023, 8, 1621–1632. [Google Scholar] [CrossRef]
- Zhang, Y. Analysis of the Digital Transformation Development Path for Travel Enterprises. Open J. Appl. Sci. 2023, 13, 1370–1386. [Google Scholar] [CrossRef]
- Ryglová, K.; Rašovská, I.; Šácha, J. Rural Tourism – Evaluating the Quality of Destination. Eur. Countryside 2017, 9, 769–788. [Google Scholar] [CrossRef]
- Shcherbak, V.; Danko, Y.; Tereshchenko, S.; Nifatova, O.; Dehtiar, N.; Stepanova, O.; Yatsenko, V. Circular economy and inclusion as effective tools to prevent ecological threats in rural areas during military operations. Global J. Environ. Sci. Manage. 2024, 10, 969–986. [Google Scholar] [CrossRef]
- Pomering, A.; Johnson, L. W.; Noble, G. Conceptualising a contemporary marketing mix for sustainable tourism marketing. CAUTHE 2010: Tourism Hospitality: Challenge the Limits 2010, 1–15. https://ro.uow.edu.au/cgi/viewcontent.cgi?article=2936&context=commpapers.
- Pomering, A.; Noble, G.; Johnson, L. W. Conceptualising a contemporary marketing mix for sustainable tourism. J. Sustainable Tourism 2011, 19, 953–969. [Google Scholar] [CrossRef]
- Trybuś-Borowiecka, K. Tourist Activity of Poles in the Era of the Covid-19 Pandemic in the Light of Survey Results. Pol. J. Sport Tourism 2023, 30, 40–46. [Google Scholar] [CrossRef]
- Moore, E.; Quinn, B. Maintaining Connections during the Pandemic: Rural Arts Festivals and Digital Practices. Tourism Hospitality 2023, 4, 499–513. [Google Scholar] [CrossRef]
- Kansiime, M. K.; Tambo, J. A.; Mugambi, I.; Bundi, M.; Kara, A.; Owuor, C. COVID-19 implications on household income and food security in Kenya and Uganda: Findings from a rapid assessment. World Dev. 2021, 137, 105199. [Google Scholar] [CrossRef]
- Anderson, M.; Pitchforth, E.; Asaria, M.; Brayne, C.; Casadei, B.; Charlesworth, A.; Coulter, A.; Franklin, B. D.; Donaldson, C.; Drummond, M.; Dunnell, K.; Foster, M.; Hussey, R.; Johnson, P.; Johnston-Webber, C.; Knapp, M.; Lavery, G.; Longley, M.; Clark, J. M.; Mossialos, E. LSE–Lancet Commission on the future of the NHS: re-laying the foundations for an equitable and efficient health and care service after COVID-19. Lancet 2021, 397, 1915–1978. [Google Scholar] [CrossRef]
- Shcherbak, V.; Gryshchenko, I.; Ganushchak-Yefimenko, L.; Nifatova, O.; Tkachuk, V.; Kostiuk, T.; Hotra, V. Using a sharing-platform to prevent a new outbreak of COVID-19 pandemic in rural areas. Global J. Environ. Sci. Manage. 2021, 7, 155–170. [Google Scholar] [CrossRef]
- Šťastná, M.; Vaishar, A.; Ryglová, K.; Rašovská, I.; Zámečník, S. Cultural Tourism as a Possible Driver of Rural Development in Czechia. Wine Tourism in Moravia as a Case Study. European Countryside 2020, 12, 292–311. [Google Scholar] [CrossRef]
- Sutomo, Y. a. W. , Sianipar, C. P. M., Hoshino, S., Onitsuka, K. (2024). Self-Reliance in Community-Based Rural Tourism: Observing Tourism Villages (Desa Wisata) in Sleman Regency, Indonesia. Tourism and Hospitality, 5. [CrossRef]
- Santos, L. L. , Cardoso, L., Araújo-Vila, N., & Fraiz-Brea, J. A. (2020). Sustainability Perceptions in Tourism and Hospitality: A Mixed-Method Bibliometric Approach. Sustainability, 12. [CrossRef]
- Shcherbak, V.; Lyshenko, M.; Tereshchenko, S.; Yefanov, V.; Vzhytynska, K.; Yatsenko, V.; Pietukhov, A. Sustainable development of united territorial communities during the conflict: turning challenges into opportunities. Hum. Cap. Urban Manage. 2024. [Google Scholar]
- Brezzi, M.; González, S.; Nguyen, D.; Prats, M.; Ader, M.; Badr, K.; Baredes, B.; Baubion, C.; Daglio, M.; Das-Doyle, C.; González-Zapata, F.; Jacobzone, S.; Matasick, C.; Pietikainen, A.; Perez, A. R.; Saffirio, C.; Michalun, V.; Fairbrother, M.; Guriev, S.; Scott, R. An updated OECD framework on drivers of trust in public institutions to meet current and future challenges. In OECD Working Papers on Public Governance 2021. [CrossRef]
- Cardoso, L.; Lopes, E.; De Almeida, G. G. F.; Santos, L. L.; Sousa, B.; Simões, J.; Perna, F. Features of Nautical Tourism in Portugal – Projected Destination Image with a Sustainability Marketing Approach. Sustainability 2023, 15, 8805. [Google Scholar] [CrossRef]
- Liu, Z.; Li, R.; Cai, R.; Lan, J. A nexus of income inequality and natural resource utilization efficiency: Effect on the road to green economic recovery. Resour. Policy 2023, 85, 103625. [Google Scholar] [CrossRef]
- Chen, C. I. Application of the novel nonlinear grey Bernoulli model for forecasting unemployment rate. Chaos Sol. Fract. 2008, 37, 278–287. [Google Scholar] [CrossRef]
- Xu, L. A Markov Chain Prediction Model Based on Rural Tourism Supply and Demand Matching Governance Model from the Perspective of Cultural Tourism Integration. Appl. Math. Nonlinear Sci. 2023, 9. [Google Scholar] [CrossRef]
- Andrews, R.; Jilke, S.; Van De Walle, S. Economic strain and perceptions of social cohesion in Europe: Does institutional trust matter? Eur. J. Polit. Res. 2014, 53, 559–579. [Google Scholar] [CrossRef]
- Luebker, M. Income Inequality, Redistribution, and Poverty: Contrasting Rational Choice and Behavioral Perspectives. Rev. Income Wealth 2014, 60, 133–154. [Google Scholar] [CrossRef]
- Liao, Y. Exploring the integration development path of rural tourism and rural revitalization under the perspective of self-media development and communication. Appl. Math. Nonlinear Sci. 2023, 9. [Google Scholar] [CrossRef]
- Król, K. Marketing Potential of Websites of Rural Tourism Facilities in Poland. Stud. Ekon. Reg. 2019, 12, 158–172. [Google Scholar] [CrossRef]
- Stanovčić, T.; Peković, S.; Vukčević, J.; Perović, D. Going Entrepreneurial: Agro-tourism and Rural Development in Northern Montenegro. Bus. Syst. Res. 2018, 9, 107–117. [Google Scholar] [CrossRef]
- Magige, J. M.; Jepkosgei, C.; Onywere, S. M. Use of GIS and remote sensing in tourism. In Springer eBooks 2020, pp. 1–27. [CrossRef]
- Zwierzchowska, J. Tourism in Rural Areas of Castilla-La Mancha. Miscelanea Geogr. 2008, 13, 231–237. [Google Scholar] [CrossRef]
- Robert, K. W.; Parris, T. M.; Leiserowitz, A. A. What is Sustainable Development? Goals, Indicators, Values, and Practice. Env. Sci. Policy Sustainable Dev. 2005, 47, 8–21. [Google Scholar] [CrossRef]
- Remondino, F. Heritage Recording and 3D Modeling with Photogrammetry and 3D Scanning. Remote Sens., 2011, 3, 1104–1138. [CrossRef]
- Magige, J. M.; Jepkosgei, C.; Onywere, S. M. Use of GIS and Remote Sensing in Tourism. In Handbook of e-Tourism. Springer 2020. https://link.springer.com/rwe/10. 1007. [Google Scholar]
- Wei-wei, Li; Tong-ji, Li; Jian-hua, Zhu; Hu-ping, Ye; Yue-e, Dong. Research on Monitoring Factors of Tourism-type Island Based on Remote Sensing[J]. Ocean Technol. 2012, 31, 63-67.
- Shi, Z.; Jiang, Y.; Zhai, X.; Zhang, Y.; Xiao, X.; Xia, J. Assessment of changes in environmental factors in a tourism-oriented Island. Front. Public Health 2023, 10. [Google Scholar] [CrossRef]
- Dong, R.; Yu, L.; Liu, G. Impact of tourism development on land-cover change in a matriarchal community in the Lugu Lake area. Int. J. Sustainable Development Dev. World Ecol. 2008, 15, 28–35. [Google Scholar] [CrossRef]
- Andyana, I.; As-Syakur, A.; Sunarta, I.; Suyarto, R.; Diara, I.; Susila, K.; Saifulloh, M.; Kusmiyarti, T.; Wiyanti, W. Urban tourism expansion monitoring by remote sensing and random forest. In Proceedings of IOP Conference Series Earth and Environmental Science, 2023, 1180, 012046. [Google Scholar] [CrossRef]
- Yu, L. Regression utility analysis of rural red cultural tourism industry chain for rural revitalization. Appl. Math. Nonlinear Sci. 2024, 9. [Google Scholar] [CrossRef]
- Almeyda, A. M.; Broadbent, E. N.; Wyman, M. S.; Durham, W. H. Ecotourism impacts in the Nicoya Peninsula, Costa Rica. Int. J. Tourism Res. 2010, 12, 803–819. [Google Scholar] [CrossRef]
- Yang, J.; Ge, Y.; Ge, Q.; Xi, J.; Li, X. Determinants of island tourism development: The example of Dachangshan Island. Tourism Manage. 2016, 55, 261–271. [Google Scholar] [CrossRef]
- Gilmore, A.; Carson, D.; Ascenção, M. Sustainable tourism marketing at a World Heritage site. J. Strateg. Mark. 2007, 15(2–3), 253–264. [CrossRef]
- Kiráľová, A. Sustainable Tourism Marketing Strategy. In IGI Global eBooks 2019, pp. 183–206. [CrossRef]
- Maliuta, L.; Harmatiy, N.; Fedyshyn, I.; Tkach, U. Rural development in the European Union through tourism potential. Manage. Theory Stud. Rural Bus. Infrastruct. Dev. 2022, 43, 555–561. [Google Scholar] [CrossRef]
- Melichová, K.; Majstríková, U. Is Rural Tourism a Perspective Driver of Development of Rural Municipalities? – The Case of Slovak Republic. Acta Reg. Environ. 2017, 14, 1–6. [Google Scholar] [CrossRef]
- Neumeier, S.; Pollermann, K. Rural Tourism As Promoter Of Rural Development – Prospects And Limitations: Case Study Findings From A Pilot Projectpromoting Village Tourism. Eur. Countryside 2014, 6, 270–296. [Google Scholar] [CrossRef]
- Veiga, C.; Santos, M. C.; Águas, P.; Santos, J. a. C. Are millennials transforming global tourism? Challenges for destinations and companies. Worldwide Hospitality Tourism Themes 2017, 9, 603–616. [Google Scholar] [CrossRef]
- Monaco, S.; Sacchi, G. Travelling The Metaverse: Potential benefits and main challenges for tourism sectors and research applications. Sustainability 2023, 15, 3348. [Google Scholar] [CrossRef]
- Rosário, A. T.; Raimundo, R. G.; Cruz, R. The impact of digital technologies on marketing and communication in the tourism industry. In Advances in hospitality, tourism and the services industry (AHTSI) book series 2021, pp. 255–267. [CrossRef]
- Rosário, A. T.; Raimundo, R. G.; Cruz, R. The impact of digital technologies on marketing and communication in the tourism industry. In IGI Global eBooks 2022, pp. 748–760. [CrossRef]
- Mathew, V.; Soliman, M. Does digital content marketing affect tourism consumer behavior? An extension of technology acceptance model. J. Consum. Behav. 2020, 20, 61–75. [Google Scholar] [CrossRef]
- Jovanovic, V.; Njegus, A. The application of GIS and its components in tourism. Yugoslav J. Oper. Res. 2008, 18, 261–272. [Google Scholar] [CrossRef]
- Kerdpitak, C. Digital Marketing and Technology Innovation on tourism Business Performance. Zenodo (CERN European Organization for Nuclear Research) 2021. [CrossRef]
- Levitskaya, A.; Yanioglo, N. Digital marketing technologies as an effective tool for promotion of tourism in the republic of Moldova. Mark. Digital Technol. 2018, 2, 77–84. [Google Scholar] [CrossRef]
- Hristoforova, I. V.; Silcheva, L. V.; Arkhipova, T. N.; Demenkova, A. B.; Nikolskaya, E. Y. Improvement of digital technologies in marketing communications of tourism and hospitality enterprises. J. Environ. Manage. Tourism 2019, 10, 829. [Google Scholar] [CrossRef]
- Morand, J. C.; Cardoso, L.; Pereira, A. M.; Araújo-Vila, N.; De Almeida, G. G. F. Tourism ambassadors as special destination image inducers. Enlightening Tourism Pathmaking J. 2021, 11, 194. [Google Scholar] [CrossRef]
- Walsh, J. A.; Jamrozy, U.; Burr, S. W. Sense of place as a component of sustainable tourism marketing. In CABI eBooks 2017, pp. 195–216. [CrossRef]
- Nugraha, K. S. W.; Suryaningsih, I. B.; Cahyanti, I. D. Destination quality, experience involvement And memorable tourism experience: is it relevant for rural tourism? Manage. Mark. 2021, 16, 69–85. [Google Scholar] [CrossRef]
Figure 1.
Structural and logical scheme of the integrated system for monitoring sustainable development of rural tourism.
Figure 1.
Structural and logical scheme of the integrated system for monitoring sustainable development of rural tourism.
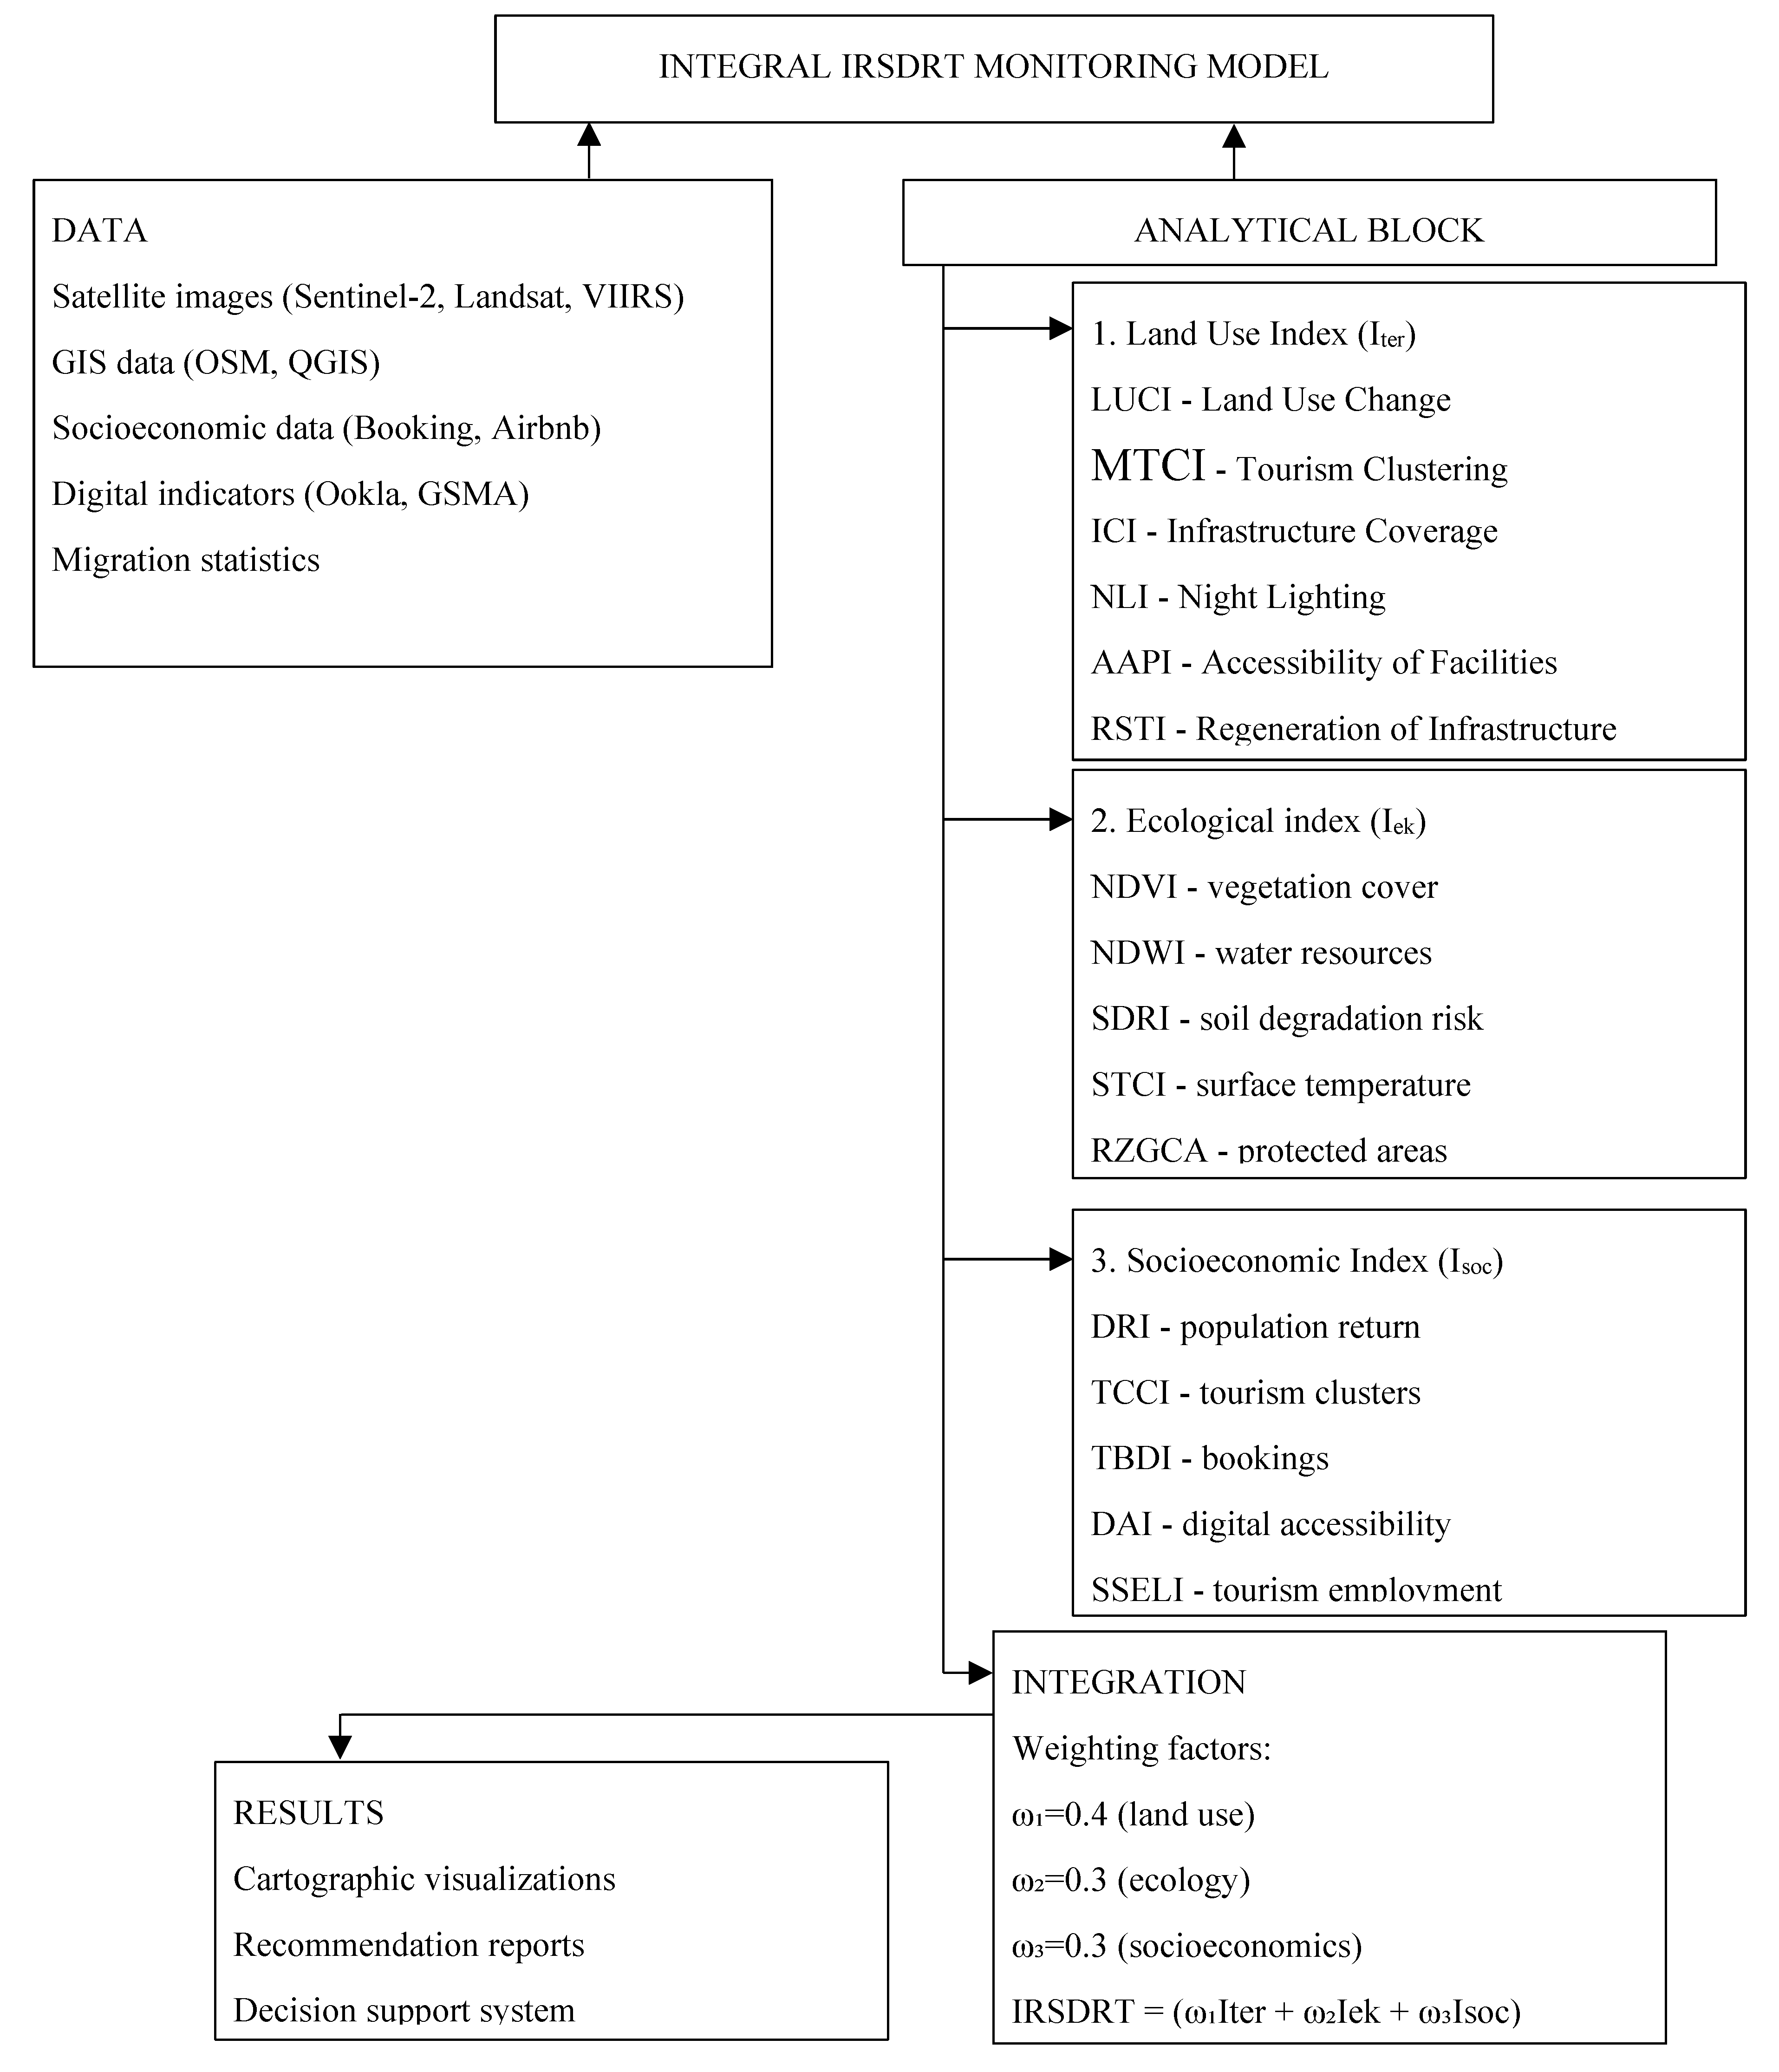
Figure 2.
Regional dislocation of Transcarpathia, Ukraine.
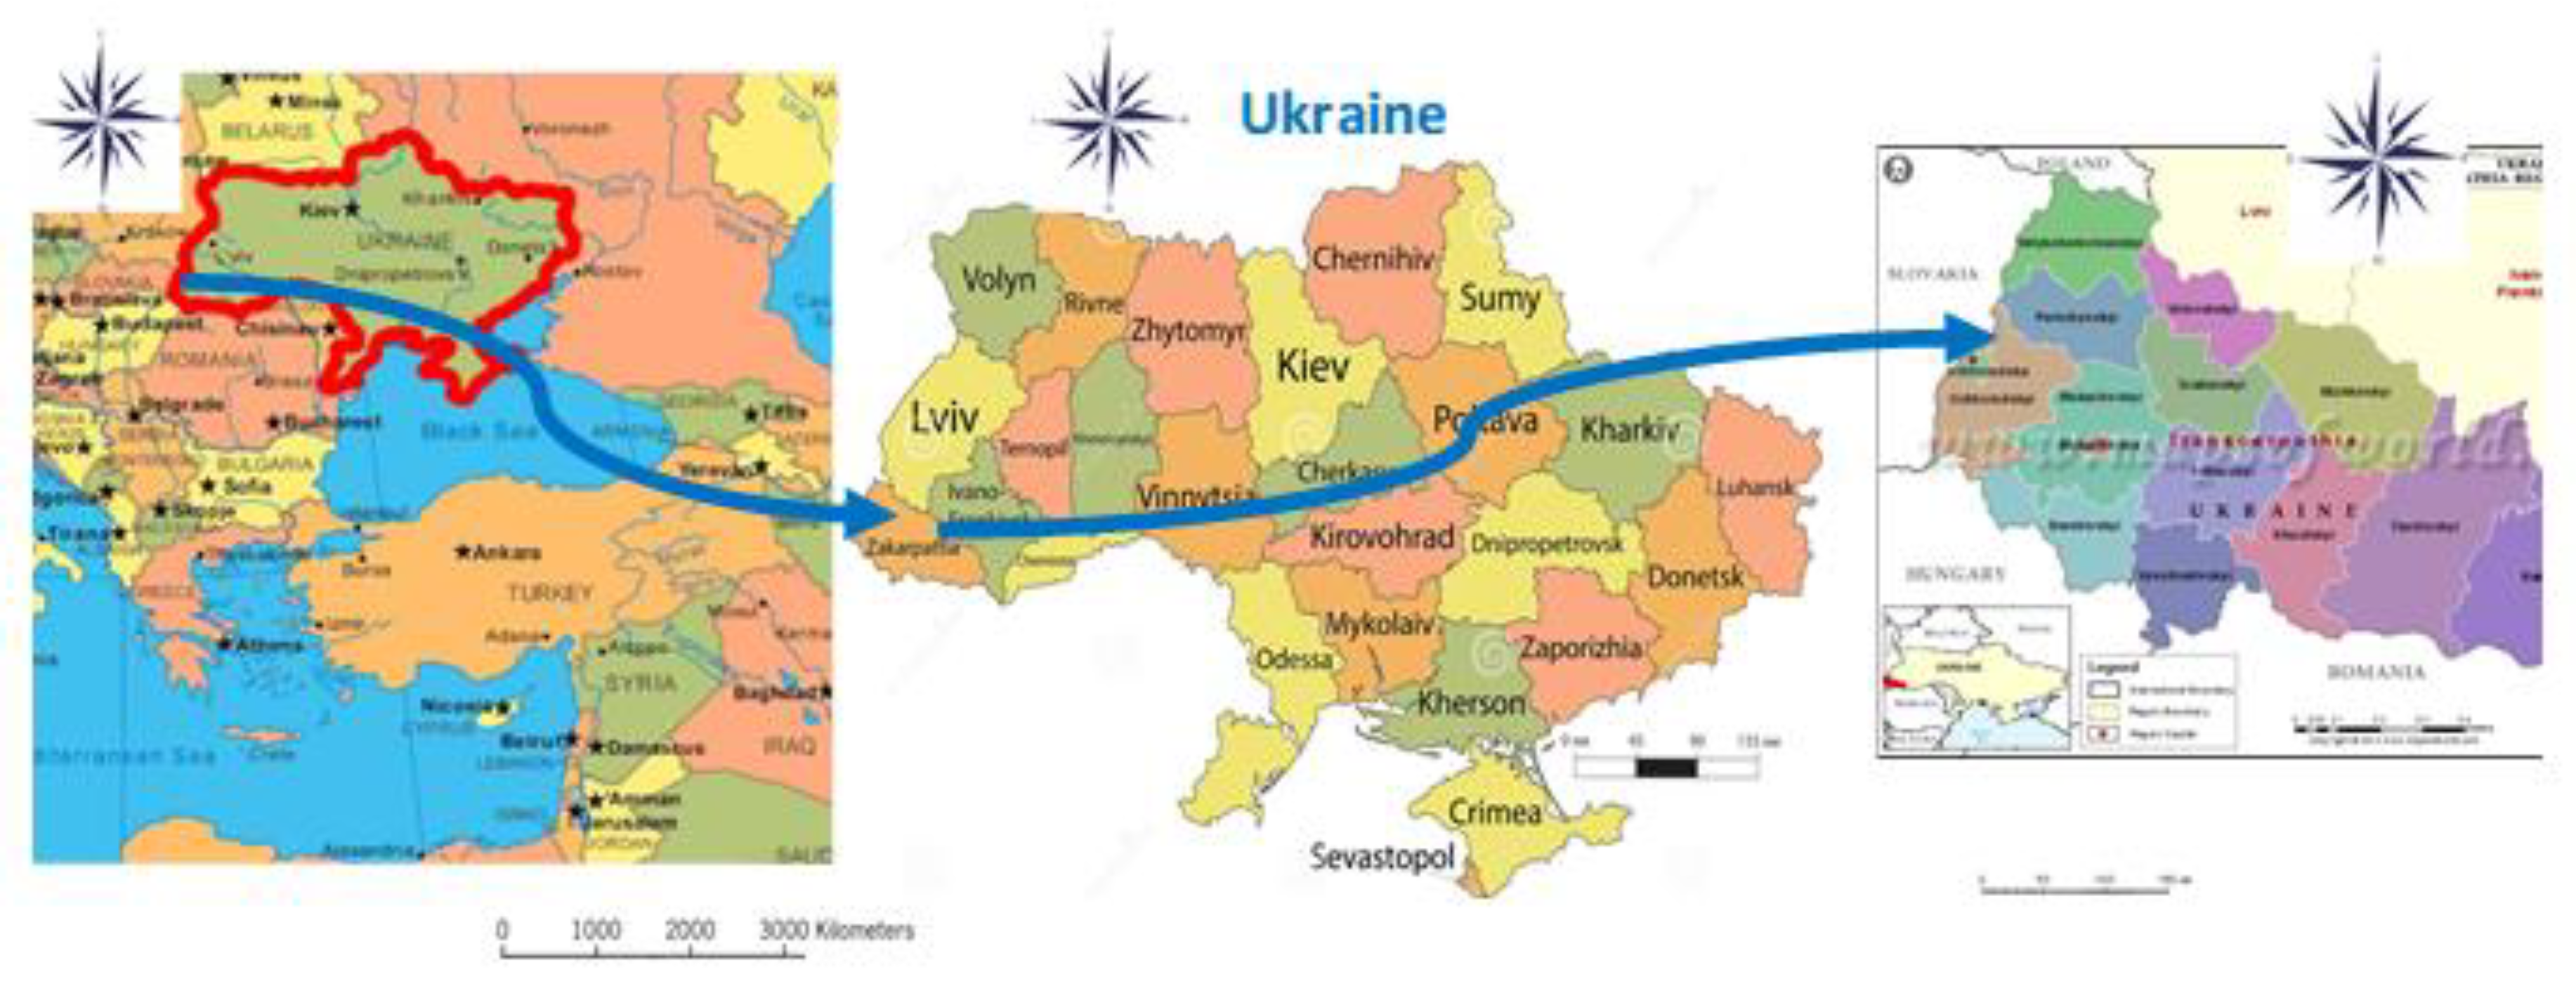
Figure 3.
Night lighting in Transcarpathia according to VIIRS DNB data for 2024, visualization of real distribution of electricity consumption as a proxy for economic activity.
Figure 3.
Night lighting in Transcarpathia according to VIIRS DNB data for 2024, visualization of real distribution of electricity consumption as a proxy for economic activity.
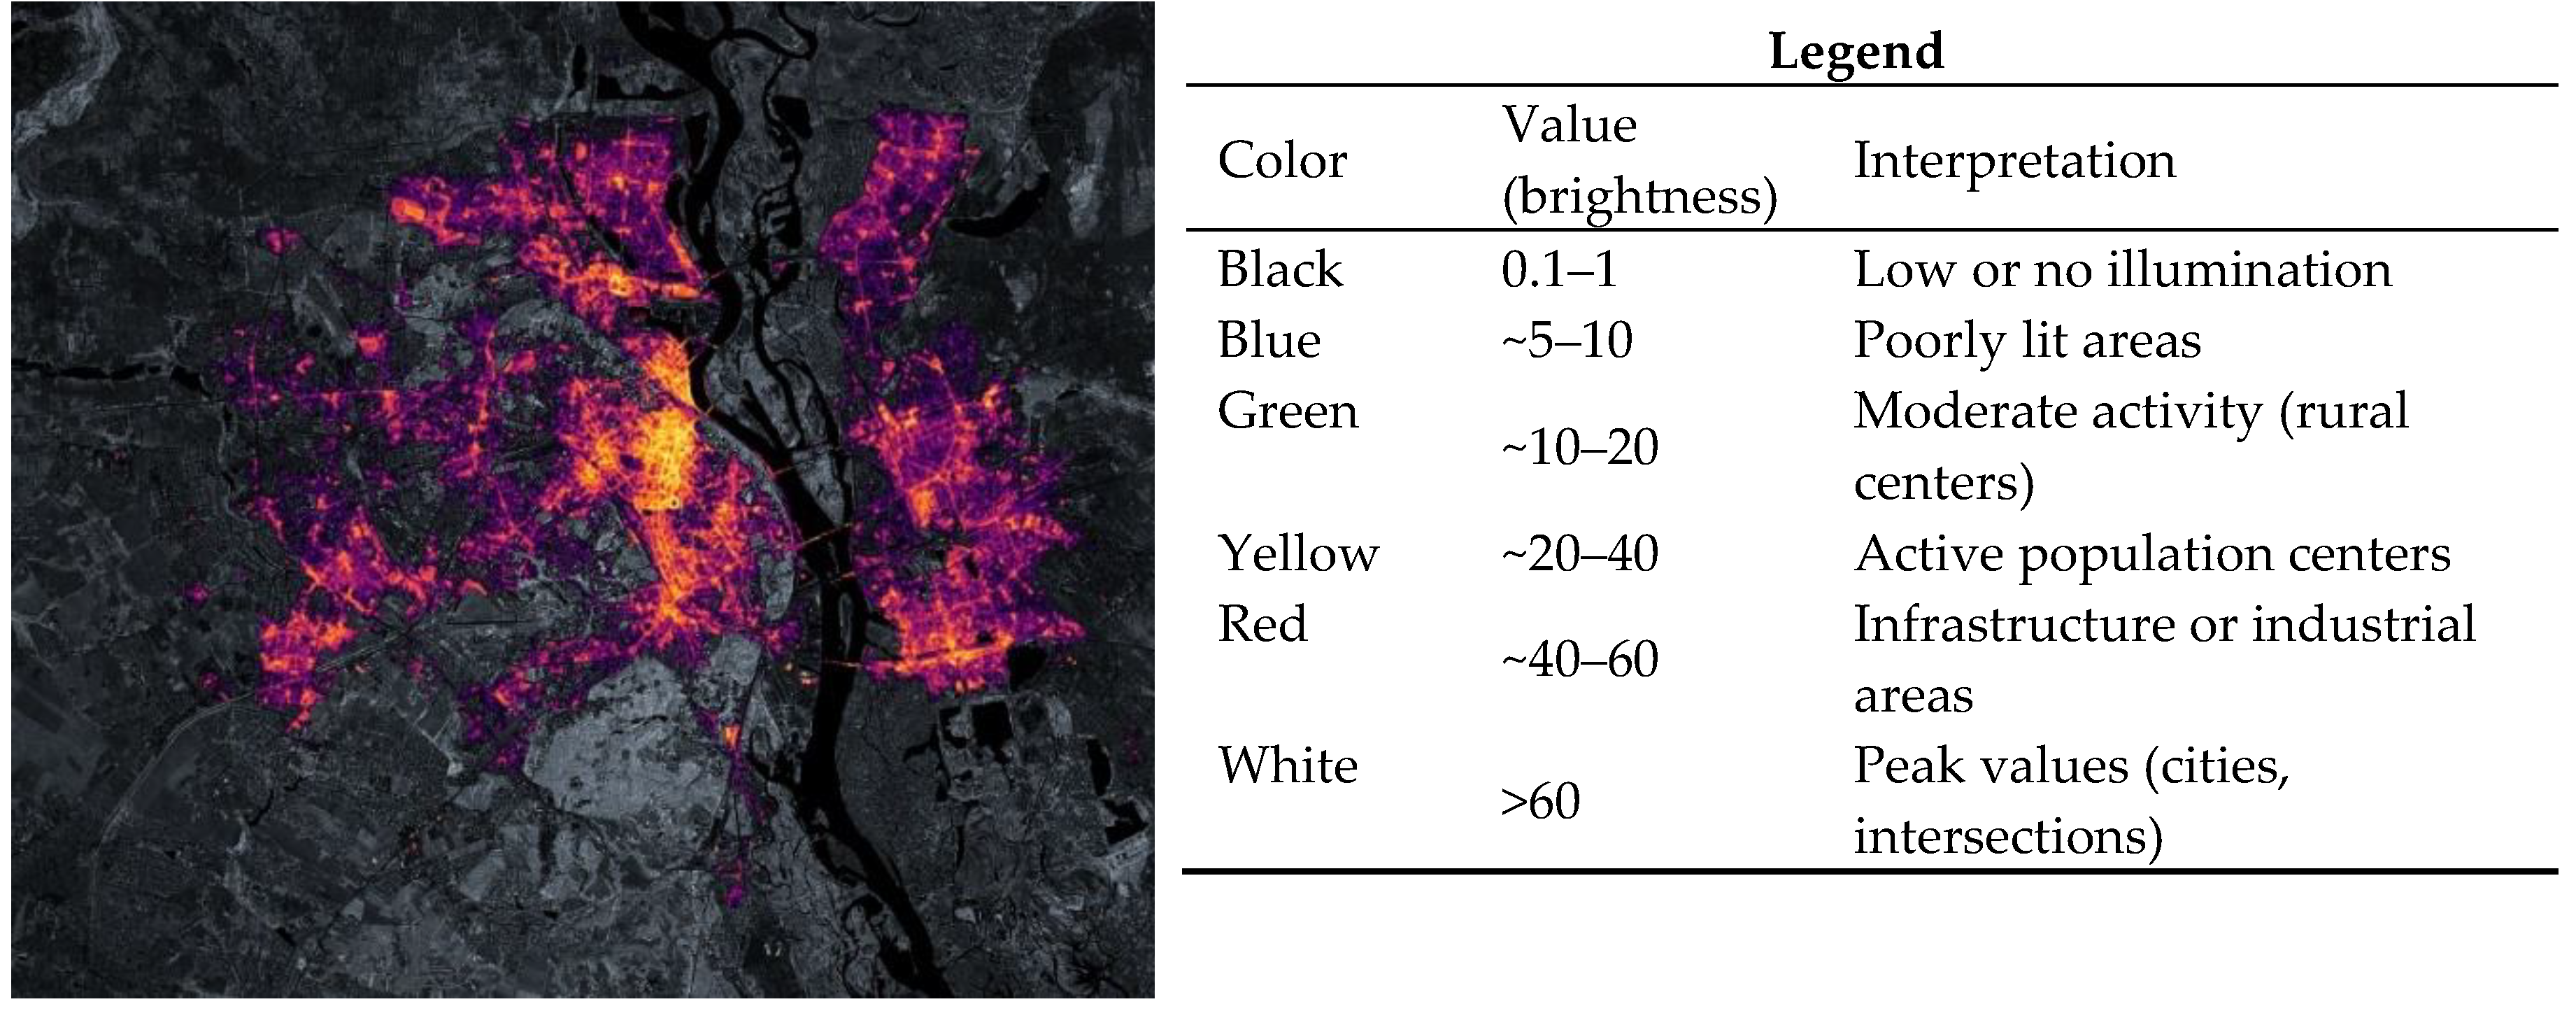
Figure 4.
Dynamics of nighttime lighting (NLI) in Transcarpathia as an indicator of economic activity.
Figure 4.
Dynamics of nighttime lighting (NLI) in Transcarpathia as an indicator of economic activity.

Figure 5.
Average MTCI values for different types of tourist facilities in the Uzhhorod–V. Bereznyi and Rakhiv–Yasinya clusters (2024).
Figure 5.
Average MTCI values for different types of tourist facilities in the Uzhhorod–V. Bereznyi and Rakhiv–Yasinya clusters (2024).
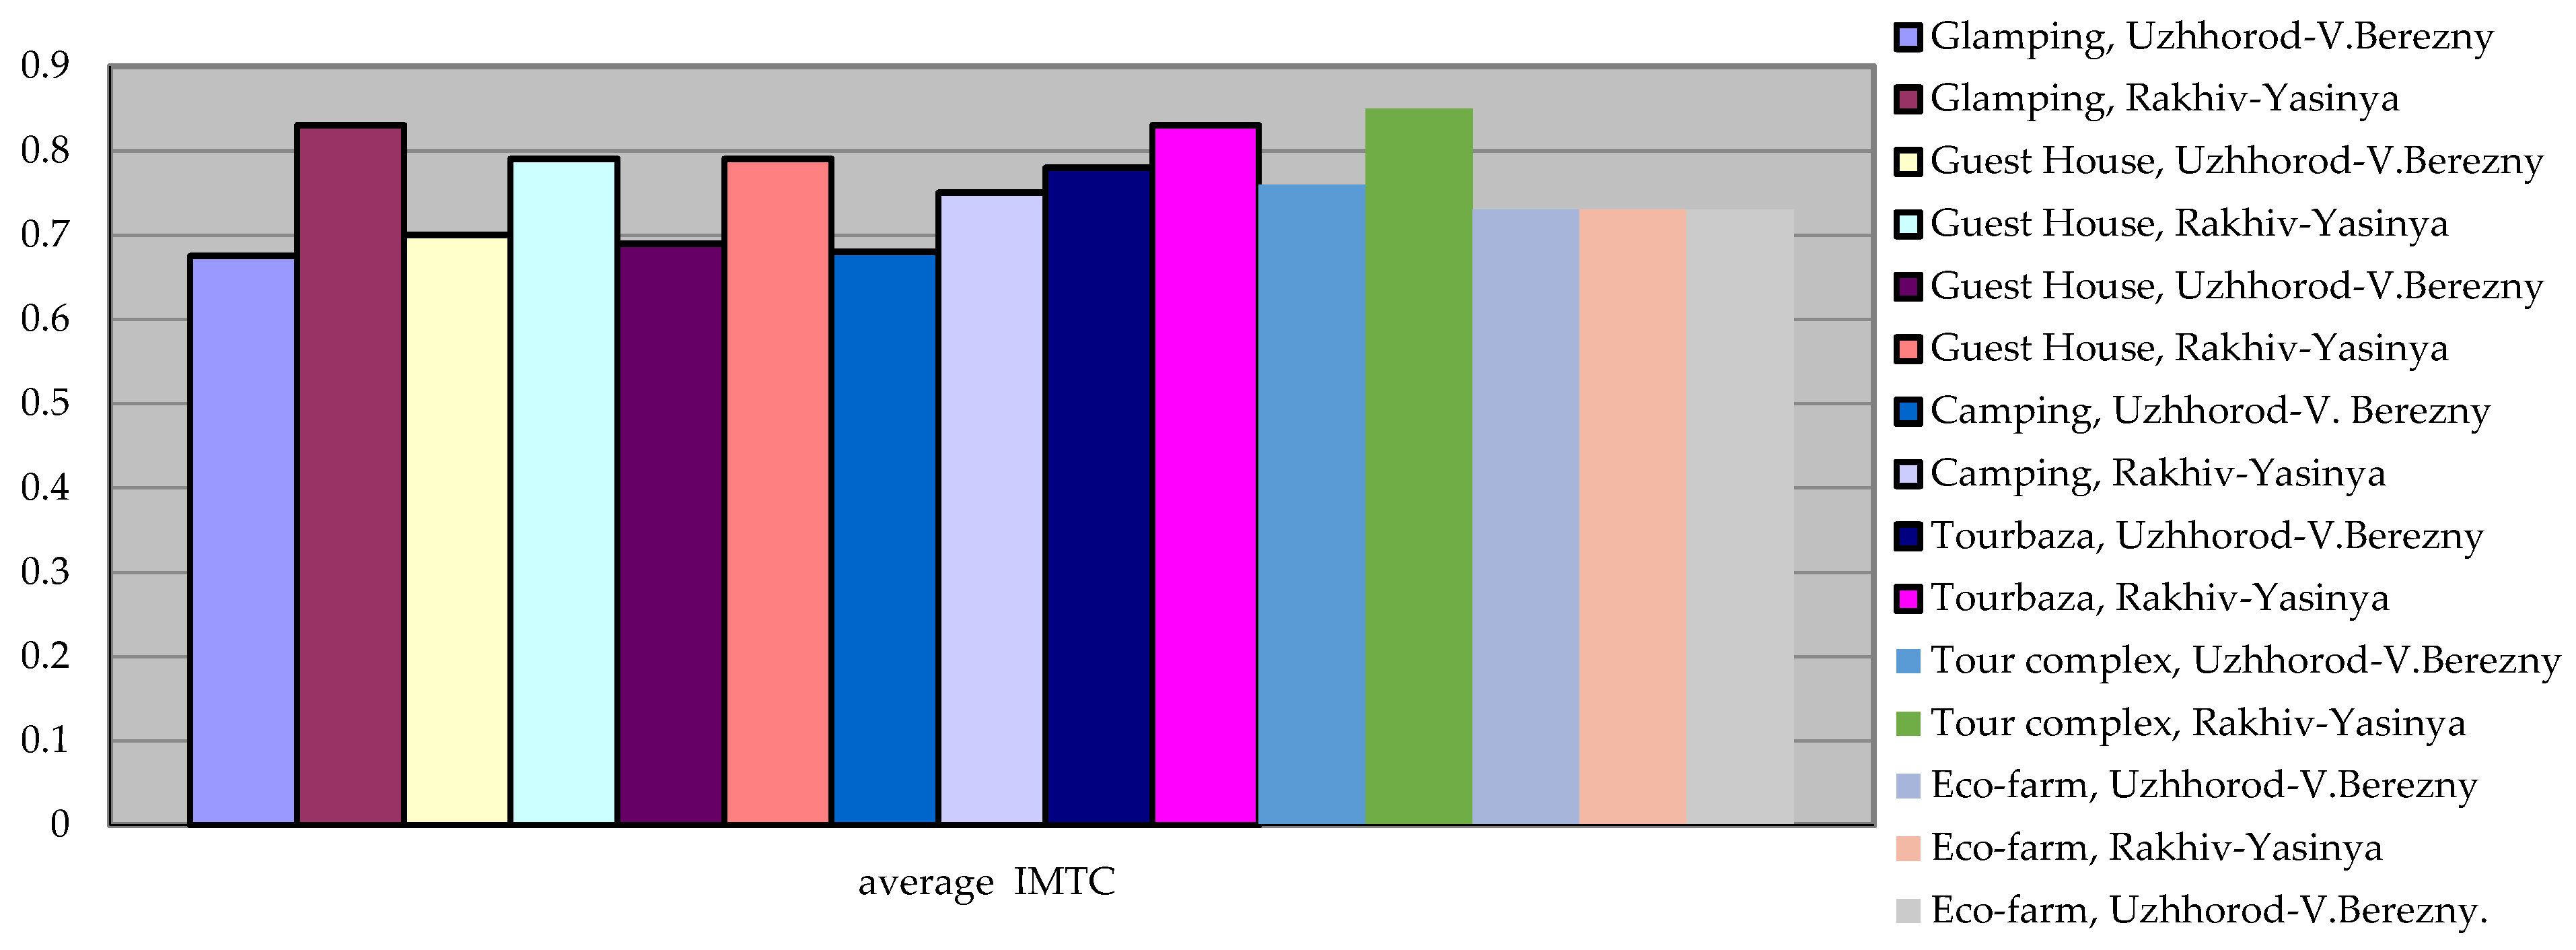
Figure 7.
Dynamics of NDVI and NDWI in the Carpathians and Solotvino region for 2022–2024.
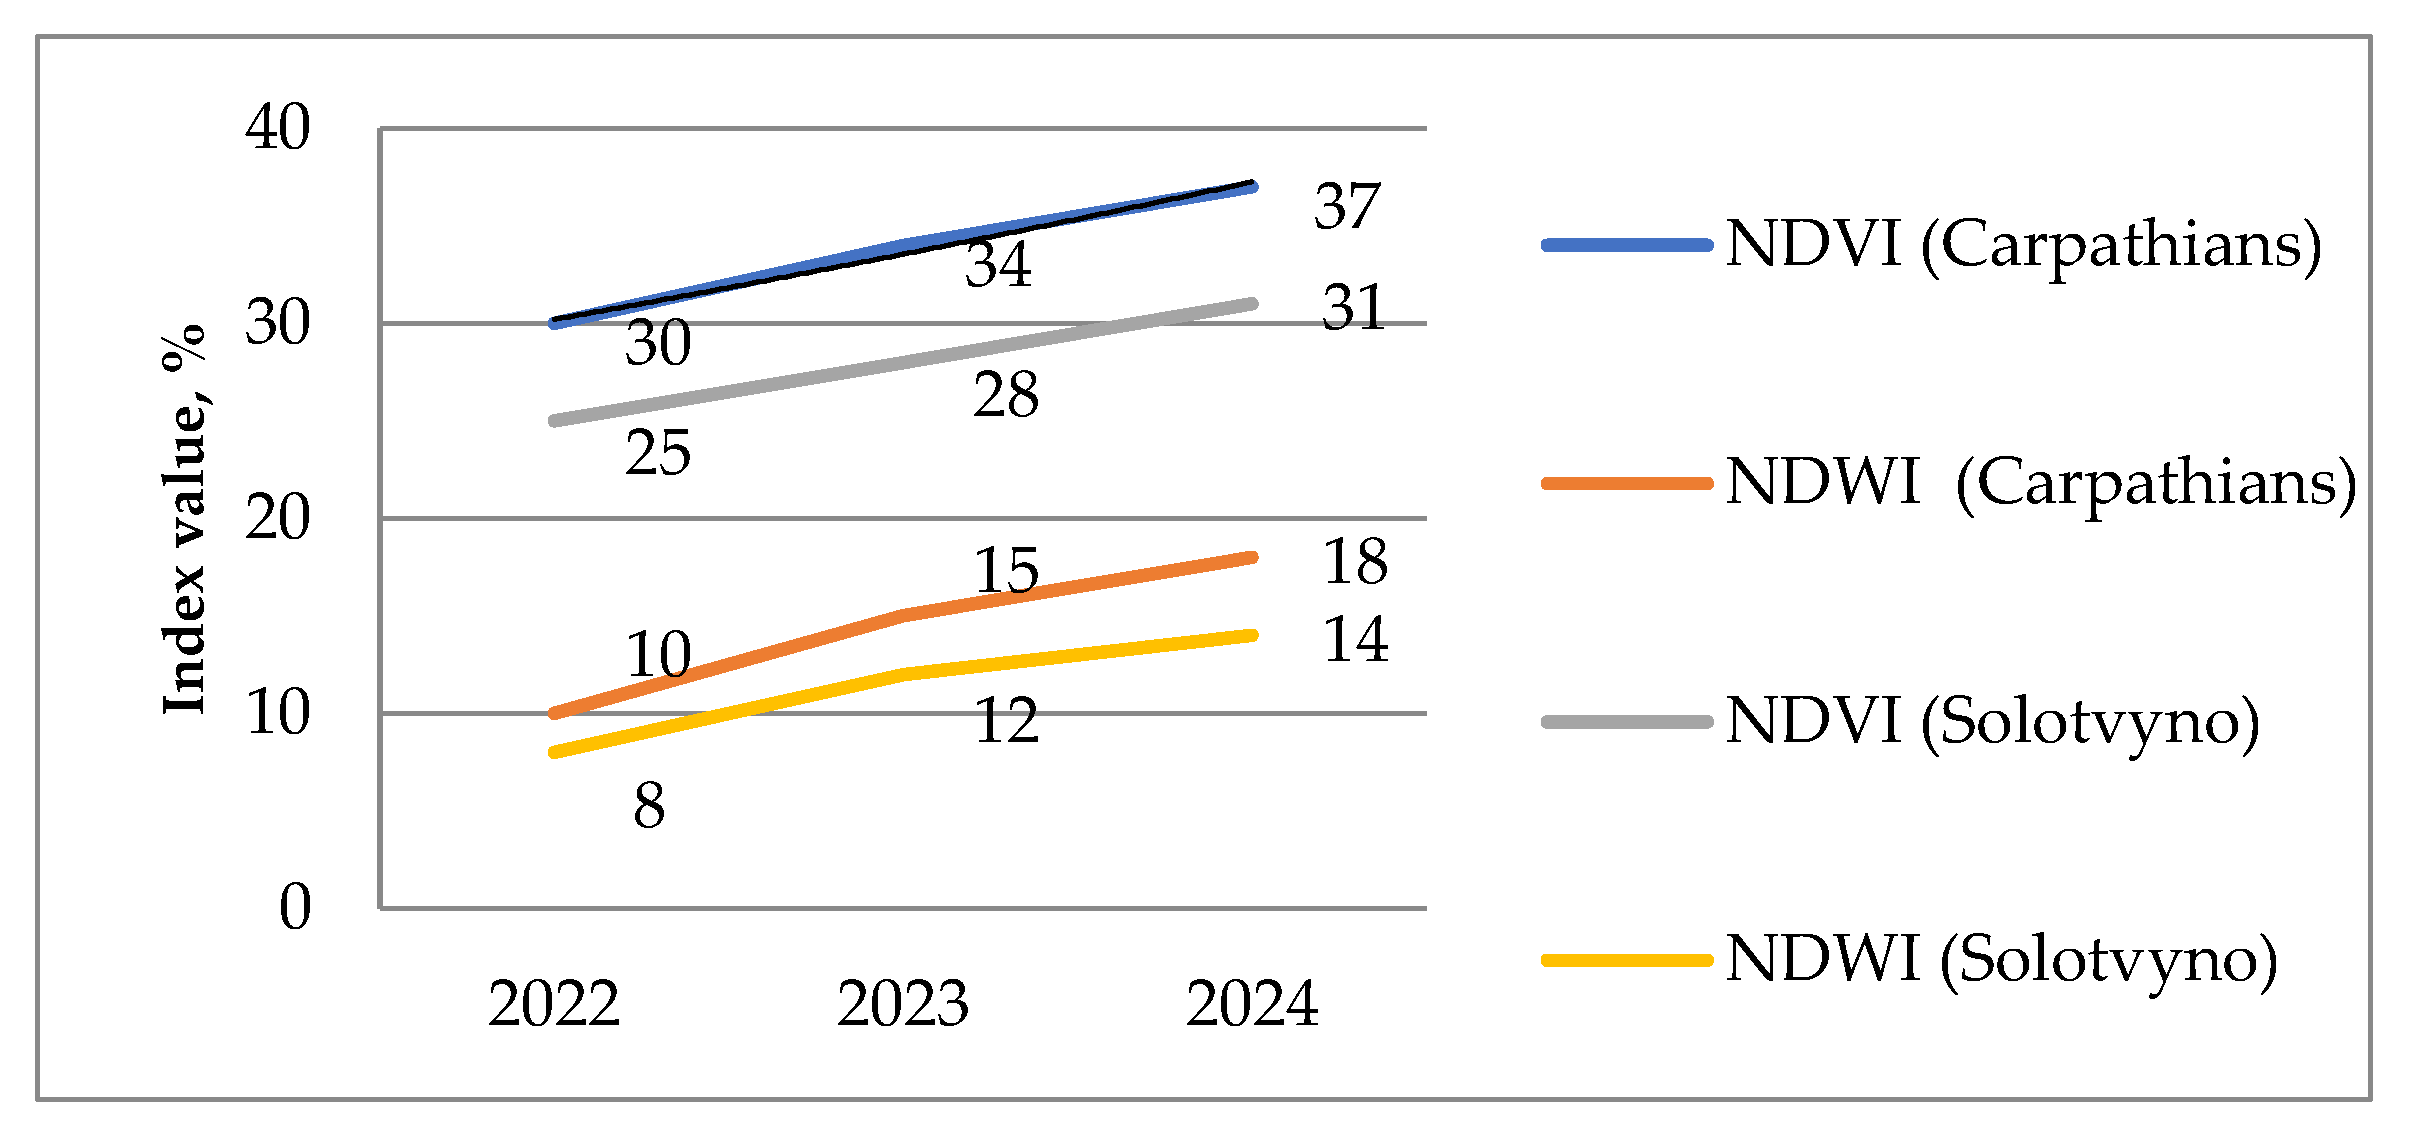
Figure 8.
Changes in SDRI and STCI in Transcarpathia for 2022–2024.
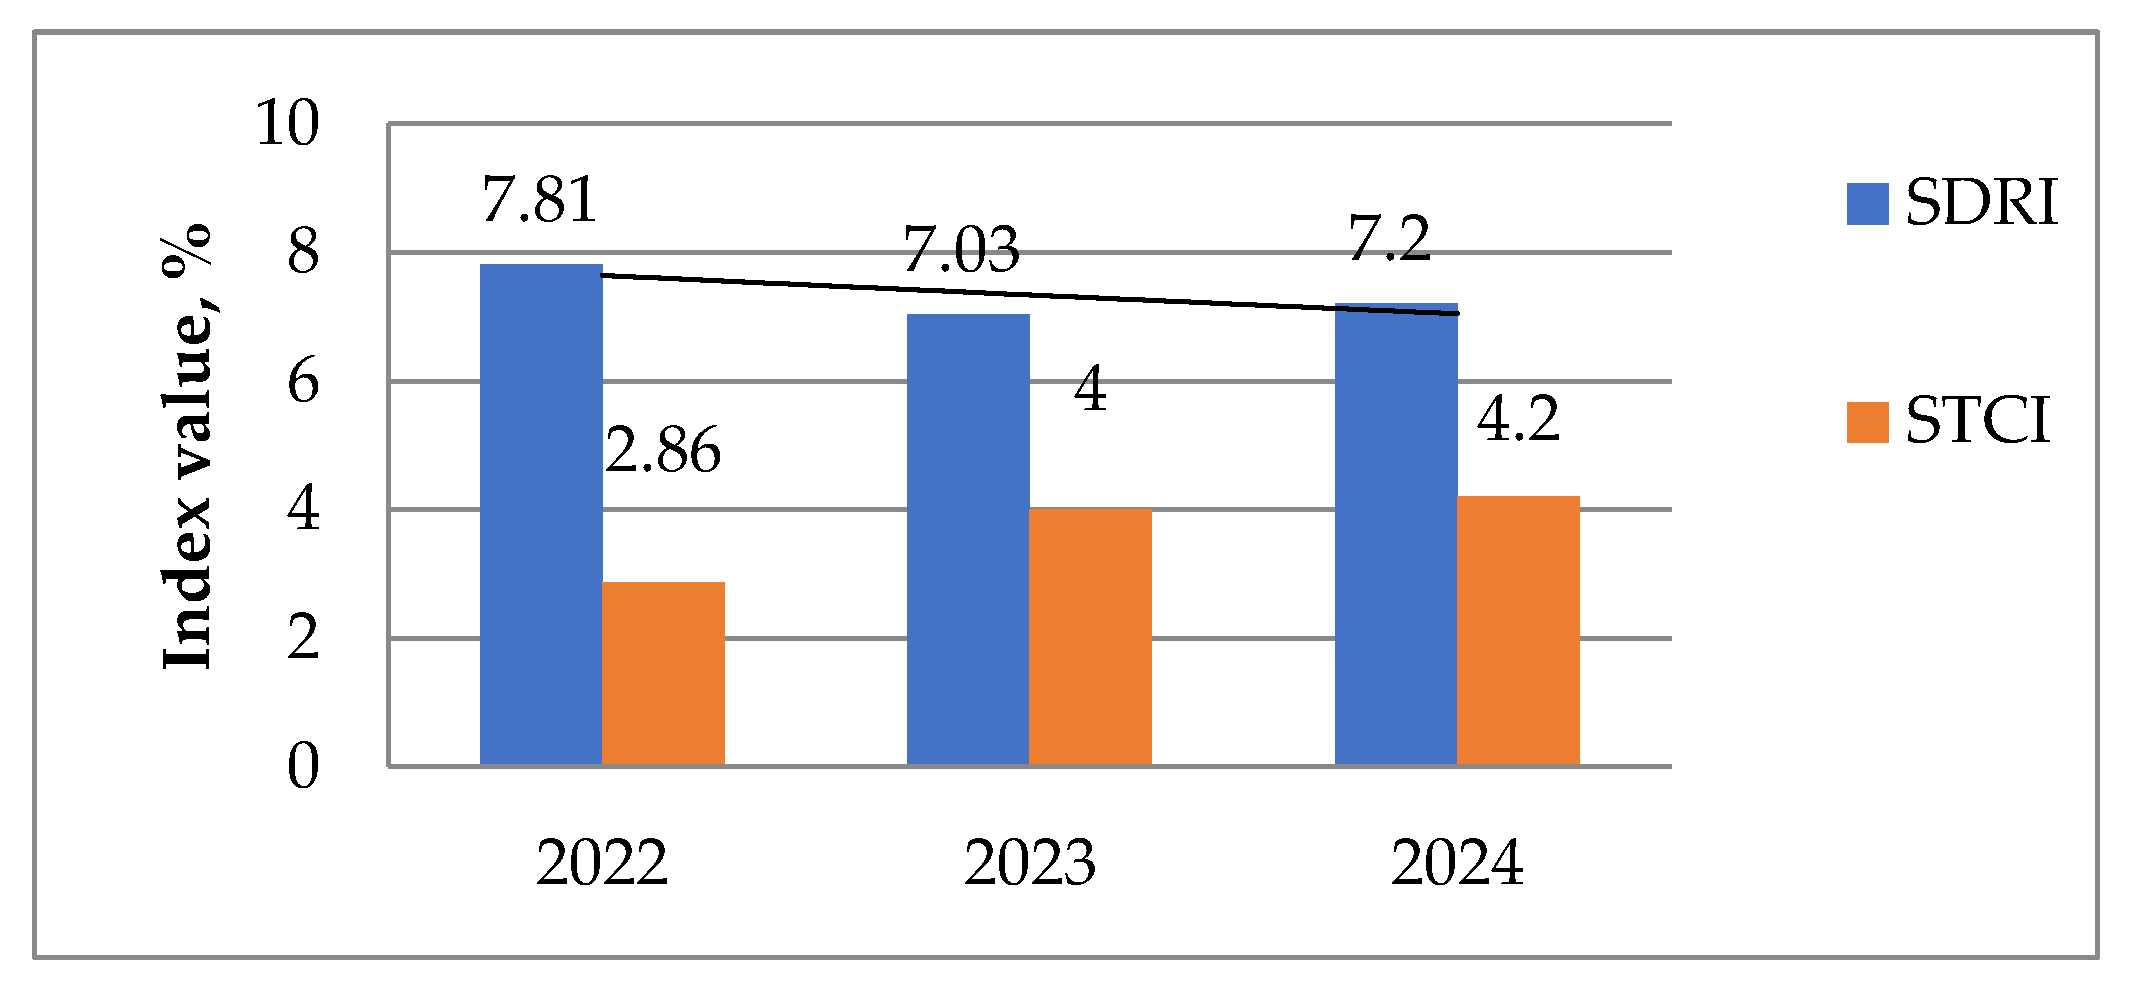
Figure 10.
Expansion of green corridors and protected areas in Transcarpathia (2022–2024).
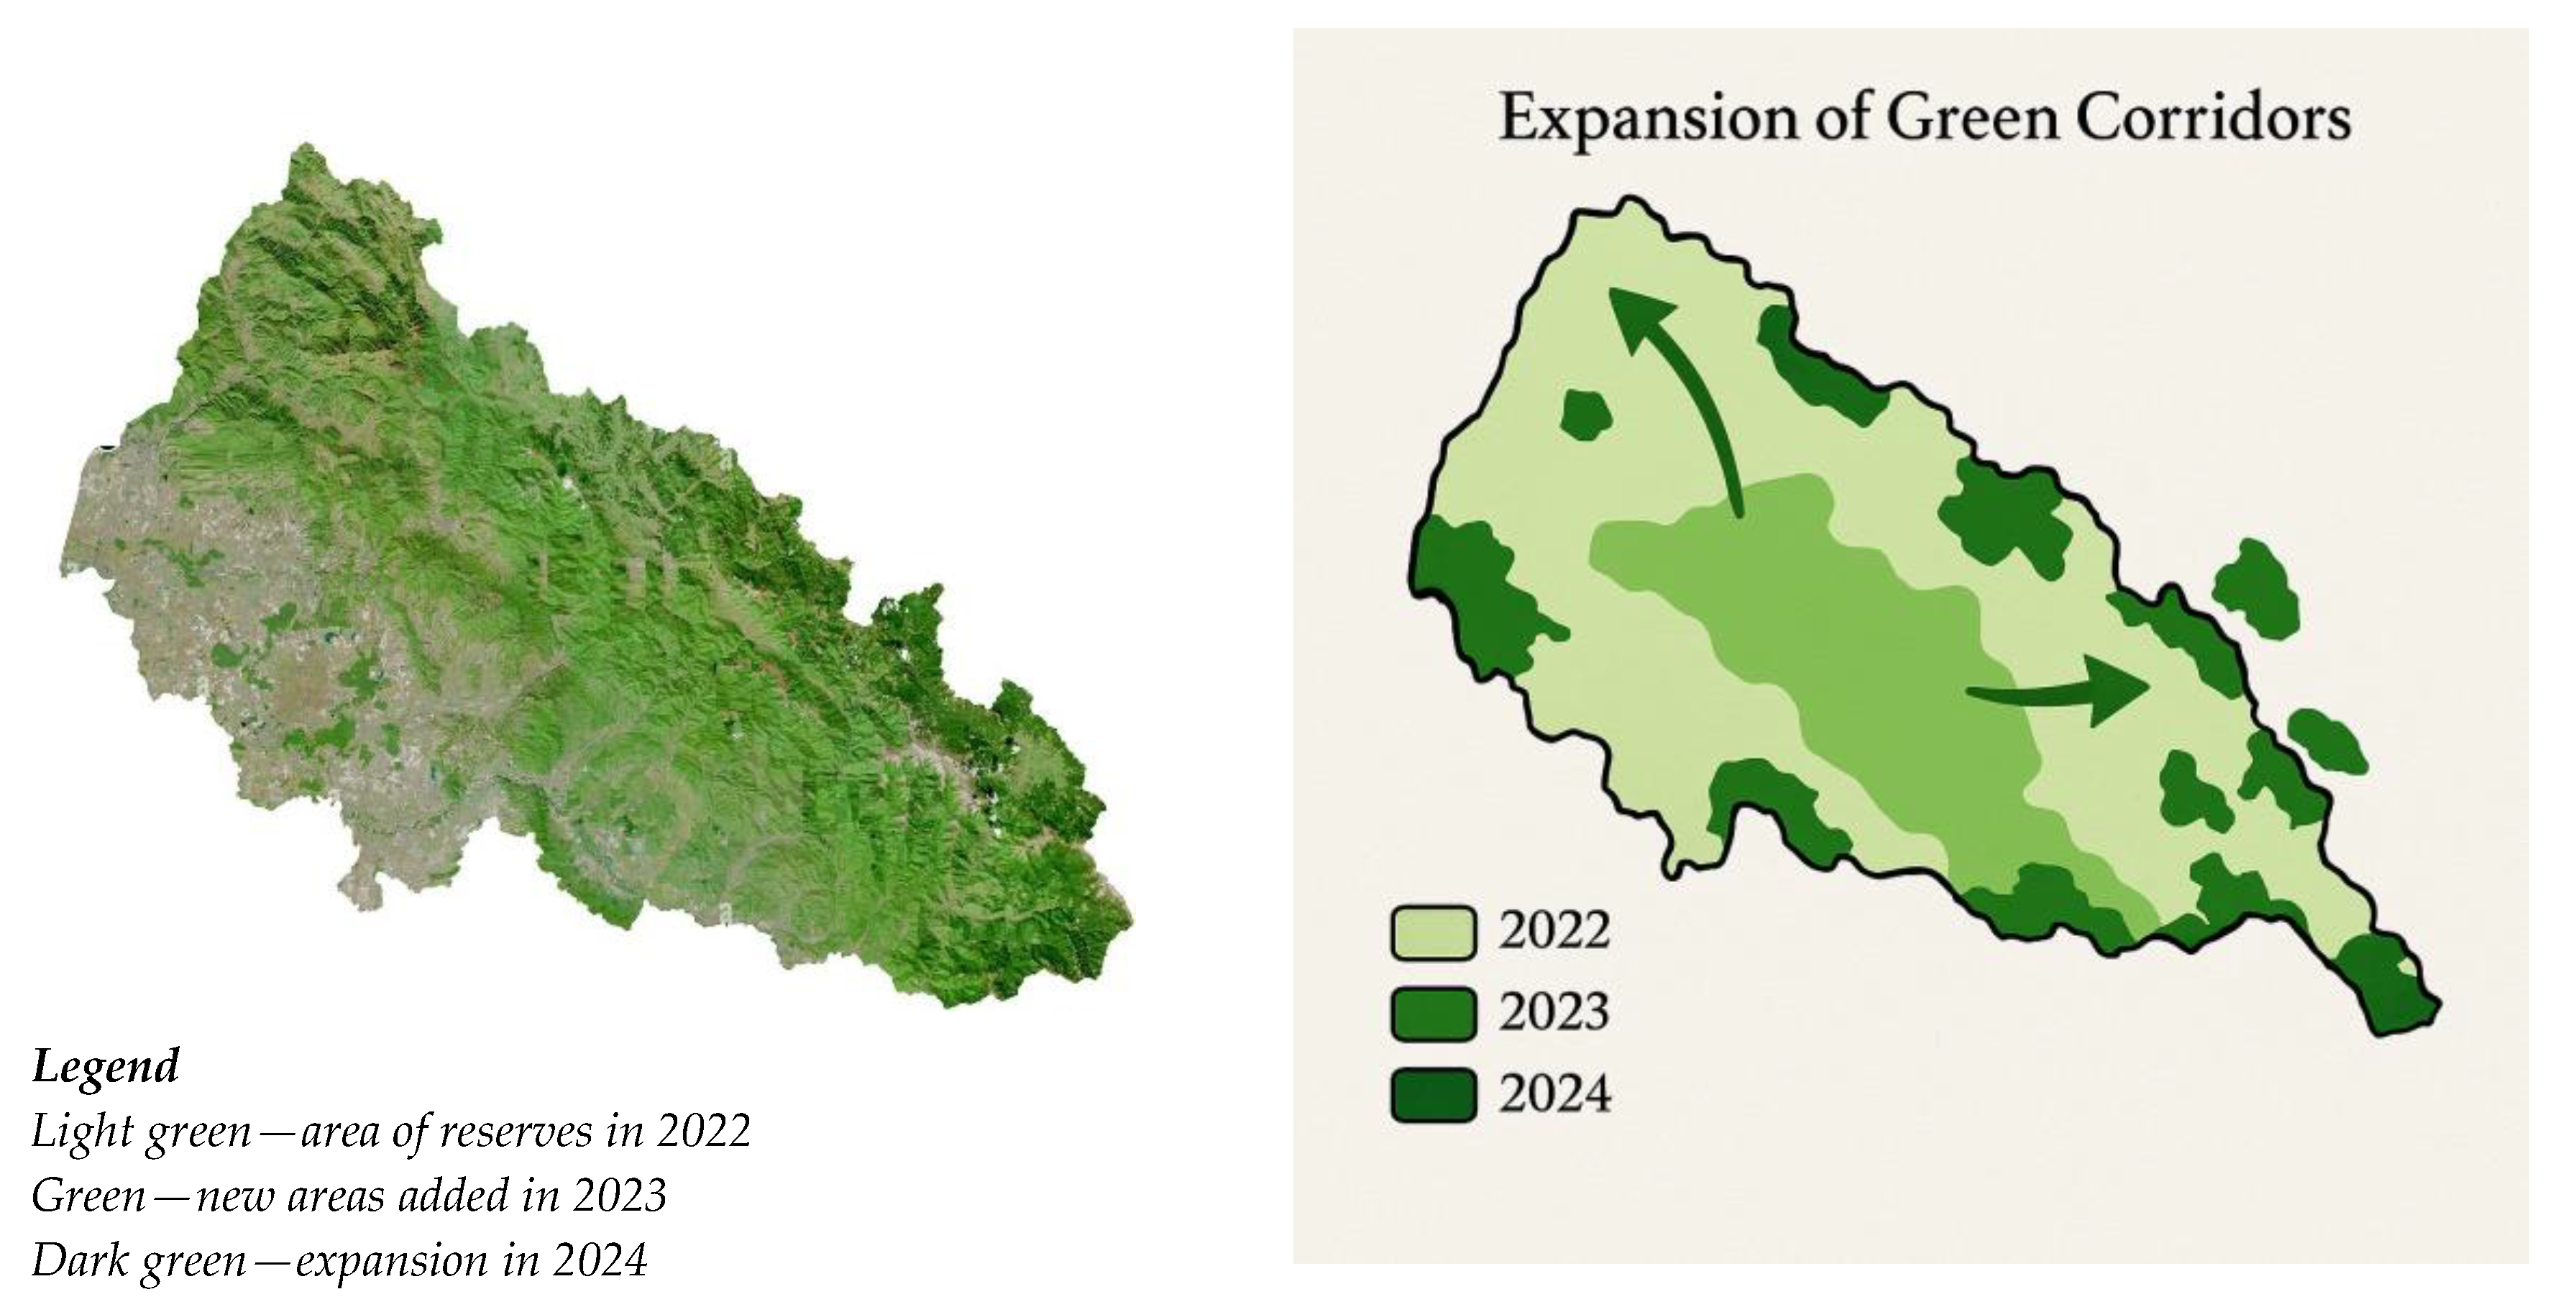
Figure 11.
Spatial distribution of environmental changes in Transcarpathia (2022-2024).
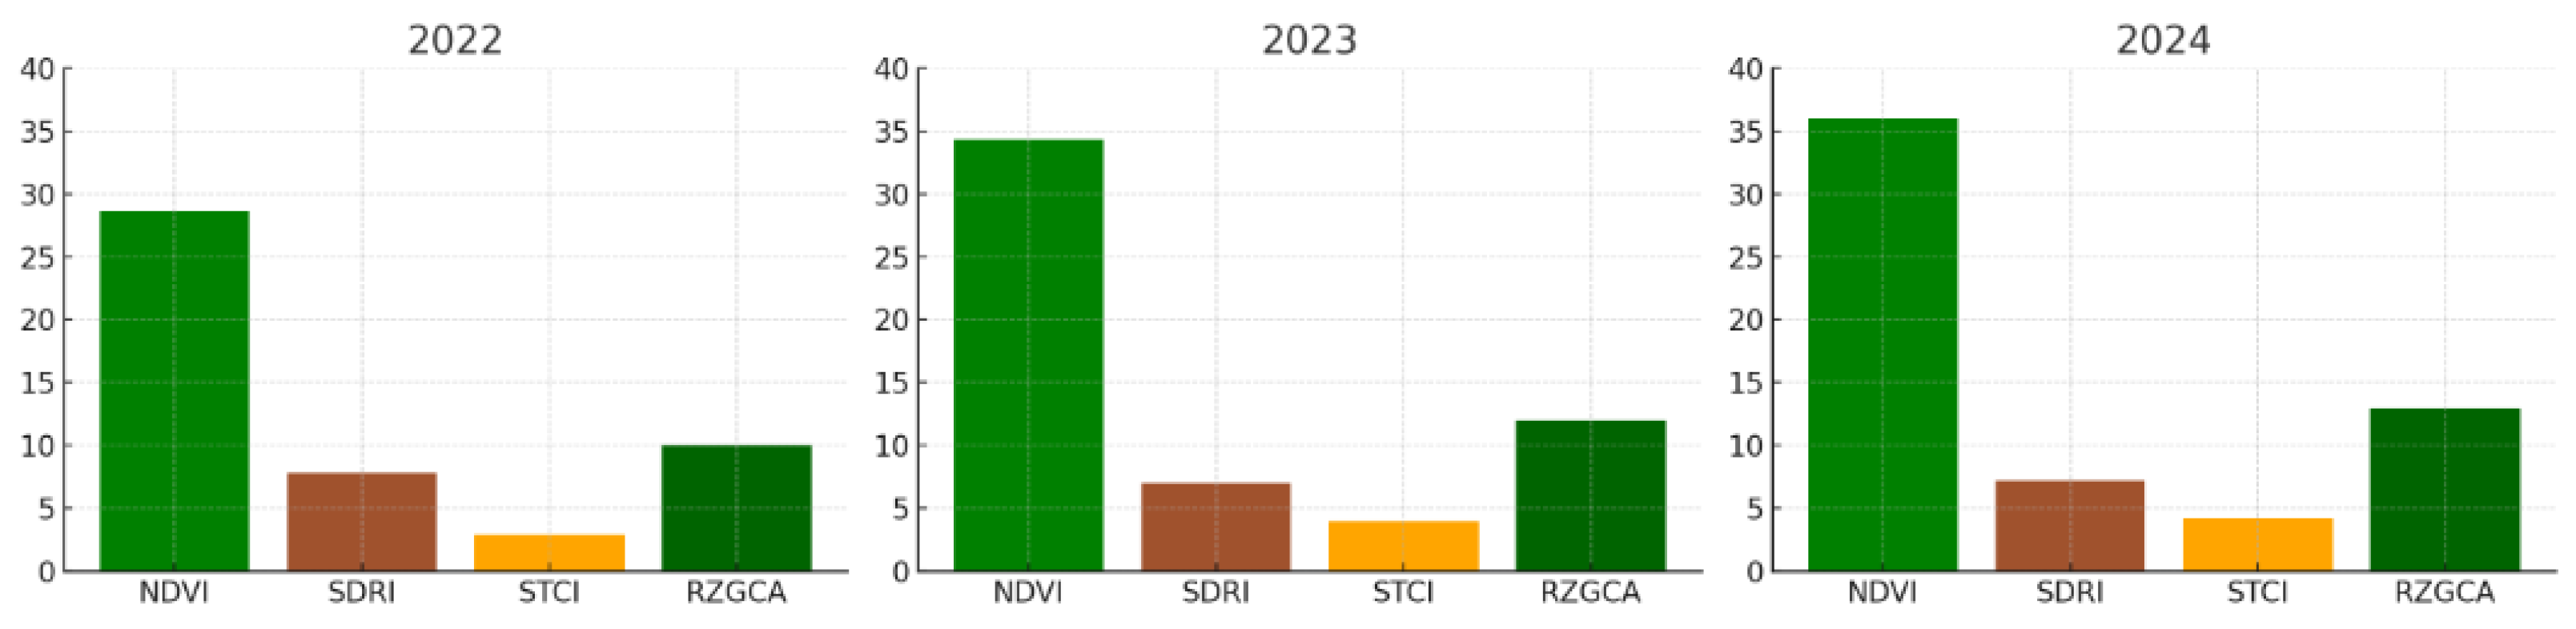
Figure 12.
Dynamics of demographic return in Transcarpathia (2022–2024).
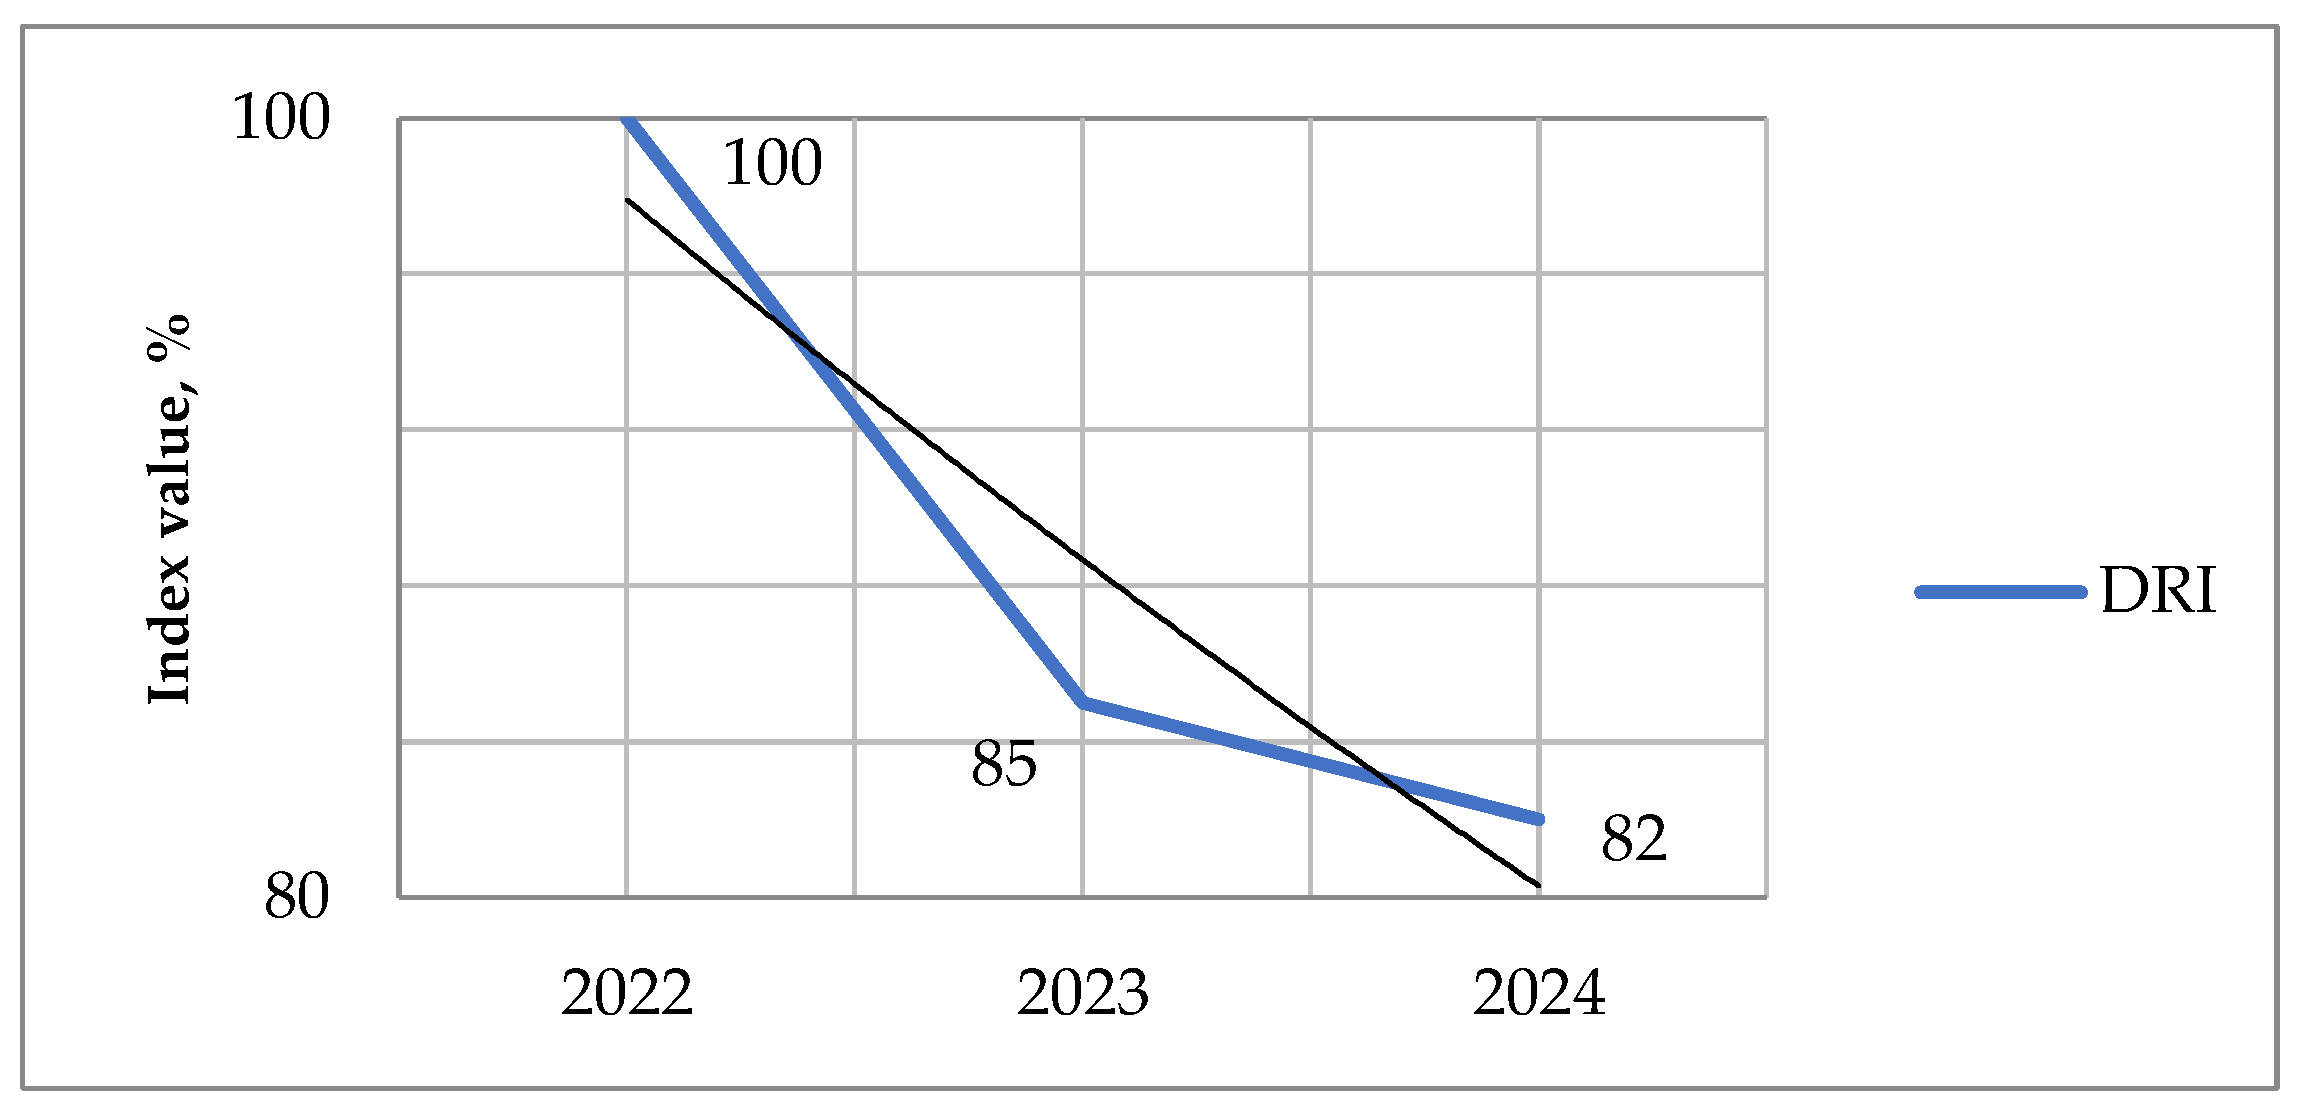
Figure 13.
Dynamics of indices of creation of tourist clusters and development of tourist orders in Transcarpathia (2022-2024).
Figure 13.
Dynamics of indices of creation of tourist clusters and development of tourist orders in Transcarpathia (2022-2024).
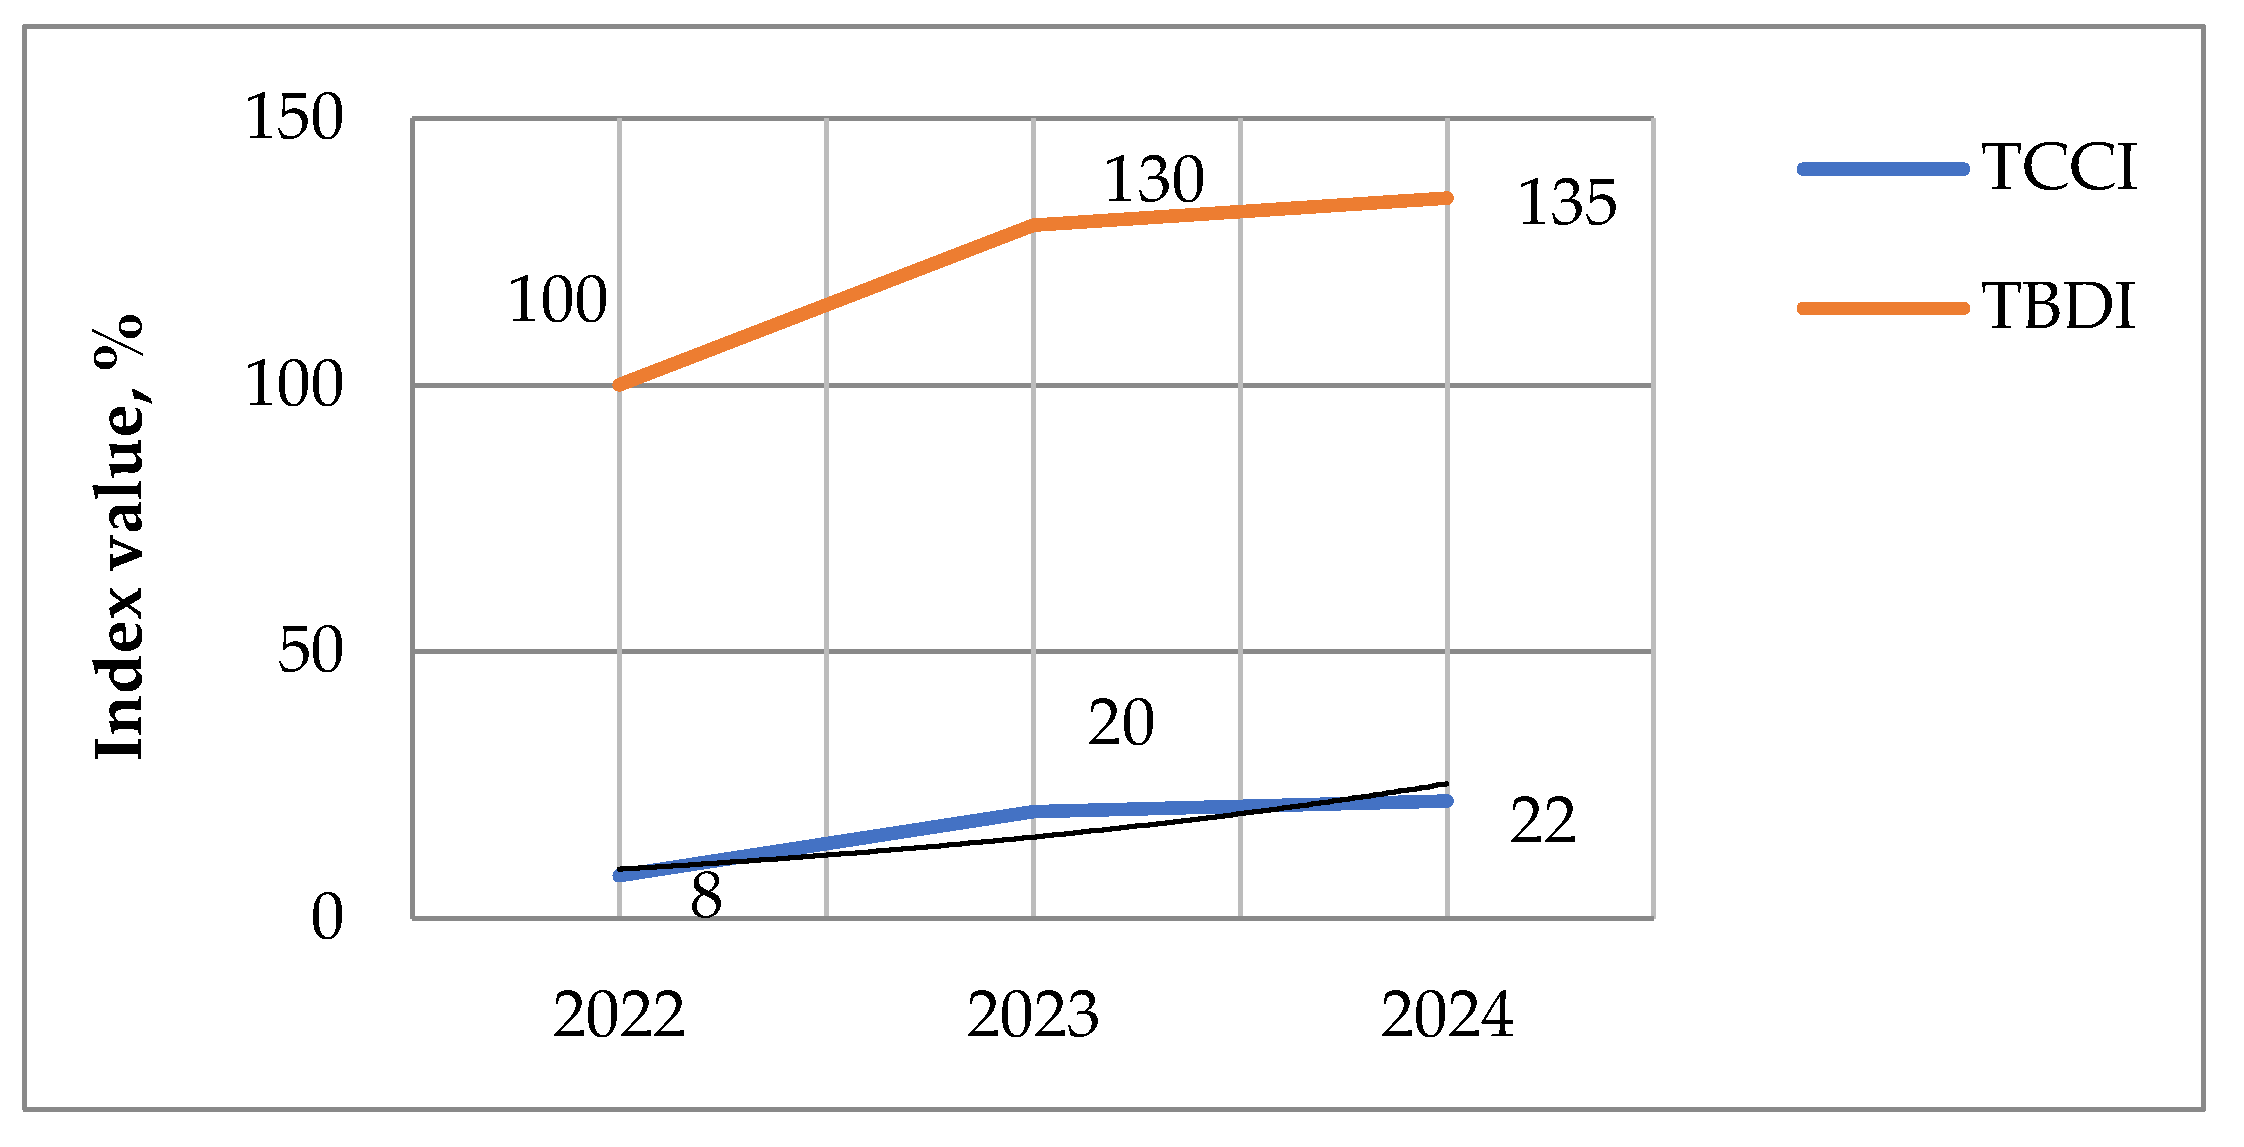
Figure 14.
Dynamics of the digital accessibility index in Transcarpathia (2022-2024).
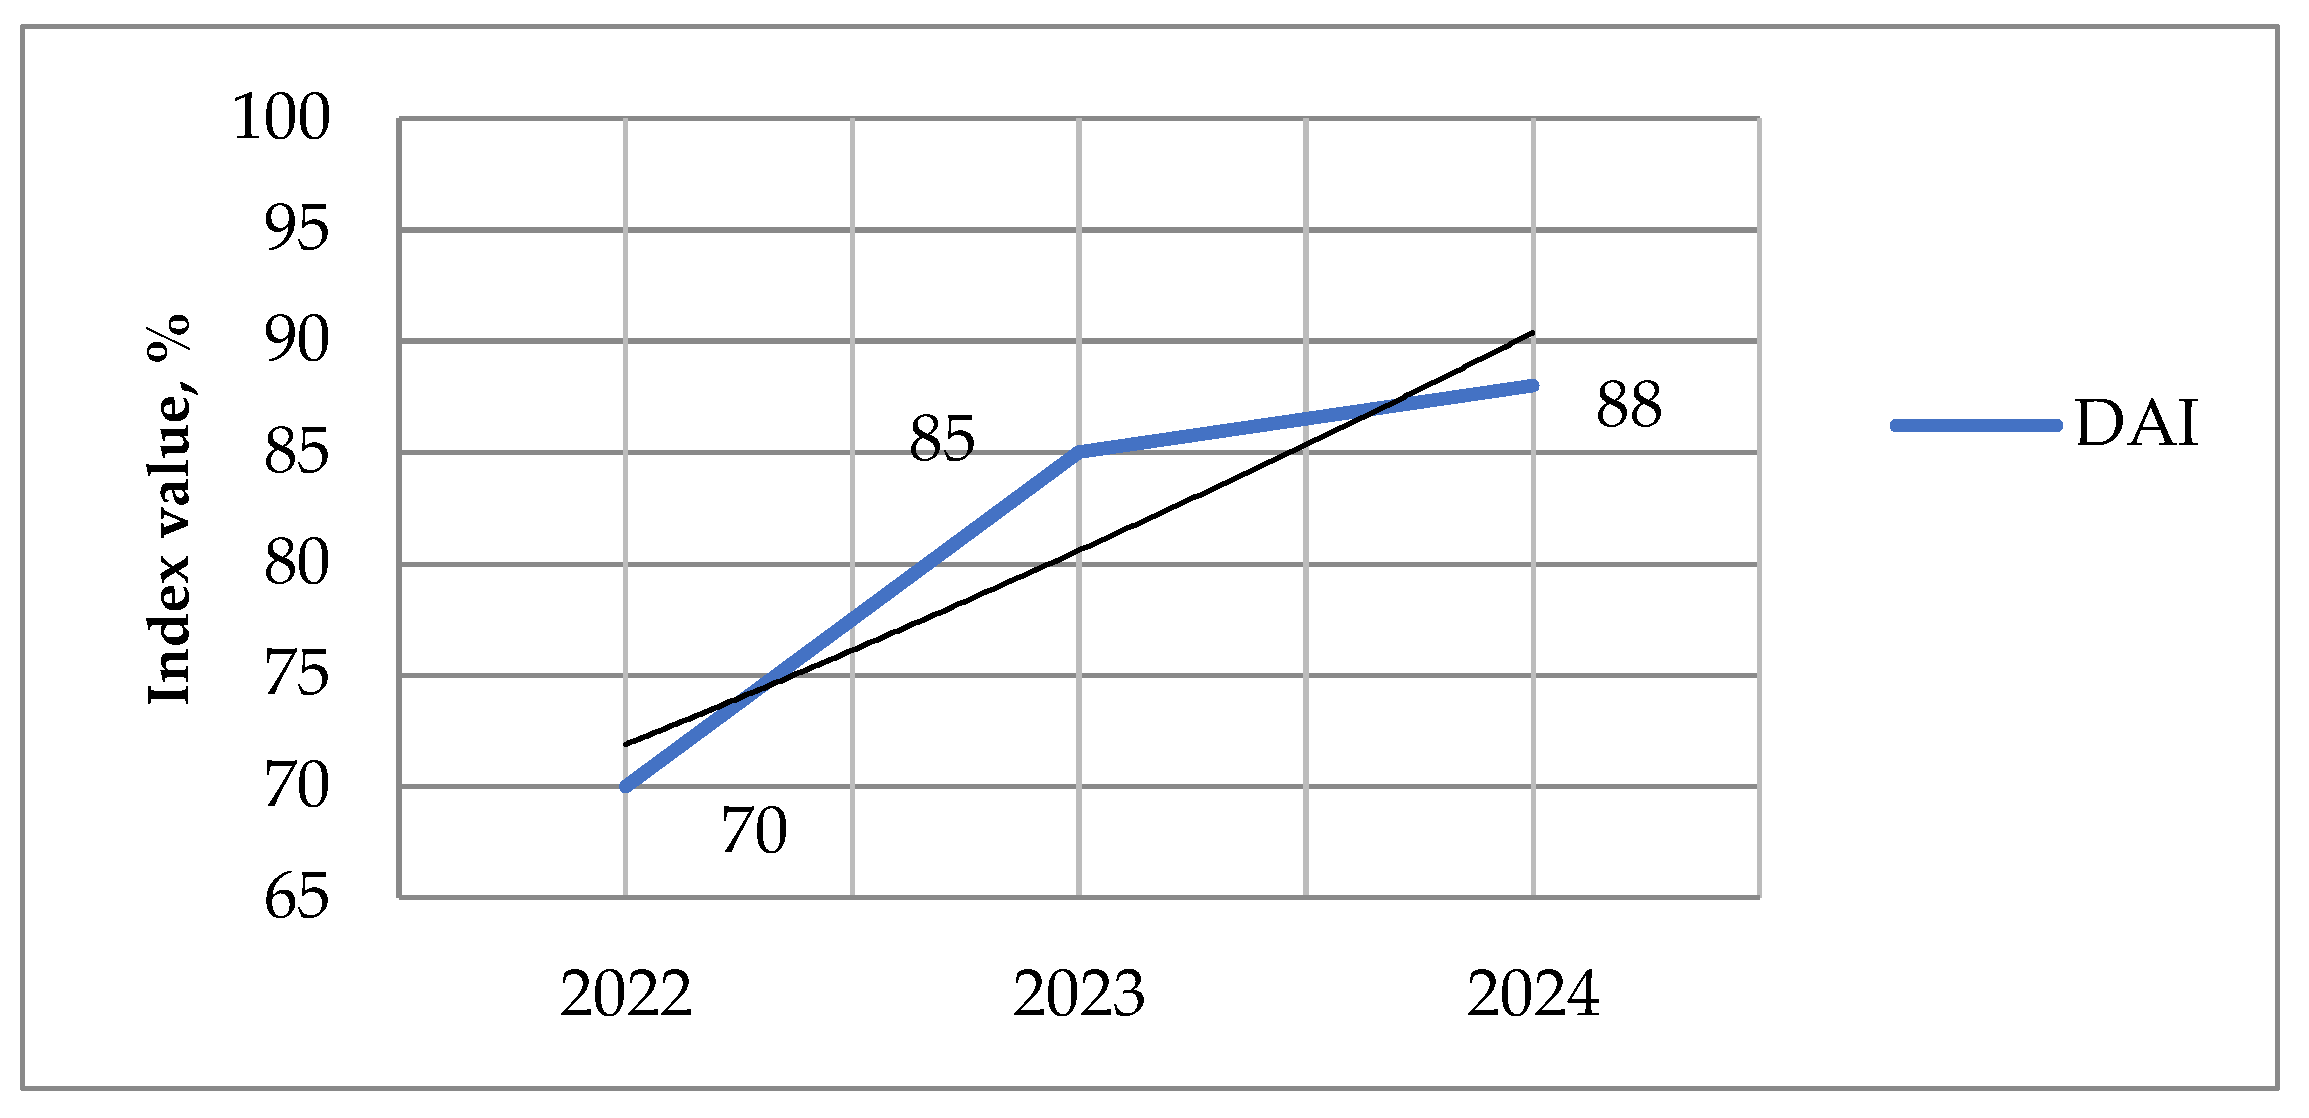
Figure 15.
Dynamics of Service Employment Index in Transcarpathia (2022-2024).
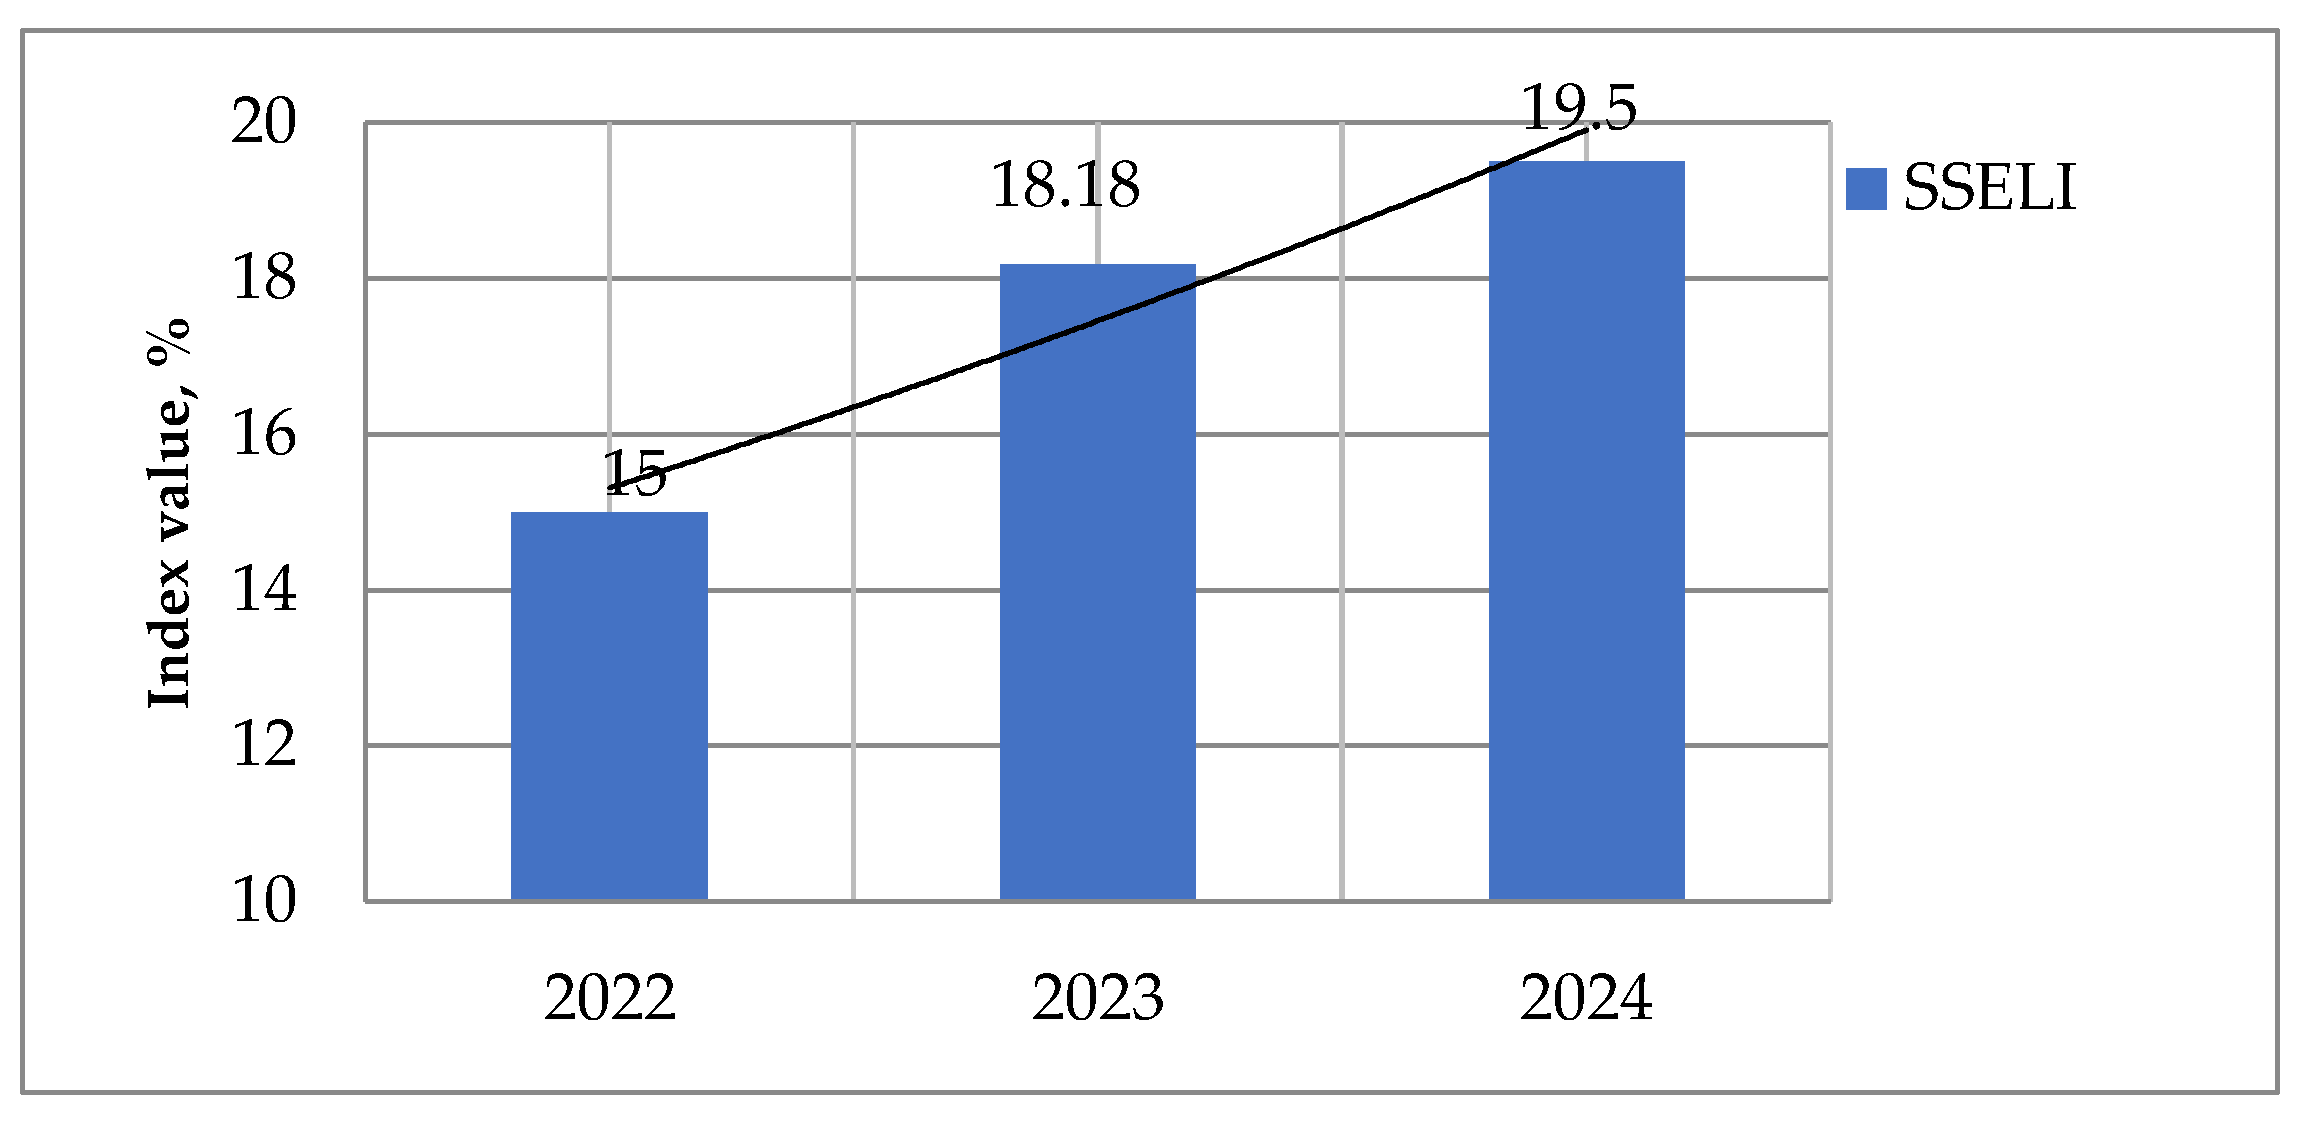
Figure 16.
Structure of employment in tourism and related services in Transcarpathia (2022-2024).
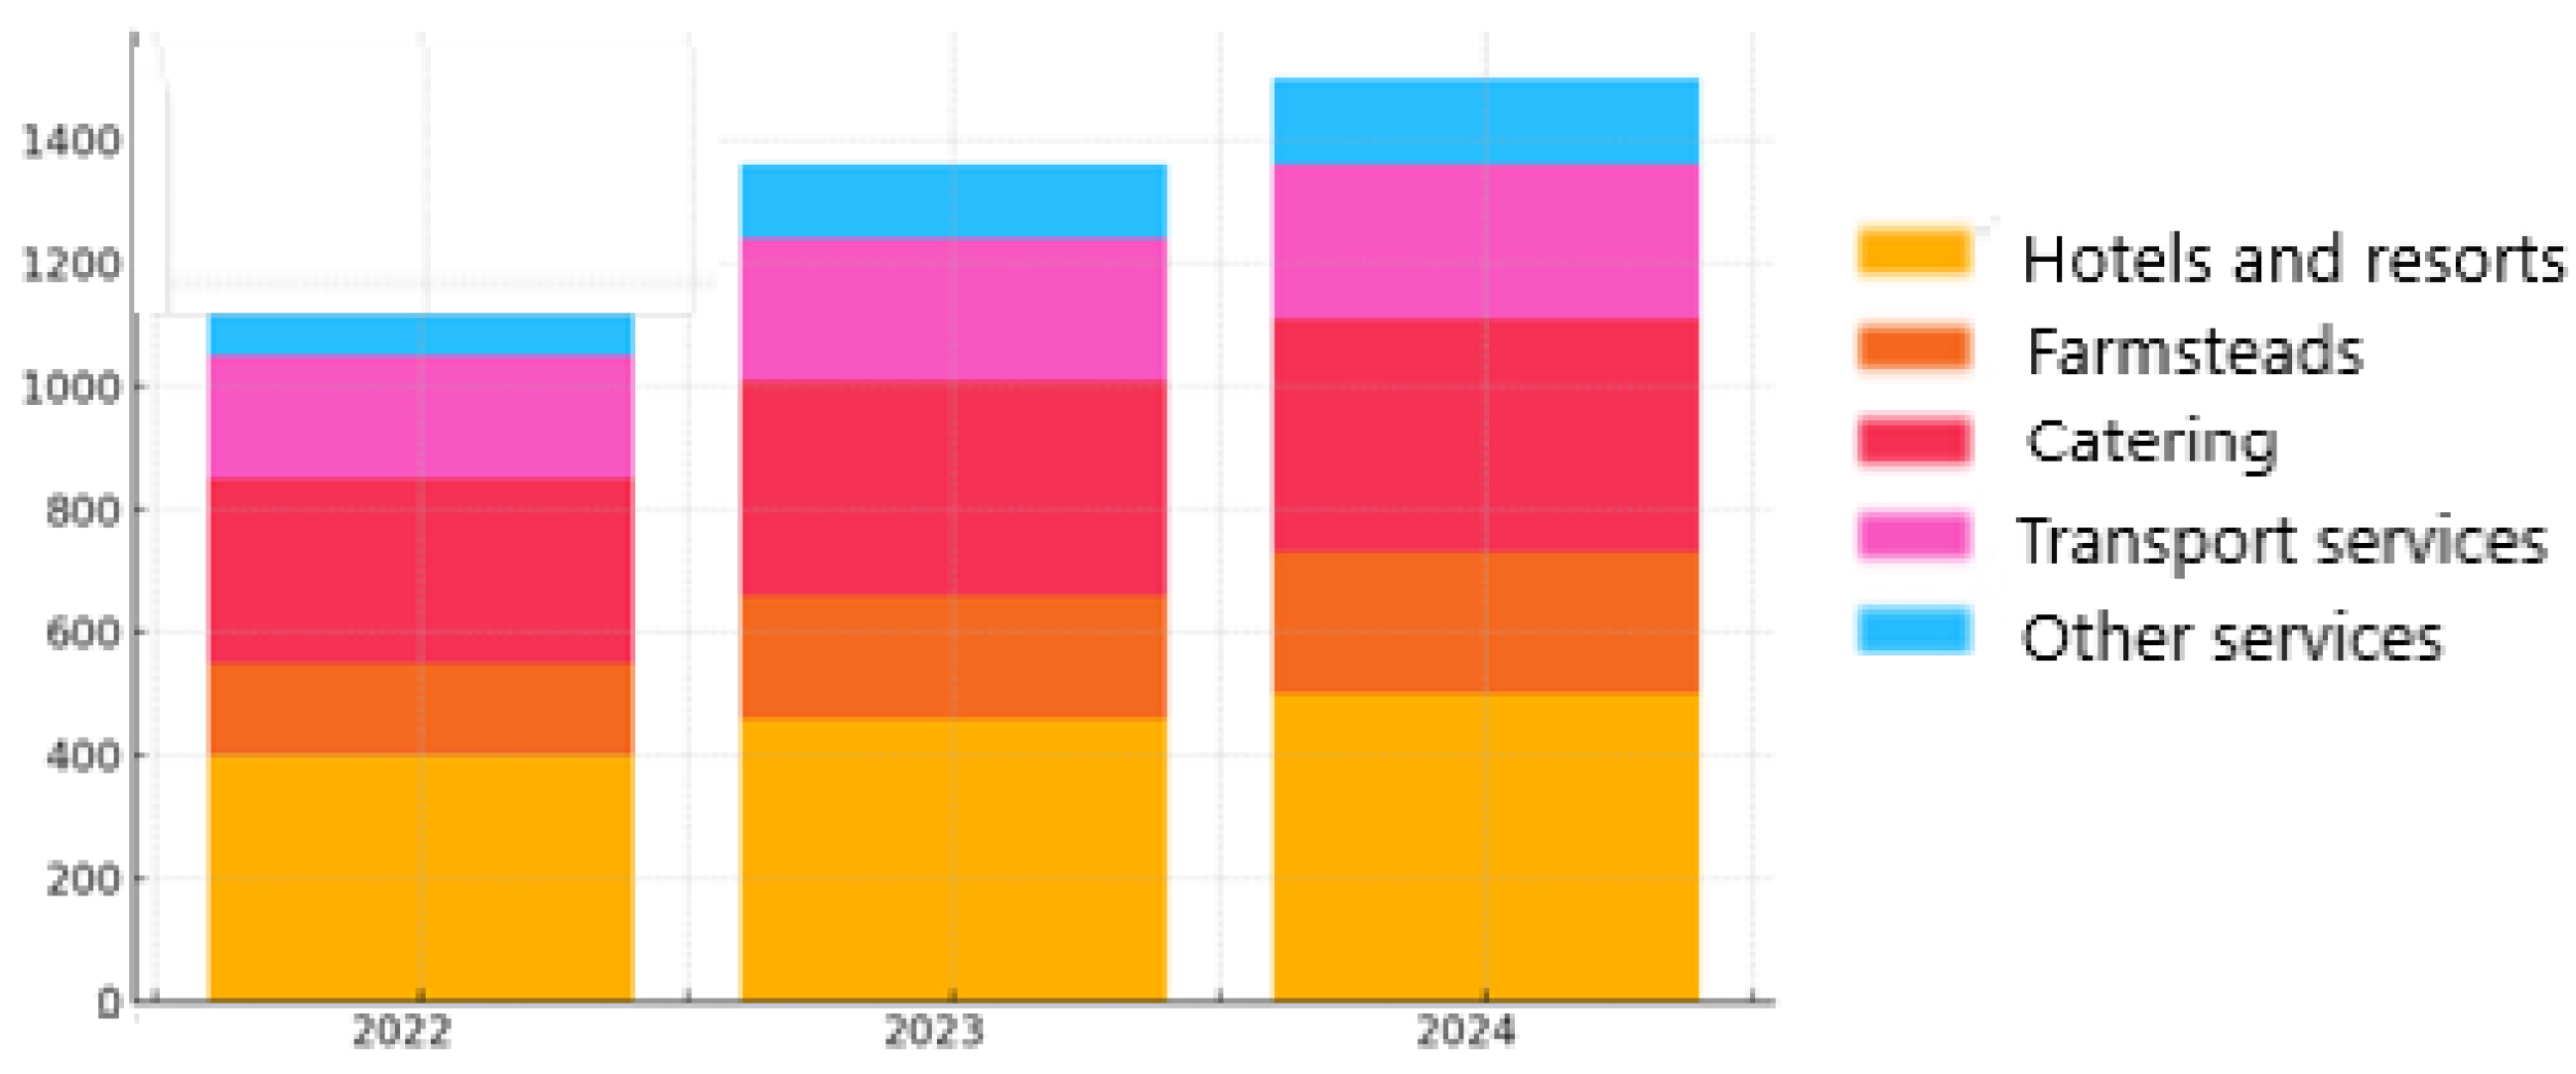
Figure 18.
Schematic distribution of growth zones, transition zones and risk zones according to IRSDRT index in Transcarpathia.
Figure 18.
Schematic distribution of growth zones, transition zones and risk zones according to IRSDRT index in Transcarpathia.
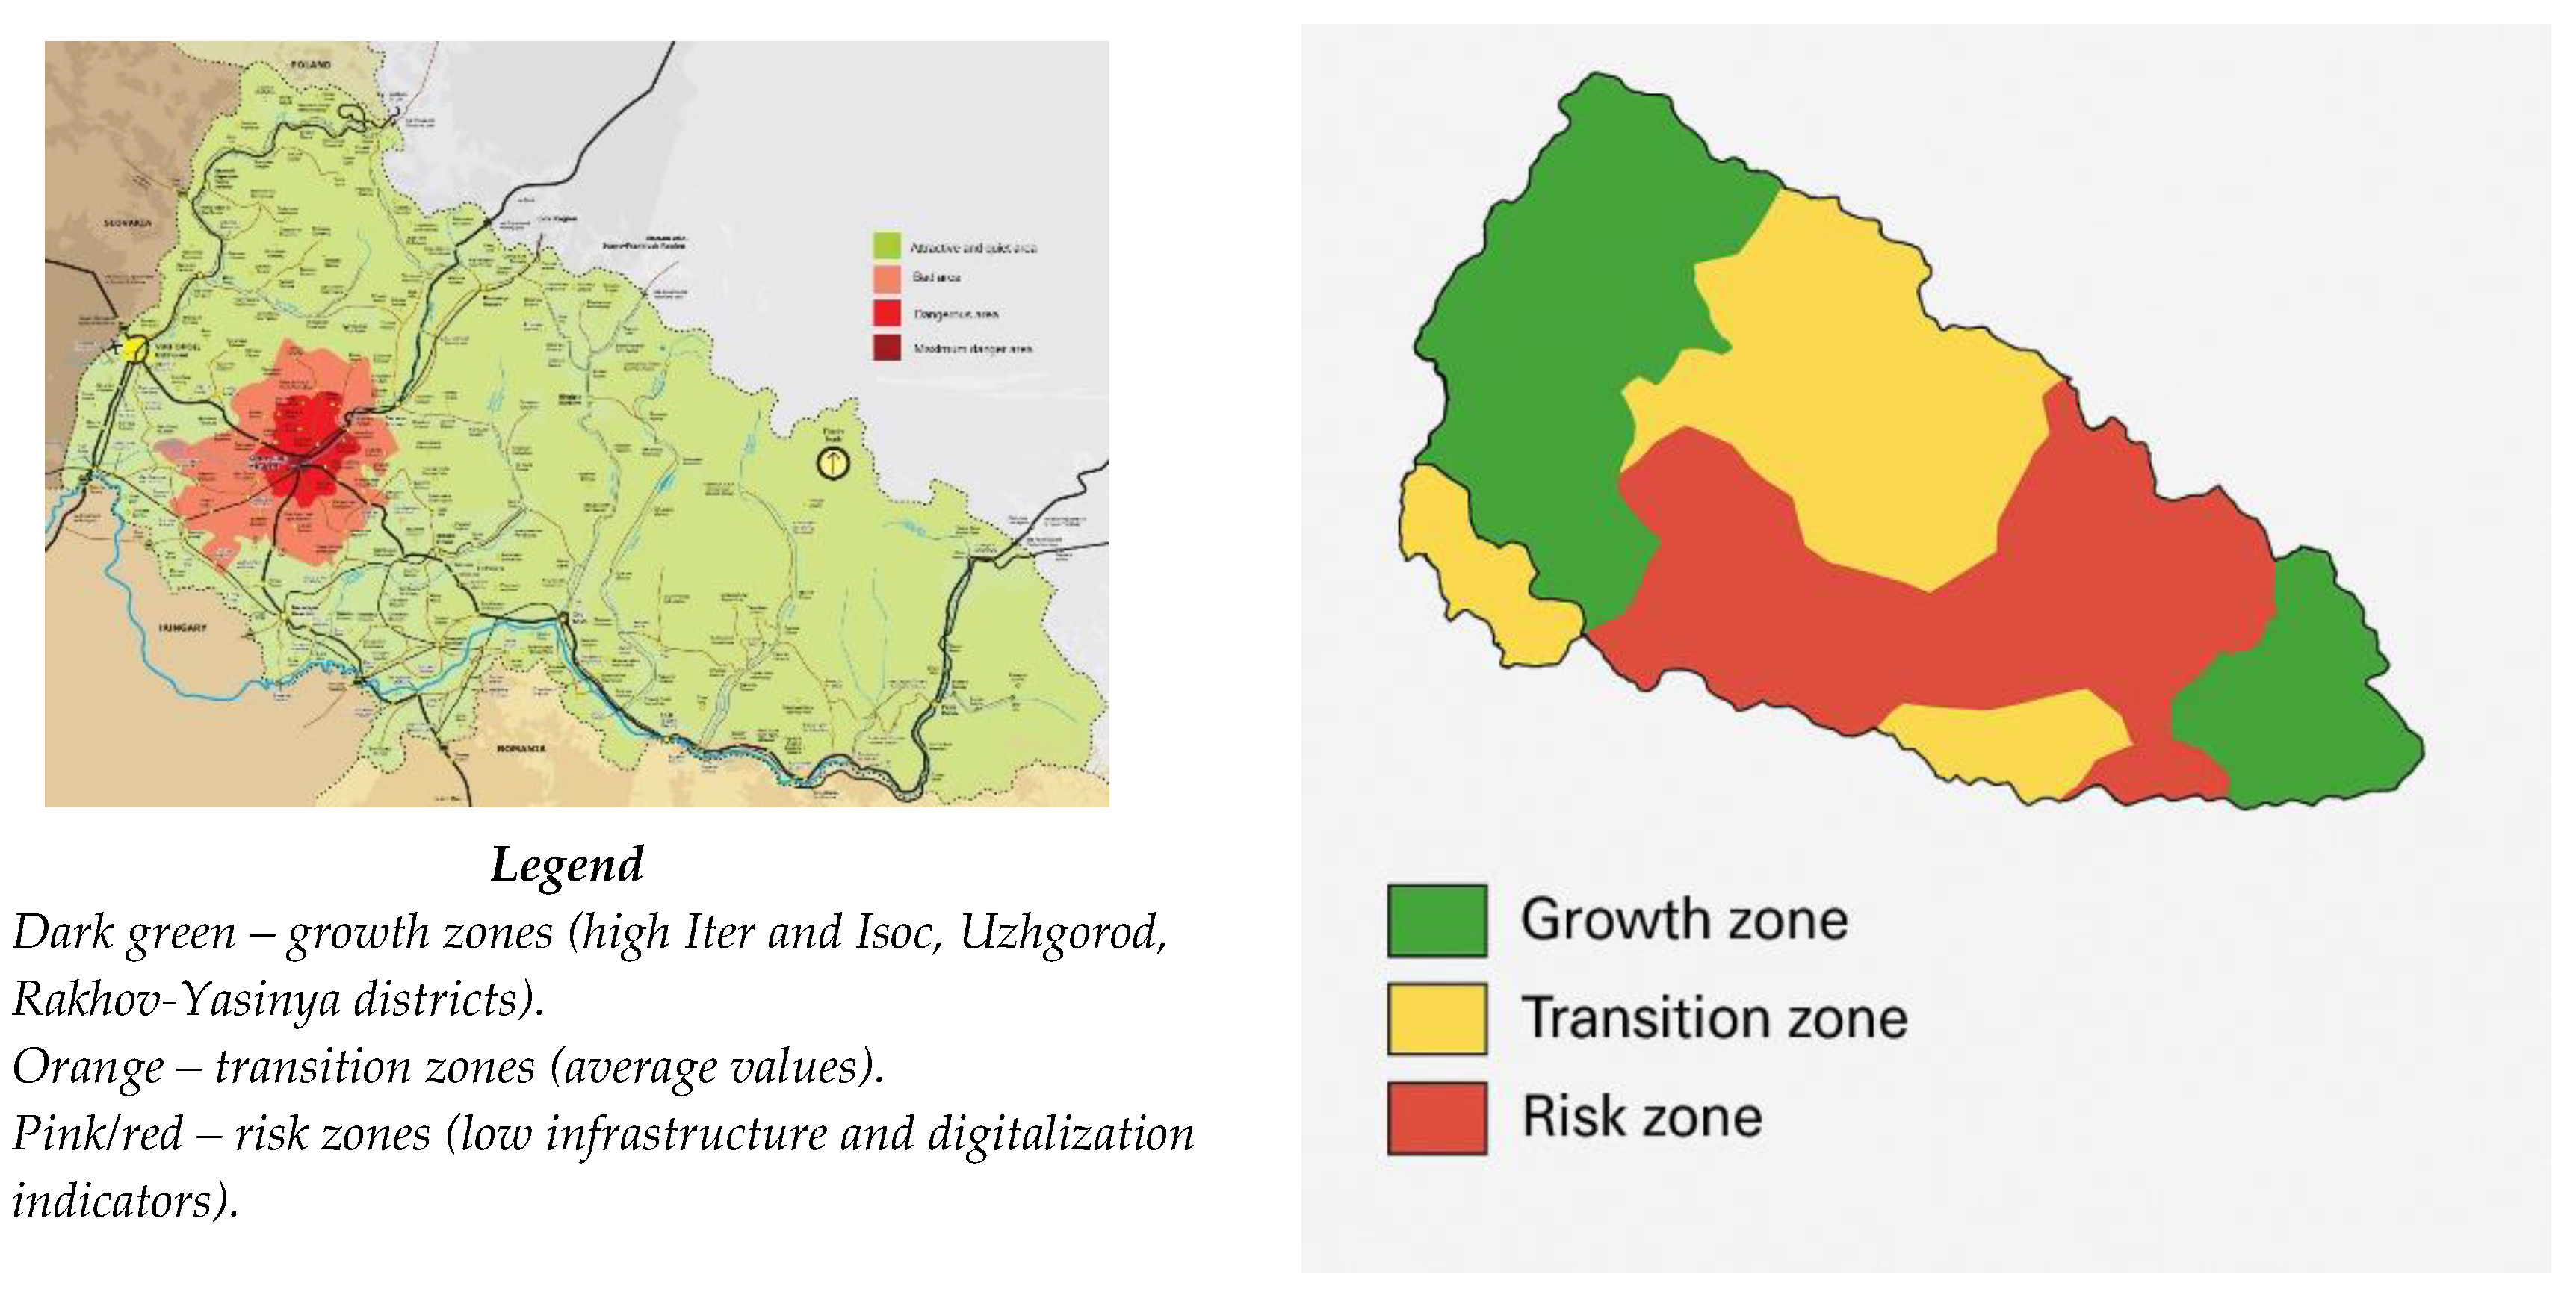
Figure 19.
Colour-coded correlation matrix of sustainable tourism indicators (2022-2024).
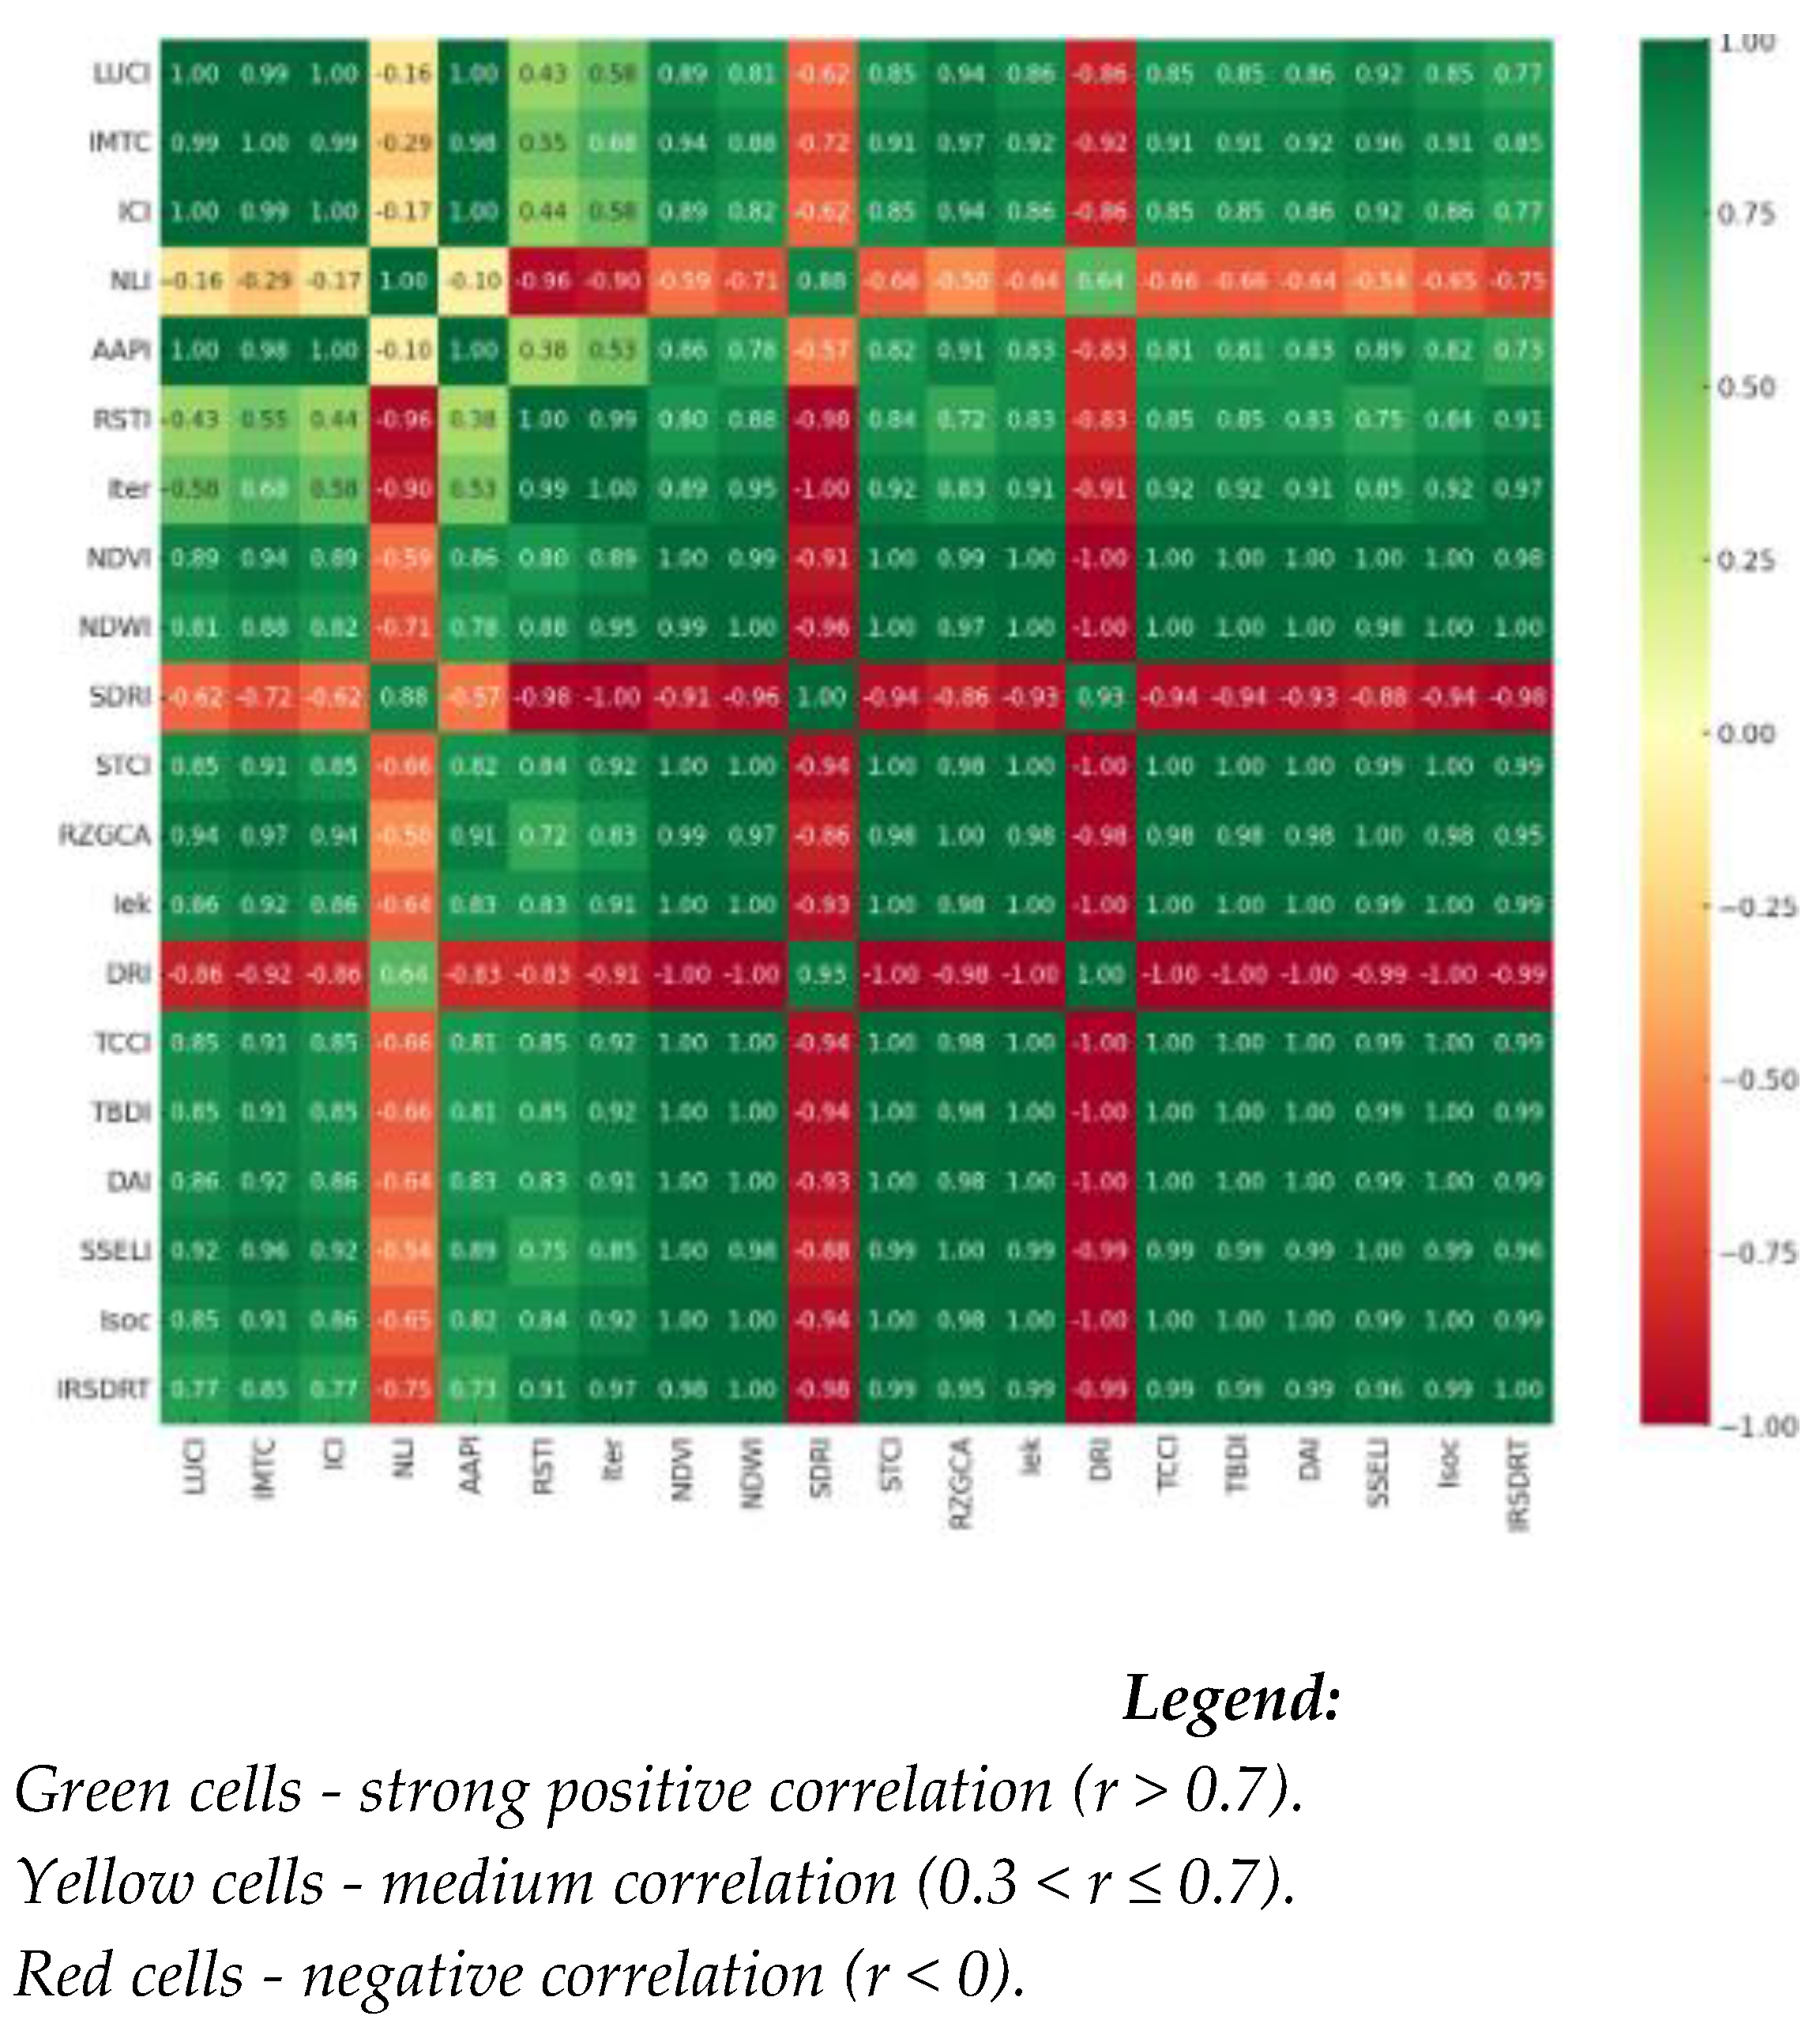
Table 1.
System of indicators for monitoring sustainable development of rural tourism in post-conflict areas.
Table 1.
System of indicators for monitoring sustainable development of rural tourism in post-conflict areas.
| Indicator | Description | Data Source / Level |
|---|---|---|
| 1. Land use and infrastructure rehabilitation | ||
| LUCI — Land Use Change Index (Tourism) | Share of new tourist facilities (eco-estates, campings, agrotourism) | Sentinel-2 satellite images + local cadastral maps |
| MTCI — Index of Mountain Tourism Clustering | Number of associations of small farmers, estates, tour guides in the directions: Uzhgorod-Velykyi Bereznyi, Rakhov-Yasinia | Transcarpathian Tourism Development Agency, QGIS |
| ICI — Infrastructure Coverage Index | Density of tourist roads, bicycle routes, sanatoriums and hotels | OSM, OVA data, Google Maps, tourist registers, “Prozorro” |
| NLI — Night Light Index | Assessment of the level of economic activity and restoration of settlements | VIIRS, DMSP-OLS |
| AAPI — Accessibility to Attraction Points Index | Average distance from villages to the nearest tourist facility (museum, hostel, etc.) | GIS calculations, local data, OSM |
| RSTI — Recovery of Social and Tourist Infrastructure Index | Level of restoration of schools, home culture, parks, tourist facilities | State Register of Destroyed Property + Sentinel-2 |
| 2. Environmental sustainability (after destruction and displacement) | ||
| NDVI — Normalized Difference Vegetation Index | Assessment of the state of green cover (forest, fields, parks) of the Carpathians | Sentinel-2, Planet |
| NDWI — Normalized Difference Water Index | Analysis of the state and area of water bodies (lakes, ponds (Solotvyno, Latoritsya)) | Sentinel-2, GEE, Landsat |
| SDRI — Soil Degradation Risk Index | Assessment of erosion and depletion of soils due to displacement, pollution, tourism | LULC cards, Sentinel-2 |
| STCI — Surface Temperature Change Index | Increase in temperature as an indicator of anthropogenic pressure (development, flow) | MODIS, Landsat |
| RZGCA — Protected Areas and Green Corridors Area | Change or restoration of protected natural areas | Mindovkillya, Protected Planet, QGIS, national parks of Ukraine |
| 3. Socio-economic sustainability and digitalization | ||
| DRI - Demographic Return Index | Return of population to villages after military actions | State Statistics Service + satellite images of population (WorldPop) |
| TCCI - Tourism Cluster Creation Index | Number of new associations of local producers and tourism initiatives | OVA, Regional Development Agencies, Transcarpathia Tourism Events Calendar, Department of Culture |
| TBDI - Tourism Booking Development Index | Dynamics of the number of bookings, excursion orders, accommodations | Booking.com, Airbnb, local platforms |
| DAI - Digital Accessibility Index | Availability of mobile phone coverage, Internet, digital booking services | Speedtest Intelligence, GSMA, Starlink Ukraine, Booking, Prozorro |
| SSELI - Service Sector Employment Level Index | Number of jobs in rural tourism | State Statistics Service, local surveys, employment centers |
Table 2.
Methodology for calculating the integral index of sustainable development of rural tourism.
Table 2.
Methodology for calculating the integral index of sustainable development of rural tourism.
| Formulas for calculating the main indices | Formulas for calculating subindexes |
|---|---|
| 1.1. Land Use and Infrastructure Index: , where LUCI - Land Use Change Index (Tourism); MTCI - Index of Mountain Tourism Clustering; ICI - Infrastructure Coverage Index; NLI - Night Light Index; AAPI - Accessibility to Attraction Points Index; RSTI - Recovery of Social and Tourist Infrastructure Index |
where - total area of new tourist facilities, ha; - oбщая плoщадь анализируемoй территoрии, га. where - number of tourist associations; - number of settlements in the analyzed area; K - correction factor (1.0 for Uzhhorod-Velykyi Bereznyi, 1.2 for Rakhiv-Yasinia). where - length of tourist roads, km; - length of bicycle routes, km; - number of hotels and resorts; - area of the territory, km². where - average nighttime light luminance after the conflict (nanoWatt/cm²/av); - average nighttime luminance before the conflict, nanoWatt/cm²/ av. where - distance from the i-th settlement to the nearest tourist site, km; N - number of settlements. where - number of reconstructed objects; - total number of destroyed objects. |
|
Notes: All indicators are normalized to a percentage scale (0-100%) For IMTC, the K coefficient takes into account the tourist potential of different destinations In ICI, a multiplier of 1000 is used to bring the values to a convenient scale For NLI, data from satellite night observation systems is used In AAPI, an inverse relationship is used - the shorter the distance, the higher the index RSTI can exceed 100% when constructing new facilities to replace destroyed ones | |
| 1.2. Environmental Sustainability Index for Post-Conflict Areas: , where NDVI — Normalized Difference Vegetation Index; NDWI — Normalized Difference Water Index; SDRI — Soil Degradation Risk Index; STCI — Surface Temperature Change Index; RZGCA — Protected Areas and Green Corridors Area |
where - reflectance in the Near-Infrared band; - reflectance in the Red visible band. where - reflectance in the Green visible band. where - average surface temperature for the current period; - base (reference) temperature level. . |
|
Notes: All index components (NDVI, NDWI, SDRI, STCI, RZGCA) are scaled to a single percentage scale (0–100%) to ensure data comparability. For SDRI (soil degradation risk) and STCI (temperature change), the formula (100 − value) is used, since an increase in these indicators indicates a deterioration in the ecological state. STCI can take negative values if the temperature decreases (for example, due to vegetation restoration). RZGCA can exceed 100% if the area of new reserves is larger than the original. For SDRI, the critical threshold is 30% of degraded soils. Accuracy depends on the resolution of satellite data. For mountainous regions, a correction for altitudinal zonality is required. Temperature data (STCI) can be distorted by cloudiness. | |
| 1.3. Index of Socio-Economic Sustainability and Digitalization:, where DRI - Demographic Return Index; TCCI - Tourism Cluster Creation Index; TBDI - Tourism Booking Development Index; DAI - Digital Accessibility Index; SSELI - Service Sector Employment Level Index |
where - number of people returning to the region; - total number of displaced persons. where - number of new tourist associations (farmsteads, eco-trails, guides); number of settlements in the analysis area. . where - current number of bookings (Booking.com, Airbnb, local platforms); wherepre-war level of demand. where - area with stable internet coverage (4G/Starlink); - total area of the region. ,where - number of employees in tourism and related services; - total employment in the region. |
|
Notes: All index components (DRI, TCCI, TBDI, DAI, SSELI) are scaled to a single percentage (0–100%) to ensure data comparability. Values above 100% are acceptable and indicate that the baseline levels have been exceeded. If the number of returnees (Nᵣₑₜᵤᵣₙ) exceeds the number of displaced (Nₚ), the value is fixed at 100%. Only official data from migration services is taken into account. “Tourist associations” include legalized farmsteads, certified guides, and registered eco-trails. The baseline level (Bₚ) is taken for the last pre-war year. Only platforms with verified data (Booking, Airbnb, local systems with state support) are taken into account. “Sustainable coverage” means an internet speed of ≥10 Mbps. Priority technologies: 4G, Starlink, fiber optics. “Related services” include: catering, transport, craft workshops. Data is verified with tax registers to avoid double counting. If Nₚ = 0 (no data on displaced persons), DRI is taken as 100%. For TBDI: in the absence of pre-war data (Bₚ), the average value for similar regions is used. In DAI, territories with protected status (without coverage) are excluded from the calculation. DRI error: ±7% due to unaccounted internal migration. TCCI does not reflect informal initiatives (e.g. illegal eco-trails). DAI does not take into account the quality of communication (only the presence of coverage). | |
| 2. Integral Index of Sustainable Development of Rural Tourism (ІRSDRT): , where — weighting factors for categories; Iter, Iek, Isoc— sub-indices for land use, ecology and socio-economic sphere | |
Table 3.
Indices of sustainable development of rural tourism in the Transcarpathia region of Ukraine in the conditions of war.
Table 3.
Indices of sustainable development of rural tourism in the Transcarpathia region of Ukraine in the conditions of war.
| Гoд | LUCI | MTCI | ICI | NLI | AAPI | RSTI | Iter | NDVI | NDWI | SDRI | STCI | RZGCA | Iek | DRI | TCCI | TBDI | DAI | SSELI | Isoc | IRSDRT |
|---|---|---|---|---|---|---|---|---|---|---|---|---|---|---|---|---|---|---|---|---|
| 2022 | 0.5 | 0.05 | 6.64 | 100.0 | 52.63 | 0.0 | 26.64 | 28.57 | 09.09 | 7.81 | 2.86 | 10.00 | 47.40 | 100.0 | 8.0 | 100.0 | 70.0 | 15.00 | 58.60 | 42.45 |
| 2023 | 1.2 | 0.12 | 7.97 | 85.0 | 55.56 | 120.0 | 44.98 | 34.29 | 16.36 | 07.03 | 4.00 | 12.00 | 50.32 | 85.0 | 20.0 | 130.0 | 85.0 | 18.18 | 67.64 | 53.38 |
| 2024 | 2.5 | 0.20 | 10.39 | 95.0 | 62.50 | 70.0 | 40.10 | 36.00 | 17.00 | 7.20 | 4.20 | 13.00 | 50.92 | 82.0 | 22.0 | 135.0 | 88.0 | 19.50 | 69.30 | 53.44 |
Table 4.
Values of the tourism clustering indicator (MTCI) for various tourist sites in the Uzhhorod- V.Bereznyi and Rakhov-Yasinya clusters (2024).
Table 4.
Values of the tourism clustering indicator (MTCI) for various tourist sites in the Uzhhorod- V.Bereznyi and Rakhov-Yasinya clusters (2024).
| Tourism object | Type of object | MTCI |
| Cluster Uzhgorod- V.Bereznyi | ||
| Eco-estate ‘Forest Fairy Tale’ | Eco Estate | 0.72 |
| Camping ‘Carpathian Holiday’ | Camping | 0.65 |
| Tourist centre ‘Polonyna’ | Turbaza | 0.78 |
| Manor ‘Bereznyansky Dvir’ | Guest House | 0.70 |
| Glamping “EcoCarpathia” | Glamping | 0.68 |
| Eco-farm ‘Green Paradise’ | Eco Farm | 0.73 |
| Tourist complex ‘Serednya Polyana’ | Tour complex | 0.76 |
| Guest house ‘Uzhhorodski Karpaty’ | Guest House | 0.69 |
| Camping ‘Forest Adventure’ | Camping | 0.71 |
| Glamping ‘Forest Dreams’ | Glamping | 0.67 |
| Cluster Rakhiv-Jasinya | ||
| Eco-estate ‘Hutsulska Svitlytsia’ | Eco-house | 0.80 |
| Camping ‘Tisa’ | Camping | 0.74 |
| Tourist complex ‘Dragobrat’ | Tour complex | 0.85 |
| Estate ‘Verkhovyna Hospita’ | Guest house | 0.77 |
| Glamping ‘Carpathian Sky’ | Glamping | 0.82 |
| Ecotourism centre “Svydovets” | Turbaza | 0.83 |
| Guest house ‘Polonyna Yasinya’ | Guest house | 0.79 |
| Camping ‘Gornyi Vidpochynok’ | Camping | 0.76 |
| Estate ‘Hutsulskyi Rai’ | Guest house | 0.81 |
| Glamping ‘Mountain Soul’ | Glamping | 0.84 |
Table 5.
Normalised differential vegetation index and water saturation index in Carpathians and Solotvyno.
Table 5.
Normalised differential vegetation index and water saturation index in Carpathians and Solotvyno.
| Гoд | NDVI (Carpathians) | NDWI (Carpathians) | NDVI (Solotvyno) | NDWI (Solotvyno) |
| 2022 | 30 | 10 | 25 | 8 |
| 2023 | 34 | 15 | 28 | 12 |
| 2024 | 37 | 18 | 31 | 14 |
Disclaimer/Publisher’s Note: The statements, opinions and data contained in all publications are solely those of the individual author(s) and contributor(s) and not of MDPI and/or the editor(s). MDPI and/or the editor(s) disclaim responsibility for any injury to people or property resulting from any ideas, methods, instructions or products referred to in the content. |
© 2025 by the authors. Licensee MDPI, Basel, Switzerland. This article is an open access article distributed under the terms and conditions of the Creative Commons Attribution (CC BY) license (http://creativecommons.org/licenses/by/4.0/).
Copyright: This open access article is published under a Creative Commons CC BY 4.0 license, which permit the free download, distribution, and reuse, provided that the author and preprint are cited in any reuse.


