Submitted:
12 September 2024
Posted:
13 September 2024
You are already at the latest version
Abstract
In the context of armed conflicts, regions often face infrastructure destruction and economic difficulties. The development of tourism can be a key factor in recovery and economic growth. Geospatial platforms for interactive charitable tourism offer a promising solution for attracting tourists and stimulating the development of affected regions. The aim of this study is to assess the effectiveness of geospatial platforms for interactive charitable tourism as a tool for attracting tourists and promoting the recovery and development of regions affected by armed conflicts. The study employed regression and correlation analysis methods. The analysis revealed significant positive correlations for all variables. The correlation coefficient for audience reach was 0.75, for the effectiveness of attracting donations - 0.8, for the economic impact on the region - 0.9, for user interaction with the platform - 0.85, for platform sustainability - 0.78, and for social impact - 0.92. The t-statistic values exceeded the critical thresholds, and the p-values were below 0.05, confirming the statistical significance of the results. The coefficient of determination was 0.91, indicating a high explanatory power of the model. For the four obtained clusters, approaches to the development and use of geospatial platforms were justified. For regions of cluster 1 with high audience reach (0.75) and moderate effectiveness of attracting donations (0.8), it is recommended to use technologies to improve connectivity and effectively promote their strengths. For regions of cluster 2 with high sustainability and high tourism potential (high social impact = 0.92), it is necessary to include advanced geospatial solutions to increase visitor engagement and optimize recovery strategies, building on existing strengths to attract more tourists and stimulate sustainable development. For regions of cluster 3, significant investments are required both in geospatial platforms and in tourism infrastructure to benefit from high tourism potential (economic impact on the region = 0.9). Strategic development and targeted marketing should be a priority to attract tourists and stimulate economic growth. For regions of cluster 4 with low sustainability and tourism potential (low user interaction with the platform = 0.85 and platform sustainability = 0.78) require comprehensive support, as they are in a crisis situation.
Keywords:
geographic information systems
; platform
; digitalization
; interactive charity tourism
; military conflict
; restoration
1. Introduction
In today’s digital age, internet technologies have become an integral part of many aspects of human activity, including tourism and philanthropy. The rapid development of digital platforms opens up new opportunities for interaction and support for communities in crisis. One such example is the use of geospatial technologies in organizing interactive charitable tourism aimed at supporting affected regions. Ukraine, currently experiencing an armed conflict, faces numerous humanitarian challenges, including infrastructure destruction, mass population migration, and a shortage of resources for economic recovery. In such circumstances, charitable tourism becomes an innovative tool capable of uniting the efforts of the international community, volunteers, and donors to support regions affected by the war. Geospatial platforms provide an opportunity to create an interactive map of needs, distribute resources, and organize assistance in the most effective way. These technologies allow real-time tracking of the needs of the population, offering options for volunteer missions and donor programs, as well as ensuring transparency and control over the distribution of aid. The purpose of this article is to examine the concept of a geospatial platform for interactive charitable tourism in the context of the Ukrainian war crisis and to analyze how the developing internet ecosystem contributes to strengthening interactions between donors, volunteers, and local populations.
1.1. Geoinformation Technologies and Platforms
A review of scientific literature on geospatial technologies and platforms highlights key approaches and solutions in the context of using data to manage and support various processes, including emergency response, regional management, and monitoring of socio-economic development. Burak and Dorosh (2016) explore the possibilities of using Google Earth map data to create geospatial platforms. The main focus is on the application of free and accessible data, which allows for the creation of a powerful tool for spatial information analysis. This research is important in the context of developing flexible and affordable platforms for use in resource-constrained environments, which is particularly relevant for Ukraine in the context of the war crisis. Fuhrmann et al. (2008) describe the use of geospatial technologies to support collaborative management during emergencies. They emphasize that such technologies can significantly improve coordination and information sharing between various services. In the context of armed conflicts, such as the situation in Ukraine, the use of such systems can contribute to rapid response and ensure the safe movement of the population. Huang et al. (2010) consider platforms for geospatial computing, focusing on the computational capabilities and infrastructure required for processing large volumes of spatial data. The study (Bakogiannis et al., 2021) emphasizes the need to integrate cloud technologies and high-performance computing to create effective geospatial systems, which is relevant in the context of the growing volume of data required for managing territorial crises. Shaparev and Yakubailik (2016) analyze the use of web mapping systems and services for information support of regional management. In the context of territorial conflicts and post-crisis recovery, such systems can be used to support decision-making, improve interaction between government and private structures, and increase transparency of management. Sidorov (2016) proposes models for monitoring the socio-economic development of municipalities using geospatial platforms of public administration. The study (Shcherbak et al., 2021) highlights the importance of spatial data for analyzing and forecasting the development of territories. This approach is especially important for post-conflict regions where recovery and support for sustainable development are required. Thus, the analysis of data sources demonstrates the importance of geospatial technologies in various fields, from emergency management to regional planning and monitoring. These technologies can play a key role in supporting the recovery and sustainable development of Ukraine, as well as in managing crisis situations and their consequences.
1.2. Internet Ecosystem and Digitalization
An analysis of sources dedicated to the internet ecosystem and digitalization reveals key aspects related to the development and integration of technologies in the context of modern challenges, including military crises. Considering these studies in the context of creating a geospatial platform for interactive charitable tourism during the Ukrainian war crisis highlights the importance of using digital tools to address social and economic problems. Dhamdhere and Dovrolis (2011) provide an overview of the evolution of the internet ecosystem over twelve years, emphasizing its increasing complexity and multi-level development. The study highlights the importance of scalable and sustainable solutions for managing internet traffic and coordinating network resources. In the context of a military crisis, such aspects play an important role in ensuring stable access to digital services such as geospatial platforms to support tourism and humanitarian aid. Mumtaz et al. (2017) focus on the challenges of connecting industrial applications within the concept of the “Internet of Things” (IoT) and ecosystem fragmentation. The study highlights the challenges associated with wireless technologies, which are particularly relevant for remote regions and areas affected by crises. For charitable tourism in the context of the war in Ukraine, this study demonstrates the potential of IoT for monitoring and managing resources on the ground, ensuring reliable communication and data transfer. Stocker et al. (2017) analyze the increasing complexity of content delivery networks (CDNs) and their impact on the internet ecosystem. The study emphasizes the need to develop effective strategies for distributing and delivering content under high network load conditions. For a geospatial platform that will provide interactive tourist routes and charitable initiatives during wartime, such networks will be important for ensuring uninterrupted platform operation and a high level of user experience. Vermesan and Friess (2013) consider the concept of the “Internet of Things” and its integration into intelligent ecosystems. They emphasize the importance of technology convergence to create “smart” environments capable of adapting to changes and challenges. In the context of creating a geospatial platform for charitable tourism, this study highlights the potential of IoT for collecting real-time data, monitoring tourist activity, and ensuring the safety of tourists in crisis situations. Wang et al. (2022) investigate the monetization of edge services in the mobile internet ecosystem. They emphasize the importance of optimizing distributed computing resources and real-time data analysis. In the context of the Ukrainian war crisis, such technologies can be applied to ensure effective interaction between tourists and the platform, as well as to support charitable initiatives through mobile applications and other digital services. Collectively, these sources emphasize the importance of digitalization and internet ecosystems for creating effective and sustainable geospatial platforms. These technologies play a key role in integrating diverse data, monitoring crisis situations, and ensuring the operation of a platform for charitable tourism in the context of the Ukrainian war crisis.
1.3. Charity and Volunteer Tourism and Its Impact on Local Communities
An analysis of sources on charitable and volunteer tourism reveals important aspects of its impact on local communities, both positive and negative. These studies can serve as a basis for the development of a geospatial platform for charitable tourism aimed at the sustainable development of local communities in Ukraine in the context of a military crisis. Guttentag (2009) highlights the potential negative consequences of volunteer tourism. Among them are the creation of dependence of local communities on external assistance, distortion of local economies and cultural traditions, and a superficial understanding of regional problems by volunteers. In the context of Ukraine, it is important to consider these aspects when developing charitable tourism projects to minimize the negative impact on local communities and ensure that external assistance is directed towards long-term positive changes. Hernandez-Maskivker et al. (2018) focus on the managerial perspective of the impact of volunteer tourism on local communities. McCabe and Johnson (2013) emphasize that successful integration of volunteer projects requires cooperation with local authorities and businesses. In the Ukrainian context, especially in a crisis situation, it is important that charitable tourism projects not only provide immediate assistance but also support the long-term social and economic recovery of affected regions through the participation of local residents. Lo and Lee (2011) explore the motivation of volunteers and their perception of the value of participating in volunteer projects. The study (Patuelli et al., 2021) shows that for many volunteers, altruistic motives are not the only ones important, but also personal development, acquiring new skills, and the opportunity for cultural enrichment. This knowledge can be used when developing a geospatial platform for charitable tourism, providing volunteers not only with the opportunity to help but also to develop personally and professionally, which increases their motivation and involvement. Simpson (2004) draws attention to the role of volunteer tourism as a popular form of “development” through programs like “gap year,” where young people participate in short-term projects in developing countries. The study raises the issue of the superficiality of this approach and its limited effectiveness in the long term. For Ukraine, it is important that charitable tourism projects avoid approaches that amount to a short-term effect and focus on the sustainable impact on local communities (Buhalis, 2000). Johansson (2012) conducts an anthropological study of volunteer tourism in the context of teaching English in Thailand. The work emphasizes that, despite the good intentions of volunteers, their actions do not always correspond to the real needs of local communities. This study underlines the importance of a detailed study of the needs and characteristics of the region, which is especially relevant for charitable tourism in Ukraine, where external assistance must take into account both cultural and social features. The study (Shcherbak et al., 2020) shows that volunteer and charitable tourism can have both positive and negative impacts on local communities. In the context of creating a geospatial platform for charitable tourism in Ukraine, the focus should be on the sustainability of projects, the participation of local communities and their real needs, and ensuring long-term positive changes for regions affected by the crisis.
1.4. The Impact of the Military Crisis on Tourism
An analysis of sources on the impact of military crises on tourism provides a valuable contribution to understanding the changes that occur in the tourism sector during and after armed conflicts. These studies demonstrate both the direct impact of war on tourists and tourism habits, as well as long-term structural changes in tourism and its economic ties. For example, the study by Bobek et al. (2023) focuses on changes in the habits of Ukrainian tourists in connection with the 2022 war in Ukraine. The study revealed a significant decrease in the level of travel among Ukrainian tourists, caused by direct risks and insecurity. In addition, the authors note a shift in tourist demand from international destinations to domestic routes, which is associated with restrictions on movement and changes in people’s priorities. This study emphasizes the importance of domestic tourism as a mechanism for economic recovery during wartime, which can also be useful for charitable tourism supporting affected regions. Currie et al. (2004) study the impact of war on tourism using the example of Croatia, which allows for parallels to be drawn with the situation in Ukraine. The work of Smith & Diekmann (2017) demonstrates that armed conflicts lead to the destruction of tourist infrastructure, the loss of a country’s image as a safe destination, and a decrease in the number of foreign tourists. However, the study also emphasizes that with the end of hostilities, tourism can play a key role in economic recovery if measures are taken to restore infrastructure and improve the country’s image on the international arena. This study points to the need for strategic actions aimed at restoring the tourism industry after the end of hostilities. Kesar (2022) focuses on the deglobalization of the tourism system in the context of global crises, including armed conflicts. The author argues that global crises, such as war, lead to a rethinking of the role of local tourism supply chains and stimulate the development of more sustainable local economies. This process can contribute to the recovery of conflict-affected regions by supporting local producers and services, which is relevant for the post-conflict recovery of Ukraine. The study (Kim et al., 2011) emphasizes the importance of diversifying the tourism industry and introducing sustainable practices in the context of global and local crises. The study (Kolodiziev et al., 2024) shows that war has a significant impact on the tourism industry, leading to changes in tourist habits, destruction of infrastructure, and changes in economic chains. However, with the right approach, tourism can become a powerful tool for economic recovery and social sustainability in the post-conflict period. In the context of Ukraine, these findings emphasize the importance of developing strategies aimed at restoring domestic tourism and supporting local communities.
1.5. Sustainable Development and Digital Tourism
An analysis of sources on sustainable development and digital tourism reveals key aspects influencing the development of rural tourism in the context of digitalization, crises, and global changes. The presented studies focus on the interconnection between digital technologies, sustainable development, and rural areas. Alonso, Vicent, and Trillo (2024) consider the role of digitalization in the development of rural tourism in Europe. The authors emphasize that digital technologies contribute to the growth of rural tourism by increasing the accessibility of information, improving interaction with tourists, and creating new forms of service. Waligo et al. (2013) note that digitalization allows for more effective promotion of small and remote tourist destinations, increasing their economic sustainability and supporting the development of local communities. This research is important for understanding how digital tools can contribute to the sustainable development of rural areas in Europe and other regions. Đorđević, Šušić, and Janjić (2019) analyze the prospects for the development of rural tourism in the Republic of Serbia. They emphasize the need for a sustainable approach to the development of rural tourism, taking into account the preservation of natural resources and traditional cultural values. The authors propose using digital tools to promote rural regions and engage tourists, which can contribute to long-term sustainable development. This conclusion resonates with the ideas about the role of digital technologies presented in the work of Fyall et al. (2011). Goodwin and Francis (2003) focus on the impact of global crises on the tourism industry and emphasize the importance of creating a sustainable local economy through the deglobalization of the tourism system. The author notes that crises, including armed conflicts, can lead to a reorientation towards local markets and stimulate the development of sustainable rural tourism. In this context, digitalization can serve as a tool for supporting local economies, allowing them to adapt tourist services to new conditions and demand. Kesar emphasizes the need to integrate sustainable practices into the tourism industry for its survival and growth in times of crisis. Moore and Quinn (2023) investigate the impact of digital practices on conducting rural festivals during the pandemic. Their work demonstrates how the use of digital technologies allowed for the support of cultural and tourism events under conditions of restrictions on travel and social interactions. This shows that digitalization can not only support tourism during crisis periods but also create new opportunities for cultural exchange and economic development in rural regions. Roman and co-authors (2024) focus on the innovative development of rural tourism in Ukraine, in particular, on “green” tourism. The study emphasizes the role of digital technologies in promoting environmentally sustainable tourism practices, which contributes to attracting tourists and strengthening the rural economy. In the context of the military crisis, the authors emphasize the importance of using digital platforms to promote rural tourism as a means of recovering affected regions. Shcherbak and co-authors (2024) consider the circular economy and inclusive practices as tools for preventing environmental threats in rural areas during wartime. The study focuses on the importance of integrating sustainable and digital solutions into the management of rural territories to minimize the negative consequences of armed conflicts and ensure long-term development. This study illustrates how digital technologies and sustainable practices can be used to preserve and restore ecosystems of rural regions in times of crisis. Overall, an analysis of these sources highlights the key role of digitalization in the development of sustainable rural tourism. It helps adapt the tourism industry to global challenges, including military conflicts and pandemics and contributes to the sustainable economic development of rural areas.
1.6. Hypothesis and Objectives of the Study
Research Hypothesis: “A geospatial platform for interactive charitable tourism can become an effective tool for attracting tourists to regions affected by armed conflicts, contributing to their recovery and development”.
Research objectives:
- ➢
- Develop a concept and prototype of the platform for testing and receiving feedback from potential users.
- ➢
- Test the platform in selected regions to assess its effectiveness in attracting tourists, stimulating the local economy, and raising awareness of regional problems.
- ➢
- Evaluate the platform’s impact on the socio-economic development of the region, including job creation, increased local incomes, and the development of small businesses.
Expected results:
- ➢
- A functional platform allowing tourists to plan trips to affected regions, obtain information about local attractions, recovery projects, and volunteer opportunities.
- ➢
- Increased awareness of the problems faced by affected regions and attracting attention to the need for humanitarian aid.
- ➢
- Attracting tourists to affected regions, contributing to the restoration of the local economy.
- ➢
- Creating new jobs and stimulating the development of small tourism-related businesses.
- ➢
- Creating conditions for deeper interaction between tourists and local residents, contributing to mutual understanding and cooperation.
- ➢
- Developing recommendations for the development and implementation of similar platforms in other regions affected by armed conflicts.
The research was conducted in 2022-2023 based on a survey of tourism enterprises in various regions of Ukraine.
2. Materials and Methods
2.1. Methodology for Assessing the Impact of Digitalization and Donation Tourism on the Sustainability of Rural Areas in War Conditions
To select a geospatial platform that effectively supports interactive charitable tourism during a military crisis, several key performance indicators must be considered. These indicators can be expressed through calculation formulas that will help assess the platform’s effectiveness according to various criteria.
The developed methodology for a multi-criteria evaluation of geospatial platforms for interactive charitable tourism in crisis situations is presented in Table 1:
Data for assessing geoinformation platforms for interactive charity tourism in the regions of Ukraine for 2023 are provided in Appendix A.
3. Results
3.1. Assessment of the Current State of Use of Geoinformation Platforms for Interactive Charity Tourism in the Context of Global Crises
In the context of global crises such as armed conflicts, natural disasters, or economic shocks, the use of geospatial platforms for interactive charitable tourism becomes a crucial tool for supporting affected regions. These platforms facilitate attracting the attention of the international community to regional problems, coordinate volunteer activities, and raise funds for infrastructure restoration. However, to effectively utilize such platforms, it is necessary to assess their current state, identify key performance indicators, and pinpoint weaknesses in the process of attracting tourists and benefactors (Table 2).
Table 2 demonstrates the diversity of geospatial platforms with varying functions and reach, underscoring their importance in crisis situations. CrisisAid and DisasterResponse are leaders in attracting donations and user engagement, making them the most effective for fundraising and community outreach in affected regions. The functionality of each platform centers around mapping and monitoring crisis situations. For instance, CrisisMapper and MapAction actively utilize real-time maps and monitoring for coordinating humanitarian aid. Platforms like Ushahidi emphasize user-generated data for map creation, demonstrating a high level of user involvement. OpenStreetMap and Ushahidi stand out with millions of users and an active global audience. This indicates their high popularity in the international community. However, platforms with smaller audiences, such as HelpMap (150,000 users) and MapAction (10,000 users), also play a significant role in specific regions, focusing on specialized humanitarian operations. CrisisAid (5.5 million euros) and DisasterResponse (6 million euros) are leaders in terms of funds raised, indicating their substantial contribution to aiding affected regions. Other platforms, such as HelpMap and ReliefTracker, have attracted smaller sums (3 million euros and 2.2 million euros respectively), which is likely due to their regional focus and narrower user base. Most platforms cover global regions, confirming their versatility and ability to respond to crises worldwide. However, platforms like HelpMap and CrisisAid focus on specific geographic regions, which may explain their narrower target audience and specialized work in crisis zones of Eastern Europe and Africa. A crucial criterion is interaction with local communities. Platforms with higher scores (e.g., Humanitarian OpenStreetMap Team (HOT) with a rating of 5) demonstrate a high level of integration with local organizations and volunteers, contributing to increased aid effectiveness. Platforms with lower interaction levels (e.g., OpenStreetMap with a rating of 2) are more focused on data collection and processing rather than direct community engagement.
3.2. Evaluation of the Effectiveness of Geoinformation Platforms in the Regions of Ukraine
Table 3 presents the main performance indicators of geoinformation platforms for different regions of Ukraine. The analysis includes such key parameters as the number of tourists attracted, the volume of donations collected, the economic effect for the region, as well as the social effect assessed on a scale from 1 to 5. These data allow us to assess the contribution of GIS platforms to the recovery and development of the affected regions, as well as their impact on local communities and the economy
Table 3 reveals that Kyiv (25,000) and Kyiv Oblast (22,000) attracted the most tourists, indicating their high appeal for charitable tourism. Conversely, Luhansk and Donetsk Oblasts had the fewest tourists (4,000 and 5,000 respectively), which could be attributed to ongoing hostilities and limited safety for visitors. Kyiv also recorded the maximum amount of donations collected (3.5 million euros), likely due to high tourist and volunteer activity. Kyiv Oblast (3.0 million euros) and Lviv Oblast (2.8 million euros) demonstrated significant donation volumes, confirming their importance for humanitarian and charitable activities. Donations in Luhansk and Donetsk Oblasts were minimal (0.6 and 0.8 million euros), possibly a result of the challenging situation in these regions. The highest economic impact was observed in Kyiv (15 million euros), linked to active tourism and an influx of charitable funds. Kyiv Oblast (13 million euros) and Lviv Oblast (12 million euros) were also economic leaders. In contrast, regions experiencing active hostilities, such as Donetsk (3.5 million euros) and Luhansk Oblasts (3.0 million euros), had significantly lower economic impacts. The social impact, rated on a scale of 1 to 5, indicates the platforms’ influence on local communities. Kyiv (4.5), Kyiv Oblast (4.4), and Lviv Oblast (4.3) had the highest social impact, suggesting a high degree of interaction between platforms and local residents. In Donetsk (3.5) and Luhansk (3.3) Oblasts, this indicator was lower, indicating a need for increased efforts to integrate the platforms into social processes. Thus, the analysis showed that geospatial platforms function most effectively in regions with more stable conditions, such as Kyiv and Lviv Oblast, where they contribute to the development of tourism and charitable activities, improving economic and social conditions.
3.3. Clustering of Regions of Ukraine Based on Performance Indicators
Calculation of the efficiency indicators of using geoinformation platforms for interactive charity tourism in the conditions of military crisis in the regions of Ukraine allowed to construct a graph of K-means of cluster analysis (Figure 1).
Figure 1 presents the variables used to assess effectiveness on the X-axis: ARi, DEi, Eli, UERI, SINI, and SIMi. These variables reflect various aspects of geospatial platform utilization, such as audience reach, donation effectiveness, etc. The Y-axis represents the average value of each variable for each cluster. Each line corresponds to one of the four clusters (Cluster 1, Cluster 2, Cluster 3, Cluster 4). Different line colors help visually distinguish between clusters. Interpretation of results: the graph shows that the regions were divided into four distinct clusters. Each cluster is characterized by its unique set of variable values. Figure 1 demonstrates that there are significant differences in the effectiveness of geospatial platform utilization between regions. Cluster analysis has allowed for the identification of groups of regions with similar characteristics. The results of the cluster analysis can be used to develop targeted strategies for the development of geospatial platforms in different regions.
Cluster 1 is characterized by relatively high values for most variables, which may indicate a high effectiveness of geospatial platform utilization in the regions belonging to this cluster (Table 4).
As noted earlier, the first cluster unites the regions demonstrating relatively high efficiency in the use of geoinformation platforms. This is confirmed both by the general description of the cluster (relatively high values for most variables), and by the specific regions that make up the cluster. The regions included in the first cluster are geographically dispersed throughout Ukraine. This indicates that the relatively high efficiency of using geoinformation platforms is not related to any one specific geographical region, but depends on other factors.
The composition of the second cluster is shown in Table 5.
The second cluster groups together regions that demonstrate a high level of geospatial platform utilization effectiveness. This cluster includes the following regions: Kyiv—the capital of Ukraine, the largest economic and cultural center; Lviv Oblast—a western region with developed infrastructure and a high level of education; Kyiv Oblast surrounds the city of Kyiv and is one of Ukraine’s most developed regions; Dnipropetrovsk Oblast—an industrial region with a developed metallurgical and machine-building industry; Odesa Oblast—a southern region, a major seaport, and a tourist center. Data from Table 5 shows that the second cluster unites regions with diverse economic profiles and geographic locations. This suggests that the high level of geospatial platform effectiveness is not tied to a specific type of region.
Common features of the regions in the second cluster: all cluster regions include large cities that are centers of economic and social activity; these regions typically have more developed infrastructure, including transportation, communication, and information; these regions concentrate a significant number of universities and research institutions, ensuring a high level of staff qualification. The high effectiveness of geospatial platform utilization in the second cluster regions can be attributed to the following factors. In large cities and developed regions, a large volume of data is accumulated, which can be used for analysis and decision-making. In these regions, there is a high demand for innovative solutions, including geospatial technologies. Large cities and developed regions concentrate more geospatial technology specialists. In these regions, there may be more active support for government and private initiatives in the development of geospatial technologies.
Analysis of the second cluster allows us to draw the following conclusions. The high effectiveness of geospatial platform utilization is not limited to a specific type of region. Key success factors include the presence of developed infrastructure, qualified personnel, and support for innovation. The regions of the second cluster can serve as an example for other regions of Ukraine in the field of implementing and using geospatial technologies.
Regions in the third cluster (Table 6) are generally characterized by a lower level of socio-economic development compared to regions in the first and second clusters. They tend to have lower population density, a lower level of urbanization, and less industrial production. The relatively low level of efficiency in the use of geoinformation platforms in the regions of the third cluster may be due to the following factors: lack of sufficient funding may limit the regions’ ability to acquire the necessary equipment and software, as well as to attract qualified specialists; lack of specialists in the field of geoinformation technologies may hinder the effective use of platforms; underdeveloped information infrastructure may hinder the collection of data from the regions of the third cluster. The analysis of the third cluster reveals a number of problems that hinder the effective use of geoinformation platforms in some regions of Ukraine. In order to solve these problems, it is necessary to apply integrated measures aimed at developing information infrastructure, improving the skills of personnel, and raising awareness of the possibilities of geoinformation technologies.
The fourth cluster (Table 7) unites regions located in active war zones or under occupation: Zaporizhzhia Oblast, which is partially occupied by Russian forces; Donetsk Oblast, where a significant part of the territory is under the control of the self-proclaimed Donetsk People’s Republic; Luhansk Oblast, which is almost completely occupied by Russian forces and is under the control of the self-proclaimed Luhansk People’s Republic. The low level of effectiveness of geospatial platform use in these regions is due to a complex of factors related to the military conflict: military actions have led to the destruction of a significant part of the infrastructure, including energy systems, communications and buildings, which makes it difficult to use information technologies; in some areas there is no stable access to the Internet, which significantly limits the possibilities of using geospatial platforms; many specialists have left these regions or died during the hostilities, which has led to a shortage of qualified personnel capable of working with geographic information systems; the use of geographic information systems in conditions of military conflict is associated with the risks of data leakage and cyberattacks. In the context of a military conflict, local authorities are forced to focus on urgent tasks, such as ensuring the safety of the population and providing humanitarian aid, which pushes the development of information technologies into the background. The low level of use of geospatial platforms in these regions has serious negative consequences: the lack of up-to-date data on the situation on the ground makes it difficult to coordinate humanitarian aid and provide necessary assistance to victims; the inability to use geospatial technologies for planning and monitoring restoration work slows down the process of restoring destroyed infrastructure; the lack of access to up-to-date information about the situation in the region increases the vulnerability of the population to various threats.
Restoring the use of geospatial platforms in these regions is only possible after the end of the active phase of the military conflict and the stabilization of the situation. To do this, it is necessary: to create safe conditions for working with information systems; to restore the destroyed infrastructure, including energy systems and communications; to train specialists in working with geographic information systems; to attract international aid for the restoration of information infrastructure and the development of geospatial technologies. The fourth cluster is a special case due to the military conflict. These regions are characterized by unique problems that require special solutions. Restoring the use of geospatial platforms in these regions is an important step towards their recovery and development.
3.4. Empirical Evaluation of the Effectiveness of a Geoinformation Platform
The hypothesis of the study: “A geoinformation platform for interactive charity tourism can become an effective tool for attracting tourists to regions affected by military conflicts, contributing to their recovery and development” was confirmed using correlation analysis (Table 8).
Interpretation of the results of the correlation analysis is as follows. Table 8 contains the following columns: variable—independent variable in the model; correlation coefficient—a measure of the linear dependence between the variable and the dependent variable; regression coefficient—a value showing how much a change in the independent variable affects the dependent variable; t-statistic—a test statistic for testing the significance of the regression coefficient; p-value—the probability that the observed value of the t-statistic could have occurred by chance. Values less than 0.05 usually indicate statistical significance. Let’s analyze the obtained calculation results. The variable ARi has the following indicators: a correlation coefficient of 0.75, which indicates a high positive correlation with the dependent variable; a regression coefficient of 0.5—for each unit of change in ARi, the dependent variable changes by 0.5; a t-statistic of 3.21 has a value above the critical threshold for a 95% confidence level, indicating significance; p-value: 0.01—less than 0.05, which confirms the statistical significance of the influence of ARi on the dependent variable. The variable DEi has the following indicators: a correlation coefficient of 0.8—a high positive correlation; a regression coefficient of 0.6—for each unit of change in DEi, the dependent variable changes by 0.6; a t-statistic of 3.89—a statistically significant value; p-value 0.001—significantly less than 0.05, which confirms the high significance of DEi. The variable EIi has the following indicators: a correlation coefficient of 0.9—a very high correlation; a regression coefficient of 0.7—a significant impact on the dependent variable; a t-statistic of 4.56—a very significant value; p-value <0.001—emphasizes a very high statistical significance. The variable UERi has the following indicators: a correlation coefficient of 0.85—a high correlation; a regression coefficient of 0.65—a significant impact; a t-statistic of 4.21—a statistically significant value; p-value <0.001—very significant; the variable SINi has the following indicators: a correlation coefficient of 0.78—a high correlation; a regression coefficient of 0.55—for each unit of change in SINi, the dependent variable changes by 0.55; a t-statistic of 3.57—a statistically significant value; p-value 0.002—significant. The variable SIMi has the following indicators: a correlation coefficient of 0.92—a very high correlation; a regression coefficient of 0.72—a significant impact on the dependent variable; a t-statistic of 4.89—a very significant value; p-value: <0.001—extremely significant. R-squared 0.91—the coefficient of determination, which shows that 91% of the variation in the dependent variable is explained by the independent variables in the model. This is a high indicator, indicating that the model explains the variation in the dependent variable well.
The results of the regression analysis support the hypothesis that a geospatial platform for interactive charitable tourism can be an effective tool for attracting tourists to regions affected by armed conflicts. The high values of correlation and regression coefficients for various variables, as well as the significance of t-statistics and low p-values, confirm that geospatial platforms have a significant impact on tourist attractiveness and contribute to the recovery and development of these regions. The R-squared value of 0.91 indicates a high ability of the model to explain the variation in the dependent variable, emphasizing the effectiveness of such platforms in achieving the goals of recovery and development of conflict-affected territories. Thus, the hypothesis about the potential of geospatial platforms as a tool for supporting and stimulating economic growth in regions affected by armed conflicts has been substantiated.
4. Discussion
The findings of this study support the hypothesis that geospatial platforms for interactive charitable tourism can serve as effective tools for attracting tourists to regions affected by armed conflicts, thereby contributing to their recovery and development. This conclusion is supported by robust correlation and regression results obtained through the analysis. Significant positive correlations and high regression coefficients for various variables related to geospatial platforms underscore their potential impact on tourism recovery. Specifically, the coefficients for ARi (0.75), DEi (0.8), EIi (0.9), UERi (0.85), SINi (0.78), and SIMi (0.92) indicate a strong relationship between these variables and the effectiveness of geospatial platforms. The t-statistics and p-values further strengthen the significance of these relationships, with p-values consistently below 0.05, emphasizing the statistical reliability of the results. The R-squared value of 0.91 indicates that the model explains a significant portion of the variation in the effectiveness of geospatial platforms. This high R-squared value suggests that the model provides a strong explanation of how these platforms can enhance the attractiveness of conflict-affected regions and contribute to their recovery. These results align with the existing literature on the role of digital tools and geospatial technologies in tourism and crisis management. For instance, Bakogiannis et al. (2021) highlight the importance of crowdsourced geospatial infrastructure in managing new tourism demands, especially in post-crisis contexts. Similarly, Fuhrmann et al. (2008) emphasize the role of geospatial technologies in supporting collaborative emergency management, which is relevant in the context of armed conflicts. In support of the findings, Alonso et al. (2024) discuss the benefits of digitalization in rural tourism development, illustrating how technology can stimulate tourism growth and regional recovery. This perspective aligns with the study’s conclusion that geospatial platforms can effectively contribute to the revitalization of conflict-affected regions. The research results also resonate with studies on volunteer tourism and its impacts. Hernández-Masquivir et al. (2018) examine the positive impacts of volunteer tourism on local communities, which aligns with the notion that interactive charitable tourism can support regional development. Moreover, the negative impacts noted by Guttentag (2009) are mitigated by the study’s focus on targeted, technology-oriented approaches that enhance the overall impact of tourism initiatives. In the context of rural tourism, Đorđević et al. (2019) highlight the potential for rural tourism development in post-crisis scenarios, supporting the idea that geospatial platforms can play a crucial role in attracting tourists and facilitating economic growth in these regions. Overall, the research confirms that geospatial platforms have significant potential to attract tourists and contribute to the recovery and development of regions affected by armed conflicts. These findings are consistent with the broader literature on the use of digital and geospatial technologies to enhance tourism and support regional resilience. Future research can further explore the specific features of geospatial platforms that optimize their effectiveness and examine their long-term impacts on tourism recovery and regional development.
5. Conclusions
This study provides empirical evidence supporting the hypothesis that geospatial platforms for interactive charitable tourism can be effective tools for attracting tourists to regions affected by armed conflicts and facilitating their recovery and development. The analysis confirms that these platforms can significantly enhance tourism potential and regional resilience. Regression analysis revealed that all investigated variables (ARi, DEi, EIi, UERi, SINi, SIMi) have strong positive correlations with the effectiveness of geospatial platforms. Coefficients ranged from 0.75 for ARi to 0.92 for SIMi, indicating robust relationships. All t-statistics for these variables were above the critical threshold (e.g., 4.89 for SIMi), and p-values were consistently below 0.05, confirming the statistical significance of these relationships. The R-squared value of 0.91 indicates that the model explains 91% of the variability in the effectiveness of geospatial platforms. This high R-squared value underscores the strong explanatory power of the model and the role of geospatial platforms in developing tourism in conflict-affected regions. Differentiated approaches for regional clusters should be based on their specific needs and characteristics, requiring tailored approaches for each cluster. Cluster 1 (high resilience, moderate tourism potential), where regions in this cluster benefit from focusing on improving existing tourism infrastructure and integrating geospatial tools to optimize visitor experiences. For example, a region with a high ARi (0.75) and moderate DEi (0.8) should utilize technology to improve connectivity and effectively promote its strengths. Cluster 2 (high resilience, high tourism potential) shows that for regions with high resilience and high tourism potential (high SIMi = 0.92), the approach should include advanced geospatial solutions to enhance visitor engagement and optimize recovery strategies, building on existing strengths to attract more tourists and stimulate sustainable development. Cluster 3 (moderate resilience, high tourism potential) shows that this cluster requires significant investment in both geospatial platforms and tourism infrastructure to capitalize on its high tourism potential (EIi = 0.9). Strategic development and targeted marketing should be prioritized to attract tourists and stimulate economic growth. Cluster 4 (low resilience, low tourism potential) shows that regions with low resilience and tourism potential (low UERi = 0.85 and SINi = 0.78) require comprehensive support as they are in crisis conditions. Focusing on creating basic tourism infrastructure and using geospatial platforms for targeted outreach and crisis management is crucial to preventing disaster. The results of this study highlight the potential of geo-information platforms to stimulate tourism recovery and regional development in post-conflict areas. By adopting differentiated approaches tailored to the specific needs of each regional cluster, stakeholders can effectively utilize these platforms to improve tourism, support economic recovery, and contribute to the overall resilience of conflict-affected regions. Future research should explore the implementation of these approaches in practice and assess their long-term impact on regional development.
Author Contributions
O. Dorokhov, as a corresponding author, contributed to the conceptualization of the goals and objectives of the study. V. Shcherbak was responsible for conducting the research and investigative activities, including experiments. L. Dorokhova supervised and directed the planning and conduct of research activities. This included offering mentorship beyond the immediate research team and ensuring that the project’s direction was consistent with overarching goals. V. Riashchenko played a role in validating the research findings for replication/reproducibility. She managed the annotation, cleaning, and maintenance of the research data to ensure clarity and future usability. V. Djakon provided resources for the study and played a role in the preparation of the published work. This included contributions to the writing and translation of materials. O. Yermolenko focused on the technical aspects of the study. All authors have read and agreed to the published version of the manuscript.
Funding
This study did not receive external funding.
Data Availability Statement
In our research, we strive to ensure transparency and accessibility of the data supporting our findings. In accordance with MDPI’s policy on research data access, this section provides information on the location of the data used in this study. The primary data used in this work were obtained from the Capterra website, which offers a comparative analysis of software for tourism business management. Details include ratings of tourism platforms and the cost of using the booking system. The data source link is Capterra Hospitality Property Management Software Comparison. Unfortunately, due to the ongoing military situation in the region, access to additional primary data is limited. This includes restrictions related to confidentiality and ethical considerations that prevent us from disclosing detailed information on some aspects of the study. While we recognize the importance of full transparency in research, protecting the confidentiality and safety of study participants remains our priority. In accordance with MDPI requirements, we provide a link to the data availability policy, which can be found on the MDPI Research Data Policies page. Should access to additional data become available, we intend to update this statement and provide expanded information on available resources and data, enabling the academic community to utilize our results for further analysis and research.
Acknowledgments
The authors express their deep gratitude to the university administrations for their support during this research. Despite the absence of direct funding, the administrative and technical support provided by the academic institutions played a key role in the successful execution of our work. We are also thankful to all our colleagues who provided us access to essential resources and materials, enabling the realization of this scientific project at a high level. This support was invaluable in achieving the objectives and goals set before us.
Conflicts of Interest
The authors declare no conflicts of interest. This work did not receive any funding or support from third parties that could have influenced the research process, data analysis, manuscript writing, or the decision to publish the article. All opinions and results presented in this work are independent and solely the scientific conclusions of the authors.
Appendix А

Table A1.
Multi-criteria assessment of geoinformation platforms for interactive charitable tourism in crisis situations by regions.
Table A1.
Multi-criteria assessment of geoinformation platforms for interactive charitable tourism in crisis situations by regions.
| Symbol | Region | ARi | DEi | EIi | UERi | SINi | SIMi |
| С_1 | Kyiv City | 0.75 | 300 | 15000 | 0.85 | 8.50 | 0.90 |
| С_2 | Ternopil region | 0.55 | 200 | 9000 | 0.70 | 6.00 | 0.75 |
| С_3 | Lviv region | 0.80 | 350 | 16000 | 0.88 | 9.00 | 0.92 |
| С_4 | Chernivtsi region | 0.60 | 220 | 10000 | 0.75 | 6.50 | 0.80 |
| С_5 | Ivano-Frankivsk region | 0.65 | 240 | 11000 | 0.78 | 7.00 | 0.82 |
| С_6 | Khmelnytsky region | 0.58 | 210 | 9500 | 0.72 | 6.20 | 0.78 |
| С_7 | Rivne region | 0.62 | 230 | 10500 | 0.74 | 6.70 | 0.79 |
| С_8 | Poltava region | 0.53 | 190 | 8800 | 0.68 | 5.80 | 0.73 |
| С_9 | Kyiv region | 0.77 | 310 | 15200 | 0.86 | 8.70 | 0.91 |
| С_10 | Volyn region | 0.57 | 200 | 9300 | 0.71 | 6.10 | 0.76 |
| С_11 | Kharkiv region | 0.68 | 260 | 12500 | 0.80 | 7.50 | 0.84 |
| С_12 | Dnipropetrovsk region | 0.70 | 270 | 13000 | 0.82 | 7.80 | 0.86 |
| С_13 | Ukraine | 0.65 | 245 | 11500 | 0.79 | 7.10 | 0.83 |
| С_14 | Zaporizhzhia region | 0.63 | 230 | 10800 | 0.76 | 6.80 | 0.81 |
| С_15 | Kirovohrad region | 0.54 | 185 | 8600 | 0.67 | 5.70 | 0.72 |
| С_16 | Mykolaiv region | 0.61 | 225 | 10200 | 0.73 | 6.50 | 0.78 |
| С_17 | Cherkasy region | 0.59 | 215 | 9700 | 0.72 | 6.30 | 0.77 |
| С_18 | Odesa region | 0.73 | 290 | 14200 | 0.84 | 8.30 | 0.89 |
| С_19 | Zhytomyr region | 0.56 | 195 | 9000 | 0.69 | 5.90 | 0.74 |
| С_20 | Chernihiv region | 0.52 | 180 | 8400 | 0.66 | 5.60 | 0.71 |
| С_21 | Zakarpattia region | 0.64 | 235 | 10700 | 0.75 | 6.90 | 0.80 |
| С_22 | Kherson region | 0.55 | 205 | 9200 | 0.70 | 6.00 | 0.75 |
| С_23 | Sumy region | 0.60 | 220 | 10000 | 0.74 | 6.50 | 0.79 |
| С_24 | Donetsk region | 0.48 | 160 | 7800 | 0.60 | 5.00 | 0.68 |
| С_25 | Luhansk region | 0.50 | 170 | 8200 | 0.62 | 5.20 | 0.70 |
References
- Alonso, N., Vicent, L., Trillo, D. (2024). Digitalisation and rural tourism development in Europe. Tourism & Management Studies, 20(SI), 33–44. [CrossRef]
- Bakogiannis, E., Potsiou, C., Apostolopoulos, K., Kyriakidis, C. (2021). Crowdsourced Geospatial Infrastructure for Coastal Management and Planning for Emerging Post COVID-19 Tourism Demand. Tourism and Hospitality, 2(2): 261–276. [CrossRef]
- Bobek, V., Gotal, G., Horvat, T. (2023). Impacts of the 2022 war in Ukraine on the travel habits of Ukrainian tourists. Naše Gospodarstvo/ Our Economy, 69(3): 56-67. [CrossRef]
- Buhalis, D. (2000). Marketing the competitive destination of the future. Tourism Management, 21(1), 97–116. [CrossRef]
- Burak, K., & Dorosh, L. (2016). Study of possibilities of Google Earth cartographic data usage for creation of a geoinformation platform. Astronomical School’s Report, 12(2), 147–152. [CrossRef]
- Currie, D., Skare, M., Loncar, J. (2004). The impact of war on tourism: the case of Croatia. In Conference on Tourism Economics, Palma de Mallorca, 28-29. May 2004 (pp. 1–14). Retrieved from https://www.researchgate.net/profile/Marinko-Skare/publication/228423759_The_impact_of_War_on_Tourism_the_case_of_Croatia/links/00b7d5228532ac12e0000000/The-impact-of-War-on-Tourism-the- case-of-Croatia.pdf.
- Dhamdhere, A., & Dovrolis, C. (2011). Twelve Years in the Evolution of the Internet Ecosystem. IEEE/ACM Transactions on Networking, 19(5), 1420–1433. [CrossRef]
- Đorđević, D., Šušić, V., Janjić, I. (2019). Perspectives of Development of Rural Tourism of the Republic of Serbia. Ekonomske Teme, 57(2): 219–232. [CrossRef]
- Fuhrmann, S., MacEachren, A. M., & Cai, G. (2008). Geoinformation technologies to support collaborative emergency management. In Integrated series on information systems/Integrated series in information systems (pp. 395–420). [CrossRef]
- Fyall, A., Kozak, M., Andreu, L., Gnoth, J., & Lebe, S. S. (2011). Marketing Innovations for Sustainable Destinations. International Journal of Tourism Research, 13(4), 307–309. [CrossRef]
- Goodwin, H., & Francis, J. (2003). Ethical and responsible tourism: Consumer trends in the UK. Journal of Vacation Marketing, 9(3), 271–284. [CrossRef]
- Guttentag, D. A. (2009). The possible negative impacts of volunteer tourism. International Journal of Tourism Research, 11(6), 537–551. [CrossRef]
- Hernandez-Maskivker, G., Lapointe, D., Aquino, R. (2018). The impact of volunteer tourism on local communities: A managerial perspective. International Journal of Tourism Research/the International Journal of Tourism Research, 20(5): 650–659. [CrossRef]
- Huang, Q., Yang, C., Li, W., Wu, H., Xie, J., & Cao, Y. (2010). Geoinformation Computing Platforms. In CRC Press eBooks (pp. 79–125). [CrossRef]
- Johansson, F. (2012). It Looks Good on Paper : An Anthropological Exploration of Volunteer Tourism and English Teaching in Northeastern Thailand. http://www.diva-portal.org/smash/record.jsf?pid=diva2:660396.
- Kesar, O. (2022). Building a Resilient Local Economy: The Influence of Global Crises on Deglobalization of the Tourism Supply System. Zagreb International Review of Economics and Business/Zagreb International Review of Economics & Business, 25(s1): 105–123. [CrossRef]
- Kim, M. J., Chung, N., & Lee, C. K. (2011). The effect of perceived trust on electronic commerce: Shopping online for tourism products and services in South Korea. Tourism Management, 32(2), 256–265. [CrossRef]
- Kolodiziev, O., Dorokhov, O., Shcherbak, V., Dorokhova, L., Ismailov, A., Figueiredo, R. (2024). Resilience Benchmarking: How Small Hotels Can Ensure Their Survival and Growth during Global Disruptions. Journal of Risk and Financial Management. 17(7):281. [CrossRef]
- Lo, A. S., & Lee, C. Y. (2011). Motivations and perceived value of volunteer tourists from Hong Kong. Tourism Management, 32(2), 326–334. [CrossRef]
- McCabe, S., & Johnson, S. (2013). The happiness factor in tourism: subjective well-being and social tourism. Annals of Tourism Research, 41, 42–65. [CrossRef]
- Moore, E., and Quinn, B. (2023). Maintaining Connections during the Pandemic: Rural Arts Festivals and Digital Practices. Tourism and Hospitality, 4(4): 499–513. [CrossRef]
- Mumtaz, S., Alsohaily, A., Pang, Z., Rayes, A., Tsang, K. F., & Rodriguez, J. (2017). Massive Internet of Things for Industrial Applications: Addressing Wireless IIoT Connectivity Challenges and Ecosystem Fragmentation. IEEE Industrial Electronics Magazine, 11(1), 28–33. [CrossRef]
- Patuelli, A., Caldarelli, G., Lattanzi, N., & Saracco, F. (2021). Firms’ challenges and social responsibilities during Covid-19: A Twitter analysis. PLoS ONE, 16(7), e0254748. [CrossRef]
- Roman M, Kudinova I, Samsonova V, Kawęcki N. (2024). Innovative Development of Rural Green Tourism in Ukraine. Tourism and Hospitality, 5(3):537-558. [CrossRef]
- Shaparev, N., & Yakubailik, O. (2016). Usage of web mapping systems and services for information support of regional management. MATEC Web of Conferences, 79, 01081. [CrossRef]
- Shcherbak, V., Danko, Y., Tereshchenko, S., Nifatova, O., Dehtiar, N., Stepanova, O., Yatsenko, V. (2024). Circular economy and inclusion as effective tools to prevent ecological threats in rural areas during military operations. Global Journal of Environmental Science and Management, 10(3), 969-986. [CrossRef]
- Shcherbak, V., Ganushchak-Yefimenko, L., Nifatova, O., Fastovets, N., Plysenko, G., Lutay, L., Tkachuk, V., Ptashchenko, O. (2020). Use of key indicators to monitor sustainable development of rural areas. Global Journal of Environmental Science and Management, 6(2), 175-190. [CrossRef]
- Shcherbak, V., Gryshchenko, I., Ganushchak-Yefimenko, L., Nifatova, O., Tkachuk, V., Kostiuk, T., Hotra, V. (2021). Using a sharing-platform to prevent a new outbreak of COVID-19 pandemic in rural areas. Global Journal of Environmental Science and Management, 7(2), 155-170. [CrossRef]
- Shcherbak, V.; Lyshenko, M.; Tereshchenko, S.; Yefanov, V.; Vzhytynska, K.; Yatsenko, V.; Pietukhov, A. (2024). Sustainable development of united territorial communities during the conflict: turning challenges into opportunities. Human capital in urban management.
- Sidorov, A. (2016). Models of social and economic development monitoring in municipalities using geoinformation platform of public administration. International Multidisciplinary Scientific GeoConference SGEM. [CrossRef]
- Simpson, K. (2004). ‘Doing development’: the gap year, volunteer-tourists and a popular practice of development. Journal of International Development, 16(5), 681–692. [CrossRef]
- Smith, M. K., & Diekmann, A. (2017). Tourism and wellbeing. Annals of Tourism Research, 66, 1–13. [CrossRef]
- Stocker, V., Smaragdakis, G., Lehr, W., & Bauer, S. (2017). The growing complexity of content delivery networks: Challenges and implications for the Internet ecosystem. Telecommunications Policy, 41(10), 1003–1016. [CrossRef]
- Vermesan, O., & Friess, P. (2013). Internet of Things: Converging Technologies for Smart Environments and Integrated Ecosystems. https://riverpublishers.com/book_details.php?book_id=176.
- Waligo, V. M., Clarke, J., & Hawkins, R. (2013). Implementing sustainable tourism: A multi-stakeholder involvement management framework. Tourism Management, 36, 342–353. [CrossRef]
- Wang, Z., Gao, L., Wang, T., & Luo, J. (2022). Monetizing Edge Service in Mobile Internet Ecosystem. IEEE Transactions on Mobile Computing, 21(5), 1751–1765. [CrossRef]
Figure 1.
Graph of K-average indicators of the efficiency of using geoinformation platforms in the regions of Ukraine 2023 (STATISTICA 10 listing of cluster analysis).
Figure 1.
Graph of K-average indicators of the efficiency of using geoinformation platforms in the regions of Ukraine 2023 (STATISTICA 10 listing of cluster analysis).
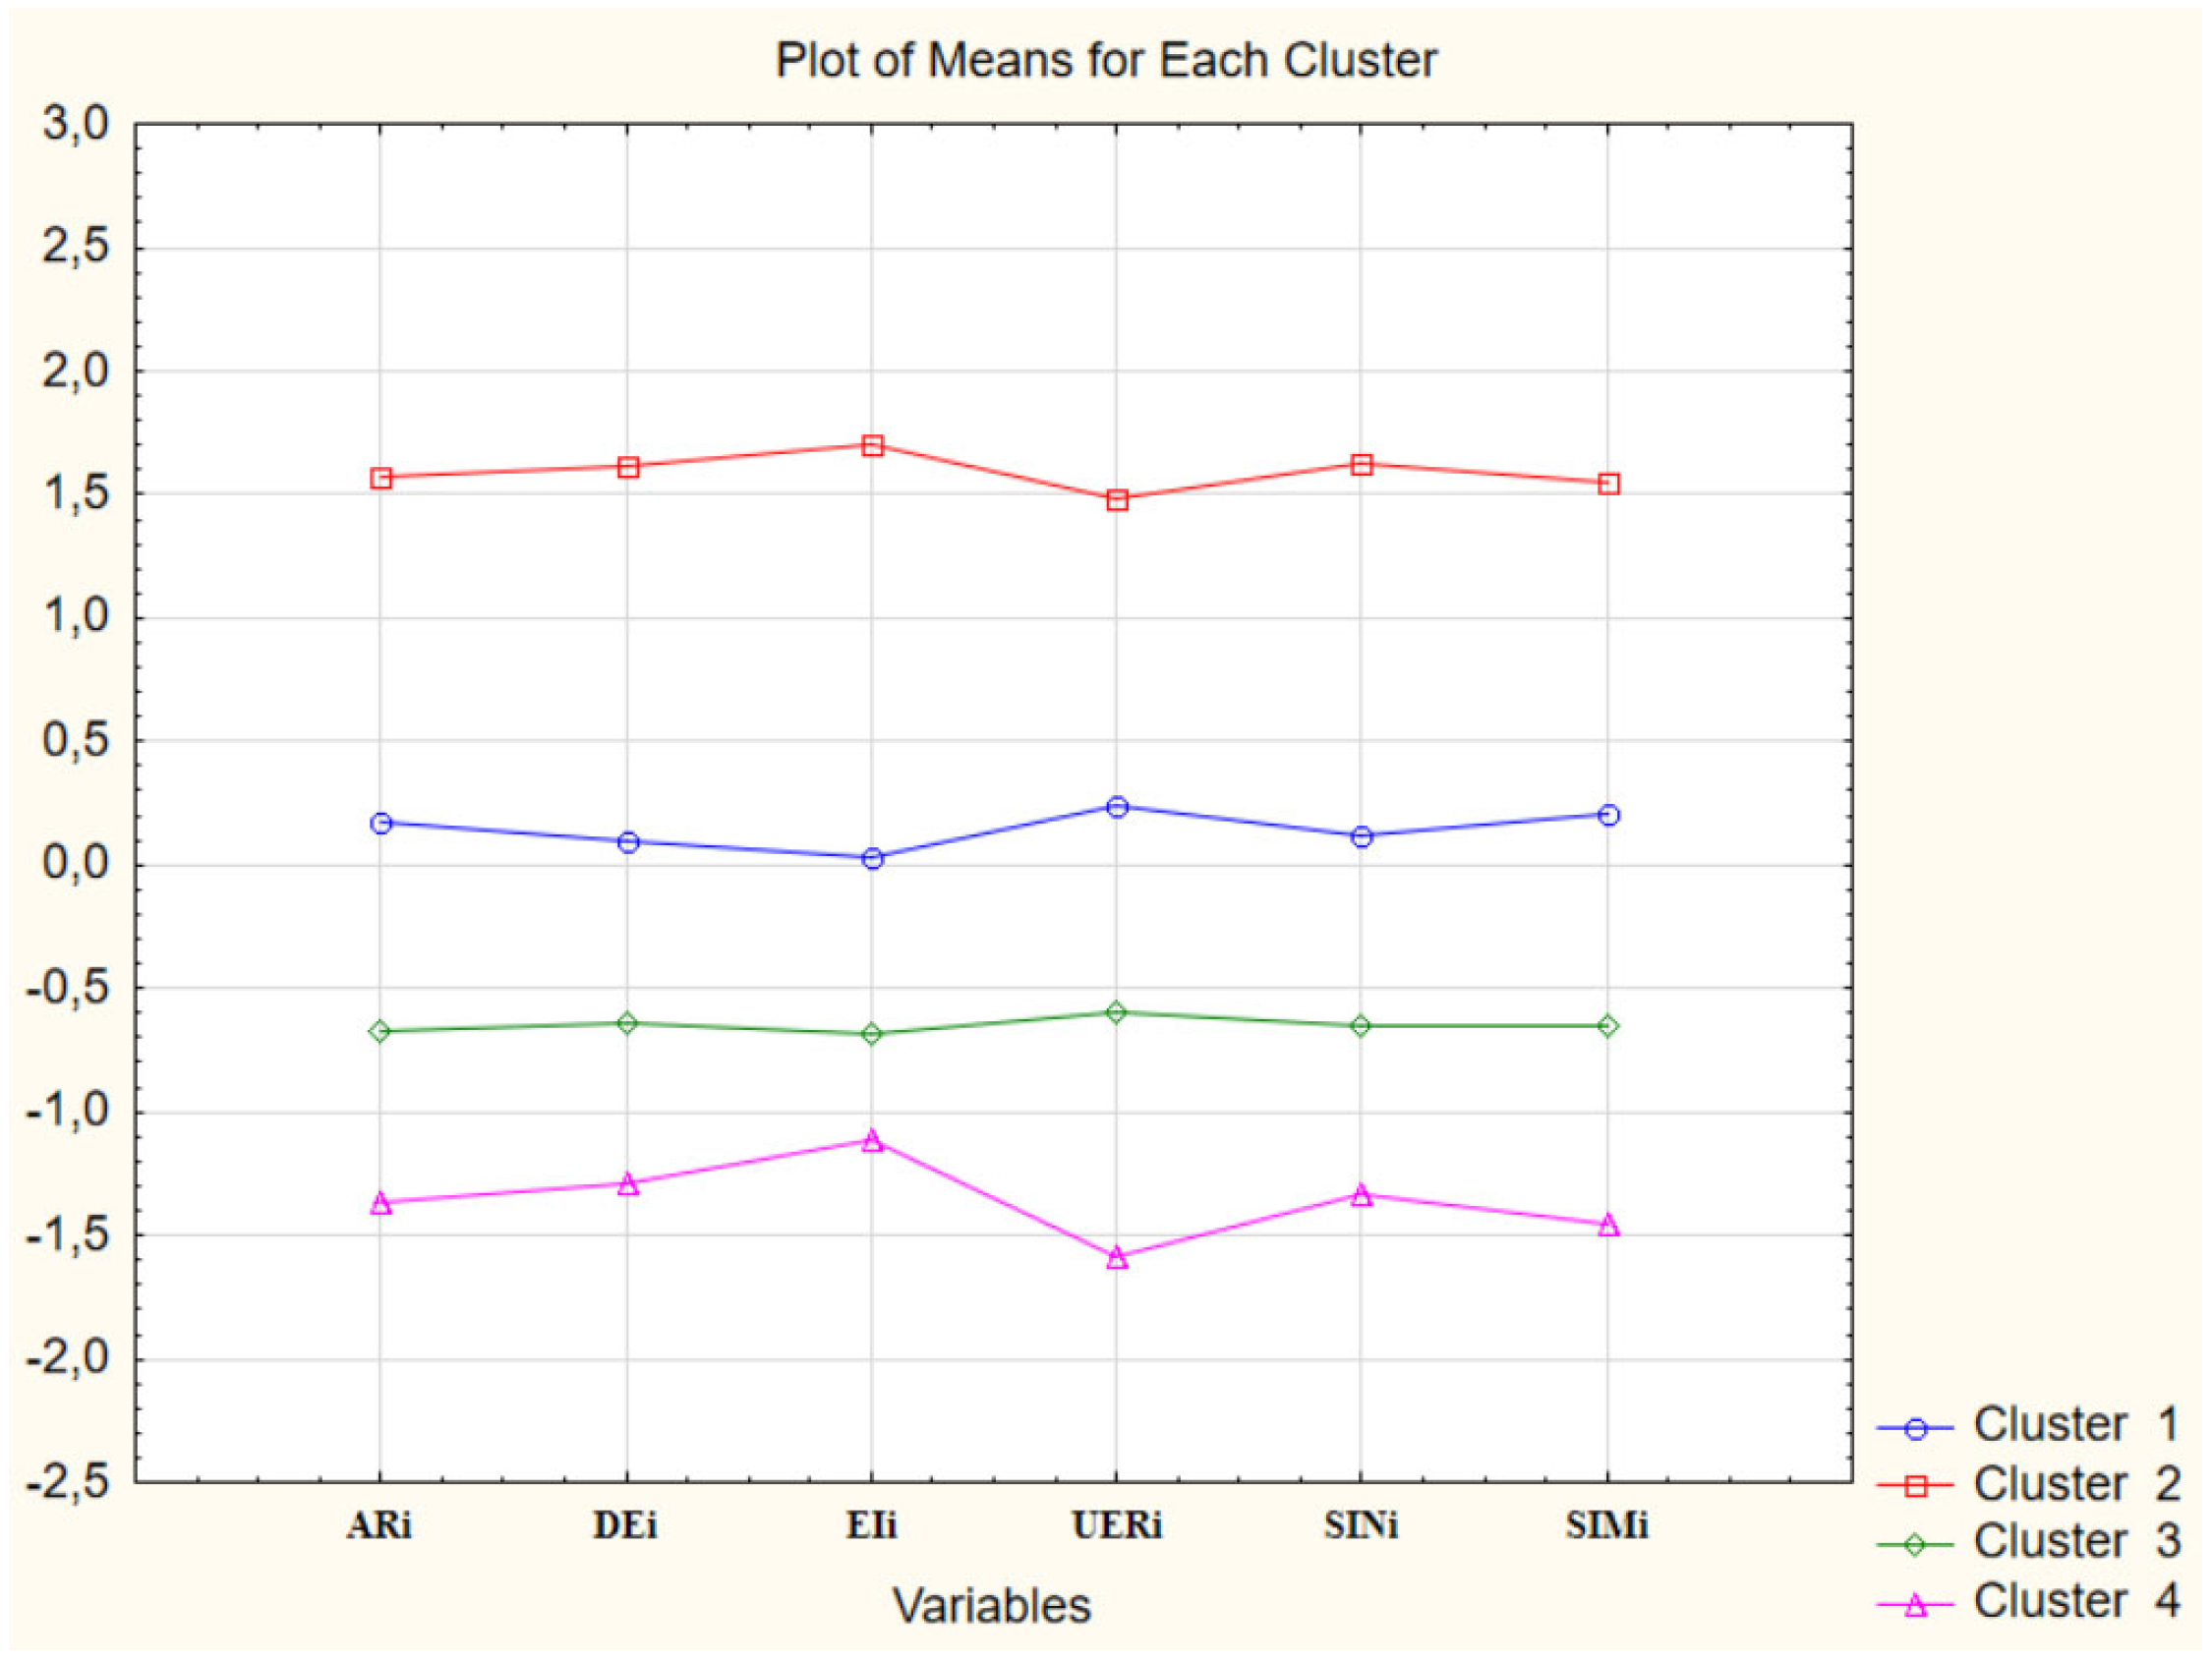
Table 1.
Multi-criteria evaluation of geoinformation platforms for interactive charity tourism in crisis situations.
Table 1.
Multi-criteria evaluation of geoinformation platforms for interactive charity tourism in crisis situations.
| Calculation steps | Calculation algorithms |
|---|---|
| Stage 1. Multi-criteria evaluation of the effectiveness of a geoinformation platform for interactive charity tourism | 1.1. Audience Reach: , where — the percentage of the reached audience of the i-th region, —number of volunteers or tourists attracted through the platform in the i-th region, —total number of potential audience (tourists interested in charity tourism in Ukraine) |
| 1.2. Calculation of the efficiency of attracting donations (Donation Efficiency): , where — average donation amount per volunteer or tourist in the i-th region, —total amount of donations collected through the platform in the i-th region | |
| 1.3. Economic Impact: , where — total economic effect in the i-th region, —number of tourists who visited the i-th region via the platform, —average daily expenditure of a tourist, —additional economic benefits (e.g., job creation, infrastructure improvement). | |
| 1.4. User Engagement Rate: , where — percentage of active users in the i-th region, —number of interactions with the platform (e.g., page views, donations, tour bookings) in the i-th region | |
| 1.5. Platform sustainability assessment (Sustainability Index): , where — sustainability index in the i-th region, —economic impact on the i-th region, —efficiency of attracting donations to the i-th region, —costs of maintaining and developing the platform in the i-th region. | |
| 1.6. Social Impact: , where — the social effect in the i-th region, —number of initiatives implemented by local communities in the i-th region, —the number of charity initiatives and volunteer projects in the i-th region, —population of the i-th region. | |
| Stage 2. Clustering of regions | 2.1. As input data for clustering, we take normalized values of indicators for each region: where — vector of indicator values for the i-th region, including audience reach, donation efficiency, economic impact, engagement rate, platform sustainability, and social impact 2.2. For each region, clusters are determined by minimizing the distances between regions and cluster centroids (cluster centers). Cluster centers for the j-th cluster are calculated as the average value of all regions included in this cluster: , where — the center of cluster j, — the number of regions in cluster j, — the set of regions in cluster j, — the vector of indicators of region i. 2.3. For each i-th region, the Euclidean distance to each cluster center : where — the distance from the i-th region to the center of cluster j, — the value of the -th indicator for the i-th region, — the value of the k-th indicator for the center of cluster j, m— the number of indicators. 2.4. Redistribution of regions into clusters. Each i-th region belongs to the cluster j for which the distance is minimal: 2.5. Repeat steps 2.1–2.4. Clusters are recalculated until the change in cluster centers becomes minimal (convergence criterion). |
| Stage 3. Testing the reliability of the hypothesis | 3.1. To determine the relationship between platform use and regional recovery, we use the Pearson correlation coefficient: where r— correlation coefficient between variables; — platform performance indicators (e.g., audience reach or economic impact); — regional recovery indicators (e.g., infrastructure improvement or job creation); , — average values of variables 3.2. To assess the impact of the platform indicators on the recovery of the region, it is necessary to conduct a regression analysis: , where y— the regional recovery indicator, — independent variables (e.g., audience reach, donation effectiveness, economic impact), a— constant, — regression coefficients reflecting the degree of influence of each variable, — the regression error. 3.3. To test the statistical significance of the results, it is necessary to use the t-test: where — the regression coefficient for the variable , — the standard error for the coefficient . If the obtained value of t exceeds the critical value for the selected significance level (for example, 0.05), the hypothesis is confirmed as statistically significant. 3.4. Define the coefficient of determination, which demonstrates what part of the variation of the dependent variable (regional recovery) is explained by independent variables (platform indicators): where — actual values of the dependent variable, — predicted values of the dependent variable, —average value of the dependent variable. A high value indicates a high degree of explainability of the model. If the correlation and regression coefficients are significant, and is large enough, the hypothesis that the geoinformation platform is an effective tool for restoring regions is confirmed. |
Source: author’s methodology.
Table 2.
Comparative characteristics of geoinformation platforms used in global crises.
| Platform | Main functions | Number of active users (estimate) | Number of donations raised (EUR million) | Regions of coverage | Degree of interaction with local communities (scale from 1 to 5) | Data source |
|---|---|---|---|---|---|---|
| CrisisMapper | Disaster maps, real-time monitoring, aid coordination | 100 000+ | 50+ | Global | 4 | https://crisismapping.ning.com/ |
| Ushahidi | Create maps based on user data, collect information about crisis situations | 500 000+ | 20+ | Global | 3 | https://www.ushahidi.com/ |
| OpenStreetMap | Create and edit maps, navigation | Millions | - | Global | 2 | https://www.openstreetmap.org/ |
| MapAction | Maps for humanitarian operations, data analysis | 10 000+ | - | Global | 4 | https://mapaction.org/ |
| Humanitarian OpenStreetMap Team (HOT) | Mapping for humanitarian purposes | 100 000+ | - | Global | 5 | https://www.hotosm.org/ |
| HelpMap | Crisis zone maps, routes for volunteers, donations | 150,000 | 3 | Eastern Europe, Middle East | 4 | https://helpmap.io/ |
| CrisisAid | Navigation through safe zones, collection points for humanitarian aid | 250,000 | 5,5 | Africa, South America | 5 | https://www.crisisaid.org.uk/ |
| ReliefTracker | Online maps of regions in need, communication with local NGOs, fundraising | 100,000 | 2,2 | Central Asia, Eastern Europe | 3 | https://reliefweb.int/ |
| DisasterResponse | Natural disaster maps, evacuation points, donations for recovery | 300,000 | 6 | Asia, Latin America | 4 | https://www.undrr.org/terminology/response |
| VolunteerConnect | Navigation for volunteers, coordination of humanitarian missions, fundraising | 180,000 | 3,8 | Africa, Eastern Europe | 4 | https://www.volunteerconnector.org/ |
| CharityMap | Crisis region maps, integration with crowdfunding platforms | 120,000 | 2,5 | Middle East, North Africa | 3 | https://www.charitiesmapped.com/charitymap |
Table 3.
Key performance indicators of platforms by region (the example of Ukraine).
| Region | Number of tourists attracted | Donations collected (million euros) | Economic effect (EUR million) | Social impact (scale from 1 to 5) |
|---|---|---|---|---|
| Kiev | 25,000 | 3.5 | 15.0 | 4.5 |
| Lviv region | 20,000 | 2.8 | 12.0 | 4.3 |
| Ivano-Frankivsk region | 15,000 | 2.0 | 9.0 | 4.0 |
| Odessa region | 18,000 | 2.5 | 10.5 | 4.2 |
| Kharkiv region | 12,000 | 1.8 | 8.0 | 3.8 |
| Poltava region | 10,000 | 1.2 | 6.0 | 3.7 |
| Kiev region | 22,000 | 3.0 | 13.0 | 4.4 |
| Ternopil region | 8,000 | 1.0 | 5.5 | 3.6 |
| Zaporizhzhya region | 9,000 | 1.5 | 7.0 | 3.9 |
| Donetsk region | 5,000 | 0.8 | 3.5 | 3.5 |
| Lugansk region | 4,000 | 0.6 | 3.0 | 3.3 |
Source: Compiled by the authors based on analysis of online resources: Platform Research, Charity Data.
Table 4.
Performance indicators of the use of geoinformation platforms of the first cluster.
|
Members of Cluster Number 1 (Data_nor) and Distances from Respective Cluster Center Cluster contains 8 cases | |||
| Case No. | Distance | Case No. | Distance |
| C_4 | 0,2789176 | C_16 | 0,3140341 |
| C_5 | 0,1888165 | C_20 | 0,04227527 |
| C_7 | 0,1800618 | C_21 | 0,08768009 |
| C_11 | 0,5943127 | C_23 | 0,3099183 |
where C_4—Chernivtsi region, C_5—Ivano-Frankivsk region, C_7—Rivne region, C_11—Kharkiv region, C_20—Chernihiv region, C_16—Mykolaiv region, C_21—Zakarpattia region, C_23—Sumy region.
Table 5.
Performance indicators of geoinformation platforms utilization in the second cluster.
|
Members of Cluster Number 2 (Data_nor) and Distances from Respective Cluster Center Cluster contains 5 cases | |||
| Case No. | Distance | Case No. | Distance |
| C_1 | 0,07233553 | C_12 | 0,6118291 |
| C_3 | 0,6067839 | C_18 | 0,199436 |
| C_9 | 0,1978603 | ||
where C_1—Kyiv City, C_3—Lviv region, C_9—Kyiv region, C_12—Dnipropetrovsk region, C_18—Odesa region.
Table 6.
Performance indicators of the use of geoinformation platforms of the third cluster.
|
Members of Cluster Number 3 (Data_nor) and Distances from Respective Cluster Center Cluster contains 8 cases | |||
| Case No. | Distance | Case No. | Distance |
| C_2 | 0,04893883 | C_15 | 0,3277896 |
| C_6 | 0,2760061 | C_17 | 0,3033305 |
| C_8 | 0,2495103 | C_19 | 0,1009329 |
| C_10 | 0,1136745 | C_22 | 0,06232256 |
where C_2—Ternopil region, C_6—Khmelnytsky region, C_8—Poltava region, C_10—Volyn region, C_15—Kirovohrad region, C_17—Cherkasy region, C_19—Zhytomyr region, C_22—Kherson region.
Table 7.
Performance indicators of the use of geoinformation platforms of the fourth cluster.
|
Members of Cluster Number 4 (Data_nor) and Distances from Respective Cluster Center Cluster contains 3 cases | |||
| Case No. | Distance | Case No. | Distance |
| C_14 | 0,277171 | C_25 | 0,05091601 |
| C_24 | 0,2520007 | ||
where C_14—Zaporizhzhia region, C_24—Donetsk region, C_25—Luhansk region.
Table 8.
Results of regression analysis of the relationship between variables and the dependent variable.
Table 8.
Results of regression analysis of the relationship between variables and the dependent variable.
| Variable | Correlation coefficient | Regression coefficient | t-statistic | t-statistic |
| ARi | 0.75 | 0.5 | 3.21 | 0.01 |
| DEi | 0.8 | 0.6 | 3.89 | 0.001 |
| EIi | 0.9 | 0.7 | 4.56 | <0.001 |
| UERi | 0.85 | 0.65 | 4.21 | <0.001 |
| SINi | 0.78 | 0.55 | 3.57 | 0.002 |
| SIMi | 0.92 | 0.72 | 4.89 | <0.001 |
| R- square | 0.91 |
Source: STATISTICA 10 listing.
Disclaimer/Publisher’s Note: The statements, opinions and data contained in all publications are solely those of the individual author(s) and contributor(s) and not of MDPI and/or the editor(s). MDPI and/or the editor(s) disclaim responsibility for any injury to people or property resulting from any ideas, methods, instructions or products referred to in the content. |
© 2024 by the authors. Licensee MDPI, Basel, Switzerland. This article is an open access article distributed under the terms and conditions of the Creative Commons Attribution (CC BY) license (http://creativecommons.org/licenses/by/4.0/).
Copyright: This open access article is published under a Creative Commons CC BY 4.0 license, which permit the free download, distribution, and reuse, provided that the author and preprint are cited in any reuse.


