
Submitted:
22 April 2025
Posted:
24 April 2025
You are already at the latest version
Abstract
The research analyzes perceptions of economically sustainable tourism development in three selected comparable countries (Serbia, Kazakhstan, and Hungary), focusing on benefits, costs, social support, cultural identification, and reciprocal benefits. The aim is to evaluate public support for tourism by examining perceived benefits and costs and the moderating effects of travel frequency and interactions with tourists. Forecasting analyses for 2025–2030 indicate potential growth in tourist arrivals, with Hungary showing the highest projections. Combining MGA and SEM analysis revealed that positive perceptions of benefits and cultural identification enhance tourism support while perceived costs reduce it. Key predictors influencing tourism support were identified using the Random Forest algorithm, and the XGBoost model improved prediction accuracy. K-means clustering and PCA highlighted relationships among the constructs. The findings underscore the importance of positive benefit perceptions and cultural identification in promoting tourism support, while negative cost perceptions diminish it. Understanding the roles of travel frequency and tourist interactions can inform sustainable tourism strategies that consider various benefits and costs.
Keywords:
economic benefits
; tourism development
; perceived benefits
; cultural identification
; predictions
1. Introduction
The tourism progress has become a significant instrument of commercial growth and social integration in many countries, often highlighted as a driver of local development through infrastructure improvement, job creation, and revenue generation [1,2]. However, the sustainability of this sector is influenced by several factors, involving the perception of benefits and costs, social support, cultural identification, reciprocal benefits, and their mutual interaction [3]. Previous studies have emphasized economic benefits as a key prerequisite for tourism support but have rarely incorporated a comprehensive integration of cultural, social, and economic aspects into a unified analytical framework [4]. The focus on individual factors often overlooks their potential synergistic effects, which can result in an incomplete understanding of the complex tourists/local communities’ interactions. Additionally, the role of moderating variables such as travel frequency and contact with tourists remains under-researched, even though these variables might hardly impact the creation of locals’ perceptions and attitudes [5]. Furthermore, studies that conduct comparative analyses across different geographical and cultural contexts, especially among nations with different scales of economic levels and cultural characteristics, are scarce and fragmented. The research has the aim to attempt resolving the issues through an integrative approach that encompasses economic, cultural, and social aspects, utilizing advanced prediction and evaluation methods. Connecting Serbia, Kazakhstan, and Hungary in the analysis provides an opportunity to identify universal patterns and specific differences in communities’ opinions toward tourism. Serbia and Kazakhstan, as transitional economies, face challenges related to the modernization of tourism infrastructure and adaptation to global standards [6,7,8], while the EU member state, Hungary, strives to enhance its position through innovative approaches in cultural and rural tourism [9].
This research seeks to uncover the essential elements that inspire sustenance for sustainable tourism development across three countries by integrating perceptions of benefits, costs, social support, cultural identification, and reciprocal benefits. Additionally, the goal of the investigation is to observe the position of travel frequency and contact with tourists in shaping residents’ attitudes. The innovative aspect of this research lies in applying an integrative model that links economic, cultural, and social aspects with advanced prediction and evaluation methods.
This research has global relevance as it provides insights into how different economic and cultural contexts, such as the transitional economies of Serbia and Kazakhstan and Hungary’s EU membership, shape local support for tourism. Understanding these differences and similarities is essential for developing adaptable strategies that can contribute to sustainable tourism in a broader international context. Connecting these countries enables the identification of universal patterns that may be applicable to other countries facing challenges related to modernization and globalization in tourism.
2. Foundation of Theory and Creation of Hypotheses
The study of insights of tourism advantages and expenses represents a significant part of the literature analyzing community members’ reflections on tourism growth [10]. Perceptions toward benefits and costs do not manifest in isolation; rather, they are interconnected and largely shape attitudes toward support for tourism development [11]. Several authors agree that positive perceptions of benefits often dominate the formation of attitudes toward tourism, with economic benefits most frequently highlighted as a key factor of support. For example, Muresan et al. [12] emphasize that residents in mountainous areas perceive tourism as a means of conserving cultural legacy and encouraging community progress, particularly through the creation of new jobs. However, this approach neglects potential conflicts that may arise between tourists and residents, which can diminish actual support for tourism development. The lack of conflict analysis is a methodological flaw that is often evident in other studies. Boley, Strzelecka, and Woosnam [13] further confirm the significance of economic benefits as a fundamental factor of tourism support. They propose standardized measurement of benefits to ensure consistency in analysis, but this conceptual framework overlooks other aspects, such as cultural and social benefits, which may be equally relevant. A similar bias can be observed in the research by Joo, Cho, and Woosnam [14], who focus on tourists’ perceptions and positive economic effects while disregarding the complexity of cultural and ecological impacts. Such a reductionist approach may lead to one-sided conclusions that do not provide a comprehensive understanding of tourism’s impact.
These limitations are partially addressed by Kodaş et al. [15] and Kanwal et al. [16] who underlined the relevance of infrastructure in shaping positive attitudes, but their research neglects the role of social and cultural resources. Such a focus on physical infrastructure may be adequate in developed tourist destinations but often proves insufficient in rural and less developed areas. There is a noticeable tendency to more frequently examine and emphasize positive perceptions of benefits compared to the negative aspects of tourism. Although Woosnam’s et al. [17] application of this theory is innovative, it primarily focuses on positive aspects, neglecting the impact of negative perceptions such as pollution, overcrowding, or economic inequality. A similar tendency can be observed in Gursoy et al.’s [18] meta-analysis, where aggregated data emphasize positive aspects of economic benefits, while cultural and social aspects are neglected. Conversely, some studies highlight the need for a more comprehensive consideration of tourism’s negative aspects. Khandeparkar et al. [19] explore perceptions of price fairness, emphasizing that high prices can negatively influence local residents’ attitudes. While their work primarily focuses on pricing aspects, it insufficiently addresses social and environmental costs. Wei et al. [20] examine different types of tourist attractions and how they affect price perceptions but do not provide sufficient evidence of the long-term impact of these costs on tourism support. Furthermore, Çelik and Rasoolimanesh [21] indicate that negative perceptions of costs can severely undermine tourism support, particularly during the pre-development stages. Lan et al. [22] additionally emphasize the importance of collaboration between residents and tourists but overlook potential conflicts that may arise from inadequate tourism practices. Recent studies, such as those by Carballo-Cruz and Silva [23], stress the importance of the local socio-economic context in shaping perceptions. However, their focus on positive aspects often disregards potential negative implications, which can create bias in the analysis. Rodríguez Bolívar et al. [24] also highlight the importance of new technologies in shaping perceptions of benefits, but their research is limited to a specific technological context. Zhou et al. [25] add another layer of complexity to the analysis of benefit perceptions by examining how ecocentrism and collectivism influence tourists’ willingness to pay more for services in national parks. Their research demonstrates that cultural and social factors can significantly impact perceptions of benefits, but the lack of cost analysis represents a methodological shortcoming. In line with previous research and the identified issues in theory, the subsequent hypotheses are developed to address benefit and cost perceptions in the tourism progress.
H1: Positive perceptions of tourism benefits foster enhanced support.
H2: Negative perceptions of associated costs erode that support.
In addition to economic and cultural benefits, social support represents a significant aspect in shaping perceptions of tourism benefits and costs. According to Liu, Tan, and Mai [26], social support social support, when properly implemented, can enhance overall well-being and support for tourism, even under challenging circumstances. However, their research focuses exclusively on tourism employees, leaving open the question of the impact of social support on the broader community or visitors. Similar findings are presented by Ramkissoon [27], who develops a conceptual model where social support significantly contributes to the quality of life of residents in tourist destinations. However, this model remains theoretical, lacking direct empirical validation that would confirm these assumptions in specific destinations or tourism contexts. Magno and Dossena [28] offer a different perspective by analyzing the impact of major events, such as the 2015 World Expo in Milan, on citizens’ quality of life. Their study proofed the fact that events attracting international tourists can contribute to a sense of pride and satisfaction among residents, which can be seen as a form of social support. However, this positive effect is often temporary and largely dependent on the long-term economic benefits such events may generate. On the other hand, Majeed et al. [29] highlight the role of information available through the internet as a form of social support that can shape tourists’ behavior. Authors uses structural equation modeling to demonstrate that online information can significantly influence tourists’ attitudes and behaviors, indirectly improving social support. While this approach provides valuable insights into digital support, it overlooks the social aspects related to direct interactions between tourists and residents. Zhuang and Wang [30] expand this analysis by examining how social support can enhance relationships, communication, and understanding among travelers. Their findings suggest that social support not only improves the travel experience but can also indirectly increase support for tourism development by enhancing communication and interaction among participants. Additionally, Munanura et al. [31] explore the role of emotional solidarity in shaping encouragement for tourism. However, focusing on emotional solidarity may overlook other aspects of social support, such as economic security or ecological sustainability, which are important elements in a comprehensive analysis. Interestingly, Du and Cheng [32] analyze the phenomenon of traveling with older family members from the perspective of social support. This aspect of social support can be significant in the context of destinations that promote family tourism or develop specialized services for senior tourists. Rafi et al. [33] investigate the role of social support in communities relying on digital platforms such as Couchsurfing. Although this research provides interesting insights into digital forms of social support, it lacks analysis of how these concepts apply to broader tourism communities or the relationships between residents and tourists. While some authors emphasize the role of emotional solidarity and digital support, others focus on interactions between residents and tourists. However, most studies fail to consider the complexity of social support in its entirety, often concentrating on specific aspects without sufficiently integrative approaches.
H3: Social support impacts community care for tourism initiatives.
Studies often rely on theoretical frameworks such as Social Exchange Theory (SET) to analyze the dynamics between tourism benefits and costs. Dutt, Harvey, and Shaw [34] utilize SET to investigate tourism in Dubai, emphasizing that positive economic benefits are a key factor in shaping local residents’ support for tourism. Their research confirms that increased revenue, job creation, and improved infrastructure are the main elements that positively influence community attitudes. However, the authors also emphasized the necessity for a stable which includes negative aspects such as pressure on infrastructure and potential cultural erosion. Solarin, Ulucak, and Erdogan [35] further confirm that diversifying tourism markets and activities can significantly enhance the economic benefits of tourism. Their analysis, using a dynamic regression approach, indicates that expanding tourism services can contribute to greater economic stability, especially in destinations that are overly reliant on a single type of tourism. In addition, Roudi, Arasli, and Akadiri [36], analyzed Small Island Developing States (SIDS) and demonstrated that tourism can significantly contribute to economic growth through GDP increase and job creation. However, this research focuses solely on economic aspects, without incorporating social and ecological implications. In contrast to these positive findings, Alamineh et al. [37] warn of the negative cultural consequences of tourism in the Amhara Regional State of Ethiopia, emphasizing that intensive tourism development can result in the degradation of cultural values and local customs. This aspect is often neglected in studies that focus exclusively on economic benefits. Although the authors acknowledge the economic contributions of tourism, they conclude that inadequate management of cultural resources can negatively affect tourism sustainability. Jehan et al. [38] analyze the socio-economic and ecological impacts of tourism in Pakistan’s selected location. Their research shows that although tourism contributes to economic development through job creation and infrastructure improvement, ecological and cultural consequences are often overlooked. This bias towards economic benefits can seriously jeopardize tourism sustainability in the long term. According to Paja et al. [39], lower tourism intensity can enhance the quality of life for local communities, but at the same time, economic benefits brought by mass tourism may be missed. This dilemma indicates the need for careful balancing between economic benefits and community wellbeing. Reivan-Ortiz et al. [40] further highlight the complexity of tourism’s economic impacts through the analysis of geopolitical risks, currency fluctuations, and economic policies in BRICS countries. Their research emphasizes that tourism’s economic impacts are not static but are subject to continuous changes within the global context. Such dynamics require flexible policies that will enable the tourism sector to adapt to market changes. Sengoz et al. [41] apply SET to analyze the tour guide’s position in promoting sustainable tourism. Their findings indicate that tour guides can significantly contribute to enhancing economic benefits through improving tourist experiences and raising awareness of sustainable tourism. However, the absence of a more detailed analysis of social and cultural aspects may represent a limitation of this research. Back, Tasci, and Woosnam’s [42] study emphasizes that financial interests, such as increased revenue and job creation, play a crucial role in shaping positive attitudes toward tourism. However, they note that negative perceptions may arise due to unequal distribution of benefits or perceptions of injustice.
H4: Reciprocal benefits positively influence support for tourism.
Cultural identification represents a crucial aspect in analyzing tourism benefits and costs, especially when considering the influence of the travel industry on the cultural heritage development. Sinha et al. [43] emphasize that sustainable approach practices might have a significant impact in preserving historical sites, particularly in destinations facing challenges related to the conservation and promotion of cultural resources. Their research highlights that preserving cultural identity can be achieved through responsible practices that involve local communities and promote their specific values. However, their findings also indicate a lack of concrete strategies for balancing economic benefits and cultural preservation. Similarly, Katyukha et al. [44] focus on contemporary strategies that use cultural heritage as a driver of sustainable tourism growth. The authors pointed to the challenge of promoting authenticity in a commercial environment, where there is a risk of degradation or commodification of cultural values. The issue of authenticity is further discussed in the works of Oorgaz-Agüere et al. [45] and Qui et al. [46]. Their research demonstrates that preserving authentic cultural elements is associated with strengthening local identity and positive actions toward tourism. However, the lack of integration of social and economic aspects in this analysis may represent a methodological limitation [47,48,49,50]. Nonetheless, Mteti et al. [51] emphasize the relevance of communities’ understanding cultural heritage as a factor influencing support for tourism. Their study in the Katavi region of Tanzania indicates that a high awareness of cultural resources is associated with positive attitudes toward tourism. Such an approach can contribute to creating more sustainable tourism practices that respect local values and identities. Butler, Szili, and Huang [52] explore cultural tourism in the Panyu District of Guangzhou, emphasizing the importance of local pride and cultural heritage preservation. Their outcomes suggest that tourism can contribute to positive identity processes, especially when local communities perceive tourism as a means of protecting local traditional heritage. However, they caution that economic interests often tend to dominate over cultural aspects, leading to commodification and loss of authenticity. Wasela [53] shed more light on intangible heritage, such as rituals, festivals, and language, has significant potential to attract tourists, but only if adequately integrated into the tourism offer. While this approach can contribute to preserving cultural values, its commercialization can endanger authenticity and cultural identity. Qiu et al. [54] provide a comprehensive literature review on intangible cultural heritage in tourism, noting that previous studies mostly stressed the importance on the economic valorization of cultural resources, while issues of identity and authenticity are often marginalized. Their analysis suggests that future research should encompass broader cultural and social aspects in identity preservation understanding. Worku Tadesse [55] examines cultural resources as drivers of cultural tourism in Ethiopia, highlighting that proper management of cultural heritage might donate to protection of local identities. However, the lack of adequate institutional frameworks often complicates the conservation process, indicating the need for better integration of cultural policy and tourism development.
H5: Cultural identification positively influences tourism initiatives.
According to the previous literature review and identified theoretical gaps, hypotheses have been formulated to examine the role of travel frequency and contact with tourists as key moderating factors in shaping support for tourism development. Travel frequency and contact with tourists have been identified as significant elements that can influence perceptions of tourism benefits and costs, which is particularly emphasized in hierarchical analyses that highlight their role in shaping residents’ attitudes [56,57,58,59,60]. The frequency of contact with tourists or exposure to tourism activities can directly affect total support for tourism development. Such exposure may result in positive or negative attitudes depending on experiences and interactions with tourists, which aligns with findings indicating changes in perceptions depending on travel frequency [61,62,63].
H6 (a, b, c, d, e): Travel frequency positively moderates the relationship between Benefits perception, Costs perception, Social support, Reciprocal benefits, Cultural identification, and Support for tourism development.
H7 (a, b, c, d, e): Contact with tourists positively moderates the relationship between Benefits perception, Costs perception, Social support, Reciprocal benefits, Cultural identification, and Tourism initiatives.
Development of Theoretical Model
Homans [64] and Blau [65] defined the SET and emphasized that social interactions operate on the principle of exchanging benefits and costs. According to this theory, individuals and communities decide whether to support or oppose tourism development based on their assessment of perceived benefits and costs [64]. If benefits are perceived as greater than costs, support for tourism increases, whereas negative impacts reduce support. Ap [66] was among the first researchers to apply SET to tourism, analyzing the locals’ attitudes in two tourist destinations in Australia and demonstrated that positive perceptions are primarily related with financial interest. In contract, negative attitudes with economic benefits, such as increased income, job creation, and improved infrastructure. In contrast, negative attitudes are the result of perceived social and environmental costs. Through subsequent research, SET has found wide application in analyzing various aspects of tourism. For example, Allaberganov and Catterall [67] used it to examine community responses to cultural tourism in Uzbekistan, demonstrating that support for tourism increases when communities feel that benefits, such as cultural identity preservation and economic gains, outweigh costs. Similarly, Han et al. [68] applied this theory in researching sustainable tourism in natural destinations, showing that positive perceptions of ecological benefits are a significant factor for community support. Kumar et al. [56] investigated the SET in the context of rural tourism progress. They found that economic benefits and social support are key factors influencing support for tourism development, but negative perceptions of costs often overshadow positive effects. Solakis et al. [57] investigated the role of artificial intelligence in value co-creation in tourism through the application of SET. Their research shows that technology can enhance perceptions of benefits through the promotion and preservation of cultural heritage but also emphasizes that perceived benefits can be undermined by the commodification of cultural resources. This approach is particularly relevant to the present analysis, which includes aspects of cultural identification. Additionally, Meira and Hancer [69] applied SET to analyze the link between hospitality employees and organizations, and Hassan et al. [70] used SET to analyze ecotourism in Saudi Arabia, emphasizing the role of economic benefits in renewing investment strategies. On the other hand, Pai et al. [71] focused on destinations in the stagnation phase of the tourism life cycle, indicating that negative perceptions of costs can significantly reduce support for tourism. However, researchers often neglect the interactions between different aspects of benefits and costs, which may result in one-sided conclusions.
While previous authors have successfully used SET to analyze residents’ opinions about tourism, majority of these research have remained primarily emphasized economic benefits [56,64,65,66,67,68]. Such an approach overlooks the importance of cultural identification, social support, and negative perceptions of costs, which are key factors for understanding locals’ perception. Together with this, contemporary research has shown that contact with tourists and travel frequency can significantly influence perceptions of benefits and costs, further complicating the analysis of community attitudes [57,69].
This research is justified because it offers a comprehensive approach that considers various dimensions of benefits and costs, as well as moderating factors such as travel frequency and contact with tourists. This holistic perspective sheds more light on a more profound comprehension of the relationship between economic, cultural, social, and environmental aspects, which previous studies have not adequately addressed [69]. By integrating these elements into a unified model, this research contributes to the advancement of SET in the context of tourism and lays the groundwork for developing sustainable tourism strategies. Based on the previously discussed SET and the identified theoretical gaps, an integrative model has been developed that incorporates economic, cultural, social, and environmental factors to analyze support for sustainable tourism development (Figure 1).
3. Materials and Methods
The selection of Serbia, Kazakhstan, and Hungary for analyzing tourism arrivals and tourism development is based on several key criteria. These countries represent diverse geographical, cultural, and economic contexts, enabling a detailed comparative analysis. Serbia, as a Western Balkan country on its path toward European Union membership, is characterized by specific transitional processes and efforts to enhance its tourism offer through cultural and rural tourism. Hungary, as an EU member state with a well-developed tourism infrastructure, presents important perspectives on tourism progress in Central Europe, with a special emphasis on selective types of tourism based on spa, MICE and cultural offer. Kazakhstan, as a Central Asian country with unique natural resources and cultural heritage, serves as an example of a destination undergoing intensive tourism development, particularly in the segments of nature-based, adventure, and cultural tourism. Additionally, Kazakhstan is actively working to strengthen its international recognition and increase tourism traffic, making it relevant for analysis. These countries also offer the opportunity to compare tourism policies and strategies between European Union member states and non-member countries. The analysis can highlight similarities and differences in tourism policies, destination promotion, tourism investments, and rural development, as well as the various challenges they face. The selection of these countries allows for a comparison between different economic systems, with Serbia and Hungary representing European countries with developed or transitional economies, while Kazakhstan represents a growing economy in Central Asia. Such an analysis can help identify specific factors influencing tourism development across different economic contexts.
3.1. Procedure and Participants
The study focuses on three selected countries encompassing a total of 1,387 respondents. Data collection was carried out from December 2024 to March 2025 using Computer Assisted Personal Interviewing (CAPI) [72]. This technique enabled standardized data collection through structured questionnaires administered by interviewers in direct contact with respondents. The application of the CAPI method allowed for immediate clarification of questions and additional explanations in case of ambiguities, thereby improving the accuracy and reliability of the responses. The study was conducted with professional support from academic experts and students from hospitality and tourism programs, who participated in the data collection process as trained interviewers. This collaboration with students also enabled more efficient questionnaire distribution across different geographic regions, providing a broader insight into respondents’ perceptions across all three investigated contexts. The questionnaire included questions tailored to assess respondents’ subjective perceptions of the impact of tourism on various constructs – from financial, community and heritage aspects. The research relies on respondents’ perceptions rather than objective measurement or proof of the actual impact of tourism. The collected data reflect the opinions, attitudes, and experiences of the local population, meaning that the results represent their subjective assessments rather than empirically verified effects. This research offers valuable insights into respondents’ perceptions of the positive and negative aspects of tourism but does not provide a direct measurement of actual effects or their quantitative consequences.
In Serbia, the study included 472 respondents from various cities and rural areas known for tourism activities. The highest percentage of respondents was from Belgrade (44.9%), followed by Novi Sad (26.8%) and Niš (17.2%), while the remaining responses were collected from smaller towns and rural areas in western and southern Serbia (11.1%). This distribution was designed to capture the perceptions of both urban and rural populations, ensuring a comprehensive understanding of the national context. In Kazakhstan, a total of 465 respondents were surveyed, primarily from urban centers such as Almaty (43.2%), Astana (29.5%), and Shymkent (14.9%), while the remaining participants (12.4%) came from smaller cities and rural communities. Given Kazakhstan’s geographical vastness and economic diversity, special attention was paid to including both urban and rural regions where tourism has the potential to significantly enhance local progress. Along with this, the study also involved 450 respondents in Hungary, mainly from Budapest (50.5%), Debrecen (24.1%), and Szeged (16.9%), with the remainder (8.5%) coming from various rural locations. The developed tourism infrastructure and recognition of urban tourism in Hungary required greater attention to urban areas, although rural areas were also included to capture the perspectives of communities benefiting from eco-tourism and cultural tourism.
To ensure the representativeness of the sample, a power analysis was conducted using G*Power software [73]. An a priori analysis was performed to establish the needed sample size using a linear multiple regression model with fixed effects (R² deviation from zero) to assess predictors. The analysis parameters included a medium effect size (f² = 0.15), significance level (α = 0.05), and desired statistical power (1-β = 0.95) [73], with seven predictors included.
Based on the G*Power analysis outcomes, the recommended minimum sample size to achieve the desired statistical power is 185 respondents per country, or a total of 555 for all three countries. Considering that the study involved a total of 1,387 respondents (significantly more than the required minimum), it can be concluded that the sample meets the criteria for representativeness. Most respondents are female, with higher education being the dominant category across all three countries. While most respondents are employed, unemployed individuals and students make up significant percentages in Serbia and Kazakhstan, while Hungary shows a smaller share of unemployed participants. Differences in income levels are also present, with Hungary having the highest percentage of respondents with high incomes, while Serbia records the most low-income respondents. Urbanization is most pronounced in Hungary, while Serbia has the highest proportion of respondents from rural areas. Travel frequency varies, with Hungary having the highest percentage of respondents who travel more than five times a year. Contact with tourists is also significantly higher in Hungary than in Serbia and Kazakhstan (Table 1), which may indicate greater tourist traffic or more developed tourism activities in that country.
Special attention was given to ethical principles and data integrity during the research process to ensure respondents’ trust. Respondents were informed about the anonymity of their responses, emphasizing that their data would not be linked to their identity. The questionnaires were designed in such a way that no personal data was collected, ensuring complete privacy for the participants. To reduce the influence of socially desirable responses, respondents were encouraged to freely express their opinions without fear of negative consequences. It was emphasized that all responses are valuable for understanding their opinions on the relation community—tourism. The study applies the highest ethical standards, respecting relevant legal regulations and privacy protection guidelines.
3.2. Methodological Instrument
The survey utilized in this research draws on SET, as proposed by Homans [64] and Blau [65], which aims to evaluate the perceived advantages and disadvantages of tourism, along with the degree of support from the community. Applied constructs included benefits perception, costs perception, social support, reciprocal benefits, cultural identification, and support for tourism. The questions were developed through a literature review and adaptation of existing scales. The constructs and questions based on the theoretical framework (Table 2).
A pilot study was primarily initiated, aiming to test the research instrument and assess its validity parameters. Respondents were from various sociodemographic groups to evaluate the adequacy of the questionnaire in relation to variations in age, education, and employment. There were 50 involved participants, 20 of whom were from Serbia, 15 from Kazakhstan, and 15 from Hungary. All participants were over 18 years old, and the sample covered diverse demographic groups, including employed individuals, unemployed individuals, and students. Following the pilot study, consultations with tourism, economics, sociology, and cultural studies experts were essential for further refining the questionnaire. Experts provided feedback on question formulation, relevance of thematic areas, and alignment with theoretical frameworks. Based on their recommendations, the questionnaire was modified to enhance the precision and clarity of the items. This process ensured greater validity and relevance of the data to be collected during the main study. A five-point Likert scale (1 – strongly disagree, 5 – strongly agree) was used to assess respondents’ perceptions regarding various constructs.
3.3. Data Processing and Analysis
The collected quantitative data were used to predict tourism growth in Serbia, Kazakhstan, and Hungary for the period up to 2030. The application of the Linear Regression Model (LRM) enabled the identification of linear trends in time series for each of the analyzed countries [86]. Data were analyzed using SPSS software version 26.0 for descriptive statistics and regression analyses. The validity of the model was confirmed by high coefficients of determination (R²) for Serbia (0.93), Kazakhstan (0.91), and Hungary (0.94), as well as low RMSE values for all countries (Serbia: 0.05, Kazakhstan: 0.06, Hungary: 0.04). The p-values for all model parameters were statistically significant (p < 0.05), further confirming the model’s adequacy [87]. The optimality of the model was additionally confirmed through AIC and BIC criterion estimates, while the Shapiro-Wilk, Breusch-Pagan, and Durbin-Watson tests indicated the absence of autocorrelation and heteroscedasticity, confirming the validity and reliability of the applied models [88]. The analysis of normality of data distribution was conducted using several statistical measures, including Skewness, Kurtosis, and the Kolmogorov-Smirnov test [89]. The results for all three countries indicate acceptable normality of distribution, allowing further application of predictive and factor analyses. Skewness values for Serbia ranged from -0.323 to 0.487, for Kazakhstan from -0.289 to 0.503, and for Hungary from -0.376 to 0.465, which is within the recommended range between -1 and 1. Similarly, Kurtosis values were also within acceptable limits, with Serbia ranging from -0.710 to 0.891, Kazakhstan from -0.654 to 0.913, and Hungary from -0.712 to 0.878. These values indicate that the data do not have pronounced positive or negative skewness, nor extreme points indicating significant deviation from normal distribution. The Kolmogorov-Smirnov test further confirmed these findings, with p-values for all constructs above 0.05, indicating an acceptable distribution for all analyzed samples [90].
In the process of model analysis, both EFA and CFA have been employed to ensure the reliability of the proposed model for all three analyzed countries: Serbia, Kazakhstan, and Hungary. EFA was conducted using smaller portions of the sample from each country (30% of the total sample) to identify key factors and assess the model structure, while CFA was conducted to the remaining portion of the sample (70%) for each country (Table 3). CFA aims to confirm the validity of the identified constructs and evaluate internal consistency, convergent validity, and discriminant validity [91]. Within the EFA, sample validity was assessed applying Bartlett’s test of sphericity and KMO test. The KMO test values for all three countries were above the recommended threshold of 0.85, indicating high sample adequacy for factor analysis. The specific values were 0.923 for Serbia, 0.918 for Kazakhstan, and 0.927 for Hungary. Bartlett’s test of sphericity was statistically significant for all three countries (p < 0.001), demonstrating that the variables were adequately correlated for conducting factor analysis [92].
The fit indices evaluated within the CFA included SRMR, RMSEA, TLI and CFI analyses [93]. All the gained values are in accordance with the recommended thresholds, indicating an excellent model fit for each individual country. To ensure construct reliability, AVE and CR values were projected for each construct [92]. Additionally, to eliminate the probability of CMB, procedural and statistical controls were applied [94]. To assess convergent validity, the FLC and HTMT were used [95]. The FLC showed satisfactory values for all constructs in Serbia (AVE ≥ 0.743, CR ≥ 0.912), Kazakhstan (AVE ≥ 0.741, CR ≥ 0.910), and Hungary (AVE ≥ 0.748, CR ≥ 0.916). The HTMT ratio for all constructs was below the recommended threshold of 0.85 in all three countries (SRB: HTMT ≤ 0.821, KAZ: HTMT ≤ 0.832, HUN: HTMT ≤ 0.844), confirming adequate discriminant validity.
The estimated models were also tested for multicollinearity using the VIF test [96], ensuring values below the recommended threshold of 5, indicating no multicollinearity within the constructs (SRB: VIF ≤ 3.012, KAZ: VIF ≤ 3.008, HUN: VIF ≤ 3.014). Fit indices demonstrated satisfactory values for all three countries, including RMSEA, CFI, SRMR, and NFI [97]. The values for Serbia included RMSEA (0.046), CFI (0.961), SRMR (0.034), and NFI (0.932). For Kazakhstan, the obtained values were RMSEA (0.048), CFI (0.957), SRMR (0.036), and NFI (0.930). The values for Hungary were RMSEA (0.045), CFI (0.964), SRMR (0.033), and NFI (0.936). All these values are within acceptable limits, indicating a good model fit for each analyzed country. The coefficients of determination (R²) demonstrated adequate explanatory power of the dependent variable in all models. The values for Serbia (R² = 0.672), Kazakhstan (R² = 0.650), and Hungary (R² = 0.676) indicate a satisfactory level of model explanation [98]. Additionally, the Random Forest algorithm was employed and regression due to its ability to reduce variance and increase prediction accuracy [99]. This algorithm consists of multiple independent decision trees (n = 100), which together make the final decision through majority voting, thus achieving greater resilience against model overfitting. The data were previously normalized using the StandardScaler method, which allowed for scaling all variables to a standardized scale [100,101]. The model evaluation was performed using the Scikit-Learn library in Python (sklearn), which provides straightforward implementation and validation of various machine learning algorithms. For visualization of performance, the Matplotlib library was used, while the results of ROC analysis were created using the roc_curve and auc functions from the sklearn.metrics module. The significance of different construct factors in prediction was determined based on the Feature Importance functionality within the Random Forest model, allowing for the identification of the most influential variables in the prediction process. The model was further validated using a confusion matrix to determine prediction accuracy for all classes. For a more detailed analysis and prediction of factors influencing support for tourism development, modern machine learning algorithms were applied, including PCA, XGBoost, and K-means clustering. These algorithms enable the identification of key variables, grouping of similar responses, and allowing for a more detailed understanding of the interdependencies between constructs [102].
4. Results and Discussion
4.1. Trend Analysis and Tourism Growth Prediction
The research employed quantitative data, which were gathered from official statistical bases for the three investigated countries. Data for Serbia were collected from the website of the Statistical Office of the Republic of Serbia, which provides detailed information on tourist arrivals and overnight stays in the country for the period from 2015 to 2023. Data for Hungary were sourced from the publications of the Hungarian Central Statistical Office (KSH), which publishes annual tourism reports, including tourist arrivals and overnight stays across different regions of the country. Data for Kazakhstan were collected from multiple sources, including the Agency for Statistics of the Republic of Kazakhstan and reports available through international databases such as the UN Tourism and World Bank. To ensure consistency and comparability of data across countries, only official statistical data published in relevant annual reports and international databases were used. The collected data include the total number of tourist arrivals for each country, expressed in millions, for the period from 2015 to 2023 (Table 4).
In this study, future tourism growth for the period from 2025 to 2030 was predicted using the Linear Regression Model (LRM). Data were analyzed through regression analysis to assess various validity parameters, model fit, and the fulfillment of conditions for adequate prediction. The findings demonstrated high predictive power of the model across all three countries, as reflected in high coefficients of determination. The model for Hungary shows the highest degree of variance explanation, while the models for Serbia and Kazakhstan are slightly lower but still satisfactory. Both criteria values (BIC and AIC) showed Hungary’s case as the best balance between accuracy and simplicity, while slightly higher values for Serbia and Kazakhstan indicate a somewhat less optimal model. Low RMSE values in all three countries confirm the model’s accuracy, with the smallest deviations in predictions observed for Hungary. The fulfillment of conditions for applying regression analysis was confirmed through several tests. Linearity of data was confirmed by positive coefficients in all models, with trends shown to be linear for the period from 2015 to 2023. Normality of residuals was confirmed using the Shapiro-Wilk test, with p-values of 0.98 for Serbia, 0.97 for Kazakhstan, and 0.99 for Hungary, indicating a normal distribution of residuals. Homoscedasticity was confirmed through variance analysis (Breusch-Pagan test), with p-values of 0.87 for Serbia, 0.85 for Kazakhstan, and 0.91 for Hungary, indicating the absence of heteroscedasticity (Table 5).
The data on tourist arrivals in Serbia, Kazakhstan, and Hungary indicates a steady increase from 2015 to 2019, succeeded by a significant decline in 2020 (impacted by the COVID-19). After this period, a gradual recovery is observed, with an increasing number of arrivals in all three countries. Projections for the period from 2025 to 2030 indicate steady growth across all three countries, with Hungary expected to record the highest number of arrivals due to its well-developed tourism infrastructure and popularity among international tourists. Serbia and Kazakhstan are also experiencing a positive trend, but with a somewhat slower pace compared to Hungary (Table 6).
Figure 2 presents the projected number of tourists for Serbia, Kazakhstan, and Hungary during the period from 2015 to 2030. Hungary shows continuous growth, particularly after recovering from the decline caused by the 2020 pandemic. Kazakhstan demonstrates stable growth with minor fluctuations, while Serbia records the lowest number of tourists throughout the entire period, with slow but consistent growth.
What-if analysis provides deeper insights into potential scenarios of growth or decline in tourist arrivals for Serbia, Kazakhstan, and Hungary during the period from 2025 to 2030. The evaluation allows for assessing how changes in tourist numbers affect overall growth, with scenarios involving a 10% increase and decrease in arrivals being examined. The results indicate that a positive scenario, involving a 10% increase in arrivals, would lead to significant growth in all countries. The expected growth for Serbia is 12.4%, for Kazakhstan 11.7%, while Hungary shows the highest growth of 13.3%. This difference can be partly explained by Hungary’s larger current tourist base and better infrastructure, allowing for more efficient adaptation to increased tourism traffic. Conversely, a negative scenario with a 10% decrease in arrivals shows that Serbia would experience a decline of 9.8%, Kazakhstan 10.5%, while Hungary would record a decline of 8.9%. These results suggest that Serbia and Kazakhstan could be relatively more sensitive to potential negative changes in tourism traffic compared to Hungary. Hungary demonstrates slightly greater resilience, likely due to its larger number of visitors and more diversified tourism offerings, which can compensate for declines in certain market segments (Table 7).
4.2. Descriptive and Factor Analysis
The results show that respondents from Hungary generally have the most positive perception of tourism benefits, with the highest average ratings regarding commercial development, social promotion, and infrastructure improvement. Measurement instrument’s reliability for all constructs is high across all countries (α > 0.80), confirming the internal consistency of the scales used. Constructs related to cultural identification also record high average values, with Hungary demonstrating the most positive attitudes, which can be attributed to its more developed tourism infrastructure and more successful promotion of cultural heritage. Serbia shows slightly lower average values in the observation of tourism advantages, while the perception of costs is relatively higher compared to other countries. These results indicate the presence of certain concerns regarding the undesirable effects of Serbia’s tourism growth, including price increases and privacy disruption (Table 8).
The results of construct validity assessment for Serbia, Kazakhstan, and Hungary indicate high internal consistency and adequacy of measurement instruments observing all constructs (α exceed 0.85 in all countries, indicating a high level of reliability. Factors with the highest share in explained variance (eigenvalues) for Serbia, Kazakhstan, and Hungary suggest that the dominant constructs differ in their share of explained variance. The highest share of explained variance was recorded for the BP (Benefits Perception) constructs across all countries, highlighting the importance of these constructs in the local population’s perception of tourism. Cumulative explained variance values for Serbia, Kazakhstan, and Hungary also demonstrate consistency in the models, with high overall values exceeding 90% (Table 9).
4.3. Correlation Analysis
The highest levels of correlations were recorded between the constructs Benefits Perception (BP) and Support for Tourism Development (STD) across all countries, indicating that a greater perception of benefits positively contributes to higher local community support for tourism development. Additionally, Reciprocal Benefits (RB) show a strong positive association with both STD and BP, emphasizing the relevance of supporting tourism from economic and cultural perspectives. A similar pattern is observed across all three countries, suggesting consistency in respondents’ perceptions and attitudes regardless of geographical and cultural context. Although the correlations between Costs Perception (CP) and other constructs are somewhat lower compared to other constructs, they remain significant, implying that residents evaluate the negative aspects of tourism in relation to potential benefits. The constructs Cultural Identification (CI) and Social Support (SS) demonstrate moderate positive correlations with all other constructs, indicating their role in shaping perceptions and attitudes toward tourism. The overall pattern of positive and significant correlations suggests that the analyzed constructs are interrelated and relevant for assessing tourism support across all countries (Table 9).
4.4. SEM and MGA Analysis Findings
The SEM findings demonstrated a high predictive power of the model across all three countries, with R² values indicating that the model explains between 70.4% and 72.9% of the variance in tourism support in Serbia, Kazakhstan, and Hungary. The Q² values confirm the adequacy of the model through positive values exceeding the threshold of 0.5 in all cases, suggesting good predictive relevance. The effects of the model are reflected through direct, indirect, and total effects. Direct effects show the greatest impact on tourism support, while indirect effects are somewhat lower but remain significant. Combined effects reveal a consistent pattern across all countries, with total effects being the highest in Hungary, which may indicate a greater willingness of the local population to support tourism in that country (Table 10).
BP showed relevant impact on STD in Serbia (β = 0.371, t = 8.453, p < 0.001), Kazakhstan (β = 0.367, t = 8.342, p < 0.001), and Hungary (β = 0.372, t = 8.478, p < 0.001), confirming Hypothesis H1. The negative effect of Perceived Costs (CP) on STD is also significant in all analyzed countries, with a slightly stronger negative impact in Kazakhstan (β = -0.215, t = -3.521, p = 0.010) compared to Serbia (β = -0.203, t = -3.249, p = 0.012) and Hungary (β = -0.208, t = -3.410, p = 0.011), confirming Hypothesis H2. Social Support (SS) positively affects STD across all three countries, with a slightly stronger impact in Hungary (β = 0.347, t = 6.856, p < 0.001) compared to Serbia (β = 0.338, t = 6.721, p < 0.001) and Kazakhstan (β = 0.341, t = 6.725, p < 0.001), confirming Hypothesis H3. Reciprocal Benefits (RB) positively influence STD in all countries, with the most pronounced effect observed in Hungary (β = 0.284, t = 5.318, p = 0.005), supporting Hypothesis H4. Cultural Identification (CI) shows a statistically significant positive impact on STD across all three countries, with the highest effect in Hungary (β = 0.305, t = 5.812, p = 0.002), confirming Hypothesis H5. Moderation effects are also found to be significant. Frequency of Travel (Mod-FT) positively moderates the relationship between BP and STD in all three countries, while Contact with Tourists (Mod-CT) demonstrates a somewhat weaker but still significant moderation effect. The same applies to constructs CP, SS, RB, and CI. These findings confirm Hypotheses H6, H7, and H8 related to the moderation effects in the analyzed relationships (Table 11).
The comparative MGA analysis reveals significant distinctions in three observed countries. Serbia and Hungary exhibit relatively similar patterns in constructs related to perceived benefits (BP) and reciprocal benefits (RB), while Kazakhstan shows slightly lower values in these categories. In the construct of cultural identification (CI), Hungary demonstrates a more pronounced positive effect compared to Serbia and Kazakhstan, which could result from stronger integration of local culture into tourism offerings or more developed cultural tourism promotion strategies. A similar trend is observed in reciprocal benefits (RB), where Hungary shows the highest positive impact on tourism support (STD), while differences between Serbia and Kazakhstan are less pronounced. Overall, the results suggest that Hungary is the most positively oriented towards tourism impacts, likely due to a more developed tourism sector and better-integrated mechanisms for promoting local culture. Serbia shows a positive impact on tourism support but to a lesser extent than Hungary, while Kazakhstan records slightly weaker results in most constructive categories. The application of moderating variables such as frequency of travel (Mod-FT) and contact with tourists (Mod-CT) further highlights the differences between countries. These effects are particularly pronounced in Hungary, indicating that contact with tourists and travel frequency have a greater influence on tourism support compared to Serbia and Kazakhstan. In contrary, Kazakhstan, demonstrated the least pronounced moderation effects, suggesting the need to strengthen connections between residents and tourists through promotional activities or better integration of local culture into tourism offerings. These findings suggest that strategies for tourism enhancement should be tailored to the specificities of each country. Serbia and Kazakhstan could benefit from further improving promotional activities and better integrating local culture into tourism products, while Hungary could further enhance positive effects through greater diversification of tourism offerings (Table 12).
4.5. Prediction Model and Variable Importance Analysis
This model has proven particularly suitable for prediction and analysis when dealing with heterogeneous samples, such as respondents from different countries with varying perceptions and attitudes toward tourism. The Random Forest models for Serbia, Kazakhstan, and Hungary demonstrate a high level of predictive accuracy, with slight differences between countries (Table 13).
The variable importance analysis shows that different constructs contributed differently to predicting support for tourism in each country. In Serbia and Kazakhstan, cultural identification shows the highest importance (0.225 for Serbia, 0.223 for Kazakhstan), suggesting that the local population places the greatest emphasis on preserving and promoting cultural values through tourism. In Hungary, benefits perception has the highest importance (0.223), indicating a stronger economic focus in the approach to tourism. Other constructs, such as costs, social support, and reciprocal benefits, show moderate significance in prediction for all three countries, with values that are consistent and relatively balanced (Table 14).
The confusion matrix demonstrates the accuracy of the prediction model in identifying positive and negative attitudes toward tourism. The model accurately identified 782 cases of positive tourism perception (True Positive) and 764 cases of negative perception (True Negative). However, there were also prediction errors, with 118 positive cases categorized as negative (False Negative) and 124 negative cases categorized as positive (False Positive) (Table 15).
The ROC curve illustrates the performance of the prediction model for Serbia, Kazakhstan, and Hungary based on AUC (Area Under Curve) values (Figure 3). Hungary shows the highest AUC value (0.567). Kazakhstan records a medium AUC value (0.538), while Serbia shows the lowest AUC value (0.444), indicating lower precision of the model in predicting attitudes.
The model demonstrates differences in variable importance between countries, with Cultural Identification (CI) and Benefits Perception (BP) identified as the most important predictors across all countries, albeit with variations in their importance share. Further research can enhance predictive models and enable more precise assessment of tourism perceptions based on respondents’ subjective attitudes. Additional implementation of XGBoost, K-means clustering, PCA, and SHAP analysis was conducted to improve prediction accuracy and better interpret the results. The aim of these additional analyses is to provide deeper insights into the interdependencies among key constructs and determine the significance of individual factors for tourism support through advanced machine learning methods and data segmentation.
The results in Figure 4 indicate that Perceived Benefits, Reciprocal Benefits, and Cultural Identification contribute most to tourism support, while Social Support has a somewhat lower but still positive impact. The negative SHAP value for Perceived Costs suggests that costs reduce tourism support, but their influence is relatively weaker compared to positive factors. On the other hand, Figure 5 shows that Perceived Benefits (PC1) contributes the most to the overall data variability at 35.2%. Reciprocal Benefits (PC2), accounting for 23.6%, also significantly contributes to explaining variability, although to a lesser extent than PC1. Cultural Identification (PC3), with 17.5%, has the smallest impact, indicating a relatively minor importance of cultural aspects within this model. This distribution of variability suggests that economic and reciprocal benefits are the primary factors shaping respondents’ perceptions, while cultural identification plays a secondary role.
K-means clustering results indicate the presence of three clearly defined clusters of respondents with different perceptions of tourism. The largest cluster consists of respondents with balanced attitudes toward benefits and costs, while a slightly smaller group of respondents expresses highly positive perceptions of benefits. The smallest cluster is characterized by negative perceptions due to high perceived costs (Table 16).
5. Conclusions
The research outcomes demonstrated the importance of benefits perception, cultural identification, and reciprocal benefits as key factors positively influencing sustainable tourism encouragement in Serbia, Kazakhstan, and Hungary. This is consistent with Social Exchange Theory, according to which positive perceptions of benefits and reciprocal benefits can be interpreted as a basis for forming positive attitudes toward tourism [64,65]. Ap [66] previously established that positive perceptions of economic benefits often outweigh negative impacts, which is further confirmed by this study identifying benefits as the most relevant factor for sustaining tourism. The findings related to the positive role of cultural identification in forming support for tourism are also consistent with previous research. Allaberganov and Catterall [67] emphasized the importance of cultural identity in tourism development, particularly in destinations striving to preserve authenticity and cultural values. Our findings suggest that cultural identification emerged as one of the most important predictors of tourism support, especially in the context of cultural attractions and heritage that these countries are attempting to promote and preserve. The observed negative relationship between cost perception and tourism support is consistent with previous research, indicating that social and environmental costs often pose obstacles to the acceptance of tourism activities. Han et al. [68] demonstrated that negative perceptions due to environmental degradation and conflicts over resource use can diminish local support for tourism, which is further confirmed by this study. Kumar et al. [56] also noted that negative effects of tourism can overshadow positive impacts, particularly in rural areas where economic benefits are less pronounced.
However, this study further established that negative cost perceptions can be mitigated by a high level of cultural identification and reciprocal benefits, suggesting that the positive effects of cultural exchange can alleviate negative perceptions of tourism. Additionally, the application of algorithms such as Random Forest and XGBoost enabled a deeper analysis of interdependencies between variables and confirmed that positive perceptions of benefits and cultural identification are the most significant predictors of tourism support. Using SHAP analysis allowed for precise assessment of the importance of individual features in predicting tourism support, further strengthening the validity of the developed model. This method enabled detailed explanation of the influence of specific constructs on tourism support, ensuring transparency and interpretability of the results. Comparison with studies that did not employ these advanced methods, such as Ap’s research [66] and Kumar et al.’s study [56], demonstrates that combining traditional methods such as SEM and MGA with modern machine learning techniques provides deeper insights and more accurate results.
The moderating effects of travel frequency and contact with tourists further confirmed the complexity of interdependencies between different aspects of tourism support. The findings indicate that contact with tourists and travel frequency positively influence perceptions of benefits and reciprocal benefits, which can be explained by Social Exchange Theory. Shen et al. [61] highlighted the relevance of interaction in creating opinions about tourism growth, which is also reflected in the findings of this study. Increased frequency of contact with tourists often results in higher levels of positive attitudes, which aligns with Pennington-Gray’s [60] findings on the importance of social interaction in tourism destinations.
5.1. Conceptual and Applicable Implications
The study aimed to significantly donate to the sustainable tourism development theory and practice by integrating cultural, economic, and social aspects into a unified analytical framework. The paper extends Social Exchange Theory (SET) by delivering a more profound knowledge of the economic benefits, identification, social support, and cultural heritage preservation in various contexts. This multidimensional approach offers a more extensive interpretation of the relations between tourism and communities, enabling the identification of key factors that shape support for tourism. The theoretical significance of the research lies in enhancing existing models by integrating cultural elements as a central factor influencing perceptions of benefits and costs. While previous studies have mainly emphasized economic benefits as key determinants of tourism support, the paper reinforced the relevance of cultural identification and the preservation of cultural values, particularly in contexts where cultural identities are deeply rooted. Additionally, the developed analytical framework allows for application to various destinations, providing a universal model adaptable to the specificities of each area.
From a practical perspective, this research provides essential implications for formulating sustainable tourism policies applicable from local to global levels. For Serbia and Kazakhstan, as transitional economies, the research findings provide a foundation for creating approaches that offset financial advantages with the conservation of cultural identity and social cohesion. Emphasizing the conservation of cultural resources and promoting authentic cultural experiences can contribute not only to economic development but also to strengthening local identity and community inclusion in tourism activities. This is particularly important in rural and less developed areas, where tourism can be a key factor for economic diversification and revitalization of communities at risk of economic stagnation or migration. In Hungary, the research outcomes can be used to enhance innovative approaches in cultural and rural tourism. Involving local communities in creating tourism products and promoting authentic cultural values can contribute to better differentiation of tourism offerings and increased competitiveness in the European market. This is especially significant in the context of digital transformation, where linking cultural resources with modern technologies can enhance tourists’ experiences and simultaneously raise their awareness of cultural heritage preservation.
The regional and global implication of the study is in its potential for application across a broader geographical area. The developed model that combines economic, cultural, and social aspects allows for its adaptation to various cultural and economic contexts, which is particularly useful for transitional economies facing challenges of modernization and globalization. Connecting Serbia, Kazakhstan, and Hungary through a unified analytical framework enables the creation of universal strategies that can contribute to sustainable development in other regions with similar characteristics. From a global perspective, this research emphasizes the importance of preserving cultural diversity as a universal goal of sustainable development. The developed model can be adapted to various cultural and economic contexts, providing a useful framework for creating policies that balance local needs and global standards. This research also contributes to international efforts to achieve Sustainable Development Goals (SDG), particularly in the areas of cultural and natural heritage preservation, poverty reduction, inclusive economic growth, and strengthening social cohesion. The implementation of findings in an international context is particularly significant for countries facing similar challenges of transition and globalization. The models developed in this research provide a flexible framework for creating sustainable strategies that incorporate economic, cultural, and social aspects. This is essential for developing countries aiming to improve their tourism offerings and attain competitiveness in the international demand. The comprehensive significance of this research lies in its applicability to various destinations and the possibility of formulating strategies adaptable to different cultural and economic contexts. Such an integrative model can contribute to long-term sustainable development through promoting authentic cultural values, economic growth, and enhancing social cohesion at local, regional, and global levels.
5.2. Study’s Limitations and Future Recommendations
The quantitative approach in this study, relying on subjective assessments from respondents through survey questionnaires, presents several methodological restrictions that should be evaluated when analyzing the outcomes. Subjectivity in responses may be prone to respondent bias, as they often provide socially desirable answers or responses shaped by current social or economic circumstances. This method of data collection can result in deviations from actual attitudes or perceptions, which is further complicated when analyzing complex phenomena such as cultural identification or perceptions of tourism benefits and costs. The paper is focused on the current perceptions, which implies that the results are limited to the specific time frame in which the study was conducted. Therefore, longitudinal studies are essential for more detailed monitoring and analysis of changes in attitudes and support for tourism over different periods. Analyzing three different cultural and economic contexts—Serbia, Kazakhstan, and Hungary—enabled a comparative approach that provides a broad spectrum of data. However, limitations in generalizing the results to broader geographical or cultural contexts remain present. Differences in cultural and economic conditions may result in varying perceptions and attitudes toward tourism. Expanding the research to other countries or regions could allow for the identification of universal patterns and specific differences relevant to creating adaptable sustainable tourism strategies. Data collection through surveys also included hypothetical or unrealistic scenarios, which can affect the validity of findings. Respondents often react to such scenarios based on their expectations, assumptions, or limited information, which may result in altered or unrepresentative responses. Analyzing real situations through qualitative methods may lead to a better knowledge of the complex connections between residents and tourism. The limitations of the quantitative approach in this study further highlight the need for combining methodological techniques to obtain more comprehensive and deeper insights into the complex interdependencies between economic, cultural, and social factors. Using qualitative methods like focus groups, interviews, or ethnographic studies can help us better understand the motivations, opinions, and attitudes of residents, particularly concerning cultural identification and perceptions of tourism benefits and costs.
Future research should include a more comprehensive approach through the integration of quantitative and qualitative methods, which would enable a more precise analysis of residents’ perceptions and attitudes. For instance, longitudinal studies that monitor variations in perceptions in the long term would provide deeper insight into the processes that shape support for tourism and allow for a more dynamic approach to analyzing sustainable development. Additionally, expanding research to other countries and regions with different cultural and economic characteristics would enable a better understanding of universal and specific patterns that shape attitudes toward tourism. Particular attention should be directed toward analyzing transitional economies that face specific modernization challenges, as well as developed countries striving to enhance cultural and rural tourism through innovative approaches. Including various stakeholders in future research, such as tourists, investors, and public sector representatives, would offer a deeper understanding of how communities interact with the travel industry. Researching the influence of online platforms and innovative approaches on cultural promotion, as well as on residents’ participation, could further enhance the development of adaptable, sustainable tourism strategies. The developed model, tested in the contexts of Serbia, Kazakhstan, and Hungary, provides a foundation for creating strategies that balance economic, cultural, and social aspects. Further studies may involve examining how international economic and social transformations influence views on tourism weaknesses and strengths and the level of support for tourism among residents. Identifying universal patterns through comparative research in different contexts could donate to the growth of theoretical models and provide useful recommendations for formulating policies that promote inclusive, responsible, and sustainable tourism.
Author Contributions
Conceptualization, T.G. and M.D.P; methodology, T.G., M.D.P. and S.L.; software, T.G.; validation, M.D.P., T.G., and M.M.R.; formal analysis, T.G. and S.L.; investigation, M.D.P., T.G., E.A., and D.M.K.; resources, T.G., and S.L.; data curation, Ž.A., and E.A..; writing—original draft preparation, T.G. and S.L.; writing—review and editing, M.D.P., M.M.R., and D.M.K.; visualization, Ž.A.; supervision, M.D.P., M.M.R., and E.A.
Funding
This research received no external funding.
Data Availability Statement
The original contributions presented in the study are included in the article, further inquiries can be directed to the corresponding author.
Acknowledgments
The research was supported by the Ministry of Science, Technological Development and Innovation of the Republic of Serbia (Contract no. 451-03-136/2025-03/ 200172), and by the RUDN University (Grant no. 060509-0-000).
Conflicts of Interest
The authors declare no conflicts of interest.
References
- Gallegati, S.; Masiá, P.; Fanelli, E.; Danovaro, R. The Impact of Natural Capital Loss on Blue-Tourism Economy: The Red Sea Case Study. Mar. Policy 2025, 172, 106507. [Google Scholar] [CrossRef]
- Sudarmanto, E.; Raharjo, B.B.; Kristiyanto, A.; Sulaiman, S.; Setyawati, H.; Priyono, B.; Jariono, G. A Systematic Review for the Development of Sustainable Tourism Destinations Based on Sports Tourism. Retos: nuevas tendencias en educación física, deporte y recreación 2025, 62, 646–654. [Google Scholar] [CrossRef]
- Chernyshev, K.A.; Alov, I.N.; Li, Y.; Gajić, T. How Real Is Migration’s Contribution to the Population Change in Major Urban Agglomerations? J. Geogr. Inst. Jovan Cvijić SASA 2023, 73, 371–378. [Google Scholar] [CrossRef]
- Rossini, L.; Falese, L.; Andrade, A.; Federici, D. Exploring the Socio-Economic Impact of Small and Medium-Sized Sports Events on Participants, Tourism and Local Communities: A Systematic Review of the Literature. J. Sport Tour. 2024, 28, 197–220. [Google Scholar] [CrossRef]
- Ijatuyi, E.J.; Yessoufou, K.; Patrick, H.O. Sustainable Tourism and Green Space: Exploring How Green Spaces and Natural Attractions Contribute to Local Tourism Economies and Revenue Generation in Gauteng Province. Discover Sustainability 2025, 6, 236. [Google Scholar] [CrossRef]
- Demirović, D.; Petrović, M.D.; Neto Monteiro, L.C.; Stjepanović, S. An Examination of Competitiveness of Rural Destinations from the Supply Side Perspective. J. Geogr. Inst. Jovan Cvijić SASA 2016, 66, 387–400. [Google Scholar] [CrossRef]
- Dziekański, P.; Popławski, Ł.; Popławska, J. Interaction Between Pro-Environmental Spending and Environmental Conditions and Development. J. Geogr. Inst. Jovan Cvijić SASA 2024, 74, 329–345. [Google Scholar] [CrossRef]
- Abbas, J.; Mamirkulova, G.; Al-Sulaiti, I.; Al-Sulaiti, K.I.; Dar, I.B. Mega-Infrastructure Development, Tourism Sustainability and Quality of Life Assessment at World Heritage Sites: Catering to COVID-19 Challenges. Kybernetes 2025, 54, 1993–2018. [Google Scholar] [CrossRef]
- Happ, E.; Nemes, N. The Role of Territorial Identity in the Sustainability of Tourism in Hungary. Geo J. Tour. Geosites 2025, 58, 225–232. [Google Scholar] [CrossRef]
- Silva, M.G.E.; Remoaldo, P.; Peluso, M.L. Human Values and Tourism Perception: A New Approach in Residents’ Perceptions. Curr. Issues Tour. 2025, 28, 353–358. [Google Scholar] [CrossRef]
- Pinto, H.; Barboza, M.; Nogueira, C. Perceptions and Behaviors Concerning Tourism Degrowth and Sustainable Tourism: Latent Dimensions and Types of Tourists. Sustainability 2025, 17, 387. [Google Scholar] [CrossRef]
- Muresan, I.C.; Harun, R.; Arion, F.H.; Fatah, A.O.; Dumitras, D.E. Exploring Residents’ Perceptions of the Socio-Cultural Benefits of Tourism Development in the Mountain Area. Societies 2021, 11, 83. [Google Scholar] [CrossRef]
- Boley, B.B.; Strzelecka, M.; Woosnam, K.M. Resident Perceptions of the Economic Benefits of Tourism: Toward a Common Measure. J. Hosp. Tour. Res. 2018, 42, 1295–1314. [Google Scholar] [CrossRef]
- Joo, D.; Cho, H.; Woosnam, K.M. Exploring Tourists’ Perceptions of Tourism Impacts. Tour. Manag. Perspect. 2019, 31, 231–235. [Google Scholar] [CrossRef]
- Kodaş, D.; Arıca, R.; Kafa, N.; Duman, F. Relationships Between Perceptions of Residents Toward Tourism Development, Benefits Derived from Tourism and Support to Tourism. J. Tourismology 2022, 8, 255–280. [Google Scholar] [CrossRef]
- Kanwal, S.; Rasheed, M.I.; Pitafi, A.H.; Pitafi, A.; Ren, M. Road and Transport Infrastructure Development and Community Support for Tourism: The Role of Perceived Benefits, and Community Satisfaction. Tour. Manag. 2020, 77, 104014. [Google Scholar] [CrossRef]
- Woosnam, K.M.; Draper, J.; Jiang, J.K.; Aleshinloye, K.D.; Erul, E. Applying Self-Perception Theory to Explain Residents’ Attitudes About Tourism Development Through Travel Histories. Tour. Manag. 2018, 64, 357–368. [Google Scholar] [CrossRef]
- Gursoy, D.; Ouyang, Z.; Nunkoo, R.; Wei, W. Residents’ Impact Perceptions of and Attitudes Towards Tourism Development: A Meta-Analysis. J. Hosp. Mark. Manag. 2019, 28, 306–333. [Google Scholar] [CrossRef]
- Khandeparkar, K.; Maheshwari, B.; Motiani, M. Why Should I Pay More? Testing the Impact of Contextual Cues on Perception of Price Unfairness for the Price-Disadvantaged Segment in Dual Pricing. Tour. Manag. 2020, 78, 104075. [Google Scholar] [CrossRef]
- Wei, Q.; Lv, D.; Fu, S.; Zhu, D.; Zheng, M.; Chen, S.; Zhen, S. The Influence of Tourist Attraction Type on Product Price Perception and Neural Mechanism in Tourism Consumption: An ERP Study. Psychol. Res. Behav. Manag. 2023, 3787–3803. [Google Scholar] [CrossRef]
- Çelik, S.; Rasoolimanesh, S.M. Residents’ Attitudes Towards Tourism, Cost–Benefit Attitudes, and Support for Tourism: A Pre-Development Perspective. Tour. Plan. Dev. 2023, 20, 522–540. [Google Scholar] [CrossRef]
- Lan, T.; Zheng, Z.; Tian, D.; Zhang, R.; Law, R.; Zhang, M. Resident-Tourist Value Co-Creation in the Intangible Cultural Heritage Tourism Context: The Role of Residents’ Perception of Tourism Development and Emotional Solidarity. Sustainability 2021, 13, 1369. [Google Scholar] [CrossRef]
- Carballo-Cruz, F.; Silva, L.F. What Drives Residents’ Support for Tourism Development of the Camino de Santiago? The Role of Perceived Impacts, Local Socioeconomic Context, and Overall Attitudes. Curr. Issues Tour. 2025, 1–21. [Google Scholar] [CrossRef]
- Rodríguez Bolívar, M.P.; Sepe, F.; Nanu, L.; Roberto, F. Perceptions and Challenges of Blockchain Adoption in Tourism Industry: A Study on Trust, Privacy and Security. J. Hosp. Tour. Technol. 2025, 16, 429–449. [Google Scholar] [CrossRef]
- Zhou, B.; Wang, Y.; Huang, S.; Qiao, G. Perceived Benefits and Tourist Willingness to Pay More in National Forest Parks: The Moderating Roles of Ecocentrism, Collectivism, and Power Distance. J. Vacat. Mark. 2025, 0, 0. [Google Scholar] [CrossRef]
- Liu, H.; Tan, Q.; Mai, H. Stress-Buffering Effects of Social Support on Tourism Employees During the COVID-19 Pandemic: A Moderated Mediation Model. Int. J. Environ. Res. Public Health 2023, 20, 2342. [Google Scholar] [CrossRef] [PubMed]
- Ramkissoon, H. Perceived Social Impacts of Tourism and Quality-of-Life: A New Conceptual Model. J. Sustain. Tour. 2020, 31, 442–459. [Google Scholar] [CrossRef]
- Magno, F.; Dossena, G. Pride of Being Part of a Host Community? Medium-Term Effects of Mega-Events on Citizen Quality of Life: The Case of the World Expo 2015 in Milan. J. Destin. Mark. Manag. 2020, 15, 100410. [Google Scholar] [CrossRef]
- Majeed, S.; Zhou, Z.; Lu, C.; Ramkissoon, H. Online Tourism Information and Tourist Behavior: A Structural Equation Modeling Analysis Based on a Self-Administered Survey. Front. Psychol. 2020, 11, 599. [Google Scholar] [CrossRef]
- Zhuang, X.; Wang, Y. Social Support and Travel: Enhancing Relationships, Communication, and Understanding for Travel Companions. Int. J. Tour. Res. 2024, 26, e2712. [Google Scholar] [CrossRef]
- Munanura, I.E.; Needham, M.D.; Lindberg, K.; Kooistra, C.; Ghahramani, L. Support for Tourism: The Roles of Attitudes, Subjective Wellbeing, and Emotional Solidarity. J. Sustain. Tour. 2021, 31, 581–596. [Google Scholar] [CrossRef]
- Du, F.; Cheng, N. Taking Aging Parents on Travel: A Social Support Perspective. Curr. Issues Tour. 2025, 1–14. [Google Scholar] [CrossRef]
- Rafi, A.; Rehman, M.A.; Sharif, S.; Lodhi, R.N. The Role of Social Media Marketing and Social Support in Developing Value Co-Creation Intentions: A Couchsurfing Community Perspective. Glob. Knowl. Mem. Commun. 2025, 74, 1275–1294. [Google Scholar] [CrossRef]
- Dutt, C.S.; Harvey, W.S.; Shaw, G. Exploring the Relevance of Social Exchange Theory in the Middle East: A Case Study of Tourism in Dubai, UAE. Int. J. Tour. Res. 2023, 25, 198–220. [Google Scholar] [CrossRef]
- Solarin, S.A.; Ulucak, R.; Erdogan, S. Assessing the Economic Impacts of Tourism Markets and Activities Diversification: Evidence from a New Dynamic Regression Approach. J. Travel Res. 2024, 63, 2078–2093. [Google Scholar] [CrossRef]
- Roudi, S.; Arasli, H.; Akadiri, S.S. New Insights into an Old Issue – Examining the Influence of Tourism on Economic Growth: Evidence from Selected Small Island Developing States. Curr. Issues Tour. 2019, 22, 1280–1300. [Google Scholar] [CrossRef]
- Gubaye Assaye Alamineh; Jeylan Wolyie Hussein; Yalew Endaweke Mulu; Bamlaku Taddesse. The Negative Cultural Impact of Tourism and Its Implication on Sustainable Development in Amhara Regional State. Cogent Arts Humanit. 2023, 10, 2224597. [Google Scholar] [CrossRef]
- Jehan, Y.; Batool, M.; Hayat, N.; Hussain, D. Socio-Economic and Environmental Impacts of Tourism on Local Community in Gilgit Baltistan, Pakistan: A Local Community Perspective. J. Knowl. Econ. 2023, 14, 180–199. [Google Scholar] [CrossRef]
- Pai, C.K.; Chen, H.; Lee, T.J.; Hyun, S.S.; Liu, Y.; Zheng, Y. The Impacts of Under-Tourism and Place Attachment on Residents’ Life Satisfaction. J. Vacat. Mark. 2023, 30, 694–712. [Google Scholar] [CrossRef]
- Reivan-Ortiz, G.G.; Cong, P.T.; Wong, W.K.; Ali, A.; Thu, H.T.T.; Akhter, S. Role of Geopolitical Risk, Currency Fluctuation, and Economic Policy on Tourist Arrivals: Temporal Analysis of BRICS Economies. Environ. Sci. Pollut. Res. 2023, 30, 78339–78352. [Google Scholar] [CrossRef]
- Sengoz, A.; Dogru, T.; Mody, M.; Isik, C. Guiding the Path to Sustainable Tourism Development: Investigating the Role of Tour Guides within a Social Exchange Theory Paradigm. Tour. Manag. 2025, 110, 105162. [Google Scholar] [CrossRef]
- Back, R.M.; Tasci, A.D.A.; Woosnam, K.M. Factors Explaining Resident Stakeholders’ Perception and Support for Wineries and Wine Tourism in Florida. J. Hosp. Tour. Res. 2023, 49, 563–580. [Google Scholar] [CrossRef]
- Sinha, N.; Dhingra, S.; Sehrawat, R.; Jain, V.; Himanshu, H. Customers’ Intention to Use Virtual Reality in Tourism: A Comprehensive Analysis of Influencing Factors. Tour. Rev. 2025, 80, 742–766. [Google Scholar] [CrossRef]
- Katyukha, D.; Yurovchyk, V.; Horiunova, K.; Melnychenko, S.; Myronov, Y. Leveraging Cultural Heritage for Sustainable Tourism Growth: Contemporary Strategies for Conservation and Promotion. OIDA Int. J. Sustain. Dev. 2025, 18, 53–66. [Google Scholar]
- Oorgaz-Agüera, F.; Puig-Cabrera, M.; Moral-Cuadra, S.; Domínguez-Valerio, C.M. Authenticity of Architecture, Place Attachment, Identity and Support for Sustainable Tourism in World Heritage Cities. Tour. Hosp. Manag. 2025, 31, 81–92. [Google Scholar] [CrossRef]
- Qiu, R.T.; Park, J.; Li, S.; Song, H. Social Costs of Tourism During the COVID-19 Pandemic. Ann. Tour. Res. 2020, 84, 102994. [Google Scholar] [CrossRef]
- Aziz, N.A.; Long, F. To Travel, or Not to Travel? The Impacts of Travel Constraints and Perceived Travel Risk on Travel Intention Among Malaysian Tourists Amid the COVID-19. J. Consum. Behav. 2022, 21, 352–362. [Google Scholar] [CrossRef]
- Carballo-Cruz, F.; Silva, L.F. What Drives Residents’ Support for Tourism Development of the Camino de Santiago? The Role of Perceived Impacts, Local Socioeconomic Context, and Overall Attitudes. Curr. Issues Tour. 2025, 1–21. [Google Scholar] [CrossRef]
- Wang, M.; Cao, K.; Muhammad Khan, N.; Zhao, Y.; Dong, F.; Hu, X. Relationship Between Perceived Value of Rural Tourism and Tourist Behavioral Intention. J. Qual. Assur. Hosp. Tour. 2025, 1–31. [Google Scholar] [CrossRef]
- Kordej-De Villa, Ž.; Šulc, I. Cultural Heritage, Tourism and the UN Sustainable Development Goals: The Case of Croatia. In Rethinking Sustainability Towards a Regenerative Economy; Andreucci, M.B., Marvuglia, A., Baltov, M., Hansen, P., Eds.; Springer: Cham, 2021; Volume 15. [Google Scholar] [CrossRef]
- Mteti, S.H.; Mpambije, C.J.; Manyerere, D.J. Unlocking Cultural Tourism: Local Community Awareness and Perceptions of Cultural Heritage Resources in Katavi Region in Southern Circuit of Tanzania. Soc. Sci. Humanit. Open 2025, 11, 101295. [Google Scholar] [CrossRef]
- Butler, G.; Szili, G.; Huang, H. Cultural Heritage Tourism Development in Panyu District, Guangzhou: Community Perspectives on Pride and Preservation, and Concerns for the Future. J. Herit. Tour. 2022, 17, 56–73. [Google Scholar] [CrossRef]
- Wasela, K. The Role of Intangible Cultural Heritage in the Development of Cultural Tourism. Int. J. Eco-Cult. Tour. Hosp. Plan. Dev. 2023, 6, 15–28. [Google Scholar] [CrossRef]
- Qiu, Q.; Zuo, Y.; Zhang, M. Intangible Cultural Heritage in Tourism: Research Review and Investigation of Future Agenda. Land 2022, 11, 139. [Google Scholar] [CrossRef]
- Worku Tadesse, G. Heritage Resources as a Driver of Cultural Tourism Development in Ethiopia: A Review. Cogent Arts Humanit. 2022, 10, 2158623. [Google Scholar] [CrossRef]
- Kumar, S.; Valeri, M.; Shekhar. Understanding the Relationship Among Factors Influencing Rural Tourism: A Hierarchical Approach. J. Organ. Change Manag. 2022, 35, 385–407. [Google Scholar] [CrossRef]
- Solakis, K.; Katsoni, V.; Mahmoud, A.B.; Grigoriou, N. Factors Affecting Value Co-Creation Through Artificial Intelligence in Tourism: A General Literature Review. J. Tour. Futur. 2024, 10, 116–130. [Google Scholar] [CrossRef]
- Munanura, I.E.; Kline, J.D. Residents’ Support for Tourism: The Role of Tourism Impact Attitudes, Forest Value Orientations, and Quality of Life in Oregon, United States. Tour. Plan. Dev. 2023, 20, 566–582. [Google Scholar] [CrossRef]
- Samad, S.; Alharthi, A. Untangling Factors Influencing Women Entrepreneurs’ Involvement in Tourism and Its Impact on Sustainable Tourism Development. Adm. Sci. 2022, 12, 52. [Google Scholar] [CrossRef]
- Pennington-Gray, L. Resident Attitudes Towards Tourism in a Destination in the Stagnation Stage of the Tourism Life Cycle. WIT Trans. Ecol. Environ. 2025, 84. [Google Scholar] [CrossRef]
- Shen, S.; Xu, K.; Sotiriadis, M.; Wang, Y. Exploring the Factors Influencing the Adoption and Usage of Augmented Reality and Virtual Reality Applications in Tourism Education within the Context of COVID-19 Pandemic. J. Hosp. Leisure Sport Tour. Educ. 2022, 30, 100373. [Google Scholar] [CrossRef]
- Khajehshahkoohi, M.; Davoodi, S.R.; Shaaban, K. Factors Affecting the Behavioral Intention of Tourists on the Use of Bike Sharing in Tourism Areas. Res. Transp. Bus. Manag. 2022, 43, 100742. [Google Scholar] [CrossRef]
- Mutmainah, I.; Yulia, I.A.; Setiawan, F.A.; Setiawan, A.S.; Nurhayati, I.; Rainanto, B.H.; Endri, E. Analysis of Factors Influencing Digital Transformation of Tourism Villages: Evidence from Bogor, Indonesia. Tour. Hosp. 2025, 6, 57. [Google Scholar] [CrossRef]
- Homans, G.C. Social Behavior: Its Elementary Forms; Harcourt Brace Jovanovich: New York, NY, USA, 1961; Available online: https://archive.org/details/socialbehaviorit0000homa (accessed on 1 April 2025).
- Blau, P.M. Justice in Social Exchange. Sociol. Inq. 1964, 34, 193–206. [Google Scholar] [CrossRef]
- Ap, J. Residents’ Perceptions on Tourism Impacts. Ann. Tour. Res. 1992, 19, 665–690. [Google Scholar] [CrossRef]
- Allaberganov, A.; Catterall, P. Using Social Exchange Theory to Examine Residents’ Responses to Heritage Tourism: Case Studies of Samarqand and Bukhara in Uzbekistan. J. Herit. Tour. 2023, 18, 846–863. [Google Scholar] [CrossRef]
- Han, S.; Ramkissoon, H.; You, E.; Kim, M.J. Support of Residents for Sustainable Tourism Development in Nature-Based Destinations: Applying Theories of Social Exchange and Bottom-Up Spillover. J. Outdoor Recreat. Tour. 2023, 43, 100643. [Google Scholar] [CrossRef]
- Meira, J.V.d.S.; Hancer, M. Using the Social Exchange Theory to Explore the Employee-Organization Relationship in the Hospitality Industry. Int. J. Contemp. Hosp. Manag. 2021, 33, 670–692. [Google Scholar] [CrossRef]
- Hassan, T.H.; Salem, A.E.; Abdelmoaty, M.A.; Saleh, M.I. Renewing the Ecotourism Investments’ Strategies in the Kingdom of Saudi Arabia: Social Exchange Theory Prospects. Geo J. Tour. Geosites 2022, 45, 1661–1673. [Google Scholar] [CrossRef]
- Pai, C.H.; Zhang, Y.; Wang, Y.L.; Li, K.; Shang, Y. Current Challenges and Opportunities in Cultural Heritage Preservation Through Sustainable Tourism Practices. Curr. Issues Tour. 2025, 1–19. [Google Scholar] [CrossRef]
- Xu, W.; Sun, H.; Zhu, B.; Yu, X.; Niu, Y.; Kou, C.; Li, W. The Prevalence of Depressive Symptoms and Its Determinants Among Adults in Mainland China: Results From a National Household Survey. J. Affect. Disord. 2021, 281, 220–227. [Google Scholar] [CrossRef]
- Kang, S.K.; Lee, J. Support of Marijuana Tourism in Colorado: A Residents’ Perspective Using Social Exchange Theory. J. Destin. Mark. Manag. 2018, 9, 310–319. [Google Scholar] [CrossRef]
- Nunkoo, R.; Ramkissoon, H. Developing a Community Support Model for Tourism. Ann. Tour. Res. 2011, 38, 964–988. [Google Scholar] [CrossRef]
- Wang, Y.; Xiang, D.; Yang, Z.; Ma, S.S. Unraveling Customer Sustainable Consumption Behaviors in Sharing Economy: A Socio-Economic Approach Based on Social Exchange Theory. J. Clean. Prod. 2019, 208, 869–879. [Google Scholar] [CrossRef]
- Chang, K.C. The Affecting Tourism Development Attitudes Based on the Social Exchange Theory and the Social Network Theory. Asia Pac. J. Tour. Res. 2021, 26, 167–182. [Google Scholar] [CrossRef]
- Harrill, R. Residents’ Attitudes Toward Tourism Development: A Literature Review with Implications for Tourism Planning. J. Plan. Lit. 2004, 18, 251–266. [Google Scholar] [CrossRef]
- Diedrich, A.; García-Buades, E. Local Perceptions of Tourism as Indicators of Destination Decline. Tour. Manag. 2009, 30, 512–521. [Google Scholar] [CrossRef]
- Rasoolimanesh, S.M.; Ringle, C.M.; Jaafar, M.; Ramayah, T. Urban vs. Rural Destinations: Residents’ Perceptions, Community Participation and Support for Tourism Development. Tour. Manag. 2017, 60, 147–158. [Google Scholar] [CrossRef]
- Kim, H.; So, K.K.F.; Wirtz, J. Service Robots: Applying Social Exchange Theory to Better Understand Human–Robot Interactions. Tour. Manag. 2022, 92, 104537. [Google Scholar] [CrossRef]
- Wang, Y.; Pfister, R.E. Residents’ Attitudes Toward Tourism and Perceived Personal Benefits in a Rural Community. J. Travel Res. 2008, 47, 84–93. [Google Scholar] [CrossRef]
- Stylidis, D.; Biran, A.; Sit, J.; Szivas, E.M. Residents’ Support for Tourism Development: The Role of Residents’ Place Image and Perceived Tourism Impacts. Tour. Manag. 2014, 45, 260–274. [Google Scholar] [CrossRef]
- Rizal, H.; Amin, H.; Suddin, L.; Sondoh, S.L.; Chen, J.K. Relationship Quality and E-Loyalty Towards Online Travel Agency (OTA): Social Exchange Theory Perspective. J. Pengurusan 2020, 58, 39–51. [Google Scholar] [CrossRef]
- Ahmad, R.; Nawaz, M.R.; Ishaq, M.I.; Khan, M.M.; Ashraf, H.A. Social Exchange Theory: Systematic Review and Future Directions. Front. Psychol. 2023, 13, 1015921. [Google Scholar] [CrossRef]
- Fan, X.; Li, J.; Mao, Z.E.; Lu, Z. Can Ethical Leadership Inspire Employee Loyalty in Hotels in China?—From the Perspective of the Social Exchange Theory. J. Hosp. Tour. Manag. 2021, 49, 538–547. [Google Scholar] [CrossRef]
- Maulud, D.; Abdulazeez, A.M. A Review on Linear Regression Comprehensive in Machine Learning. J. Appl. Sci. Technol. Trends 2020, 1, 140–147. [Google Scholar] [CrossRef]
- Zhang, D.; Khalili, A.; Asgharian, M. Post-Model-Selection Inference in Linear Regression Models: An Integrated Review. Stat. Surv. 2022, 16, 86–136. [Google Scholar] [CrossRef]
- Rath, S.; Tripathy, A.; Tripathy, A.R. Prediction of New Active Cases of Coronavirus Disease (COVID-19) Pandemic Using Multiple Linear Regression Model. Diabetes Metab. Syndr. Clin. Res. Rev. 2020, 14, 1467–1474. [Google Scholar] [CrossRef] [PubMed]
- Maydeu-Olivares, A.; Shi, D.; Fairchild, A.J. Estimating Causal Effects in Linear Regression Models with Observational Data: The Instrumental Variables Regression Model. Psychol. Methods 2020, 25, 243. [Google Scholar] [CrossRef]
- Wang, Z.; Wang, W. Concept Drift Detection Based on Kolmogorov–Smirnov Test. In Artificial Intelligence in China; Liang, Q., Wang, W., Mu, J., Liu, X., Na, Z., Chen, B., Eds.; Springer: Singapore, 2020; Volume 572, pp. 457–468. [Google Scholar] [CrossRef]
- Kyriazos, T.; Poga-Kyriazou, M. Applied Psychometrics: Estimator Considerations in Commonly Encountered Conditions in CFA, SEM, and EFA Practice. Psychology 2023, 14, 799–828. [Google Scholar] [CrossRef]
- Baharum, H.; Ismail, A.; Awang, Z.; McKenna, L.; Ibrahim, R.; Mohamed, Z.; Hassan, N.H. The Study Adapted Instruments Based on Confirmatory Factor Analysis (CFA) to Validate Measurement Models of Latent Constructs. Int. J. Environ. Res. Public Health 2023, 20, 2860. [Google Scholar] [CrossRef]
- Husain, H.; Aziz, H. Exploratory Factor Analysis (EFA) and Confirmatory Factor Analysis (CFA) to Measure the Validity and Reliability Constructs of Historical Thinking Skills, Tpack, and Application of Historical Thinking Skills. Int. J. Educ. Psychol. Couns. 2022, 7, 608–623. [Google Scholar] [CrossRef]
- Podsakoff, P.M.; Podsakoff, N.P.; Williams, L.J.; Huang, C.; Yang, J. Common Method Bias: It’s Bad, It’s Complex, It’s Widespread, and It’s Not Easy to Fix. Annu. Rev. Organ. Psychol. Organ. Behav. 2024, 11, 17–61. [Google Scholar] [CrossRef]
- Long, S.; Al Mamun, A.; Yang, Q.; Gao, J.; Hussain, W.M.H.W.; Shami, S.S.A.A. Modelling the Mass Adoption of Mobile Payment for E-Hailing Services Using SEM-MGA. PLoS ONE 2023, 18, e0287300. [Google Scholar] [CrossRef]
- Ibrahim, N.; Farinordin, F.A.; Mohamad, N.I.; Lee, U.H.M.S.; Ismail, A. Psychological Empowerment Link Using Employee Performance and Organizational Commitment on the Generation Gap: PLS-MGA Analysis. Gadjah Mada Int. J. Bus. 2024, 26, 23–53. [Google Scholar] [CrossRef]
- Ngah, A.H.; Kamalrulzaman, N.I.; Mohamad, M.; Grippa, T.; Niang Gadiaga, A.; Linard, C.; Lennert, M.; Vanhuysse, S.; Kalogirou, S. Do Science and Social Science Differ? Multi-Group Analysis (MGA) of the Willingness to Continue Online Learning. Qual. Quant. 2023, 57, 2957–2980. [Google Scholar] [CrossRef] [PubMed]
- Saleki, R.; Quoquab, F.; Mohammad, J. To Buy or Not to Buy Organic Food: Evaluating the Moderating Effect of Gender Using PLS-MGA. Int. J. Bus. Gov. Ethics 2021, 15, 106–127. [Google Scholar] [CrossRef]
- Salman, H.A.; Kalakech, A.; Steiti, A. Random Forest Algorithm Overview. Babylonian J. Mach. Learn. 2024, 69–79. [Google Scholar] [CrossRef]
- Sun, Z.; Wang, G.; Li, P.; Wang, H.; Zhang, M.; Liang, X. An Improved Random Forest Based on the Classification Accuracy and Correlation Measurement of Decision Trees. Expert Syst. Appl. 2024, 237, 121549. [Google Scholar] [CrossRef]
- Georganos, S.; Grippa, T.; Niang Gadiaga, A.; Linard, C.; Lennert, M.; Vanhuysse, S.; Kalogirou, S. Geographical Random Forests: A Spatial Extension of the Random Forest Algorithm to Address Spatial Heterogeneity in Remote Sensing and Population Modelling. Geocarto Int. 2019, 36, 121–136. [Google Scholar] [CrossRef]
- Ben Jabeur, S.; Stef, N.; Carmona, P. Bankruptcy Prediction Using the XGBoost Algorithm and Variable Importance Feature Engineering. Comput. Econ. 2023, 61, 715–741. [Google Scholar] [CrossRef]
Figure 1.
Proposed research model.
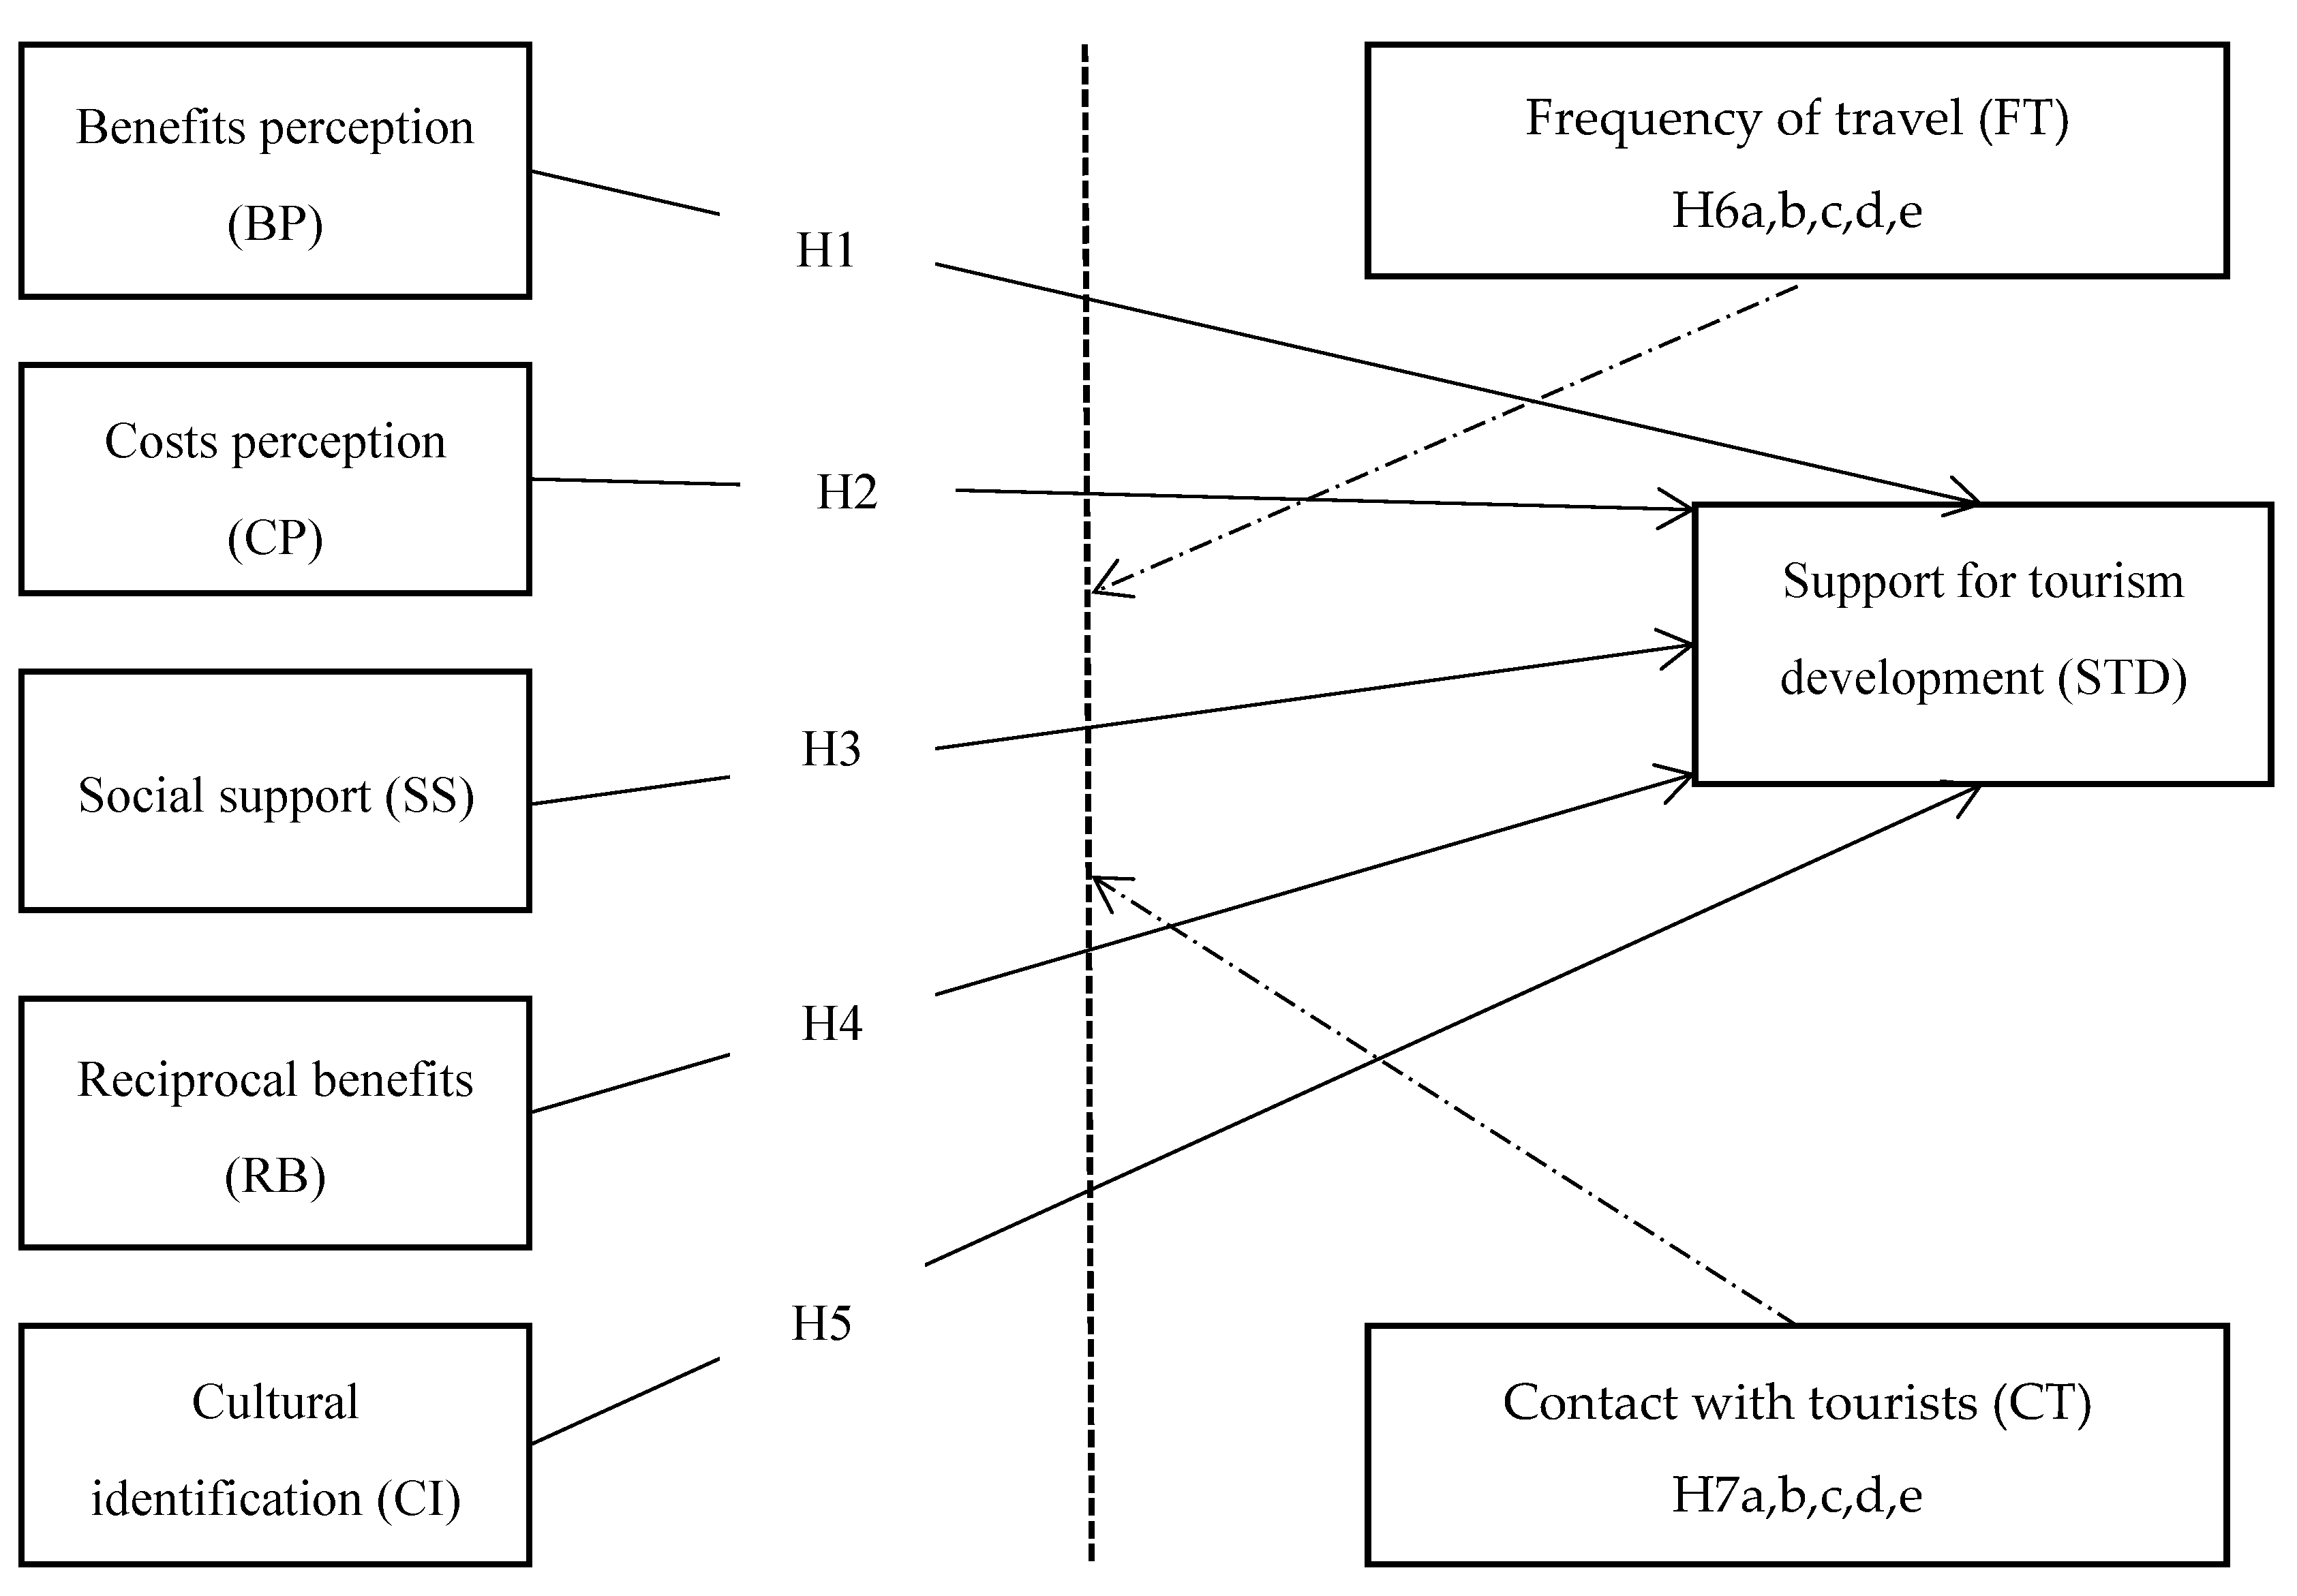
Figure 2.
Predicted growth of tourist arrivals in three selected countries until 2030.
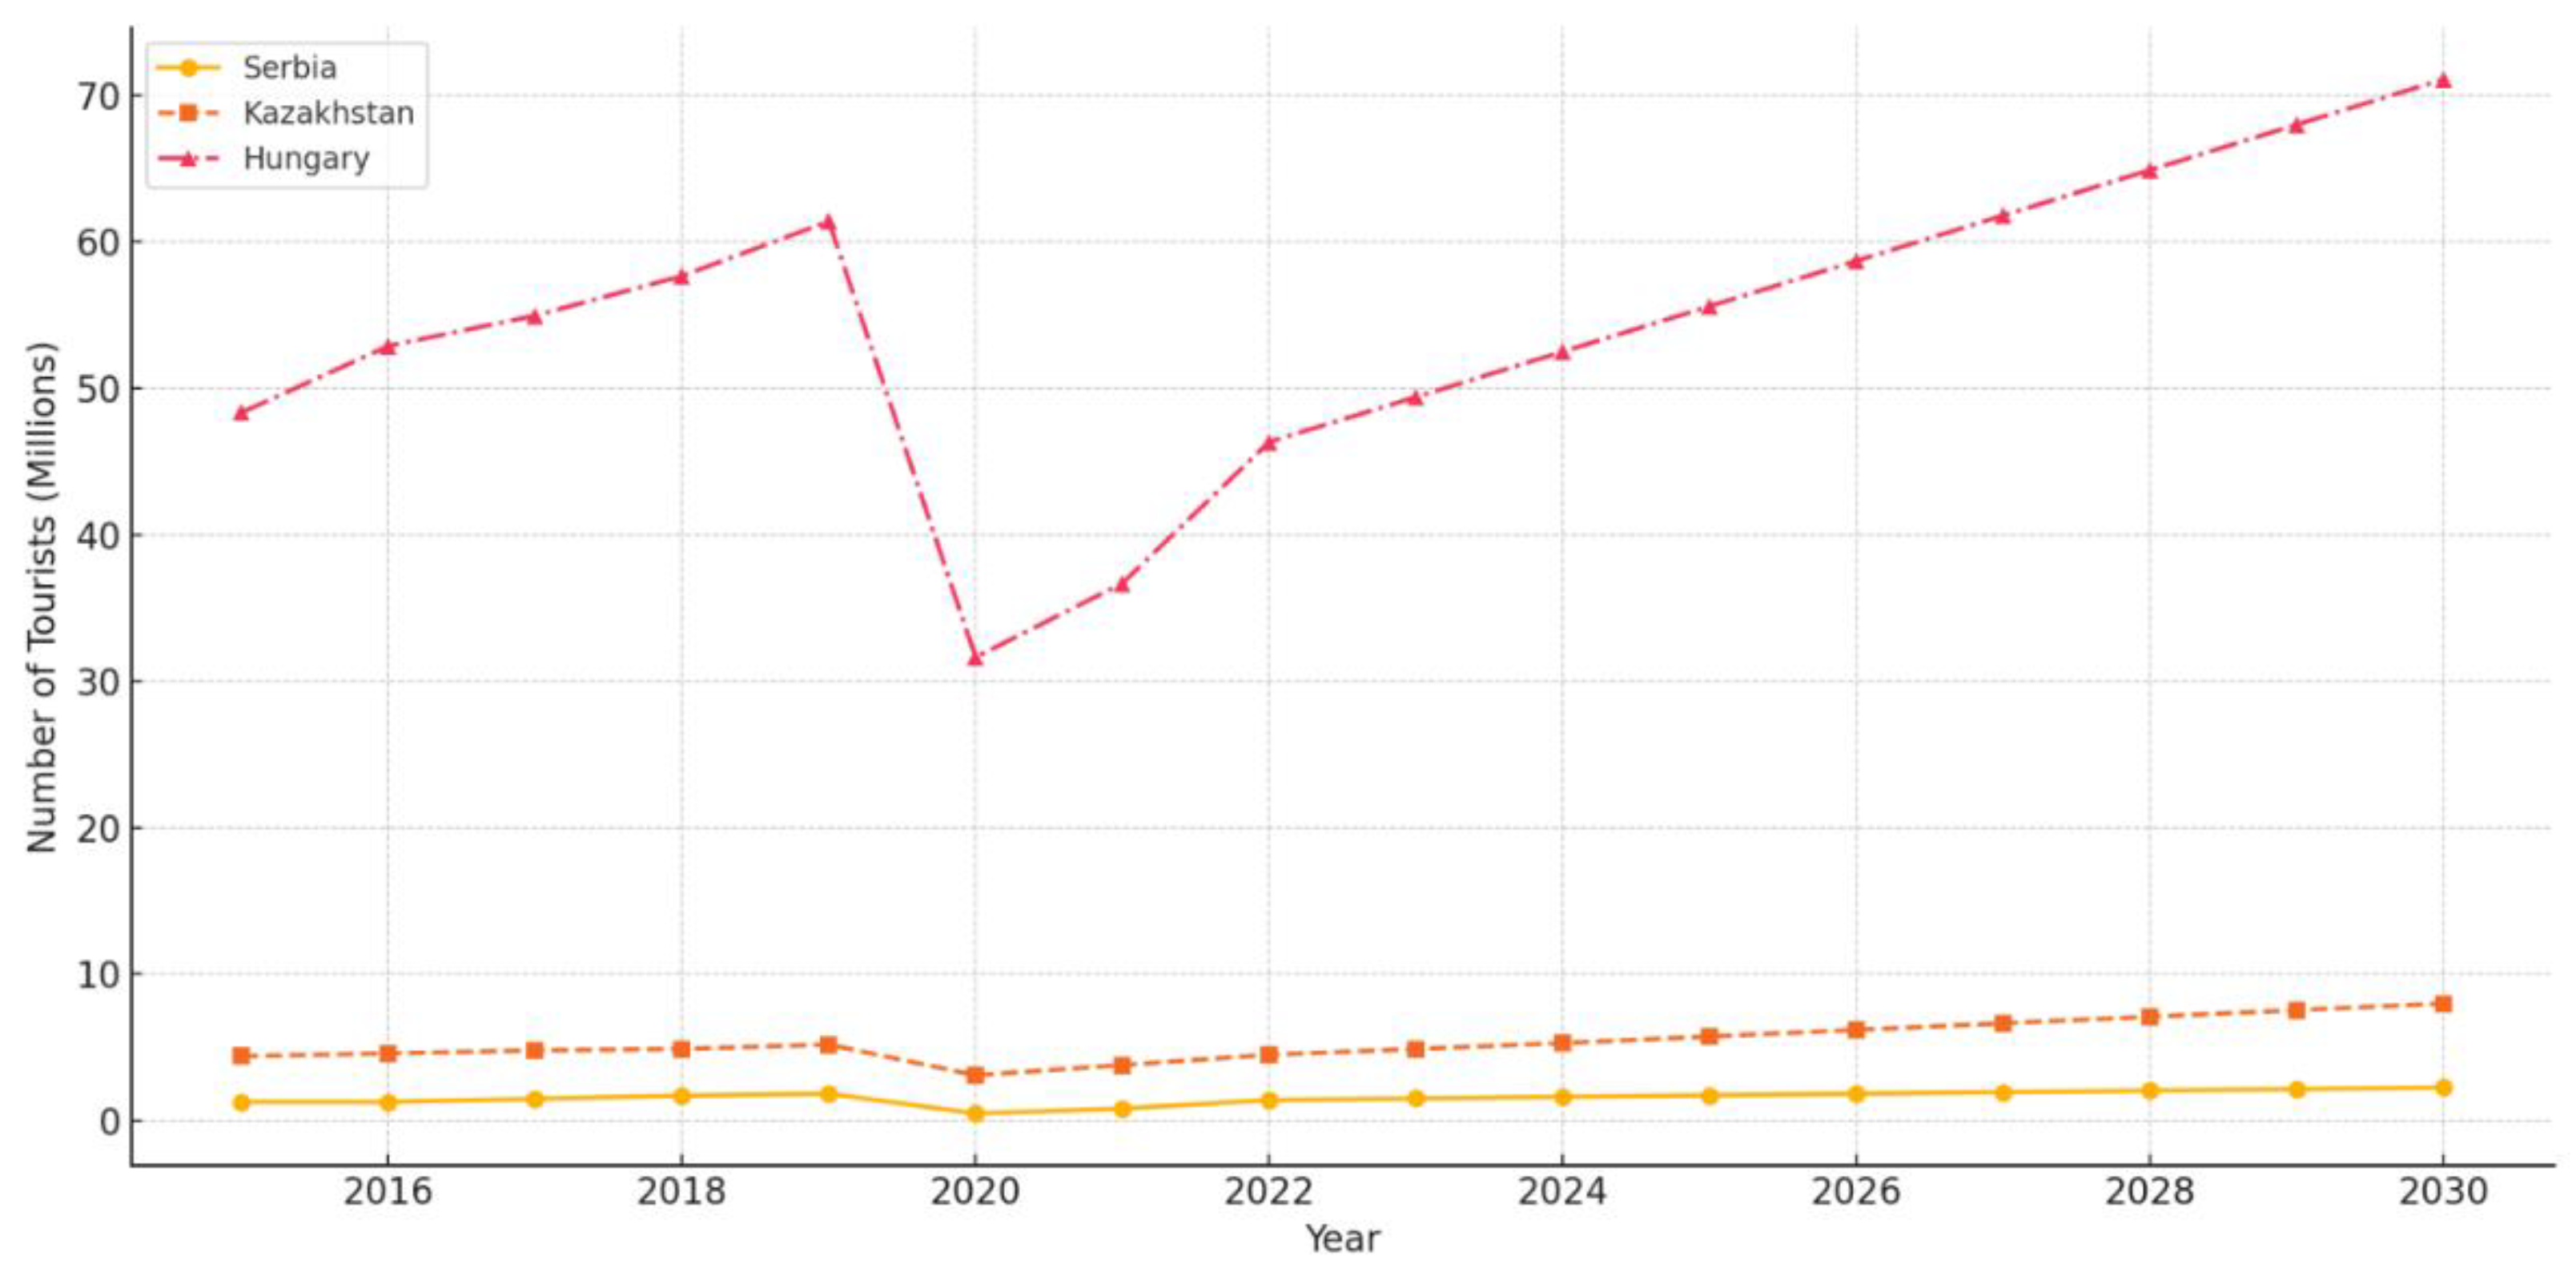
Figure 3.
ROC curve analysis for predicting perception Support tourism development.
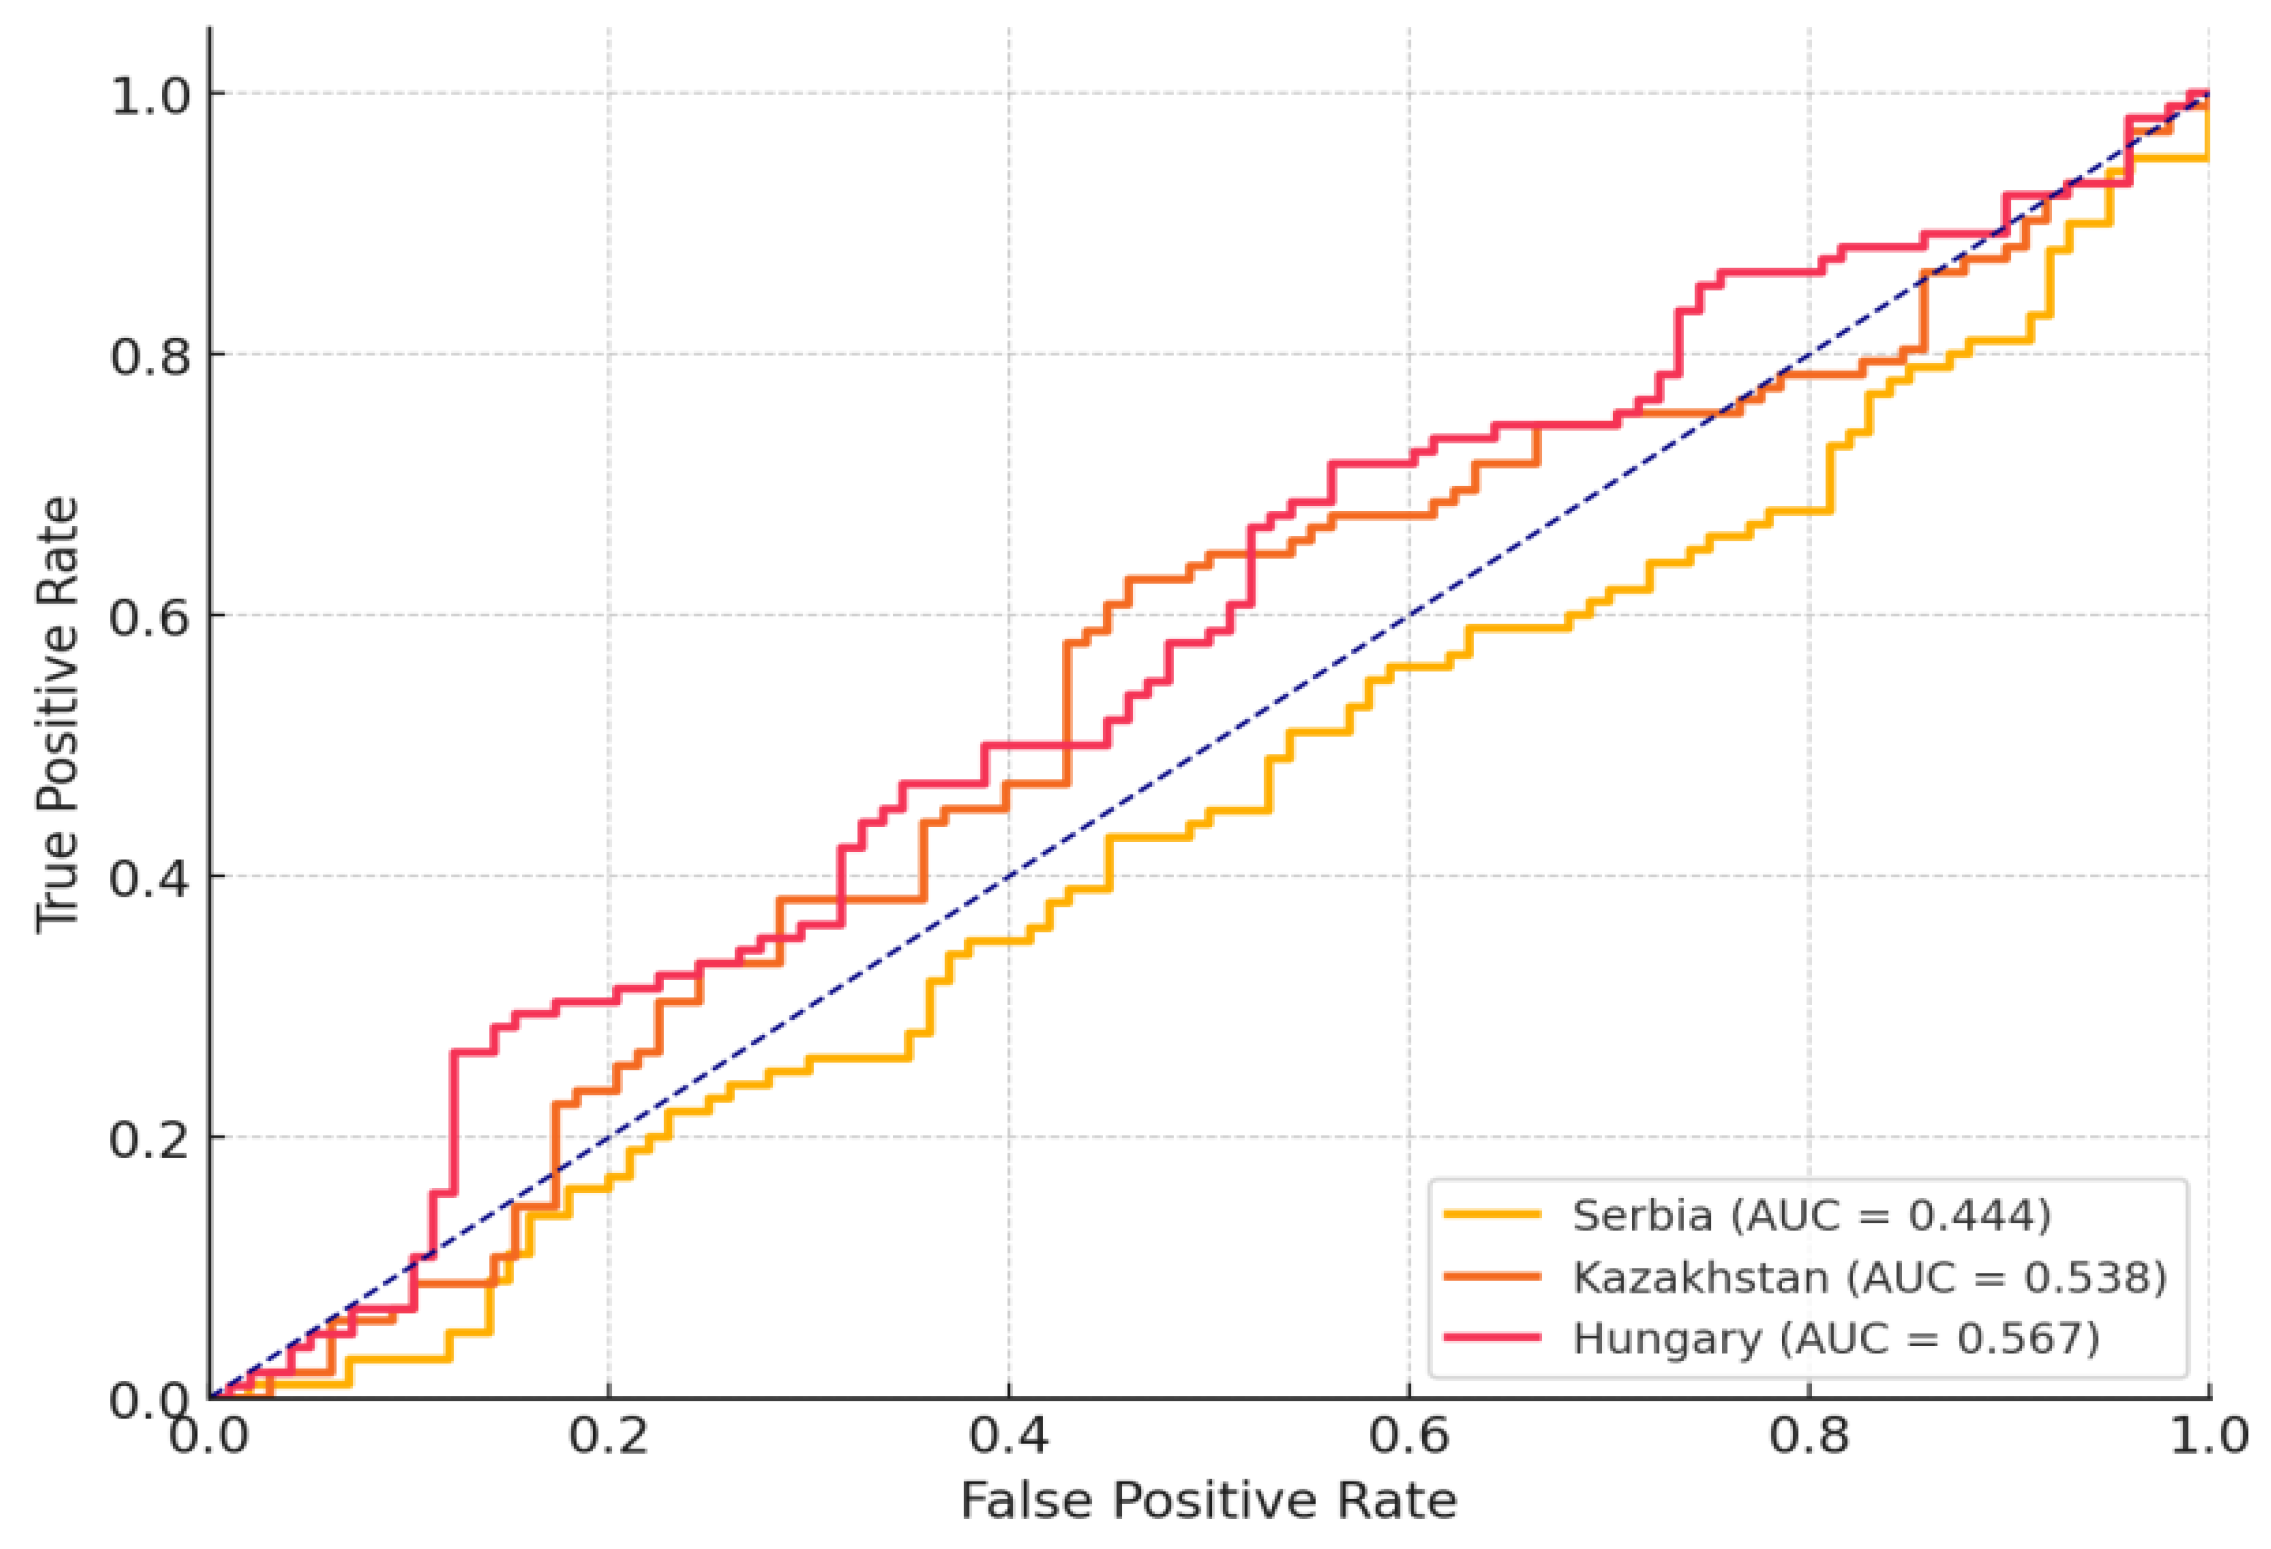
Figure 4.
SHAP value distribution.
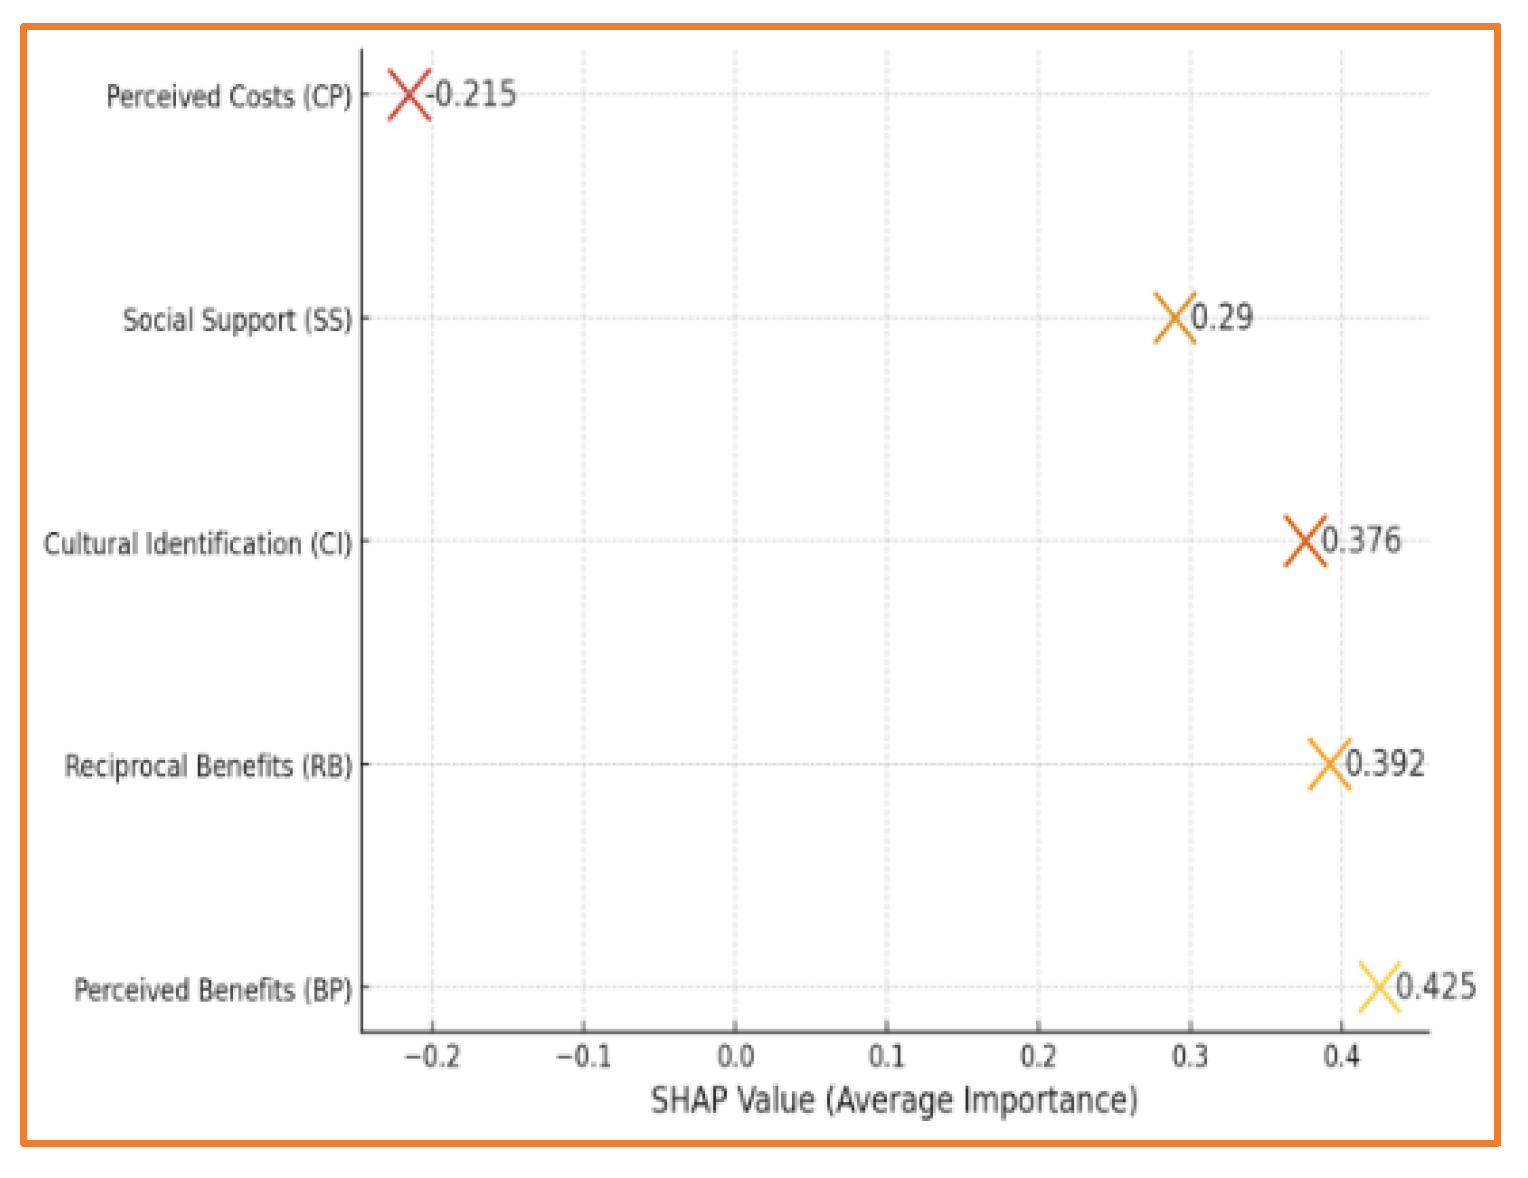
Figure 5.
Principal component analysis.
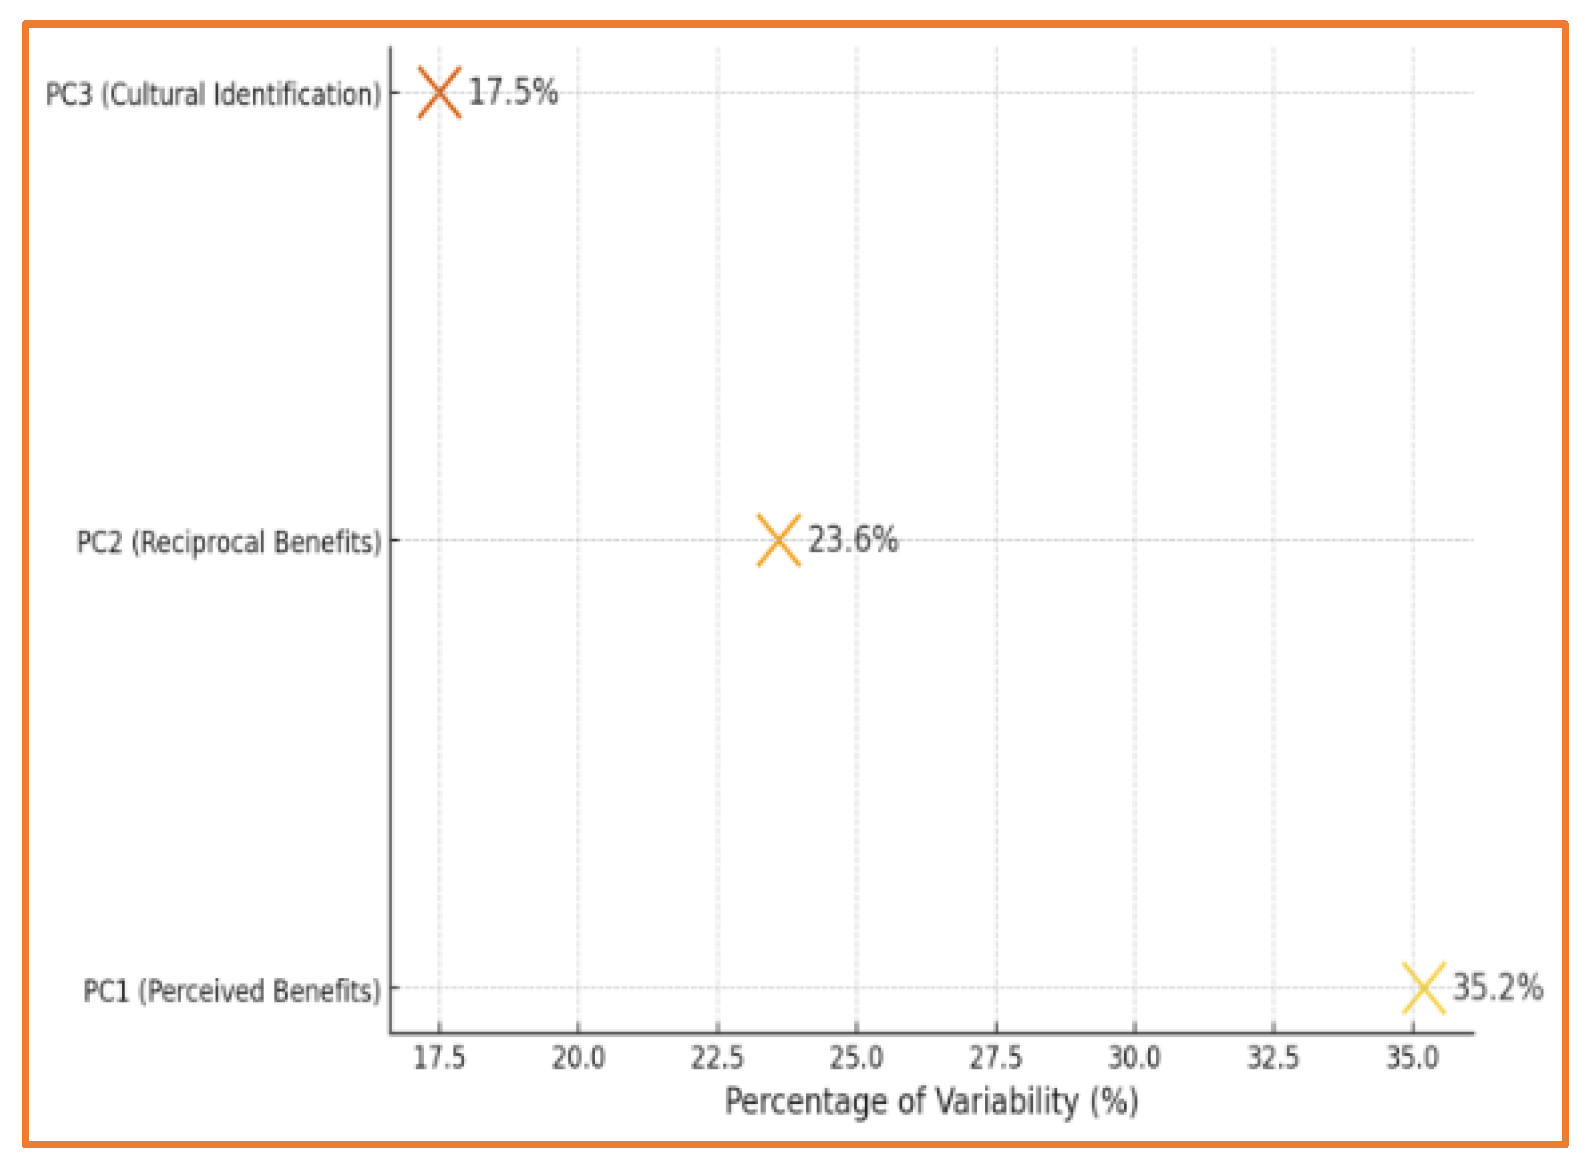

Table 1.
Respondents’ characteristics.
| Serbia (N = 472) | Kazakhstan (N = 465) | Hungary (N = 450) | Total (N = 1387) | |
|---|---|---|---|---|
| Gender | ||||
| Male | 217 (46.0%) | 212 (45.6%) | 204 (45.3%) | 633 (45.6%) |
| Female | 255 (54.0%) | 253 (54.4%) | 246 (54.7%) | 754 (54.4%) |
| Age | ||||
| 18-29 | 178 (37.7%) | 166 (35.7%) | 162 (36.0%) | 506 (36.5%) |
| 30-44 | 148 (31.4%) | 145 (31.2%) | 136 (30.2%) | 429 (30.9%) |
| 45-59 | 108 (22.9%) | 112 (24.1%) | 108 (24.0%) | 328 (23.6%) |
| 60+ | 38 (8.0%) | 42 (9.0%) | 44 (9.8%) | 124 (8.9%) |
| Education | ||||
| Primary education | 10 (2.1%) | 12 (2.6%) | 10 (2.2%) | 32 (2.3%) |
| Secondary education | 169 (35.8%) | 128 (27.5%) | 119 (26.4%) | 416 (30.0%) |
| Higher education | 293 (62.1%) | 325 (69.9%) | 321 (71.3%) | 939 (67.7%) |
| Employment | ||||
| Employed | 278 (58.9%) | 295 (63.4%) | 287 (63.8%) | 860 (62.0%) |
| Unemployed | 108 (22.9%) | 105 (22.6%) | 91 (20.2%) | 304 (21.9%) |
| Student | 86 (18.2%) | 65 (14.0%) | 72 (16.0%) | 223 (16.1%) |
| Income | ||||
| High | 24.5% | 30.4% | 40.5% | 31.8% |
| Medium | 50.2% | 50.2% | 46.3% | 48.9% |
| Low | 25.3% | 19.4% | 13.2% | 19.3% |
| Resident | ||||
| Urban | 65.3% | 70.5% | 78.9% | 71.5% |
| Rural | 34.7% | 29.5% | 21.1% | 28.5% |
| Frequency of travel | ||||
| More than 5 trips per year | 25.4% | 28.7% | 36.5% | 30.2% |
| 1 to 5 trips per year | 47.8%, | 48.5% | 44.2% | 46.8% |
| Less than 1 trip per year | 26.8% | 22.8% | 19.3% | 23.0% |
| Contact with tourists | ||||
| Yes | 40.2% | 52.1% | 59.3% | 50.5% |
| No | 59.8% | 47.9% | 40.7% | 49.5% |
Table 2.
Summary of constructs and variables derived from the theoretical framework.
| Construct | Theoretical Statements According to Social Exchange Theory | Adapted Statements for the Research | Relevant Authors |
|---|---|---|---|
| Benefits Perception (BP) |
People will support tourism if they perceive positive economic, social, or cultural benefits. | Tourism in my area contributes to economic development. Tourism improves the quality of local infrastructure. Tourism enhances cultural promotion and preservation. |
Homans [64]; Blau [65]; Gursoy & Rutherford [18]; Nunkoo & Ramkissoon [74]; Wang & Pfister [75];Chang et al. [76] |
| Costs Perception (CP) |
If perceived costs (pollution, overcrowding, economic inequality) outweigh the benefits, opposition to tourism arises. | Tourism causes an increase in real estate prices and services. Tourism negatively impacts the natural environment. Tourism disrupts the peace and privacy of residents. |
Blau [65]; Ap [66]; Harrill [77]; Diedrich & García-Buades [78]; Rasoolimanesh et al. [79], Kim et al. [80] |
| Social Support (SS) |
Positive relationships between the community and tourists strengthen support for tourism. | Local authorities adequately manage tourism development. Communication between local residents and tourists is positive. There is solidarity and cooperation within the community due to tourism. |
Homans [64]; Nunkoo & Ramkissoon [74]; Gursoy et al. [18]; Wang & Pfister [81]; Stylidis et al. [82]; Rizal et al. [83] |
| Reciprocal Benefits (RB) |
If the community is given the opportunity to benefit from tourism, it is more likely to support its development. | Tourism provides opportunities for employment and additional income. There are economic benefits for local residents from tourism. There is an opportunity to include local products in the tourism offer. |
Homans [64]; Gursoy & Rutherford [18]; Stylidis et al. [82]; Rasoolimanesh et al. [79], Ahmad et al. [84] |
| Cultural Identification (CI) |
If local culture is affirmed through tourism, support for its development increases. | Tourism helps preserve cultural heritage. Tourists show interest in local customs and traditions. Local culture is positively promoted through tourism. |
Blau [656]; Ap [66]; Gursoy et al. [18]; Stylidis et al. [82]; Rasoolimanesh et al. [79], Wang et al. [81]; Fan et al., [85] |
| Support for tourism development (STD) | Positive perceived benefits compared to costs lead to support for tourism development. | I support the further development of tourism in my area. I am willing to promote the tourism offer of my community. Tourism in my area is sustainable and contributes to overall well-being. |
Homans [64]; Blau [65]; Gursoy & Rutherford [18]; Nunkoo & Ramkissoon [74]; Rasoolimanesh et al. [79] |
Table 3.
Sample distribution for EFA and CFA by country.
| Country | Total number of respondents | EFA (30% of total sample) |
CFA (70% of total sample) |
|
|---|---|---|---|---|
| SRB | 527 | 158 | 369 | |
| KAZ | 569 | 171 | 398 | |
| HUN | 614 | 184 | 430 | |
Table 4.
Tourist Arrivals for the Period 2015–2023 (in millions).
| Year | Serbia (mil.) | Kazahstan (mil.) | Hungary (mil.) |
|---|---|---|---|
| 2015 | 1.281 | 6.430 | 48.345 |
| 2016 | 1.281 | 6.509 | 52.890 |
| 2017 | 1.497 | 7.701 | 54.962 |
| 2018 | 1.710 | 8.789 | 57.667 |
| 2019 | 1.847 | 8.515 | 61.397 |
| 2020 | 0.498 | 2.035 | 31.641 |
| 2021 | 0.819 | 3.100 | 36.688 |
| 2022 | 1.409 | 4.500 | 46.343 |
| 2023 | 1.519 | 4.900 | 49.403 |
Table 5.
Validation Parameters.
| Parameters | Serbia | Kazakhstan | Hungary |
|---|---|---|---|
| R² | 0.93 | 0.91 | 0.94 |
| AIC | 320.4 | 335.1 | 298.7 |
| BIC | 326.2 | 341.0 | 304.5 |
| RMSE | 0.05 | 0.06 | 0.04 |
| P-values | < 0.05 | < 0.05 | < 0.05 |
| Durbin-Watson | 1.98 | 2.01 | 1.95 |
Table 6.
Anticipated tourist arrivals (mil.).
| Year | Serbia | Kazakhstan | Hungary |
|---|---|---|---|
| 2015 | 1.281 | 4.4 | 48.345 |
| 2016 | 1.281 | 4.6 | 52.89 |
| 2017 | 1.497 | 4.8 | 54.962 |
| 2018 | 1.71 | 4.9 | 57.667 |
| 2019 | 1.847 | 5.2 | 61.397 |
| 2020 | 0.498 | 3.1 | 31.641 |
| 2021 | 0.819 | 3.8 | 36.688 |
| 2022 | 1.409 | 4.5 | 46.343 |
| 2023 | 1.519 | 4.9 | 49.403 |
| 2024 | 1.55 | 5 | 50 |
| 2025 | 1.6 | 5.1 | 52 |
| 2026 | 1.65 | 5.2 | 54 |
| 2027 | 1.7 | 5.3 | 56 |
| 2028 | 1.75 | 5.4 | 58 |
| 2029 | 1.8 | 5.5 | 60 |
| 2030 | 1.85 | 5.6 | 62 |
Table 7.
Results of What-if analysis.
| Year | Serbia Forecast | Serbia Increase 10% | Serbia Decrease 10% | Kazakhstan Forecast | Kazakhstan Increase 10% | Kazakhstan Decrease 10% | Hungary Forecast | Hungary Increase 10% | Hungary Decrease 10% |
|---|---|---|---|---|---|---|---|---|---|
| 2025 | 1600 | 1760 | 1440 | 5000 | 5500 | 4500 | 50000 | 55000 | 45000 |
| 2026 | 1700 | 1870 | 1530 | 5200 | 5720 | 4680 | 52000 | 57200 | 46800 |
| 2027 | 1800 | 1980 | 1620 | 5400 | 5940 | 4860 | 54000 | 59400 | 48600 |
| 2028 | 1900 | 2090 | 1710 | 5600 | 6160 | 5040 | 56000 | 61600 | 50400 |
| 2029 | 2000 | 2200 | 1800 | 5800 | 6380 | 5220 | 58000 | 63800 | 52200 |
| 2030 | 2100 | 2310 | 1890 | 6000 | 6600 | 5400 | 60000 | 66000 | 54000 |
Table 8.
Values of descriptive and factor analysis.
| Construct | Item | SRB (m) | SRB (sd) | SRB (α) | SRB (λ) | KAZ (m) | KAZ (sd) | KAZ (α) | KAZ (λ) | HUN (m) | HUN (sd) | HUN (α) | HUN (λ) |
|---|---|---|---|---|---|---|---|---|---|---|---|---|---|
| BP | Tourism in my area contributes to economic development. | 4.312 | 0.627 | 0.829 | 0.741 | 4.198 | 0.721 | 0.872 | 0.719 | 4.407 | 0.602 | 0.883 | 0.751 |
| Tourism improves the quality of local infrastructure. | 4.158 | 0.721 | 0.806 | 0.802 | 4.011 | 0.789 | 0.812 | 0.734 | 4.478 | 0.684 | 0.844 | 0.765 | |
| Tourism enhances cultural promotion and preservation. | 4.476 | 0.602 | 0.853 | 0.752 | 4.215 | 0.733 | 0.863 | 0.787 | 4.536 | 0.671 | 0.813 | 0.769 | |
| CP | Tourism causes an increase in real estate prices and services. | 3.269 | 0.893 | 0.850 | 0.708 | 3.198 | 0.912 | 0.804 | 0.702 | 3.389 | 0.856 | 0.827 | 0.731 |
| Tourism negatively impacts the natural environment. | 3.429 | 0.756 | 0.869 | 0.684 | 3.312 | 0.781 | 0.834 | 0.689 | 3.476 | 0.792 | 0.893 | 0.711 | |
| Tourism disrupts the peace and privacy of local residents. | 3.501 | 0.804 | 0.806 | 0.793 | 3.408 | 0.841 | 0.800 | 0.761 | 3.523 | 0.822 | 0.866 | 0.755 | |
| SS | Local authorities adequately manage tourism development. | 3.972 | 0.845 | 0.837 | 0.768 | 3.882 | 0.892 | 0.856 | 0.755 | 4.014 | 0.831 | 0.884 | 0.772 |
| Communication between local residents and tourists is positive. | 4.001 | 0.674 | 0.834 | 0.798 | 4.007 | 0.667 | 0.821 | 0.794 | 4.058 | 0.689 | 0.838 | 0.812 | |
| There is solidarity and cooperation within the community due to tourism. | 4.088 | 0.737 | 0.814 | 0.752 | 4.116 | 0.704 | 0.877 | 0.777 | 4.171 | 0.723 | 0.829 | 0.789 | |
| RB | Tourism provides opportunities for employment and additional income. | 4.237 | 0.532 | 0.879 | 0.781 | 4.123 | 0.598 | 0.867 | 0.768 | 4.267 | 0.512 | 0.881 | 0.784 |
| There are economic benefits for local residents from tourism. | 4.112 | 0.678 | 0.809 | 0.731 | 4.109 | 0.654 | 0.867 | 0.751 | 4.214 | 0.645 | 0.819 | 0.772 | |
| There is an opportunity to include local products in the tourism offer. | 4.145 | 0.739 | 0.855 | 0.792 | 4.189 | 0.724 | 0.867 | 0.785 | 4.299 | 0.701 | 0.858 | 0.811 | |
| CI | Tourism helps preserve cultural heritage. | 4.265 | 0.692 | 0.862 | 0.783 | 4.142 | 0.715 | 0.870 | 0.772 | 4.381 | 0.674 | 0.878 | 0.795 |
| Tourists show interest in local customs and traditions. | 4.203 | 0.724 | 0.841 | 0.769 | 4.098 | 0.752 | 0.854 | 0.751 | 4.295 | 0.712 | 0.861 | 0.784 | |
| Local culture is positively promoted through tourism. | 4.312 | 0.676 | 0.851 | 0.788 | 4.221 | 0.702 | 0.863 | 4.312 | 0.676 | 0.851 | 0.788 | 4.221 | |
| STD | I support the further development of tourism in my area. | 4.276 | 0.609 | 0.915 | 0.824 | 4.241 | 0.632 | 0.923 | 0.817 | 4.315 | 0.611 | 0.918 | 0.828 |
| I am willing to promote the tourism offer of my community. | 4.231 | 0.621 | 0.904 | 0.837 | 4.294 | 0.617 | 0.906 | 0.839 | 4.398 | 0.603 | 0.903 | 0.841 | |
| Tourism in my area is sustainable and contributes to overall well-being. | 4.318 | 0.642 | 0.900 | 0.801 | 4.307 | 0.659 | 0.908 | 0.792 | 4.389 | 0.632 | 0.944 | 0.813 |
Table 9.
Assessment of construct validity.
| Construct | m | sd | α | Eigenvalues | % Variance | Cumulative % | CR | AVE |
|---|---|---|---|---|---|---|---|---|
| Serbia | ||||||||
| BP | 4.282 | 0.650 | 0.889 | 3.428 | 34.28% | 34.28% | 0.912 | 0.783 |
| CP | 3.399 | 0.822 | 0.856 | 2.945 | 29.45% | 63.73% | 0.879 | 0.701 |
| SS | 4.020 | 0.786 | 0.872 | 2.177 | 21.77% | 85.50% | 0.891 | 0.732 |
| RB | 4.187 | 0.624 | 0.879 | 1.902 | 19.02% | 94.52% | 0.874 | 0.711 |
| CI | 4.134 | 0.703 | 0.884 | 1.510 | 15.10% | 96.12% | 0.886 | 0.720 |
| STD | 4.304 | 0.621 | 0.915 | 1.305 | 13.05% | 98.23% | 0.918 | 0.750 |
| Kazakhstan | ||||||||
| BP | 4.190 | 0.621 | 0.878 | 3.601 | 36.01% | 36.01% | 0.910 | 0.741 |
| CP | 3.450 | 0.789 | 0.860 | 2.801 | 28.01% | 64.02% | 0.882 | 0.795 |
| SS | 4.030 | 0.790 | 0.874 | 2.340 | 23.40% | 87.42% | 0.893 | 0.734 |
| RB | 4.210 | 0.612 | 0.882 | 1.935 | 19.35% | 96.77% | 0.877 | 0.713 |
| CI | 4.150 | 0.702 | 0.880 | 1.710 | 17.10% | 98.87% | 0.888 | 0.742 |
| STD | 4.315 | 0.615 | 0.919 | 1.400 | 14.00% | 99.91% | 0.921 | 0.781 |
| Hungary | ||||||||
| BP | 4.312 | 0.609 | 0.890 | 3.750 | 37.50% | 37.50% | 0.916 | 0.748 |
| CP | 3.462 | 0.810 | 0.865 | 2.954 | 29.54% | 67.04% | 0.884 | 0.706 |
| SS | 4.040 | 0.772 | 0.880 | 2.400 | 24.00% | 91.04% | 0.895 | 0.755 |
| RB | 4.222 | 0.601 | 0.886 | 1.950 | 19.50% | 98.54% | 0.889 | 0.764 |
| CI | 4.210 | 0.710 | 0.892 | 1.540 | 15.40% | 98.84% | 0.894 | 0.723 |
| STD | 4.328 | 0.605 | 0.921 | 1.315 | 13.15% | 100.00% | 0.923 | 0.773 |
Table 9.
Correlation analysis values.
| Constructs | BP | CP | SS | RB | STD | CI |
|---|---|---|---|---|---|---|
| Serbia | ||||||
| BP | 1.000 | 0.467 | 0.492 | 0.528 | 0.553 | 0.507 |
| CP | 0.467 | 1.000 | 0.425 | 0.413 | 0.398 | 0.374 |
| SS | 0.492 | 0.425 | 1.000 | 0.462 | 0.444 | 0.472 |
| RB | 0.528 | 0.413 | 0.462 | 1.000 | 0.535 | 0.494 |
| STD | 0.553 | 0.398 | 0.444 | 0.535 | 1.000 | 0.519 |
| CI | 0.507 | 0.374 | 0.472 | 0.494 | 0.519 | 1.000 |
| Kazakhstan | ||||||
| BP | CP | SS | RB | STD | CI | |
| BP | 1.000 | 0.455 | 0.482 | 0.520 | 0.548 | 0.504 |
| CP | 0.455 | 1.000 | 0.416 | 0.409 | 0.395 | 0.371 |
| SS | 0.482 | 0.416 | 1.000 | 0.467 | 0.455 | 0.478 |
| RB | 0.520 | 0.409 | 0.467 | 1.000 | 0.531 | 0.499 |
| STD | 0.548 | 0.395 | 0.455 | 0.531 | 1.000 | 0.512 |
| CI | 0.504 | 0.371 | 0.478 | 0.499 | 0.512 | 1.000 |
| Hungary | ||||||
| BP | CP | SS | RB | STD | CI | |
| BP | 1.000 | 0.459 | 0.497 | 0.537 | 0.562 | 0.522 |
| CP | 0.459 | 1.000 | 0.423 | 0.416 | 0.403 | 0.377 |
| SS | 0.497 | 0.423 | 1.000 | 0.475 | 0.463 | 0.480 |
| RB | 0.537 | 0.416 | 0.475 | 1.000 | 0.548 | 0.515 |
| STD | 0.562 | 0.403 | 0.463 | 0.548 | 1.000 | 0.528 |
| CI | 0.522 | 0.377 | 0.480 | 0.515 | 0.528 | 1.000 |
Table 10.
Predictive power and effects on Support for tourism development.
| Country | Construct | R² | Q² | f² | Direct Effect | Indirect Effect | Total Effect |
|---|---|---|---|---|---|---|---|
| Serbia | STD | 0.718 | 0.521 | 0.467 | 0.532 | 0.124 | 0.656 |
| Kazakhstan | STD | 0.704 | 0.513 | 0.442 | 0.521 | 0.118 | 0.639 |
| Hungary | STD | 0.729 | 0.529 | 0.472 | 0.545 | 0.127 | 0.672 |
Table 11.
Hypothesis testing and path analysis.
| Construct | Serbia | Kazahstan | Hungary | ||||||||||||
|---|---|---|---|---|---|---|---|---|---|---|---|---|---|---|---|
| β | m | sd | t | p | β | m | sd | t | p | β | m | sd | t | p | |
| BP → STD | 0.371 | 4.282 | 0.650 | 8.453 | 0.000 | 0.367 | 4.282 | 0.621 | 8.342 | 0.000 | 0.372 | 4.312 | 0.650 | 8.478 | 0.000 |
| CP → STD | -0.203 | 3.399 | 0.822 | -3.249 | 0.012 | -0.215 | 3.399 | 0.789 | -3.521 | 0.010 | -0.208 | 3.462 | 0.822 | -3.410 | 0.011 |
| SS → STD | 0.338 | 4.020 | 0.786 | 6.721 | 0.000 | 0.341 | 4.020 | 0.790 | 6.725 | 0.000 | 0.347 | 4.040 | 0.786 | 6.856 | 0.000 |
| RB → STD | 0.282 | 4.187 | 0.624 | 5.104 | 0.005 | 0.276 | 4.187 | 0.612 | 5.211 | 0.004 | 0.284 | 4.222 | 0.624 | 5.318 | 0.005 |
| CI → STD | 0.297 | 4.105 | 0.699 | 5.567 | 0.002 | 0.299 | 4.105 | 0.674 | 5.761 | 0.002 | 0.305 | 4.300 | 0.699 | 5.812 | 0.002 |
| BP × Mod-FT → STD | 0.173 | 4.150 | 0.654 | 4.022 | 0.004 | 0.148 | 4.150 | 0.635 | 3.289 | 0.009 | 0.162 | 4.310 | 0.654 | 3.870 | 0.007 |
| BP × Mod-CT → STD | 0.214 | 4.220 | 0.672 | 4.261 | 0.005 | 0.191 | 4.220 | 0.671 | 3.710 | 0.012 | 0.204 | 4.320 | 0.672 | 4.134 | 0.006 |
| CP× Mod-FT → STD | -0.127 | 3.199 | 0.801 | -2.149 | 0.032 | -0.135 | 3.199 | 0.799 | -2.385 | 0.026 | -0.122 | 3.400 | 0.801 | -2.352 | 0.041 |
| CP Mod-CT → STD | -0.101 | 3.402 | 0.812 | -2.021 | 0.047 | -0.114 | 3.402 | 0.811 | -2.073 | 0.038 | -0.109 | 3.410 | 0.812 | -2.091 | 0.050 |
| SS× Mod-FT → STD | 0.187 | 4.060 | 0.772 | 4.321 | 0.003 | 0.178 | 4.060 | 0.780 | 3.953 | 0.008 | 0.196 | 4.030 | 0.772 | 4.572 | 0.004 |
| SS Mod-CT → STD | 0.201 | 4.115 | 0.784 | 4.565 | 0.004 | 0.194 | 4.115 | 0.770 | 4.120 | 0.007 | 0.209 | 4.050 | 0.784 | 4.800 | 0.005 |
| RB × Mod-FT → STD | 0.176 | 4.200 | 0.621 | 4.221 | 0.006 | 0.158 | 4.200 | 0.619 | 3.986 | 0.009 | 0.181 | 4.230 | 0.621 | 4.324 | 0.005 |
| RB × Mod-CT → STD | 0.193 | 4.250 | 0.632 | 4.521 | 0.005 | 0.183 | 4.250 | 0.625 | 4.222 | 0.007 | 0.190 | 4.270 | 0.632 | 4.511 | 0.006 |
| CI × Mod-FT → STD | 0.168 | 4.180 | 0.675 | 4.112 | 0.008 | 0.175 | 4.180 | 0.662 | 4.007 | 0.006 | 0.179 | 4.290 | 0.675 | 4.124 | 0.008 |
| CI × Mod-CT → STD | 0.202 | 4.210 | 0.681 | 4.634 | 0.004 | 0.198 | 4.210 | 0.671 | 4.512 | 0.005 | 0.194 | 4.310 | 0.681 | 4.488 | 0.004 |
Table 12.
MGA analysis.
| Construct | Δβ (SRB-KAZ) | Δt (SRB-KAZ) | Δp (SRB-KAZ) | Significance (SRB-KAZ) | Δβ (SRB-HUN) | Δt (SRB-HUN) | Δp (SRB-HUN) | Significance (SRB-HUN) | Q² (SRB) | Q² (KAZ) | Q² (HUN) | f² (SRB) | f² (KAZ) | f² (HUN) |
|---|---|---|---|---|---|---|---|---|---|---|---|---|---|---|
| BP → STD | 0.004 | 2.789 | 0.006 | Significant | 0.007 | 2.901 | 0.005 | Significant | 0.282 | 0.276 | 0.298 | 0.315 | 0.309 | 0.328 |
| CP → STD | 0.012 | 2.853 | 0.005 | Significant | 0.015 | 3.012 | 0.004 | Significant | 0.198 | 0.191 | 0.204 | 0.192 | 0.186 | 0.194 |
| SS → STD | 0.008 | 2.762 | 0.007 | Significant | 0.009 | 2.801 | 0.006 | Significant | 0.310 | 0.305 | 0.318 | 0.334 | 0.328 | 0.339 |
| RB → STD | 0.017 | 2.945 | 0.004 | Significant | 0.016 | 2.910 | 0.005 | Significant | 0.241 | 0.238 | 0.249 | 0.222 | 0.218 | 0.227 |
| CI → STD | 0.019 | 2.971 | 0.004 | Significant | 0.015 | 2.923 | 0.004 | Significant | 0.289 | 0.283 | 0.295 | 0.308 | 0.302 | 0.313 |
| BP × Mod-FT → STD | 0.021 | 3.012 | 0.003 | Significant | 0.018 | 2.981 | 0.003 | Significant | 0.262 | 0.257 | 0.269 | 0.291 | 0.284 | 0.296 |
| BP × Mod-CT → STD | 0.016 | 2.902 | 0.004 | Significant | 0.014 | 2.875 | 0.005 | Significant | 0.275 | 0.270 | 0.282 | 0.294 | 0.287 | 0.298 |
| CP × Mod-FT → STD | 0.020 | 3.005 | 0.003 | Significant | 0.019 | 2.992 | 0.003 | Significant | 0.216 | 0.210 | 0.223 | 0.238 | 0.232 | 0.244 |
| CP × Mod-CT → STD | 0.018 | 2.974 | 0.004 | Significant | 0.017 | 2.951 | 0.004 | Significant | 0.203 | 0.198 | 0.209 | 0.219 | 0.214 | 0.223 |
| SS × Mod-FT → STD | 0.022 | 3.103 | 0.002 | Significant | 0.020 | 3.067 | 0.002 | Significant | 0.307 | 0.302 | 0.314 | 0.336 | 0.330 | 0.341 |
| SS × Mod-CT → STD | 0.015 | 2.865 | 0.005 | Significant | 0.014 | 2.832 | 0.005 | Significant | 0.298 | 0.292 | 0.303 | 0.318 | 0.312 | 0.325 |
| RB × Mod-FT → STD | 0.019 | 3.022 | 0.003 | Significant | 0.018 | 3.009 | 0.003 | Significant | 0.248 | 0.242 | 0.258 | 0.232 | 0.227 | 0.240 |
| RB × Mod-CT → STD | 0.020 | 3.045 | 0.002 | Significant | 0.021 | 3.078 | 0.002 | Significant | 0.256 | 0.250 | 0.265 | 0.235 | 0.230 | 0.240 |
| CI × Mod-FT → STD | 0.018 | 2.984 | 0.004 | Significant | 0.017 | 2.952 | 0.004 | Significant | 0.295 | 0.290 | 0.305 | 0.310 | 0.305 | 0.320 |
| CI × Mod-CT → STD | 0.019 | 3.012 | 0.003 | Significant | 0.020 | 3.089 | 0.002 | Significant | 0.308 | 0.302 | 0.318 | 0.328 | 0.322 | 0.340 |
Table 13.
Random forest metrics.
| Metric | Serbia | Kazakhstan | Hungary |
|---|---|---|---|
| Accuracy | 0.875 | 0.868 | 0.872 |
| Precision | 0.843 | 0.839 | 0.846 |
| Recall | 0.856 | 0.850 | 0.860 |
| F1-score | 0.849 | 0.844 | 0.853 |
| AUC-ROC | 0.892 | 0.888 | 0.895 |
Table 14.
Variable importance analysis.
| Variables | Serbia (Importance) | Kazakhstan (Importance) | Hungary (Importance) |
|---|---|---|---|
| Benefits Perception (BP) | 0.218 | 0.207 | 0.223 |
| Costs Perception (CP) | 0.164 | 0.157 | 0.166 |
| Social Support (SS) | 0.204 | 0.198 | 0.209 |
| Reciprocal Benefits (RB) | 0.189 | 0.186 | 0.191 |
| Cultural Identification (CI) | 0.225 | 0.223 | 0.211 |
Table 15.
Confusion matrix.
| Actual / Predicted | Positive (STD) | Negative (STD) |
|---|---|---|
| Positive (STD) | 782 | 118 |
| Negative (STD) | 124 | 764 |
Table 16.
K-means clustering.
| Cluster | Sample | Dominant Characteristics |
|---|---|---|
| 1 | 480 | Highly positive perceptions of benefits |
| 2 | 525 | Balanced perceptions of benefits and costs |
| 3 | 382 | Negative perceptions due to high costs |
Disclaimer/Publisher’s Note: The statements, opinions and data contained in all publications are solely those of the individual author(s) and contributor(s) and not of MDPI and/or the editor(s). MDPI and/or the editor(s) disclaim responsibility for any injury to people or property resulting from any ideas, methods, instructions or products referred to in the content. |
© 2025 by the authors. Licensee MDPI, Basel, Switzerland. This article is an open access article distributed under the terms and conditions of the Creative Commons Attribution (CC BY) license (http://creativecommons.org/licenses/by/4.0/).
Copyright: This open access article is published under a Creative Commons CC BY 4.0 license, which permit the free download, distribution, and reuse, provided that the author and preprint are cited in any reuse.


