
Submitted:
28 July 2025
Posted:
29 July 2025
You are already at the latest version
Abstract
Breast cancer is the most commonly diagnosed cancer worldwide, with high rates of distant metastasis. While circulating tumor cells (CTCs) are the disseminatory units of metastasis and are indicative of a poor prognosis, CTC heterogeneity within individual patients, between breast cancer subtypes, and between primary and metastatic tumors within a patient obscures the relationship between CTCs and disease progression. EpCAM, its homologue Trop2, and a pan-Cytokeratin marker were evaluated to determine their contributions to CTC presence and clustering behavior over the study period. We conducted a systematic longitudinal analysis of 51 breast cancer patients during the course of their treatment to deepen our understanding of CTC contributions to breast cancer progression. Methods: 305 total blood samples from 51 metastatic breast cancer (mBC) patients were included in the study. Patients received diverse treatment schedules based on discretion of the practicing oncologist. Patients were monitored from July 2020 to March 2023, with blood samples collected at scheduled care appointments. Nucleated cells were isolated, imaged, and analyzed using Rarecyte® technology, and statistical analysis was performed in R using the lmerTest and lme4 packages, as well as in Graphpad Prism version 10.4.1. Results: Both classical CTCs (DAPI+, EpCAM+, CK+, CD45-) and Trop2+ CTCs were detected in the blood of breast cancer patients. A high degree of correlation was found between CTC biomarkers, and CTC expression of EpCAM, Trop2, and the presence of CD45+ cells all predicted cluster size, while Pan-CK did not. Furthermore, while analyses of biomarkers by receptor status revealed no significant differences between HR+, HER2+, and TNBC patients, longitudinal analysis found evidence for discrete trajectories of EpCAM, Trop2, and clustering behaviors between HR+ and HER2+ cancers after diagnosed metastasis. Conclusions: Correlation and longitudinal analysis revealed that EpCAM, Trop2, and CD45+ cells were predictive of CTC cluster presence and size, and highlighted distinct trajectories of biomarker change over time between HR+ and HER2+ cancers following metastatic diagnosis.
Keywords:
EpCAM
; Trop2
; CTC
; CTC cluster
; breast cancer
; metastasis
; liquid biopsy Cytokeratin
; CD45
1. Introduction
Breast cancer is the most frequently diagnosed cancer in the world, and results in an estimated 685,000 deaths every year, with this burden projected to increase substantially over the next two decades [1,2]. While great strides have been made with increasingly potent and specific chemotherapeutics such as antibody-drug conjugates [3,4], treatment remains challenging because breast cancer is a heterogeneous disease spanning diverse subtypes, each with differing biomarker expression, prognoses, and metastatic capacities [5,6,7]. However, across breast cancer and all cancer types, 90% of deaths are due to distant metastasis from the primary tumor [8,9].
Breast cancers are classified based on expression of the estrogen receptor (ER), the progesterone receptor (PR), and human epidermal growth factor receptor2 (HER2). In particular, tumors are often grouped into three categories: hormone receptor positive in the absence of HER2 expression (HR+), HER2-expressing in the presence or absence of hormone receptor expression (HER2+), or negative for all three biomarkers (triple negative, or TNBC). HR+ cancers carry the best prognosis and are targeted by many well-established therapeutics [10,11]. While HER2+ cancers are more aggressive and carry a higher metastatic load, anti-HER2 therapies are successfully applied in the clinic [12,13]. TNBC is the most aggressive and least-treatable subtype, with a 5-year mortality rate of 40%, a median survival time of 13.3 months after metastatic diagnosis, and recurrence rate as high as 25% [3,14,15].
Regardless of subtype, metastasis spreads via circulating tumor cells (CTCs), which disseminate from the primary tumor through the vasculature to secondary sites where they enter dormancy and/or trigger distant metastasis. Breast cancer CTCs are classically defined as CD45-, EpCAM+, and Cytokeratin 8/18/19+ (classical CTCs or cCTCs), and this definition has yielded important insights into how CTC shedding predicts survivorship [16]. EpCAM is a transmembrane glycoprotein with homeostatic roles in the maintenance of epithelial barrier integrity, while elevated EpCAM expression within solid tumors is associated with poor prognosis [17]. EpCAM is a central regulator in many critical tumorigenic processes, including cell proliferation, adhesion, and migration [12,17,18], and has been explored as a druggable target in many solid tumors. For example, efficacy of CAR-T cell immunotherapy targeting EpCAM has recently been demonstrated [19].
Cytokeratins (CK) are intermediate filament proteins known to regulate structural integrity of epithelial cells, and in addition to being markers for classical CTCs, are also widely overexpressed within solid breast tumors and associated with poor survivorship [20,21]. Cytokeratins 8 and 18 (CK8 and CK18) are co-expressed in healthy mammary glands, and while their expression in tumor tissue negatively correlates with rates of recurrence, ER status, and tumor grade, CK8/18 are expressed by breast cancer CTCs [21]. CK19 has roles in cell-adhesion, motility, maintenance of epithelial morphology, is linked to recurrence, and is also expressed by breast cancer CTCs [20,21,22,23]. Curiously, despite their shared presence on breast cancer CTCs, overexpression of CK18 and CK19 in tumor tissues correlate in opposite directions with disease progression, though this may differ by subtype [24]. Like EpCAM, CK18 and CK19 are both reliable diagnostic markers in addition to being promising therapeutic targets [19,20,21].
Despite advances made using the classical CTC paradigm, it is also clear that many metastasis-competent CTCs do not fit the classical definition. For example, downregulation of EpCAM and Cytokeratins (CK) in CTCs is known to be associated with a mesenchymal subtype, as is upregulation of Vimentin [25,26]. While the epithelial-to-mesenchymal transition (EMT) is typically seen as a key step in metastatic progression, it is not a requirement for breast cancer lung metastasis, and within-tumor heterogeneity in EMT status may confer complementary benefits as non-EMT cells are metastatically competent and EMT cells can facilitate chemoresistance and recurrence at metastatic sites [27].
Furthermore, certain tumor-specific markers such as HER2 or EGFR may not be present in CTCs due to tumor heterogeneity, early dissemination, epigenetic changes, and/or drug-induced selection events [5,25,28]. Indeed, biomarker discordance between CTCs and the tumors they shed from have frequently been documented [25,28,29,30]. For these reasons, expansion of biomarker-based classifications, biomarker-agnostic approaches such as microfluidics based on size/deformability/density, and negative depletion of CD45+ immune cells are employed to cast a wider net in characterizing neoplastic cells outside of classical CTC classification ([25,31,32,33,34]. To this aim, recent research from our lab and others have highlighted EpCAM’s only homologue Trop2 [7,35,36], (also known as EpCAM2) as a promising CTC biomarker and target in aggressive and otherwise untreatable HER2+ and TNBC diseases [3,4]. Trop2 shares many functions with EpCAM, including stabilization of tight junction proteins and oncogenic roles in proliferation, adhesion, and migration [37,38], however they also undergo distinct post-translational modifications, show different patterns of expression in healthy and cancerous tissues [39,40], and while both allow for cell contractility, they may play discrete roles in finetuning adhesion and migration [41].
EpCAM and Trop2 themselves promote homophilic cell adhesion in addition to their role in stability tight-junction Claudins of healthy epithelia and neoplastic cells [37,38], and due to the potential relevance of these mechanisms in CTC motility, further longitudinal studies utilizing large datasets are necessary to unravel the underlying complexity of EpCAM’s role in CTC dissemination [17,18,40,42]. Indeed, some evidence suggests that despite EpCAM’s known roles as an adhesion molecule, surface expression can also impair adhesion [18].
CTCs in blood travel as single cells, clusters of homotypic CTCs, or in close association with CD45+ immune cells, platelets, or cancer-associated fibroblasts. Evidence suggests diverse benefits of clustering with stromal and immune cells, including immune evasion, anoikis resistance, resistance to shear- and oxidative stress, and 20-100x improved metastatic competency relative to single CTCs [6,43,44,45]. Additionally, non-tumor cells associated with CTCs may be a potent source of growth factors and cytokines which eventually aid in the establishment of the distant pre-metastatic niche [43,44,46]. While EpCAM and Trop2 are relatively weak cell adhesion molecules compared to the classical junction proteins such as E-Cadherin [17], this may be an advantage for forming clusters with tumor-resident immune cells prior to invasion of the surrounding connective tissue. EpCAM and/or Trop2 expression may allow for transient but stable cell-cell contacts to be maintained in the absence of contact inhibition and polarization, allowing increased motility and migratory capacity to co-occur with protection from stressors conferred by cluster formation [6,43,44,45]. This intermediate state with both epithelial and metastatic characteristics is a known trait of CTC clusters and may undergird successful survival in the blood stream and eventual dissemination [27,34,47,48,49].
Over a 32-month period, we collected and enumerated Trop2+ (T2CTCs) and cCTCs in an unbiased way, notably from the blood of breast cancer patients of all subtypes, covering diverse treatment regimens and metastatic stages. 205 blood samples from 51 patients were included in the cCTC dataset, with 100 blood samples from 26 patients in the T2CTC dataset, totaling over 6,000 output images for scoring. We undertook correlative analysis and longitudinal analysis via linear mixed effects modelling in order to illuminate the roles of CK8/18/19, the EpCAM family, and CD45+ cells in CTC clustering. We hypothesized that EpCAM, Trop2, and CK would all significantly predict CTC cluster presence and size, as well as diversity of available sites for distant metastasis.
2. Materials and Methods
2.1. Study Design and Participants
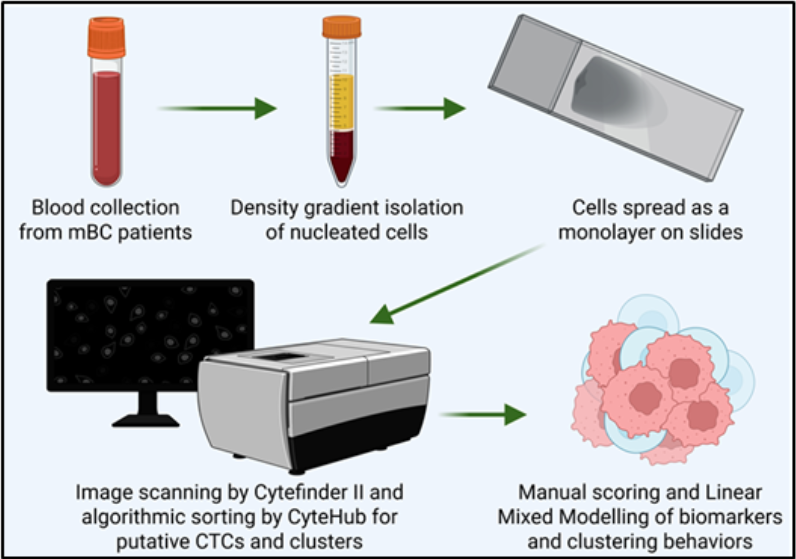
Patients with metastatic breast cancer provided informed consent in accordance with IRB protocols, and all patient identities were anonymized prior to receipt by our technicians. Blood was collected into sodium-EDTA tubes and all blood samples began processing within 4 hours of retrieval. Patient parameters for the classical and Trop2 CTC datasets are shown in Table 1 and Table 2.
2.2. RareCyte® Sample Processing, Scanning, and Analysis
Upon receipt of patient blood in EDTA tubes, blood was incubated, fractionated, and mounted per the manufacturer’s instructions. In brief, a maximum of 7.5 mL of blood was transferred to an AccuCyte® Blood Collection Tube for a period of 24-48 hours prior to processing. Blood was then removed from the collection tubes and dispensed into the AccuCyte Separation Tube, centrifuged to remove red blood cells and enrich for nucleated cells. An additional round of centrifugation isolated the nuclear cell layer into cell isolation fluid (RareCyte, Seattle, WA, USA, 24-1090-002), which was applied as a monolayer to a microscope slide using the Cytespreader Slide Preparation Device®. Slide-mounted
Classical CTCs were stained according using the RareCyte Rareplex 0700-MA staining protocol, while Trop2+ CTCs were stained according to the Rareplex 1200-MA staining protocol, with a final concentration of 1:100 of anti-Trop2 antibody (ECM Biosciences, Aurora, CO, USA, TM0051). All slides were scanned using the Cytefinder II® imaging platform and analyzed with CyteHub® software. Images output by CytHub were then quality-checked by trained technicians to confirm classification as individual CTCs and/or clusters. Figure 1A,B show representative CyteHub output images from the 0700-MA and 1200-MA staining procedures from HR+ and HER2-expressing cancers, respectively. Figure 1C shows an image of an exceptionally large CTC cluster from a HER2-expressing cancer, originally captured by CyteHub® and subsequently imaged via confocal microscopy.
2.3. Confocal Imaging
High-resolution confocal imaging of the cluster in Figure 1C was performed on the Zeiss LSM 800 Airyscan using the 63x oil objective.
2.4. Endpoints and Assessments
Because of staggered periods of enrollment and differing frequency of sample availability from each patient, a clear clinical endpoint was not set. Rather, each patient was analyzed relative to their initial diagnosis date with mBC as well as diagnosis dates for each unique metastatic disease. Clinical parameters and diagnosis dates were provided by the practicing oncologist. Sample receipt and analysis spanned from July 2020 through March 2023.
2.5. Statistical Analysis
Due to non-normality and zero-skewing in the patient biomarker datasets, data were base 2 log-transformed after the addition of 1 to each original observation. Correlation coefficient (r) values are listed, and correlation analysis was performed alongside linear regressions for all biomarker pairs, as shown in Figures 2 and 3. The classical CTC (cCTC) and Trop2+ CTC (T2CTC) dataset each evaluated 8 biomarkers, however the cCTC dataset includes EpCAM and pan-CK on different fluorophores, the T2CTC dataset does not, because the 1200-MA staining requires that EpCAM and CK be measured with the same fluorophore. Longitudinal data analysis was performed based on a linear regression model with random coefficients according to the formula Y = a + b x t + ε, where a represents the initial biomarker value, decomposed into a fixed effect a0, and a random effect a1, while b represents the slope, decomposed into b0 and b1 as above. Both datasets were fitted to the full model described above to determine if biomarker trajectories differed by receptor status (HR+ and HER2+), as there were not sufficient patients or collection events to include TNBC in the longitudinal analysis. In the full model, the intercept a0 and slope b0 differ between the two receptor statuses. Where evidence was insufficient to detect differences by receptor status, data was fitted to a reduced model to determine if the slope was significantly non-zero for each biomarker value over the analysis period. In the reduced model, the intercept a0 but not the slope b0 differ by receptor status. Longitudinal analysis was performed with the date of each patient’s first diagnosis with metastatic breast cancer standardized as time 0. For longitudinal analysis by metastatic site, time 0 represents each patient’s diagnosis with metastasis to the indicated site. All statistical analysis was performed in R using the lmerTest and lme4 packages. Data visualization for Figure 4 was performed in Graphpad Prism version 10.4.1. We used the markdown-file tool implemented in R for coding and creating dynamic documentation in statistical analysis to ensure scientific rigor and reproducibility.
2.6. Data Availability
Data are available upon request but are not publicly available for protection of patient privacy.
3. Results
3.1. RareCyte Reveals Expression of Trop2 in Breast Cancer Patient CTCs and High Inter-Marker Correlation
Analysis of breast cancer patient blood by RareCyte technology revealed the clear presence of c-CTCs (EpCAM+, PanCK+, CD45-, Figure 1A) as well as the presence of T2CTCs (Figure 1B,C). Additionally, both classical and T2CTCs were found as singlets and in homotypic and heterotypic cluster configurations (Figure 1A–C).
As expected, correlation analysis revealed a high degree of correlation between a majority of the included CTC biomarkers. Figures 2 and 3 list biomarkers in the diagonals, with each box on the lower left representing scatter plots with the regression line of the two biomarkers in the same row and column, and each box in the upper right representing the correlation coefficient of the same two biomarkers in that same row and column, symmetrically about the diagonal. The tables included in both figures list all strong correlations (those with an r ≥ 0.7). In the cCTC dataset (Figure 2), expression of EpCAM and the presence of CD45+ cells in cluster with CTCs were highly predictive of both cluster presence and size (highlighted in red text), with a correlation coefficient of 0.78 between EpCAM+ CTCs and the presence of CD45+ cells. No strong correlations were observed between pan-Cytokeratin expression and any of the other evaluated biomarkers.
Likewise in the T2CTC dataset, cluster presence and size was highly correlated with the presence of CD45+ cells, as well as by positivity for the CK/EpCAM channel jointly with Trop2 (Figure 3). Together this data strongly suggests that the EpCAM family and CD45+ cells are facilitative of CTC cluster formation and intravasation to the blood of breast cancer patients.
3.2. No Individual CTC Biomarker Condition Was Significantly Associated with Receptor Status
In order to determine whether patterns of individual biomarker expression were associated with a particular receptor status, we compared biomarker values across all patients in both the cCTC (Figure 4 A-D) and T2CTC datasets (Figure 4E-F). In cases where patients had more than 1 sample analyzed, each patient is represented by the average value for each biomarker to avoid pseudo-replication. ANOVA revealed all associations to be non-significant. Results are shown in Table 1 (cCTC) and 2 (T2CTC).
3.3. Longitudinal Analysis Reveals Differences in Clustering Behavior Between HR+ and HER2+ Cancers
In order to determine whether biomarkers changed over the course of multiple measures, we performed longitudinal analysis on HR+ and HER2+ patients for both the cCTC (Figures 5–7) and T2CTC datasets (Figure 5) by linear mixed modelling. Figure 5A-F show spaghetti plots [50] with trendlines for clustering behaviors in the cCTC dataset, with those for EpCAM in G and H. Full model results are shown in Table 3.
EpCAM and the number of clusters containing 2 or more cells (Clusters >2) showed statistically significant differences, (p = 0.02183 and p= 0.00691, respectively) in slope between HR+ and HER2+ cancers, indicating different biomarker rates of change over time between receptor subtypes. In particular, analysis indicates that these two parameters increased over time in HER2+ cancers during the analysis period relative to first metastatic diagnosis, while there is no significant change with time in HR+ cancers. Clusters showed marginal significance (p= 0.0675) in the same direction, and all other comparisons were non-significant.
Figure 6A-F show spaghetti plots with trendlines for clustering behaviors in the T2CTC dataset, with those for Trop2 in G and H. Full model results are shown in Table 4. All comparisons by receptor status were non-significant.
To determine if biomarker trajectories over time differed by metastatic site, independent models were employed for each of four metastatic sites: brain, liver, bone, and lungs. The model for each metastatic site included analysis of all biomarkers, with clustering behaviors and EpCAM-family expression shown in Figure 7 for the cCTC dataset and in Figure 8 for the T2CTC dataset. Complete results for the full and reduced models for each metastatic site in the cCTC dataset are shown in Table S1 and T2CTCs in Table S2. In the cCTC dataset, the full model found no significant differences between HR+ and HER2+ cancers by metastatic site. The cCTC reduced model found that relative to first diagnosis of lung metastasis, Clusters >2 (p = 0.07211), CD45 in cluster (p = 0.07763) had marginally non-zero slopes. Relative to diagnosis with bone metastasis, slopes for Clusters >2 (p = 0.06979) and CD45 in cluster (0.09091) were marginally non-zero. Relative to diagnosis with brain metastasis, Clusters >2 (0.07983) were marginally non-zero. Likewise for liver metastasis, Clusters >2 per ml (p = 0.08623).
In the T2CTC dataset, a baseline effect of Trop2 expression was found for the bone metastatic condition (p = 0.04255), with a marginally significant difference in slope between those with bone metastasis and without (p = 0.05163). Clusters >2 was significant both at baseline (p = 0.00882), and with respect to slope (p = 0.02084), indicating an increase in larger clusters over time after diagnosis with brain metastasis. The reduced model found marginally non-zero slopes by lung metastasis for Clusters (p = 0.08503) and by brain meta-stasis for CD45 in Cluster (p = 0.07605). All other comparisons were non-significant across both datasets.
4. Discussion
Due to their roles as epithelial cell adhesion molecules, the EpCAM family has long been suspected to play a fundamental role in CTC invasion, intravasation, circulation, dissemination, and eventual metastasis, though their mechanisms of action during tumor progression have remained elusive. EpCAM is employed as the primary discriminating diagnostic marker in breast cancers, and decades of study have confirmed its salience in predicting overall survival and progression free survival [12,42]. With the rationale of discriminating CTC heterogeneity and the widely acknowledged need to expand biomarker criteria in CTC identification, we incorporated EpCAM homologue Trop2 in our analyses, and our results indicate that EpCAM and Trop2 have overlapping but distinct roles in CTC shedding, clustering, and homing to distant metastatic sites. In support of this hypothesis, both EpCAM+ CTCs and Clusters >2 increased after first metastasis in HER2+ cancers but not HR+, suggesting discrete evolutionary trajectories in CTC clustering behavior between the receptor statuses.
While the full cCTC model comparing trajectories of biomarkers between HR+ and HER2+ disease did not find any significant association between metastatic site and biomarker status, the full T2CTC model did find a significant baseline effect of Trop2 expression and a marginally significant difference in slope between receptor statuses after diagnosis with bone metastasis. While the smaller size of the T2CTC dataset relative to the cCTC dataset does warrant caution, the results suggest that shedding of Trop2+ CTCs may be a feature of bone metastatic disease. Additionally, larger clusters (those with greater than 2 cells) differed both at baseline and by slope between receptor subtypes after diagnosis with brain metastasis, suggesting that larger cluster size corresponds more to brain metastasis in HER2+ disease than in HR+. The reduced cCTC models by metastatic status revealed marginally non-zero slopes for Clusters >2 and clustering with CD45+ cells after diagnosis with lung bone metastasis, as well as for Clusters >2 for brain and liver metastasis. The reduced T2CTC model found marginally non-zero slopes for cluster present after diagnosis with lung metastasis and CD45+ immune cells in clusters after brain metastasis.
Taken together, modelling by metastatic site suggest that certain sites are predisposed to shedding larger heterotypic clusters containing CD45+ cells. Larger clusters are known to be associated with poor prognosis [34,51], and prior research from our group has demonstrated a transcriptomic signature underlying breast cancer brain metastasis [52]. Importantly, to our knowledge this is the first study using patient-derived CTCs to tie specific CTC cluster configurations with specific organ metastatic sites [53]. Although recent investigations on organotropism of breast cancer subtypes has been performed with cell lines using microfluidic chips, SKBR3, the Trop2-high, HER2-expressing cell line employed, did not show substantial bone organotropism [54].
Contrary to our hypothesis, while the pan-cytokeratin marker targeting CK8/9/19 was detected in many patients, it did not correlate strongly (r > 0.7) with any other CTC biomarker or clustering behavior. This is surprising given the role of CKs in maintenance of cell morphology and in particular the role of CK19 in cell-cell adhesion. However, this mechanism is mediated by E-Cadherin, which is frequently lost in the partial EMT state [20,21]. Because CK19-E-cadherin interactions result in stronger cell adhesion and cell polarization that may impede clustering and migration, the relationships between clustering behaviors and EpCAM and Trop2 may be due to their ability to mediate both homophilic adhesion and tight-junction mediated adhesion, allowing simultaneously for cytoskeletal flexibility, maintenance of a depolarized state, and preservation of cell-cell contacts. EpCAM+ CTCs expressing low levels of CK/8/18/19 correspond with decreased overall survival [21,55]. Our results suggest that this could be a function of clustering behaviors in the hybrid EMT state. This hypothesized dual role in clustering behavior is consistent with the partial/hybrid EMT phenotype which may confer the plasticity found in the most metastatically competent CTC clusters [5,27,28,34,35,51,56], and further underscores the complexity of oncogenic patterns of differentiation and dedifferentiation. Indeed, while CK19-KO cells have improved motility, they are less able to form tumor mammospheres [22], suggesting a complex role whereby they are not integral to invasion and cluster formation, but may aid in guiding structured micrometastasis upon dissemination.
Our analysis of biomarker values by subtype did not reveal any significant associations, although all biomarker values for a given patient were averaged in this analysis to avoid pseudoreplication. Given high inter- and intra-patient heterogeneity in circulating EpCAM+ cells shown here (Figures 5 and ) and elsewhere [42], use of averaged values may have obscured underlying patterns that differed by receptor subtype.
Conversely, our longitudinal analysis, which incorporates intra-patient heterogeneity in CTC biomarkers, revealed that biomarker trajectories did in fact differ significantly between subtypes (Figure 5 and Table 3). Furthermore, as previous investigations yielded conflicting reports as to how CTC number and presence differs between subtypes [25,28,29,30,42], we suggest that this disparity may in part be explained by high intra-patient heterogeneity, discrete biomarker trajectories between subtypes, and unaccounted-for EpCAM-negative CTCs.
Correlational analysis also revealed CD45+ cell presence in clusters also correlated with cluster size, independent of EpCAM and Trop2 expression. While CD45+ cells may be more likely to develop connections to larger clusters in a probabilistic manner, and the EpCAM family may have an indirect effect on CD45+ cells clustering with tumor cells mediated by greater cluster size, our analysis cannot establish a causal link between CD45+ cells in clusters with EpCAM+ and Trop2+ CTCs. However, EpCAM is capable of mediating homotypic interactions between the intestinal epithelia and epithelia-resident lymphocytes [18,57], which is highly suggestive of a possible role in cluster formation prior to dissemination.
There are limitations to this study. First, the smaller size of the T2CTC dataset and the marginal significance of the results by metastatic site merit caution, however given the consistency of the effect patterns despite the substantial confounds due to tumor heterogeneity and treatment status, we contend these effects reveal an underlying mechanism. Second, while our data suggest that EpCAM and Trop2 play roles in the presence and size of CTC clusters, there are other known biomarkers involved in cluster formation unaccounted for in our dataset, including plakoglobin [6], CD44 [56], and ICAM [56]. CK19’s interactions with plakoglobin and E-Cadherin are complex and context-dependent, further complicating interpretation. Third, some known bidirectional molecular interactions such as those between HER2 and CK19 [21,58] are not analyzable in our datasets due to our use of the pan-CK marker which stains CK8, CK18, and CK19. Finally, CK19 may serve to impair or facilitate metastasis depending on cancer stage [22].
Altogether, our results illustrate the critical roles of EpCAM and Trop2 in CTC clustering behavior after metastatic diagnosis, giving clarity to a clinical literature largely confounded by inter- and intra-patient heterogeneity in CTC shedding and clustering behavior. Further studies are needed to interrogate the roles of EpCAM and Trop2, and in particular whether their actions in Claudin stabilization and homophilic adhesion differentially regulate CTC cluster formation and metastatic competency.
5. Conclusions
CTC shedding is a complex process, and given the rarity of CTCs and the further rarity of metastatically competent CTCs and CTC clusters, our work is an important first step in unravelling the mechanisms underlying successful metastasis. Correlation and longitudinal analyses revealed that EpCAM, Trop2, and CD45 expression were highly predictive of cluster presence and size, and highlighted distinct trajectories of biomarker change over time between HR+ and HER2+ cancers. By incorporating analysis of EpCAM, Trop2, and CK8/18/19, we were able to shed light on the roles of these CTC markers in clustering and metastatic trajectories, finding that EpCAM and Trop2, but not CK, significantly affected clustering behavior and distant metastasis. Future studies can build on our research to illuminate the mechanistic roles of EpCAM, Trop2 and the partial EMT in CTC clustering and organotropism, in turn yielding clinically actionable strategies to undermine the competency of these deadly metastatic seeds.
Supplementary Materials
The following supporting information can be downloaded at the website of this paper posted on Preprints.org.
Author Contributions
“Conceptualization, S.D.M. and D.M.; methodology S.D.M and H.K; software, H.K. and S.D.M.; validation, S.DM, H.K., D.M.; formal analysis, H.K. and S.D.M.; investigation, S.D.M., H.K., U.B.G., D.M.; resources, U.B.G. and D.M; data curation, S.D.M. and H.K.; writing—original draft preparation, S.D.M.; writing—review and editing, S.D.M and D.M.; visualization, S.D.M and H.K.; supervision, D.M.; project administration, S.D.M and D.M..; funding acquisition, D.M. All authors have read and agreed to the published version of the manuscript.
Funding
This research was supported by NIH grant 1RO1 CA193213, by Project Translational Award from UNM Comprehensive Cancer Center, by NIH CTCS Award to DM, and by UNM Comprehensive Cancer Center Support grant (NCI P30CA118100), partially supporting the Bionformatics Shared Resource.
Institutional Review Board Statement
The study was conducted in accordance with the Declaration of Helsinki, and approved by the Institutional Review Board (or Ethics Committee) of University of New Mexico (protocol code HRRC#19-513 and HRRC#15-507, November 1, 2019).
Informed Consent Statement
All patients diagnosed with metastatic breast cancer (mBC) undergoing active cancer treatment gave signed written consent to provide blood samples per UNM IRB – approved protocols HRRC #15-507 and HRRC #19-513.
Data Availability Statement
Data are available upon request but are not publicly available for protection of patient privacy.
Acknowledgments
The authors have reviewed and edited the output and take full responsibility for the content of this publication. Thanks to Elizabeth R. Raby, Ankita Z. Schwarting, Rhudovic R. Rhamos, Shelby R. Kenny, and Christine M. Pauken for assisting with sample collection, processing, and analysis.
Conflicts of Interest
The authors declare no conflicts of interest.
Abbreviations
The following abbreviations are used in this manuscript:
| CTC | Circulating Tumor Cell |
| cCTC | Classically defined Circulating Tumor Cell |
| T2CTC | Trop2-expressing Circulating Tumor Cell |
| mBC | Metastatic Breast Cancer |
| TCCP | Total Cancer Care Protocol |
| CK | Cytokeratin |
| EpCAM | Epithelial Cell Adhesion Molecule |
| HER2 | Human epidermal growth factor receptor 2 |
| EGFR | Epidermal growth factor receptor |
References
- Arnold, M.; Morgan, E.; Rumgay, H.; Mafra, A.; Singh, D.; Laversanne, M.; Vignat, J.; Gralow, J.R.; Cardoso, F.; Siesling, S.; et al. Current and Future Burden of Breast Cancer: Global Statistics for 2020 and 2040. The Breast 2022, 66, 15–23. [Google Scholar] [CrossRef]
- Heer, E.; Harper, A.; Escandor, N.; Sung, H.; McCormack, V.; Fidler-Benaoudia, M.M. Global Burden and Trends in Premenopausal and Postmenopausal Breast Cancer: A Population-Based Study. The Lancet Global Health 2020, 8, e1027–e1037. [Google Scholar] [CrossRef]
- Tang, Q.; Li, H.; Zhao, X.T.; Li, Z.Y.; Ma, C.X.; Zhou, S.Q.; Chen, D.D. Opportunities and Challenges in the Development of Antibody-Drug Conjugate for Triple-Negative Breast Cancer: The Diverse Choices and Changing Needs. World J Oncol 2024, 15, 527–542. [Google Scholar] [CrossRef] [PubMed]
- Garrigos, L.; Camacho, D.; Perez-Garcia, J.M.; Llombart-Cussac, A.; Cortes, J.; Antonarelli, G. Sacituzumab Govitecan for Hormone Receptor-Positive HER2-Negative Advanced Breast Cancer. Expert Rev Anticancer Ther 2024, 24, 949–958. [Google Scholar] [CrossRef]
- Brown, H.K.; Tellez-Gabriel, M.; Cartron, P.-F.; Vallette, F.M.; Heymann, M.-F.; Heymann, D. Characterization of Circulating Tumor Cells as a Reflection of the Tumor Heterogeneity: Myth or Reality? Drug Discov Today 2019, 24, 763–772. [Google Scholar] [CrossRef]
- Aceto, N.; Bardia, A.; Miyamoto, D.T.; Donaldson, M.C.; Wittner, B.S.; Spencer, J.A.; Yu, M.; Pely, A.; Engstrom, A.; Zhu, H.; et al. Circulating Tumor Cell Clusters Are Oligoclonal Precursors of Breast Cancer Metastasis. Cell 2014, 158, 1110–1122. [Google Scholar] [CrossRef] [PubMed]
- Pauken, C.M.; Kenney, S.R.; Brayer, K.J.; Guo, Y.; Brown-Glaberman, U.A.; Marchetti, D. Heterogeneity of Circulating Tumor Cell Neoplastic Subpopulations Outlined by Single-Cell Transcriptomics. Cancers (Basel) 2021, 13, 4885. [Google Scholar] [CrossRef] [PubMed]
- Chaffer, C.L.; Weinberg, R.A. A Perspective on Cancer Cell Metastasis. Science 2011, 331, 1559–1564. [Google Scholar] [CrossRef]
- Sung, H.; Ferlay, J.; Siegel, R.L.; Laversanne, M.; Soerjomataram, I.; Jemal, A.; Bray, F. Global Cancer Statistics 2020: GLOBOCAN Estimates of Incidence and Mortality Worldwide for 36 Cancers in 185 Countries. CA Cancer J Clin 2021, 71, 209–249. [Google Scholar] [CrossRef]
- LeVasseur, N.; Manna, M.; Jerzak, K.J. An Overview of Long-Acting GnRH Agonists in Premenopausal Breast Cancer Patients: Survivorship Challenges and Management. Curr Oncol 2024, 31, 4209–4224. [Google Scholar] [CrossRef]
- Eliassen, F.M.; Blåfjelldal, V.; Helland, T.; Hjorth, C.F.; Hølland, K.; Lode, L.; Bertelsen, B.-E.; Janssen, E.A.M.; Mellgren, G.; Kvaløy, J.T.; et al. Importance of Endocrine Treatment Adherence and Persistence in Breast Cancer Survivorship: A Systematic Review. BMC Cancer 2023, 23, 625. [Google Scholar] [CrossRef]
- Spizzo, G.; Obrist, P.; Ensinger, C.; Theurl, I.; Dünser, M.; Ramoni, A.; Gunsilius, E.; Eibl, G.; Mikuz, G.; Gastl, G. Prognostic Significance of Ep-CAM AND Her-2/Neu Overexpression in Invasive Breast Cancer. Int J Cancer 2002, 98, 883–888. [Google Scholar] [CrossRef]
- Li, L.; Zhang, D.; Wu, Y.; Wang, J.; Ma, F. Efficacy and Safety of Trastuzumab with or without a Tyrosine Kinase Inhibitor for HER2-Positive Breast Cancer: A Systematic Review and Meta-Analysis. Biochimica et Biophysica Acta (BBA) - Reviews on Cancer 2023, 1878, 188969. [Google Scholar] [CrossRef]
- Lin, N.U.; Claus, E.; Sohl, J.; Razzak, A.R.; Arnaout, A.; Winer, E.P. Sites of Distant Recurrence and Clinical Outcomes in Patients with Metastatic Triple-Negative Breast Cancer. Cancer 2008, 113, 2638–2645. [Google Scholar] [CrossRef] [PubMed]
- Dent, R.; Trudeau, M.; Pritchard, K.I.; Hanna, W.M.; Kahn, H.K.; Sawka, C.A.; Lickley, L.A.; Rawlinson, E.; Sun, P.; Narod, S.A. Triple-Negative Breast Cancer: Clinical Features and Patterns of Recurrence. Clin Cancer Res 2007, 13, 4429–4434. [Google Scholar] [CrossRef] [PubMed]
- Cristofanilli, M.; Budd, G.T.; Ellis, M.J.; Stopeck, A.; Matera, J.; Miller, M.C.; Reuben, J.M.; Doyle, G.V.; Allard, W.J.; Terstappen, L.W.M.M.; et al. Circulating Tumor Cells, Disease Progression, and Survival in Metastatic Breast Cancer. N Engl J Med 2004, 351, 781–791. [Google Scholar] [CrossRef] [PubMed]
- Schnell, U.; Cirulli, V.; Giepmans, B.N.G. EpCAM: Structure and Function in Health and Disease. Biochimica et Biophysica Acta (BBA) - Biomembranes 2013, 1828, 1989–2001. [Google Scholar] [CrossRef] [PubMed]
- Trzpis, M.; McLaughlin, P.M.J.; de Leij, L.M.F.H.; Harmsen, M.C. Epithelial Cell Adhesion Molecule: More than a Carcinoma Marker and Adhesion Molecule. The American Journal of Pathology 2007, 171, 386–395. [Google Scholar] [CrossRef]
- Li, D.; Guo, X.; Yang, K.; Yang, Y.; Zhou, W.; Huang, Y.; Liang, X.; Su, J.; Jiang, L.; Li, J.; et al. EpCAM-Targeting CAR-T Cell Immunotherapy Is Safe and Efficacious for Epithelial Tumors. Sci. Adv. 2023, 9. [Google Scholar] [CrossRef]
- Abdelaziz, L.A.; Ebian, H.; Harb, O.; Nosery, Y.; Taha, H.; Nawar, N. Clinical Significance of Cytokeratin 19 and OCT4 as Survival Markers in Non-Metastatic and Metastatic Breast Cancer Patients. Contemp Oncol (Pozn) 2022, 26, 78–87. [Google Scholar] [CrossRef]
- Bahadoran, E.; Moghbelinejad, S.; Mohammadi, G.; Shahbazmohammadi, H.; Abdolvahabi, Z.; Jalilvand, M.; Zare, I.; Alaei, M.; Keshavarz Shahbaz, S. Cytokeratin Expression in Breast Cancer: From Mechanisms, Progression, Diagnosis, and Prognosis to Therapeutic Implications. Molecular & Cellular Oncology 2025, 12. [Google Scholar] [CrossRef]
- Alsharif, S.; Sharma, P.; Bursch, K.; Milliken, R.; Lam, V.; Fallatah, A.; Phan, T.; Collins, M.; Dohlman, P.; Tiufekchiev, S.; et al. Keratin 19 Maintains E-Cadherin Localization at the Cell Surface and Stabilizes Cell-Cell Adhesion of MCF7 Cells. Cell Adh Migr 2021, 15, 1–17. [Google Scholar] [CrossRef] [PubMed]
- Meijer, S.E.; Klebanov-Akopyn, O.; Pavlov, V.; Laks, S.; Hazzan, D.; Nissan, A.; Zippel, D. Detection of Minimal Residual Disease in the Peripheral Blood of Breast Cancer Patients, with a Multi Marker (MGB-1, MGB-2, CK-19 and NY-BR-1) Assay. Breast Cancer (Dove Med Press) 2021, 13, 617–624. [Google Scholar] [CrossRef] [PubMed]
- Parikh, R.R.; Yang, Q.; Higgins, S.A.; Haffty, B.G. Outcomes in Young Women with Breast Cancer of Triple-Negative Phenotype: The Prognostic Significance of CK19 Expression. Int J Radiat Oncol Biol Phys 2008, 70, 35–42. [Google Scholar] [CrossRef] [PubMed]
- Kotsifaki, A.; Maroulaki, S.; Armakolas, A. Exploring the Immunological Profile in Breast Cancer: Recent Advances in Diagnosis and Prognosis through Circulating Tumor Cells. Int J Mol Sci 2024, 25, 4832. [Google Scholar] [CrossRef]
- Zhang, L.; Ridgway, L.D.; Wetzel, M.D.; Ngo, J.; Yin, W.; Kumar, D.; Goodman, J.C.; Groves, M.D.; Marchetti, D. The Identification and Characterization of Breast Cancer CTCs Competent for Brain Metastasis. Sci Transl Med 2013, 5, 180ra48. [Google Scholar] [CrossRef]
- Fischer, K.R.; Durrans, A.; Lee, S.; Sheng, J.; Li, F.; Wong, S.T.C.; Choi, H.; El Rayes, T.; Ryu, S.; Troeger, J.; et al. Epithelial-to-Mesenchymal Transition Is Not Required for Lung Metastasis but Contributes to Chemoresistance. Nature 2015, 527, 472–476. [Google Scholar] [CrossRef]
- Aitken, S.J.; Thomas, J.S.; Langdon, S.P.; Harrison, D.J.; Faratian, D. Quantitative Analysis of Changes in ER, PR and HER2 Expression in Primary Breast Cancer and Paired Nodal Metastases. Annals of Oncology 2010, 21, 1254–1261. [Google Scholar] [CrossRef]
- Peeters, D.J.E.; Van Dam, P.-J.; Van Den Eynden, G.G.M.; Rutten, A.; Wuyts, H.; Pouillon, L.; Peeters, M.; Pauwels, P.; Van Laere, S.J.; Van Dam, P.A.; et al. Detection and Prognostic Significance of Circulating Tumour Cells in Patients with Metastatic Breast Cancer According to Immunohistochemical Subtypes. Br J Cancer 2014, 110, 375–383. [Google Scholar] [CrossRef]
- Kulasinghe, A.; Wu, H.; Punyadeera, C.; Warkiani, M.E. The Use of Microfluidic Technology for Cancer Applications and Liquid Biopsy. Micromachines (Basel) 2018, 9, 397. [Google Scholar] [CrossRef]
- Vishnoi, M.; Peddibhotla, S.; Yin, W.; T. Scamardo, A.; George, G.C.; Hong, D.S.; Marchetti, D. The Isolation and Characterization of CTC Subsets Related to Breast Cancer Dormancy. Sci Rep 2015, 5. [Google Scholar] [CrossRef]
- Lampignano, R.; Schneck, H.; Neumann, M.; Fehm, T.; Neubauer, H. Enrichment, Isolation and Molecular Characterization of EpCAM-Negative Circulating Tumor Cells. Adv Exp Med Biol 2017, 994, 181–203. [Google Scholar] [CrossRef]
- Königsberg, R.; Obermayr, E.; Bises, G.; Pfeiler, G.; Gneist, M.; Wrba, F.; de Santis, M.; Zeillinger, R.; Hudec, M.; Dittrich, C. Detection of EpCAM Positive and Negative Circulating Tumor Cells in Metastatic Breast Cancer Patients. Acta Oncol 2011, 50, 700–710. [Google Scholar] [CrossRef]
- Fridrichova, I.; Kalinkova, L.; Ciernikova, S. Clinical Relevancy of Circulating Tumor Cells in Breast Cancer: Epithelial or Mesenchymal Characteristics, Single Cells or Clusters? Int J Mol Sci 2022, 23, 12141. [Google Scholar] [CrossRef]
- Liao, Q.; Zhang, R.; Ou, Z.; Ye, Y.; Zeng, Q.; Wang, Y.; Wang, A.; Chen, T.; Chai, C.; Guo, B. TROP2 Is Highly Expressed in Triple-Negative Breast Cancer CTCs and Is a Potential Marker for Epithelial Mesenchymal CTCs. Molecular Therapy: Oncology 2024, 32, 200762. [Google Scholar] [CrossRef]
- Mavroudis, D.; Lagoudaki, E.; Gounaki, S.; Hatziavraam, S.; Fotsitzoudis, C.; Michaelidou, K.; Agelaki, S.; Papadaki, M.A. Abstract P4-05-27: Comparative Analysis of TROP2 Expression in Tumor Tissues and Circulating Tumor Cells (CTCs) in the Peripheral Blood of Patients with Triple Negative Breast Cancer. Clinical Cancer Research 2025, 31, P4–05. [Google Scholar] [CrossRef]
- Wu, C.-J.; Lu, M.; Feng, X.; Nakato, G.; Udey, M.C. Matriptase Cleaves EpCAM and TROP2 in Keratinocytes, Destabilizing Both Proteins and Associated Claudins. Cells 2020, 9, 1027. [Google Scholar] [CrossRef] [PubMed]
- Wu, C.-J.; Feng, X.; Lu, M.; Morimura, S.; Udey, M.C. Matriptase-Mediated Cleavage of EpCAM Destabilizes Claudins and Dysregulates Intestinal Epithelial Homeostasis. J Clin Invest 2017, 127, 623–634. [Google Scholar] [CrossRef] [PubMed]
- Lenárt, S.; Lenárt, P.; Šmarda, J.; Remšík, J.; Souček, K.; Beneš, P. Trop2: Jack of All Trades, Master of None. Cancers (Basel) 2020, 12, 3328. [Google Scholar] [CrossRef]
- Menz, A.; Lony, N.; Lennartz, M.; Dwertmann Rico, S.; Schlichter, R.; Kind, S.; Reiswich, V.; Viehweger, F.; Dum, D.; Luebke, A.M.; et al. Epithelial Cell Adhesion Molecule (EpCAM) Expression in Human Tumors: A Comparison with Pan-Cytokeratin and TROP2 in 14,832 Tumors. Diagnostics (Basel) 2024, 14, 1044. [Google Scholar] [CrossRef]
- Aslemarz, A.; Fagotto-Kaufmann, M.; Ruppel, A.; Fagotto-Kaufmann, C.; Balland, M.; Lasko, P.; Fagotto, F. An EpCAM/Trop2 Mechanostat Differentially Regulates Collective Behaviour of Human Carcinoma Cells. EMBO J 2025, 44, 75–106. [Google Scholar] [CrossRef] [PubMed]
- Szostakowska-Rodzos, M.; Fabisiewicz, A.; Wakula, M.; Tabor, S.; Szafron, L.; Jagiello-Gruszfeld, A.; Grzybowska, E.A. Longitudinal Analysis of Circulating Tumor Cell Numbers Improves Tracking Metastatic Breast Cancer Progression. Sci Rep 2024, 14, 12924. [Google Scholar] [CrossRef]
- Duda, D.G.; Duyverman, A.M.M.J.; Kohno, M.; Snuderl, M.; Steller, E.J.A.; Fukumura, D.; Jain, R.K. Malignant Cells Facilitate Lung Metastasis by Bringing Their Own Soil. Proc Natl Acad Sci U S A 2010, 107, 21677–21682. [Google Scholar] [CrossRef]
- Fabisiewicz, A.; Grzybowska, E. CTC Clusters in Cancer Progression and Metastasis. Med Oncol 2017, 34, 12. [Google Scholar] [CrossRef]
- Schuster, E.; Taftaf, R.; Reduzzi, C.; Albert, M.K.; Romero-Calvo, I.; Liu, H. Better Together: Circulating Tumor Cell Clustering in Metastatic Cancer. Trends Cancer 2021, 7, 1020–1032. [Google Scholar] [CrossRef]
- Tang, R.; Luo, S.; Liu, H.; Sun, Y.; Liu, M.; Li, L.; Ren, H.; Angele, M.K.; Börner, N.; Yu, K.; et al. Circulating Tumor Microenvironment in Metastasis. Cancer Research 2025, 85, 1354–1367. [Google Scholar] [CrossRef]
- Sayed, Z.S.; Khattap, M.G.; Madkour, M.A.; Yasen, N.S.; Elbary, H.A.; Elsayed, R.A.; Abdelkawy, D.A.; Wadan, A.-H.S.; Omar, I.; Nafady, M.H. Circulating Tumor Cells Clusters and Their Role in Breast Cancer Metastasis; a Review of Literature. Discov Onc 2024, 15, 94. [Google Scholar] [CrossRef]
- Zheng, X.; Carstens, J.L.; Kim, J.; Scheible, M.; Kaye, J.; Sugimoto, H.; Wu, C.-C.; LeBleu, V.S.; Kalluri, R. Epithelial-to-Mesenchymal Transition Is Dispensable for Metastasis but Induces Chemoresistance in Pancreatic Cancer. Nature 2015, 527, 525–530. [Google Scholar] [CrossRef]
- Ebright, R.Y.; Lee, S.; Wittner, B.S.; Niederhoffer, K.L.; Nicholson, B.T.; Bardia, A.; Truesdell, S.; Wiley, D.F.; Wesley, B.; Li, S.; et al. Deregulation of Ribosomal Protein Expression and Translation Promotes Breast Cancer Metastasis. Science 2020, 367, 1468–1473. [Google Scholar] [CrossRef] [PubMed]
- Mercier, F.; Consalvo, N.; Frey, N.; Phipps, A.; Ribba, B. From Waterfall Plots to Spaghetti Plots in Early Oncology Clinical Development. Pharm Stat 2019, 18, 526–532. [Google Scholar] [CrossRef] [PubMed]
- Costa, C.; Muinelo-Romay, L.; Cebey-López, V.; Pereira-Veiga, T.; Martínez-Pena, I.; Abreu, M.; Abalo, A.; Lago-Lestón, R.M.; Abuín, C.; Palacios, P.; et al. Analysis of a Real-World Cohort of Metastatic Breast Cancer Patients Shows Circulating Tumor Cell Clusters (CTC-Clusters) as Predictors of Patient Outcomes. Cancers 2020, 12, 1111. [Google Scholar] [CrossRef] [PubMed]
- Boral, D.; Vishnoi, M.; Liu, H.N.; Yin, W.; Sprouse, M.L.; Scamardo, A.; Hong, D.S.; Tan, T.Z.; Thiery, J.P.; Chang, J.C.; et al. Molecular Characterization of Breast Cancer CTCs Associated with Brain Metastasis. Nat Commun 2017, 8. [Google Scholar] [CrossRef] [PubMed]
- Talmadge, J.E.; Fidler, I.J. AACR Centennial Series: The Biology of Cancer Metastasis: Historical Perspective. Cancer Res 2010, 70, 5649–5669. [Google Scholar] [CrossRef] [PubMed]
- Liu, L.; Qu, X.; Wang, Z.; Ji, C.; Ling, R.; Yan, C. Leaf-Vein-Inspired Multi-Organ Microfluidic Chip for Modeling Breast Cancer CTC Organotropism. Front Oncol 2025, 15, 1602225. [Google Scholar] [CrossRef]
- Polioudaki, H.; Agelaki, S.; Chiotaki, R.; Politaki, E.; Mavroudis, D.; Matikas, A.; Georgoulias, V.; Theodoropoulos, P.A. Variable Expression Levels of Keratin and Vimentin Reveal Differential EMT Status of Circulating Tumor Cells and Correlation with Clinical Characteristics and Outcome of Patients with Metastatic Breast Cancer. BMC Cancer 2015, 15, 399. [Google Scholar] [CrossRef]
- Dianat-Moghadam, H.; Azizi, M.; Eslami-S, Z.; Cortés-Hernández, L.E.; Heidarifard, M.; Nouri, M.; Alix-Panabières, C. The Role of Circulating Tumor Cells in the Metastatic Cascade: Biology, Technical Challenges, and Clinical Relevance. Cancers (Basel) 2020, 12, 867. [Google Scholar] [CrossRef]
- Nochi, T.; Yuki, Y.; Terahara, K.; Hino, A.; Kunisawa, J.; Kweon, M.-N.; Yamaguchi, T.; Kiyono, H. Biological Role of Ep-CAM in the Physical Interaction between Epithelial Cells and Lymphocytes in Intestinal Epithelium. Clin Immunol 2004, 113, 326–339. [Google Scholar] [CrossRef]
- Ju, J. -h; Oh, S.; Lee, K. -m; Yang, W.; Nam, K.S.; Moon, H.-G.; Noh, D.-Y.; Kim, C.G.; Park, G.; Park, J.B.; et al. Cytokeratin19 Induced by HER2/ERK Binds and Stabilizes HER2 on Cell Membranes. Cell Death Differ 2015, 22, 665–676. [Google Scholar] [CrossRef] [PubMed]

Table 1.
Clinical characteristics of patients included in the classical CTC dataset
| Clinical Characteristic |
Category | Full Cohort |
HR+/HER2- | HR-/HER2+ | TNBC | Fisher exact test, p-value |
|---|---|---|---|---|---|---|
| Age at 1st blood collection |
<65 | 30 (60.0) | 17 (54.8) | 11 (68.8) | 2 (66.7) | |
| 65+ | 20 (40.0) | 14 (45.2) | 5 (31.2) | 1 (33.3) | 0.792 | |
| Total | 50 (100) | 31 (100) | 16 (100) | 3 (100) | ||
| Number of Metastatic sites |
1 2 3+ Total |
4 (8.0) 15 (30.0) 31 (62.0) 50 (100) |
4 (12.9) 7 (22.6) 20 (64.5) 31 (100) |
0 (0.0) 7 (43.8) 9 (56.2) 16 (100) |
0 (0.0) 1 (33.0) 2 (66.7) 3 (100) |
0.417 |
| Lung metastasis | N Y Total |
22 (43.1) 29 (56.9) 51 (100) |
14 (43.8) 18 (56.2) 32 (100) |
7 (43.8) 9 (56.2) 16 (100) |
1 (33.0) 2 (66.7) 3 (100) |
1.000 |
| Bone metastasis | N Y Total |
14 (27.5) 37 (72.5) 51 (100) |
6 (18.8) 26 (81.2) 32 (100) |
7 (43.8) 9 (56.2) 16 (100) |
1 (33.0) 2 (66.7) 3 (100) |
0.141 |
| Liver metastasis | N | 25 (50.0) | 16 (51.6) | 7 (43.8) | 2 (66.7) | |
| Y Total |
25 (50.0) 50 (100) |
15 (48.4) 31 (100) |
9 (56.2) 16 (100) |
1 (33.3) 3 (100) |
0.816 | |
| Brain metastasis | N | 34 (68.0) | 24 (77.4) | 9 (56.2) | 1 (33.3) | |
| Y | 16 (32.0) | 7 (22.6) | 7 (43.8) | 2 (66.7) | 0.105 | |
| Total | 50 (100) | 31 (100) | 16 (100) | 3 (100) |
Of the 51 patients in the cCTC dataset, 1 was missing age, 1 did not have full metastatic site data.
Table 2.
Clinical characteristics of patients included Trop2 CTC dataset.
| Clinical Characteristic |
Category | Full Cohort |
HR+/HER2- | HR-/HER2+ | TNBC | Fisher exact test, p-value |
|---|---|---|---|---|---|---|
| Age at 1st blood collection |
<65 | 16 (64.0) | 7 (50.0) | 7 (87.5) | 2 (66.7) | |
| 65+ | 9 (36.0) | 7 (50.0) | 1 (12.5) | 1 (33.3) | 0.246 | |
| Total | 25 (100) | 14 (100) | 8 (100) | 3 (100) | ||
| Number of Metastatic sites |
1 2 3+ Total |
2 (7.7) 9 (34.6) 15 (57.7) 26 (100) |
2 (13.3) 4 (26.7) 9 (60.0) 15 (100)) |
0 (0.0) 4 (50.0) 4 (50.0) 8 (100) |
0 (0.0) 1 (33.0) 2 (66.7) 3 (100) |
0.834 |
| Lung metastasis | N Y Total |
13 (50.0) 13 (50.0) 26 (100) |
8 (53.3) 7 (46.7) 15 (100) |
4 (50.0) 4 (50.0) 8 (100) |
1 (33.0) 2 (66.7) 3 (100) |
1.000 |
| Bone metastasis | N Y Total |
7 (26.9) 19 (73.1) 26 (100) |
2 (13.3) 13 (86.7) 15 (100) |
4 (50.0) 4 (50.0) 8 (100) |
1 (33.0) 2 (66.7) 3 (100) |
0.139 |
| Liver metastasis | N | 11 (42.3) | 6 (40.0) | 3 (37.5) | 2 (66.7) | |
| Y Total |
15 (57.7) 26 (100) |
9 (60.0) 15 (100) |
5 (62.5) 8 (100) |
1 (33.3) 3 (100) |
0.724 | |
| Brain metastasis | N | 18 (69.2) | 11 (73.3) | 6 (75.0) | 1 (33.3) | |
| Y | 8 (30.8) | 4 (26.7) | 2 (25.0) | 2 (66.7) | 0.418 | |
| Total | 26 (100) | 15 (100) | 8 (100) | 3 (100) |
*Of the 26 total patients included in the T2CTC dataset, 1 did not have a listed age.
Table 3.
Full longitudinal model results by receptor status for all biomarkers in the cCTC dataset.
| Biomarker (per mL) | Receptor Effect | Time Effect | Interaction |
|---|---|---|---|
| cCTCs | 0.6591061 | 0.7461176 | 0.840692 |
| CK | 0.4685809 | 0.6062315 | 0.4074604 |
| EpCAM | 0.7158591 | 0.1999038 | 0.0218357 |
| Clusters | 0.9510659 | 0.028952 | 0.0674635† |
| Clusters of 2 | 0.6826174 | 0.0805827 | 0.1121893 |
| cCTC in cluster | 0.4323639 | 0.5820074 | 0.5686966 |
| Clusters >2 | 0.5347161 | 0.0062573 | 0.0069147 |
| CD45 in cluster | 0.9598183 | 0.0401535 | 0.1091464 |
| † Indicates a marginally significant result |
Table 4.
Full longitudinal model results by receptor status for all biomarkers in the T2CTC dataset.
Table 4.
Full longitudinal model results by receptor status for all biomarkers in the T2CTC dataset.
| Biomarker (per mL) | Receptor Effect | Time Effect | Interaction |
|---|---|---|---|
| CK/EpCAM/Trop2 | 0.4802839 | 0.8340946 | 0.8919177 |
| CK/EpCAM | 0.5649867 | 0.0955775 | 0.1789835 |
| Trop2 | 0.5484958 | 0.8870074 | 0.490742 |
| Clusters | 0.966292 | 0.2493243 | 0.5708911 |
| CTC in cluster | 0.7295486 | 0.5810308 | 0.8777693 |
| CD45 in cluster | 0.9998403 | 0.2495356 | 0.5364823 |
| Clusters of 2 | 0.2829963 | 0.6461081 | 0.4631998 |
| Clusters >2 | 0.633026 | 0.2716701 | 0.4975725 |
Disclaimer/Publisher’s Note: The statements, opinions and data contained in all publications are solely those of the individual author(s) and contributor(s) and not of MDPI and/or the editor(s). MDPI and/or the editor(s) disclaim responsibility for any injury to people or property resulting from any ideas, methods, instructions or products referred to in the content. |
© 2025 by the authors. Licensee MDPI, Basel, Switzerland. This article is an open access article distributed under the terms and conditions of the Creative Commons Attribution (CC BY) license (https://creativecommons.org/licenses/by/4.0/).
Copyright: This open access article is published under a Creative Commons CC BY 4.0 license, which permit the free download, distribution, and reuse, provided that the author and preprint are cited in any reuse.


