
Submitted:
19 February 2025
Posted:
20 February 2025
You are already at the latest version
Abstract
High-Grade Serous Ovarian Carcinoma (HGSOC) is a highly heterogeneous disease. Machine learning-based cellular morphometric biomarkers (CMB-ML) have been identified across multiple tumor types, capturing tissue heterogeneity, predicting tumor microenvironments (TME) and clinical outcomes. We aimed to identify ethnicity-specific CMBs in African American and White HGSOC patients using whole-slide images (WSIs) and assess their associations with overall survival (OS). Analysis of 109 patients from The Cancer Genome Atlas Ovarian Cancer (TCGA-OV) cohort was validated in WSIs from 22 patients in the Loma Linda University (LLU) cohort. We linked immune checkpoint markers (ICM) to CMB scores and confirmed via immunohistochemistry. We identified and validated three ethnicity-specific CMBs — 73, 80, and 215 with significant frequency differences. Higher CMB 73 and 80 frequencies correlated with shorter OS in African Americans (p=0.022, p=0.023), while higher CMB 215 frequency was linked to improved OS in White patients (p=0.051). Molecular analysis of TCGA-OV cohort revealed lower immune infiltration in African Americans and higher ICM expression in Whites (PDCD1: p=0.033, PDCD1LG2: p=0.014, CD8A: p=0.014). Immunohistochemistry in the LLU-OV cohort showed expression of predicted markers CD3, CD8, and PDCD1. Although there were no significant differences between the two ethnic groups, CMB-ML explores a new avenue for understanding health disparities.
Keywords:
High-grade serous ovarian cancer
; Ethnicity
; Cellular Morphometric Biomarkers
; Tumor microenvironment
; Immunohistochemistry
; Overall survival
1. Introduction
Ovarian carcinoma (OC) is rare but remains the deadliest gynecological cancer, often presenting with poor prognosis and drug resistance [2]. Among its histotypes, HGSOC accounts for ~75% of epithelial OCs [3]and is characterized by late detection due to unreliable diagnostic markers [4], a low five-year survival rate (~47.5%) [5], and high recurrence due to platinum resistance [6]. This resistance is linked to HGSOC’s heterogeneous cellular architecture, leading to varied patient outcomes after standard chemotherapy [7].
HGSOC displays significant morphological diversity within and between tumors, compounded by racial disparities that necessitate precise, timely diagnosis [8]. Cellular Morphometric Biomarkers (CMBs) offer valuable insights into diagnosis, prognosis, and treatment response [1]. While molecular biomarkers such as TP53, BRCA1/2 mutations, HRD, gene expression subtypes, and circulating tumor DNA have been extensively studied [2, 9, 10], the link between CMBs and molecular, immunological, and quantitative profiles from whole slide histopathology images (WSIs) remain underexplored due to technological limitations [1]. Developing an AI-driven Machine Learning framework (CMB-ML) for analyzing CMBs from WSIs could enable early prediction of platinum resistance and enhance precision oncology [11].
Racial Disparities in HGSOC
Ovarian cancer disproportionately affects African American women, who experience worse survival rates than White women [12]. Mortality rates have risen among Black women compared to other ethnic groups, with disparities most pronounced in developing regions [13]. While HGSOC phenotypes often exhibit higher disease burden and mortality among Black populations, variations in CMB levels across ethnicities may contribute to these disparities [1]. Genomic research on HGSOC has primarily focused on non-African populations [14]. Underscoring the need for WSI-based CMB analysis to explore the intersection of histopathology, race, and treatment outcomes [15].
CMBs have been linked to molecular alterations, immune microenvironment differences, and treatment responses in cancers like gliomas and squamous cell carcinoma [16]. In HGSOC, leveraging CMBs from routine Hematoxylin and Eosin (H&E)-stained WSIs may offer an unbiased approach to biological stratification and disparity analysis [1]. A CMB-ML framework tailored for ovarian cancer could reveal ethnic-specific tumor microenvironment differences, guiding precision therapies.
The Tumor Microenvironment in HGSOC
The immune landscape of HGSOC plays a critical role in prognosis and therapy response [17]. Ovarian cancer cells interact with the microenvironment to promote tumor progression and immune evasion [18]. Cancer-associated fibroblasts (CAFs), the dominant stromal component, drive immunosuppression through inflammatory signaling, DNA damage responses, and extracellular matrix remodeling [19, 20]. CAFs also express immune checkpoint ligands like PD-L1, impairing tumor-infiltrating lymphocyte function [19].
Immune cell composition within the tumor microenvironment (TME) influences survival and systemic therapy response, with immunosuppressive phenotypes correlating with lower overall survival [21, 22]. Black women with HGSOC exhibit worse outcomes than White women, potentially due to both healthcare access disparities and immune TME differences [23]. Integrating immune-modulating strategies with standard therapies could improve survival rates [18].
As AI-driven morphometric analyses evolve, leveraging CMBs to study TME heterogeneity in diverse populations could yield novel biomarkers, enhance treatment stratification, and address racial disparities in HGSOC outcomes. In this study, we have identified AI-generated differential CMB frequencies and predicted immune subpopulations in the TME between African and White Americans using the TCGA-OV cohort. We validated these findings in the LLU-OV cohort using immunohistochemistry and correlated them to overall survival.
2. Materials and Methods
Patient Cohort Information
The patient data from the LLU-OV cohort, which includes H&E-stained diagnostic slides and clinical information from 22 patients, were retrieved from the Loma Linda Medical (LMM) Center repository between 2010 and 2022 (Table 1). The inclusion criteria were high-grade serous ovarian cancer, with African American patients randomly matched to an equal number of White patients. Patient data included diagnostic, staging, treatment, and overall survival information. All 22 patients were diagnosed with high-grade serous ovarian cancer, with 11 African American and 11 White patients. The average age at diagnosis was 62.3 years, with the youngest patient being 39.5 years old and the oldest 81.3 years old. The average overall survival was 39.5 months. This study was approved by the Institutional Review Board (IRB) of Loma Linda University Medical Center. Clinical and histopathological data were obtained from patient charts, and whole slide images (WSIs) of H&E-stained slides were scanned using the AperioCs2 Leica Biosystems scanner at the California Tumor Tissue Registry (CTTR) center at Loma Linda University. These images were quantitatively analyzed for Cellular Morphometric Biomarkers by Machine Learning (CMB-ML) pipeline (Figure 1). We then compared our CMB data with the TCGA-OV cohort, which included 109 patients with H&E-stained diagnostic slides and complete clinical information, using the criteria outlined by [1].
Ethnic-Specific CMB Identification and Validation
Using the stacked predictive sparse decomposition technique [24,25,26] on our cellular morphometric biomarker machine learning (CMB-ML) pipeline, we identified 256 CMBs from cellular objects extracted from the whole slide images (WSI) of H&E-stained diagnostic slides from 22 high-grade serous ovarian cancer (HGSOC) patients enrolled in the LLU-OV cohort. The patient demographics and descriptive statistics for all 22 cases, including ethnicity, stage at diagnosis, age at diagnosis, overall survival, and overall status, are summarized in Supplementary Table 1. In the CMB-ML pipeline, we used a single network layer with 256 dictionary elements (i.e., CMBs) and applied a sparsity constraint of 30, with a fixed random sampling rate of 1000 cellular objects per WSI across the cohort. The pre-trained CMB-ML model then reconstructed each cellular region as a sparse combination of the 256 predefined CMBs and represented each patient as an aggregate of all cellular objects belonging to that patient. Ethnicity-specific CMBs were defined as those with significantly different relative abundances between African American and Caucasian patients, and these were validated in the TCGA-OV cohort (Figure 1).
Exploration of the Underlying Association Between Tumor Microenvironments (TMEs) and CMBs in TCGA-OV.
The TME (i.e., abundances of member cell types in a mixed cell population) was assessed using Consensus ME (version: 0.0.1.9000) [27] based on the stacked predictive sparse decomposition [24,25,26] technique and our cellular morphometric biomarkers identified by the machine learning (CMB-ML) pipeline. The association between CMBs and TMEs was calculated using Spearman rank correlation and represented by a heatmap (Complex Heatmap package in R, version 3.18).
Exploration of the Underlying Association Between Genomic Instability and CMBs in TCGA-OV
Genomic instability in terms of aneuploidy score and fraction of genome altered, mutation counts, mutation burden, and prognosis (i.e., overall survival and progression-free survival) were downloaded from the cBioPortal website (www.cbioportal.org). The association between CMBs and genomic instability parameters was calculated using the Spearman correlation and represented by a heatmap (Complex Heatmap package in R, version 3.18).
Exploration of Differences in Immune Checkpoints Across Ethnic Groups in TCGA-OV
Gene expression of various immune checkpoints in terms of PD-1, PD-L1, PD-L2, CTLA4, CD8A, and CD80 were downloaded from cBioPortal (www.cbioportal.org), and the differences between African Americans and Caucasians were calculated by Mann-Whitney Nonparametric test. Differences in immune checkpoint expression, immune cell infiltration, and genomic instability between groups in the TCGA cohort were analyzed using the Mann-Whitney non-parametric test (for continuous variables) or the Chi-square test (for categorical variables). A p-value (FDR corrected if applicable) < 0.05 was considered statistically significant.
TME Analysis by Immunohistochemistry
Immunohistochemistry staining was performed at the California Tumor Tissue Registry (CCTR) using the Leica Biosystems Bond Automated Stainer, following the manufacturer’s protocol. Slides were dewaxed for 10 minutes with Bond Dewax Solution (Leica, Buffalo, IL), then hydrated with ethanol and Bond Wash Solution for 3 minutes. Antigen retrieval was conducted for 27 minutes using Bond Epitope Retrieval Solution 1. Following this, slides were washed for 2 minutes in Bond Wash Solution and then incubated with Peroxidase Block for 5 minutes, followed by a 6-minute wash in Bond Wash Solution. Primary antibodies against CD3, CD8, and PDCD1 were diluted in Bond Antibody Diluent (Leica, Buffalo, IL) at concentrations of 1:200 and 1:500, respectively. Detection was performed using the Polymer Refine Detection System (Leica, Buffalo, IL), and visualization was achieved using 3,3′-Diaminobenzidine (DAB) Refine chromogen. Lymph node tissue samples, used as positive external controls, were placed on slides alongside the ovarian cancer samples. These controls were microscopically evaluated concurrently with the tumor samples to confirm appropriate immunopositivity. The negative control involved omitting the primary antibody. After staining, the slides were counterstained with hematoxylin for contrast, rehydrated with deionized water, and mounted under coverslips.
The percentage of cells expressing CD3, CD8, or PDCD1 in tumor tissues was quantified from whole slide scanned images using QuPath software [28]. Additionally, slides were independently evaluated by a gynecologic pathologist, blinded to patient cohort information, through direct light microscopy. The manual evaluation included hotspot analysis, where five high-power fields (HPF, defined as 400x magnification using an Olympus BX50 microscope) with the highest number of tumor-infiltrating cells expressing each marker were counted, and results were averaged using both median and mean modalities. Tumor sections were classified into one of three categories based on combined CD3 and CD8 expression: (1) T-cell inflamed, characterized by abundant tumor-infiltrating cells expressing CD3/8; (2) T-cell excluded, defined by a peritumoral stroma rich in CD3/8-expressing cells but few within the tumor itself; and (3) T-cell devoid, characterized by very few cells expressing CD3 or CD8 in either the tumor or peritumoral stroma.
Statistical Analysis for Immunohistochemistry on Selected Markers
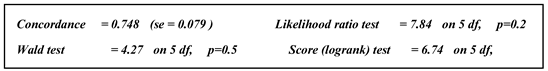
Statistical analyses were conducted using SAS 9.4 (SAS Institute Inc., Cary, NC) and R (version 4.42). We performed linear regression analyses to assess the associations between the immune markers CD3, CD8, and PDCD1 and key independent variables, including Ethnicity, Stage at Diagnosis, Age at Diagnosis, Overall Survival (OS_ Months), and OS_ Status (Supplementary Table 1). Since linear regression assumes that the residuals of the dependent variable are normally distributed, we assessed the normality of Average CD3, Average CD8, and Average PDCD1 before performing the regression. The normality of continuous quantitative variables was tested using the Shapiro-Wilk test, and statistical significance was defined as a p-value of less than 0.05. A Wilcoxon test was used to assess survival differences between ethnic groups. The association between two categorical variables was assessed using Fisher’s exact test. To examine factors associated with overall survival, the Cox regression model and log-rank test were employed.
3. Results
3.1. Qualitative and quantitative clinical and pathological characterization of the patients in the LLU cohort.
All patients in the LLU cohort were diagnosed with high-grade serous ovarian cancer (Supplementary Table 1). Of these, 6 patients were diagnosed with stage I, 2 with stage II, 10 with stage III, and 4 with stage IV disease. All 22 patients underwent debulking surgery (optimal cytoreduction) followed by chemotherapy with carboplatin/paclitaxel. Sixteen patients were classified as treatment-sensitive. The overall survival was 39.5 months. During the study period, some patients relapsed, 6 patients died, and 4 were lost to follow-up.
3.2. CMB Frequency Assessment Among Different Ethnicities in TCGA-OV and LLU-OV Cohort
To evaluate differences in CMB frequency in the LLU-OV cohort, we analyzed H&E-stained diagnostic slides and clinical data from 22 patients retrieved from the Loma Linda Medical (LMM) Center repository between 2010 and 2022. These whole-slide images were processed using a computer algorithm, the pre-trained CMB-ML pipeline, which utilized a single network layer with 256 dictionary elements (i.e., CMBs) and a sparsity constraint of 30. A fixed random sampling rate of 1000 cellular objects per slide was applied. The pre-trained CMB-ML model reconstructed each cellular region on the slide, capturing a sparse combination of the 256 predefined CMBs. These CMBs were aggregated to represent each patient as a collection of all delineated cellular objects from that individual. Ethnicity-specific CMBs were defined as those with significantly different relative abundances between African American and Caucasian patients and were validated in the TCGA-OV cohort (Figure 2).
3.3. Association of CMB Frequency with Overall Survival
To establish whether ethnic-specific CMBs (73, 80, and 215) were associated with overall survival, we performed a Kaplan-Meier analysis on the selected CMBs in relation to the number of patients at risk in both ethnic groups as shown in Figure 3..
3.4. Association Between CMBs and TME
To assess the association between the established ethnic-specific CMBs 70, 80, and 215 with the tumor microenvironment, we evaluated our selected TCGA_OV cohort (n=106) using the ConsensusTME method (version: 0.0.1.9000) [27]. We tested the abundance of individual immune cell types in our cohort that correlated to ethnic-specific CMBs 70, 80, and 215. The association between CMBs and TMEs was calculated using Spearman rank correlation and represented by a heat map, as shown in Figure 4.
3.5. Association of Immune Check Points Across Ethnic Groups in TCGA-OV
To evaluate gene expression of predicted immune checkpoints in our TCGA_OV cohort, we compared the expression of the Immune Checkpoint markers PDCD-1, CD274, PDCD1LG2, CTLA4, CD8A, and CD80 in African American Versus White patients, as shown in Figure 5.
3.6. Tissue Immunohistochemistry Expression of CD3, CD8 and PDCD1
To determine the correlation of CMB data with TME, we performed immunohistochemistry to evaluate the percentage and number of tumor-infiltrating cells expressing CD3, CD8, and PDCD1 in our patient samples from both ethnic groups in the LLU cohort (n=22), performed through Qupath analysis, and independently validated by manual counts. The cells expressing CD3, CD8, and PDCD1, respectively, stain brown in these photomicrographs (Figure 6a-f, 200× magnification). Whole slide images (WSIs) for these two patient samples are provided in Supplementary Figures 1 and Figure 2.
3.7. Immunophenotyping Based on T-Cell Infiltration
To determine the patient immune phenotypes in the LLU cohort, each tumor tissue WSI was categorized into one of three categories based on a combined assessment of CD3 and CD8 expression: T-cell inflamed, defined as rich in tumor-infiltrating cells expressing CD3/8; T-cell excluded, defined as having peritumoral stroma rich in cells expressing CD3/8, but with few expressing cells in the tumor; and T-cell devoid, defined as having very few cells expressing CD3 or CD8 within either the tumor cells or peritumoral stroma. The representative samples of each immune phenotype are shown in these photomicrographs (Figure 7a-c,200× magnification). Whole slide images (WSIs) are provided in Supplementary Figure 3.
3.7. Tissue Immunohistochemistry Statistical Analysis
Average cell counts of CD3, CD8, and PDCD1 are represented in the Supplementary Table 1. To assess differences between the two ethnic groups in the LLU cohort, we performed regression analysis using R version 4.42, on average CD3, CD8, and PDCD1 T_ cell expression in LLU Cohort patients (Table 2a and 2b). Our results showed that none of the T-cells were statistically significant after adjusting for all other variables. Concluding that there is no strong evidence to suggest a difference in the distribution of T-cell counts (either CD3 or CD8 ) between the two ethnic groups. The lack of statistical significance indicates that, in this dataset, the differences in T-cell counts between African American and White participants were insufficient to conclude a meaningful difference in their distributions.

Table 2.
a: Regression analysis for Average CD3, CD8, and PDCD1 cell counts.
| Coefficient | Exp (coef) | se (coef) | z | Pr(>|z|) | |
|---|---|---|---|---|---|
| Ethnicity | -0.049207 | 0.951984 | 0.775087 | -0.063 | 0.949 |
| Age of diagnosis | 0.056786 | 1.058429 | 0.035697 | 1.591 | 0.112 |
| CD3 | -0.004826 | 0.995185 | 0.021725 | -0.222 | 0.824 |
| CD8 | 0.007829 | 1.007860 | 0.020224 | 0.387 | 0.699 |
| PDCD1 | -0.035621 | 0.965006 | 0.047307 | -0.753 | 0.451 |
Table 2.
b: Regression analysis for Average CD3, CD8, and PDCD1 cell counts.
| Exp(coef) | Exp(-coef) | Lower .95 | Upper .95 | |
|---|---|---|---|---|
| Ethnicity | 0.9520 | 1.0504 | 0.2084 | 4.349 |
| Age of diagnosis | 1.0584 | 0.9448 | 0.9869 | 1.135 |
| CD3 | 0.9952 | 1.0048 | 0.9537 | 1.038 |
| CD8 | 1.0079 | 0.9922 | 0.9687 | 1.049 |
| PDCD1 | 0.9650 | 1.0363 | 0.8796 | 1.059 |
4. Discussion
Biomarkers are naturally occurring molecules that serve as indicators of normal biological processes or disease states [29]. Recently, cellular morphometric biomarkers identified through machine learning (CMB-ML) have been developed and validated across various tumor types, capturing cellular-level tissue heterogeneity and enabling patient stratification based on distinct tumor microenvironments (TME) and clinical outcomes [1].
In this study, we extracted 30 distinct CMBs from whole slide images (WSIs) of high-grade serous ovarian cancer (HGSOC) patients in our LLU cohort. Among these, three CMBs—73, 80, and 215—exhibited ethnic-specific differences. African American patients had significantly higher levels of CMBs 73 and 80, while White patients showed higher frequencies of CMB 215. Further analysis revealed that the frequencies of these CMBs were associated with overall survival in a manner specific to each ethnic group, findings that were confirmed through correlation with patient data. These results align with the morphological characteristics of HGSOC, which is composed of highly proliferative and markedly atypical cells [30]. Understanding cellular morphometric variations in HGSOC patients may provide insights into health disparities and inform strategies to mitigate them [31].
Currently, the most morphometric characterization of ovarian cancer focuses on malignant epithelial cells, primarily through light microscopy [32]. However, AI-powered morphometric analysis enables a more detailed evaluation of additional cell types within the TME—such as ovarian cortical fibroblasts, immune cells, and vascular cells—offering a more comprehensive understanding of factors influencing cancer progression and patient outcomes. These findings are consistent with previous studies highlighting the role of CMBs in cancer diagnosis and therapeutics based on tissue histology [26].
Further investigation into the relationship between CMBs and TME composition revealed that patients with higher frequencies of CMBs 73 and 80 exhibited fewer immune cells within their TME, suggesting an immune desert or "cold" tumor phenotype. In contrast, CMB 215 was associated with a higher abundance of immune cells, indicating a "hot" tumor with robust T-cell infiltration. To validate these findings, we performed immunohistochemical analysis of CD3, CD8, and PDCD1 expressions within the TME. Although the results were not statistically significant, a clear trend emerged linking CMBs to immune cell presence. Prior studies have associated CD3, CD8, and PDCD1 expression in the TME with improved survival outcomes [33, 34]. PDCD1, in particular, is highly expressed in several advanced carcinomas and has been identified as a favorable prognostic marker [35].
Consistent with previous reports on racial disparities in HGSOC, robust immune infiltration has been linked to improved survival in White patients, whereas African American patients did not experience the same survival advantage despite similar levels of CD3, CD8, and PDCD1 expression [36]. Our study corroborated these findings, demonstrating that immune expression correlated with survival in White patients but was attenuated and not statistically significant in African American patients. These results highlight the potential value of ethnic-specific TME profiling in identifying patients with poor prognostic features who may benefit from immunomodulatory treatments [22].
HGSOC is the most aggressive and lethal subtype of ovarian cancer, with patients typically presenting at an advanced stage and frequently developing chemotherapy-resistant recurrent disease, leading to poor prognosis [37, 8]. Historically, ovarian carcinomas have been classified based on primary histology alone [31]. However, our analysis demonstrated that applying CMB-ML to digital H&E-stained images enables an unbiased approach to biological stratification, offering insights that may guide patient care. Biomarkers are critical for managing the complexities of HGSOC treatment. In this study, we identified significant differences in CMB 73, 80, and 215 frequencies in relation to overall survival across ethnic groups. Specifically, CMBs 73 and 80 were significantly higher in African American patients and associated with lower immune cell presence, while CMB 215 was significantly elevated in White patients, suggesting differential immune activity between the two populations. These findings were consistent across both the LLU and TCGA cohorts.
Our study underscores the potential of CMBs as predictors of the TME in HGSOC, opening new avenues for understanding health disparities and developing personalized treatment strategies. Immunostaining for CD3, CD8, and PDCD1 expression validated the predicted associations between CMBs and the TME identified through machine learning. A limitation of this study was the small sample size, particularly for minority populations, which may have reduced statistical power to fully assess environmental, genetic, and clinical contributions to ovarian cancer risk and survival. However, by incorporating data from the TCGA cohort, we were able to validate our observations. A larger dataset is needed to further elucidate disparities in HGSOC and develop targeted interventions to improve survival across all racial and ethnic groups.
In conclusion, analyzing CMBs and their associated immune-expression markers in paraffin-embedded HGSOC samples is feasible and may enhance prognostic assessments while advancing our understanding of health disparities in cancer research. Furthermore, we successfully developed a pathology image-based subtyping method that stratifies patients based on CMBs, linking them to treatment responses, TME composition, overall survival, and immunohistochemical expression of CD3, CD8, and PDCD1. This approach provides a cost-effective, scalable solution with potential applications in clinical settings worldwide.
Author Contributions
Jane Muinde: Set up design and conceptualization, performed experiments, wring original draft, Qupath analysis using Qupath software, and compiled manuscript. Dan: Helped with Immunohistochemistry experiments. Joseph: Technical assistance. Umang: Software and Statistical analysis. Dr. Carter: Provided funding for Immunohistochemistry at CTTR, performed manual counts for immunohistochemistry validation and analysis of data, review and editing. Dr. Maranga: Project Collaborator. Dr. Salma Khan: Principal Investigator, provided research guidance and resources for this project, review and editing.
Funding
Please add: “This research received no external funding”.
Data Availability Statement
We will provide Whole slide images of H&E slides that were used to extract CMBs upon request.
Protocol Title: LLUCC Biospecimen Lab IRB approval Number: 58238.
Protocol Title
LLUCC Biospecimen Lab IRB approval Number: 58238.
Acknowledgments
The authors would like to thank Dr. Hang Chang, from the Biomedical Data Science Center, Lawrence Berkeley National Laboratory, for experimental design and assistance with CMB analysis, Dr. Suzanne Philips, Chair of the Earth and Biological Sciences, for her constant support, Linda Healy (CTTR), and Cedric Lansangan (NSBB PHD student) and Celina Romi Yamauchi for their support. Finally, we thank the Center for Health Disparities and Molecular Medicine for support in providing the resources we needed for this project.
Conflicts of Interest
“The authors declare no conflicts of interest.”.
Abbreviations
The following abbreviations are used in this manuscript:
| AI | Artificial intelligence |
| CMB | Cellular Morphometric Biomarkers |
| CTTR | California Tumor Tissue Registry |
| DAB | 3,3′-Diaminobenzidine |
| LLU | Loma Linda University Cohort |
| ML | Machine Learning |
| TCGA | The Cancer Genome Atlas |
| TME | Tumor Microenvironment |
| WSIs | Whole Slide Images |
References
- Liu, X.P., et al., Clinical significance and molecular annotation of cellular morphometric subtypes in lower-grade gliomas discovered by machine learning. Neuro Oncol, 2023. 25(1): p. 68-81. [CrossRef]
- Zhang, R., et al., Molecular Biomarkers for the Early Detection of Ovarian Cancer. Int J Mol Sci, 2022. 23(19). [CrossRef]
- Xu, J., et al., Single-Cell RNA Sequencing Reveals the Tissue Architecture in Human High-Grade Serous Ovarian Cancer. Clin Cancer Res, 2022. 28(16): p. 3590-3602. [CrossRef]
- Huh, S., et al., Novel Diagnostic Biomarkers for High-Grade Serous Ovarian Cancer Uncovered by Data-Independent Acquisition Mass Spectrometry. J Proteome Res, 2022. 21(9): p. 2146-2159. [CrossRef]
- O'Shea, A.S., Clinical Staging of Ovarian Cancer. Methods Mol Biol, 2022. 2424: p. 3-10.
- Burdett, N.L., et al., Multiomic analysis of homologous recombination-deficient end-stage high-grade serous ovarian cancer. Nature Genetics, 2023. 55(3): p. 437-450. [CrossRef]
- Tadić, V., W. Zhang, and A. Brozovic, The high-grade serous ovarian cancer metastasis and chemoresistance in 3D models. Biochim Biophys Acta Rev Cancer, 2024. 1879(1): p. 189052. [CrossRef]
- Azzalini, E., et al., Overview of Tumor Heterogeneity in High-Grade Serous Ovarian Cancers. Int J Mol Sci, 2023. 24(20). [CrossRef]
- Si, M., et al., Integrated Analysis To Identify Molecular Biomarkers Of High-Grade Serous Ovarian Cancer. Onco Targets Ther, 2019. 12: p. 10057-10075. [CrossRef]
- Zheng, M.J., et al., Identification of molecular marker associated with ovarian cancer prognosis using bioinformatics analysis and experiments. J Cell Physiol, 2019. 234(7): p. 11023-11036. [CrossRef]
- Chang, H., et al., From Mouse to Human: Cellular Morphometric Subtype Learned From Mouse Mammary Tumors Provides Prognostic Value in Human Breast Cancer. Front Oncol, 2021. 11: p. 819565. [CrossRef]
- Srivastava, S.K., et al., Racial health disparities in ovarian cancer: not just black and white. J Ovarian Res, 2017. 10(1): p. 58. [CrossRef]
- Torre, L.A., et al., Ovarian cancer statistics, 2018. CA Cancer J Clin, 2018. 68(4): p. 284-296. [CrossRef]
- Deb, B., A. Uddin, and S. Chakraborty, miRNAs and ovarian cancer: An overview. J Cell Physiol, 2018. 233(5): p. 3846-3854. [CrossRef]
- Mao, X.Y., et al., iCEMIGE: Integration of CEll-morphometrics, MIcrobiome, and GEne biomarker signatures for risk stratification in breast cancers. World J Clin Oncol, 2022. 13(7): p. 616-629. [CrossRef]
- Pérez-Baena, M.J., et al., Artificial intelligence-empowered cellular morphometric risk score improves prognostic stratification of cutaneous squamous cell carcinoma. Clinical and Experimental Dermatology, 2024. 49(7): p. 692-698. [CrossRef]
- Santoro, A., et al., The multiple facets of ovarian high grade serous carcinoma: a review on morphological, immunohistochemical and molecular features. Critical Reviews in Oncology/Hematology, 2024: p. 104603. [CrossRef]
- Yang, Y., et al., Tumor Microenvironment in Ovarian Cancer: Function and Therapeutic Strategy. Front Cell Dev Biol, 2020. 8: p. 758.
- Li, Y., et al., Deciphering the immune landscape dominated by cancer-associated fibroblasts to investigate their potential in indicating prognosis and guiding therapeutic regimens in high grade serous ovarian carcinoma. Front Immunol, 2022. 13: p. 940801. [CrossRef]
- Luo, Z., et al., Tumor microenvironment: The culprit for ovarian cancer metastasis? Cancer Letters, 2016. 377(2): p. 174-182.
- Biswas, S., et al., IgA transcytosis and antigen recognition govern ovarian cancer immunity. Nature, 2021. 591(7850): p. 464-470. [CrossRef]
- McKenzie, N.D., et al., Prognostic features of the tumor microenvironment in high-grade serous ovarian cancer and dietary immunomodulation. Life Sci, 2023. 333: p. 122178.
- Peres, L.C. and J.M. Schildkraut, Chapter One - Racial/ethnic disparities in ovarian cancer research, in Advances in Cancer Research, M.E. Ford, N.F. Esnaola, and J.D. Salley, Editors. 2020, Academic Press. p. 1-21. [CrossRef]
- Chang, H., et al., Stacked Predictive Sparse Decomposition for Classification of Histology Sections. Int J Comput Vis, 2015. 113(1): p. 3-18. [CrossRef]
- Chang, H., et al., Characterization of tissue histopathology via predictive sparse decomposition and spatial pyramid matching. Med Image Comput Comput Assist Interv, 2013. 16(Pt 2): p. 91-8.
- Chang, H., et al., Classification of Tumor Histology via Morphometric Context. Proc IEEE Comput Soc Conf Comput Vis Pattern Recognit, 2013. 2013.
- Jiménez-Sánchez, A., O. Cast, and M.L. Miller, Comprehensive Benchmarking and Integration of Tumor Microenvironment Cell Estimation Methods. Cancer Research, 2019. 79(24): p. 6238-6246. [CrossRef]
- Bankhead, P., et al., QuPath: Open source software for digital pathology image analysis. Scientific Reports, 2017. 7(1): p. 16878. [CrossRef]
- Bonifácio, V.D.B., Ovarian Cancer Biomarkers: Moving Forward in Early Detection. Adv Exp Med Biol, 2020. 1219: p. 355-363.
- Romero, I., et al., Morphological and molecular heterogeneity of epithelial ovarian cancer: Therapeutic implications. EJC Suppl, 2020. 15: p. 1-15. [CrossRef]
- Yeung, T.-L., et al., Cellular and molecular processes in ovarian cancer metastasis. A Review in the Theme: Cell and Molecular Processes in Cancer Metastasis. American Journal of Physiology-Cell Physiology, 2015. 309(7): p. C444-C456. [CrossRef]
- Darb-Esfahani, S., et al., Morphology and tumour-infiltrating lymphocytes in high-stage, high-grade serous ovarian carcinoma correlated with long-term survival. Histopathology, 2018. 73(6): p. 1002-1012.
- Darb-Esfahani, S., et al., Prognostic impact of programmed cell death-1 (PD-1) and PD-ligand 1 (PD-L1) expression in cancer cells and tumor-infiltrating lymphocytes in ovarian high grade serous carcinoma. Oncotarget, 2016. 7(2): p. 1486-99. [CrossRef]
- Vázquez-García, I., et al., Ovarian cancer mutational processes drive site-specific immune evasion. Nature, 2022. 612(7941): p. 778-786. [CrossRef]
- Dumitru, A., et al., Focus on PD-1/PD-L1 as a Therapeutic Target in Ovarian Cancer. Int J Mol Sci, 2022. 23(20).
- Peres, L.C., et al., Racial Differences in the Tumor Immune Landscape and Survival of Women with High-Grade Serous Ovarian Carcinoma. Cancer Epidemiology, Biomarkers & Prevention, 2022. 31(5): p. 1006-1016. [CrossRef]
- Kleinmanns, K. and L. Bjørge, Enhancing precision oncology in high-grade serous carcinoma: the emerging role of antibody-based therapies. npj Women's Health, 2024. 2(1): p. 7. [CrossRef]
Figure 1.
Study design: A schematic illustration for the study design. This study employed an advanced unsupervised cellular morphometric biomarker by machine learning (CMB-ML) pipeline for effective biomarker mining and extraction, ensuring the optimal integration of reconstructable individual biomarkers (method adopted from [1].
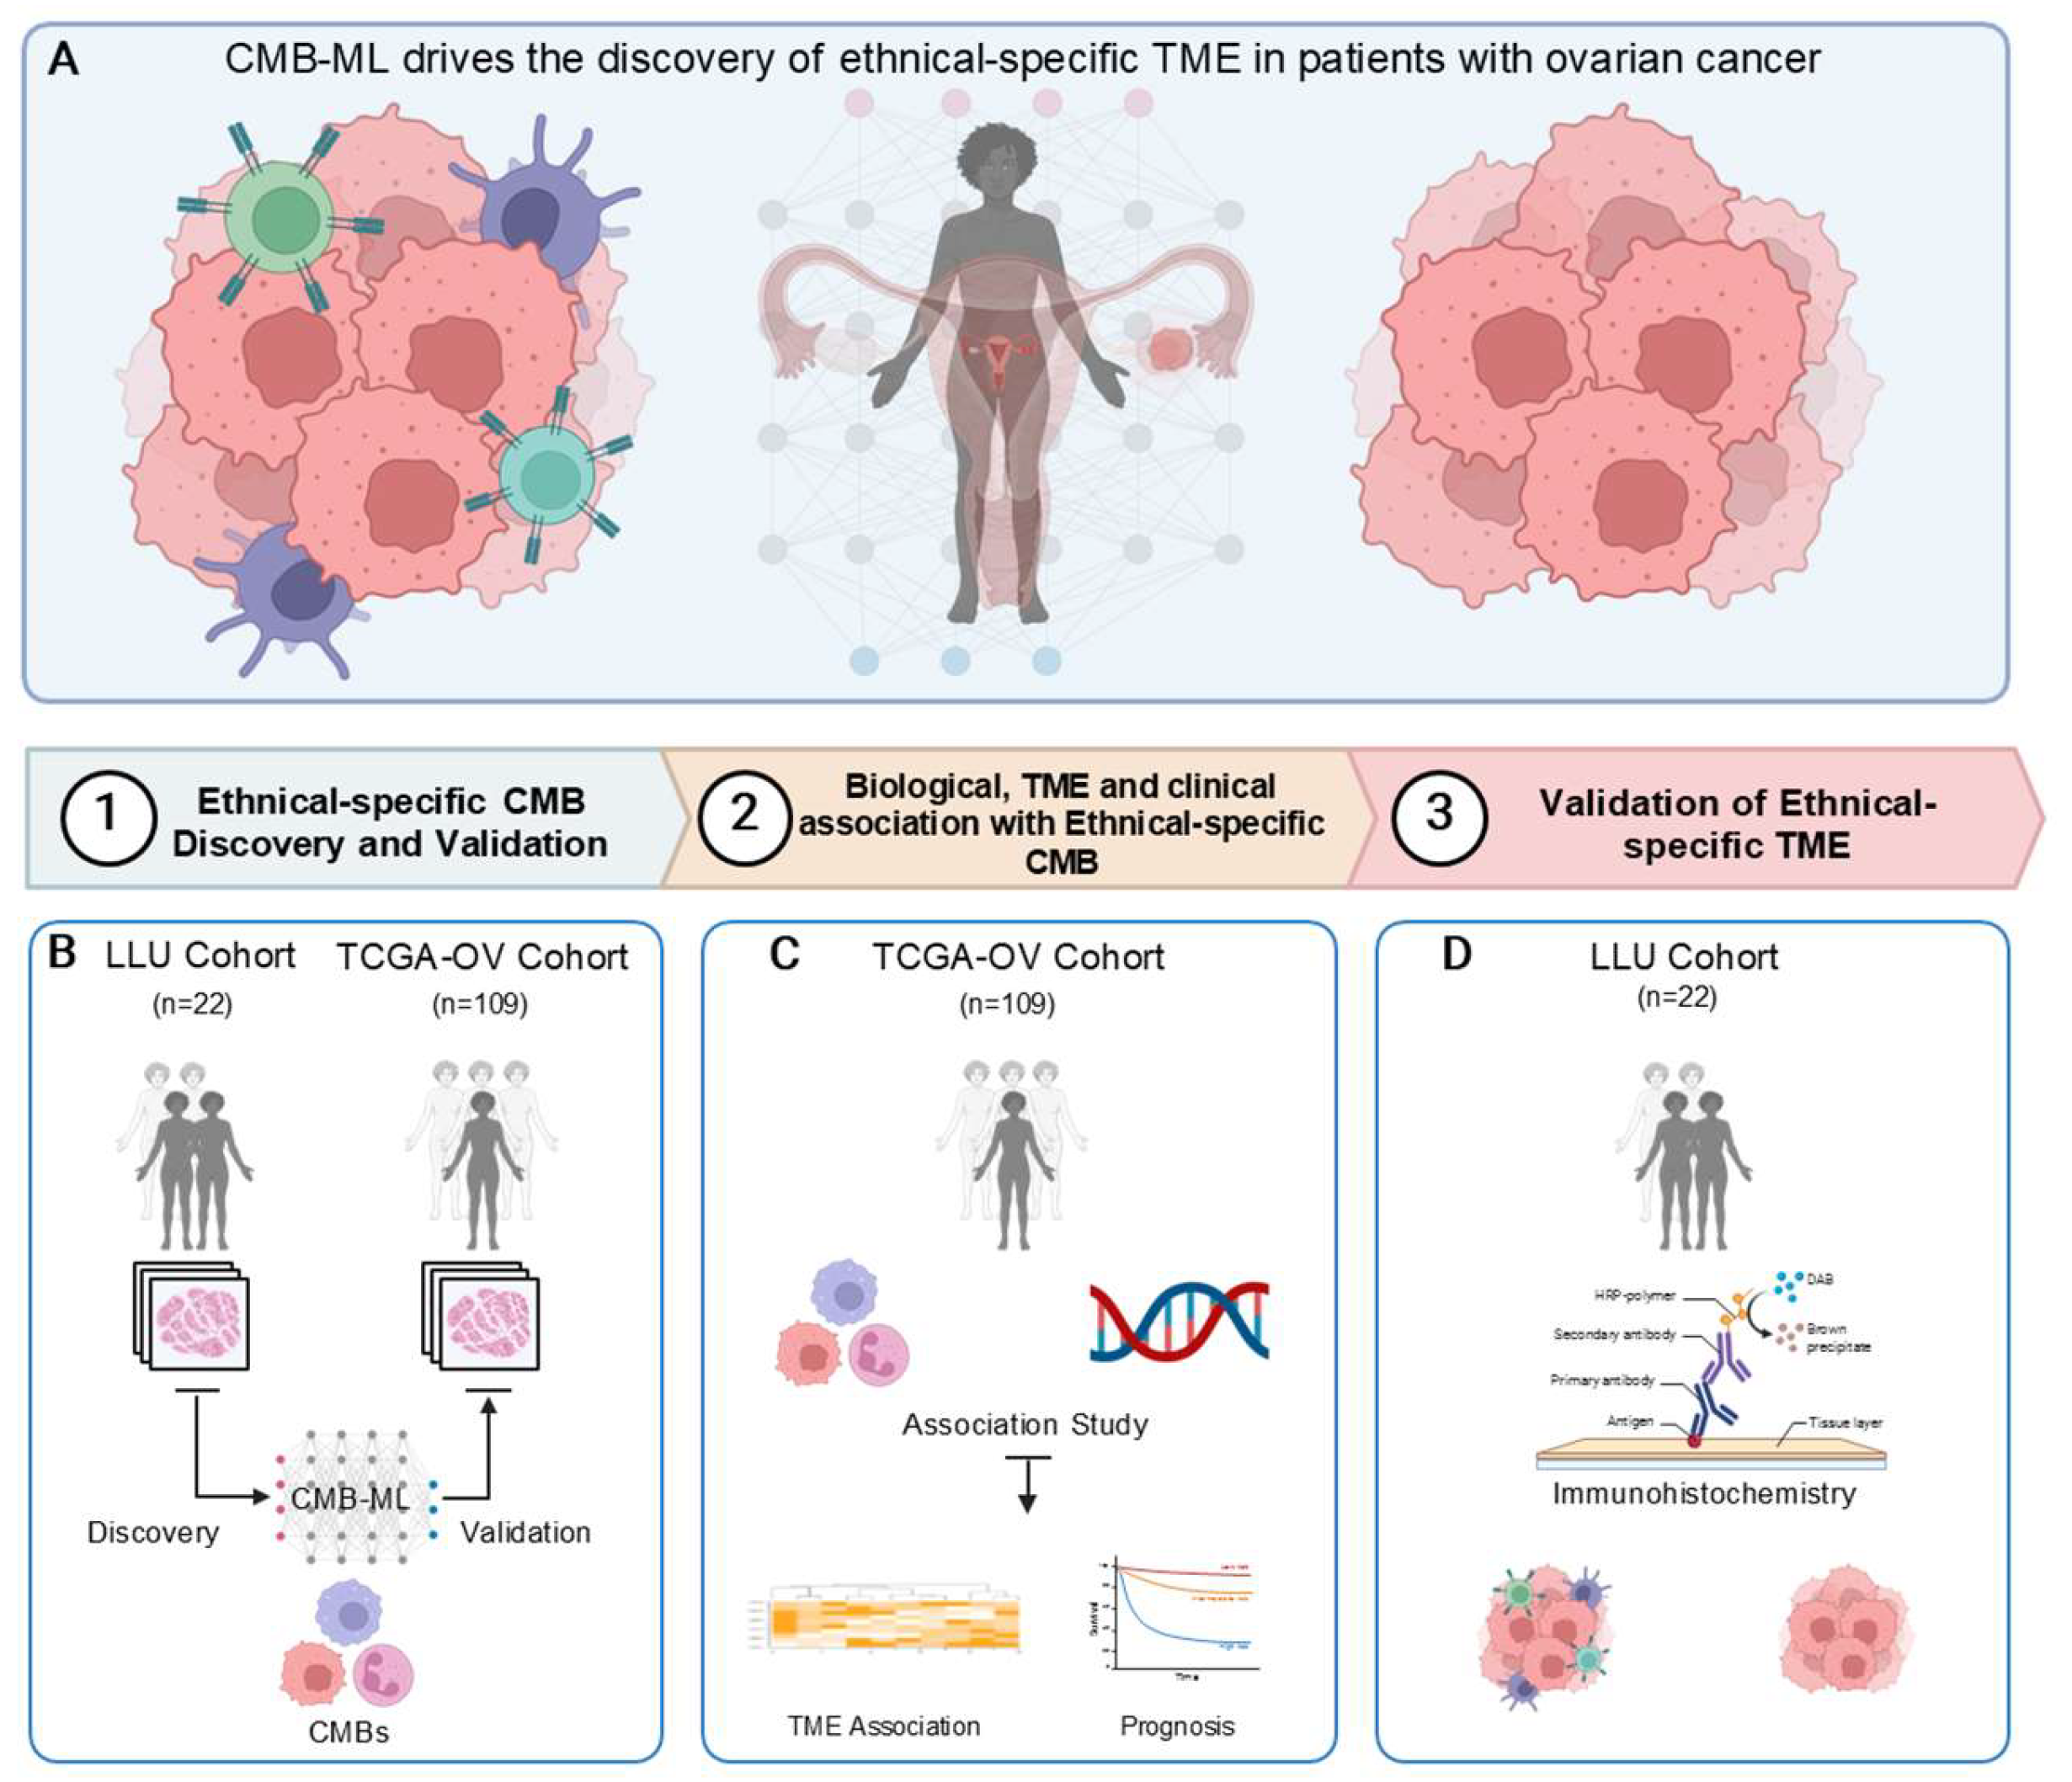
Figure 2.
CMB frequency among different ethnicities: This study revealed that there were significantly different relative frequencies in ethnic-specific (A)CMB73, (B)CMB80, and (C)CMB21(p=0.038, p=0.0052, and p=0.045 respectively) as compared to overall survival between African American and White patients in the Loma Linda University cohort. These results from the LLU cohort (n=22) were validated in the TCGA-OV cohort (n=106) for CMB 73, CMB 80, and CMB 215, producing similar results (p=0.04, p=0.0005, and p=0.024) respectively).
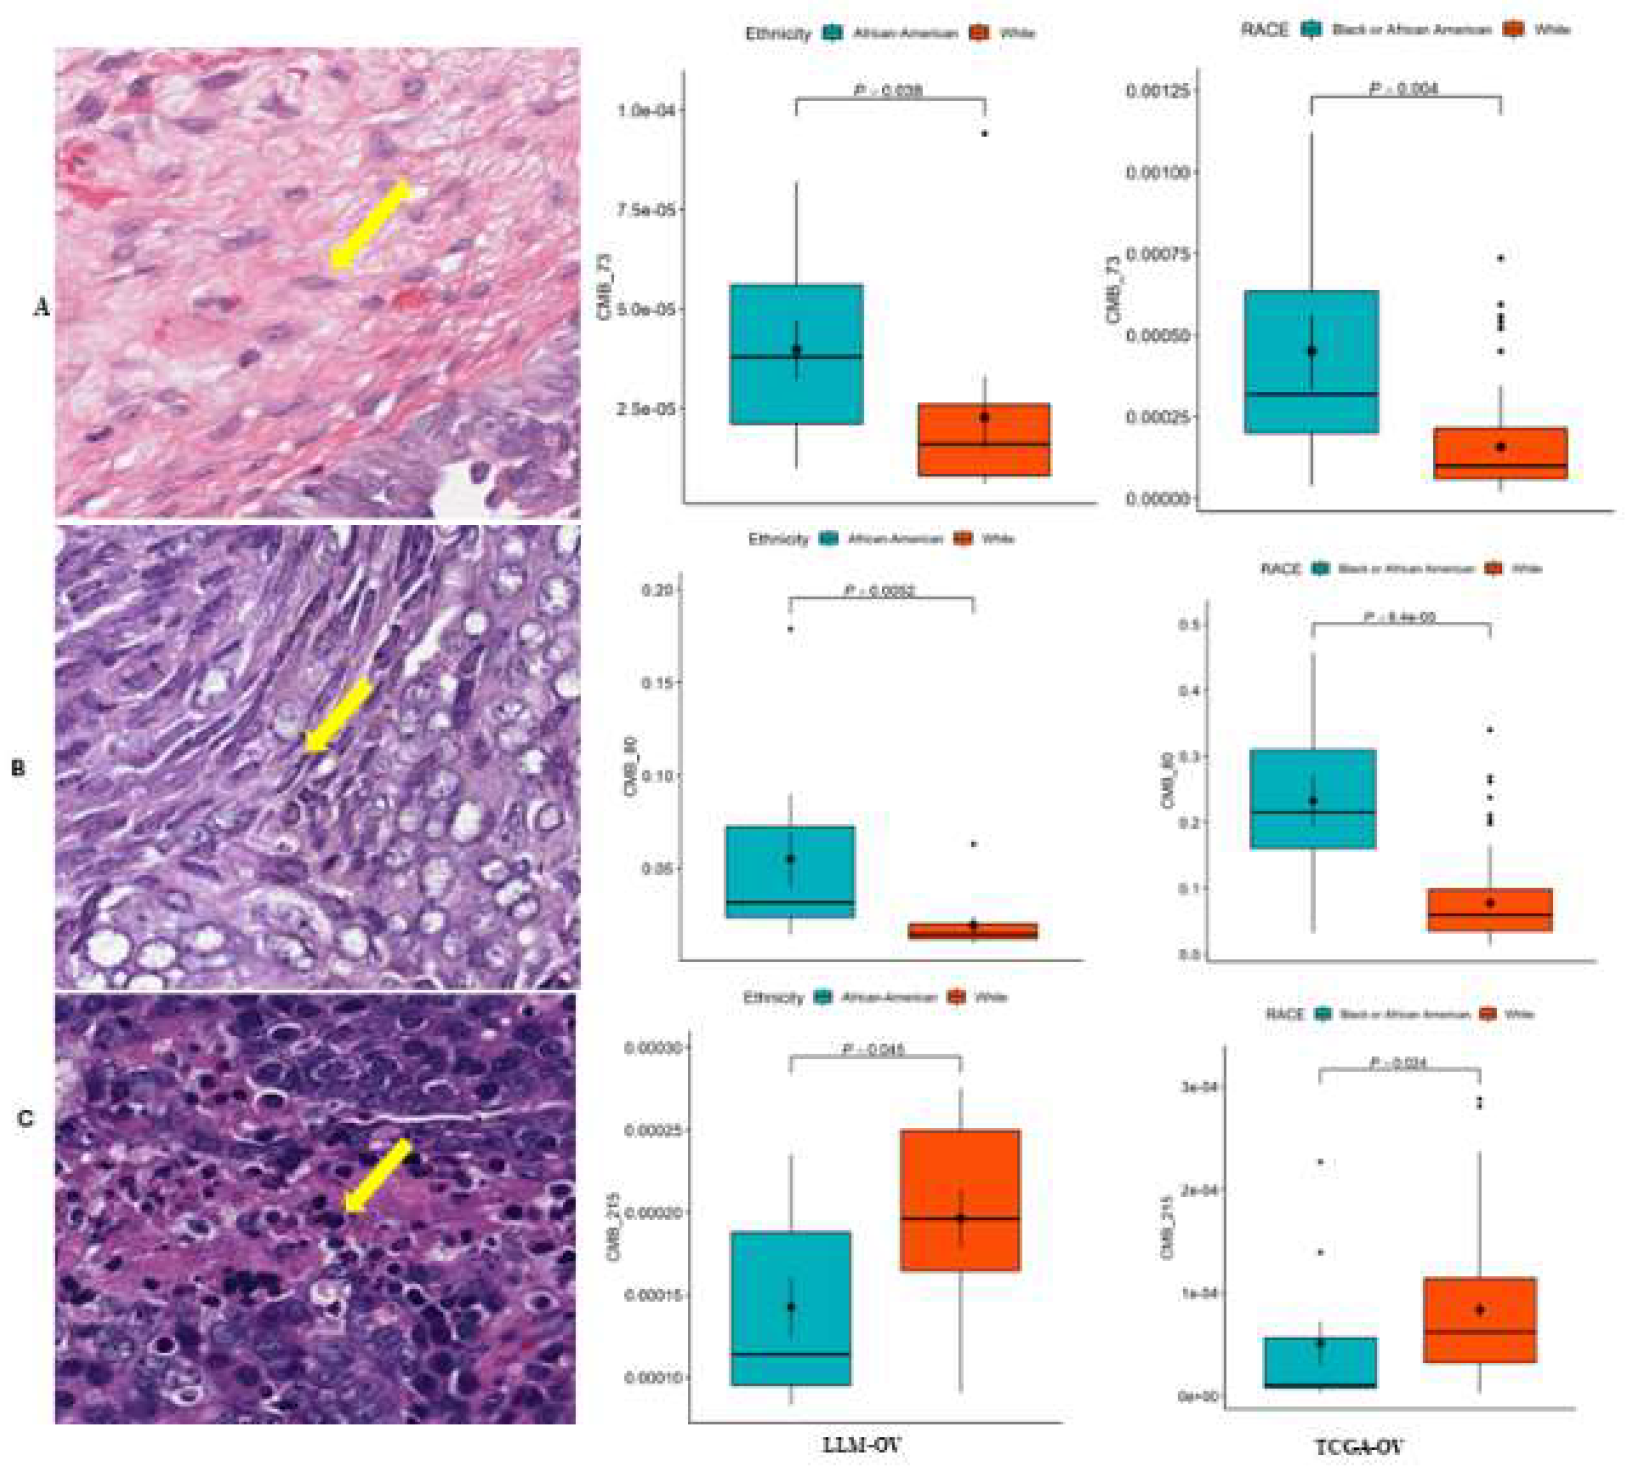
Figure 3.
Association of CMBs with Overall Survival: This study revealed distinct associations of CMB73, CMB80, and CMB215 frequencies to overall survival between the two ethnic groups. Kaplan-Meier analysis showed that a higher frequency of CMB 73 and CMB 80 correlated to significantly shorter overall survival (OS) (p = 0.022 (CMB 73) and (p = 0.023(CMB 80) in African Americans compared to White patients. A higher frequency of CMB 215 correlated to significantly higher overall survival (OS) (p = 0.051) in White patients compared to African Americans.
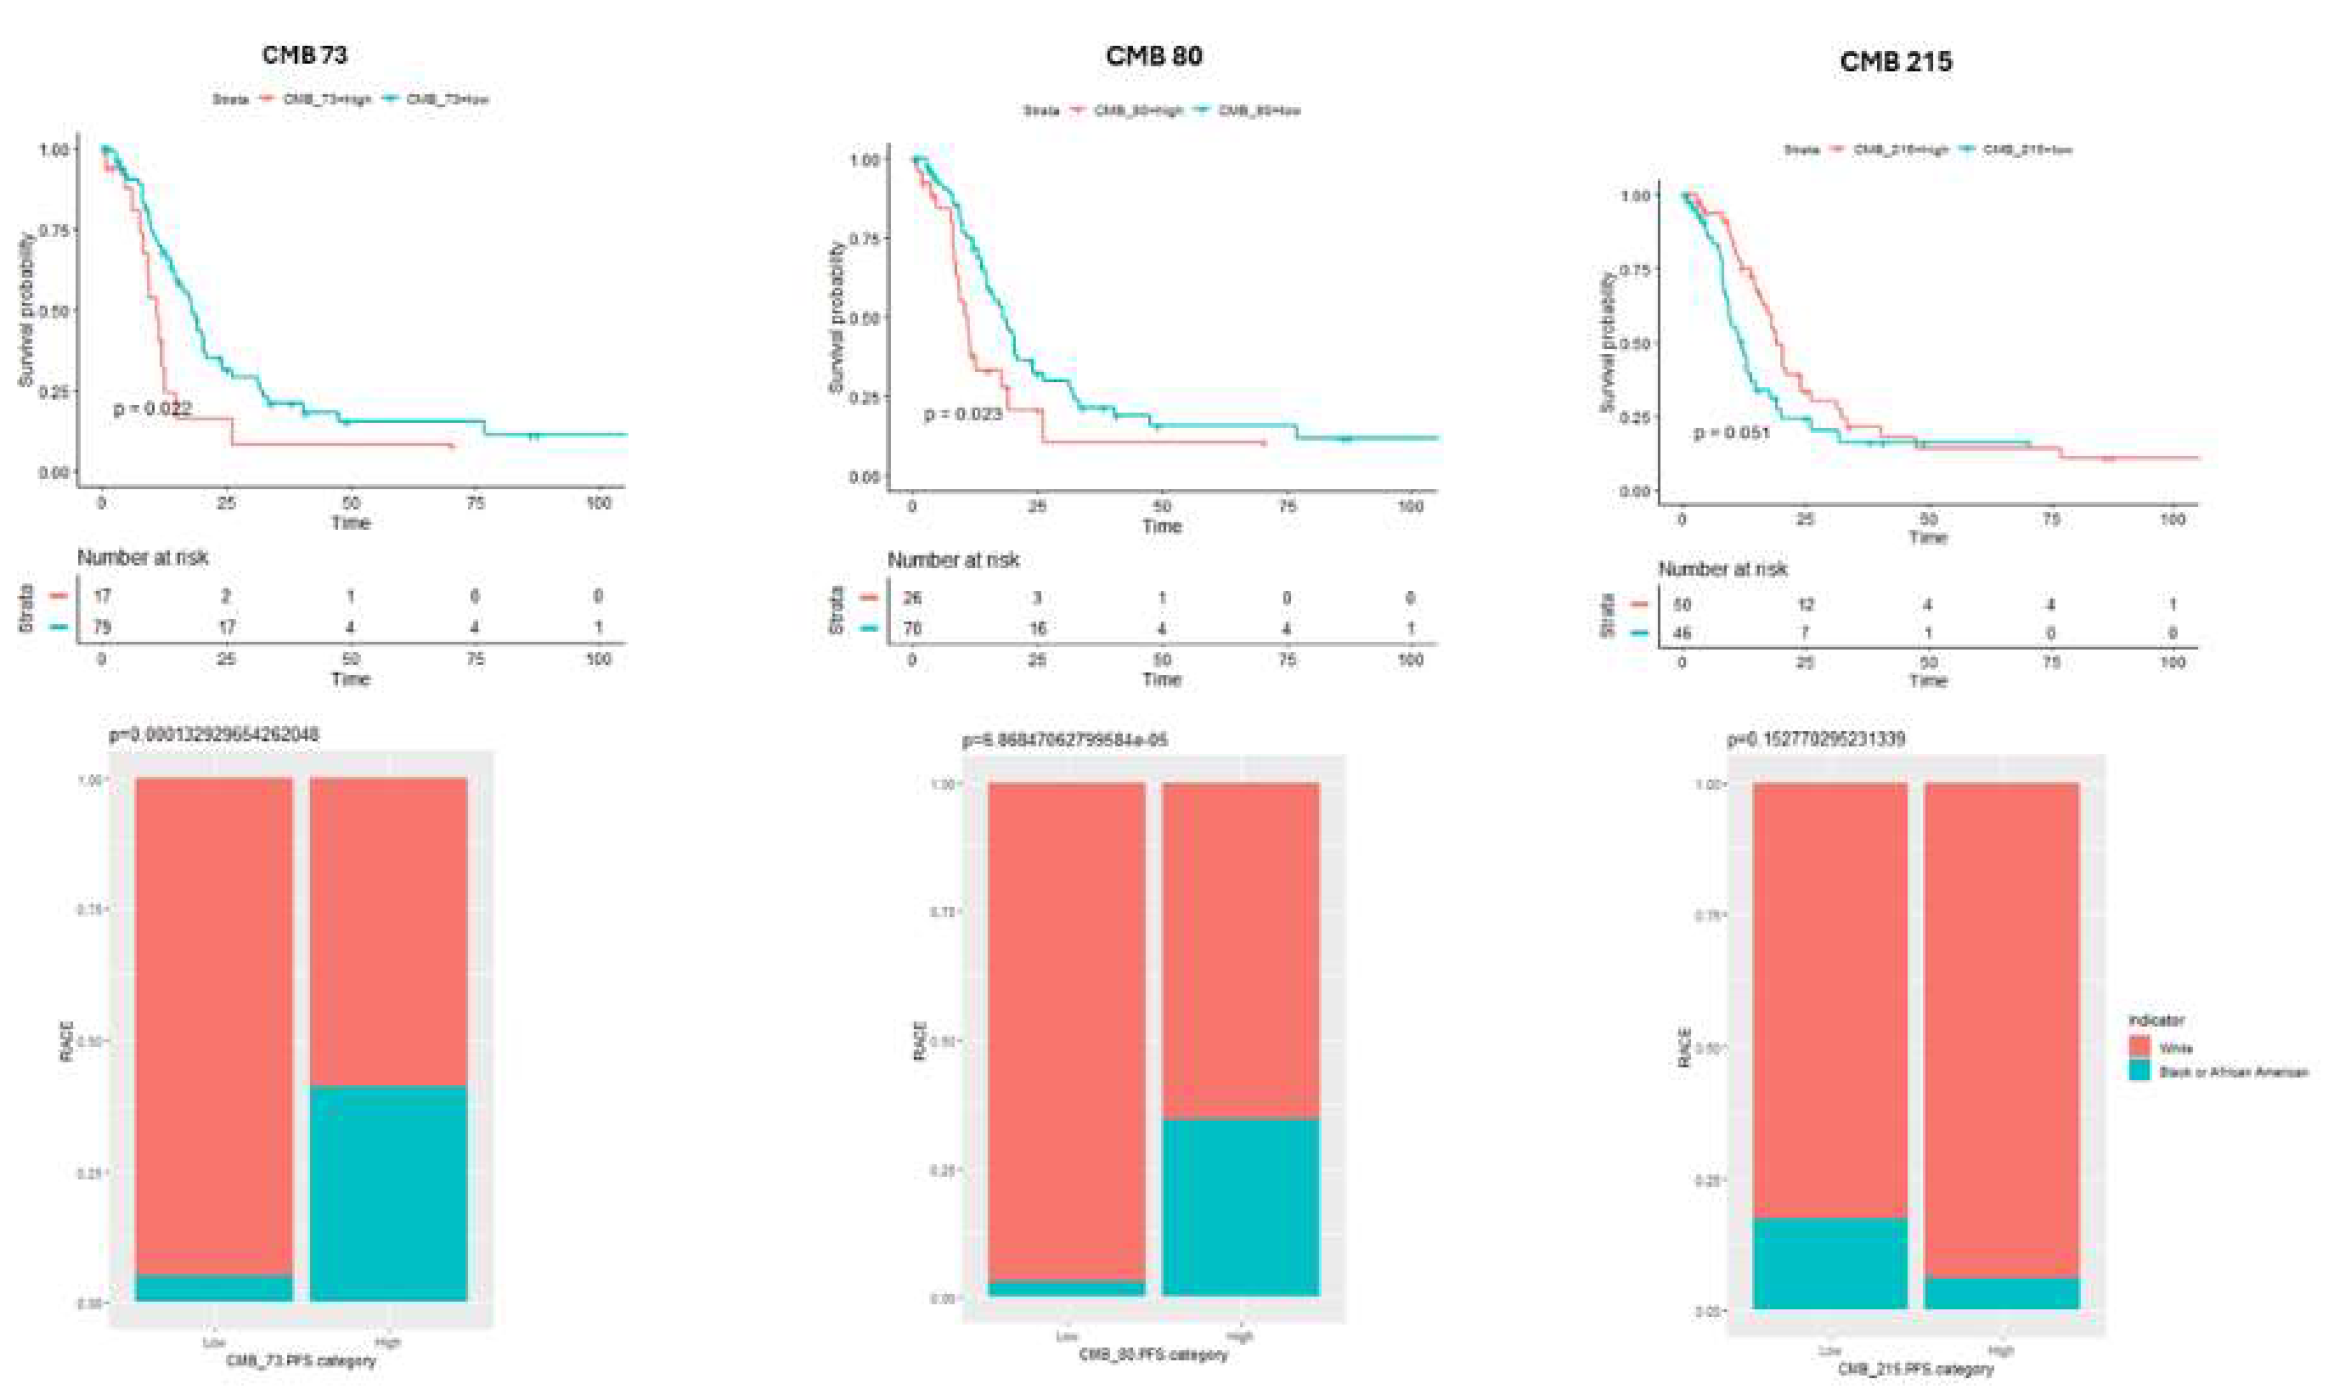
Figure 4.
TCGA - Association between CMBs and TME: This study revealed distinct associations of ethnic-specific CMB73, CMB80, and CMB215 frequencies compared to individual immune cell types in the TME. CMB association with immune cell types was as follows, CMB 215>73>80.
Figure 4.
TCGA - Association between CMBs and TME: This study revealed distinct associations of ethnic-specific CMB73, CMB80, and CMB215 frequencies compared to individual immune cell types in the TME. CMB association with immune cell types was as follows, CMB 215>73>80.
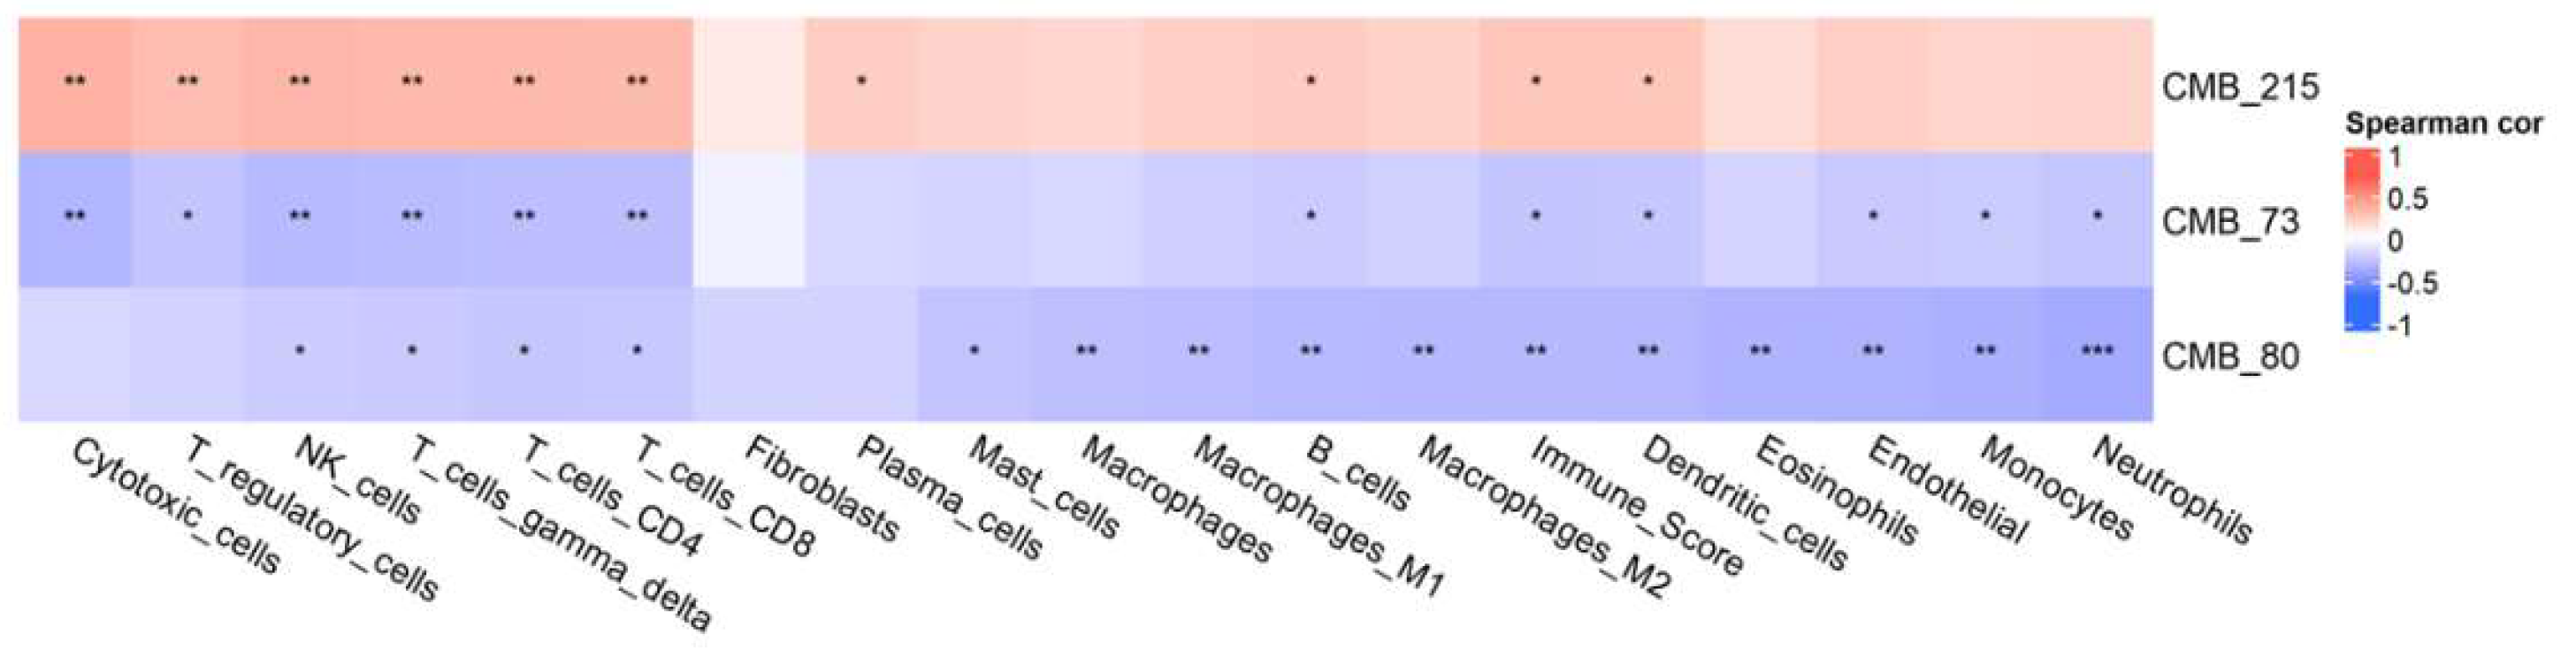
Figure 5.
TCGA Immune Check Points among RACE groups: A molecular association study with immune checkpoint markers PDCD1(p=0.033), PDCD1LG2(p=0.014), and CD8A (0.014) in the TCGA-OV cohort indicated significantly lower immune infiltration in African Americans and significantly higher immune checkpoints in White patients.
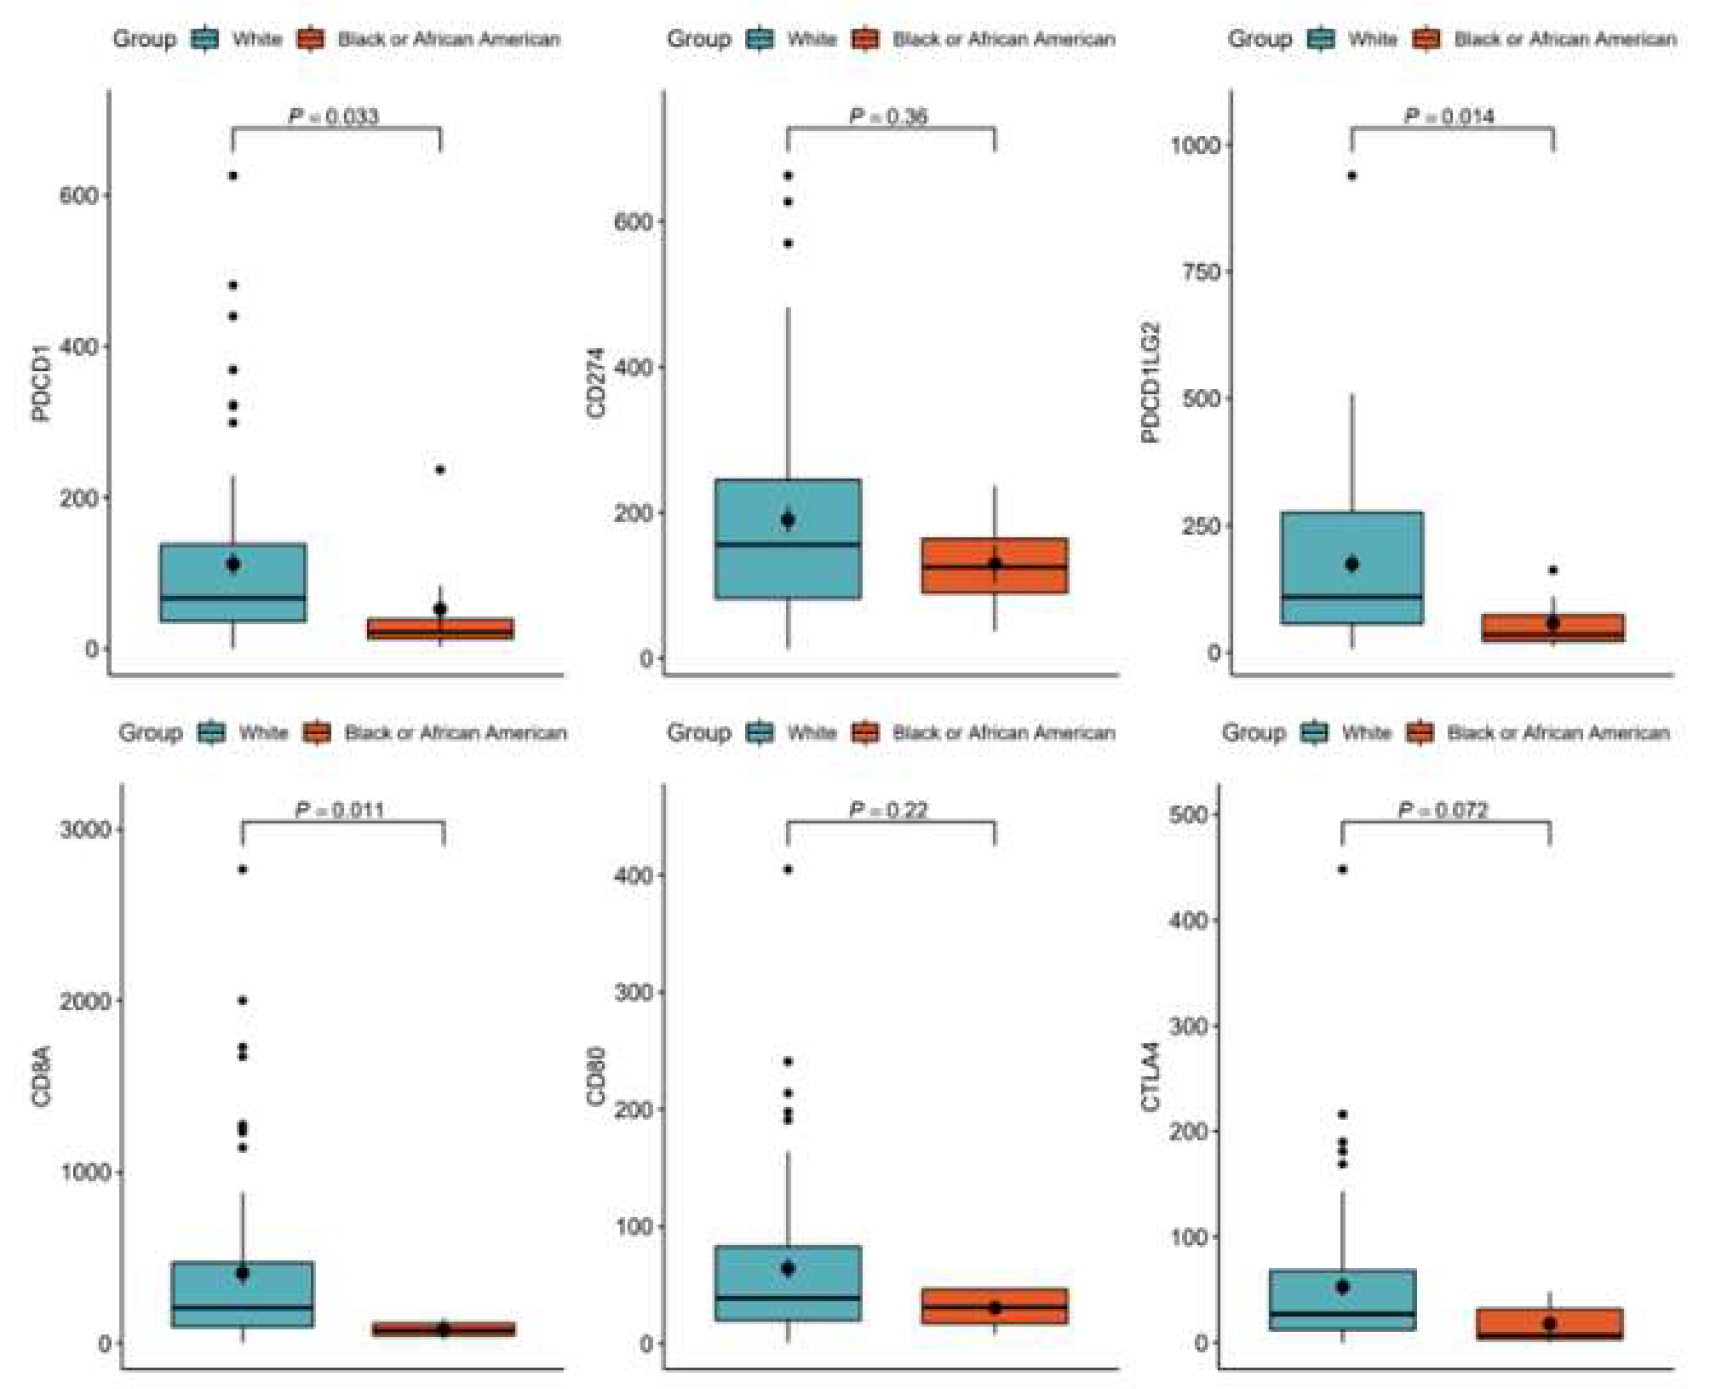
Figure 6.
a-f: Tissue immunoexpression of CD3, CD8, and PDCD1 in high-grade serous ovarian carcinoma., (a-c) CD3,CD8 and PDCD1immunoexpression in AA patient, (d-f)-CD3, CD8 and PDCD1 immunoexpression in White patient. Brown staining represents tissue immunopositivity for the immunohistochemical reaction with the monoclonal antibodies anti-CD3, anti-CD8, and anti-PDCD1, demonstrating the presence of the respective T-cells in the surface of the high-grade serous ovarian carcinoma cells. Photomicrograph at 20× magnification.
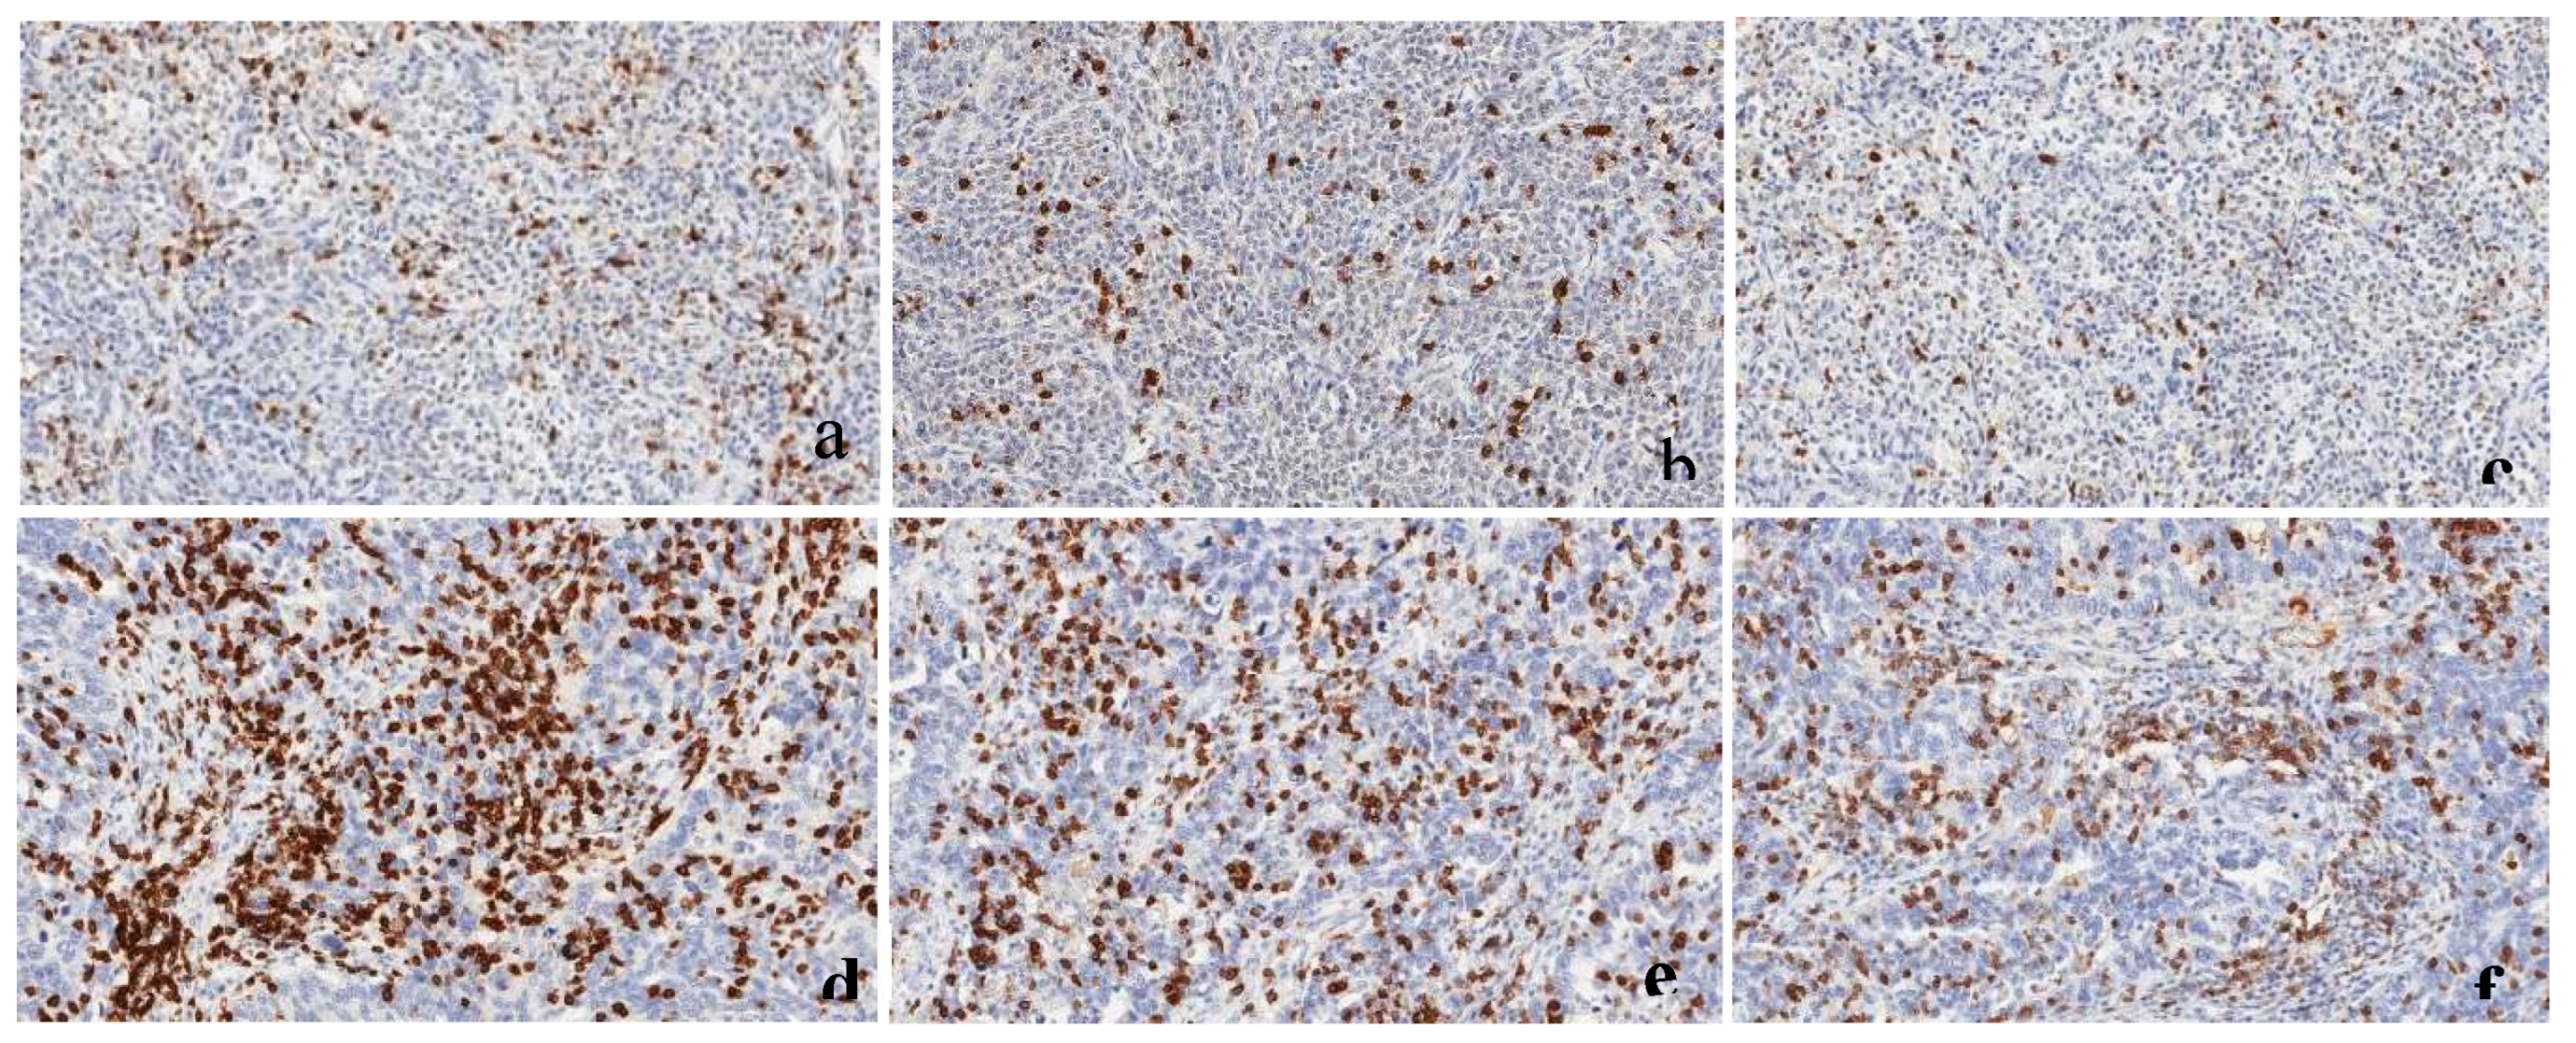
Figure 7.
a) T-cell inflamed tumor tissue (Hot): Tissue rich in tumor-infiltrating cells expressing high counts of CD3/8 in both Tumor and stroma b) T-cell excluded tumor tissue: Tissue rich in tumor-infiltrating cells expressing high counts of CD3/8 in the stroma but few cells in the tumor c) T-cell devoid tumor tissue (cold/ immune dessert): Tissue lacking tumor-infiltrating cells ex-pressing CD3/8 in both Tumor and stroma.
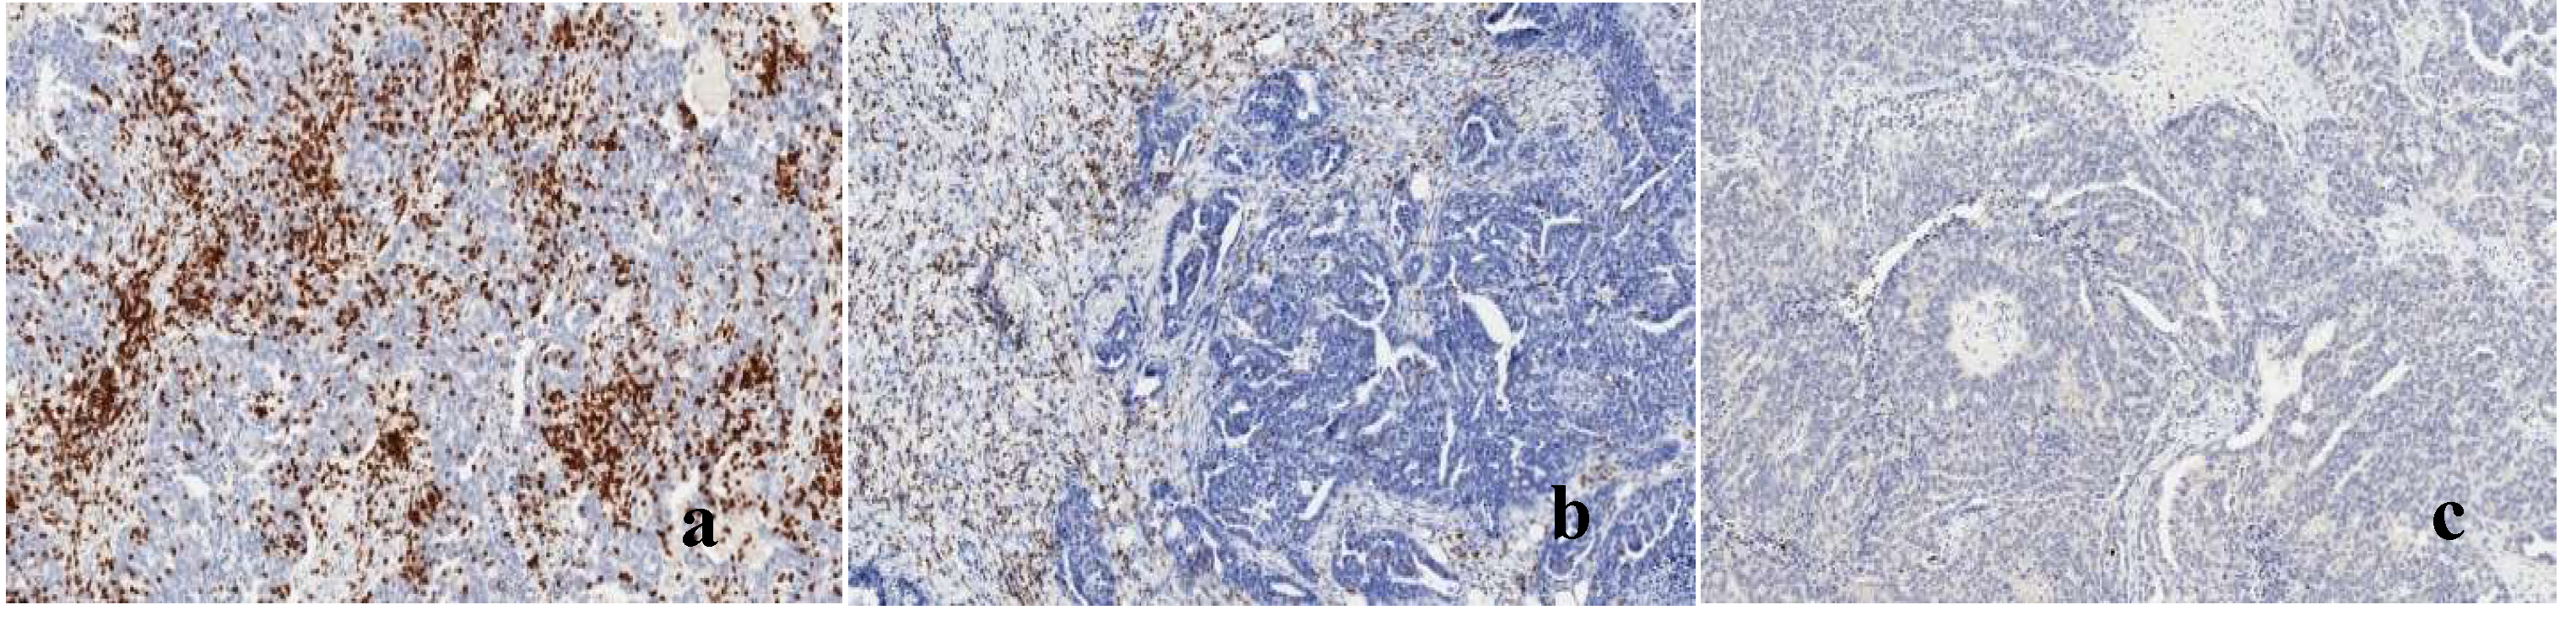
Table 1.
LLU Cohort Patient cohort information (n=22).
| African American (N=11) |
White (N=11) |
P-value | |
|---|---|---|---|
| Age of diagnosis | |||
| Mean (SD) | 62.5 (9.74) | 62.2 (12.8) | 0.847 |
| Median [Min, Max] | 63.5 [50.5, 76.8] | 62.9 [39.5, 81.3] | |
| Stage | |||
| I | 2 (18.2%) | 4 (36.4%) | 0.254 |
| II | 2 (18.2%) | 0 (0%) | |
| III | 6 (54.5%) | 4 (36.4%) | |
| IV | 1 (9.1%) | 3 (27.3%) |
All 22 patients were diagnosed with high-grade serous ovarian cancer (HGSOC). 11 patients were African American while 11 were White. All patients had an average age of 62.3 years at diagnosis. The youngest and oldest patients were 39.5 years old and 81.3 years old, respectively. Overall survival was 39.5 months.
Disclaimer/Publisher’s Note: The statements, opinions and data contained in all publications are solely those of the individual author(s) and contributor(s) and not of MDPI and/or the editor(s). MDPI and/or the editor(s) disclaim responsibility for any injury to people or property resulting from any ideas, methods, instructions or products referred to in the content. |
© 2025 by the authors. Licensee MDPI, Basel, Switzerland. This article is an open access article distributed under the terms and conditions of the Creative Commons Attribution (CC BY) license (http://creativecommons.org/licenses/by/4.0/).
Copyright: This open access article is published under a Creative Commons CC BY 4.0 license, which permit the free download, distribution, and reuse, provided that the author and preprint are cited in any reuse.


