Submitted:
28 July 2025
Posted:
29 July 2025
You are already at the latest version
Abstract
Intrinsically-disordered regions (IDRs) are sometimes considered parts of the ‘dark proteomes’, i.e., protein parts that have been largely under-appreciated, as are the overlapping phenomena of low-complexity or compositionally-biased regions (LCRs/CBRs). Experimentalists and computationalists alike are still learning how to decrypt the functionally meaningful features of such regions. Here, I report the creation of the support troupe Patterny to aid such protein cryptanalysis. The current troupe members are named Blocky, Bandy, Moduley, Repeaty, and Runny. Each dissects protein regions through comparing to ideal assortments wherein everything is sampled proportionally and dispersed randomly. Blocky discerns the segregation of amino-acids by type, and scores them for it. Bandy is focused on picking out compositional bands and calculating their evenness. Moduley labels the boundaries of optimized compositional modules (‘CModules’) and other possible boundary sets for compositionally-biased regions. Repeaty concisely summarizes repetitiveness using an information entropy of amino-acid interval diversity. Runny enumerates homopeptide content and assesses its significance. Both original whole sequences and CModules from Moduley, are fed into the other Patterny members. Patterny is applied to some illustrative sample data from yeast proteome and the DISPROT database. It is available at: https://github.com/pmharrison/patterny/, and might aid those aiming to intensify light-shedding and hypothesis generation for protein regions with function encoded in a distributed manner, such as IDRs and LCRs/CBRs more generally.
Keywords:
intrinsic disorder
; compositional bias
; low complexity
; annotation
; function
; software
1. Introduction
Intrinsically-disordered regions are protein parts that remain unfolded during at least a part of their functioning. They have long been associated with lower ‘sequence complexity’, i.e., the sequences are generally simpler, more repetitive and sample residue types un-evenly [1,2]. Originally, the term ‘low-complexity’ as applied to proteins had a strictly algorithmic meaning, referring to sequence tracts that had lower information entropy, as calculated by the algorithm SEG by Wootton & Federhen [3]. ‘Compositional bias’ is a more general term that covers a range from highly biased and repetitive sequences to those that have a milder compositional skew [3,4]. Arguably, sequence complexity per se is less likely to be under selection in protein sequences than say a specific compositional bias for amino acids that has a functional role, and it is also not clear where an imaginary boundary around the concept of ‘low-complexity’ could be placed [4]. Compositional biases are directly linked to functional roles of IDRs [5,6].
However, IDRs and CBRs are not simply compositional entities. They have various types of patterning such as repeat structure, alternating compositional blocks or bands, multiple discrete compositional modules/motifs, and amino-acid runs or ‘homopeptides’. Such residue patterning in IDRs can have functional significance e.g., repeat patterns in prion-determinant domains [7]; patterning of charged residues into blocks (i.e., residue ‘blockiness’) in transcriptional regulators and nucleolar proteins [8,9]; homopeptide content in transcriptional activators [10]; compositional modularity in stress-response proteins such as the water stress sensor protein FLOE-1 in Arabidopsis [11]. Some tools have been developed in recent years to tackle characterizing such patterning. The program NARDINI was developed to analyze specific types of binary compositional patterning in IDRs [12]. Particularly for CBRs, the program LCD-Composer can be applied to analyze both compositional bias and residue dispersion, the inverse concept to ‘blockiness’ [13], and the LCT server analyses ‘low complexity’ and distance to perfect repeat structure [14]. Blockiness and homopeptide content were demonstrated to have strong functional associations for intrinsically-disordered CBRs in Saccharomyces cerevisiae [5].
To aid those venturing deeper into the dark proteomes, I have assembled a troupe of five decipherment helpers, collectively called Patterny. These are programs that each focus on one particularly feature of IDRs and CBRs, as listed above in the Abstract. They have been applied to three large data sets, and the penetrance of the analysed phenomena are discussed. Some illustrative examples are probed in more detail.
2. Materials and Methods
2.1. Data Sets
The DISPROT database of intrinsically-disordered regions was downloaded in FASTA format in July 2025 [15]. This was reduced for sequence redundancy using an algorithm previously described [16], yielding a set of 6,643 sequences. The proteome of budding yeast Saccharomyces cerevisiae (strain 288c) was obtained at the same time from UniProt [17]. For comparative purposes, the ASTRALSCOP40 data set of protein domain sequences (version 2.08) was also analyzed [18]. Orthologs of the illustrative example Chromogranin-A were taken from the OrthoDB database [19], and from previously calculated fungal ortholog sets by the author for the other example MSA2 [20].
2.2. Annotation of Compositional Bias Using fLPS2
2.3. Patterny Flow Design
The Patterny flow is drawn in Figure 1A. Submitted sequence data is assessed by each program individually, however output of the Moduley program is further fed into the Blocky, Repeaty and Runny programs. Bandy operates separately. The individual programs/scripts are described below.
2.4. Moduley: Labelling Compositional Modules (CModules) and Other Possible Compositional Boundaries
Compositional modules (CModules) are defined as regions of compositional bias, optimized over a range of possible parameter sets. Moduley performs this definition task (Figure 1B). For this, a list of twelve fLPS2 parameter sets that were applied to thoroughly picking apart the functional associations of intrinsically-disordered compositional biases (Table 1 in ref. [4,5]), were re-applied here. All the annotated compositionally-biased regions from all the outputs are sorted on increasing P-value. Then for any one region, any other region with the same primary bias (i.e., most dominant residue type) and with overlap over most of its extent (≥0.5) is de-selected. This progressive de-selection continues until there are no more regions to assess.
In parallel, larger lists of boundary sets are formed through an analogous de-selection procedure, except the criterion for overlap is to have both ends within a small margin (=5 was found to be suitable).
There is one flag for the Patterny script (‘–cmodules yes|no’), which can be used to turn off calculation and analysis of CModules, e.g., if a set of previously calculated CModules is being digested.
2.5. Bandy: Discerning Compositional Banding
Compositional banding occurs when two or more patches of the same primary compositional bias are detected in an input sequence. Bandy has been designed to pick out sets of bands and to assess how evenly arranged these bands are. To discern band sets, a new option in the fLPS2 program was applied (‘-b’) which allows for minimum window lengths down to 3, while keeping maximum window sizes ≤20. A set of twelve parameter sets using very smaller window sizes was applied, and the resulting annotations were pooled and then segregated according to their primary residue bias, or both primary and secondary residues biases for multiple-residue biased regions (Figure 1C).
Each band set was then assessed for its distance to perfect banding (DPB). This is calculated by: (1) re-distributing the endpoints of the bands evenly over the same overall span; (2) calculating the deviation of each original endpoint to its corresponding ‘perfect’ endpoint; (3) summing these deviations to get DPB. The original DPB values are then compared to the DPB values arising from a sample of 1,000 random endpoint sets of the same number placed along the same span, to derive z-scores and P-values (Figure 1C). In doing so, for band sets with band number ≥4, outlier intervals between bands are labelled and excised if their median absolute deviation is ≥3.5. Finally, for each primary bias, the following are output: (a) the band set with the highest band number (if there is a tie, the one with the smallest P-value is picked); (b) the band set with the lowest z-score; (c) the band set with the highest z-score.
2.6. Blocky: Assessing Residue Segregation
The Blocky algorithm was described previously [5]. It calculates a blockiness score (B), which is an indicator of how segregated residue types are along an input sequence (Figure 2A). Originally, it was normalized using time-consuming calculations of minimum possible blockiness. Here, it is simplified relative to its previous treatment, so that only the raw score B is considered, but also now it is compared against values calculated for 1,000 scrambled sequences of the same composition. From the B distribution, z-scores and P-values are calculated. Residue-specific blockiness values are also determined in the same way. Where residue-specific B values are > the overall B value, this indicates that the residue is contributing to the residue segregation tendency.
2.7. Runny: Measuring Homopeptide Content
Homopeptides are defined as runs of amino acids of the same type with a minimum length of 3 residues [23]. Previously we dissected the intimate connection between homopeptide content (hpep) and the function of intrinsically-disordered compositionally-biased regions (ID-CBRs) [5]. Here, Runny calculates homopeptide content and assesses its significance relative to a population of 1,000 scrambled sequences of the same composition, as above for Blocky (Figure 2B).
2.8. Repeaty: Calculating Repetitiveness
Repeaty calculates the overall repetitiveness of a sequence using a concept of residue interval entropy (IE) drawn up here, which is given by:
where there are N types of residue interval. N comprises all possible interval types of the sort x…[δ]…z, where the interval δ is in the range 0 to 100, and the residue pairs x and z are all possible pairings, including those with x=z. To make the calculation computationally tractable, only intervals between residue types that occur at least three times in the sequence are considered. As above for Runny and Blocky, the significance of the value of IE is assessed relative to a population of 1,000 scrambled sequences of the same composition (Figure 2C). IE values just for intervals with x=z (same-residue) and x≠z (different-residue) are also determined.
In addition to these overall IE values, an ‘experimental’ output of the top ten intervals contributing most to IE is provided, sorted in two different ways: (1) any significant interval, but sorted on decreasing frequency; (2) sorted on significant P-value.
2.9. The Patterny Script and the Program Implementations
Each of the components of Patterny are written in C and shell script (with one short AWK script), and executed using a shell script (patterny, either BASH or zsh, there are no shell-specific commands). The current version of fLPS2 (2.1, described above) has also been updated. The package is available from Github [https://github.com/pmharrison/patterny/], and includes some examples input and output files. The details of program execution and output format appear in the README.
3. Results & Discussion
3.1. Rationale, Test Data Sets & Performance
Patterny is a troupe of decipherment helpers designed to provide information which may guide further inquiry and hypothesis generation for protein regions whose function is encoded in a distributed manner, such as IDRs, and LCRs/CBRs more generally. Currently, there are five members in the troupe that focus on different distributed properties. Firstly, Moduley discovers optimized compositional modules (termed CModules), and also longer lists of Boundary Sets for compositionally-defined regions. The latter may be useful for picking more sensible tracts to piece together for experimental constructs, or someone might even be keen on applying them to more thorough bioinformatical analyses. Secondly, Bandy labels compositional banding, which occurs when there are at least two tracts with the same primary amino-acid compositional bias. Thirdly, Blocky assesses the overall segregation of residues by type along a sequence tract (blockiness). Fourthly, Runny highlights sequence tracts that have significant enrichments (or occasionally, lacks) of homopeptides, i.e., runs of amino-acid residues ≥3 in size [23]. Both the latter properties were demonstrated to have clear functional associations for tracts with the same primary bias in the model organism Saccharomyces cerevisiae [5]. Fifthly, Repeaty measures the overall repetitiveness of a tract using a novel conception of residue interval entropy, and provides output that highlights the most prominent residue intervals. Repeaty assesses repetitiveness without explicitly pulling predicted repeats out of the input.
Two data sets were derived for testing Patterny: (1) the DISPROT database of intrinsically-disordered regions found by experiment was reduced using a clustering procedure previously developed [16], to make it non-redundant (DISPROTNR); (2) A set of CModules from the S. cerevisiae (budding yeast) proteome found by the Moduley program (CModulesYEAST). A third set of structural protein domain sequences, ASTRALSCOP40 takes on the role of a comparative ‘control’.
The performance of the package was checked for the DISPROTNR set (6,643 sequence tracts) and the CModulesYEAST set (24,043 sequence tracts). The full Patterny package takes 39.1s system time to process DISPROTNR and 103.5s for the CModulesYEAST, with ~>90% of these timings being taken up with the Repeaty program. For CModulesYEAST, derivation and assessment of Cmodules is not carried out (‘–cmodules no’). These timings were assessed on a 2020 Apple Mac Mini with an M1 chip and 16GB RAM. The package can thus analyze large databases and proteomes quite tractably.
3.2. Prevalences of Features in the DISPROTNR Set
To gauge the penetrance of the phenomena explored, I summarized all the results for the three data sets in a big table (i.e., Table 1). CModules are a common feature of every data set, but the average –log(P-value) of the compositional bias is substantially lower for the larger abundance of them in the ASTRALSCOP40 structural domain sequences (~4.4, i.e., P-values of about 10–4), compared to DISPROTNR (~8.3), and CModulesYEAST (~6.4). Compositional banding occurs for about 1 in 10 of sequences regardless of origin, and there is even a handful of banding patterns ≥3 in number and ‘significantly uneven’ (0.2% in DISPROTNR and CModulesYEAST). Significant blockiness and homopeptide content (hpep) are most common in DISPROTNR, with significant repetitiveness actually most common in ASTRALSCOP40, but ≥9% frequency for all three data sets. Again, there are diminutive handfuls of sequences that are significantly un-blocky, un-repetitive or lacking in hpep (Table 1).
Are Blocky and Bandy redundant in utility? Maximum blockiness occurs when residues are perfectly segregated by type. Perfect banding occurs when a residue type occurs in bias bands that are perfectly spaced. However, only about 21% (90/430) of the DISPROT entries that have ‘significantly even’ bands are also ‘significantly blocky’ by the Blocky algorithm, indicating some overlap, but a substantial difference of emphasis.
3.3. Ranges of Behaviour for the Properties Explored
As a validatory exercise, extremes of modularity, blockiness, band evenness, hpep, and repetitiveness were examined. These are listed in Suppl. File S1. The output from each example for the relevant Patterny program has been isolated along with its sequence. (The description of the headers is given in detail in the README bundled with the package.) Just to highlight a few of these examples, firstly, an extreme case of modularity is the frequency clock protein from Neurospora crassa, which has 16 CModules which do not merge into a larger CModule, such as is observed in the C-terminal fragment of S/A-repeat-containing protein D from Staphylococcus aureus [24,25]. Disprot entry DP01621r005 (the C-terminal IDR of the LANA protein from Herpesvirus 8) is both extremely un-blocky and devoid of hpep [15]. To demonstrate the effectiveness of IE at ascertaining repetitiveness, the most extreme value is observed for the central disordered fragment from Nucleoporin NSP1 from S. cerevisiae (DP01077r015), with a z-score of -46.1) [26]. This protein contains several large exact repeats.
3.4. Detailed Example from DISPROT: Chromogranin-A from Domestic Cod
Two detailed random examples of no particular interest were picked from each data source. The output files for these examples are available at Github [https://github.com/pmharrison/patterny/tree/main/Examples/output]. Firstly, the protein chromogranin-A from Bos taurus (domestic cow) (entry DP00118r011 from DISPROT). Chromogranin A is a multi-functional precursor that, through its proteolytic cleavage, generates a family of biologically active peptides that collectively exert regulatory effects on diverse physiological systems in vertebrates. It is experimentally demonstrated to be ~100% intrinsically-disordered [15,27]. It was probed for a small panel of vertebrates. The CModules observed in it are drawn in Figure 3A, with other Patterny outputs summarized in 3B. Significant blockiness is a feature of chromogranin-A for several vertebrates, and any blockiness observed is centred around E, L, A and S residues chiefly. There are notable hpep enrichments in the mammalian sequences generally for E-homopeptides, and for Q-homopeptides specifically only in mouse. The sequences have a significant conserved repetitiveness across all species that stems largely from intervals between different residue types. These results are observed for both the whole sequences and the largest CModules within each sequence.
3.5. Detailed Example from CModulesYEAST: Putative Transcriptional Activator MSA2 from S. cerevisiae
The second example is MSA2 a putative transcriptional activator that along with its paralog MSA1 is a key regulator of the G1/S transition of the cell cycle. MSA2 originated after the whole-genome duplication of budding yeasts; it is sporadically conserved across Saccharomycetaceae, and originated since the last common ancestor of that clade. Alphafold predicts it as almost completely disordered, with intermittent alpha helices (for reference, please see its UniProt database record [17]). Here, we observe that MSA2 has a core CModule that tends to contain S, N and P residues (Figure 4A). There is compositional banding for N residues across most species, and conserved significant blockiness is observed in Saccharomyces (S_*) and Naumovozyma (N_*) species that is mainly caused by segregation of S, N, T, P and K residues, while significant hpep is observed in most of the species, most notably for S and N residues. Unlike the DISPROT example, there is not a conserved significant repetitiveness over the whole data set (just within the Saccharomyces genus, and in N. glabratus), either across whole orthologs or just within CModules. In a recent analysis of ID-CBRs (intrinsically-disordered compositionally-biased regions), the short Q-rich tract in MSA2 is linked to clusters with a possible function in regulation of transcription by RNA polymerase II (GO:0006357), and the N-rich tract to various categories linked more generally, or more specifically to regulation of transcription (e.g., GO:0006355, GO:0045944, GO:0001228) [5,29].
3.6. Further Examples
Some further examples (four each from DISPROTNR and CModulesYEAST) and their outputs are bundled with the package, and available at Github [https://github.com/pmharrison/patterny/tree/main/Examples]. These demonstrate diverse traits in terms of modularity, banding, blockiness, homopeptide content and repetitiveness. For example, there is an EK-rich CModule (that was also identified as an intrinsically-disordered CBR in ref. [5]) in mannosyltransferase regulator 4, which operates in N-glycan mannosylphosphorylation (a functionality only found in fungi), that has obvious E and K banding and high hpep values.
3.7. Patterny Source Code Distribution
The Patterny source code, some executables and the example data is available at Github [https://github.com/pmharrison/patterny/]. The details of output formats can be found in the README.txt bundled with the package.
4. Conclusions
It is hoped that this package might be useful for hypothesis generation for IDRs and CBRs in proteins. The Patterny outputs could be used to guide mutations and molecular constructs in laboratory experiments. Indeed, in addition to the short-listed CModules, there are longer lists of possible compositional ‘boundary sets’, that might be useful for specifying boundaries for constructs. Also, computational biologists could graft the package into pipelines to probe large-scale data sets for the functional manifestations of IDR and CBR features.
Several further developments of the package are anticipated. Firstly, the sort of linear regression that was used in a previous study of yeast intrinsically-disordered CBRs [5], will be implemented more generally. Also, the package will gain further power through the lens of phylogeny trees, and explicit consideration of clade-specific conservation of traits. Such phylo-optical intensification of the algorithms will hopefully yield insights when cross-referenced with functional information, e.g., from Gene Ontology [29].
Supplementary Materials
The following supporting information can be downloaded at the website of this paper posted on Preprints.org., File S1: Examples of the extremes of the properties examined.
Funding
This research received no external funding.
Data Availability Statement
Data used as examples were downloaded from the UniProt, DISPROT and OrthoDB databases.
Conflicts of Interest
The author declares no conflicts of interest.
Abbreviations
The following abbreviations are used in this manuscript:
| IDR | Intrinsically-disordered region |
| LCR | Low-complexity region |
| CBR | Compositionally-biased region |
| DPB | Distance to perfect banding |
| IE | Interval Entropy |
References
- Romero, P.; Obradovic, Z.; Li, X.; Garner, E.C.; Brown, C.J.; Dunker, A.K. Sequence complexity of disordered protein. Proteins 2001, 42, 38–48. [Google Scholar] [CrossRef]
- van der Lee, R.; Buljan, M.; Lang, B.; Weatheritt, R.J.; Daughdrill, G.W.; Dunker, A.K.; Fuxreiter, M.; Gough, J.; Gsponer, J.; Jones, D.T.; et al. Classification of intrinsically disordered regions and proteins. Chem Rev 2014, 114, 6589–6631. [Google Scholar] [CrossRef]
- Wootton, J.C.; Federhen, S. Analysis of compositionally biased regions in sequence databases. Methods Enzymol 1996, 266, 554–571. [Google Scholar] [CrossRef] [PubMed]
- Harrison, P.M. Optimizing strategy for the discovery of compositionally-biased or low-complexity regions in proteins. Sci Rep 2024, 14, 680. [Google Scholar] [CrossRef] [PubMed]
- Harrison, P.M. Intrinsically Disordered Compositional Bias in Proteins: Sequence Traits, Region Clustering, and Generation of Hypothetical Functional Associations. Bioinform Biol Insights 2024, 18, 11779322241287485. [Google Scholar] [CrossRef] [PubMed]
- Kastano, K.; Mier, P.; Dosztanyi, Z.; Promponas, V.J.; Andrade-Navarro, M.A. Functional Tuning of Intrinsically Disordered Regions in Human Proteins by Composition Bias. Biomolecules 2022, 12. [Google Scholar] [CrossRef]
- MacLea, K.S.; Paul, K.R.; Ben-Musa, Z.; Waechter, A.; Shattuck, J.E.; Gruca, M.; Ross, E.D. Distinct amino acid compositional requirements for formation and maintenance of the [PSI(+)] prion in yeast. Mol Cell Biol 2015, 35, 899–911. [Google Scholar] [CrossRef]
- Lyons, H.; Veettil, R.T.; Pradhan, P.; Fornero, C.; De La Cruz, N.; Ito, K.; Eppert, M.; Roeder, R.G.; Sabari, B.R. Functional partitioning of transcriptional regulators by patterned charge blocks. Cell 2023, 186, 327–345 e328. [Google Scholar] [CrossRef]
- King, M.R.; Ruff, K.M.; Pappu, R.V. Emergent microenvironments of nucleoli. Nucleus 2024, 15, 2319957. [Google Scholar] [CrossRef]
- Gemayel, R.; Chavali, S.; Pougach, K.; Legendre, M.; Zhu, B.; Boeynaems, S.; van der Zande, E.; Gevaert, K.; Rousseau, F.; Schymkowitz, J.; et al. Variable Glutamine-Rich Repeats Modulate Transcription Factor Activity. Mol Cell 2015, 59, 615–627. [Google Scholar] [CrossRef]
- Dorone, Y.; Boeynaems, S.; Flores, E.; Jin, B.; Hateley, S.; Bossi, F.; Lazarus, E.; Pennington, J.G.; Michiels, E.; De Decker, M.; et al. A prion-like protein regulator of seed germination undergoes hydration-dependent phase separation. Cell 2021, 184, 4284–4298 e4227. [Google Scholar] [CrossRef]
- Cohan, M.C.; Shinn, M.K.; Lalmansingh, J.M.; Pappu, R.V. Uncovering Non-random Binary Patterns Within Sequences of Intrinsically Disordered Proteins. J Mol Biol 2022, 434, 167373. [Google Scholar] [CrossRef]
- Cascarina, S.M.; King, D.C.; Osborne Nishimura, E.; Ross, E.D. LCD-Composer: an intuitive, composition-centric method enabling the identification and detailed functional mapping of low-complexity domains. NAR Genom Bioinform 2021, 3, lqab048. [Google Scholar] [CrossRef]
- Mier, P.; Andrade-Navarro, M.A. Assessing the low complexity of protein sequences via the low complexity triangle. PLoS One 2020, 15, e0239154. [Google Scholar] [CrossRef] [PubMed]
- Quaglia, F.; Meszaros, B.; Salladini, E.; Hatos, A.; Pancsa, R.; Chemes, L.B.; Pajkos, M.; Lazar, T.; Pena-Diaz, S.; Santos, J.; et al. DisProt in 2022: improved quality and accessibility of protein intrinsic disorder annotation. Nucleic Acids Res 2022, 50, D480–D487. [Google Scholar] [CrossRef] [PubMed]
- Harrison, P.M. Compositionally biased dark matter in the protein universe. Proteomics 2018, e1800069. [Google Scholar] [CrossRef] [PubMed]
- UniProt, C. UniProt: the Universal Protein Knowledgebase in 2023. Nucleic Acids Res 2023, 51, D523–D531. [Google Scholar] [CrossRef]
- Fox, N.K.; Brenner, S.E.; Chandonia, J.M. SCOPe: Structural Classification of Proteins--extended, integrating SCOP and ASTRAL data and classification of new structures. Nucleic Acids Res 2014, 42, D304–309. [Google Scholar] [CrossRef]
- Tegenfeldt, F.; Kuznetsov, D.; Manni, M.; Berkeley, M.; Zdobnov, E.M.; Kriventseva, E.V. OrthoDB and BUSCO update: annotation of orthologs with wider sampling of genomes. Nucleic Acids Res 2025, 53, D516–D522. [Google Scholar] [CrossRef]
- Harrison, P.M. Robust phylogenetic profile clustering for Saccharomyces cerevisiae proteins. PeerJ 2025, 13, e19370. [Google Scholar] [CrossRef]
- Harrison, P.M. fLPS: Fast discovery of compositional biases for the protein universe. BMC Bioinformatics 2017, 18, 476. [Google Scholar] [CrossRef]
- Harrison, P.M. fLPS 2.0: rapid annotation of compositionally-biased regions in biological sequences. PeerJ 2021, 9, e12363. [Google Scholar] [CrossRef] [PubMed]
- Wang, Y.; Harrison, P.M. Homopeptide and homocodon levels across fungi are coupled to GC/AT-bias and intrinsic disorder, with unique behaviours for some amino acids. Sci Rep 2021, 11, 10025. [Google Scholar] [CrossRef]
- Tariq, D.; Maurici, N.; Bartholomai, B.M.; Chandrasekaran, S.; Dunlap, J.C.; Bah, A.; Crane, B.R. Phosphorylation, disorder, and phase separation govern the behavior of Frequency in the fungal circadian clock. Elife 2024, 12. [Google Scholar] [CrossRef]
- Josefsson, E.; O'Connell, D.; Foster, T.J.; Durussel, I.; Cox, J.A. The binding of calcium to the B-repeat segment of SdrD, a cell surface protein of Staphylococcus aureus. J Biol Chem 1998, 273, 31145–31152. [Google Scholar] [CrossRef] [PubMed]
- Denning, D.P.; Patel, S.S.; Uversky, V.; Fink, A.L.; Rexach, M. Disorder in the nuclear pore complex: the FG repeat regions of nucleoporins are natively unfolded. Proc Natl Acad Sci U S A 2003, 100, 2450–2455. [Google Scholar] [CrossRef]
- Yoo, S.H.; Ferretti, J.A. Nature of the pH-induced conformational changes and exposure of the C-terminal region of chromogranin A. FEBS Lett 1993, 334, 373–377. [Google Scholar] [CrossRef] [PubMed]
- Taylor, W.R. Residual colours: a proposal for aminochromography. Protein Eng 1997, 10, 743–746. [Google Scholar] [CrossRef]
- Gene Ontology, C.; Aleksander, S.A.; Balhoff, J.; Carbon, S.; Cherry, J.M.; Drabkin, H.J.; Ebert, D.; Feuermann, M.; Gaudet, P.; Harris, N.L.; et al. The Gene Ontology knowledgebase in 2023. Genetics 2023, 224. [Google Scholar] [CrossRef]
Figure 1.
Patterny flow and the Moduley and Bandy algorithms. (a) Overall flow. Input sequence data is submitted to Moduley to make sets of CModules and a larger list of boundary sets. In parallel, Bandy speculates about bands of similar composition in each sequence of the input data. Blocky, Repeaty and Runny process both the original input data, and the sets of CModules from Moduley. (b) A graphical depiction of the Moduley algorithm described in Methods. (c) A graphical depiction of the Bandy algorithm described in Methods.
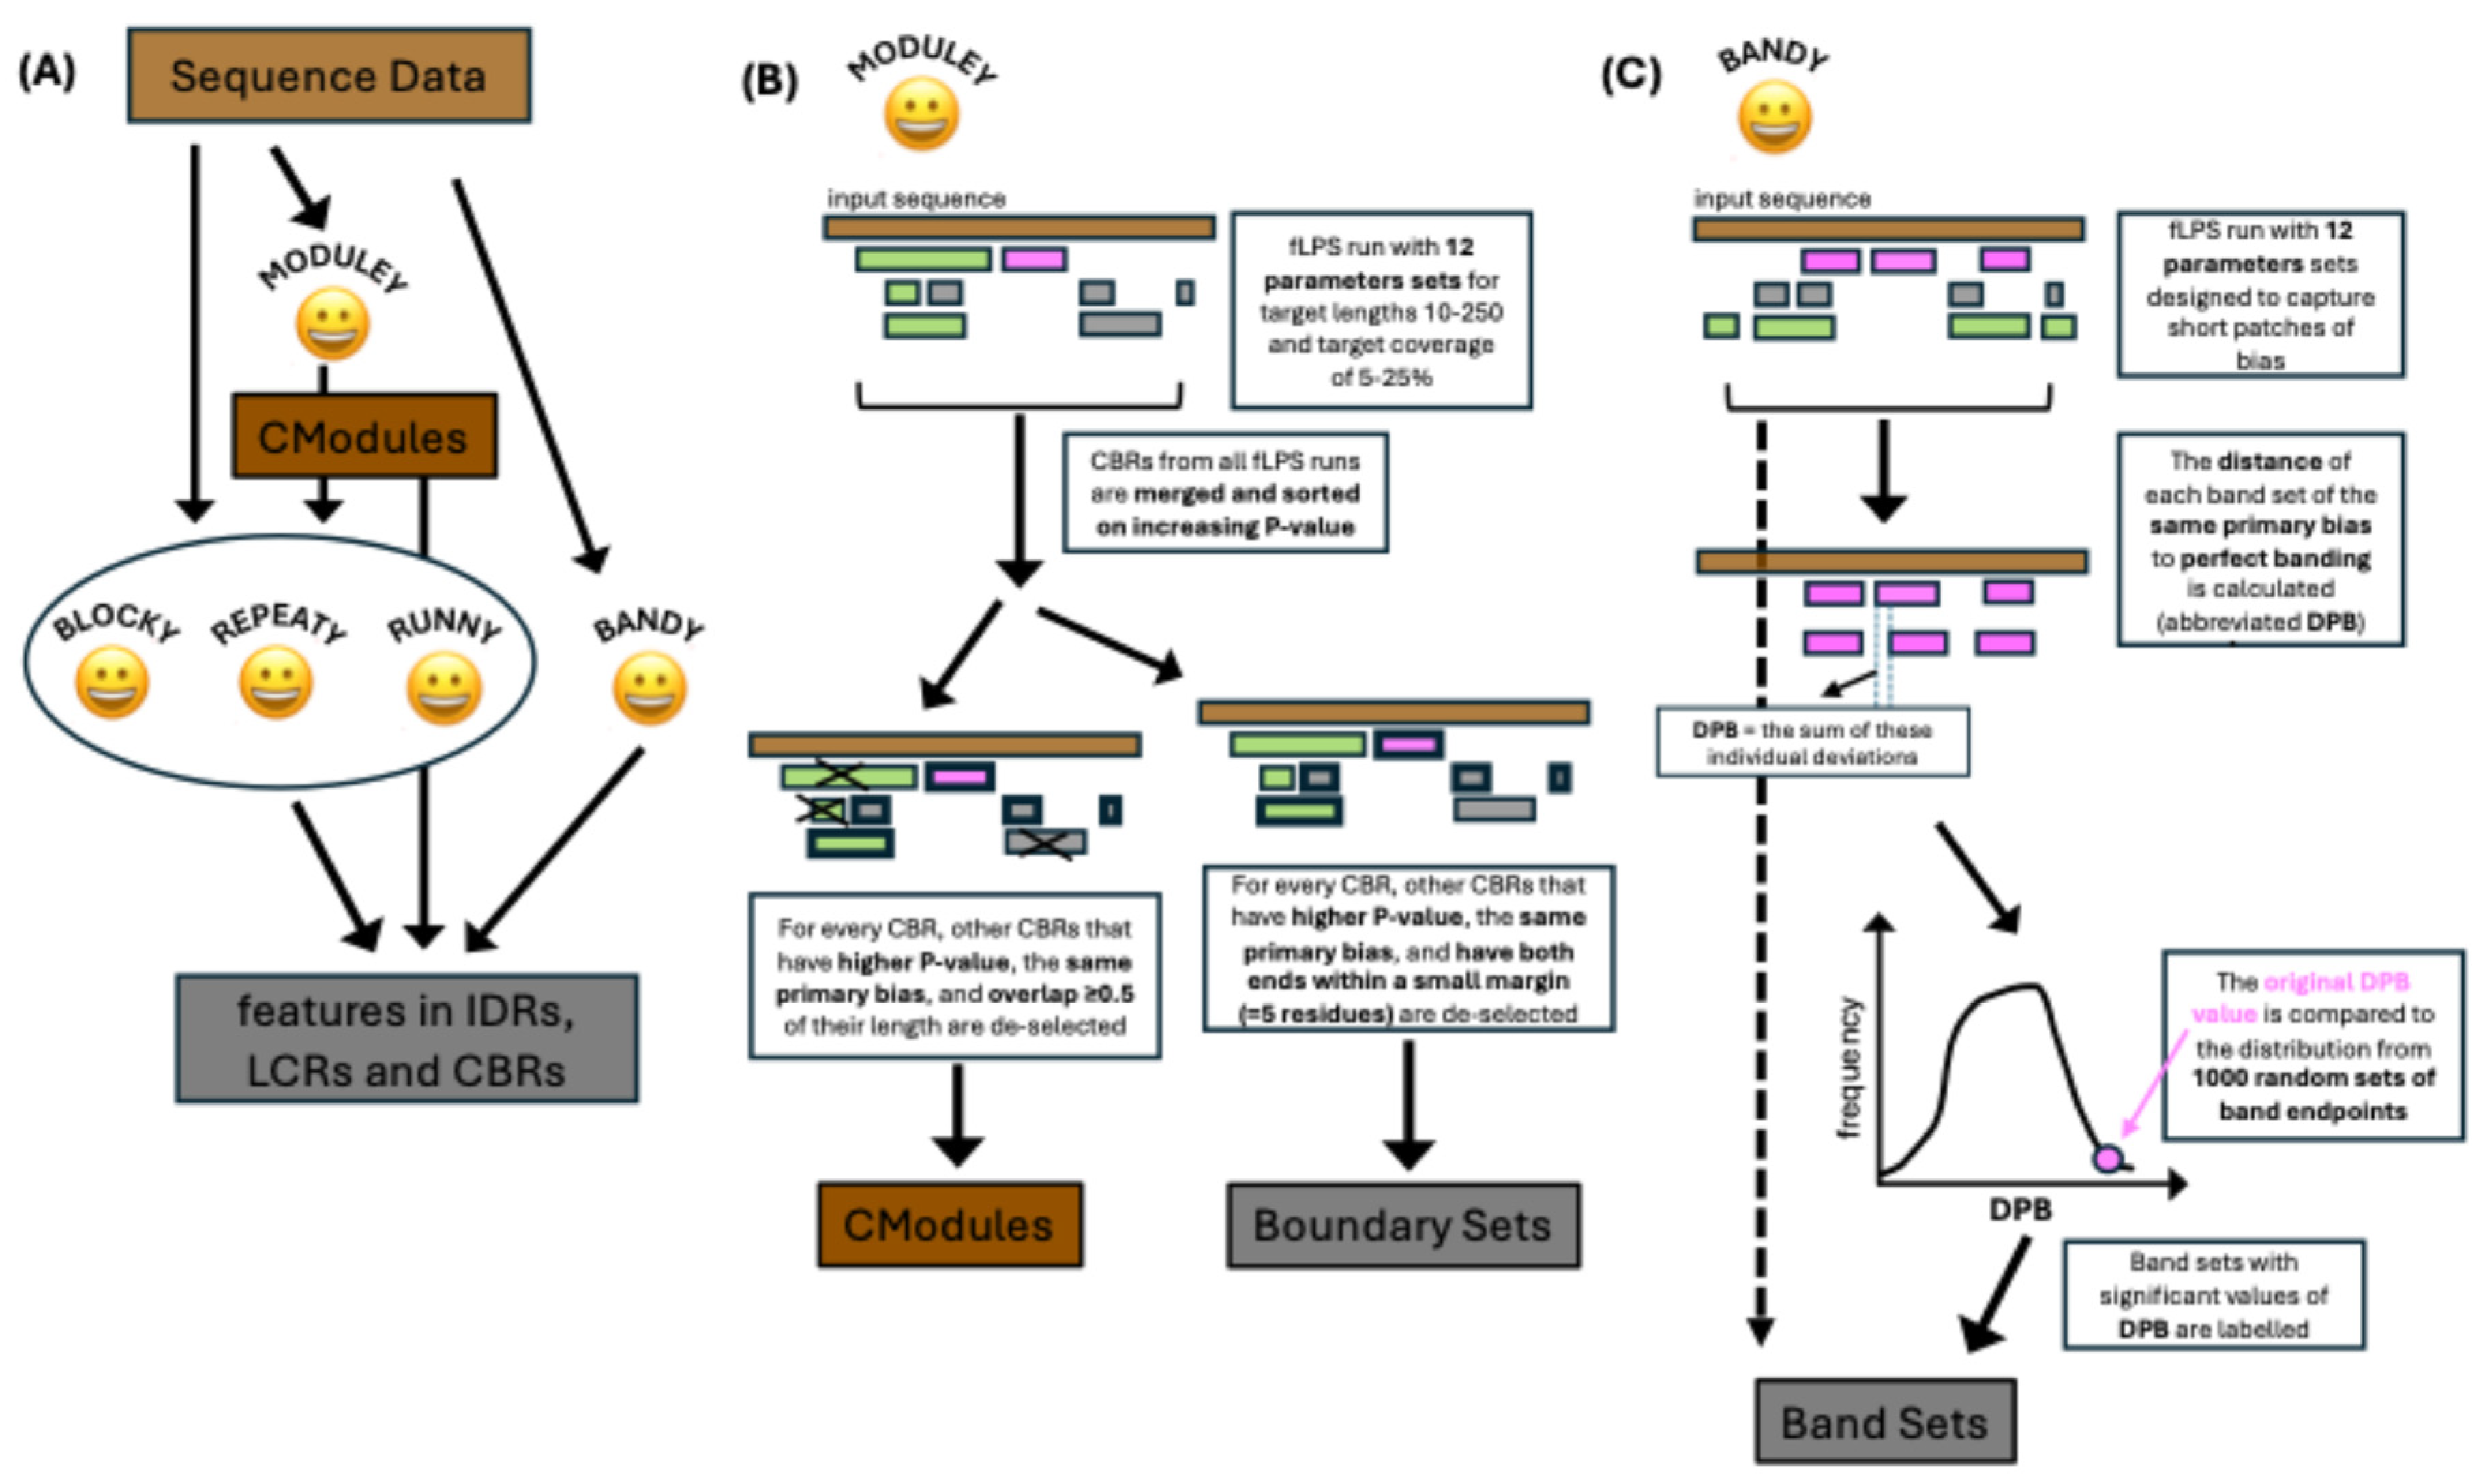
Figure 2.
Graphical depictions of the algorithms of (A) Blocky, (B) Runny and (C) Repeaty. These are described in detail in the Methods section.
Figure 2.
Graphical depictions of the algorithms of (A) Blocky, (B) Runny and (C) Repeaty. These are described in detail in the Methods section.
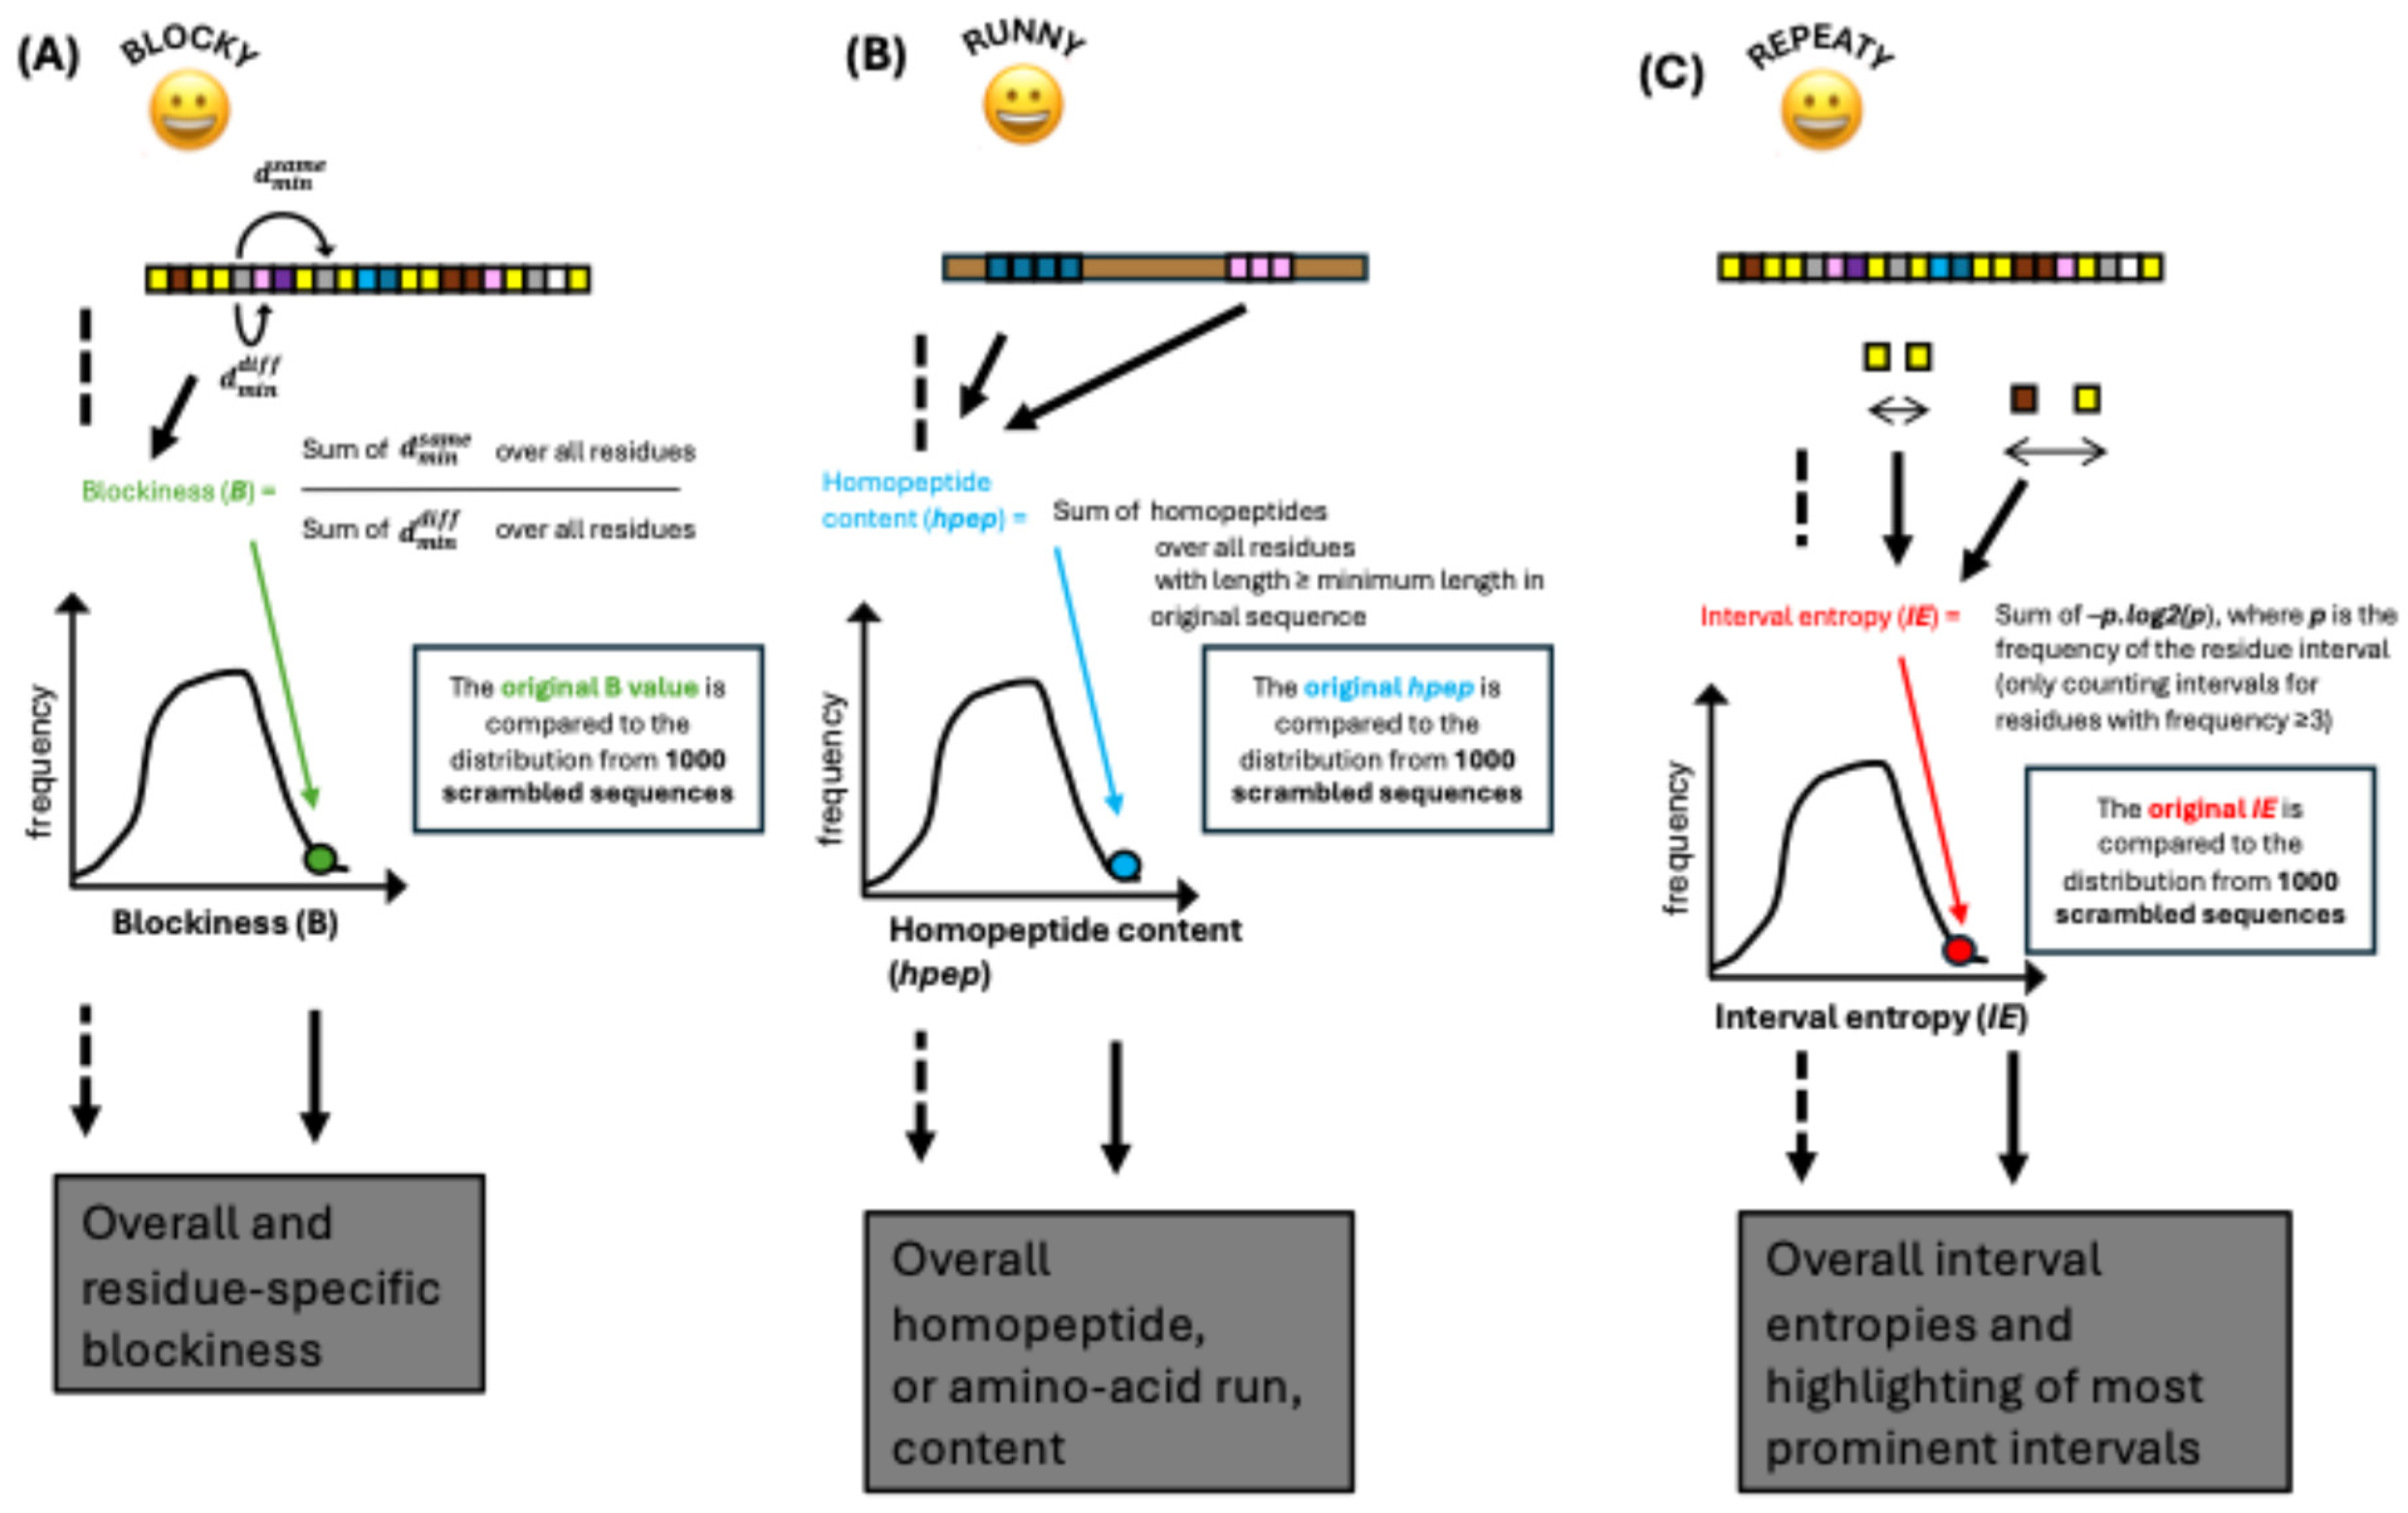
Figure 3.
Example from the DISPROT database: Chromogranin-A from B. taurus (cow). (A) A picture of the CModules in each of the eight vertebrate orthologs analyzed. These are coloured using the Taylor amino-acid residue scheme [28], and labelled with their bias signatures and bias P-values. (B) A summary of the output for the other four programs. Significant blockiness relative to the sample of 1000 scrambled sequences is indicated with a black asterisk (*), and with a red asterisk if they are also significant in this way for the largest CModule in each sequence. The symbol † labels residues that contribute to blockiness and occur across all those labelled *.
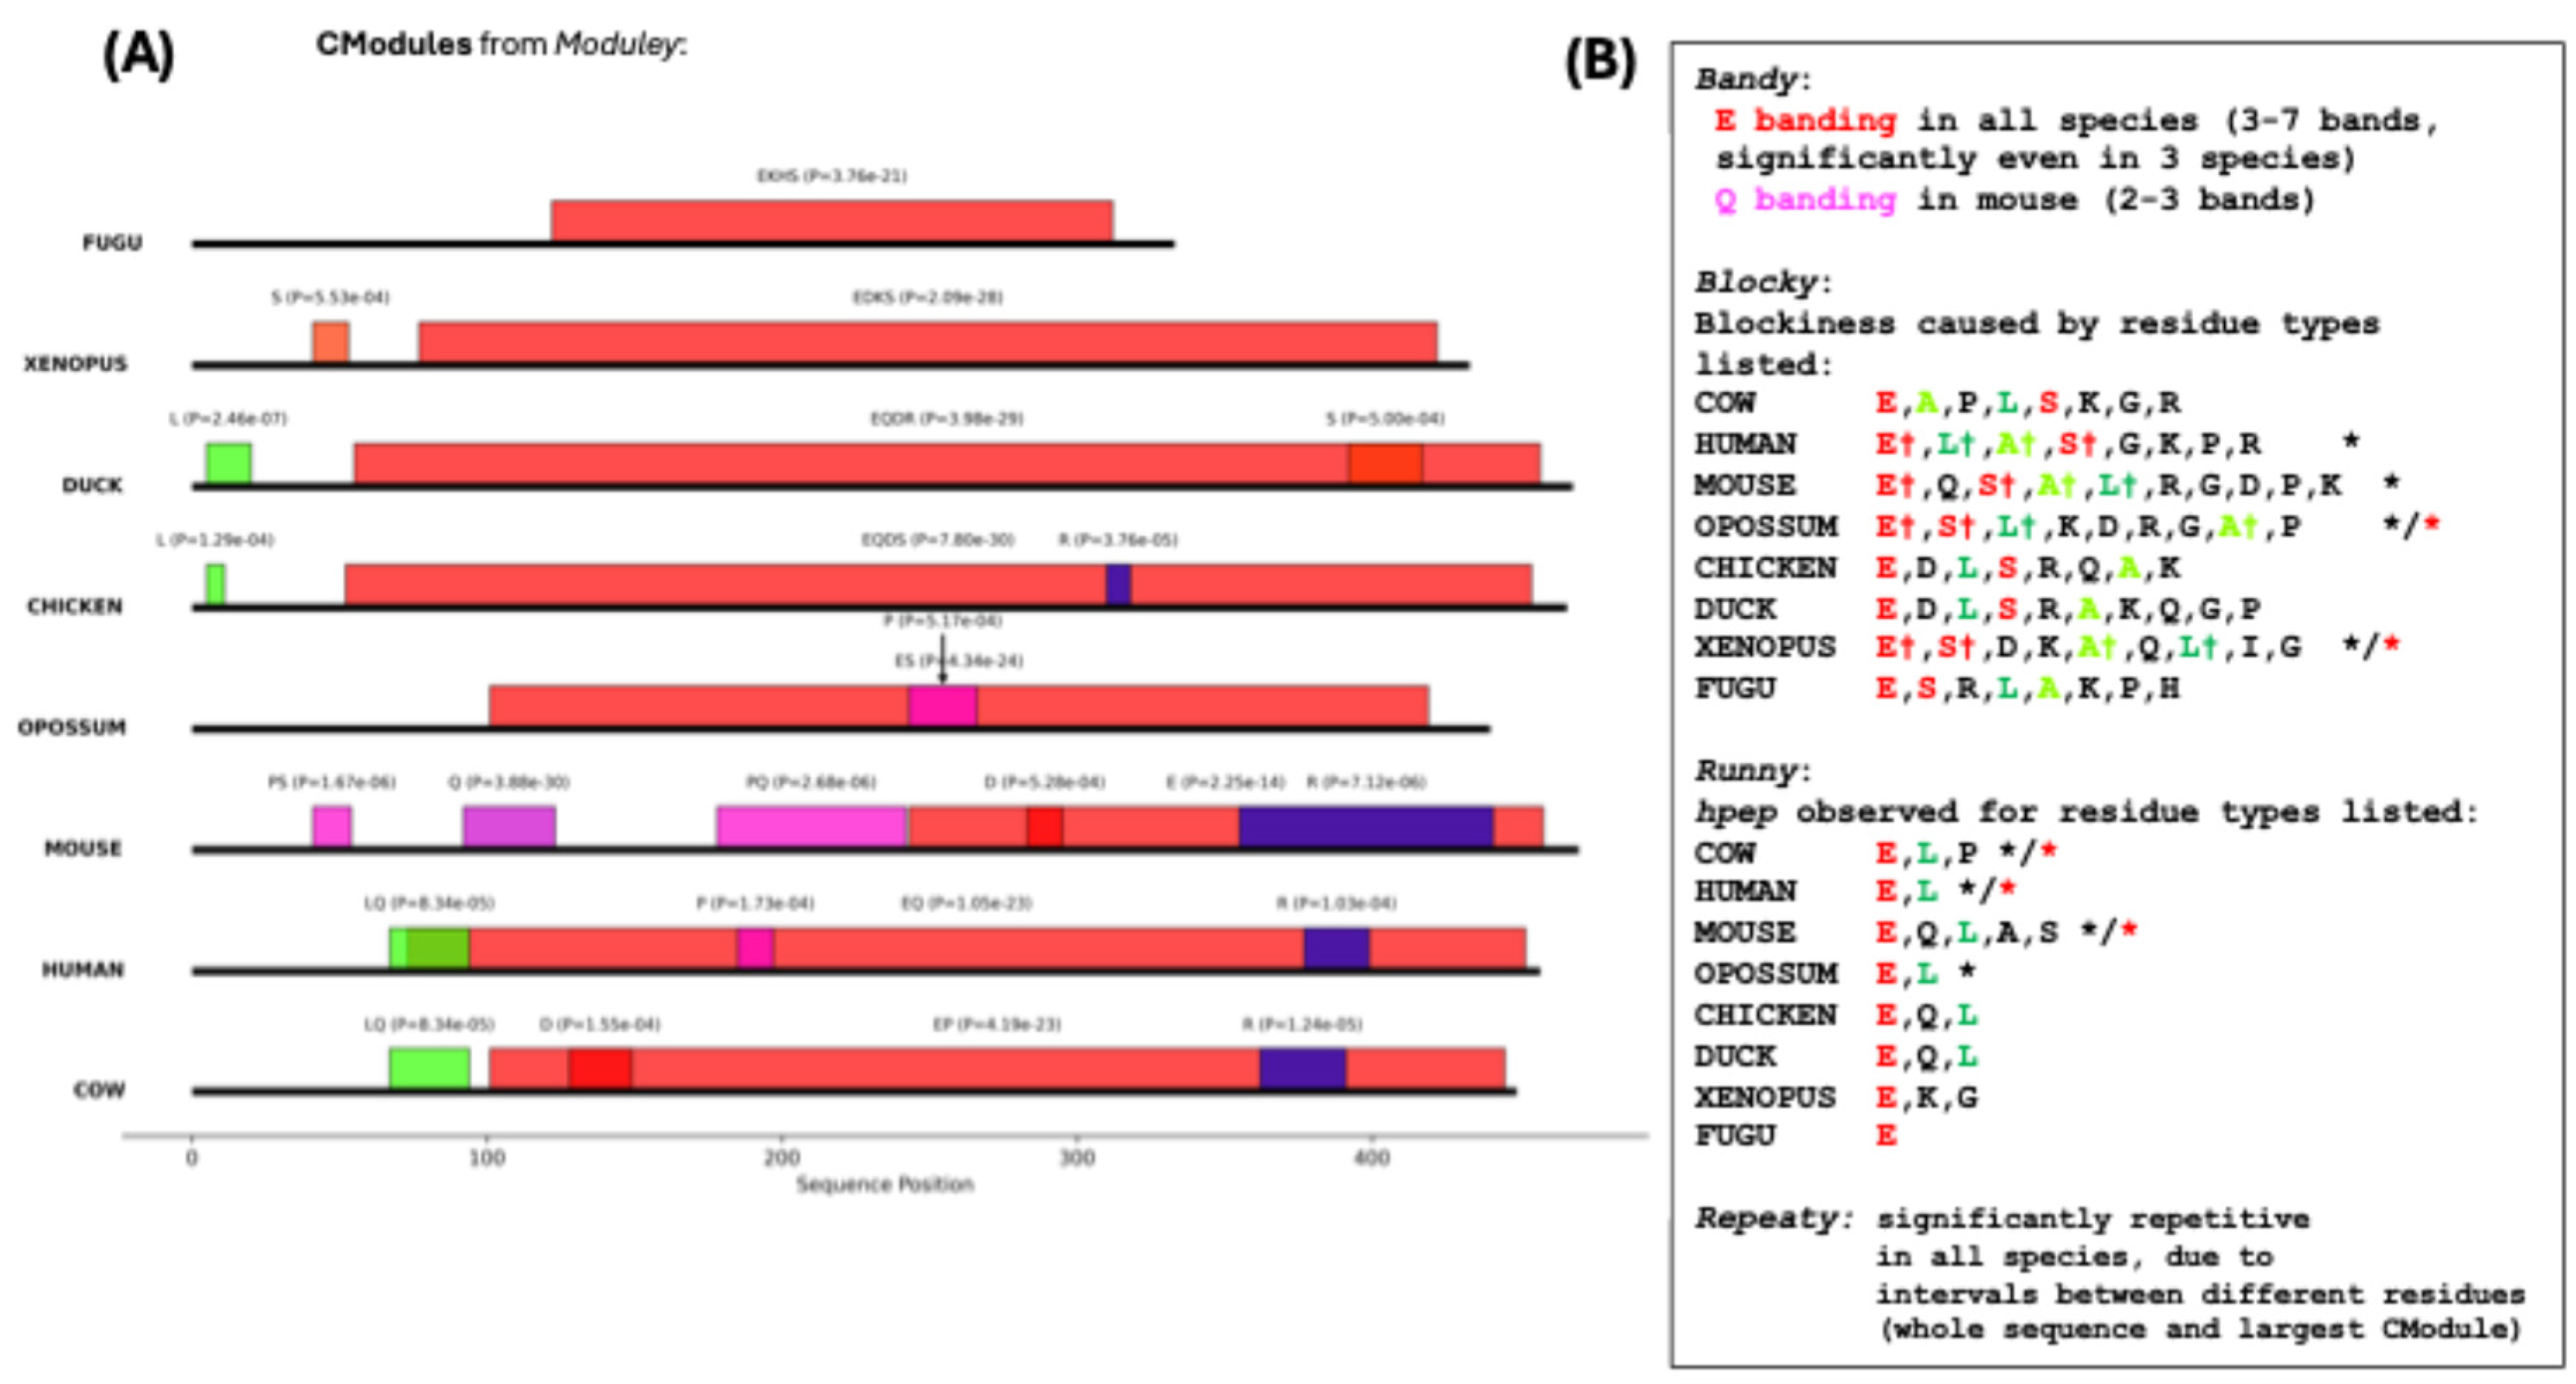
Figure 4.
Example from the CModulesYEAST data set: MSA2 putative transcriptional activator from S. cerevisiae. (A) A picture of the CModules in each of the twelve Saccharomycetaceae orthologs analyzed. These are coloured and labelled as in Figure 3. (B) A summary of the output for the other four programs. Labelling is as in Figure 3.
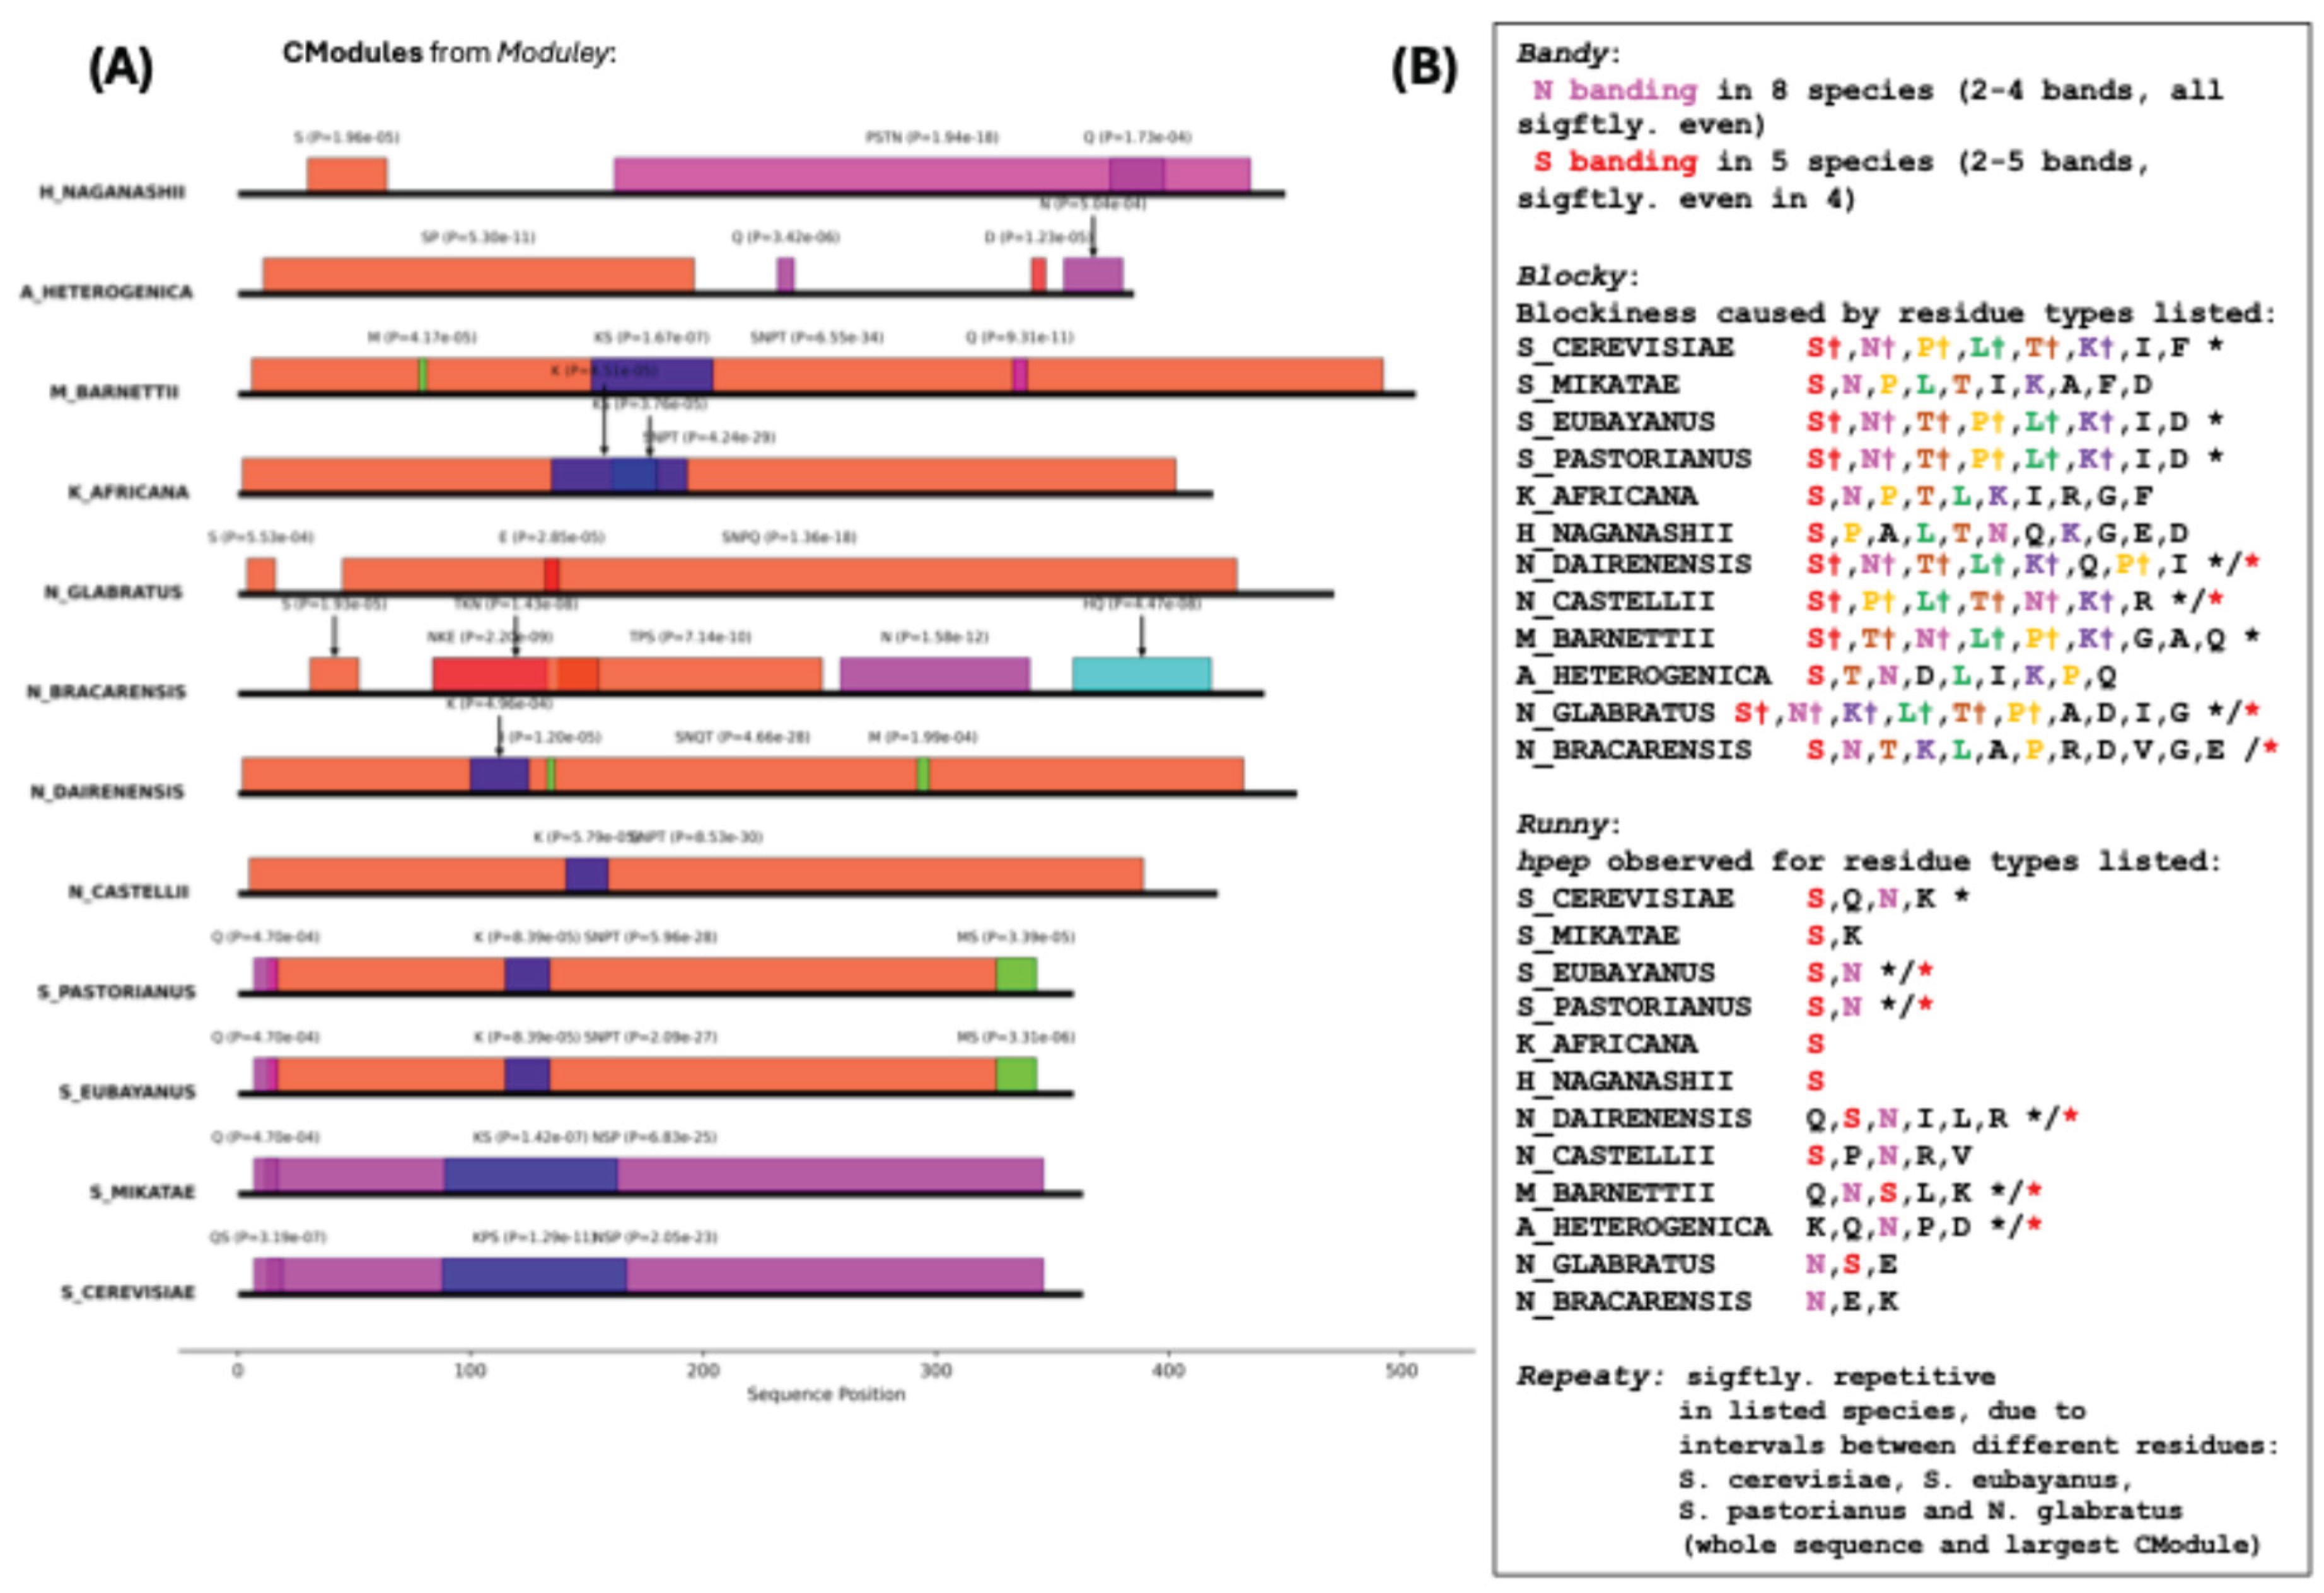

Table 1.
Prevalences.
| Feature |
Data Sets→DISPROTNR (total=6463) |
CModulesYEAST (total=24043) |
ASTRALSCOP40 (total=14844) |
|
Modularity: CModules (≥1) CModules (≥2) CModules (≥3) |
2454 (38.0%) 746 (11.5%) 309 (4.8%) |
--- --- --- |
10096 (68.0%)* 4490 (30.2%) 1794 (12.1%) |
|
Banding: Bands (≥2) Bands (≥3) Significantly even bands (≥2) Significantly uneven bands (≥2) Significantly even bands (≥3) Significantly uneven bands (≥3) |
670 (10.4%) 389 (6.0%) 430 (6.7%) 17 (0.3%) 66 (1.0%) 14 (0.2%) |
3217 (13.4%) 1640 (11.0%) 2145 (8.9%) 59 (0.2%) 244 (1.0%) 51 (0.2%) |
1317 (8.9%) 382 (2.6%) 950 (6.4%) 1 (0.0%) 46 (0.3%) 1 (0.0%) |
|
Blockiness (B): Significantly blocky Significantly un-blocky |
|||
| 560 (8.7%) | 1592 (6.6%) | 575 (3.9%) | |
| 70 (1.1%) | 51 (0.2%) | 38 (0.3%) | |
|
Homopeptide content (hpep): Significant hpep enrichment Significant hpep lack |
802 (12.4%) 9 (0.1%) |
2280 (9.5%) 16 (0.1%) |
938 (6.3%) 0 (0.0%) |
|
Repetitiveness [Interval Entropy (IE)]: Significantly repetitive Significantly un-repetitive |
598 (9.3%) 54 (0.8%) |
2194 (9.1%) 269 (1.1%) |
1672 (11.3%) 136 (0.9%) |
* Entries are in bold if either the ASTRALSCOP40 set or both the DISPROTNR and CModulesYEAST set have higher occurrences.
Disclaimer/Publisher’s Note: The statements, opinions and data contained in all publications are solely those of the individual author(s) and contributor(s) and not of MDPI and/or the editor(s). MDPI and/or the editor(s) disclaim responsibility for any injury to people or property resulting from any ideas, methods, instructions or products referred to in the content. |
© 2025 by the authors. Licensee MDPI, Basel, Switzerland. This article is an open access article distributed under the terms and conditions of the Creative Commons Attribution (CC BY) license (http://creativecommons.org/licenses/by/4.0/).
Copyright: This open access article is published under a Creative Commons CC BY 4.0 license, which permit the free download, distribution, and reuse, provided that the author and preprint are cited in any reuse.


