Submitted:
31 July 2025
Posted:
04 August 2025
You are already at the latest version
Abstract
Reversible cysteine oxidation is a central mechanism of protein regulation, commonly studied through advanced redox proteomic workflows that systematically catalogue the redox state of thousands of residues. Excitingly, these expansive datasets contain latent information that remains largely untapped. In this work, we propose that principles from information theory, signal geometry, and chaos theory can reveal hidden meaning within these data—illuminating dynamic regulation, molecular memory, and the interplay between order and chaos in redox biology. Drawing on concepts such as Shannon entropy, Fisher information, and spectral energy, we show how variability and spread in redox signals may reflect structured, condition-specific differences rather than random noise. We further define a mathematical basis for a cysteine redox butterfly effect on fractal redox manifolds where sensitivity to initial conditions produces chaotic responses. Even simple entropy-based metrics can uncover coherent patterns in existing datasets, motivating a conceptual shift in how redox proteomic data can analyzed and interpreted. We further propose that oxidation can be viewed as a probabilistic signal field shaped by underlying biochemical, spatial, and evolutionary constraints. This reframing opens new avenues for extracting insight from existing data and offers a conceptual bridge toward future models of redox biology.
Keywords:
cysteine
; redox
; proteomics
; information
; chaos
; proteoform
1. Introduction
Reversible cysteine residue oxidation redox-regulates biological processes by dynamically modifying protein structure and function [1]. These oxidative post-translational modifications (PTMs [2,3,4,5,6]) influence protein activity, stability, localization, interactions, and phase [7]—making cysteine oxidation a powerful and versatile mechanism of cellular control [8]. Viewed from a systems perspective, redox regulation operates like an electrical circuit: the sulfur atom in cysteine functions as a live node, continuously reshaped by the flux of oxidizing and reducing equivalents [9]. This nodal flux is modulated by a metabolically wired redox module comprising oxidants—reactive oxygen species (ROS) like hydrogen peroxide (H₂O₂)—and reductants, including the glutathione (GSH) and thioredoxin (Trx) systems [10,11,12].
As reviewed elsewhere [13,14,15,16,17], mass spectrometry-based redox proteomics enables a systems-level readout of this biochemical circuitry by quantifying the percentage oxidation of individual cysteine residues across the proteome [18,19,20,21,22,23,24,25]. These residue-resolved oxidation states provide a relative, condition-specific map of electron flux throughout the networked circuit [26]—offering a powerful lens through which to observe the dynamic output of the upstream redox module [27]. These redox proteomic approaches have yielded important insights into signaling pathways [28], stress responses [29], aging [18], immunity [30], and disease mechanisms [31]—each shaped by the underlying flux of oxidants and reductants [32].
Current redox proteomic frameworks largely treat the redox state of each residue as a vector with direction and magnitude. These residue-level vectors enable condition-specific changes to be analyzed using standard approaches, such as volcano plots. Excitingly, the power of such analyses can be amplified by considering the latent information encoded by the ensemble of vectors as a whole. This holistic perspective can reveal emergent structure, function, and circuit-level output—features of the redox system that may remain hidden when residues are considered in isolation. For example, high-dimensional analyses can provide transformative insights—like ordered and chaotic cysteine redox state patterns—that may already be latent features in extant datasets [27].
To reveal latent features, the present review focuses on the analysis and the reinterpretation of redox proteomic datasets using high-dimensional, information theory-grounded metrics like Shannon entropy [33]. Since the underlying redox biology and proteomic technologies have been comprehensively reviewed [34,35,36,37,38,39,40,41,42,43,44,45,46,47,48], we begin by defining how redox proteomic data are currently analyzed and interpreted. We then introduce a set of information-theoretic tools for high-dimensional analysis and demonstrate how these concepts can uncover emergent features—including structure, symmetry, and chaos [49]. These emergent features enable peptide-centric proteomics to better describe cysteine proteoform defined bioelectrical circuits [50]. What follows is a new way of thinking and speaking about redox biology. It is a language grounded in the grammar of information theory, shaped by chaos, and expressed through dynamic nonlinear systems.
2. Methods
Consistent with our previous work [51], all of the python-scripted source codes are available on Github at https://github.com/JamesCobley/Redox_information inclusive of requirements, readme, and MIT license files. To enable interested readers to implement the analyses described, each script is configured for open-sourced google colab jupyter notebook run times. One simply needs to render the scripts compatible with the relevant source data.
For the information theory analysis, we demonstrated proof-of-principle using empirical priors. To compute several metrics on empirical priors, we computationally implemented the relevant equations on the OxiMouse dataset [18], downloaded from https://oximouse.hms.harvard.edu/. This dataset provided the cysteine redox state of residue level vectors in ten different tissues from young and old mice. For the purposes of brevity, the present analysis was restricted to analyzing the young and old brain data [52,53]. Since a full reanalysis of the raw instrument files was beyond the scope of the present work, we used the mean and standard error of the mean to bootstrap the statistical testing—as detailed in the legend of each figure.
For the chaos theory analysis, we demonstrated proof-of-principle using synthetic priors due to the limited time-resolved redox proteomic datasets that are presently available. Upon generation of the appropriate empirical priors, the equations can be implemented without changing their general form—the mathematics is invariant.
3. Results
3.1. The Flatland Problem: How Scalar Redox Values Conceal the High-Dimensional Structure of Peptide Data
Redox proteomic datasets usually comprise redox state vectors encoding the direction and magnitude of a given state in the percentage basis—from 0 to 100% oxidized—for thousands of cysteine residues across one or more conditions [18,54,55,56,57,58,59,60,61,62]. Typically, these vectors arise from the spectral measurement of peptide ensembles bearing light (reduced) and heavy (reversibly oxidized) labels—such as isotopically distinct maleimide probes [25,63,64]—at both the MS1 (intact peptide) and MS2 (fragment ion) levels [65,66,67,68,69,70]. Each spectral "read" is therefore an amalgam of binary 0 and 1 intensities—corresponding to light and heavy modified peptides and their fragments—that collectively encode the overall signal for a given peptide. These signals are usually converted into percentages following the processing of the raw files using appropriate software like MaxQuant or DIA-NN for data-dependent acquisition (DDA) and data-independent acquisition (DIA) schemes, respectively [71,72,73].
Most current frameworks treat the residue-level redox state as a scalar datapoint—a single numerical value encoding the degree of oxidation—to enable rigorous statistical comparisons between conditions. Each scalar is treated as a scale-bounded continuous variable, capable of assuming any real value within the closed interval [0, 100] [74,75]. These data are typically analyzed by comparing scalar values between conditions using appropriate statistical tests, such as independent t-tests for parametric datasets, with corrections applied to control for family-wise error rates. A common visualization method is the volcano plot, in which the mean oxidation difference (the delta change) between conditions is plotted as the log₂ fold-change against a significance metric, such as the –log₁₀ adjusted P-value. This approach captures both the magnitude and direction of redox shifts and is particularly useful for identifying cysteine residues with significant, condition-specific perturbations—for instance, in age-associated redox stress response [76,77,78,79,80].
To extract broader biological patterns from the scalar redox data, many studies apply dimensionality reduction techniques, such as Principal Component Analysis (PCA) [81]. PCA transforms the original high-dimensional dataset—where each residue is a variable—into a reduced set of orthogonal axes (principal components) that capture the greatest variance in the data. This enables the visualization of global structure, such as sample clustering by condition, tissue, or genotype, while preserving the most informative variation. In parallel, unsupervised clustering algorithms—such as hierarchical clustering or k-means—are often used to group residues or samples based on shared redox patterns [27]. These approaches can reveal context-specific clusters, like tissue-specific oxidation signatures [18,52], helping to identify coherent redox modules across biological systems [82,83]. Together, PCA and clustering extend scalar analysis beyond univariate comparisons by revealing coarse-grained structure in the data, forming a conceptual bridge between single-site analysis and more integrated, systems-level insights.
While scalar-based approaches enable powerful statistical analyses, they also impose a reductionist structure that can obscure biological meaning, which we term the “flatland problem”. By treating each cysteine residue as an independent variable, these methods flatten the system into a residue-centric view, fragmenting the natural continuity of protein-level redox behavior. This flat projection into low-dimensional space disrupts the coordinated structure of the underlying redox manifold. In this manifold, each residue belongs to a specific cysteine proteoform—a defined molecular configuration determined by the redox state of all cysteines in that protein molecule [50]. Hence, clusters or components derived from conventional analyses reflect statistical groupings of residues, not coherent proteoform dynamics. This disconnect matters: it is proteoforms—not their disembodied peptides—that enact biology [84,85,86,87,88]. Redox regulation is not merely a collection of residue shifts [89], but a coordinated molecular choreography that scalar analysis cannot fully resolve [90,91,92].
While peptide-level oxidation percentages appear continuous, they are ensemble averages over discrete molecular states [93,94,95,96,97]. For example, a protein molecule with three cysteines can exist only in one of four possible proteoform oxidation modes: 0%, 33%, 66%, or 100% [27,50,51,89,98]. However, what we measure is a peptide-level readout—an aggregate signal reflecting a distribution over these unseen modes [99]. Linear models treat this data as continuous, but the originating system is fundamentally discrete and combination constrained.
The tension—between continuous analysis and discrete biological configuration—reveals a core limitation of current frameworks. It invites new models that acknowledge the latent structure of cysteine proteoforms embedded in high-dimensional state space [51,100]While these proteoforms are not directly observed in bottom-up mass spectrometry [101,102,103], peptide measurements are projections of their redox state distributions. Hence, methods that recognize this structured embedding are better equipped to recover the coordinated, nonlinear behavior of redox systems [104,105,106].
Nonlinear models from information can chaos theory can be directly applied to peptide-level oxidation data [107]. Nonlinear models are sensitive to thresholds, feedback loops, bifurcations, and emergent behaviors [49,98,108]. For example, a small change in oxidation at one cysteine may lead to a disproportionate structural or functional shift in the protein, particularly if it triggers allosteric change or destabilizes a critical motif [109,110,111,112]. Even without measuring cysteine proteoforms [89], nonlinear models applied to peptide data can uncover signatures of non-additivity and non-monotonicity in redox behavior. These models can help to recover the logic of the system: a redox landscape not governed by smooth gradients but by discrete jumps, state transitions, and multi-stable basins of behavior [113].
3.2. Conceptual Foundations of Information and Chaos Theory
When seeking to quantify the uncertainty or structure within a signal, Claude Shannon’s 1948 masterpiece [33] introduced a new mathematical framework now known as information theory. Shannon's goal was to formalize the process of communication—how to transmit messages over noisy channels with maximal efficiency and minimal error. He defined informational entropy as the average uncertainty or surprise associated with a set of outcomes. The resulting entropy was not about the second law of thermodynamics, but about the number of choices available—the informational richness of a distribution of datapoints in the discrete binary basis [114].
In transcending telecommunications, information theory permeated virtually every branch of scientific study, including biology [115,116,117]. It now provides a general language for quantifying structure, uncertainty, redundancy, and complexity in diverse systems—from neural networks and genetic sequences to language, learning, and thermodynamics. Central concepts such as mutual information, Kullback–Leibler divergence, and algorithmic complexity enable precise descriptions of how patterns emerge, propagate, and are constrained by prior states. This naturally intersects with Bayesian inference [118], which formalizes how prior knowledge influences probabilistic updates in light of new data. In essence, information theory reveals how order and unpredictability are balanced within any probabilistic system, making it a natural partner to dynamical frameworks like chaos theory that explore how such systems evolve over time [119].
While modeling atmospheric convection in the early 1960’s, Edward Lorenz discovered that even deterministic systems could behave unpredictably [120]. His seemingly minor rounding error in initial conditions led to radically different weather simulations—an observation that inspired chaos theory [121]. Lorenz’s insight revealed that nonlinear dynamical systems, though governed by deterministic rules, could exhibit sensitive dependence on initial conditions—the “butterfly effect” [122]. This realization catalyzed the development of advanced mathematical frameworks—including strange attractors, Lyapunov exponents, and fractals—to characterize the intricate, self-similar, and often beautiful structures underlying complex dynamical behavior [123,124,125].
3.3. Shannon Entropy: Quantifying Uncertainty in Redox Distributions
Let the redox proteomic dataset be discretized into percentage oxidized bins, where each bin defines a given range of peptide oxidation values. For example, 50, 2%-oxidized bins over the [0,100] interval. Let pi be the proportion of peptide datapoints falling within bin i, such that the sum of all bins equals 1. Then Shannon entropy (H) becomes:
By binning the redox state into discrete intervals, the continuous oxidation data are converted into a valid probability distribution which is mathematically justified because Shannon entropy is defined over discrete outcome spaces. Biologically, the bins correspond to semantically meaningful states (e.g., 100%-reduced [126,127,128]). The range of each bin can be adjusted depending on the nature of the experiment.
Shannon entropy quantifies the distribution of information—that is, how redox values are spread across discrete oxidation bins. A uniform distribution corresponds to maximal entropy, indicating maximal uncertainty or randomness in the oxidation state data. In contrast, a sharp peak localized to a single bin implies minimal entropy—high predictability and low diversity in cysteine redox states. Geometrically, entropy reflects the distribution shape: a flat plateau suggests maximal uncertainty, while a narrow spike reveals an ordered, constrained system.
To capture the information structure embedded within complex, high-dimensional redox proteomic landscape [129,130,131], we calculated the Shannon entropy across 5%-oxidation increments over the 0,100 interval from the 8,183 cysteine residue vectors in young and old mouse brains. Even though the oxidation of this subset of the proteome decreased by 0.8% from 8.9 in young to 8.1%-oxidized in old mouse brains, the Shannon entropy increased from 3.884 bits in young to 4.143 bits in old mouse brains. This ~0.26-bit increase means the distribution of oxidation levels across the ~8,000 cysteine sites are more dispersed—geometrically spread—in aging brains (Figure 1). Bootstrapping from the SEM revealed this was a significant and appreciable effect (Cohen’s d = 10.6).
3.4. Mutual Information: Quantifying Shared Information Between Redox States
Let the same discretized redox state from section 3.3 define a random variable taking values for each oxidation bin, and let be a binary variable, such as age were . Denote the joint probability
and the marginals
so that . The mutual information in bits is defined by
By discretizing oxidation into bins, we obtain a valid discrete joint distribution . Mutual information measures the reduction in uncertainty about A (e.g., age) gained by observing the oxidation bin X:
- (the minimum) bits if X and A are statistically independent—knowing oxidation gives no clue to age.
- (the maximum) bits if and only if oxidation perfectly predicts age (each bin occurs in only one age group).
A high indicates that certain redox-state intervals are strongly age-specific, revealing cysteine sites whose oxidation patterns carry significant “age information.” Conversely, a low implies that, despite any shifts in mean or variance, the oxidation distributions for young vs. old overlap so extensively that a single measurement scarcely informs on age. The latter is the case (0.001 bits) when mutual information is applied globally to the cysteine redox proteomic vectors in young and old mouse brains due to the statistical dependence of X and A in each oxidation bin (Figure 2).
Like the other metrics, mutual information can be computed per pathway or site. Hence, we performed a site-wise analysis using a script to identify 100 cystienes exhibiting the greatest delta change between young and old, pinpointing potential brain-specific aging biomarkers, which increased the mutual information bits by an order of magnitude (from 0.001 to 0.014 bits). The top ten sites yeilded an mutual infromation score of 0.693 bits. For example, the delta change for Cys59 in Acyl-coenzyme A thioesterase THEM4 was 98.8%. The resultant mutual information score of 0.693 bits renders the site highly predicitve of age.
3.5. Kullback-Liebler Divergence: Quantifying the Geometric Difference Between Redox State Distributions in Information Space
Let redox proteomic data from two conditions like control and H2O2-treated [132] be discretized into the same percentage-oxidized bins, such that represents the baseline condition (e.g., control) and represents the perturbed state (e.g., H2O2). Each Pi and Qi denotes the proportion of peptides falling into bin i, normalized such that . The Kullback-Leibler (KL) divergence from Q to P is defined as:
This equation formalizes the informational cost of assuming distribution Q compared to P. KL divergence captures how much the cysteine redox state has changed across the full distributional structure when the system is perturbed. Geometrically, KL divergence measures how one probability distribution shape differs from another in information space. Unlike Euclidean distance, it is asymmetric , preserving the temporal or causal directionality of cysteine redox state changes.
Consistent with Figure 2, the site-wise KL score for most of the 8,183 peptide vectors was 0.000 bits, indicating that no information is gained or lost across the majority of sites in old compared to young mice (Figure 3). These zero scores suggest minimal redistribution of oxidized peptides. However, 1,014 (12.4%) of the cysteine vectors displayed a nonzero KL divergence, such that the data displayed a bimodal distribution with a large peak at 0 and a nontrivial peak at 30-35 bits.
For example, the KL divergence score for Cys59 in peptidyl-prolyl cis-trans isomerase NIMA-interacting 1 (PIN1) was 34.21 bits. This reflects complete non-overlap between its young and old oxidation distributions. In young brains, Cys59 averages 6.8 % ± 0.56 % oxidation, while in Old it shifts to 0.97 % ± 0.25 %, with the two tight SEM-derived replicate clouds each falling into distinct histogram bins. A KL of ~34 bits arises because .
Biologically, this “all-or-nothing” change signals a re-parameterization of Cys59’s redox state with age: its oxidation profile in old mice carries maximal information relative to young (i.e., perfect separation), even though the absolute change in percent oxidation may seem modest.
3.6. Fisher Information Metric: Quantifying the Geometry of Curved Redox State Manifolds
Let the redox peptide oxidation data be characterized by a probability distribution p(x;θ), where θ is a parameter (or vector of parameters) that defines the shape or structure of the distribution—such as a mean oxidation state across peptides. The Fisher Information metric (FIM, I(θ) quantifies how much information the data carries about this parameter, which can be formalized as:
FIM describes how sharply a system responds to perturbations like exercise [133,134,135,136,137,138,139,140,141]. For instance, two distributions with the same mean oxidation might differ in how tightly they are concentrated around that mean [142]. Hence, the FIM captures this second-order structure—the local curvature of the data landscape. Geometrically, the FIM defines a Riemannian geometry on the space of probability distributions. It introduces curvature to the informational manifold: distributions that are more sensitive to parameter shifts lie on steeper, more curved regions, whereas robust or flat distributions lie in shallower area. These redox state data-derived manifolds can be described in terms of geometric distances and angles.
Interpretationally, high FIM values might correspond to tipping points, where small redox shifts drastically reconfigure the proteomic landscape (e.g., triggering signal response thresholds [143,144,145]). Conversely, flat regions with low Fisher Information may indicate robust zones [146,147,148], where cysteine redox state changes are dynamically buffered—“homeo-dynamics” [149].
The global FIM—dimensionless squared Hellinger distance (range 0-2)—was 0.1887, signifying that the overall surface between the cysteine redox state vectors in young compared to old mouse brains was mostly flat—small geodesic—across the oxidation bins (Figure 4). Interpretationally, this is consistent with the mutual information (0.001 bits) score and the substantial peak at 0 in the KL divergence distribution.
However, one can observe tall peaks in some binds, especially at intermediate oxidation states (30-60%-oxidized). At these vector points in the overall high dimensional manifold, the geodesic distance between the young and old is considerable, denoting a reconfiguration of the landscape. Specifically, the curvature is near maximal at θ60%, meaning this bin contributs substantially to the overall FIM score.
3.7. Fisher-Rao Distance: Quantifying the Distance Between Curved Redox Manifolds
Let the redox peptide oxidation data be characterized by a probability distribution p(x;θ), where θ parameterizes a family of redox states. While the FIM describes the local curvature around a single distribution, the Fisher–Rao distance (dFR) measures the true path length between two such distributions on the curved statistical manifold. Formally, this geodesic—the shortest path length—distance is defined as:
Fisher–Rao distance defines the true informational displacement between redox states—accounting not just for the magnitude of redox change, but for how the statistical curvature of the system warps that change. Two distributions might appear close in Euclidean metrics, yet lie far apart on the information manifold if one lies in a steep, sensitive region and the other in a flat, buffered one.
Geometrically, the Fisher–Rao distance measures the shortest possible path between redox states while honoring the manifold’s internal curvature—akin to walking over a hill instead of cutting through it. This defines the “true” distance between redox states in terms of the system’s sensitivity to change—where a greater distance indicates the systems not only differ in their values but their geometry.
Interpretationally, large Fisher–Rao distances between conditions (e.g., healthy vs. diseased [150]) may signify deep structural shifts in the system. Small Fisher–Rao distances, by contrast, may reflect smooth adaptation—a curved, minimal transition within a robust regulatory space.
Computing the Fisher-Rao distances in young and old mouse brains revealed an overall distance of 0.4399 radians maps to 25 degrees between two cysteine oxidation distance, signifying moderate angular separation (Figure 5). A maximum distance of 3.14 radians would indicate maximal separation. Hence, the angular separation of the distributions is more convergent than divergent.
The nonzero score indicates a degree of separation concentrated around the intermediate oxidation bins, particularly 20-30%-oxidized. Hence, subsets of the cysteine proteome do undergo substantial reparameterization, effectively defining a local reshaping of the manifold at specific points.
3.8. Distinguishing Order from Chaos in Time-Resolved Redox Dynamics
Let the redox proteome be measured across a time series—such as sequential timepoints under altered mitochondrial function, circadian cycles, or developmental transitions [151,152,153,154,155,156,157,158,159,160,161,162,163]. This temporally resolved data introduces a new analytic axis: how the system evolves, not just where it is. The temporal trajectory of the cysteine redox state may exhibit patterns that are:
- Ordered—following predictable or quasi-linear dynamics.
- Chaotic—diverging over time due to small differences in the initial conditions.
- Hybrid—a cysteine redox system where orderly and chaotic behaviors coexist either across different subsystems, within different time windows, or as structured chaos near low-dimensional attractors.
Chaos theory provides a mathematical framework to distinguish between these regimes by characterizing the underlying attractor structure of the dynamical system (Figure 6). Here, the redox trajectory is treated as an evolving signal in phase space, and we ask: Does it converge to a stable pattern, cycle through predictable states, or exhibit sensitive dependence on initial conditions?
To distinguish between these behavioral regimes, we draw from a set of mathematically grounded metrics in nonlinear dynamics. These tools quantify whether redox trajectories evolve stably, diverge chaotically, or settle into structured attractors. These tools capture distinct signatures of complexity: Lyapunov exponents quantify divergence of nearby trajectories, recurrence analysis detects hidden periodicities and long-range dependencies, correlation dimension characterizes the geometry of the underlying attractor, and bifurcation analysis reveals phase transitions triggered by small parametric shifts [164,165,166,167,168,169]. Table 1 summarizes each metric, its mathematical formulation, and its interpretation in the context of peptide-resolved proteomics, such as time-resolved cell cycle or signaling analyses [23,170,171,172].
At the peptide level, these tools allow us to treat nonlinear cysteine redox dynamics as an evolving informational signal trajectory in a high-dimensional state space [98]. These signal trajectories can fold and stretch like a shape being continually remodeled. The resulting shapes—patterns—can exhibit instability and a memory. These measures offer a generative map of how redox perturbations propagate, whether they resolve into ordered recovery or spiral into new basin attractors, which we term strange oxi-attractors.
Small differences in initial cysteine oxidation states can cascade into dramatically different outcomes. A minute shift in oxidation at a specific site—triggered by the upstream redox module [173,174,175]—may push the system across a bifurcation point or into a new attractor basin—a dissipative structure: the strange oxi-attractor [176].
We define this phenomenon as the cysteine redox butterfly effect. This effect captures the sensitive dependence to initial conditions in nonlinear systems, which while manifest at the proteoform level can be recorded in the redox states of peptides. The cysteine redox butterfly effect explains how noise can become a biological signal—how tiny molecular events can influence fate decisions, stress responses, or pathogenesis [177,178,179,180,181,182,183,184,185,186,187]. And critically, these changes are not arbitrary. Hence, cysteine oxidation encodes not only the current biochemical state—but the memory of its perturbation history, fractally embedded in time.
3.9. Fractal Geometry: Quantifying Scale-Invariant Self-Similar Cysteine Redox State Patterns
Let a peptide level cysteine redox trajectory be conceptualized as a curve evolving in complex space, where each peptide’s oxidation state is modeled not as a scalar value but as a complex number:
In this formalism,is the real measured percentage oxidation of the peptide at time t, andis an imaginary component, capturing a latent structure, such as the velocity of the redox state change, the geometry (e.g., Fisher-Rao distance), or a measure of entropy (e.g., approximate entropy or Shannon entropy). This transformation lifts peptide-coded cysteine redox dynamics into the complex plane (), where the trajectories—paths in phase space [0,100]—can generate fractals.
Pioneered by Benoit Mandelbrot [124,125,168,188,189], fractals are geometric structures that exhibit self-similarity across scales, often governed by recursive rules or nested feedback. Applied to redox proteomics, fractal analysis asks: Does the oxidation trajectory of a peptide encode recursive or scale-invariant patterns? Do certain biochemical systems evolve along a fractal manifold in redox space? To help answer these questions, Table 2 defines a set of mathematically grounded tools for extracting fractal structure from complex-valued peptide oxidation trajectories. Figure 7 illustrates a synthetic example of a complex-valued redox signal and its recurrence structure, visually revealing fractal and recursive motifs in .
These metrics may be applied on a per-peptide basis or aggregated across peptides or pathways to infer system-wide fractal signatures. These analyses may also be constrained within specific time windows to isolate localized self-similarity.
Interpretationally, fractal geometry can reveal if and how cysteine oxidation patterns recur, nest, or stretch over time. A residue signal with a non-integer fractal dimensional value , suggests scale-invariant, and recursive redox dynamics, like a recurrent oxidation-reduction control cycle gravitating around a basin attractor. The imaginary component in the expression, provides analytical flexibility. It can encode temporal derivatives, conformational entropy, of redox flux sensitivity. As a result, fractal patterns that spiral inward or explode outward can be produced. Fractal geometry can reveal whether the system or aspects thereof exhibits chaotic behavior about strange oxi-attractors via the analysis of fractal redox manifolds.
We define a fractal redox manifold as a recursive geometric space where peptide oxidation states evolve nonlinearly in a conserved self-similar manner. These manifolds may embody a memory of redox history.
4. Discussion
Ironically, redox biology resists reduction. It defies simple arithmetic. As evidenced by the failure of the original linear rooted free radical theory of aging [190,191,192,193,194], adding or subtracting electrons doesn’t yield proportionate cysteine redox state changes. Instead, it can provoke silence or unleash a cascade. Without violating physics, outputs diverge from inputs. How? Because the cysteine redox network is not a passive register of electrons. Instead, it is a dynamic, living network. Actively wiring, perpetually rewiring itself by funneling, channeling, dispersing the electron flux across sulfur nodes. This sulfur nodal flux dynamically remodels cysteine proteoforms distributions [27,50,51,89,98,195].
The instantiated now carries a memory. The oxidation state of cysteine—measured via a peptide level read—holds a record of its past that can offer insights even when the proteoform level information is inaccessible. These redox states tell us how now can shape the future. The profound consequence is that divergence from a given state might not be easily reversed by an “antioxidant” [36,38,196,197,198,199]. Even if the antioxidant works as intended [37,40,200], simply curtailing further oxidation will not provide the electrons needed to reduce what is already oxidized [133,201].
A core operating logic emerges where the flow of electron dynamically shapes and reshapes the live sulfur nodes of the cysteine proteome. This incessant flow of energy continually generates entropy by reshaping proteoform matter, structuring their nonlinear dynamics. From the relatively simple redox reactions that determine these states change dynamics, emerges complex behavior—hysteresis, order, chaos, and fractals (Figure 8). But, how do we understand this complexity? How do we differentiate between order and chaos? If needed, can we restore order or provoke redox chaos?
To better understand the structured signals underpinning complex phenotypes like sleep-loss induced neurodegeneration [202,203,204,205,206], information and chaos theory become indispensable tools for advancing redox proteomic analyses—even when it is peptides not their proteoforms that are measured [207,208,209,210,211,212,213,214,215,216,217,218,219].
- Information theory enables the oxidation state of a peptide to be analyzed and interpreted as an encoded signal, compressible or not, with measurable entropy. The more irregular, the less compressible—and paradoxically, the more information it may carry. By quantifying these dynamics across timepoints and conditions, one can begin to see that redox states are not random variables—they are deterministic signals with memory, unfolding on a nonlinear manifold.
- Chaos theory offers the interpretive lens. Small redox changes can produce outsized shifts in oxidation of peptides. This sensitivity to initial conditions defines the redox butterfly effect. Peptide-level oxidation patterns form trajectories—not just in time, but across a complex redox phase space, where certain states act as strange oxi-attractor. With tools like approximate entropy, recurrence quantification, and fractal dimension analysis, these structures are now computationally accessible, even at the peptide level.
A single oxidation event, once viewed in isolation, can now be seen as part of a larger dynamic system—a ripple in a structured informational field space. Part of a wider cysteine state pattern capable of producing redox fractal manifolds. What began as a measurement of oxidation becomes something else entirely:
A window into the informational and energetic landscape of the cell, where peptide-level data carries echoes of phase transitions, stability basins, and bifurcation points.
The dual lens of information and chaos theory can make sense of many anomalies. Like how chaotic attractors in atrial fibrillation demand a shock—not a gentle nudge—to restore rhythm, redox chaos—or ordered dysregulation—may require a systemic reset. Any reset is unlikely to stem from the “oxidants bad, antioxidants good” dichotomy [138] as no diseases where “oxidative stress” is implicated have yet been cured along these lines [220]. These disappointing results evidence how much current thinking in redox biology breaks down in the face of nonlinear dynamical systems.
So far, virtually every pharmaceutical redox therapy has fallen short. Perhaps, what’s needed is not a molecule, but a mode—a system-wide coherence. These coherent system states may be better achieved not by a “blockbuster antioxidant”—however well-designed—but through basic lifestyle choices [221,222,223]. As Barry Halliwell remarked [38], they include sleep, diet, exercise. Each one remodels the energy flowing, matter cycling dynamical logic of the cysteine proteome. For example, exercise induces nuanced reductive and oxidative cysteine redox state changes [139,223,224,225,226,227,228,229,230,231,232,233] These physiology-first systems strategies may ultimately be able to cross boundary conditions from order to chaos or vice versa within subsets of the network.
5. Conclusion
Erwin Schrodinger, Albert Szent-Györgyi and others are widely credited with the idea that discoveries consist of seeing what everybody else has seen and thinking what nobody else has thought. In this tradition, we have articulated a novel idea built atop what everybody in the field has seen—cysteine redox proteomic datasets.
We propose that these datasets can be reinterpreted through the lens of information theory and chaos theory—not just as static outputs but as signals from dynamic systems, revealing geometry, structure, and unpredictability in redox biology. From this perspective, a single oxidative shift could ripple over time crossing the chaotic boundary to a strange oxi-attractor—the cysteine redox butterfly effect.
Deriving novel insights does not depend on generating new data, but on rethinking what we already have. Petabytes of existing redox proteomic data can now be interrogated for Shannon entropy, KL divergence, Fisher information, and chaos signatures, extracting hidden order and transitions within complex peptide distributions. Hence, we expect these approaches to unlock latent patterns, enabling not just new discoveries but a shift in how we frame, model, and predict dynamics in redox biology [234,235,236].
Information and chaos theory metrics can be applied to virtually every proteomic dataset from global label-free quantification [237] studies, targeted analyses [238,239,240,241], to advanced chemo-proteomic workflows [242], including reactive cysteine labelling [243,244,245,246] and PTMs like phosphorylation [247,248]. Other oxidative PTMs include methionine oxidation, tyrosine nitration, and carbonylation at several amino acids, such as lysine [249,250,251,252,253,254,255,256,257,258,259,260]. We fully expect similar insights to emerge from their reinterpretation. Hence, scientists across disparate fields can leverage information and chaos theory to derive novel proteomic insights from preexisting datasets [261].
In conclusion, we have reframed the analysis and interpretation of redox proteomic datasets, and potentially proteomic datasets at large, using mathematically grounded information and chaos theory derived metrics. The result is a new of thinking about redox biology—one that embraces the complexities and emergent properties of nonlinear dynamical systems.
Supplementary Materials
n/a.
Author Contributions
n/a.
Funding
n/a
Institutional Review Board Statement
n/a.
Informed Consent Statement
n/a.
Data Availability Statement
n/a
Acknowledgments
The author thanks Prof. Angus Lamond (The University of Dundee) and the members of his lab for useful scientific discussions. During the preparation of this manuscript, the authors used ChatGPT (OpenAI, GPT-4, July 2025) for the purposes of idea refinement, language editing, figure caption ideas, symbolic visual inspiration, and high-level sound boarding. The tool was also used to provide structural feedback and enhance clarity during drafting. All content was reviewed, edited, and finalized by the authors, who take full responsibility for the accuracy and integrity of the publication.
Conflicts of Interest
The author declares no conflicts of interest.
References
- Sies, H.; Mailloux, R.J.; Jakob, U. Fundamentals of Redox Regulation in Biology. Nat. Rev. Mol. Cell Biol. 2024, 1–19. [Google Scholar] [CrossRef]
- Alcock, L.J.; Perkins, M.V.; Chalker, J.M. Chemical Methods for Mapping Cysteine Oxidation. Chem Soc Rev 2017, 47, 231–268. [Google Scholar] [CrossRef]
- Paulsen, C.E.; Carroll, K.S. Cysteine-Mediated Redox Signaling: Chemistry, Biology, and Tools for Discovery. Chem Rev 2013, 113, 4633–4679. [Google Scholar] [CrossRef]
- Gould, N.S.; Evans, P.; Martínez-Acedo, P.; Marino, S.M.; Gladyshev, V.N.; Carroll, K.S.; Ischiropoulos, H. Site-Specific Proteomic Mapping Identifies Selectively Modified Regulatory Cysteine Residues in Functionally Distinct Protein Networks. Chem Biol 2015, 22, 965–975. [Google Scholar] [CrossRef]
- Wensien, M.; Pappenheim, F.R. von; Funk, L.-M.; Kloskowski, P.; Curth, U.; Diederichsen, U.; Uranga, J.; Ye, J.; Fang, P.; Pan, K.-T.; et al. A Lysine–Cysteine Redox Switch with an NOS Bridge Regulates Enzyme Function. Nature 2021, 593, 460–464. [Google Scholar] [CrossRef] [PubMed]
- Zhai, Y.; Chen, L.; Zhao, Q.; Zheng, Z.-H.; Chen, Z.-N.; Bian, H.; Yang, X.; Lu, H.-Y.; Lin, P.; Chen, X.; et al. Cysteine Carboxyethylation Generates Neoantigens to Induce HLA-Restricted Autoimmunity. Science 2023, 379, eabg2482. [Google Scholar] [CrossRef] [PubMed]
- Huang, X.; Chen, S.; Li, W.; Tang, L.; Zhang, Y.; Yang, N.; Zou, Y.; Zhai, X.; Xiao, N.; Liu, W.; et al. ROS Regulated Reversible Protein Phase Separation Synchronizes Plant Flowering. Nat Chem Biol 2021, 17, 549–557. [Google Scholar] [CrossRef] [PubMed]
- Lennicke, C.; Cochemé, H.M. Redox Metabolism: ROS as Specific Molecular Regulators of Cell Signaling and Function. Mol Cell 2021, 81, 3691–3707. [Google Scholar] [CrossRef]
- Parvez, S.; Long, M.J.C.; Poganik, J.R.; Aye, Y. Redox Signaling by Reactive Electrophiles and Oxidants. Chem Rev 2018, 118, 8798–8888. [Google Scholar] [CrossRef]
- Jones, D.P.; Sies, H. The Redox Code. Antioxid Redox Sign 2015, 23, 734–746. [Google Scholar] [CrossRef]
- Jones, D.P. Redox Organization of Living Systems. Free Radic. Biol. Med. 2024, 217, 179–189. [Google Scholar] [CrossRef]
- Feelisch, M.; Cortese-Krott, M.M.; Santolini, J.; Wootton, S.A.; Jackson, A.A. Systems Redox Biology in Health and Disease. EXCLI J. 2022, 21, 623–646. [Google Scholar] [CrossRef]
- Day, N.J.; Gaffrey, M.J.; Qian, W.-J. Stoichiometric Thiol Redox Proteomics for Quantifying Cellular Responses to Perturbations. Antioxidants 2021, 10, 499. [Google Scholar] [CrossRef]
- Li, X.; Gluth, A.; Zhang, T.; Qian, W. Thiol Redox Proteomics: Characterization of Thiol-based Post-translational Modifications. Proteomics 2023, e2200194. [Google Scholar] [CrossRef]
- Cobley, J.N.; Sakellariou, G.K.; Husi, H.; McDonagh, B. Proteomic Strategies to Unravel Age-Related Redox Signalling Defects in Skeletal Muscle. Free Radical Bio Med 2019, 132, 24–32. [Google Scholar] [CrossRef]
- Kim, H.; Ha, S.; Lee, H.Y.; Lee, K. ROSics: Chemistry and Proteomics of Cysteine Modifications in Redox Biology. Mass Spectrom Rev 2015, 34, 184–208. [Google Scholar] [CrossRef] [PubMed]
- Burger, N.; Chouchani, E.T. A New Era of Cysteine Proteomics – Technological Advances in Thiol Biology. Curr. Opin. Chem. Biol. 2024, 79, 102435. [Google Scholar] [CrossRef]
- Xiao, H.; Jedrychowski, M.P.; Schweppe, D.K.; Huttlin, E.L.; Yu, Q.; Heppner, D.E.; Li, J.; Long, J.; Mills, E.L.; Szpyt, J.; et al. A Quantitative Tissue-Specific Landscape of Protein Redox Regulation during Aging. Cell 2020, 180, 968–983.e24. [Google Scholar] [CrossRef] [PubMed]
- Li, X.; Day, N.J.; Feng, S.; Gaffrey, M.J.; Lin, T.-D.; Paurus, V.L.; Monroe, M.E.; Moore, R.J.; Yang, B.; Xian, M.; et al. Mass Spectrometry-Based Direct Detection of Multiple Types of Protein Thiol Modifications in Pancreatic Beta Cells under Endoplasmic Reticulum Stress. Redox Biol 2021, 46, 102111. [Google Scholar] [CrossRef]
- Day, N.J.; Kelly, S.S.; Lui, L.; Mansfield, T.A.; Gaffrey, M.J.; Trejo, J.B.; Sagendorf, T.J.; Attah, I.K.; Moore, R.J.; Douglas, C.M.; et al. Signatures of Cysteine Oxidation on Muscle Structural and Contractile Proteins Are Associated with Physical Performance and Muscle Function in Older Adults: Study of Muscle, Mobility and Aging (SOMMA). Aging Cell 2024, 23, e14094. [Google Scholar] [CrossRef] [PubMed]
- Huang, J.; Staes, A.; Impens, F.; Demichev, V.; Breusegem, F.V.; Gevaert, K.; Willems, P. CysQuant: Simultaneous Quantification of Cysteine Oxidation and Protein Abundance Using Data Dependent or Independent Acquisition Mass Spectrometry. Redox Biol. 2023, 67, 102908. [Google Scholar] [CrossRef] [PubMed]
- Anjo, S.I.; Melo, M.N.; Loureiro, L.R.; Sabala, L.; Castanheira, P.; Grãos, M.; Manadas, B. OxSWATH: An Integrative Method for a Comprehensive Redox-Centered Analysis Combined with a Generic Differential Proteomics Screening. Redox Biol. 2019, 22, 101130. [Google Scholar] [CrossRef]
- Behring, J.B.; Post, S. van der; Mooradian, A.D.; Egan, M.J.; Zimmerman, M.I.; Clements, J.L.; Bowman, G.R.; Held, J.M. Spatial and Temporal Alterations in Protein Structure by EGF Regulate Cryptic Cysteine Oxidation. Sci Signal 2020, 13, eaay7315. [Google Scholar] [CrossRef]
- Held, J.M. Redox Systems Biology: Harnessing the Sentinels of the Cysteine Redoxome. Antioxid Redox Sign 2020, 32, 659–676. [Google Scholar] [CrossRef]
- Held, J.M.; Danielson, S.R.; Behring, J.B.; Atsriku, C.; Britton, D.J.; Puckett, R.L.; Schilling, B.; Campisi, J.; Benz, C.C.; Gibson, B.W. Targeted Quantitation of Site-Specific Cysteine Oxidation in Endogenous Proteins Using a Differential Alkylation and Multiple Reaction Monitoring Mass Spectrometry Approach. Mol Cell Proteomics 2010, 9, 1400–1410. [Google Scholar] [CrossRef]
- Brown, G.C. Bioenergetic Myths of Energy Transduction in Eukaryotic Cells. Front. Mol. Biosci. 2024, 11, 1402910. [Google Scholar] [CrossRef]
- Cobley, J.N. 50 Shades of Oxidative Stress: A State-Specific Cysteine Redox Pattern Hypothesis. Redox Biol. 2023, 67, 102936. [Google Scholar] [CrossRef]
- Lennicke, C.; Cochemé, H.M. Redox Regulation of the Insulin Signalling Pathway. Redox Biol 2021, 42, 101964. [Google Scholar] [CrossRef]
- Sies, H. Oxidative Eustress: On Constant Alert for Redox Homeostasis. Redox Biol 2021, 41, 101867. [Google Scholar] [CrossRef] [PubMed]
- Devant, P.; Boršić, E.; Ngwa, E.M.; Xiao, H.; Chouchani, E.T.; Thiagarajah, J.R.; Hafner-Bratkovič, I.; Evavold, C.L.; Kagan, J.C. Gasdermin D Pore-Forming Activity Is Redox-Sensitive. Cell Reports 2023, 42, 112008. [Google Scholar] [CrossRef] [PubMed]
- Cobley, J.N.; Fiorello, M.L.; Bailey, D.M. 13 Reasons Why the Brain Is Susceptible to Oxidative Stress. Redox Biol 2018, 15, 490–503. [Google Scholar] [CrossRef] [PubMed]
- Sies, H. Dynamics of Intracellular and Intercellular Redox Communication. Free Radic. Biol. Med. 2024, 225, 933–939. [Google Scholar] [CrossRef] [PubMed]
- Shannon, C.E. A Mathematical Theory of Communication. Bell Syst. Tech. J. 1948, 27, 379–423. [Google Scholar] [CrossRef]
- D’Autréaux, B.; Toledano, M.B. ROS as Signalling Molecules: Mechanisms That Generate Specificity in ROS Homeostasis. Nat Rev Mol Cell Bio 2007, 8, 813–824. [Google Scholar] [CrossRef]
- Winterbourn, C.C.; Hampton, M.B. Thiol Chemistry and Specificity in Redox Signaling. Free Radical Bio Med 2008, 45, 549–561. [Google Scholar] [CrossRef]
- Halliwell, B.; Gutteridge, J. Free Radicals in Biology and Medicine; 2015; Vol. 5th Edition.
- Murphy, M.P.; Bayir, H.; Belousov, V.; Chang, C.J.; Davies, K.J.A.; Davies, M.J.; Dick, T.P.; Finkel, T.; Forman, H.J.; Janssen-Heininger, Y.; et al. Guidelines for Measuring Reactive Oxygen Species and Oxidative Damage in Cells and in Vivo. Nat Metabolism 2022, 4, 651–662. [Google Scholar] [CrossRef]
- Halliwell, B. Understanding Mechanisms of Antioxidant Action in Health and Disease. Nat. Rev. Mol. Cell Biol. 2023, 1–21. [Google Scholar] [CrossRef] [PubMed]
- Murphy, M.P.; Holmgren, A.; Larsson, N.-G.; Halliwell, B.; Chang, C.J.; Kalyanaraman, B.; Rhee, S.G.; Thornalley, P.J.; Partridge, L.; Gems, D.; et al. Unraveling the Biological Roles of Reactive Oxygen Species. Cell Metab 2011, 13, 361–366. [Google Scholar] [CrossRef]
- Sies, H.; Belousov, V.V.; Chandel, N.S.; Davies, M.J.; Jones, D.P.; Mann, G.E.; Murphy, M.P.; Yamamoto, M.; Winterbourn, C. Defining Roles of Specific Reactive Oxygen Species (ROS) in Cell Biology and Physiology. Nat Rev Mol Cell Bio 2022, 1–17. [Google Scholar] [CrossRef]
- Sies, H.; Jones, D.P. Reactive Oxygen Species (ROS) as Pleiotropic Physiological Signalling Agents. Nat Rev Mol Cell Bio 2020, 21, 363–383. [Google Scholar] [CrossRef]
- Sies, H. Hydrogen Peroxide as a Central Redox Signaling Molecule in Physiological Oxidative Stress: Oxidative Eustress. Redox Biol 2017, 11, 613–619. [Google Scholar] [CrossRef] [PubMed]
- Moosmann, B.; Hajieva, P. Probing the Role of Cysteine Thiyl Radicals in Biology: Eminently Dangerous, Difficult to Scavenge. Antioxidants 2022, 11, 885. [Google Scholar] [CrossRef] [PubMed]
- Margaritelis, N.V.; Cobley, J.N.; Paschalis, V.; Veskoukis, A.S.; Theodorou, A.A.; Kyparos, A.; Nikolaidis, M.G. Going Retro: Oxidative Stress Biomarkers in Modern Redox Biology. Free Radical Bio Med 2016, 98, 2–12. [Google Scholar] [CrossRef]
- Cobley, J.N.; Husi, H. Immunological Techniques to Assess Protein Thiol Redox State: Opportunities, Challenges and Solutions. Antioxidants 2020, 9, 315. [Google Scholar] [CrossRef]
- Cobley, J.N. Mechanisms of Mitochondrial ROS Production in Assisted Reproduction: The Known, the Unknown, and the Intriguing. Antioxidants 2020, 9, 933. [Google Scholar] [CrossRef]
- Margaritelis, N.V.; Cobley, J.N.; Paschalis, V.; Veskoukis, A.S.; Theodorou, A.A.; Kyparos, A.; Nikolaidis, M.G. Principles for Integrating Reactive Species into in Vivo Biological Processes: Examples from Exercise Physiology. Cell Signal 2016, 28, 256–271. [Google Scholar] [CrossRef]
- Cobley, J.N.; Margaritelis, N.V.; Chatzinikolaou, P.N.; Nikolaidis, M.G.; Davison, G.W. Ten “Cheat Codes” for Measuring Oxidative Stress in Humans. Antioxidants 2024, 13, 877. [Google Scholar] [CrossRef]
- Choudhary, D.; Foster, K.R.; Uphoff, S. Chaos in a Bacterial Stress Response. Curr. Biol. 2023, 33, 5404–5414.e9. [Google Scholar] [CrossRef]
- Cobley, J.N. Oxiforms: Unique Cysteine Residue- and Chemotype-specified Chemical Combinations Can Produce Functionally-distinct Proteoforms. Bioessays 2023, 45. [Google Scholar] [CrossRef]
- Cobley, J.N.; Chatzinikolaou, P.N.; Schmidt, C.A. Computational Analysis of Human Cysteine Redox Proteoforms Reveals Novel Insights. [CrossRef]
- Urrutia, P.J.; Bórquez, D.A. Expanded Bioinformatic Analysis of Oximouse Dataset Reveals Key Putative Processes Involved in Brain Aging and Cognitive Decline. Free Radic. Biol. Med. 2023, 207, 200–211. [Google Scholar] [CrossRef] [PubMed]
- Li, B.; Ming, H.; Qin, S.; Nice, E.C.; Dong, J.; Du, Z.; Huang, C. Redox Regulation: Mechanisms, Biology and Therapeutic Targets in Diseases. Signal Transduct. Target. Ther. 2025, 10, 72. [Google Scholar] [CrossRef]
- Desai, H.; Andrews, K.H.; Bergersen, K.V.; Ofori, S.; Yu, F.; Shikwana, F.; Arbing, M.A.; Boatner, L.M.; Villanueva, M.; Ung, N.; et al. Chemoproteogenomic Stratification of the Missense Variant Cysteinome. Nat. Commun. 2024, 15, 9284. [Google Scholar] [CrossRef] [PubMed]
- Yan, T.; Boatner, L.M.; Cui, L.; Tontonoz, P.J.; Backus, K.M. Defining the Cell Surface Cysteinome Using Two-Step Enrichment Proteomics. JACS Au 2023, 3, 3506–3523. [Google Scholar] [CrossRef] [PubMed]
- Burton, N.R.; Polasky, D.A.; Shikwana, F.; Ofori, S.; Yan, T.; Geiszler, D.J.; Leprevost, F. da V.; Nesvizhskii, A.I.; Backus, K.M. Solid-Phase Compatible Silane-Based Cleavable Linker Enables Custom Isobaric Quantitative Chemoproteomics. J. Am. Chem. Soc. 2023, 145, 21303–21318. [Google Scholar] [CrossRef]
- Desai, H.S.; Yan, T.; Yu, F.; Sun, A.W.; Villanueva, M.; Nesvizhskii, A.I.; Backus, K.M. SP3-Enabled Rapid and High Coverage Chemoproteomic Identification of Cell-State–Dependent Redox-Sensitive Cysteines. Mol. Cell. Proteom. 2022, 21, 100218. [Google Scholar] [CrossRef]
- Yan, T.; Desai, H.S.; Boatner, L.M.; Yen, S.L.; Cao, J.; Palafox, M.F.; Jami-Alahmadi, Y.; Backus, K.M. SP3-FAIMS Chemoproteomics for High-Coverage Profiling of the Human Cysteinome**. ChemBioChem 2021, 22, 1841–1851. [Google Scholar] [CrossRef]
- Boatner, L.M.; Palafox, M.F.; Schweppe, D.K.; Backus, K.M. CysDB: A Human Cysteine Database Based on Experimental Quantitative Chemoproteomics. Cell Chem Biol 2023. [Google Scholar] [CrossRef] [PubMed]
- Yan, T.; Palmer, A.B.; Geiszler, D.J.; Polasky, D.A.; Boatner, L.M.; Burton, N.R.; Armenta, E.; Nesvizhskii, A.I.; Backus, K.M. Enhancing Cysteine Chemoproteomic Coverage through Systematic Assessment of Click Chemistry Product Fragmentation. Anal Chem 2022, 94, 3800–3810. [Google Scholar] [CrossRef]
- Huang, H.; Petersen, M.H.; Ibañez-Vea, M.; Lassen, P.S.; Larsen, M.R.; Palmisano, G. Simultaneous Enrichment of Cysteine-Containing Peptides and Phosphopeptides Using a Cysteine-Specific Phosphonate Adaptable Tag (CysPAT) in Combination with Titanium Dioxide (TiO2) Chromatography*. Mol. Cell. Proteom. 2016, 15, 3282–3296. [Google Scholar] [CrossRef]
- Leichert, L.I.; Gehrke, F.; Gudiseva, H.V.; Blackwell, T.; Ilbert, M.; Walker, A.K.; Strahler, J.R.; Andrews, P.C.; Jakob, U. Quantifying Changes in the Thiol Redox Proteome upon Oxidative Stress in Vivo. Proc National Acad Sci 2008, 105, 8197–8202. [Google Scholar] [CrossRef]
- Chouchani, E.T.; Methner, C.; Nadtochiy, S.M.; Logan, A.; Pell, V.R.; Ding, S.; James, A.M.; Cochemé, H.M.; Reinhold, J.; Lilley, K.S.; et al. Cardioprotection by S-Nitrosation of a Cysteine Switch on Mitochondrial Complex I. Nat Med 2013, 19, 753–759. [Google Scholar] [CrossRef]
- Chouchani, E.T.; James, A.M.; Fearnley, I.M.; Lilley, K.S.; Murphy, M.P. Proteomic Approaches to the Characterization of Protein Thiol Modification. Curr Opin Chem Biol 2011, 15, 120–128. [Google Scholar] [CrossRef]
- Sinha, A.; Mann, M. A Beginner’s Guide to Mass Spectrometry–Based Proteomics. Biochem. 2020, 42, 64–69. [Google Scholar] [CrossRef]
- Aebersold, R.; Mann, M. Mass Spectrometry-Based Proteomics. Nature 2003, 422, 198–207. [Google Scholar] [CrossRef]
- Steen, H.; Mann, M. The Abc’s (and Xyz’s) of Peptide Sequencing. Nat Rev Mol Cell Bio 2004, 5, 699–711. [Google Scholar] [CrossRef]
- He, F.; Aebersold, R.; Baker, M.S.; Bian, X.; Bo, X.; Chan, D.W.; Chang, C.; Chen, L.; Chen, X.; Chen, Y.-J.; et al. π-HuB: The Proteomic Navigator of the Human Body. Nature 2024, 636, 322–331. [Google Scholar] [CrossRef] [PubMed]
- Guo, T.; Steen, J.A.; Mann, M. Mass-Spectrometry-Based Proteomics: From Single Cells to Clinical Applications. Nature 2025, 638, 901–911. [Google Scholar] [CrossRef]
- Aebersold, R.; Mann, M. Mass-Spectrometric Exploration of Proteome Structure and Function. Nature 2016, 537, 347–355. [Google Scholar] [CrossRef] [PubMed]
- Cox, J.; Mann, M. MaxQuant Enables High Peptide Identification Rates, Individualized p.p.b.-Range Mass Accuracies and Proteome-Wide Protein Quantification. Nat. Biotechnol. 2008, 26, 1367–1372. [Google Scholar] [CrossRef] [PubMed]
- Demichev, V.; Messner, C.B.; Vernardis, S.I.; Lilley, K.S.; Ralser, M. DIA-NN: Neural Networks and Interference Correction Enable Deep Proteome Coverage in High Throughput. Nat. Methods 2020, 17, 41–44. [Google Scholar] [CrossRef]
- Lou, R.; Cao, Y.; Li, S.; Lang, X.; Li, Y.; Zhang, Y.; Shui, W. Benchmarking Commonly Used Software Suites and Analysis Workflows for DIA Proteomics and Phosphoproteomics. Nat. Commun. 2023, 14, 94. [Google Scholar] [CrossRef]
- Pillay, C.S.; Eagling, B.D.; Driscoll, S.R.E.; Rohwer, J.M. Quantitative Measures for Redox Signaling. Free Radical Bio Med 2016, 96, 290–303. [Google Scholar] [CrossRef]
- Buettner, G.R.; Wagner, B.A.; Rodgers, V.G.J. Quantitative Redox Biology: An Approach to Understand the Role of Reactive Species in Defining the Cellular Redox Environment. Cell Biochem Biophys 2013, 67, 477–483. [Google Scholar] [CrossRef]
- Cobley, J.N.; Moult, P.R.; Burniston, J.G.; Morton, J.P.; Close, G.L. Exercise Improves Mitochondrial and Redox-Regulated Stress Responses in the Elderly: Better Late than Never! Biogerontology 2015, 16, 249–264. [Google Scholar] [CrossRef]
- Cobley, J.N.; Sakellariou, G.K.; Owens, D.J.; Murray, S.; Waldron, S.; Gregson, W.; Fraser, W.D.; Burniston, J.G.; Iwanejko, L.A.; McArdle, A.; et al. Lifelong Training Preserves Some Redox-Regulated Adaptive Responses after an Acute Exercise Stimulus in Aged Human Skeletal Muscle. Free Radical Bio Med 2014, 70, 23–32. [Google Scholar] [CrossRef] [PubMed]
- Stretton, C.; Pugh, J.N.; McDonagh, B.; McArdle, A.; Close, G.L.; Jackson, M.J. 2-Cys Peroxiredoxin Oxidation in Response to Hydrogen Peroxide and Contractile Activity in Skeletal Muscle: A Novel Insight into Exercise-Induced Redox Signalling? Free Radical Bio Med 2020, 160, 199–207. [Google Scholar] [CrossRef] [PubMed]
- Pugh, J.N.; Stretton, C.; McDonagh, B.; Brownridge, P.; McArdle, A.; Jackson, M.J.; Close, G.L. Exercise Stress Leads to an Acute Loss of Mitochondrial Proteins and Disruption of Redox Control in Skeletal Muscle of Older Subjects: An Underlying Decrease in Resilience with Aging? Free Radical Bio Med 2021, 177, 88–99. [Google Scholar] [CrossRef]
- McDonagh, B.; Sakellariou, G.K.; Smith, N.T.; Brownridge, P.; Jackson, M.J. Differential Cysteine Labeling and Global Label-Free Proteomics Reveals an Altered Metabolic State in Skeletal Muscle Aging. J. Proteome Res. 2014, 13, 5008–5021. [Google Scholar] [CrossRef] [PubMed]
- Shinn, M. Phantom Oscillations in Principal Component Analysis. Proc. Natl. Acad. Sci. 2023, 120, e2311420120. [Google Scholar] [CrossRef]
- Kitano, H. Computational Systems Biology. Nature 2002, 420, 206–210. [Google Scholar] [CrossRef]
- Hartwell, L.H.; Hopfield, J.J.; Leibler, S.; Murray, A.W. From Molecular to Modular Cell Biology. Nature 1999, 402, C47–C52. [Google Scholar] [CrossRef]
- Smith, L.M.; Kelleher, N.L.; Linial, M.; Goodlett, D.; Langridge-Smith, P.; Goo, Y.A.; Safford, G.; Bonilla*, L.; Kruppa, G.; Zubarev, R.; et al. Proteoform: A Single Term Describing Protein Complexity. Nat Methods 2013, 10, 186–187. [Google Scholar] [CrossRef]
- Smith, L.M.; Kelleher, N.L. Proteoforms as the next Proteomics Currency. Science 2018, 359, 1106–1107. [Google Scholar] [CrossRef]
- Carbonara, K.; Andonovski, M.; Coorssen, J.R. Proteomes Are of Proteoforms: Embracing the Complexity. Proteomes 2021, 9, 38. [Google Scholar] [CrossRef]
- Coorssen, J.R.; Padula, M.P. Proteomics—The State of the Field: The Definition and Analysis of Proteomes Should Be Based in Reality, Not Convenience. Proteomes 2024, 12, 14. [Google Scholar] [CrossRef]
- Alfaro, J.A.; Bohländer, P.; Dai, M.; Filius, M.; Howard, C.J.; Kooten, X.F. van; Ohayon, S.; Pomorski, A.; Schmid, S.; Aksimentiev, A.; et al. The Emerging Landscape of Single-Molecule Protein Sequencing Technologies. Nat Methods 2021, 18, 604–617. [Google Scholar] [CrossRef] [PubMed]
- Cobley, J.N. Exploring the Unmapped Cysteine Redox Proteoform Landscape. Am. J. Physiol.-Cell Physiol. 2024. [Google Scholar] [CrossRef]
- Parkies, S.L.; Lind, D.J.; Pillay, C.S. Emerging Trends for the Regulation of Thiol-Based Redox Transcription Factor Pathways. Biochemistry 2025. [Google Scholar] [CrossRef] [PubMed]
- Jacquel, B.; Kavčič, B.; Aspert, T.; Matifas, A.; Kuehn, A.; Zhuravlev, A.; Byckov, E.; Morgan, B.; Julou, T.; Charvin, G. A Trade-off between Stress Resistance and Tolerance Underlies the Adaptive Response to Hydrogen Peroxide. Cell Syst. 2025, 101320. [Google Scholar] [CrossRef] [PubMed]
- Lind, D.J.; Naidoo, K.C.; Tomalin, L.E.; Rohwer, J.M.; Veal, E.A.; Pillay, C.S. Quantifying Redox Transcription Factor Dynamics as a Tool to Investigate Redox Signalling. Free Radic. Biol. Med. 2024, 218, 16–25. [Google Scholar] [CrossRef]
- Smith, L.M.; Thomas, P.M.; Shortreed, M.R.; Schaffer, L.V.; Fellers, R.T.; LeDuc, R.D.; Tucholski, T.; Ge, Y.; Agar, J.N.; Anderson, L.C.; et al. A Five-Level Classification System for Proteoform Identifications. Nat. Methods 2019, 16, 939–940. [Google Scholar] [CrossRef]
- Bamberger, C.; Martínez-Bartolomé, S.; Montgomery, M.; Pankow, S.; Hulleman, J.D.; Kelly, J.W.; Yates, J.R. Deducing the Presence of Proteins and Proteoforms in Quantitative Proteomics. Nat. Commun. 2018, 9, 2320. [Google Scholar] [CrossRef]
- Aebersold, R.; Agar, J.N.; Amster, I.J.; Baker, M.S.; Bertozzi, C.R.; Boja, E.S.; Costello, C.E.; Cravatt, B.F.; Fenselau, C.; Garcia, B.A.; et al. How Many Human Proteoforms Are There? Nat Chem Biol 2018, 14, 206–214. [Google Scholar] [CrossRef]
- Marx, V. Inside the Chase after Those Elusive Proteoforms. Nat. Methods 2024, 1–6. [Google Scholar] [CrossRef] [PubMed]
- Bludau, I.; Aebersold, R. Proteomic and Interactomic Insights into the Molecular Basis of Cell Functional Diversity. Nat. Rev. Mol. Cell Biol. 2020, 21, 327–340. [Google Scholar] [CrossRef]
- Cobley, J.N.; Chatzinikolaou, P.N.; Schmidt, C.A. The Nonlinear Cysteine Redox Dynamics in the I-Space: A Proteoform-Centric Theory of Redox Regulation. Redox Biol. 2025, 103523. [Google Scholar] [CrossRef] [PubMed]
- Hansen, R.E.; Roth, D.; Winther, J.R. Quantifying the Global Cellular Thiol–Disulfide Status. Proc National Acad Sci 2009, 106, 422–427. [Google Scholar] [CrossRef]
- Cobley, J.N.; Noble, A.; Guille, M. Cleland Immunoblotting Unmasks Unexpected Cysteine Redox Proteoforms. [CrossRef]
- Melani, R.D.; Gerbasi, V.R.; Anderson, L.C.; Sikora, J.W.; Toby, T.K.; Hutton, J.E.; Butcher, D.S.; Negrão, F.; Seckler, H.S.; Srzentić, K.; et al. The Blood Proteoform Atlas: A Reference Map of Proteoforms in Human Hematopoietic Cells. Science 2022, 375, 411–418. [Google Scholar] [CrossRef] [PubMed]
- Smith, L.M.; Agar, J.N.; Chamot-Rooke, J.; Danis, P.O.; Ge, Y.; Loo, J.A.; Paša-Tolić, L.; Tsybin, Y.O.; Kelleher, N.L.; Proteomics, T.C. for T.-D. The Human Proteoform Project: Defining the Human Proteome. Sci Adv 2021, 7, eabk0734. [Google Scholar] [CrossRef]
- Roberts, D.S.; Loo, J.A.; Tsybin, Y.O.; Liu, X.; Wu, S.; Chamot-Rooke, J.; Agar, J.N.; Paša-Tolić, L.; Smith, L.M.; Ge, Y. Top-down Proteomics. Nat. Rev. Methods Prim. 2024, 4, 38. [Google Scholar] [CrossRef]
- Burnum-Johnson, K.E.; Conrads, T.P.; Drake, R.R.; Herr, A.E.; Iyengar, R.; Kelly, R.T.; Lundberg, E.; MacCoss, M.J.; Naba, A.; Nolan, G.P.; et al. New Views of Old Proteins: Clarifying the Enigmatic Proteome. Mol Cell Proteomics 2022, 21, 100254. [Google Scholar] [CrossRef]
- Su, P.; Hollas, M.A.R.; Pla, I.; Rubakhin, S.; Butun, F.A.; Greer, J.B.; Early, B.P.; Fellers, R.T.; Caldwell, M.A.; Sweedler, J.V.; et al. Proteoform Profiling of Endogenous Single Cells from Rat Hippocampus at Scale. Nat. Biotechnol. 2025, 1–5. [Google Scholar] [CrossRef]
- Plubell, D.L.; Käll, L.; Webb-Robertson, B.-J.; Bramer, L.M.; Ives, A.; Kelleher, N.L.; Smith, L.M.; Montine, T.J.; Wu, C.C.; MacCoss, M.J. Putting Humpty Dumpty Back Together Again: What Does Protein Quantification Mean in Bottom-Up Proteomics? J. Proteome Res. 2022, 21, 891–898. [Google Scholar] [CrossRef]
- Pace, P.E.; Fu, L.; Hampton, M.B.; Winterbourn, C.C. Redox Proteomic Analysis of H2O2 -Treated Jurkat Cells and Effects of Bicarbonate and Knockout of Peroxiredoxins 1 and 2. Free Radic. Biol. Med. 2025, 227, 221–232. [Google Scholar] [CrossRef] [PubMed]
- Ivancevic, V.G.; Ivancevic, T.T. Ricci Flow and Nonlinear Reaction–Diffusion Systems in Biology, Chemistry, and Physics. Nonlinear Dyn. 2011, 65, 35–54. [Google Scholar] [CrossRef]
- Heppner, D.E.; Dustin, C.M.; Liao, C.; Hristova, M.; Veith, C.; Little, A.C.; Ahlers, B.A.; White, S.L.; Deng, B.; Lam, Y.-W.; et al. Direct Cysteine Sulfenylation Drives Activation of the Src Kinase. Nat Commun 2018, 9, 4522. [Google Scholar] [CrossRef] [PubMed]
- Wani, R.; Qian, J.; Yin, L.; Bechtold, E.; King, S.B.; Poole, L.B.; Paek, E.; Tsang, A.W.; Furdui, C.M. Isoform-Specific Regulation of Akt by PDGF-Induced Reactive Oxygen Species. Proc National Acad Sci 2011, 108, 10550–10555. [Google Scholar] [CrossRef]
- Su, Z.; Burchfield, J.G.; Yang, P.; Humphrey, S.J.; Yang, G.; Francis, D.; Yasmin, S.; Shin, S.-Y.; Norris, D.M.; Kearney, A.L.; et al. Global Redox Proteome and Phosphoproteome Analysis Reveals Redox Switch in Akt. Nat Commun 2019, 10, 5486. [Google Scholar] [CrossRef]
- Zhang, J.; Ali, M.Y.; Chong, H.B.; Tien, P.-C.; Woods, J.; Noble, C.; Vornbäumen, T.; Ordulu, Z.; Possemato, A.P.; Harry, S.; et al. Oxidation of Retromer Complex Controls Mitochondrial Translation. Nature 2025, 1–11. [Google Scholar] [CrossRef]
- Huang, J.; Co, H.K.; Lee, Y.; Wu, C.; Chen, S. Multistability Maintains Redox Homeostasis in Human Cells. Mol. Syst. Biol. 2021, 17, e10480. [Google Scholar] [CrossRef]
- Feinstein, A. A New Basic Theorem of Information Theory. Trans. IRE Prof. Group Inf. Theory 1954, 4, 2–22. [Google Scholar] [CrossRef]
- Nunn, A.V.W.; Guy, G.W.; Bell, J.D. The Quantum Mitochondrion and Optimal Health. Biochem. Soc. Trans. 2016, 44, 1101–1110. [Google Scholar] [CrossRef] [PubMed]
- Waltermann, C.; Klipp, E. Information Theory Based Approaches to Cellular Signaling. Biochim. Biophys. Acta (BBA) - Gen. Subj. 2011, 1810, 924–932. [Google Scholar] [CrossRef]
- Lu, Y.R.; Tian, X.; Sinclair, D.A. The Information Theory of Aging. Nat. Aging 2023, 3, 1486–1499. [Google Scholar] [CrossRef] [PubMed]
- Malakoff, D. Bayes Offers a “New” Way to Make Sense of Numbers. Science 1999, 286, 1460–1464. [Google Scholar] [CrossRef]
- Crutchfield, J.P.; Young, K. Inferring Statistical Complexity. Phys. Rev. Lett. 1989, 63, 105–108. [Google Scholar] [CrossRef] [PubMed]
- Lorenz, E.N. Deterministic Nonperiodic Flow. J. Atmos. Sci. 1963, 20, 130–141. [Google Scholar] [CrossRef]
- Gleick, J. Chaos: Making the New Science; Penguin Books, 2008; ISBN 9780143113454.
- Lorenz, E.N. Predictability: Does the Flap of a Butterfly’s Wings in Brazil Set off a Tornado in Texas. In Proceedings of the merican Association for the Advancement of Science; Washington DC; 1972. [Google Scholar]
- Feigenbaum, M.J. Quantitative Universality for a Class of Nonlinear Transformations. J. Stat. Phys. 1978, 19, 25–52. [Google Scholar] [CrossRef]
- Mandelbrot, B.B. Fractals in Physics: Squig Clusters, Diffusions, Fractal Measures, and the Unicity of Fractal Dimensionality. J. Stat. Phys. 1984, 34, 895–930. [Google Scholar] [CrossRef]
- Mandelbrot, B.B. Fractal Geometry: What Is It, and What Does It Do? Proc. R. Soc. Lond. A Math. Phys. Sci. 1989, 423, 3–16. [Google Scholar] [CrossRef]
- Gutteridge, J.M.C.; Halliwell, B. Mini-Review: Oxidative Stress, Redox Stress or Redox Success? Biochem Bioph Res Co 2018, 502, 183–186. [Google Scholar] [CrossRef]
- Halliwell, B. Biochemistry of Oxidative Stress. Biochemical Society Transactions 2007. [Google Scholar] [CrossRef] [PubMed]
- Paulsen, C.E.; Truong, T.H.; Garcia, F.J.; Homann, A.; Gupta, V.; Leonard, S.E.; Carroll, K.S. Peroxide-Dependent Sulfenylation of the EGFR Catalytic Site Enhances Kinase Activity. Nat Chem Biol 2012, 8, 57–64. [Google Scholar] [CrossRef]
- Go, Y.-M.; Chandler, J.D.; Jones, D.P. The Cysteine Proteome. Free Radical Bio Med 2015, 84, 227–245. [Google Scholar] [CrossRef]
- Go, Y.-M.; Roede, J.R.; Walker, D.I.; Duong, D.M.; Seyfried, N.T.; Orr, M.; Liang, Y.; Pennell, K.D.; Jones, D.P. Selective Targeting of the Cysteine Proteome by Thioredoxin and Glutathione Redox Systems*. Mol Cell Proteomics 2013, 12, 3285–3296. [Google Scholar] [CrossRef]
- Moan, N.L.; Clement, G.; Maout, S.L.; Tacnet, F.; Toledano, M.B. The Saccharomyces Cerevisiae Proteome of Oxidized Protein Thiols CONTRASTED FUNCTIONS FOR THE THIOREDOXIN AND GLUTATHIONE PATHWAYS*. J Biol Chem 2006, 281, 10420–10430. [Google Scholar] [CrossRef]
- Reest, J. van der; Lilla, S.; Zheng, L.; Zanivan, S.; Gottlieb, E. Proteome-Wide Analysis of Cysteine Oxidation Reveals Metabolic Sensitivity to Redox Stress. Nat Commun 2018, 9, 1581. [Google Scholar] [CrossRef]
- Cobley, J.N.; Close, G.L.; Bailey, D.M.; Davison, G.W. Exercise Redox Biochemistry: Conceptual, Methodological and Technical Recommendations. Redox Biol 2017, 12, 540–548. [Google Scholar] [CrossRef]
- Cobley, J.N. Oxidative Stress. 2020, 447–462. [CrossRef]
- Cobley, J.N.; Davison, G.W. Oxidative Eustress in Exercise Physiology. 2022, 11–22. [CrossRef]
- Cobley, James.N.; Davison, G.W. Oxidative Eustress in Exercise Physiology; CRC Press, 2022; ISBN 9781003051619.
- Cobley, J.N.; Margaritelis, N.V.; Morton, J.P.; Close, G.L.; Nikolaidis, M.G.; Malone, J.K. The Basic Chemistry of Exercise-Induced DNA Oxidation: Oxidative Damage, Redox Signaling, and Their Interplay. Front Physiol 2015, 6, 182. [Google Scholar] [CrossRef] [PubMed]
- Nikolaidis, M.G.; Margaritelis, N.V. Free Radicals and Antioxidants: Appealing to Magic. Trends Endocrinol. Metab. 2023. [Google Scholar] [CrossRef] [PubMed]
- Nikolaidis, M.; Margaritelis, N.; Matsakas, A. Quantitative Redox Biology of Exercise. Int. J. Sports Med. 2020, 41, 633–645. [Google Scholar] [CrossRef]
- Margaritelis, N.V.; Chatzinikolaou, P.N.; Chatzinikolaou, A.N.; Paschalis, V.; Theodorou, A.A.; Vrabas, I.S.; Kyparos, A.; Nikolaidis, M.G. The Redox Signal: A Physiological Perspective. IUBMB Life 2022, 74, 29–40. [Google Scholar] [CrossRef] [PubMed]
- Margaritelis, N.V.; Cobley, J.N.; Nastos, G.G.; Papanikolaou, K.; Bailey, S.J.; Kritsiligkou, P.; Nikolaidis, M.G. “Unlocking Athletic Potential: Exploring Exercise Physiology from Mechanisms to Performance”: Evidence-Based Sports Supplements: A Redox Analysis. Free Radic. Biol. Med. 2024, 224, 62–77. [Google Scholar] [CrossRef]
- Ursini, F.; Maiorino, M.; Forman, H.J. Redox Homeostasis: The Golden Mean of Healthy Living. Redox Biol 2016, 8, 205–215. [Google Scholar] [CrossRef] [PubMed]
- Marinho, H.S.; Real, C.; Cyrne, L.; Soares, H.; Antunes, F. Hydrogen Peroxide Sensing, Signaling and Regulation of Transcription Factors. Redox Biol 2014, 2, 535–562. [Google Scholar] [CrossRef]
- Antunes, F.; Brito, P.M. Quantitative Biology of Hydrogen Peroxide Signaling. Redox Biol 2017, 13, 1–7. [Google Scholar] [CrossRef]
- Meng, J.; Lv, Z.; Wang, Y.; Chen, C. Identification of the Redox-Stress Signaling Threshold (RST): Increased RST Helps to Delay Aging in C. Elegans. Free Radical Bio Med 2021, 178, 54–58. [Google Scholar] [CrossRef]
- Sies, H.; Berndt, C.; Jones, D.P. Oxidative Stress. Annu Rev Biochem 2016, 86, 1–34. [Google Scholar] [CrossRef]
- Sies, H. Oxidative Stress: A Concept in Redox Biology and Medicine. Redox Biol 2015, 4, 180–183. [Google Scholar] [CrossRef]
- Sies, H. Oxidative Stress: Concept and Some Practical Aspects. Antioxidants 2020, 9, 852. [Google Scholar] [CrossRef]
- Lloyd, D.; Aon, M.A.; Cortassa, S. Why Homeodynamics, Not Homeostasis? Sci. World J. 2001, 1, 133–145. [Google Scholar] [CrossRef] [PubMed]
- Forman, H.J.; Zhang, H. Targeting Oxidative Stress in Disease: Promise and Limitations of Antioxidant Therapy. Nat Rev Drug Discov 2021, 1–21. [Google Scholar] [CrossRef]
- Robb, E.L.; Gawel, J.M.; Aksentijević, D.; Cochemé, H.M.; Stewart, T.S.; Shchepinova, M.M.; Qiang, H.; Prime, T.A.; Bright, T.P.; James, A.M.; et al. Selective Superoxide Generation within Mitochondria by the Targeted Redox Cycler MitoParaquat. Free Radical Bio Med 2015, 89, 883–894. [Google Scholar] [CrossRef]
- Booty, L.M.; Gawel, J.M.; Cvetko, F.; Caldwell, S.T.; Hall, A.R.; Mulvey, J.F.; James, A.M.; Hinchy, E.C.; Prime, T.A.; Arndt, S.; et al. Selective Disruption of Mitochondrial Thiol Redox State in Cells and In Vivo. Cell Chem Biol 2019, 26, 449–461.e8. [Google Scholar] [CrossRef] [PubMed]
- Sidlauskaite, E.; Gibson, J.W.; Megson, I.L.; Whitfield, P.D.; Tovmasyan, A.; Batinic-Haberle, I.; Murphy, M.P.; Moult, P.R.; Cobley, J.N. Mitochondrial ROS Cause Motor Deficits Induced by Synaptic Inactivity: Implications for Synapse Pruning. Redox Biol 2018, 16, 344–351. [Google Scholar] [CrossRef]
- Murphy, M.P. How Mitochondria Produce Reactive Oxygen Species. Biochem J 2009, 417, 1–13. [Google Scholar] [CrossRef]
- Cho, C.-S.; Yoon, H.J.; Kim, J.Y.; Woo, H.A.; Rhee, S.G. Circadian Rhythm of Hyperoxidized Peroxiredoxin II Is Determined by Hemoglobin Autoxidation and the 20S Proteasome in Red Blood Cells. Proc National Acad Sci 2014, 111, 12043–12048. [Google Scholar] [CrossRef]
- O’Neill, J.S.; Ooijen, G. van; Dixon, L.E.; Troein, C.; Corellou, F.; Bouget, F.-Y.; Reddy, A.B.; Millar, A.J. Circadian Rhythms Persist without Transcription in a Eukaryote. Nature 2011, 469, 554–558. [Google Scholar] [CrossRef]
- Pei, J.-F.; Li, X.-K.; Li, W.-Q.; Gao, Q.; Zhang, Y.; Wang, X.-M.; Fu, J.-Q.; Cui, S.-S.; Qu, J.-H.; Zhao, X.; et al. Diurnal Oscillations of Endogenous H2O2 Sustained by P66Shc Regulate Circadian Clocks. Nat Cell Biol 2019, 21, 1553–1564. [Google Scholar] [CrossRef]
- Amponsah, P.S.; Yahya, G.; Zimmermann, J.; Mai, M.; Mergel, S.; Mühlhaus, T.; Storchova, Z.; Morgan, B. Peroxiredoxins Couple Metabolism and Cell Division in an Ultradian Cycle. Nat Chem Biol 2021, 17, 477–484. [Google Scholar] [CrossRef] [PubMed]
- Bazopoulou, D.; Knoefler, D.; Zheng, Y.; Ulrich, K.; Oleson, B.J.; Xie, L.; Kim, M.; Kaufmann, A.; Lee, Y.-T.; Dou, Y.; et al. Developmental ROS Individualizes Organismal Stress Resistance and Lifespan. Nature 2019, 576, 301–305. [Google Scholar] [CrossRef] [PubMed]
- Cobley, J.N. Synapse Pruning: Mitochondrial ROS with Their Hands on the Shears. Bioessays 2018, 40, 1800031. [Google Scholar] [CrossRef]
- Foyer, C.H.; Wilson, M.H.; Wright, M.H. Redox Regulation of Cell Proliferation: Bioinformatics and Redox Proteomics Approaches to Identify Redox-Sensitive Cell Cycle Regulators. Free Radical Bio Med 2018, 122, 137–149. [Google Scholar] [CrossRef] [PubMed]
- Henau, S.D.; Pagès-Gallego, M.; Pannekoek, W.-J.; Dansen, T.B. Mitochondria-Derived H2O2 Promotes Symmetry Breaking of the C. Elegans Zygote. Dev Cell 2020, 53, 263–271.e6. [Google Scholar] [CrossRef]
- Cobley, J.; Noble, A.; Bessell, R.; Guille, M.; Husi, H. Reversible Thiol Oxidation Inhibits the Mitochondrial ATP Synthase in Xenopus Laevis Oocytes. Antioxidants 2020, 9, 215. [Google Scholar] [CrossRef] [PubMed]
- LYAPUNOV, A.M. The General Problem of the Stability of Motion. Int. J. Control 1992, 55, 531–534. [Google Scholar] [CrossRef]
- Wolf, A.; Swift, J.B.; Swinney, H.L.; Vastano, J.A. Determining Lyapunov Exponents from a Time Series. Phys. D: Nonlinear Phenom. 1985, 16, 285–317. [Google Scholar] [CrossRef]
- Eckmann, J.-P.; Ruelle, D. Ergodic Theory of Chaos and Strange Attractors. Rev. Mod. Phys. 1985, 57, 617–656. [Google Scholar] [CrossRef]
- Pincus, S.M. Approximate Entropy as a Measure of System Complexity. Proc. Natl. Acad. Sci. 1991, 88, 2297–2301. [Google Scholar] [CrossRef]
- Grassberger, P.; Procaccia, I. Characterization of Strange Attractors. Phys. Rev. Lett. 1982, 50, 346–349. [Google Scholar] [CrossRef]
- Marwan, N.; Romano, M.C.; Thiel, M.; Kurths, J. Recurrence Plots for the Analysis of Complex Systems. Phys. Rep. 2007, 438, 237–329. [Google Scholar] [CrossRef]
- Kirova, D.G.; Judasova, K.; Vorhauser, J.; Zerjatke, T.; Leung, J.K.; Glauche, I.; Mansfeld, J. A ROS-Dependent Mechanism Promotes CDK2 Phosphorylation to Drive Progression through S Phase. Dev Cell 2022, 57, 1712–1727. [Google Scholar] [CrossRef]
- Vorhauser, J.; Roumeliotis, T.I.; Leung, J.K.; Coupe, D.; Yu, L.; Böhlig, K.; Nadler, A.; Choudhary, J.S.; Mansfeld, J. Cell Cycle-Dependent S-Sulfenyl Proteomics Uncover a Redox Switch in P21-CDK Feedback Governing the Proliferation-Senescence Decision. bioRxiv, 2024; 2024.09.14.613007. [Google Scholar] [CrossRef]
- Henríquez-Olguín, C.; Gallero, S.; Reddy, A.; Persson, K.W.; Schlabs, F.L.; Voldstedlund, C.T.; Valentinaviciute, G.; Meneses-Valdés, R.; Sigvardsen, C.M.; Kiens, B.; et al. Revisiting Insulin-Stimulated Hydrogen Peroxide Dynamics Reveals a Cytosolic Reductive Shift in Skeletal Muscle. Redox Biol. 2025, 82, 103607. [Google Scholar] [CrossRef] [PubMed]
- Winterbourn, C.C. Reconciling the Chemistry and Biology of Reactive Oxygen Species. Nat Chem Biol 2008, 4, 278–286. [Google Scholar] [CrossRef]
- Winterbourn, C.C.; Peskin, A.V.; Kleffmann, T.; Radi, R.; Pace, P.E. Carbon Dioxide/Bicarbonate Is Required for Sensitive Inactivation of Mammalian Glyceraldehyde-3-Phosphate Dehydrogenase by Hydrogen Peroxide. Proc National Acad Sci 2023, 120, e2221047120. [Google Scholar] [CrossRef]
- Dickinson, B.C.; Chang, C.J. Chemistry and Biology of Reactive Oxygen Species in Signaling or Stress Responses. Nat Chem Biol 2011, 7, 504–511. [Google Scholar] [CrossRef]
- Prigogine, I. Dissipative Structures, Dynamics and Entropy. Int. J. Quantum Chem. 1975, 9, 443–456. [Google Scholar] [CrossRef]
- Manford, A.G.; Rodríguez-Pérez, F.; Shih, K.Y.; Shi, Z.; Berdan, C.A.; Choe, M.; Titov, D.V.; Nomura, D.K.; Rape, M. A Cellular Mechanism to Detect and Alleviate Reductive Stress. Cell 2020, 183, 46–61.e21. [Google Scholar] [CrossRef]
- Noguchi, N.; Saito, Y.; Niki, E. Actions of Thiols, Persulfides, and Polysulfides as Free Radical Scavenging Antioxidants. Antioxidants Redox Signal 2022, 0. [Google Scholar] [CrossRef] [PubMed]
- Byrne, D.P.; Shrestha, S.; Galler, M.; Cao, M.; Daly, L.A.; Campbell, A.E.; Eyers, C.E.; Veal, E.A.; Kannan, N.; Eyers, P.A. Aurora A Regulation by Reversible Cysteine Oxidation Reveals Evolutionarily Conserved Redox Control of Ser/Thr Protein Kinase Activity. Sci Signal 2020, 13, eaax2713. [Google Scholar] [CrossRef] [PubMed]
- Kalinichenko, A.L.; Jappy, D.; Solius, G.M.; Maltsev, D.I.; Bogdanova, Y.A.; Mukhametshina, L.F.; Sokolov, R.A.; Moshchenko, A.A.; Shaydurov, V.A.; Rozov, A.V.; et al. Chemogenetic Emulation of Intraneuronal Oxidative Stress Affects Synaptic Plasticity. Redox Biol 2023, 60, 102604. [Google Scholar] [CrossRef]
- Akter, S.; Fu, L.; Jung, Y.; Conte, M.L.; Lawson, J.R.; Lowther, W.T.; Sun, R.; Liu, K.; Yang, J.; Carroll, K.S. Chemical Proteomics Reveals New Targets of Cysteine Sulfinic Acid Reductase. Nat Chem Biol 2018, 14, 995–1004. [Google Scholar] [CrossRef] [PubMed]
- Montero, L.; Okraine, Y.V.; Orlowski, J.; Matzkin, S.; Scarponi, I.; Miranda, M.V.; Nusblat, A.; Gottifredi, V.; Alonso, L.G. Conserved Cysteine-Switches for Redox Sensing Operate in the Cyclin-Dependent Kinase Inhibitor P21(CIP/KIP) Protein Family. Free Radic. Biol. Med. 2024, 224, 494–505. [Google Scholar] [CrossRef] [PubMed]
- Mills, E.L.; Harmon, C.; Jedrychowski, M.P.; Xiao, H.; Gruszczyk, A.V.; Bradshaw, G.A.; Tran, N.; Garrity, R.; Laznik-Bogoslavski, D.; Szpyt, J.; et al. Cysteine 253 of UCP1 Regulates Energy Expenditure and Sex-Dependent Adipose Tissue Inflammation. Cell Metab 2021. [Google Scholar] [CrossRef]
- Ruiz, D.G.; Sandoval-Perez, A.; Rangarajan, A.V.; Gunderson, E.L.; Jacobson, M.P. Cysteine Oxidation in Proteins: Structure, Biophysics, and Simulation. Biochemistry 2022, 61, 2165–2176. [Google Scholar] [CrossRef] [PubMed]
- Göbl, C.; Morris, V.K.; Dam, L. van; Visscher, M.; Polderman, P.E.; Hartlmüller, C.; Ruiter, H. de; Hora, M.; Liesinger, L.; Birner-Gruenberger, R.; et al. Cysteine Oxidation Triggers Amyloid Fibril Formation of the Tumor Suppressor P16INK4A. Redox Biol 2020, 28, 101316. [Google Scholar] [CrossRef]
- Burgoyne, J.R.; Madhani, M.; Cuello, F.; Charles, R.L.; Brennan, J.P.; Schröder, E.; Browning, D.D.; Eaton, P. Cysteine Redox Sensor in PKGIa Enables Oxidant-Induced Activation. Science 2007, 317, 1393–1397. [Google Scholar] [CrossRef]
- Bodnar, Y.; Lillig, C.H. Cysteinyl and Methionyl Redox Switches: Structural Prerequisites and Consequences. Redox Biol. 2023, 65, 102832. [Google Scholar] [CrossRef]
- Gao, J.; Newberry, M. Fractal Scaling and the Aesthetics of Trees. arXiv 2024. [Google Scholar] [CrossRef]
- Bannink, T.; Buhrman, H. Quantum Pascal’s Triangle and Sierpinski’s Carpet. arXiv 2017. [Google Scholar] [CrossRef]
- Harman, D. Aging: A Theory Based on Free Radical and Radiation Chemistry. J Gerontology 1956, 11, 298–300. [Google Scholar] [CrossRef]
- Harman, D. Origin and Evolution of the Free Radical Theory of Aging: A Brief Personal History, 1954–2009. Biogerontology 2009, 10, 773. [Google Scholar] [CrossRef]
- Meo, S.D.; Venditti, P. Evolution of the Knowledge of Free Radicals and Other Oxidants. Oxidative Med. Cell. Longev. 2020, 2020, 9829176. [Google Scholar] [CrossRef]
- Gladyshev, V.N. The Free Radical Theory of Aging Is Dead. Long Live the Damage Theory! Antioxid. Redox Signal. 2014, 20, 727–731. [Google Scholar] [CrossRef]
- Finkel, T.; Holbrook, N.J. Oxidants, Oxidative Stress and the Biology of Ageing. Nature 2000, 408, 239–247. [Google Scholar] [CrossRef]
- Cobley, J.; Chatzinikolaou, P.N.; Schmidt, C.A. Non-Linear Cysteine Redox Proteoform Dynamics in the I-Space: A Novel Theory of Redox Regulation. 2024. [CrossRef]
- Gutteridge, J.M.C.; Halliwell, B. Antioxidants: Molecules, Medicines, and Myths. Biochem Bioph Res Co 2010, 393, 561–564. [Google Scholar] [CrossRef]
- Halliwell, B. Reflections of an Aging Free Radical. Free Radic Biology Medicine 2020, 161, 234–245. [Google Scholar] [CrossRef] [PubMed]
- Murphy, M.P. Antioxidants as Therapies: Can We Improve on Nature? Free Radical Bio Med 2014, 66, 20–23. [Google Scholar] [CrossRef] [PubMed]
- Frijhoff, J.; Winyard, P.G.; Zarkovic, N.; Davies, S.S.; Stocker, R.; Cheng, D.; Knight, A.R.; Taylor, E.L.; Oettrich, J.; Ruskovska, T.; et al. Clinical Relevance of Biomarkers of Oxidative Stress. Antioxid. Redox Signal. 2015, 23, 1144–1170. [Google Scholar] [CrossRef] [PubMed]
- Williamson, J.; Hughes, C.M.; Cobley, J.N.; Davison, G.W. The Mitochondria-Targeted Antioxidant MitoQ, Attenuates Exercise-Induced Mitochondrial DNA Damage. Redox Biol 2020, 36, 101673. [Google Scholar] [CrossRef]
- Cobley, J.N.; McHardy, H.; Morton, J.P.; Nikolaidis, M.G.; Close, G.L. Influence of Vitamin C and Vitamin E on Redox Signaling: Implications for Exercise Adaptations. Free Radical Bio Med 2015, 84, 65–76. [Google Scholar] [CrossRef]
- Halliwell, B. Reactive Oxygen Species and the Central Nervous System. J. Neurochem. 1992, 59, 1609–1623. [Google Scholar] [CrossRef]
- Halliwell, B. Oxidative Stress and Neurodegeneration: Where Are We Now? J. Neurochem. 2006, 97, 1634–1658. [Google Scholar] [CrossRef]
- Vaccaro, A.; Dor, Y.K.; Nambara, K.; Pollina, E.A.; Lin, C.; Greenberg, M.E.; Rogulja, D. Sleep Loss Can Cause Death through Accumulation of Reactive Oxygen Species in the Gut. Cell 2020, 181, 1307–1328.e15. [Google Scholar] [CrossRef]
- Rorsman, H.O.; Müller, M.A.; Liu, P.Z.; Sanchez, L.G.; Kempf, A.; Gerbig, S.; Spengler, B.; Miesenböck, G. Sleep Pressure Accumulates in a Voltage-Gated Lipid Peroxidation Memory. Nature 2025, 641, 232–239. [Google Scholar] [CrossRef]
- Kempf, A.; Song, S.M.; Talbot, C.B.; Miesenböck, G. A Potassium Channel β-Subunit Couples Mitochondrial Electron Transport to Sleep. Nature 2019, 568, 230–234. [Google Scholar] [CrossRef]
- Cobley, J.N.; Noble, A.; Jimenez-Fernandez, E.; Moya, M.-T.V.; Guille, M.; Husi, H. Catalyst-Free Click PEGylation Reveals Substantial Mitochondrial ATP Synthase Sub-Unit Alpha Oxidation before and after Fertilisation. Redox Biol 2019, 26, 101258. [Google Scholar] [CrossRef]
- Tuncay, A.; Noble, A.; Guille, M.; Cobley, J.N. RedoxiFluor: A Microplate Technique to Quantify Target-Specific Protein Thiol Redox State in Relative Percentage and Molar Terms. Free Radical Bio Med 2022, 181, 118–129. [Google Scholar] [CrossRef] [PubMed]
- Tuncay, A.; Crabtree, D.R.; Muggeridge, D.J.; Husi, H.; Cobley, J.N. Performance Benchmarking Microplate-Immunoassays for Quantifying Target-Specific Cysteine Oxidation Reveals Their Potential for Understanding Redox-Regulation and Oxidative Stress. Free Radical Bio Med 2023, 204, 252–265. [Google Scholar] [CrossRef] [PubMed]
- Po, A.; Eyers, C.E. Top-Down Proteomics and the Challenges of True Proteoform Characterization. J. Proteome Res. 2023, 22, 3663–3675. [Google Scholar] [CrossRef]
- Cao, M.; Day, A.M.; Galler, M.; Latimer, H.R.; Byrne, D.P.; Foy, T.W.; Dwyer, E.; Bennett, E.; Palmer, J.; Morgan, B.A.; et al. A Peroxiredoxin-P38 MAPK Scaffold Increases MAPK Activity by MAP3K-Independent Mechanisms. Mol. Cell 2023, 83, 3140–3154.e7. [Google Scholar] [CrossRef] [PubMed]
- Donnelly, D.P.; Rawlins, C.M.; DeHart, C.J.; Fornelli, L.; Schachner, L.F.; Lin, Z.; Lippens, J.L.; Aluri, K.C.; Sarin, R.; Chen, B.; et al. Best Practices and Benchmarks for Intact Protein Analysis for Top-down Mass Spectrometry. Nat. Methods 2019, 16, 587–594. [Google Scholar] [CrossRef] [PubMed]
- Timp, W.; Timp, G. Beyond Mass Spectrometry, the next Step in Proteomics. Sci Adv 2020, 6, eaax8978. [Google Scholar] [CrossRef]
- Siuti, N.; Kelleher, N.L. Decoding Protein Modifications Using Top-down Mass Spectrometry. Nat. Methods 2007, 4, 817–821. [Google Scholar] [CrossRef]
- Tentori, A.M.; Yamauchi, K.A.; Herr, A.E. Detection of Isoforms Differing by a Single Charge Unit in Individual Cells. Angewandte Chemie Int Ed 2016, 55, 12431–12435. [Google Scholar] [CrossRef]
- Brown, K.A.; Melby, J.A.; Roberts, D.S.; Ge, Y. Top-down Proteomics: Challenges, Innovations, and Applications in Basic and Clinical Research. Expert Rev. Proteom. 2020, 17, 719–733. [Google Scholar] [CrossRef]
- Chen, B.; Brown, K.A.; Lin, Z.; Ge, Y. Top-Down Proteomics: Ready for Prime Time? Anal Chem 2018, 90, 110–127. [Google Scholar] [CrossRef]
- Ansong, C.; Wu, S.; Meng, D.; Liu, X.; Brewer, H.M.; Kaiser, B.L.D.; Nakayasu, E.S.; Cort, J.R.; Pevzner, P.; Smith, R.D.; et al. Top-down Proteomics Reveals a Unique Protein S-Thiolation Switch in Salmonella Typhimurium in Response to Infection-like Conditions. Proc National Acad Sci 2013, 110, 10153–10158. [Google Scholar] [CrossRef] [PubMed]
- Kelleher, N.L.; Lin, H.Y.; Valaskovic, G.A.; Aaserud, D.J.; Fridriksson, E.K.; McLafferty, F.W. Top Down versus Bottom Up Protein Characterization by Tandem High-Resolution Mass Spectrometry. J. Am. Chem. Soc. 1999, 121, 806–812. [Google Scholar] [CrossRef]
- Azzi, A. Oxidative Stress: What Is It? Can It Be Measured? Where Is It Located? Can It Be Good or Bad? Can It Be Prevented? Can It Be Cured? Antioxidants 2022, 11, 1431. [Google Scholar] [CrossRef] [PubMed]
- Cobley, J.N.; Bartlett, J.D.; Kayani, A.; Murray, S.W.; Louhelainen, J.; Donovan, T.; Waldron, S.; Gregson, W.; Burniston, J.G.; Morton, J.P.; et al. PGC-1α Transcriptional Response and Mitochondrial Adaptation to Acute Exercise Is Maintained in Skeletal Muscle of Sedentary Elderly Males. Biogerontology 2012, 13, 621–631. [Google Scholar] [CrossRef]
- Cobley, J.N.; Sakellariou, G.K.; Murray, S.; Waldron, S.; Gregson, W.; Burniston, J.G.; Morton, J.P.; Iwanejko, L.A.; Close, G.L. Lifelong Endurance Training Attenuates Age-Related Genotoxic Stress in Human Skeletal Muscle. Longev Heal 2013, 2, 11. [Google Scholar] [CrossRef]
- Ostrom, E.L.; Traustadóttir, T. Aerobic Exercise Training Partially Reverses the Impairment of Nrf2 Activation in Older Humans. Free Radic. Biol. Med. 2020, 160, 418–432. [Google Scholar] [CrossRef]
- Noble, A.; Guille, M.; Cobley, J.N. ALISA: A Microplate Assay to Measure Protein Thiol Redox State. Free Radical Bio Med 2021, 174, 272–280. [Google Scholar] [CrossRef] [PubMed]
- Muggeridge, D.J.; Crabtree, D.R.; Tuncay, A.; Megson, I.L.; Davison, G.; Cobley, J.N. Exercise Decreases PP2A-Specific Reversible Thiol Oxidation in Human Erythrocytes: Implications for Redox Biomarkers. Free Radical Bio Med 2022, 182, 73–78. [Google Scholar] [CrossRef] [PubMed]
- Kramer, P.A.; Duan, J.; Gaffrey, M.J.; Shukla, A.K.; Wang, L.; Bammler, T.K.; Qian, W.-J.; Marcinek, D.J. Fatiguing Contractions Increase Protein S-Glutathionylation Occupancy in Mouse Skeletal Muscle. Redox Biol. 2018, 17, 367–376. [Google Scholar] [CrossRef] [PubMed]
- Davies, K.J.A. Adaptive Homeostasis. Mol. Asp. Med. 2016, 49, 1–7. [Google Scholar] [CrossRef]
- Henriquez-Olguin, C.; Meneses-Valdes, R.; Jensen, T.E. Compartmentalized Muscle Redox Signals Controlling Exercise Metabolism – Current State, Future Challenges. Redox Biol 2020, 35, 101473. [Google Scholar] [CrossRef]
- Henríquez-Olguin, C.; Knudsen, J.R.; Raun, S.H.; Li, Z.; Dalbram, E.; Treebak, J.T.; Sylow, L.; Holmdahl, R.; Richter, E.A.; Jaimovich, E.; et al. Cytosolic ROS Production by NADPH Oxidase 2 Regulates Muscle Glucose Uptake during Exercise. Nat Commun 2019, 10, 4623. [Google Scholar] [CrossRef]
- Henriquez-Olguin, C.; Meneses-Valdes, R.; Kritsiligkou, P.; Fuentes-Lemus, E. From Workout to Molecular Switches: How Does Skeletal Muscle Produce, Sense, and Transduce Subcellular Redox Signals? Free Radic. Biol. Med. 2023, 209, 355–365. [Google Scholar] [CrossRef]
- Margaritelis, N.V. Personalized Redox Biology: Designs and Concepts. Free Radic. Biol. Med. 2023, 208, 112–125. [Google Scholar] [CrossRef]
- Xia, Q.; Casas-Martinez, J.C.; Zarzuela, E.; Muñoz, J.; Miranda-Vizuete, A.; Goljanek-Whysall, K.; McDonagh, B. Peroxiredoxin 2 Is Required for the Redox Mediated Adaptation to Exercise. Redox Biol 2023, 60, 102631. [Google Scholar] [CrossRef] [PubMed]
- Margaritelis, N.V.; Kyparos, A.; Paschalis, V.; Theodorou, A.A.; Panayiotou, G.; Zafeiridis, A.; Dipla, K.; Nikolaidis, M.G.; Vrabas, I.S. Reductive Stress after Exercise: The Issue of Redox Individuality. Redox Biol. 2014, 2, 520–528. [Google Scholar] [CrossRef]
- Goulev, Y.; Morlot, S.; Matifas, A.; Huang, B.; Molin, M.; Toledano, M.B.; Charvin, G. Nonlinear Feedback Drives Homeostatic Plasticity in H2O2 Stress Response. eLife 2017, 6, e23971. [Google Scholar] [CrossRef]
- Pillay, C.S.; Rohwer, J.M. Computational Models as Catalysts for Investigating Redoxin Systems. Essays Biochem. 2024. [Google Scholar] [CrossRef]
- Huang, B.K.; Sikes, H.D. Quantifying Intracellular Hydrogen Peroxide Perturbations in Terms of Concentration. Redox Biol 2014, 2, 955–962. [Google Scholar] [CrossRef]
- Ammar, C.; Schessner, J.P.; Willems, S.; Michaelis, A.C.; Mann, M. Accurate Label-Free Quantification by DirectLFQ to Compare Unlimited Numbers of Proteomes. Mol. Cell. Proteom. 2023, 22, 100581. [Google Scholar] [CrossRef]
- Picotti, P.; Aebersold, R. Selected Reaction Monitoring–Based Proteomics: Workflows, Potential, Pitfalls and Future Directions. Nat Methods 2012, 9, 555–566. [Google Scholar] [CrossRef]
- Burniston, J.G.; Kenyani, J.; Gray, D.; Guadagnin, E.; Jarman, I.H.; Cobley, J.N.; Cuthbertson, D.J.; Chen, Y.-W.; Wastling, J.M.; Lisboa, P.J.; et al. Conditional Independence Mapping of DIGE Data Reveals PDIA3 Protein Species as Key Nodes Associated with Muscle Aerobic Capacity. J Proteomics 2014, 106, 230–245. [Google Scholar] [CrossRef] [PubMed]
- Malik, Z.A.; Cobley, J.N.; Morton, J.P.; Close, G.L.; Edwards, B.J.; Koch, L.G.; Britton, S.L.; Burniston, J.G. Label-Free LC-MS Profiling of Skeletal Muscle Reveals Heart-Type Fatty Acid Binding Protein as a Candidate Biomarker of Aerobic Capacity. Proteomes 2013, 1, 290–308. [Google Scholar] [CrossRef] [PubMed]
- Cobley, J.N.; Malik, Z.Ab.; Morton, J.P.; Close, G.L.; Edwards, B.J.; Burniston, J.G. Age- and Activity-Related Differences in the Abundance of Myosin Essential and Regulatory Light Chains in Human Muscle. Proteomes 2016, 4, 15. [Google Scholar] [CrossRef] [PubMed]
- Burger, N.; Mittenbühler, M.J.; Xiao, H.; Shin, S.; Wei, S.M.; Henze, E.K.; Schindler, S.; Mehravar, S.; Wood, D.M.; Petrocelli, J.J.; et al. The Human Zinc-Binding Cysteine Proteome. Cell 2025, 188, 832–850.e27. [Google Scholar] [CrossRef]
- Backus, K.M.; Correia, B.E.; Lum, K.M.; Forli, S.; Horning, B.D.; González-Páez, G.E.; Chatterjee, S.; Lanning, B.R.; Teijaro, J.R.; Olson, A.J.; et al. Proteome-Wide Covalent Ligand Discovery in Native Biological Systems. Nature 2016, 534, 570–574. [Google Scholar] [CrossRef] [PubMed]
- Weerapana, E.; Wang, C.; Simon, G.M.; Richter, F.; Khare, S.; Dillon, M.B.D.; Bachovchin, D.A.; Mowen, K.; Baker, D.; Cravatt, B.F. Quantitative Reactivity Profiling Predicts Functional Cysteines in Proteomes. Nature 2010, 468, 790–795. [Google Scholar] [CrossRef] [PubMed]
- Cravatt, B.F.; Simon, G.M.; III, J.R.Y. The Biological Impact of Mass-Spectrometry-Based Proteomics. Nature 2007, 450, 991–1000. [Google Scholar] [CrossRef] [PubMed]
- Kemper, E.K.; Zhang, Y.; Dix, M.M.; Cravatt, B.F. Global Profiling of Phosphorylation-Dependent Changes in Cysteine Reactivity. Nat Methods 2022, 19, 341–352. [Google Scholar] [CrossRef]
- Suskiewicz, M.J. The Logic of Protein Post-translational Modifications (PTMs): Chemistry, Mechanisms and Evolution of Protein Regulation through Covalent Attachments. BioEssays 2024, 46, e2300178. [Google Scholar] [CrossRef]
- Lancaster, N.M.; Sinitcyn, P.; Forny, P.; Peters-Clarke, T.M.; Fecher, C.; Smith, A.J.; Shishkova, E.; Arrey, T.N.; Pashkova, A.; Robinson, M.L.; et al. Fast and Deep Phosphoproteome Analysis with the Orbitrap Astral Mass Spectrometer. Nat. Commun. 2024, 15, 7016. [Google Scholar] [CrossRef]
- Davies, M.J. Methionine Oxidation Products as Biomarkers of Oxidative Damage to Proteins and Modulators of Cellular Metabolism and Toxicity. Redox Biochem. Chem. 2025, 12, 100052. [Google Scholar] [CrossRef]
- Davies, M.J. Protein Oxidation and Peroxidation. Biochem J 2016, 473, 805–825. [Google Scholar] [CrossRef]
- He, D.; Feng, H.; Sundberg, B.; Yang, J.; Powers, J.; Christian, A.H.; Wilkinson, J.E.; Monnin, C.; Avizonis, D.; Thomas, C.J.; et al. Methionine Oxidation Activates Pyruvate Kinase M2 to Promote Pancreatic Cancer Metastasis. Mol Cell 2022, 82, 3045–3060.e11. [Google Scholar] [CrossRef]
- Lin, S.; Yang, X.; Jia, S.; Weeks, A.M.; Hornsby, M.; Lee, P.S.; Nichiporuk, R.V.; Iavarone, A.T.; Wells, J.A.; Toste, F.D.; et al. Redox-Based Reagents for Chemoselective Methionine Bioconjugation. Science 2017, 355, 597–602. [Google Scholar] [CrossRef]
- Bartesaghi, S.; Radi, R. Fundamentals on the Biochemistry of Peroxynitrite and Protein Tyrosine Nitration. Redox Biol. 2018, 14, 618–625. [Google Scholar] [CrossRef]
- Radi, R. Interplay of Carbon Dioxide and Peroxide Metabolism in Mammalian Cells. J Biol Chem 2022, 102358. [Google Scholar] [CrossRef] [PubMed]
- Radi, R. Oxygen Radicals, Nitric Oxide, and Peroxynitrite: Redox Pathways in Molecular Medicine. Proc National Acad Sci 2018, 115, 5839–5848. [Google Scholar] [CrossRef]
- Sultana, R.; Butterfield, D.A. Identification of the Oxidative Stress Proteome in the Brain. Free Radic. Biol. Med. 2011, 50, 487–494. [Google Scholar] [CrossRef]
- Butterfield, D.A.; Halliwell, B. Oxidative Stress, Dysfunctional Glucose Metabolism and Alzheimer Disease. Nat Rev Neurosci 2019, 20, 148–160. [Google Scholar] [CrossRef]
- Sultana, R.; Butterfield, D.A. Oxidative Modification of Brain Proteins in Alzheimer’s Disease: Perspective on Future Studies Based on Results of Redox Proteomics Studies. J. Alzheimer’s Dis. 2013, 33, S243–S251. [Google Scholar] [CrossRef]
- Bettinger, J.Q.; Simon, M.; Korotkov, A.; Welle, K.A.; Hryhorenko, J.R.; Seluanov, A.; Gorbunova, V.; Ghaemmaghami, S. Accurate Proteomewide Measurement of Methionine Oxidation in Aging Mouse Brains. J. Proteome Res. 2022, 21, 1495–1509. [Google Scholar] [CrossRef]
- Aledo, J.C.; Aledo, P. Susceptibility of Protein Methionine Oxidation in Response to Hydrogen Peroxide Treatment–Ex Vivo versus In Vitro: A Computational Insight. Antioxidants 2020, 9, 987. [Google Scholar] [CrossRef] [PubMed]
- Dai, C.; Pfeuffer, J.; Wang, H.; Zheng, P.; Käll, L.; Sachsenberg, T.; Demichev, V.; Bai, M.; Kohlbacher, O.; Perez-Riverol, Y. Quantms: A Cloud-Based Pipeline for Quantitative Proteomics Enables the Reanalysis of Public Proteomics Data. Nat. Methods 2024, 21, 1603–1607. [Google Scholar] [CrossRef] [PubMed]
Figure 1.
Per-Site Shannon Entropy in Mouse Brain, Young vs. Old (n = 8 183 sites). As generated by a script, the plot shows the distribution of per-site Shannon entropies (in bits) computed from five simulated replicates per cysteine site. Replicates were drawn from a normal distribution using each site’s reported mean oxidation percentage and SEM (σ = SEM·√5), then binned into 20 equal intervals across [0,100] to calculate entropy. To assess uncertainty, we bootstrapped the pooled entropy—flattening all simulated replicates across sites—and repeated the simulation 1000 ×, yielding robust estimates of the overall entropy for young vs. old brains. The clear upward shift in entropy for old mice indicates increased heterogeneity of cysteine oxidation states with age.
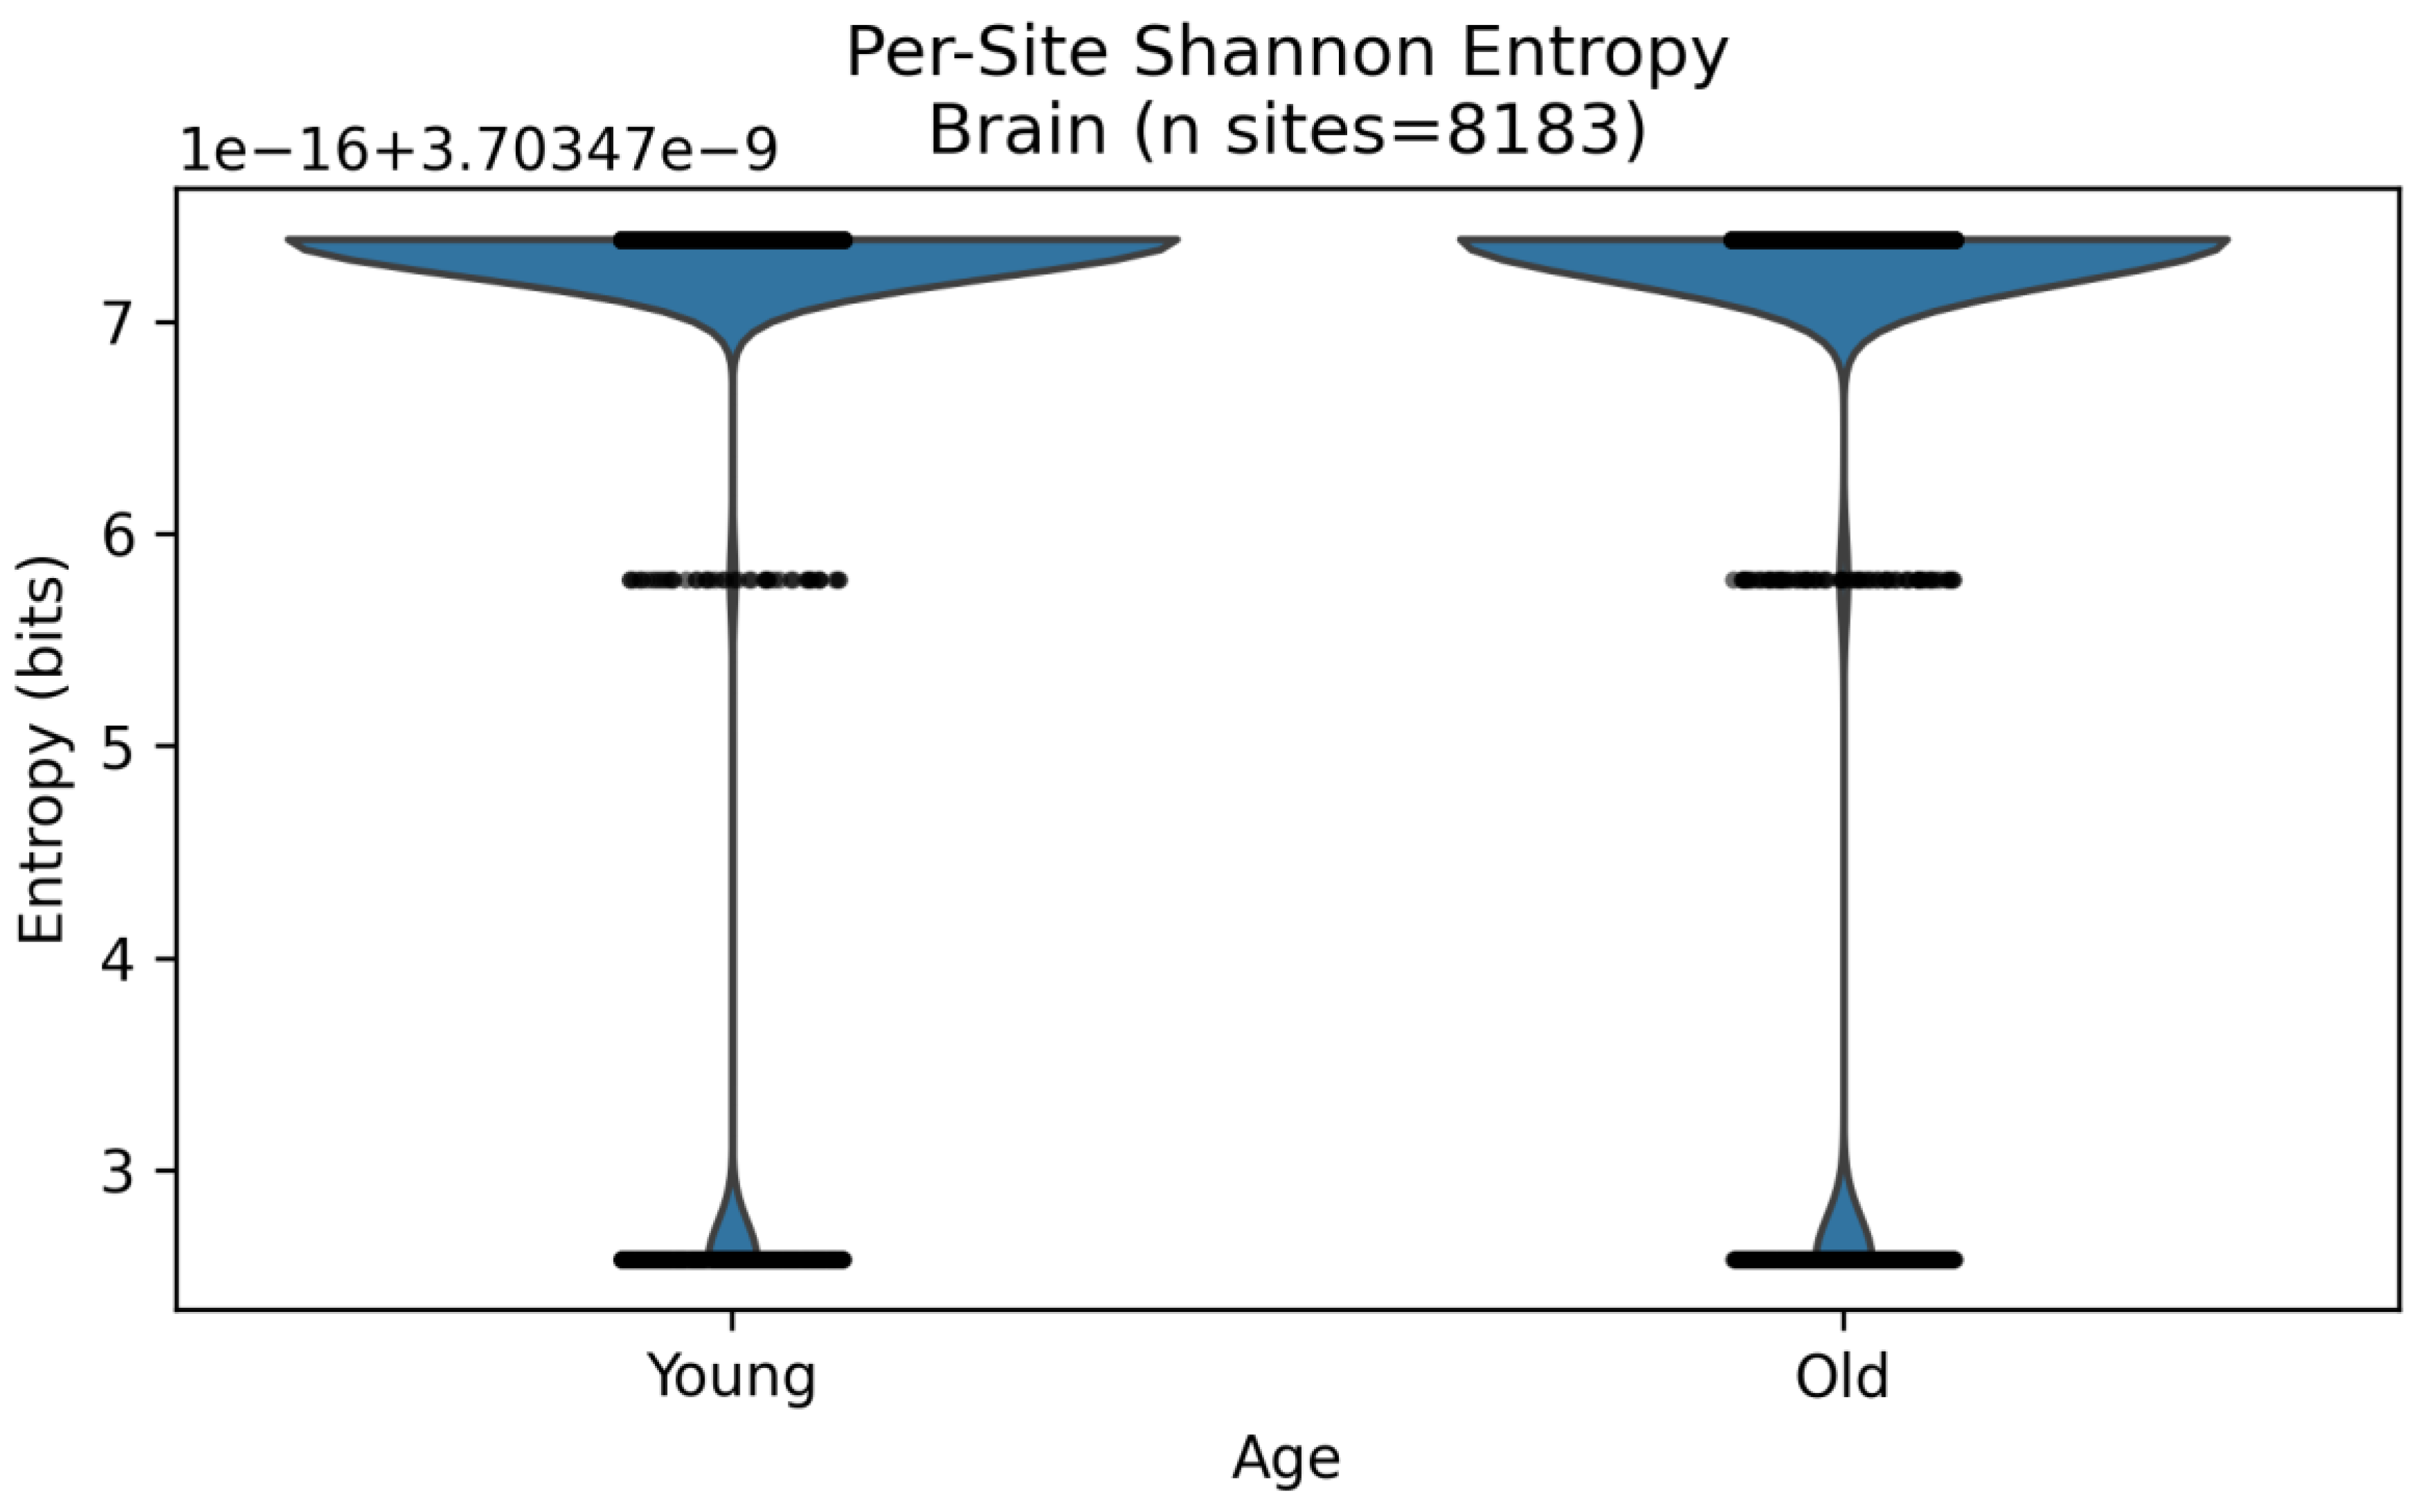
Figure 2.
Joint histogram of brain oxidation bins vs. age. As generated by a script, the heatmap shows counts of cysteine sites binned by mean oxidation percentage (20 bins across 0–100 %) on the x-axis and age group (Young, Old) on the y-axis. Despite a modest shift in average redox state (8.9 % → 8.1 %), the two marginal distributions overlap almost completely—each oxidation interval contains similar numbers of young and old site. Hence, their mutual information is near 0.
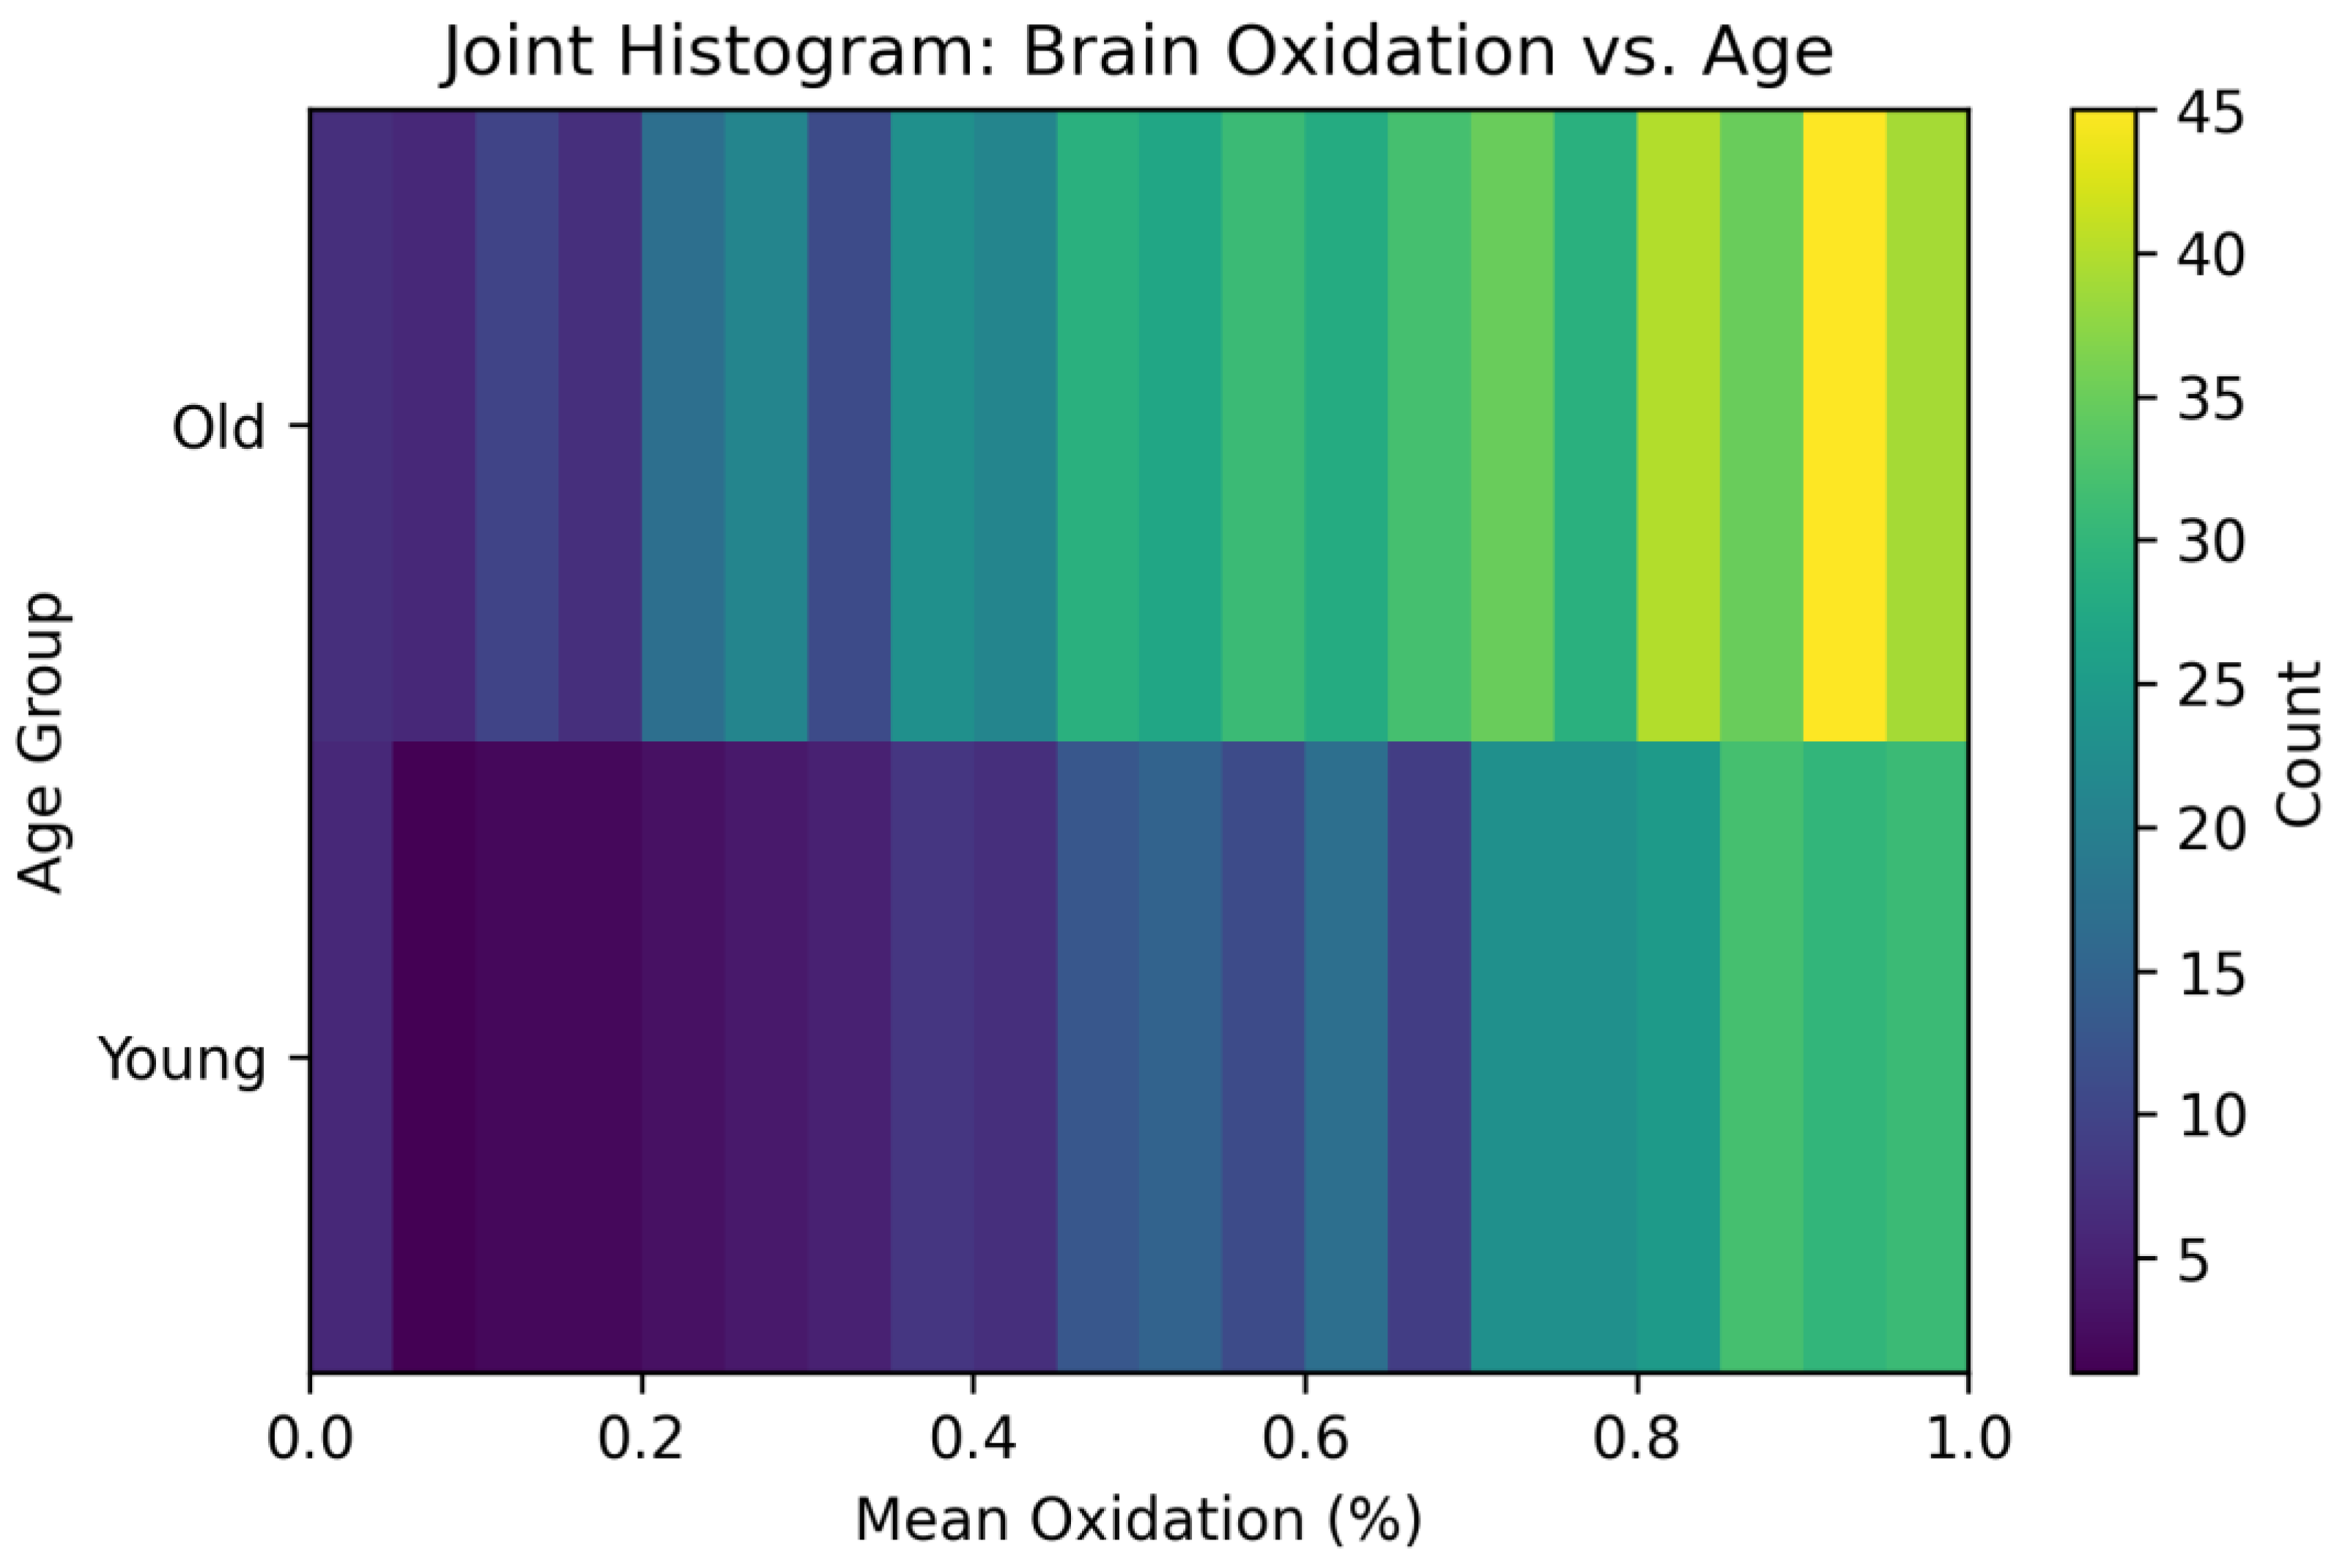
Figure 3.
Distribution of per cysteine Kullback–Leibler (KL) divergence in the brains young compared to old mice. As generated using a script, each residue oxidation probability distribution (P: control; Q: case) was discretized into equal bins and KL divergence DKL(P∣∣Q) was calculated in bits. Most peptides exhibit minimal divergence, suggesting stable redox profiles, while a subset shows substantial shifts under perturbation. The dashed line indicates the mean KL divergence across all peptides (4.2403 bits), quantifying the average informational cost of assuming the perturbed state distribution given the baseline. Note the extreme bimodal distribution of the dataset.
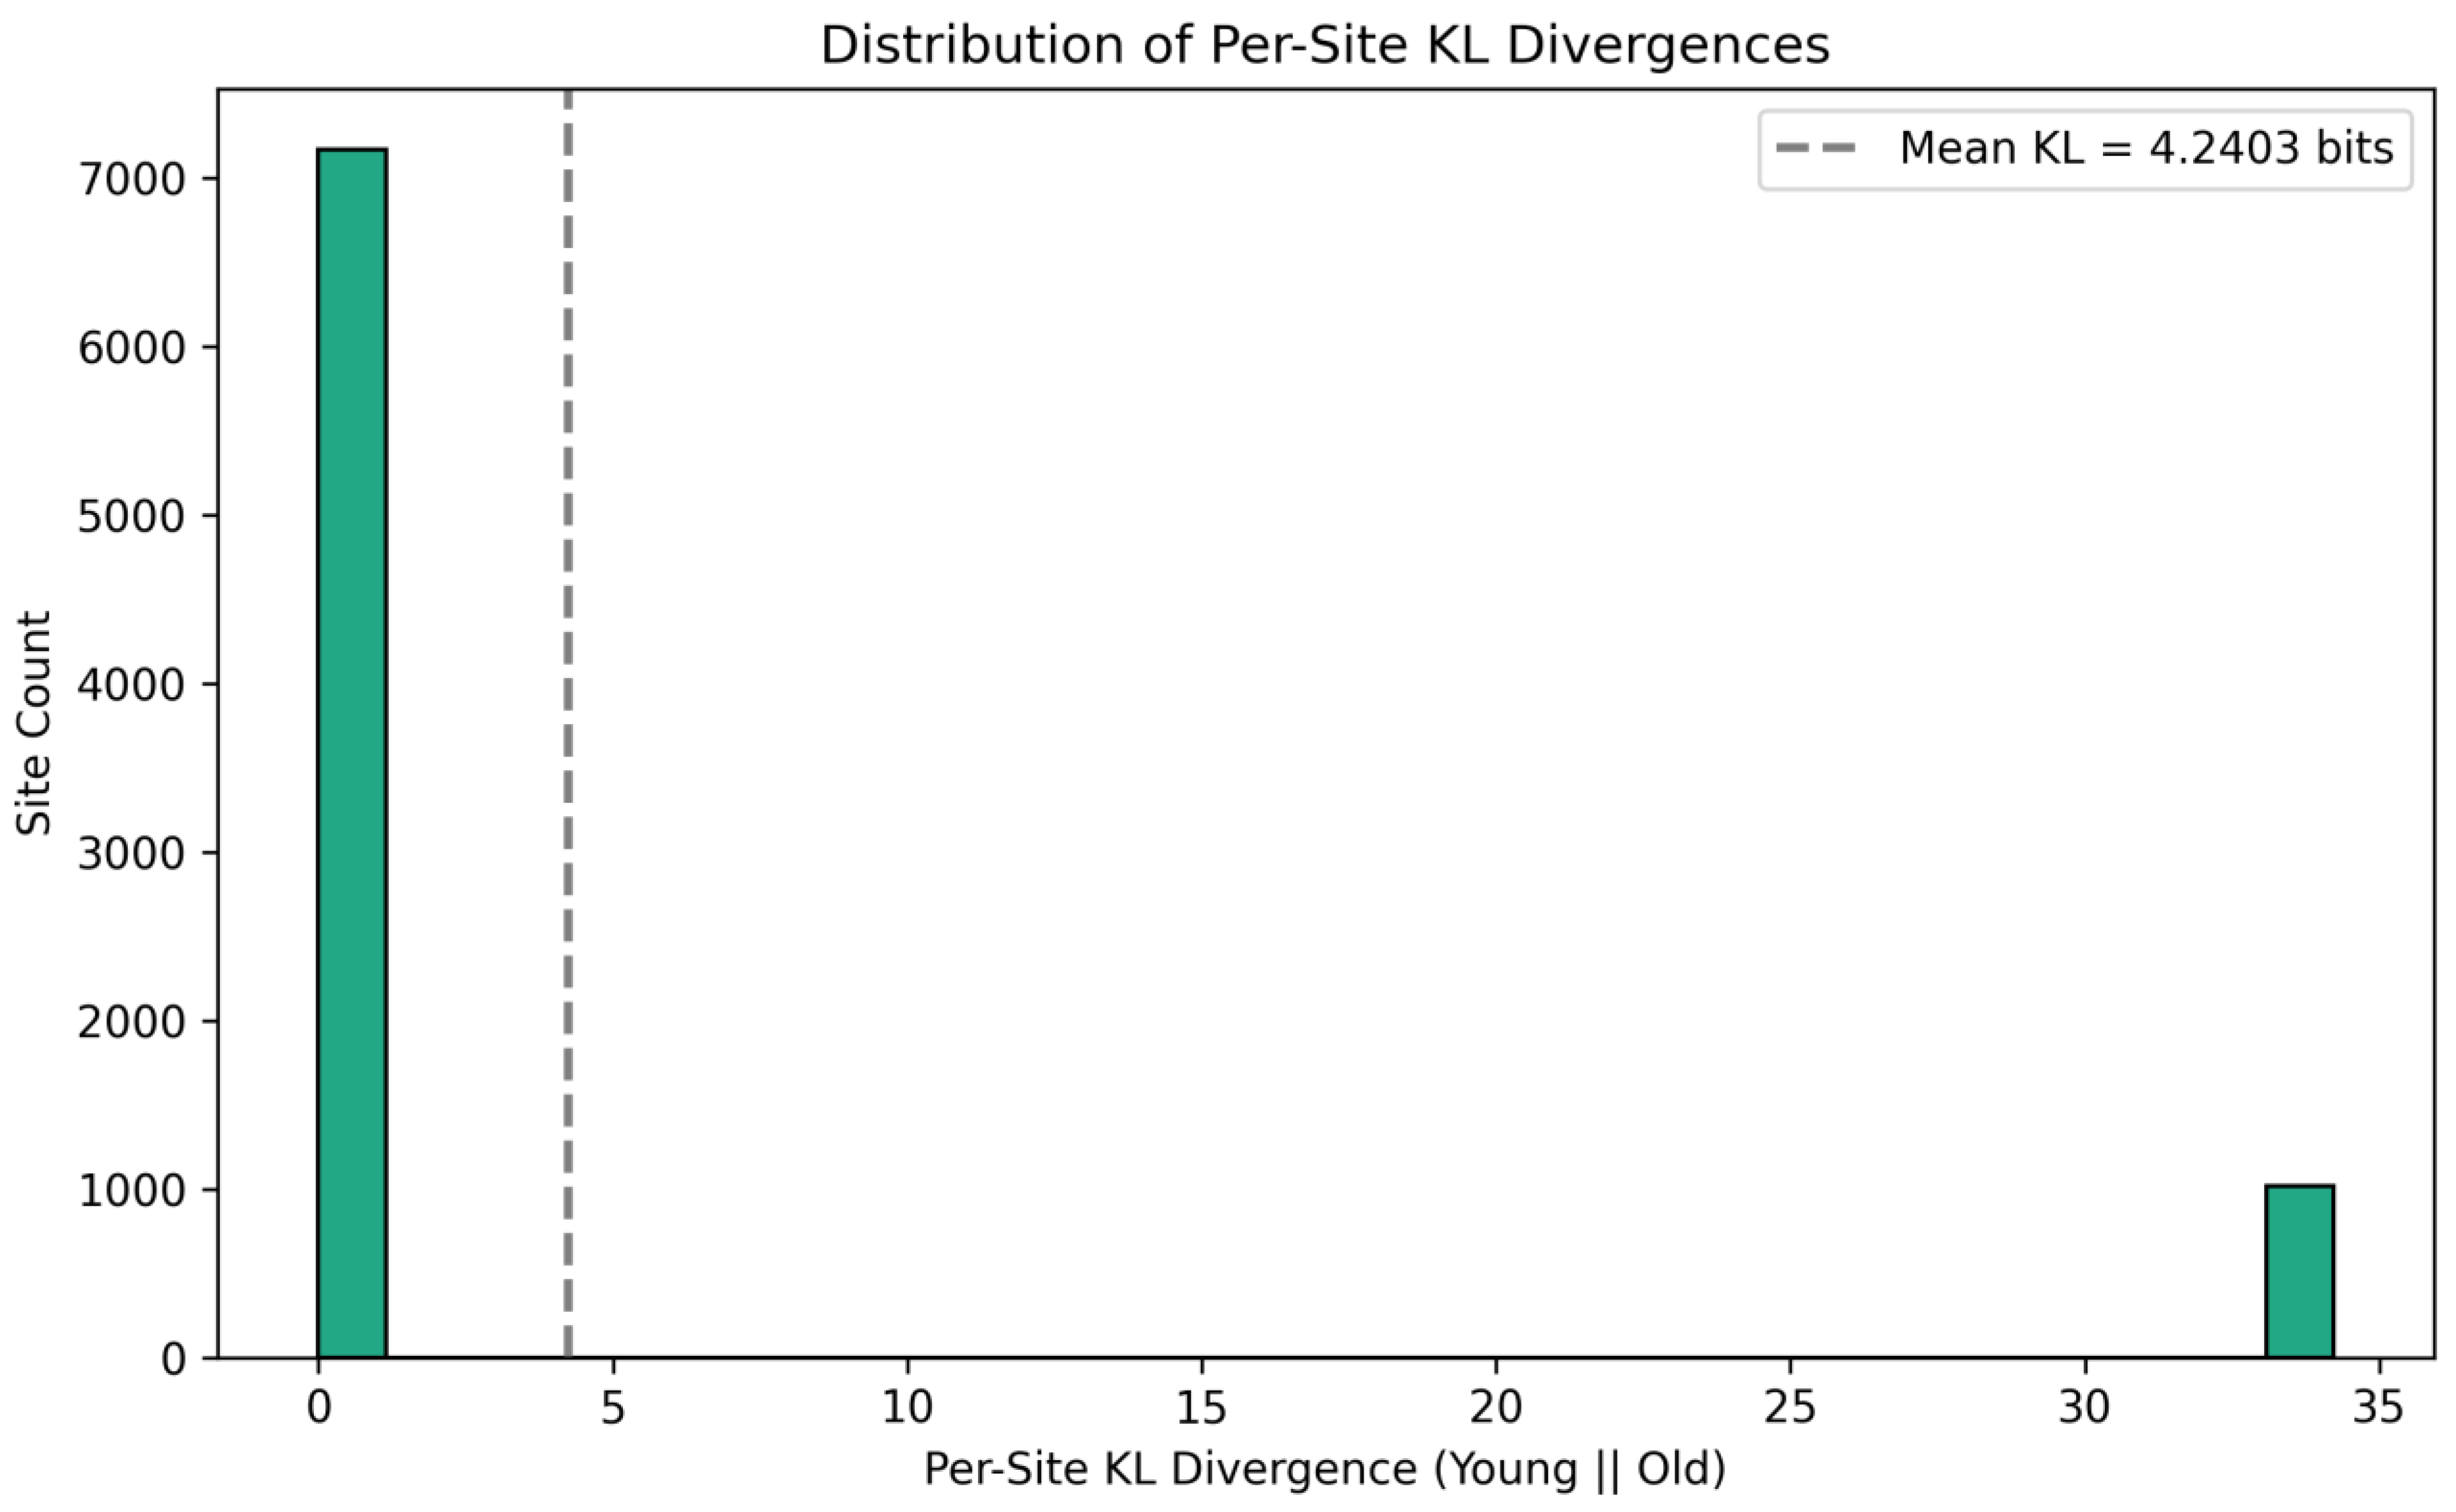
Figure 4.
Fisher Information Surface over Redox θ. As generated using a script, this 3D plot shows the Fisher Information Metric between Young and Old brain cysteine oxidation distributions, discretized into equal-width bins (0–100 %). The “Young vs Young” comparison (front plane) is flat at zero, confirming no self-distance. In contrast, the “Young vs Old” surface exhibits sharp peaks at intermediate oxidation levels (around 35–45 % and a secondary bump near 75–85 %), indicating those bins contribute most strongly to the statistical distance (geodesic) between age groups. The low information at extremes (0–10 % and 90–100 %) reflects minimal age-dependent change at very reduced or fully oxidized states.
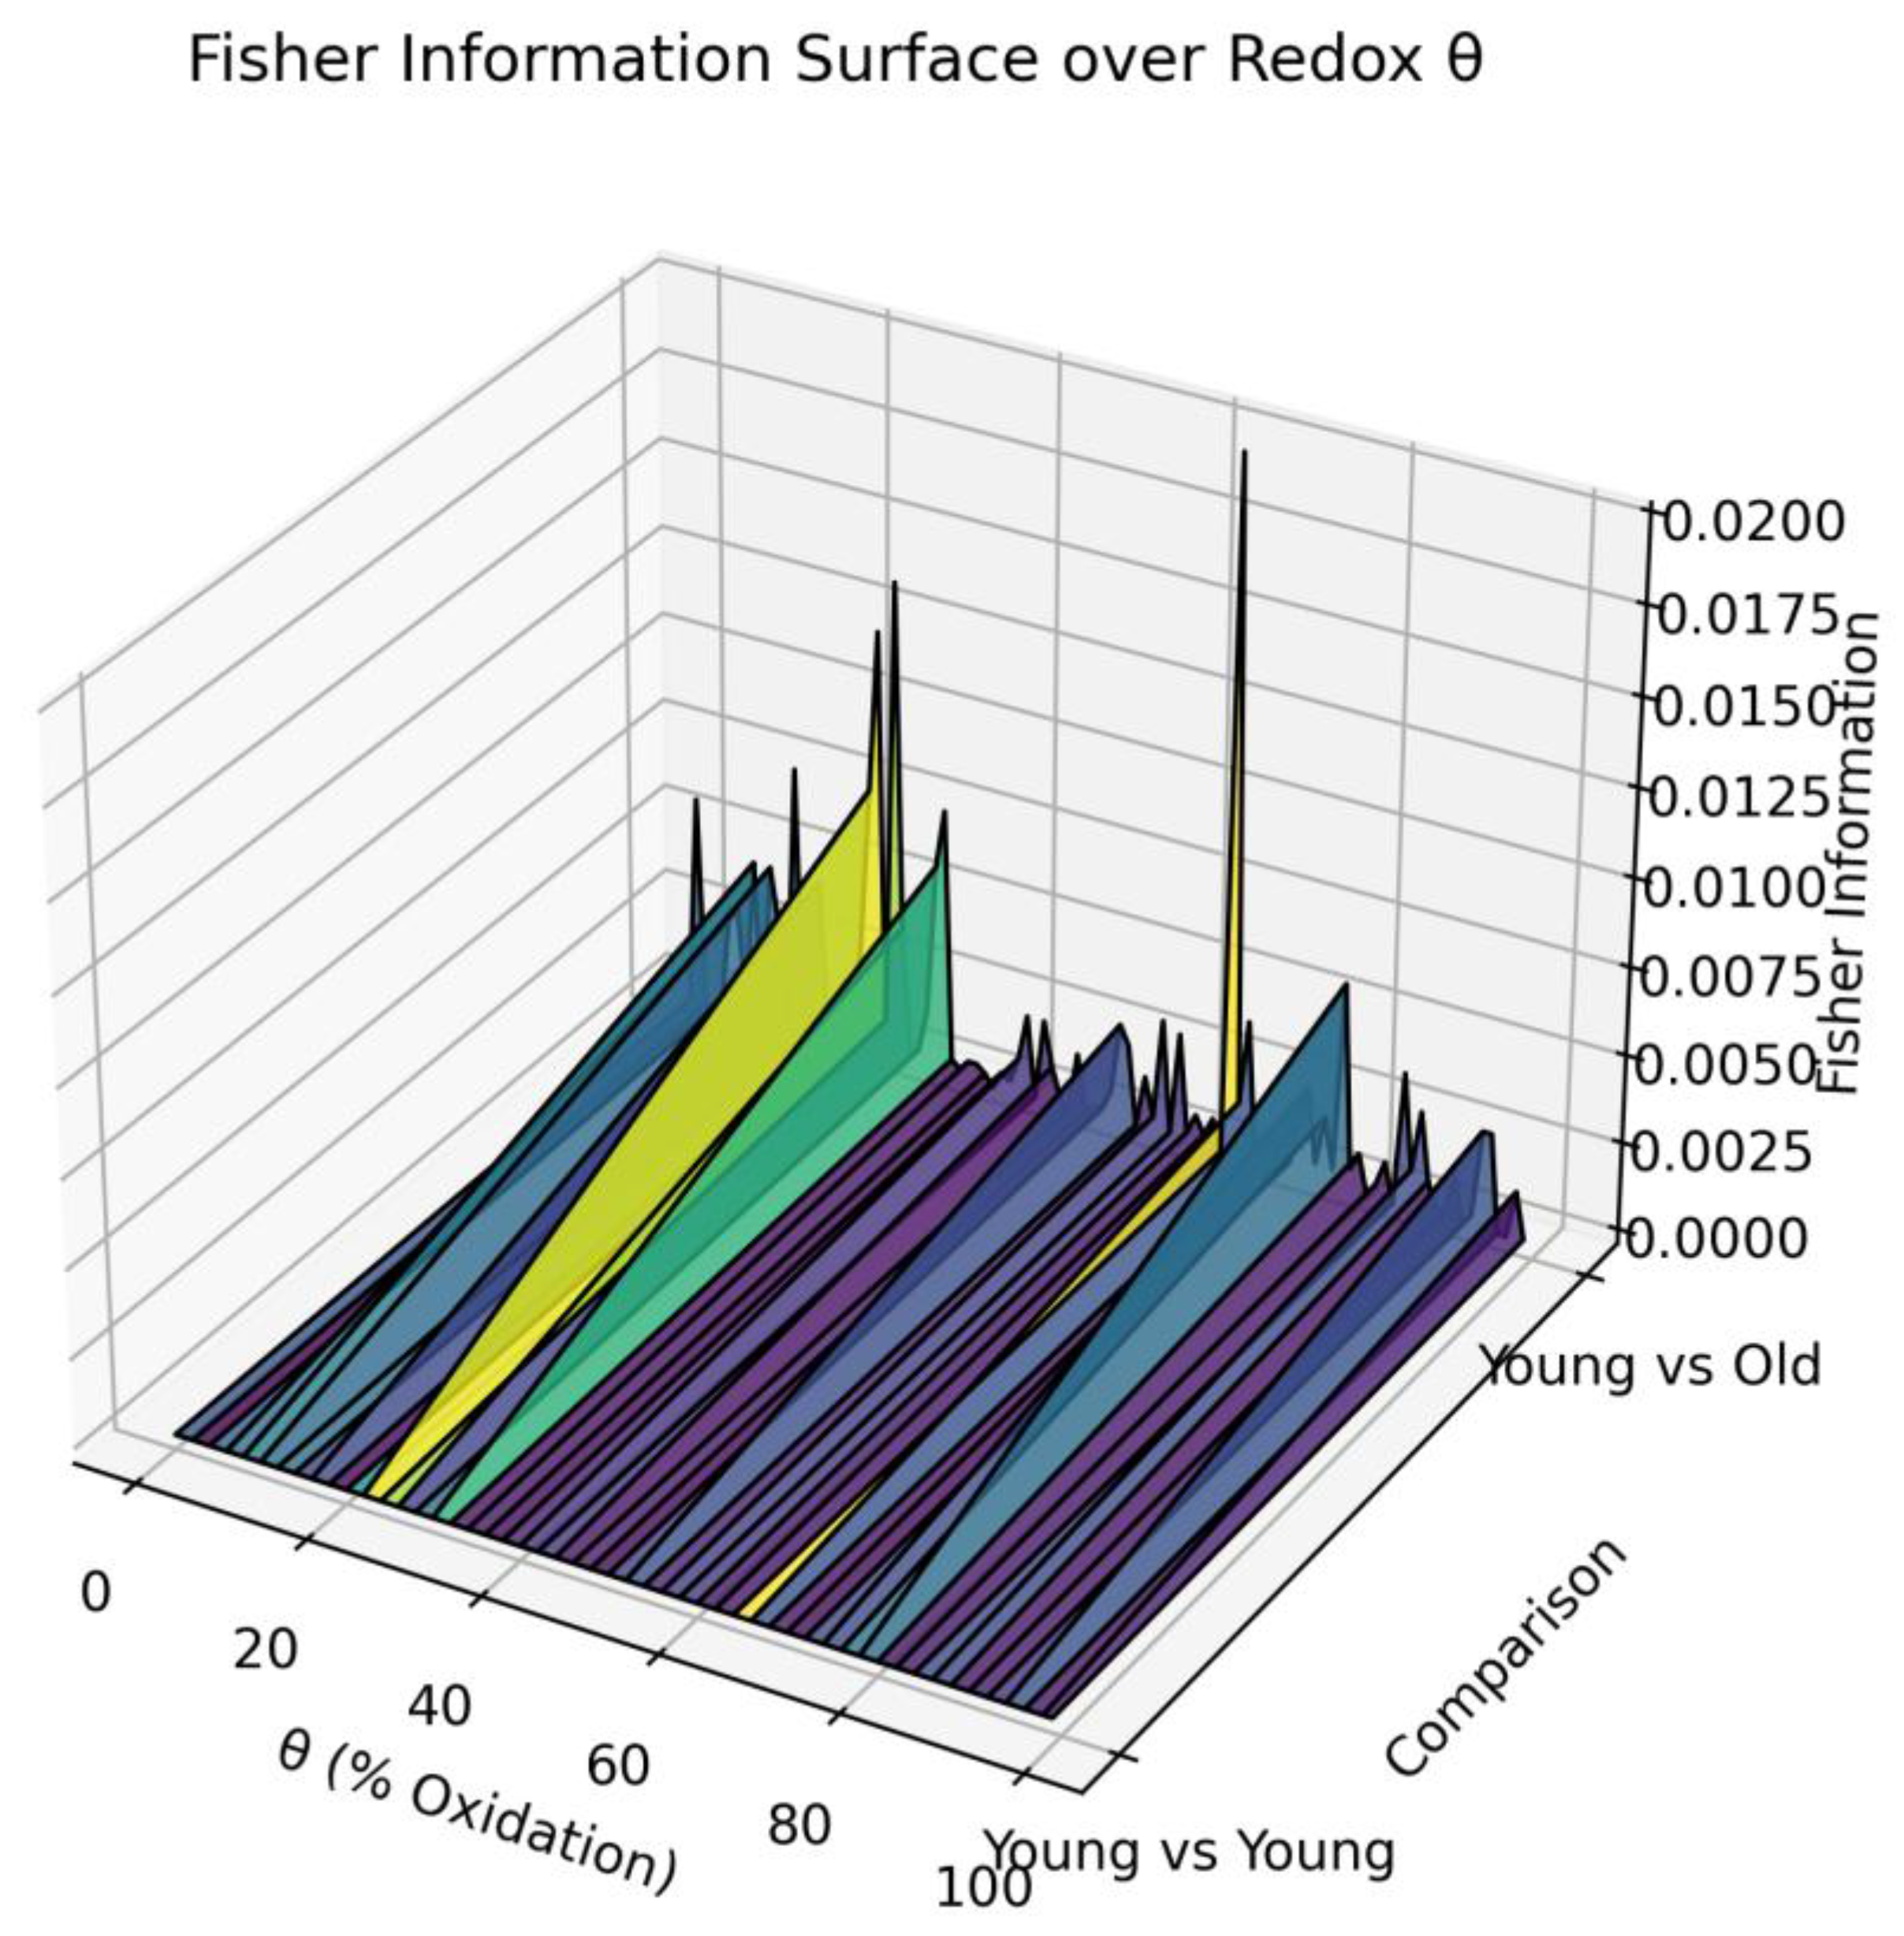
Figure 5.
Local Fisher–Rao Contributions over Oxidation Bins. As generated using a script, the “Young vs Young” row is uniformly colored (~3.08 radians) because comparing identical distributions yields a constant minimal contribution in each bin. In contrast, the “Young vs Old” row peaks in the 10–20 % and 20–30 % oxidation bins (bright yellow), indicating those intermediate oxidation levels carry the greatest local geodesic distance between age groups. Cooler colors toward the extremes (0–10 % and 90–100 %) show minimal local distance, consistent with negligible age-dependent change in those redox state. .
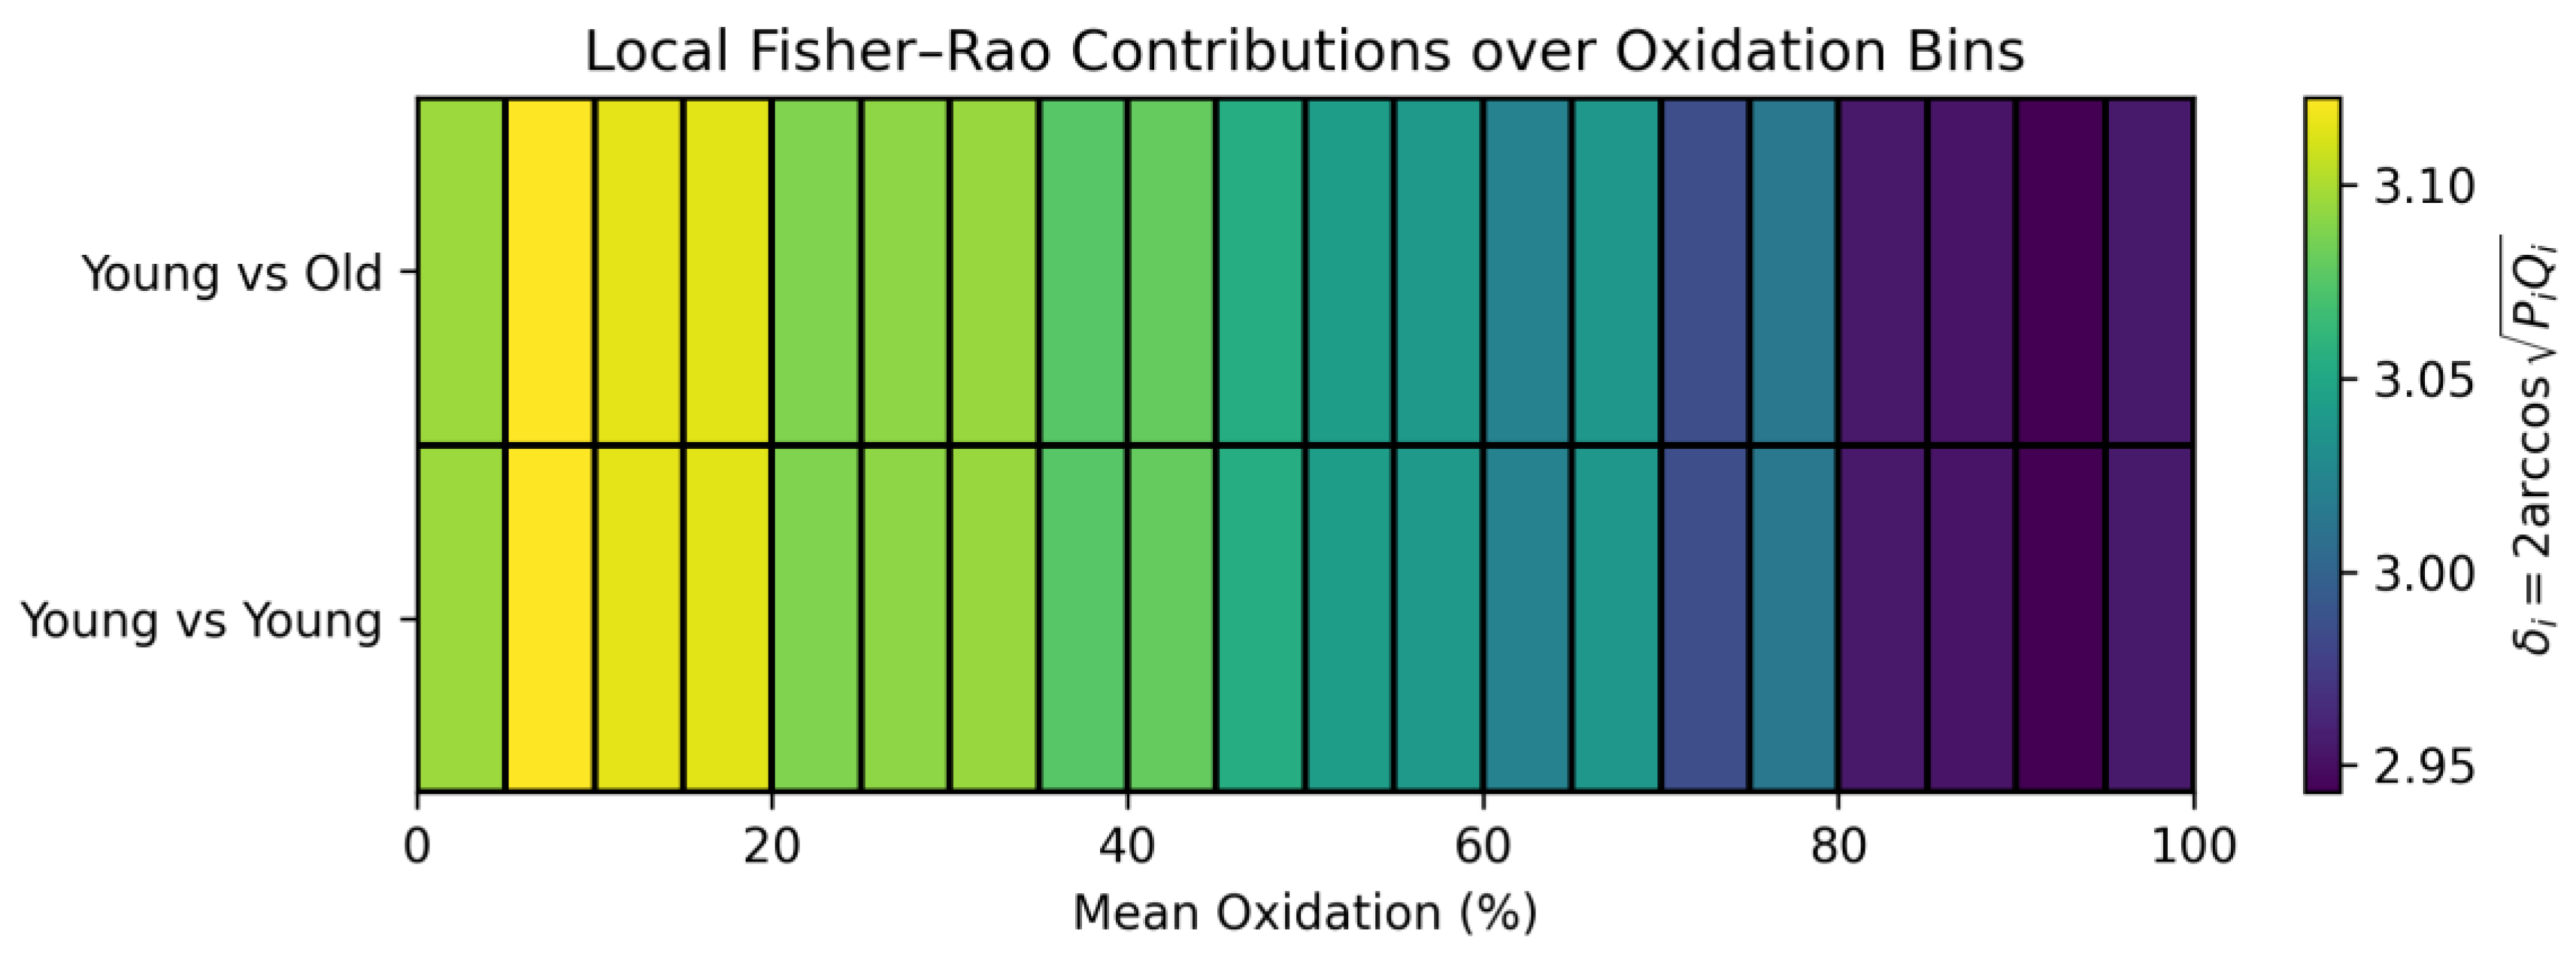
Figure 6.
Bifurcation and Recurrence Reveal Emergent Redox Chaos in Synthetic Systems. Left: Bifurcation diagram of a logistic map modeling cysteine oxidation under increasing control parameter (μ), representing external redox input such as ROS flux. The system transitions from a single fixed point (ordered behavior) into periodic oscillations, and ultimately chaotic dynamics as μ increases. These bifurcations emulate how redox systems can exhibit critical transitions where small parameter changes drive disproportionate shifts in the proteoform state distribution. Right: Recurrence plot of a synthetic redox signal over time. The top-left region shows regular, periodic recurrence patterns—indicative of stable or oscillatory redox behavior—whereas the lower-right region becomes irregular and fragmented, reflecting transition to chaos. This transition captures the coexistence of order and disorder, consistent with redox hybrid attractors. Such plots reveal hidden periodicity, long-range memory, and the emergence of structured noise within redox trajectories, supporting the concept of “strange oxi-attractors”.
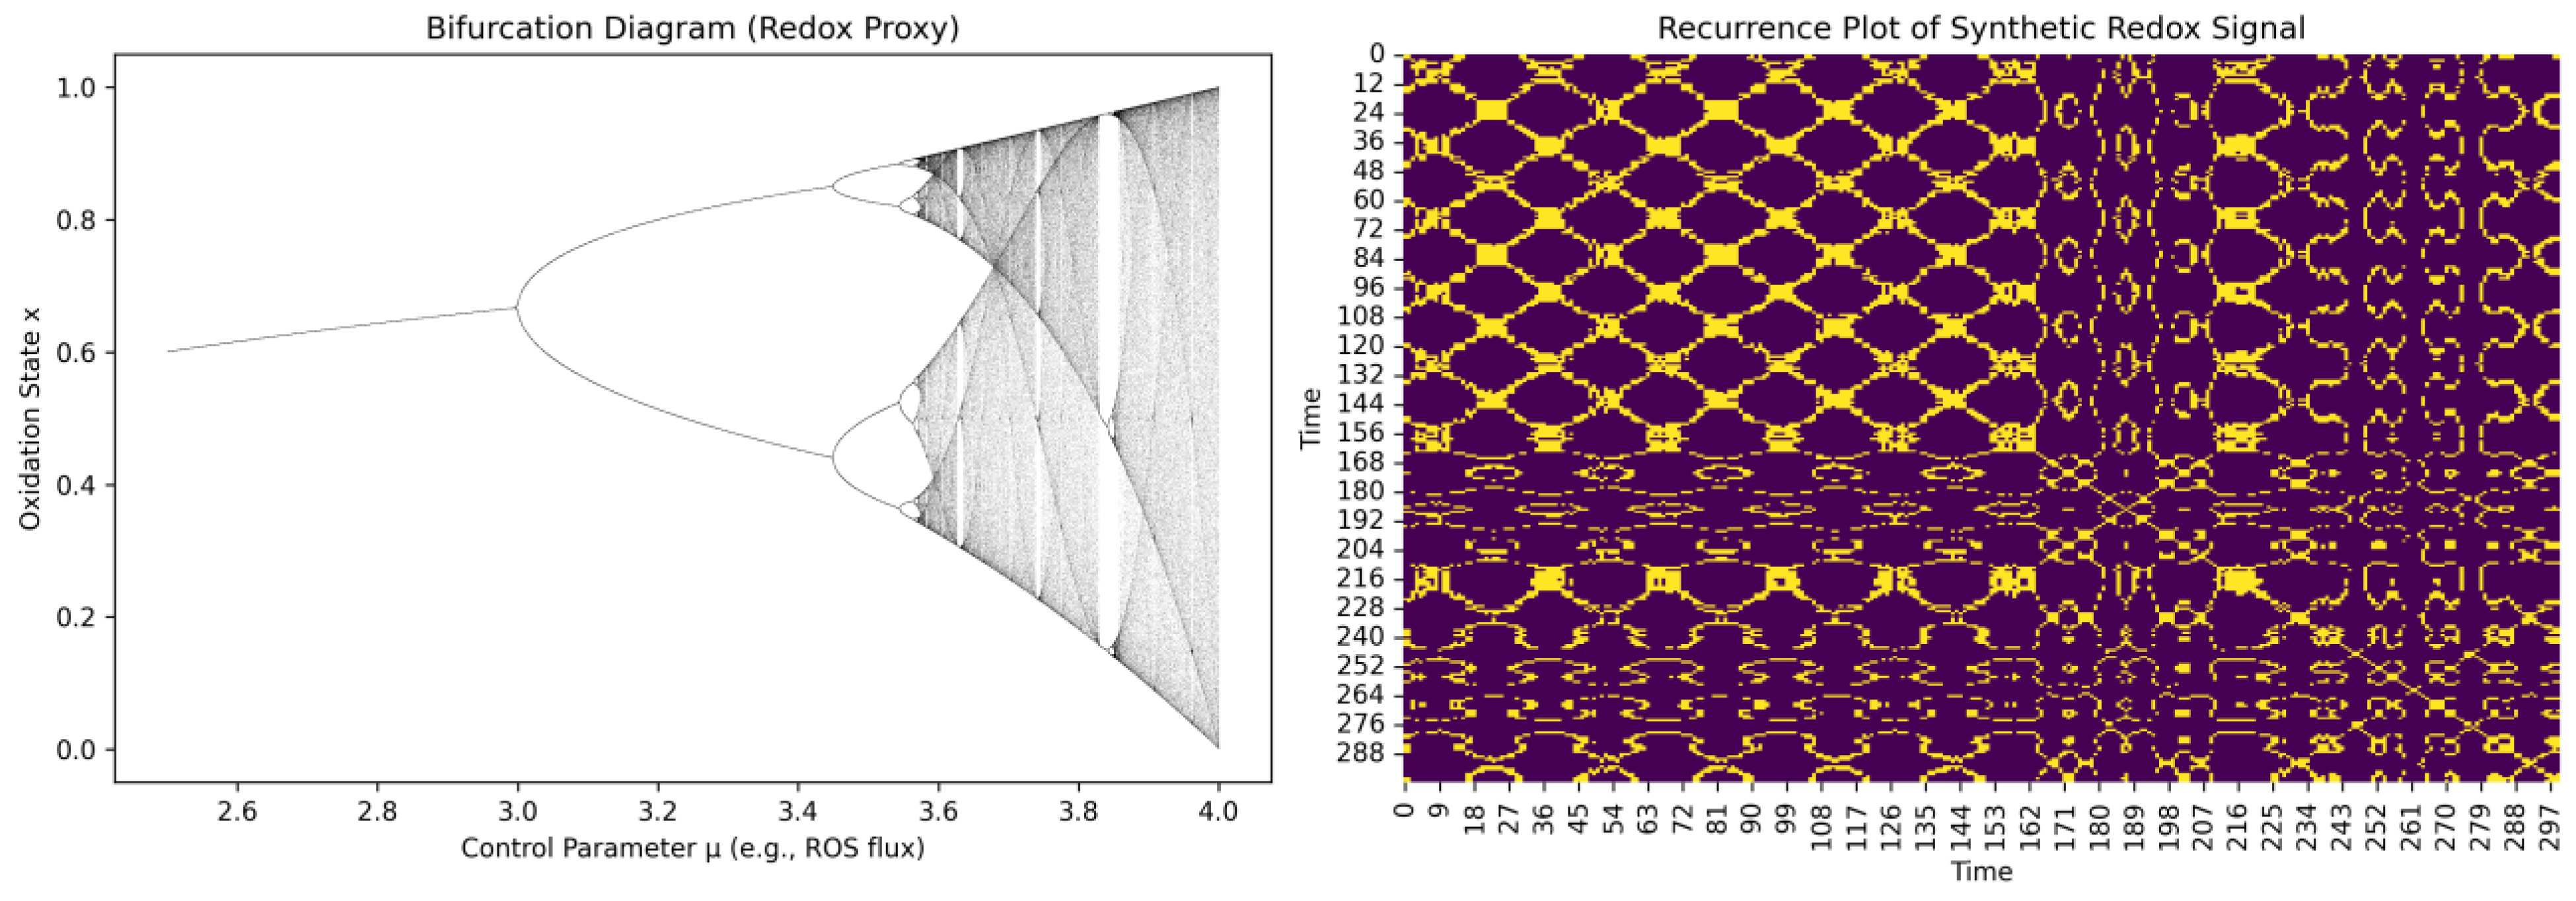
Figure 7.
Synthetic fractal redox signal in complex redox space reveals scale-invariant recurrence structure. Left. Real
component (solid blue) represents the synthetic oxidation level R(t)R(t)R(t)
over time. Imaginary component (dashed red) encodes a latent redox variable,
here modelled as the temporal derivative of oxidation (velocity), forming a
complex signal
. Periodic base
structure with superimposed fractal spikes reflects recursive oxidation
dynamics and perturbation events. (Right) Recurrence plot of the complex signal
Z(t), showing repeated trajectory motifs in phase space. The plot
reveals nested lattice-like structures with cross-scale diagonals and loops,
consistent with a self-similar and fractal manifold in redox space. These
patterns suggest memory-like dynamics, attractor basins, and long-range
temporal correlations within the redox signal evolution.
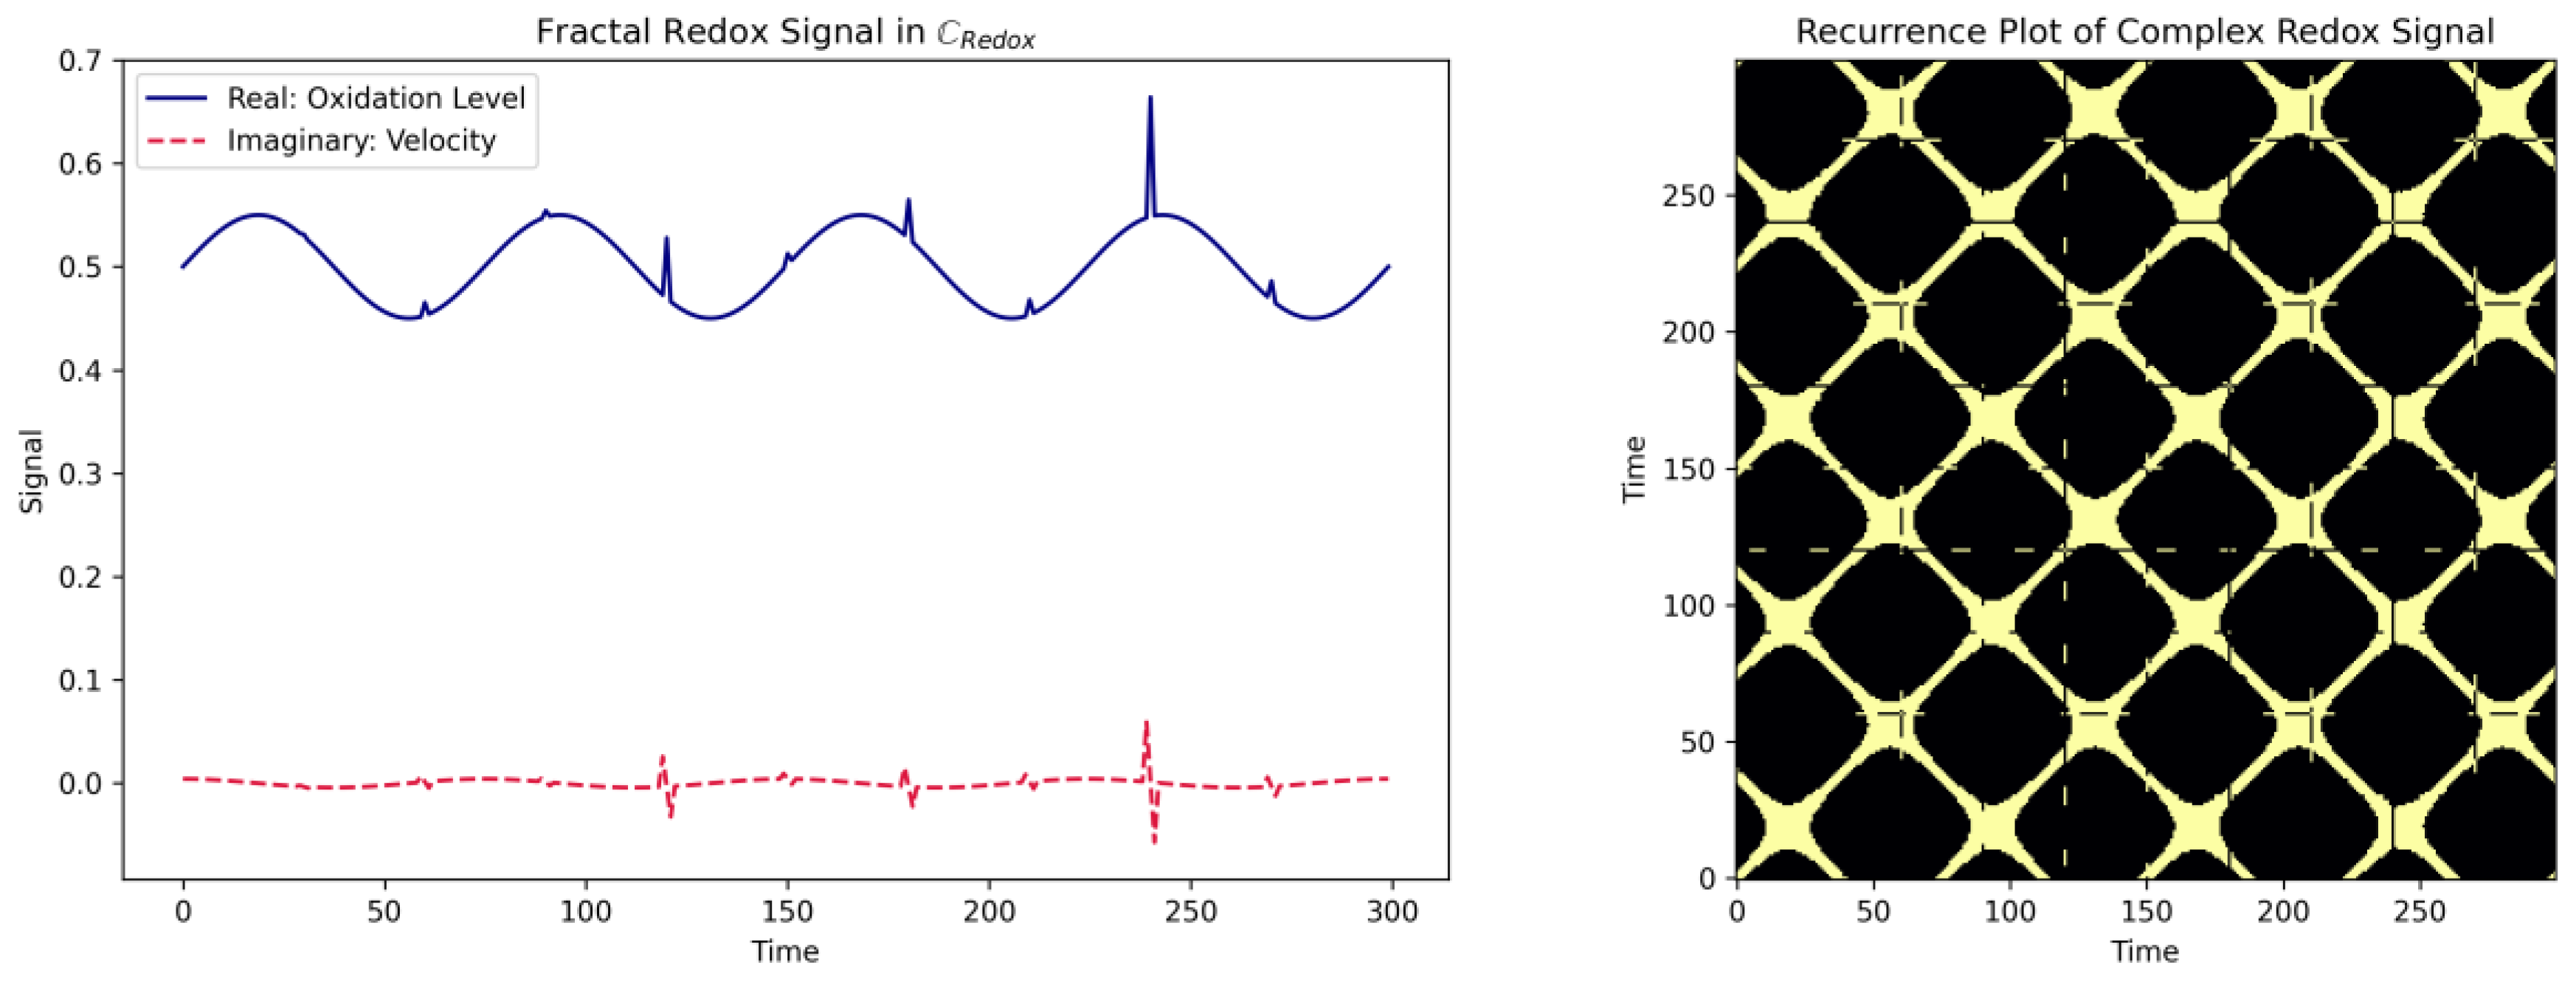
Figure 8.
The cysteine redox butterfly effect. A small change in ROS from a redox perturbation (left) provokes chaotic cysteine proteoforms trajectories in redox phase space (right).
Figure 8.
The cysteine redox butterfly effect. A small change in ROS from a redox perturbation (left) provokes chaotic cysteine proteoforms trajectories in redox phase space (right).
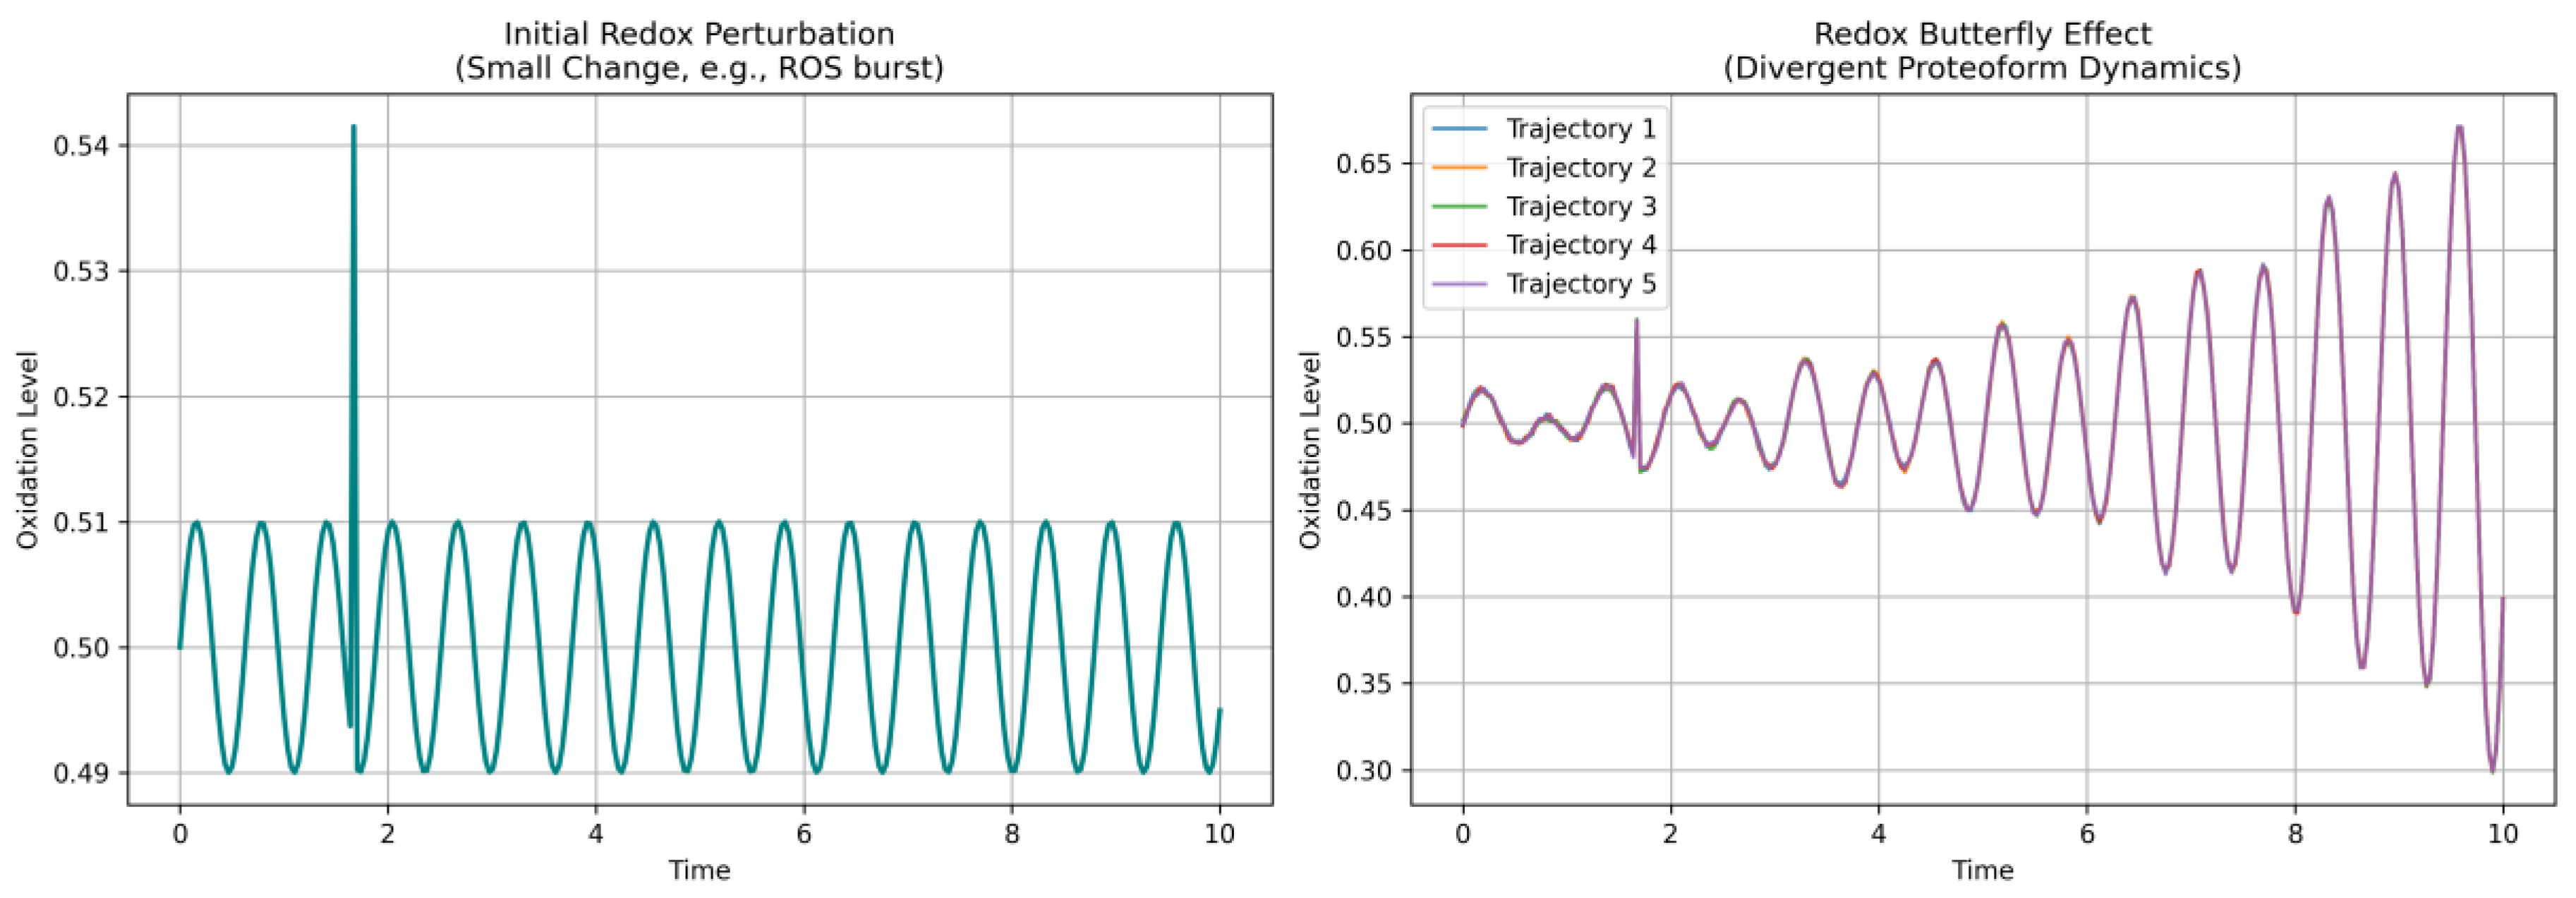

Table 1.
Summary of key chaos theory metrics, inclusive of the mathematical tool, peptide-level equations, and the biological interpretation.
Table 1.
Summary of key chaos theory metrics, inclusive of the mathematical tool, peptide-level equations, and the biological interpretation.
| Metric | Mathematical tool | Equation (peptide level) | Biological interpretation |
| Lyapunov exponent (λ) | Exponential divergence of nearby trajectories. | Positive values denote redox shifts diverging over time. Negative values denote converging or stable trajectories. | |
| Attractor geometry | Correlation dimension (D2) via Grassberger-Proaccia algorithm. | Redox states oscillate about nonlinear basins with fractal, self-similar structure. | |
| Entropy production | Kolmogorov-Sinai (KS) or approximate Entropy (ApEn). | The dynamic generation of information reflects continually redox remodeling of the peptide oxidation state. | |
| State recurrence | Recurrence quantification analysis (RQA), Poincaré maps. | Where is the Heaviside function | Detects long-range memory, hidden periodicity, and/or structured noise in cysteine oxidation datasets |
| Bifurcation detection | Delay-coordinate bifurcation diagram with control parameter. | , scan over (e.g., ROS flux) | Can reveal whether small redox changes trigger shape transitions in cysteine oxidation—phase space shifts. |
| Phase-space remodeling | Delay embedding with topological analysis. | Can reveal the stretching and folding that is characteristic of chaotic attractors. |
Notes: xt is the cysteine redox state (e.g., %-oxidation) of a given peptide at time t. δX(t) and δX0 are small perturbations in peptide oxidation trajectories. m is embedding dimension; τ is time delay; μ is a control parameter (e.g., ROS flux). The equations can be computed peptide-wise, then aggregated across peptides or protein.
Table 2.
Mathematically grounded tools for fractal analysis in peptide level redox biology.
| Metric | Mathematical tool | Equation (peptide level) | Biological interpretation |
| Box-Counting Dimension (D(B)) | Estimates geometric complexity by covering the trajectory in -sized boxes. | Measures how fully the redox trajectory fills its phase space. A High DB suggests a recursive filling of the available space—the [0,100] interval. | |
| Curvature entropy | Quantifies the entropy (S) of trajectory curvature fluctuations. | Where ki is local curvature. | Measures dynamic inflections in redox trajectories—capturing looping, spiraling, or sharp transition behavior. |
| Fractal recurrence score | Assesses self-similarity in recurrence plots. | Diagonal line structures in 2D recurrence plots of Z(t); compute fractal dimension of recurrences. | Measures multi-scale repetition in cysteine oxidation patterns, with the ability to capture periodic cycles. |
| Spectral fractality | Power-law scaling of the trajectory frequency domain. | Power spectrum , where quantifies long-range memory | Measures cysteine oxidation dynamics across timescales with the ability to capture nested cycles or autocorrelation behavior. |
Disclaimer/Publisher’s Note: The statements, opinions and data contained in all publications are solely those of the individual author(s) and contributor(s) and not of MDPI and/or the editor(s). MDPI and/or the editor(s) disclaim responsibility for any injury to people or property resulting from any ideas, methods, instructions or products referred to in the content. |
© 2025 by the authors. Licensee MDPI, Basel, Switzerland. This article is an open access article distributed under the terms and conditions of the Creative Commons Attribution (CC BY) license (http://creativecommons.org/licenses/by/4.0/).
Copyright: This open access article is published under a Creative Commons CC BY 4.0 license, which permit the free download, distribution, and reuse, provided that the author and preprint are cited in any reuse.


