
Submitted:
28 July 2025
Posted:
29 July 2025
You are already at the latest version
Abstract
Carnosic acid (CA) is a phenolic diterpene with high antioxidant activity that supports its radioprotective capacity. This study aims to determine whether the radiosensitizing effect of CA established in B16F10 melanoma cells also occur in other mela-nin-producing cells. Cell survival analysis, apoptosis, intracellular glutathione levels, and cell cycle progression were evaluated by comparing radiosensitive cells (PNT2) with radioresistant melanin-producing cells (MELAN A, SK-MEL-1 and B16F10). In PNT2 cells, CA exhibited radioprotective capacity, with 100% cell survival after expo-sure to 20 Gy of X-rays (p < 0.001), decreasing apoptosis (p < 0.001) and increasing the GSH/GSSH ratio (p < 0.01), without significant modification in cell cycle progression. However, the administration of CA to irradiated cells failed to show radioprotective capacity in MELAN A and SK-MEL-1 cells, it even doubled cell death in B16F10 cells (p < 0.001); did not modify cell apoptosis, nor prevent a decrease in the GSH/GSSG ratio and intensify the modifications in the cell cycle induced by ionizing radiation. All of these led to a loss of radioprotective capacity in the melanin producing cells (MELAN A and SK-MEL-1) and even induced a radiosensitizing effect in B16F10 cells. Understanding the mechanisms of action of substances such as CA could promote new applications that protect healthy cells and exclusively damage neoplastic cells when both are present within the same irradiated volume in cancer patients requiring radiotherapy.
Keywords:
radiation effects
; radioprotectors
; radiosensitizers
; melanoma
; B16F10
; PNT2
; SK MEL 1
; Melan A
1. Introduction
Melanoma is known to have the highest mortality rate among skin cancer patients worldwide [1-3]. The current therapeutic approach to advanced human melanoma includes surgery as the first line of treatment in localized stages, while in metastatic phases, immunotherapy, targeted therapies, and in selected cases, adjuvant or palliative radiotherapy are used. However, melanoma is notoriously resistant to chemotherapy and has a limited response to conventional radiotherapy, which warrants the search for novel strategies to improve tumor radiosensitivity [4,5].
In the experimental context, B16F10 melanoma cell line is a mouse metastatic cell line that is frequently used as a research model of melanomas [5,6] to assess the response to ionizing radiation (IR) and other modulating agents. Previous studies have shown that these cells are characterized by high radioresistance attributed to their endogenous antioxidant capacity and the activation of DNA damage repair mechanisms [7,8]. However, it has been described that the administration of certain antioxidant and known radioprotective substances, such as carnosol [9], rosmarinic acid [10,11,12] and carnosic acid [13,14]. Paradoxically, they do not confer radioprotection to B16F10 cells; on the contrary, these compounds can exert a radiosensitizing effect, increasing radiation-induced cell death and raising the enhancement ratio (ER) to values greater than 2.2 [9,12,14]. This paradoxical phenomenon has been linked to the activation of melanogenesis and the alteration of the intracellular redox system, especially glutathione depletion, which compromises endogenous antioxidant defences, favouring lethal oxidative damage induced by ionizing radiation [9,10,12]. This paradoxical radiosensitizing effect has also been related to the metabolic adaptations associated with the high metastatic capacity of these cells, to specific characteristics of their enzyme production, to their enormous cellular proliferation and even to the change in microenvironmental pH produced by tumor necrosis associated with their rapid growth [12, 14].
In this study we aim to also evaluate the existence of this paradoxical radiosensitizing effect in other normal murine melanocyte cell lines (Melan A) and in human metastatic melanoma cells (SK-MEL-1). The investigation of compounds capable of modulating responses to ionizing radiation—enhancing tumor radiosensitivity while selectively protecting normal cells—represents a promising strategy to optimize therapeutic efficacy in melanoma. This approach opens new avenues for personalized radiotherapy by increasing tumor damage without elevating toxicity in healthy tissues [10,12].
2. Materials and Methods
2.1. Carnosic Acid
Carnosic acid (CA) (C20H28O4) (4AR,10aS)-5,6-dihydroxy-1,1-dimethyl-7-propan-2-yl- 2,3,4,9,10,10a-hexahydrophenanthrene-4a-carboxylic acid) from Rosmarinus officinalis with a purity of ≥ 91% was purchased from Sigma-Aldrich (Madrid, Spain) (Figure 1).
2.2. MTT and XTT Cytotoxicity Assay
To investigate the cell survival by means of the MTT assay for adherent cells and the XTT assay for cells in suspension, we used four cell lines with different degrees of resistance to ionizing radiation [15]: human prostate epithelial cells PNT2, a cell line traditionally considered to be radiosensitive and which we used as reference control cells; and three traditionally melanin-producing cell lines considered radioresistant: Melan A (melanocytes of murine origin), SK-MEL-1 (human metastatic melanoma cells) and B16F10 (murine melanoma cells).
PNT2 cells were obtained from the European Collection of Authenticated Cell Cultures (ECACC) (ECACC 95012613, UK) and were cultured in RPMI-1640 medium supplemented with glutamine (2 mM). B16F10 cells were kindly provided by Dr. Hearing from the National Cancer Institute (Bethesda, MA, USA) and cultured in a 1:1 mixture of Dulbecco’s modified Eagle’s medium (DMEM) and Ham’s F12 (Ham’s Nutrient mixture F-12). The Melan-A murine melanocyte cell line was generously supplied by Professor Dorothy C. Bennett (University of London, London, UK; ECACC, cat# 153599). Melan-A cells were grown in RPMI 1640 medium and 200 nM 12-O-tetradecanoylphorbol-13-acetate (TPA). The human melanoma cell line SK-MEL-1 was obtained directly from the LGC Standards/ATCC advanced cell catalog (ATCC, cat# HTB-67) and grown in Eagle's Minimum Essential Medium (EMEM). All culture mediums were enriched with 10% fetal bovine serum (Gibco BRL) and antibiotics (5% penicillin/streptomycin). Cell cultures were maintained at 37˚C and 95% relative humidity and an atmosphere of 5% CO2. Throughout the study, conventional Mycoplasma Tests were conducted to confirm the absence of contamination by Mycoplasma spp. CA dissolved in DMSO (1mg per mL) was prepared at 35 µM in phosphate buffered saline (PBS). The carnosic acid was administered by adding 35 μl of 35 µM CA to each well. The administration of CA to the culture medium was carried out 15 minutes prior to X-ray exposure.
MTT and XTT Assays of Irradiated Cells
To analyze the radioprotective effects of the CA on PNT2, Melan-A and B16F10 cell lines, two MTT assay types were carried out as previously described [13, 16]. Forty-eight (48) hours after incubation, cell proliferation was determined after exposure to X-radiation. Briefly, PNT2 cells (3200 cells/well), Melan-A and B16F10 cells (2500 cells/well) were incubated in 200 µl of growth medium and allowed to adhere to the bottom of the wells for 24 hours. After 48 hours of X-ray exposure, 50 μl of MTT (5 mg/ml) in culture medium were added to each well and incubated in a 5% CO2, atmosphere at 37 °C for 4 h media and unmetabolized MTT were then removed.
For the XTT assay [13,16], SK-MEL-1 cells were seeded (2500 cells/well) and allowed to acclimatize for 48 hours prior to treatment (20 Gy irradiation and/or addition of 35 μM CA). Following treatment, cells were incubated for either 24 or 48 hours. The XTT assay was then performed by adding 50 μl of freshly prepared XTT solution to each well. This solution consisted of XTT (Sigma, 1 mg/ml) combined with PMS (5 mM, dissolved in PBS). The mixture was sterilized by passing through a 0.22-μm nylon membrane syringe filter and incubated at 37 °C in a humidified atmosphere containing 5% CO₂ for 4 hours.
After shaking the plates for 30 min at room temperature, the absorbance readings of the plates were read spectrophotometrically using FLUOstar® Omega spectrophotometer (BMG Labtech, Offenburg, Germany). Absorbance values at 570 nm and 690 nm were used for test and reference wavelengths respectively. Each experiment was re-peated six times.
2.3. Anexin V
For cell apoptosis determination by flow cytometry, we used the Alexa Fluor® 488 annexin V/Dead Cell Apoptosis Kit (Catalog nos. V13241) (Invitrogen™, Thermo Fisher Scientific, Spain, Madrid) that allows measurement of early apoptosis by detecting the expression of phosphatidylserine (PS) and membrane permeability as described previously [14]. Stained cells were immediately analyzed using a FACSCalibur flow cytometer (Becton Dickinson), with fluorescence measured at 530 nm and 575 nm following excitation with a 488 nm laser.
2.4. GSH Assay
The GSH/GSSG-GloTM assay (Promega, Madison, MI, USA) was used to determine and quantify the levels of total glutathione (GSH + GSSG), reduced glutathione (GSSG), and the GSH/GSSG ratio into the cells subjected to the different experimental conditions 30 minutes after exposure to 20 Gy of X-rays, as described previously [14]. The method was carried out according to the manufacturer's instructions. The cells were then treated with 35 µl CA solution. Cell densities were evaluated and corrections made using the Bradford assay [17]. Cells were dislodged from the substratum by trypsinization and their fluorescence in-tensity analyzed using FLUOstar® Omega (BMG Labtech, Offenburg, Germany). All experiments were repeated six times.
2.5. Ciclo Celular
The cell lines were grown in 25 cm² culture flasks with 5 mL of appropriate culture medium and incubated under standard conditions until adequate confluence was reached. The cells were then treated with fresh medium and CA was administered at a final concentration of 35 µM. Thirty minutes after compound administration, X-ray irradiation was performed. Forty-eight (48) hours following irradiation, the cells were suspended in culture medium and harvested by centrifuging at 200 g for 10 minutes at room temperature. After cell counting and adjustment to 1x10⁶ cells/200 µL in cold PBS, they were fixed with 2 mL of a 70% ethanol solution in PBS and kept for 30 minutes at 4°C to achieve adequate cell permeabilization. Subsequently, the cells were centrifuged for 10 minutes at 4°C at 1000 rpm and the supernatant was discarded. The pelleted cells were resuspended in 800 µL of cold PBS. For DNA staining, 100 µL of a propidium iodide (PI) solution at a final concentration of 400 µg/mL and 100 µL of RNase A (1 µg/mL) (Sigma-Aldrich, St. Louis, MO, USA) in PBS were added to each sample. The samples were incubated in the dark at 4°C for 30 minutes to ensure correct intercalation of the PI with the cellular DNA. A FACSCalibur flow cytometer (Becton Dickinson, Franklin Lakes, NJ, USA) was used for data acquisition, using an excitation laser at 488 nm and an emission filter of 585/42 nm. DNA content histograms were generated and analyzed with ModFit LT software (Verity Software House, Topsham, ME, USA), using the appropriate fitting model for determining cellular distribution across cell cycle phases (G0/G1, S, and G2/M). All experiments were performed according to the manufacturer's instructions.
.2.6. Irradiation
The exposure of test models to different doses of IR was carried out using an Andrex SMART 200E X-ray generator (Yxlon International, Hamburg, Germany), operating with the same technical characteristics (200 kV, 4.5 mA, 2.5 mm Al filtration, 35 cm focus-object distance (FOD) and a dose rate of 1.3 cGy/s). Exposure times were modified to take care of the total dose of X-rays administered to cell cultures in each of the tests carried out. In the MTT assay, annexin assay, cell cycle and GSH assay, cell cultures grown in microplates were irradiated to 20 Gy of X-rays Administered radiation doses were continuously monitored inside the X-ray cabinet and the final radiation dose was confirmed by means of thermoluminescent dosimeters.
2.7. Statistical Analysis
In the cell survival assay, an analysis of variance (ANOVA). of repeated means was performed, and this was complemented by the least significant difference (LSD) test. In this case, we modified the previous formula [18] to adapt the Magnitude of protection (MP) to cell survival: MP (%) = (Mirradiated control – Mirradiated treated / Mirradiated control) × 100, where M is the percentage of mortality with respect to non-irradiated control cells.
In the apoptosis and intracellular glutathione determinations, analysis of variance complemented by contrast analysis was used to assess the degree of correlation be-tween variables. Quantitative means were compared by regression and linear correlation analysis.
3. Results
3.1. Cytotoxicity Assay. MTT and XTT Assay
In all cell lines tested, the administration of CA (CCA) modified cell survival compared to the survival determined with respect to control cells (C) (p<0.01), showing a slight cytotoxicity of CA at the concentration tested when the cells were incubated for 48h. Similarly, in all cell lines, exposure to 20 Gy of X-rays (Ci) produced a significant decrease, of approximately 40%, in cell survival with respect to the control cells (C) which was a statistically significant difference (p <0.001) and portrayed the cytotoxic capacity of X-rays, expressing a cytotoxic damage of IR on these cells. Administration of CA to cell cultures before irradiation (CiCA) produced significant and different changes in each cell line studied. In the PNT2 cells, CiCA treatment produced a significant increase in cell survival (p < 0.001) with respect to the irradiated cells (Ci), which shows a cytoprotective capacity of CA against cytotoxic damage induced by x-rays. In these cells a MF of 97 ± 1.1% was established, which expresses a radioprotective capacity of CA, eliminating 67% of radiation-induced cell death (p<0.001), reaching levels of cell survival comparable to non-irradiated control samples.
On the contrary’s, the administration of CA to B16F10 cell cultures before irradiation (CiCA) produced a decrease in cell survival that was shown to be a statistically significant difference (p < 0.001) expressing an increase in cytotoxic damage induced by X-rays in the irradiated control group (Ci). In these cells, no protection factor was determined, which expresses an absence protective capacity of CA for these cells. On the contrary, a decrease in cell survival of 32.1 ± 3.5% was determined, expressing a radiosensitizing capacity of CA on B16F10 cells, increasing cell death by 2 time compared to irradiated cells (p< 0.001) (Figure 2).
In the Melan A and SK-MEL-1 cell lines, the administration of CA to cell cultures before irradiation (CiCA) does not show statistically significant differences with respect to the irradiated groups (Ci). This demonstrates the absence of a cytotoxic effect significant on these cells induced by CA that enhances the cytotoxic effect induced by IR. Although no radioprotective effect is observed in these cells
3.2. Apoptosis
In the non-tumor cell lines i.e. PNT2 and MELAN A, the administration of CA (CCA) to both cell lines, decreased apoptosis by between 30-60%, showing statistically significant differences with respect to their control groups (C) (p<0.001); while in the tumor lines (SK-MEL-1 and B16F10) it produced an increase in apoptosis in both cell lines reaching statistical significance only in the SK-MEL-1 cells (p<0.001) (Figure 3).Exposure to X-rays (Ci) was found to increase apoptosis in all cell lines tested (p<0.001), the increase observed was nearly six (6) fold in B16F10 cells, 2.3-fold in SK-MEL-1 cells, double (2-fold) in PNT2 cells, and rose by only 14% in MELAN A cells.
The administration of CA before exposure to X-rays (CiCA) produced a significant decrease in the percentage of apoptotic cells in PNT2 cells (p<0.001) where apoptosis decreases by more than 300%, even below the percentage expressed by non-irradiated control cells (C).In the other cell lines, the reduction in the percentage of apoptotic cells was much lower, 3% in MELAN A, 10% in SK-MEL-1 and 17% in B16F10, which did not reach statistical significance (Figure 4).
3.3. GSH Assay
The evaluation of total cellular GSH content showed statistically significant differences between the four cell lines studied. In the melanin-producing cells (MELAN A, SK-MEL-1 and B16F10) the amount of total glutathione determined in the non-irradiated cells (C) was significantly higher than that observed in PNT2 cells (p < 0.001). In B16F10 cells, the total glutathione concentration was more than twice what was measured in PNT2 cells (C) (p < 0.001) (Figure 5).
In the PNT2 cells, the administration of CA (CCA)produced a significant decrease in the total glutathione (p<0.001). Exposure to 20 Gy of X-rays (Ci) triggered a greater reduction in total glutathione (p < 0.001), which did not show any significant difference with the total glutathione observed in cells previously treated with CA before exposure to X-rays (CiCA) (Figure 5). These differences in total glutathione concentrations do not correlate with significant differences in the GSH/GSSH ratio, which may express a cellular capacity of the cells to eliminate damage caused by exposure to X-rays (Figure 6). In the melanin-producing cells (MELAN A, SK-MEL-1 and B16F10) the administration of CA (CCA) did not produce variations in total glutathione in B16F10 cells. However, it caused a decrease in glutathione content in MELAN A cells (p < 0.01) and an increase in SK-MEL-1 cells. Exposure to 20 Gy of X-rays (Ci) produced a reduction in total glutathione content (p < 0.001) in MELAN A cells while a significant increase of total glutathione was determined in SK-MEL-1 and B16F10 tumor cells (p < 0.001). However, the administration of CA before exposure to X-rays only produced a significant increase in total glutathione content in non-tumor cells, and barely attaining statistical significance in MELAN A cells (p < 0.001) (Figure 5). However, for these three cell lines (i.e. MELAN A, SK-MEL-1 and B16F10) exposure to X-rays produced a significant decrease in the GSH/GSSH ratio (Ci) (p<0.01) which expresses damage induced by ionizing radiation. Furthermore, in two melanoma cell lines (i.e. SK-MEL-1 and B16F10), the administration of CA before irradiation (CiCA) did not show differences in the GSH/GSSH ratio with respect to irradiated cells (Ci), an expression of absence of radioprotective effect of CA in these cells (Figure 6).
3.4. Ciclo Celular
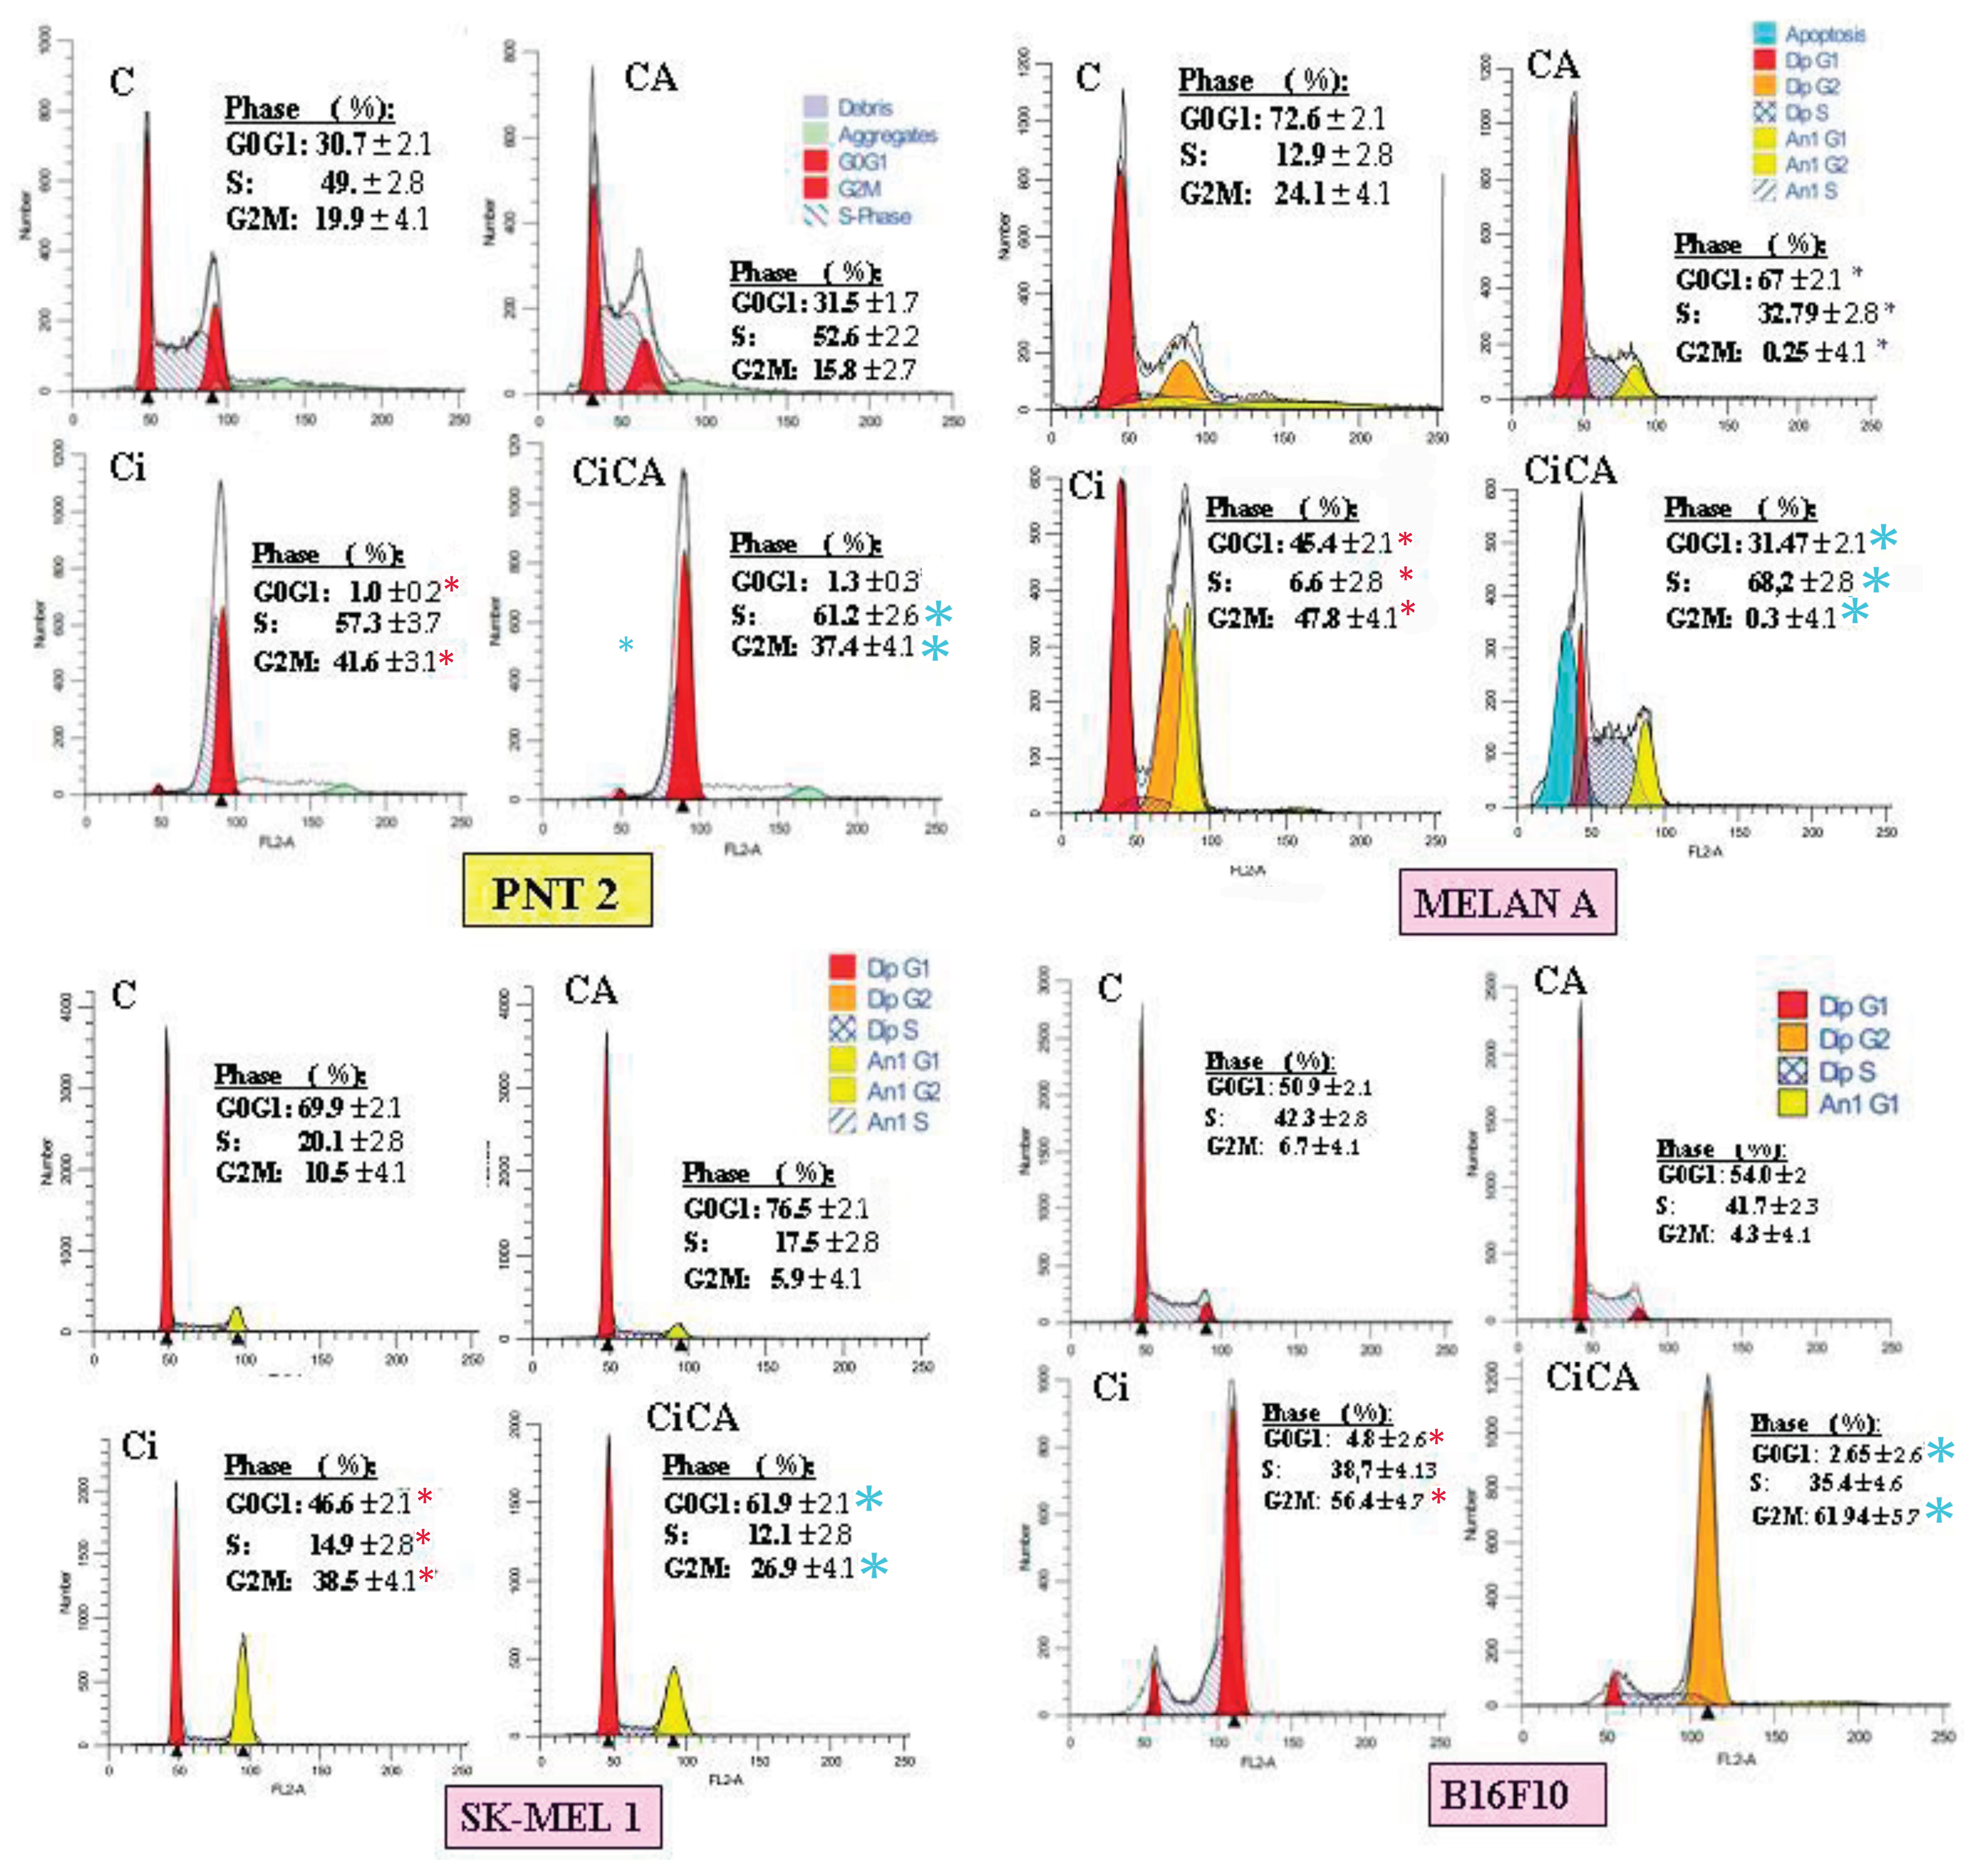
Exposure to X-rays (Ci) produces a significant increase in the percentage of cells in G2/M (p < 0.001) with a significant decrease in the G0/G1 phase (p < 0.001). This was accompanied by an increase in S phase of the PNT2 line (p < 0.001) and a reduction in the S phase in the melanin-producing cells (MELAN A, SK-MEL-1 and B16F10) (Figure 7). Administration of CA to PNT2 cells had no significant effect on non-irradiated cells (CCA) while in the irradiated cells (CiCA), it reduced the intensity of the damaging effect elicited by X-rays (p <0.001), which could be interpreted to mean a radioprotective effect. In addition, an increase in the population of cells in G1 phase was observed, which could indicate apoptosis.
In the SK-MEL-1 cells, CA administration decreased the G2M cells (p < 0.001) by increasing G0/G1 phase, which could be an expression of CA-induced cellular damage (CCA). In the irradiated cells, CA increased the cells in G0/G1 phase (p <0.001) while decreasing the G2/M phase which could be considered a protective effect of CA (CiCA) (p <0.001) (Figure 7).On the contrary, in the non-irradiated B16F10 cells, the administration of CA did not seem to have a significant effect (CCA); while in the irradiated cells (CiCA) it decreases the percentage of cells in G0/G1 phase of the cell cycle (p <0.01) with a concomitant increase in G2/M phase (p <0.01), so here, CA could be seen as a radiosensitizing agent.
In the MELAN A cells, the analysis was modelled manually considering the aneuploid populations present (model excluded debris and/or aggregates). Although the overall percentages of aneuploids and diploids were taken into account, the interpretation of the cell cycle results focused on the diploid population, as it is the most representative. In cells treated with the combination of irradiation and CA (CiCA), the apoptotic population was specifically modelled due to its relevance. In non-irradiated cells (CCA), a decrease in G0/G1phase was observed, accompanied by a significant reduction in G2/M phase and an increase in S phase cells (p < 0.001), which could express a damaging effect of CA on MELAN A cells. In the irradiated cells (Ci), the reduction in G0/G1phase cells was greater (p < 0.001) and there was a significant reduction in G2/M phase cell with an increase in S phase cells when CA is administered before irradiation (CiCA). This expresses a greater cellular damage than what was produced by IR alone. These results indicate a complex and markedly different behaviour from the PNT2 cells. CA alone (CCA) profoundly alters the cycle in MELAN A cells. In combination with irradiation, CA (CiCA) does not show a protective effect, but induces strong apoptosis and severely alters the cell cycle of decreasing the percentage of surviving cells (with massive accumulation in S phase (p < 0.001) and a block in G2/M phase (p < 0.01)). This suggests a potent cytotoxic and radiosensitizing effect of CA on the MELAN A cell line.
4. Discussion
CA has demonstrated significant radioprotective effects in various studies, which has been attributed to its antioxidant properties [11,13,14]. It has been reported to reduce the genotoxic and cytotoxic effects induced by ionizing radiation in various cell lines [9,13,14]. This radioprotective effect has been attributed to its ability to scavenge IR-induced free radicals [9,13,14]. However, we previously reported a paradoxical radiosensitizing effect of carnosic acid in metastatic melanoma B16F10 cells and proposed a mechanistic action for this radiosensitizing effect that could provide a novel treatment strategy [14]. In this work we examined the loss of the radioprotective capacity of CA in other cells and even the possible existence of a radiosensitizing effect in both normal and tumoral melanin-producing cells. Perhaps the analysis of these opposing effects could help clarify the mechanisms responsible for protecting healthy cells and simultaneously damaging neoplastic cells, thus achieving a desirable therapeutic strategy for cancer patients undergoing radiotherapy.
One of the parameters used to determine the cytotoxic effects induced by IR and different chemical substances is cell growth inhibition. In radiobiology, this is also known as cell survival assay [15,19]. In this study we used two assays to determine cell survival: the MTT assay for cell viability [9,10,16] and the Annexin V assay to determine apoptosis [11,14]. Several studies have reported that IR induces cytotoxic effects in PNT2 cells [9,10,16]. However, studies on the effect of CA on cell survival in PNT2 cells exposed to IR are very scarce [13,14]. Our study confirms a significant decrease in cell survival after exposure to 20 Gy of X-rays, and a significant increase in cell survival with prior administration of CA, indicating a high radioprotective capacity. This radioprotective capacity has been attributed to its ability to eliminate IR-induced free radicals [9,10,16]. Similarly, some previous studies have reported the cytotoxic effect of IR on B16F10 cells [9,10,16]. However, contrary to expectations, administering CA to B16F10 cells prior to irradiation resulted in a significant reduction in cell survival, indicating a radiosensitizing effect. This finding differs from the radioprotective effects of CA observed in other cell lines [9,10,14,16]. We have not sighted previous references on the effect of CA on cell survival in irradiated B16F10 cells [14]. However, various compounds have demonstrated antiproliferative effects, inhibiting cell growth and reducing metastatic invasion in vivo [20,21]. These effects are often enhanced when the compounds are administered prior to IR exposure [9,10]. Similarly, the combination of CA with other antitumor drugs presents an antiproliferative capacity in these B16F10 cells [22,23,24,25,26] showing that it inhibits adhesion and metastatic migration possibly due to the inhibition of the epithelial-mesenchymal transition (EMT) and the inactivation of AKT kinase [22,23,24,25]. We have not found previous references on the effect of IR on cell survival in MELAN A and SK-MEL-1 cells. Our results show a reduction in cell survival caused by IR similar to that determined in the other cell lines studied. We have also not found any references on the effect of CA on MELAN A and SK-MEL-1 cells. At the concentrations used in our study, CA produced a reduction in cell survival that is also similar in the four cell lines studied. However, in irradiated cells pretreated with CA, no radioprotective effect was observed in the two cancer cell lines, distinguishing them from normal prostate cells (PNT2). Although a reduction in cell survival was noted, it did not reach statistical significance. The extent of this loss of radioprotection on cell survival appears to vary in intensity, ranked from highest to lowest as follows: B16F10 < MELAN A = SK-MEL-1 < PNT2.
Cysteine and glutathione are the main intracellular antioxidants, capable of reducing oxidative stress by scavenging free radicals induced by IR [27,28,29]. Numerous studies have established the relationship of cell resistance to treatment with chemotherapeutic substances and IR with the amount of intracellular glutathione [12, 20, 21,27,28,29,30,31,32,33]. Our results shows that B16F10, SK-MEL-1 and MELAN A cells have a much higher total glutathione concentration than PNT2 cells, confirming previously reported results [12,14]. This large difference in the amount of total intracellular glutathione levels in normal melanocytes and melanoma cells could explain the higher resistance of these cells to ionizing radiation and some chemotherapy treatments [27-33]. In these cells, the administration of CA produced a decrease in the total concentration of GSH in the entire group of cells (Ci, CA, CiCA) compared to the control group (C). This could express the cytotoxic capacity of cells that received CA. However, a significant increase in the GSH/GSSH ratio was also determined in both irradiated and non-irradiated cells, which could explain part of its radioprotective capacity, confirming the hypothesis that it would act in a complementary or additive manner with intracellular endogenous glutathione [9,10,29,30]. References on the effect of CA administration on the total concentration of intracellular glutathione in MELAN A and SK-MEL-1 cells are not available. In previous studies, it was established that the administration of CA to B16F10 cells failed to modify the amount of total glutathione or the GSH/GSSG ratio [14]. However, prior administration of CA before X-ray exposure produced a significant decrease in the GSH/GSSG ratio similar to that of irradiated cells. This shows a reduction in the reduced glutathione available to scavenge free radicals and is related to the increase in IR-induced oxidative stress; expressing an increase in IR-induced damage [12,14]. In the other two cell lines i.e. MELAN A and SK-MEL-1, CA administration produced a similar response, leading to a significant decrease in the GSH/GSSG ratio, unlike the response observed in normal PNT2 cells. The degree of reduction in the GSH/GSSG ratio varies in intensity and can be ranked from lowest to highest as follows: B16F10 = MELAN A = SK-MEL-1 < PNT2. To date, we have not identified any studies that report the effect of CA on apoptosis in the cell lines used in this study. It has been reported that CA can increases apoptosis in different cell lines by inducing the expression of caspases 3, 8 and 9 and affecting the Akt/mTOR pathway [26,31,32]. In our study, CA decreased the percentage of apoptotic cells in non-tumor cell lines (PNT2 and MELAN A), did not modify the percentage of apoptosis in B16F10 and induced an increase in apoptotic cells in SK-MEL-1 tumor cells. However, prior administration of CA before X-ray exposure only reduced the percentage of apoptotic cells in PNT2 cells, with no significant differences observed in melanin-producing cell lines. The increase in cellular apoptosis varies in magnitude and can be ranked by intensity from highest to lowest as follows: PNT2 >B16F10 = MELAN A = SK-MEL-1
In our study, exposure to X-rays produced characteristic changes in the cell cycle events such as an increase in the percentage of cells in G2/M as the most frequent alteration, both in human and murine cell lines, This is associated with the activation of p53 and p21, as well as alterations in the levels of Cyclin A and cyclin B1 [37-39]. Following radiation exposure, the proportion of cells in the G0/G1 phase either de-creased or remained unchanged, and this was generally accompanied by a reduction in the S phase population [37-39]. Our results show these modifications in all irradiated cell lines, although we have determined differences in the S phase where the number of cells is similar in B16F10 cells, is reduced in MELAN A and SK-MEL-1 cells and only increases in PNT2 cells.
CA significantly reduced the G2/M phase of the cell cycle in several tumor cells, including Caco-2, HT-29, LoVo, and B16F10 [36-38]. This arrest prevents cells from entering mitosis, allowing for the activation of repair mechanisms or, in cases of irreparable damage, the induction of apoptosis. In some cellular contexts, CA induces G0/G1 arrest, associated with the overexpression of cyclin-dependent kinase inhibitors such as p21, which blocks progression to the S phase and DNA replication [38]. CA promotes the accumulation of cells in the sub-G1 phase, a marker of DNA frag-mentation and apoptosis. This effect is dose-dependent and is associated with the activation of caspases and the cleavage of PARP [29,31].
We have not found any references reporting on the effect of CA administered before X-ray exposure in these cell lines. In our study on PNT2 cells, CA administration showed no effect on the irradiated cells. However, CA increased radiation-induced damage in B16F10 and MELAN A cells, while reducing radiation-induced effects in SK-MEL-1 cells.
In exploring the possible explanation for the radiosensitizing effect of CA on melanoma cells, we found that the affected cells shared a common characteristic—the ability to produce melanin. In both normal and tumoral melanocytes, cysteine participates in the pheomelanin formation pathway in melanogenesis [26]. It has been reported that increased intracellular cysteine or glutathione concentrations activates the pheomelanin synthetic pathway to the detriment of other cellular activities [26,27,31]. In our study, the radiosensitizing effect mediated by a decrease in the GSH/GSSG ratio produced by CA could be due to the sum of different factors. CA could, as previously described for caffeic and rosmarinic acids [10,12,14,31,40-42], induce the activation of melanogenesis through the pheomelanin pathway, causing a decrease in intracellular GSH levels and therefore cannot be used to scavenge ROS induced by IR. Furthermore, in B16F10 cells, reduced superoxide dismutase activity has been reported, which may lead to decreased levels of intracellular reduced glutathione [25,31,32,43]. Additionally, CA may exert an inhibitory effect on enzymes such as glucose-6-phosphate dehydrogenase and glutathione reductase [43], as well as glutathione S-transferase—an effect observed with other diterpenes [43, 44]. This inhibition could lower intracellular NADPH levels, thereby diminishing the cell’s ability to regenerate reduced glutathione from its oxidized form [12,14]. CA could benefit from these conditions to enhance its effect on tumor cells and, like other alkylating agents and platinum-containing compounds, it would probably act better on cells located in acidic tumor beds [45,46]. Possibly the intensity of these effects could explain why the radiosensitizing effect was more pronounced in B16F10 cells. However, the loss of the radioprotective capacity of CA was observed in the three cell lines studied, whether tumoral or non-tumorous. Further studies are clearly needed to validate these findings and to gain a deeper understanding of the radiosensitizing potential of CA and its interaction with ionizing radiation-induced ROS. This should include assessments using various assays such as DPPH, iron-reducing antioxidant power, nitro blue tetrazolium (NBT) reduction, and ROS quantification, as well as the evaluation of detoxifying enzyme activities, including superoxide dismutase (SOD) and glutathione peroxidases (GPx).
In short, the synergy between cisplatin and other chemotherapeutics combined with IR in melanoma is similar to the effect of CA combined with IR [47]: both enhance tumor damage, modify apoptosis and arrest the cell cycle at critical phases, hindering DNA repair and promoting cell death. However, carnosic acid adds greater selectivity, since it protects normal cells while sensitizing melanin-producing cells, representing a relevant therapeutic advantage.
5. Conclusions
CA is an antioxidant compound with a significant radioprotective capacity. However, in melanin-producing cells (MELAN A and SK-MEL-1) it loses this radioprotective capacity or may even produce a paradoxical effect by becoming a radiosensitizing agent significantly reducing cell survival (B16F10). Knowing the mechanisms of action of substances such as CA could help create potential new applications that allow the protection of healthy cells while exclusively damaging neoplastic cells, thus presenting a new desirable strategy for cancer patients who need to undergo radiotherapy.
Author Contributions
Author Contributions: Conceptualization, A.-O., D.G.-A. and M.-A.; Data curation, A.-O., D.G.-A., M.; I.-F., J.-G. and, A.-M and M.-A.; Formal analysis, I.-F., M.-A., A.-M., J.-G., MR.-T. and M.-A.; Funding acquisition, M.-A.; Investigation, A.-O., M.A.-S., D.G.-A., MR.-T. and M.-A.; Methodology, M.-A.; Project administration, A.-O., and M.-A.; Resources, A.-O., I.-F., J.-G and M.-A.; Supervision, M.-A.; Validation, M.-A. and I.-F; Visualization, A.-O., I.-F., M.-A., MR.-T. and, A.-M and M.-A.; Writing— original draft, D.G.-A, and M.-A.; Writing—review and editing, D.G.-A., and M.-A. All authors have read and agreed to the published version of the manuscript.
Funding
This research was funded by the National Spanish R&D Programme CENIT of the Spanish Ministry of Science and Technology named “Industrial Research and Experimental Development of Intelligent Foods (Acronym: SMARTFOODS).
Institutional Review Board Statement
The study were approved by Comité de Bioseguridad en experimentación de la Universidad de Murcia (ID:472/2021), the Ethical Committee of the University of Murcia (CECA:510/2018) and Government of the Autonomous Community of the Region of Murcia (Spain) (Nº A13211208).
Conflicts of Interest
The authors declare no conflict of interest.
References
- Garbe, C.; Keim, U.; Gandini, S.; Amaral, T.; Katalinic, A.; Hollezcek, B.; Martus, P.; Flatz, L.; Leiter, U.; Whiteman, D. Epidemiology of cutaneous melanoma and keratinocyte cancer in white populations 1943–2036. Eur. J. Cancer 2021, 152, 18–25. [Google Scholar] [CrossRef]
- Rastrelli, M.; Tropea, S.; Rossi, C.R.; Alaibac, M. Melanoma: epidemiology, risk factors, pathogenesis, diagnosis and classification. In Vivo 2014, 28, 1005–1011. [Google Scholar]
- Demierre, M.F. Epidemiology and prevention of cutaneous melanoma. Curr. Treat. Options Oncol. 2006, 7, 181–186. [Google Scholar] [CrossRef]
- Sun, Y.; Shen, Y.; Liu, Q.; Zhang, H.; Jia, L.; Chai, Y.; Jiang, H.; Wu, M.; Li, Y. Global trends in melanoma burden: A comprehensive analysis from the Global Burden of Disease Study, 1990–2021. J. Am. Acad. Dermatol. 2025, 92, 100–107. [Google Scholar] [CrossRef]
- Martínez, C.; Yáñez, J.; Vicente, V.; Alcaraz, M.; Benavente-García, O.; Castillo, J.; Lorente, J.; Lozano, J.A. Effects of several polyhydroxylated flavonoids on the growth of B16F10 melanoma and Melan-a melanocyte cell lines: influence of the sequential oxidation state of the flavonoid skeleton. Melanoma Res. 2003, 13, 3–9. [Google Scholar] [CrossRef]
- Cordeiro, M.F.; Marmitt, L.P.; Horn, A.P. Subcutaneous injection of multipotent mesenchymal stromal cells admixed with melanoma cells in mice favors tumor incidence and growth: a systematic review and meta-analysis. Arch. Dermatol. Res. 2018, 310, 231–240. [Google Scholar] [CrossRef]
- Stevens, G.; McKay, M.J. Dispelling the myths surrounding radiotherapy for treatment of cutaneous melanoma. Lancet Oncol. 2006, 7, 575–583. [Google Scholar] [CrossRef] [PubMed]
- Min, Y.; Roche, K.; Tian, S.; Eblan, M.J.; McKinnon, K.P.; Caster, J.M.; Chai, S.; Herring, L.E.; Zhang, L.; Zhang, T.; DeSimone, J.M.; Tepper, J.E.; Vincent, B.G.; Serody, J.S.; Wang, A.Z. Antigen-capturing nanoparticles improve the abscopal effect and cancer immunotherapy. Nat. Nanotechnol. 2017, 12, 877–882. [Google Scholar] [CrossRef]
- Alcaraz, M.; Achel, D.G.; Olivares, A.; Olmos, E.; Alcaraz-Saura, M.; Castillo, J. Carnosol, radiation and melanoma: a translational possibility. Clin. Transl. Oncol. 2013, 15, 712–719. [Google Scholar] [CrossRef] [PubMed]
- Alcaraz, M.; Alcaraz-Saura, M.; Achel, D.G.; Olivares, A.; López-Morata, J.A.; Castillo, J. Radiosensitizing effect of rosmarinic acid in metastatic melanoma B16F10 cells. Anticancer Res. 2014, 34, 1913–1921. [Google Scholar] [PubMed]
- Olivares, A.; Alcaraz-Saura, M.; Achel, D.G.; Berná-Mestre, J. de D.; Alcaraz, M. Radiation-induced bystander effect: Loss of radioprotective capacity of rosmarinic acid in vivo and in vitro. Antioxidants 2021, 10. [Google Scholar] [CrossRef]
- Olivares, A.; Alcaraz-Saura, M.; Achel, D.G.; Alcaraz, M. Effect of rosmarinic acid and ionizing radiation on glutathione in melanoma B16F10 cells: A translational opportunity. Antioxidants 2020, 9. [Google Scholar] [CrossRef]
- Achel, D.G.; Alcaraz-Saura, M.; Castillo, J.; Olivares, A.; Alcaraz, M. Radioprotective and antimutagenic effects of Pycnanthus angolensis Warb seed extract against damage induced by X-rays. J. Clin. Med. 2019, 9, 1612. [Google Scholar] [CrossRef]
- Alcaraz, M.; Olivares, A.; Andreu-Gálvez, M.; Achel, D.G.; Mercado, A.M.; Alcaraz-Saura, M. Paradoxical radiosensitizing effect of carnosic acid on B16F10 metastatic melanoma cells: A new treatment strategy. Antioxidants 2022, 11, 2166. [Google Scholar] [CrossRef] [PubMed]
- Hall, E.J. Radiobiology for the Radiologist, 2nd ed.; Harper & Row: Philadelphia, PA, USA, 1978; pp. 93–110. [Google Scholar]
- Yáñez, J.; Vicente, V.; Alcaraz, M.; Castillo, J.; Benavente-García, O.; Canteras, M.; Teruel, J.A.L. Cytotoxicity and antiproliferative activities of several phenolic compounds against three melanocyte cell lines: Relationship between structure and activity. Nutr. Cancer 2004, 49, 191–199. [Google Scholar] [CrossRef]
- Bradford, M.M. A rapid and sensitive method for the quantitation of microgram quantities of protein utilizing the principle of protein-dye binding. Anal. Biochem. 1976, 72, 248–254. [Google Scholar] [CrossRef]
- Sarma, L.; Kesavan, P.C. Protective effects of vitamins C and E against γ-ray-induced chromosomal damage in mouse. Int. J. Radiat. Biol. 1993, 63, 759–764. [Google Scholar] [CrossRef]
- International Atomic Energy Agency. Cytogenetic Dosimetry: Applications in Preparedness for and Response to Radiation Emergencies; IAEA: Vienna, Austria, 2011; pp. 1–247. [Google Scholar]
- Tagde, A.; Singh, H.; Kang, M.H.; Reynolds, C.P. The glutathione synthesis inhibitor buthionine sulfoximine synergistically enhanced melphalan activity against preclinical models of multiple myeloma. Blood Cancer J. 2014, 4, e229. [Google Scholar] [CrossRef] [PubMed]
- Clark, E.P.; Epp, E.R.; Biaglow, J.E.; Morse-Gaudio, M.; Zachgo, E. Glutathione depletion, radiosensitization, and misonidazole potentiation in hypoxic Chinese hamster ovary cells by buthionine sulfoximine. Radiat. Res. 1984, 98, 370–380. [Google Scholar] [CrossRef]
- Lin, K.-I.; Lin, C.-C.; Kuo, S.-M.; Lai, J.-C.; Wang, Y.-Q.; You, H.-L.; Hsu, M.-L.; Chen, C.-H.; Shiu, L.-Y. Carnosic acid impedes cell growth and enhances anticancer effects of carmustine and lomustine in melanoma. Biosci. Rep. 2018, 38, BSR20171092. [Google Scholar] [CrossRef] [PubMed]
- Arakawa, N.; Okubo, A.; Yasuhira, S.; Takahashi, K.; Amano, H.; Akasaka, T.; Masuda, T.; Shibazaki, M.; Maesawa, C. Carnosic acid, an inducer of NAD(P)H quinone oxidoreductase 1, enhances the cytotoxicity of β-lapachone in melanoma cell lines. Oncol. Lett. 2018, 15, 2393–2400. [Google Scholar] [CrossRef] [PubMed]
- Masuda, T.; Inaba, Y.; Takeda, Y. Antioxidant mechanism of carnosic acid: structural identification of two oxidation products. J. Agric. Food Chem. 2001, 49, 5560–5565. [Google Scholar] [CrossRef] [PubMed]
- Huang, S.-C.; Ho, C.-T.; Lin-Shiau, S.-Y.; Lin, J.-K. Carnosol inhibits the invasion of B16/F10 mouse melanoma cells by suppressing metalloproteinase-9 through down-regulating nuclear factor-kappa B and c-Jun. Biochem. Pharmacol. 2005, 69, 221–232. [Google Scholar] [CrossRef] [PubMed]
- Patwardhan, R.S.; Sharma, D.; Checker, R.; Thoh, M.; Sandur, S.K. Spatio-temporal changes in glutathione and thioredoxin redox couples during ionizing radiation-induced oxidative stress regulate tumor radio-resistance. Free Radic. Res. 2015, 49, 1218–1232. [Google Scholar] [CrossRef] [PubMed]
- del Marmol, V.; Ito, S.; Bouchard, B.; Libert, A.; Wakamatsu, K.; Ghanem, G.; Solano, F. Cysteine deprivation promotes eumelanogenesis in human melanoma cells. J. Investig. Dermatol. 1996, 107, 698–702. [Google Scholar] [CrossRef] [PubMed]
- Palomares, T.; Alonso-Varona, A.; Alvarez, A.; Castro, B.; Calle, Y.; Bilbao, P. Interleukin-2 increases intracellular glutathione levels and reverses the growth-inhibiting effects of cyclophosphamide on B16 melanoma cells. Clin. Exp. Metastasis 1997, 15, 329–337. [Google Scholar] [CrossRef]
- Rodman, S.N.; Spence, J.M.; Ronnfeldt, T.J.; Zhu, Y.; Solst, S.R.; O’Neill, R.A.; Allen, B.G.; Guan, X.; Spitz, D.R.; Fath, M.A. Enhancement of radiation response in breast cancer stem cells by inhibition of thioredoxin- and glutathione-dependent metabolism. Radiat. Res. 2016, 186, 385–395. [Google Scholar] [CrossRef]
- Soobrattee, M.A.; Neergheen, V.S.; Luximon-Ramma, A. Phenolics as potential antioxidant therapeutic agents: mechanism and actions. Mutat. Res. 2005, 579, 200–213. [Google Scholar] [CrossRef]
- Moore, J.; Yousef, M.; Tsiani, E. Anticancer effects of rosemary (Rosmarinus officinalis L.) extract and rosemary extract polyphenols. Nutrients 2016, 11, 731. [Google Scholar] [CrossRef]
- El-Huneidi, W.; Bajbouj, K.; Muhammad, J.S.; Vinod, A.; Shafarin, J.; Khoder, G.; Saleh, M.A.; Taneera, J.; Abu-Gharbieh, E. Carnosic acid cooperates with tamoxifen to induce apoptosis associated with caspase-3 activation in breast cancer cells in vitro and in vivo. Pharmaceuticals (Basel) 2021, 14, 230. [Google Scholar] [CrossRef]
- Kinnaert, E.; Duez, P.; Morandini, R.; Dubois, J.; Van Houtte, P.; Ghanem, G. Cysteine but not glutathione modulates the radiosensitivity of human melanoma cells by affecting both survival and DNA damage. Pigment Cell Res. 2004, 17, 275–280. [Google Scholar] [CrossRef] [PubMed]
- Lonati, L.; Barbieri, S.; Guardamagna, I.; Ottolenghi, A.; Baiocco, G. Radiation-induced cell cycle perturbations: A computational tool validated with flow-cytometry data. Sci. Rep. 2020, 10, 22230. [Google Scholar] [CrossRef]
- Lei, L.; Story, M.; Legerski, R.J. Cellular responses to ionizing radiation damage. Int. J. Radiat. Oncol. Biol. Phys. 2001, 49, 1157–1162. [Google Scholar] [CrossRef]
- Li, M.; You, L.; Xue, J.; Lu, Y. Ionizing radiation-induced cellular senescence in normal, non-transformed cells and the involved DNA damage response: A mini review. Front. Pharmacol. 2018, 9, 522. [Google Scholar] [CrossRef]
- Tang, J.-F.; Li, G.-L.; Zhang, T.; Du, Y.-M.; Huang, S.-Y.; Ran, J.-H.; Li, J.; Chen, D.-L. Homoharringtonine inhibits melanoma cell proliferation in vitro and in vivo by inducing DNA damage, apoptosis, and G2/M cell cycle arrest. Arch. Biochem. Biophys. 2021, 708, 108774. [Google Scholar] [CrossRef]
- Visanji, J.M.; et al. Induction of G2/M phase cell cycle arrest by carnosol and carnosic acid is associated with alteration of cyclin A and cyclin B1 levels. Cancer Lett. 2006, 239, 157–166. [Google Scholar] [CrossRef] [PubMed]
- Wu, G.; Xiu, H.; Luo, H.; Ding, Y.; Li, Y. A mathematical model for cell cycle control: graded response or quantized response. Cell Cycle 2022, 21, 735–744. [Google Scholar] [CrossRef]
- Chao, H.-H.; Karagounis, I.V.; Thomas, C.; François, N.B.; Facciabene, A.; Koumenis, C.; Maity, A. Combination of CHEK1/2 inhibition and ionizing radiation results in abscopal tumor response through increased micronuclei formation. Oncogene 2020, 39, 4344–4357. [Google Scholar] [CrossRef]
- Aruoma, O.I.; Halliwell, B.; Aeschbach, R.; Löligers, J. Antioxidant and pro-oxidant properties of active rosemary constituents: carnosol and carnosic acid. Xenobiotica 1992, 22, 257–268. [Google Scholar] [CrossRef]
- Kudugunti, S.K.; Vad, N.M.; Ekogbo, E.; Moridani, M.Y. Efficacy of caffeic acid phenethyl ester (CAPE) in skin B16-F0 melanoma tumor-bearing C57BL/6 mice. Invest. New Drugs 2011, 29, 52–62. [Google Scholar] [CrossRef] [PubMed]
- Tandogan, B.; Kuruüzüm-Uz, A.; Sengezer, C.; Güvenalp, Z.; Demirezer, L.Ö.; Ulusu, N.N. In vitro effects of rosmarinic acid on glutathione reductase and glucose-6-phosphate dehydrogenase. Pharm. Biol. 2011, 49, 587–594. [Google Scholar] [CrossRef] [PubMed]
- Gülçin, İ.; Scozzafava, A.; Supuran, C.T.; Koksal, Z.; Turkan, F.; Çetinkaya, S.; Bingöl, Z.; Huyut, Z.; Alwasel, S.H. Rosmarinic acid inhibits some metabolic enzymes including glutathione S-transferase, lactoperoxidase, acetylcholinesterase, butyrylcholinesterase and carbonic anhydrase isoenzymes. J. Enzyme Inhib. Med. Chem. 2016, 31, 1698–1702. [Google Scholar] [CrossRef]
- Martínez-Zaguilán, R.; Seftor, E.A.; Seftor, R.E.; Chu, Y.W.; Gillies, R.J.; Hendrix, M.J. Acidic pH enhances the invasive behavior of human melanoma cells. Clin. Exp. Metastasis 1996, 14, 176–186. [Google Scholar] [CrossRef]
- Wahl, M.L.; Owen, J.A.; Burd, R.; Herlands, R.A.; Nogami, S.S.; Rodeck, U.; Berd, D.; Leeper, D.B.; Owen, C.S. Regulation of intracellular pH in human melanoma: potential therapeutic implications. Mol. Cancer Ther. 2002, 1, 617–628. [Google Scholar] [PubMed]
- Arienti, C.; Zoli, W.; Pignatta, S.; Carloni, S.; Paganelli, G.; Ulivi, P.; Romeo, A.; Menghi, E.; Sarnelli, A.; Medri, L.; Polico, R.; Silvestrini, R.; Tesei, A. Efficacy of different sequences of radio- and chemotherapy in experimental models of human melanoma. J. Cell. Physiol. 2014, 229, 1548–1556. [Google Scholar] [CrossRef] [PubMed]
Figure 1.
Chemical structure of carnosic acid [14].
Figure 1.
Chemical structure of carnosic acid [14].
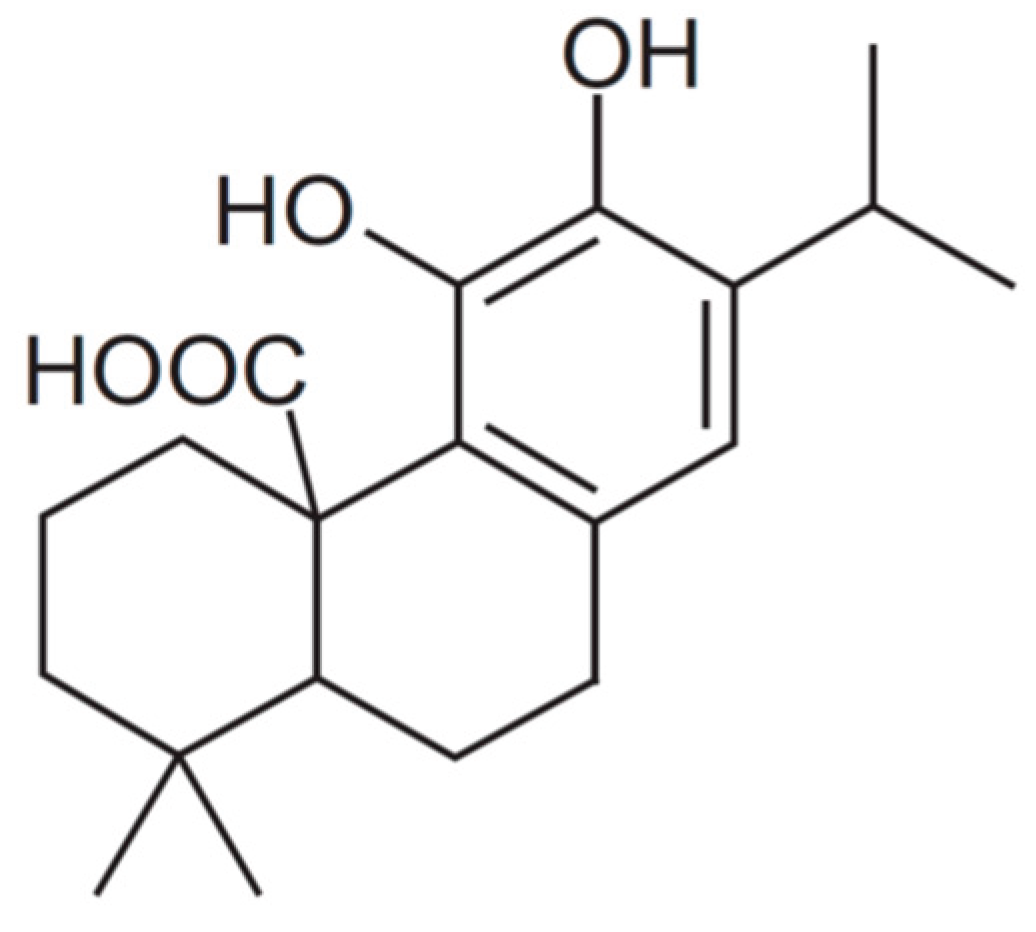
Figure 2.
MTT and XXT assay: Cell survival curves derived for all the cell lines (groups) studied: PNT2, MELAN A, SK-MEL-1 and B16F10 (C, control; CCA, treated with carnosic acid; Ci, irradiated control; CiCA, Cells were treated with CA before irradiation)) ((1): p < 0.001 versus C; (2): p < 0.01 versus C; (3) p < 0.001 versus Ci). Data are mean ± SE of six independent experiments.
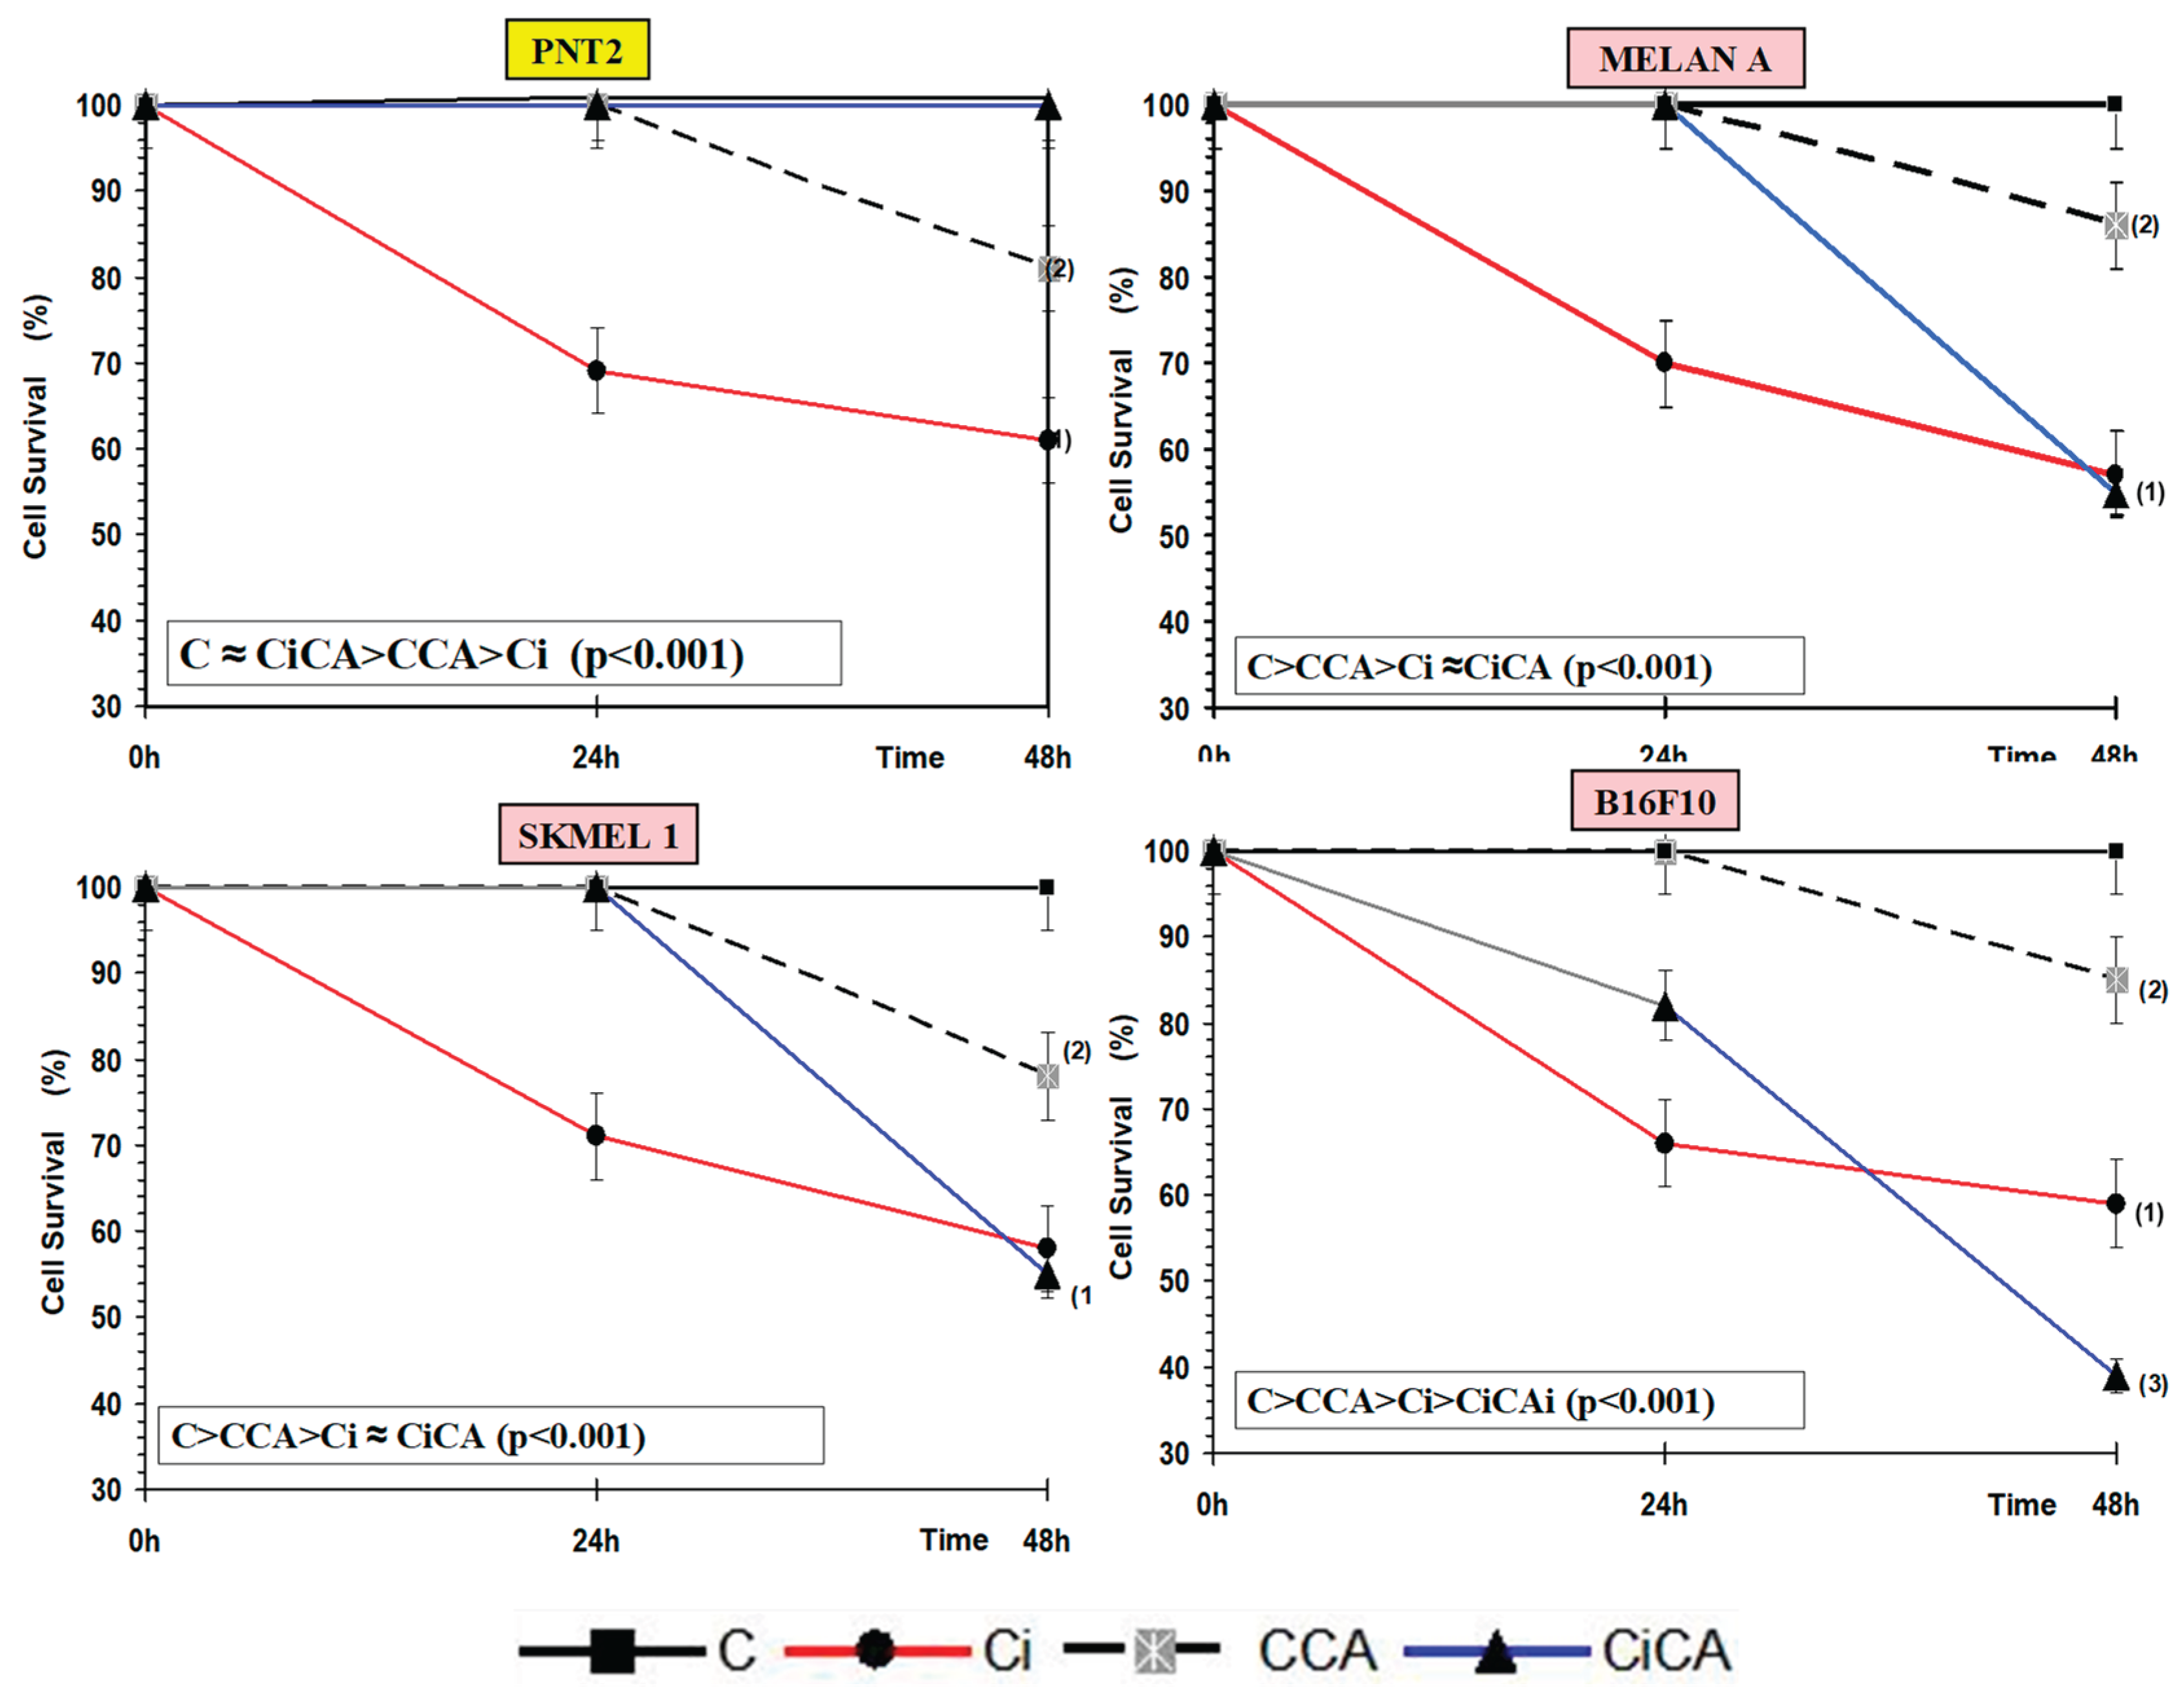
Figure 3.
Percentage of PNT2, MELAN A, SK-MEL-1 and B16F10 cells in apoptosis 48h after exposure to 20 Gy of X-rays (C, control; CCA, treated with carnosic acid; Ci, irradiated control; CiCA, cells were treated with CA before irradiation) ((1) p < 0.001 versus C; (2) p < 0.01 versus C; (3) p < 0.001 versus C; (4) p <. 0.001 versus Ci). Data are mean ± SE of six independent experiments.
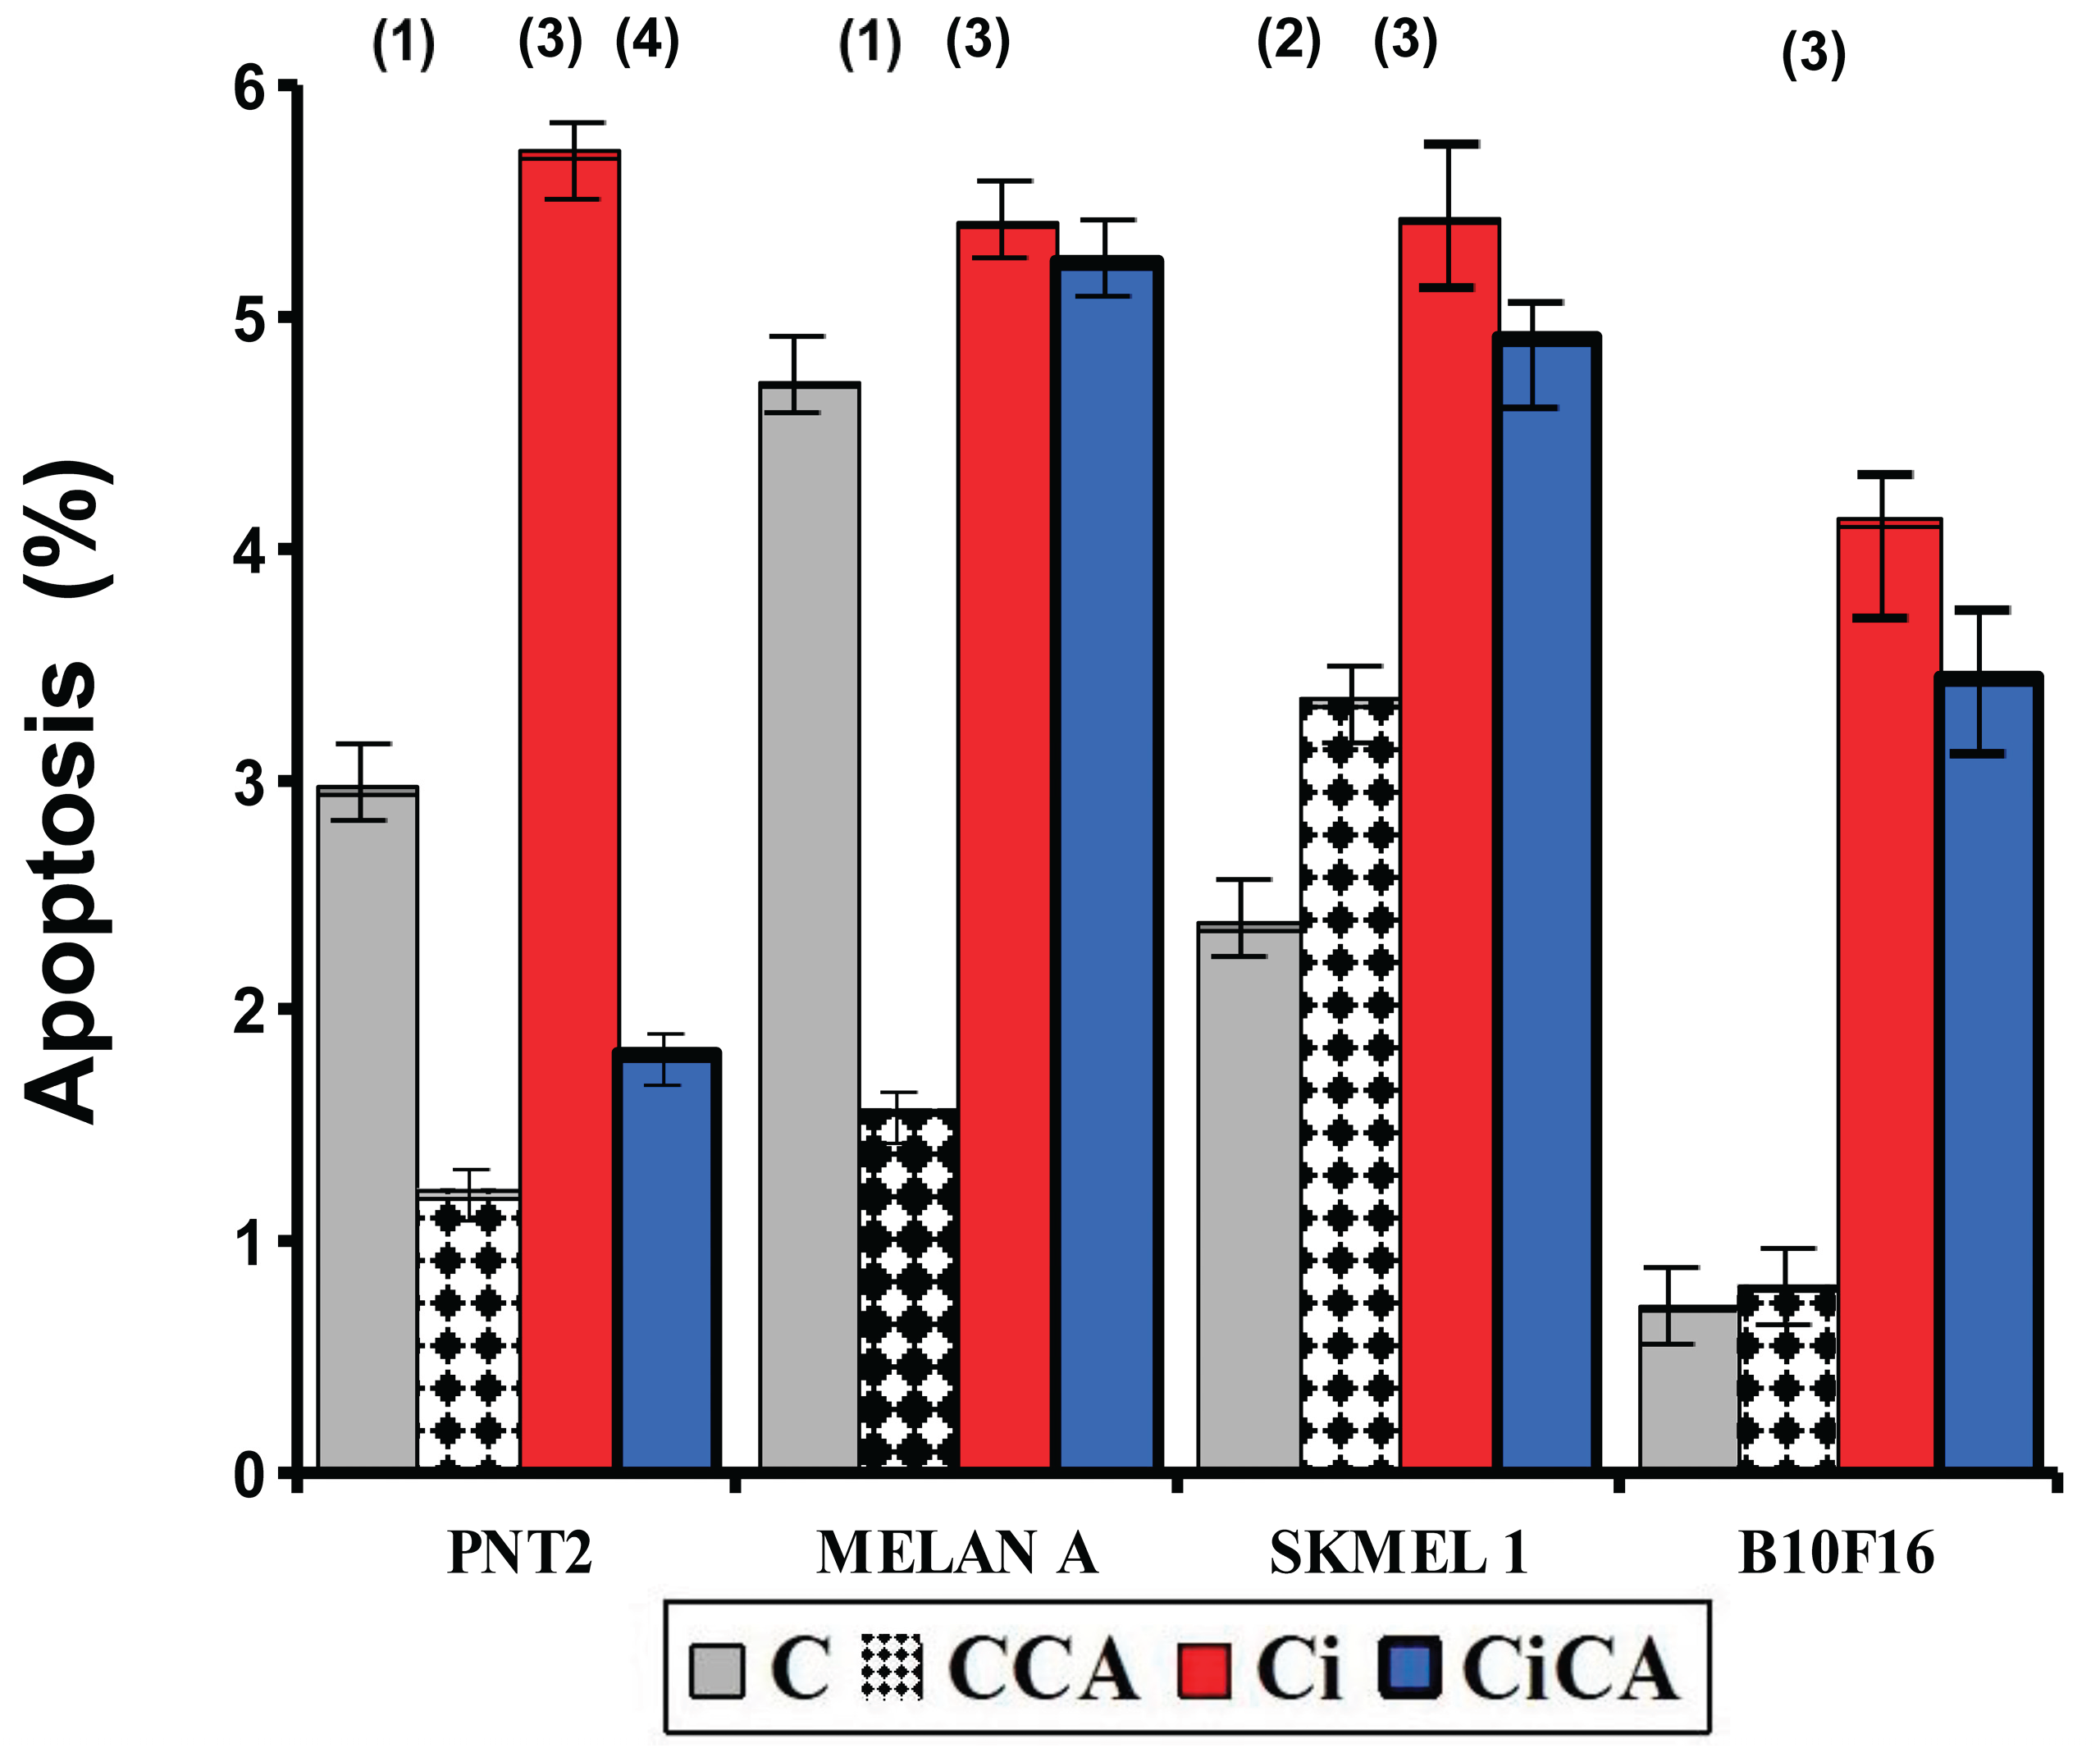
Figure 4.
Percentage of PNT2, MELAN A, SK-MEL-1 and B16F10 cells in apoptosis 48h after exposure to 20 Gy of X-rays in irradiated cells (Ci) and in irradiated cells treated with CA before the irradiation with rays X (CiCA) ((1) p < 0.001 versus C; (2) p < 0.01 versus C; (3) p < 0.001 versus C irradiated (4) p <. 0.001 versus Ci). Data are mean ± SE of six independent experiments.
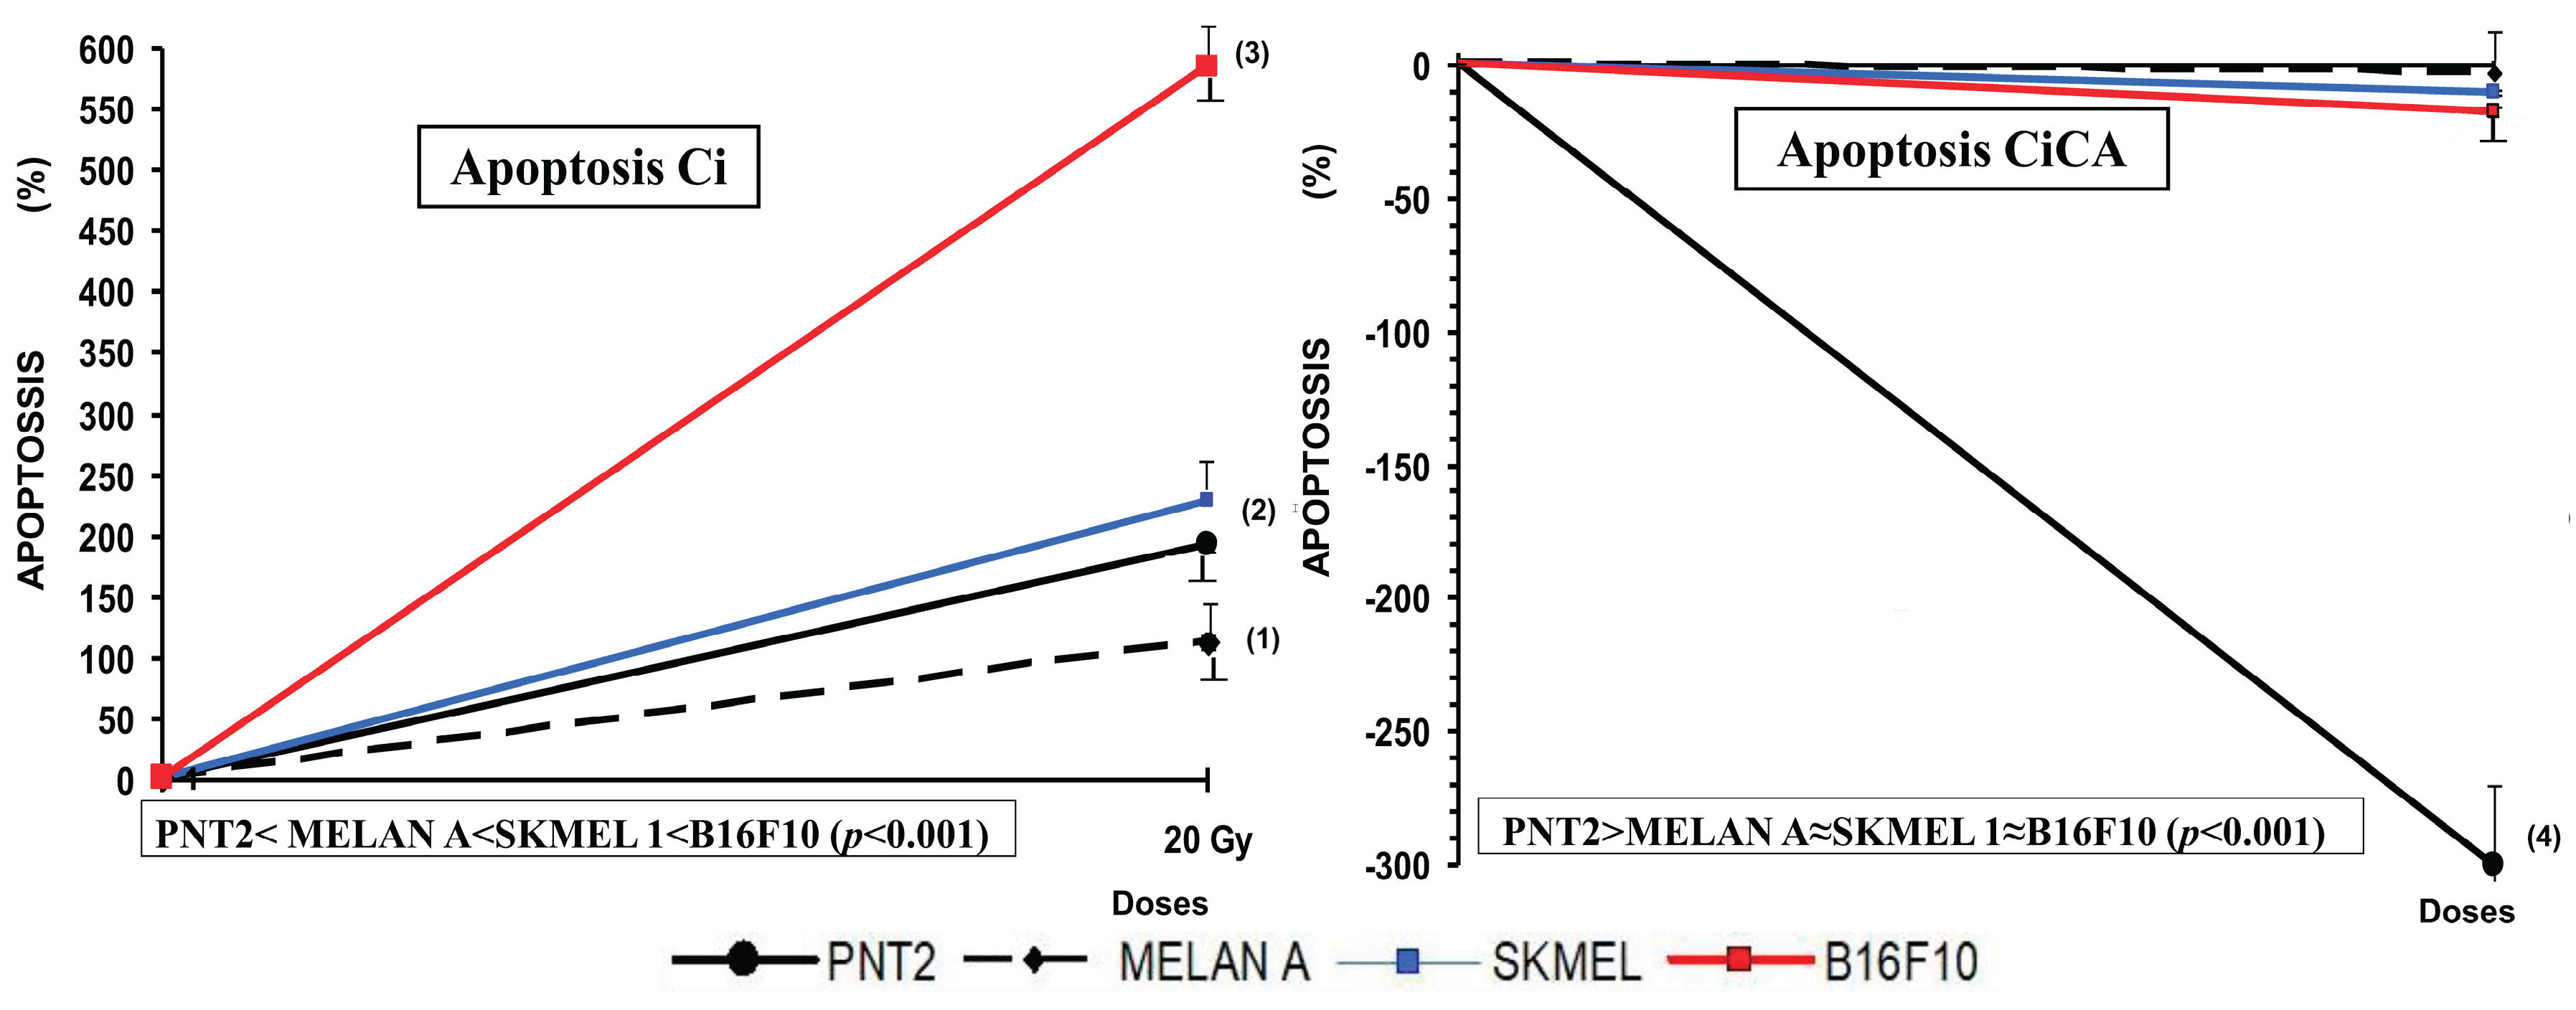
Figure 5.
Total glutathione concentrations of the different groups studied (C, control; CCA, treated with carnosic acid; Ci, irradiated control; CiCA, Cells were treated with CA before irradiation) ((1)p < 0.001 versus PNT2 control (C); (2) p < 0.001 versus PNT2 control (C);(3) p < 0.001; (4) p < 0.001 versus SK-MEL-1 control (C); (5) p < 0.001 versus control cells, respectively (C); (6) p < 0.001 versus MELAN control irradiated (Ci)). Data are mean ± SE of six independent experiments.
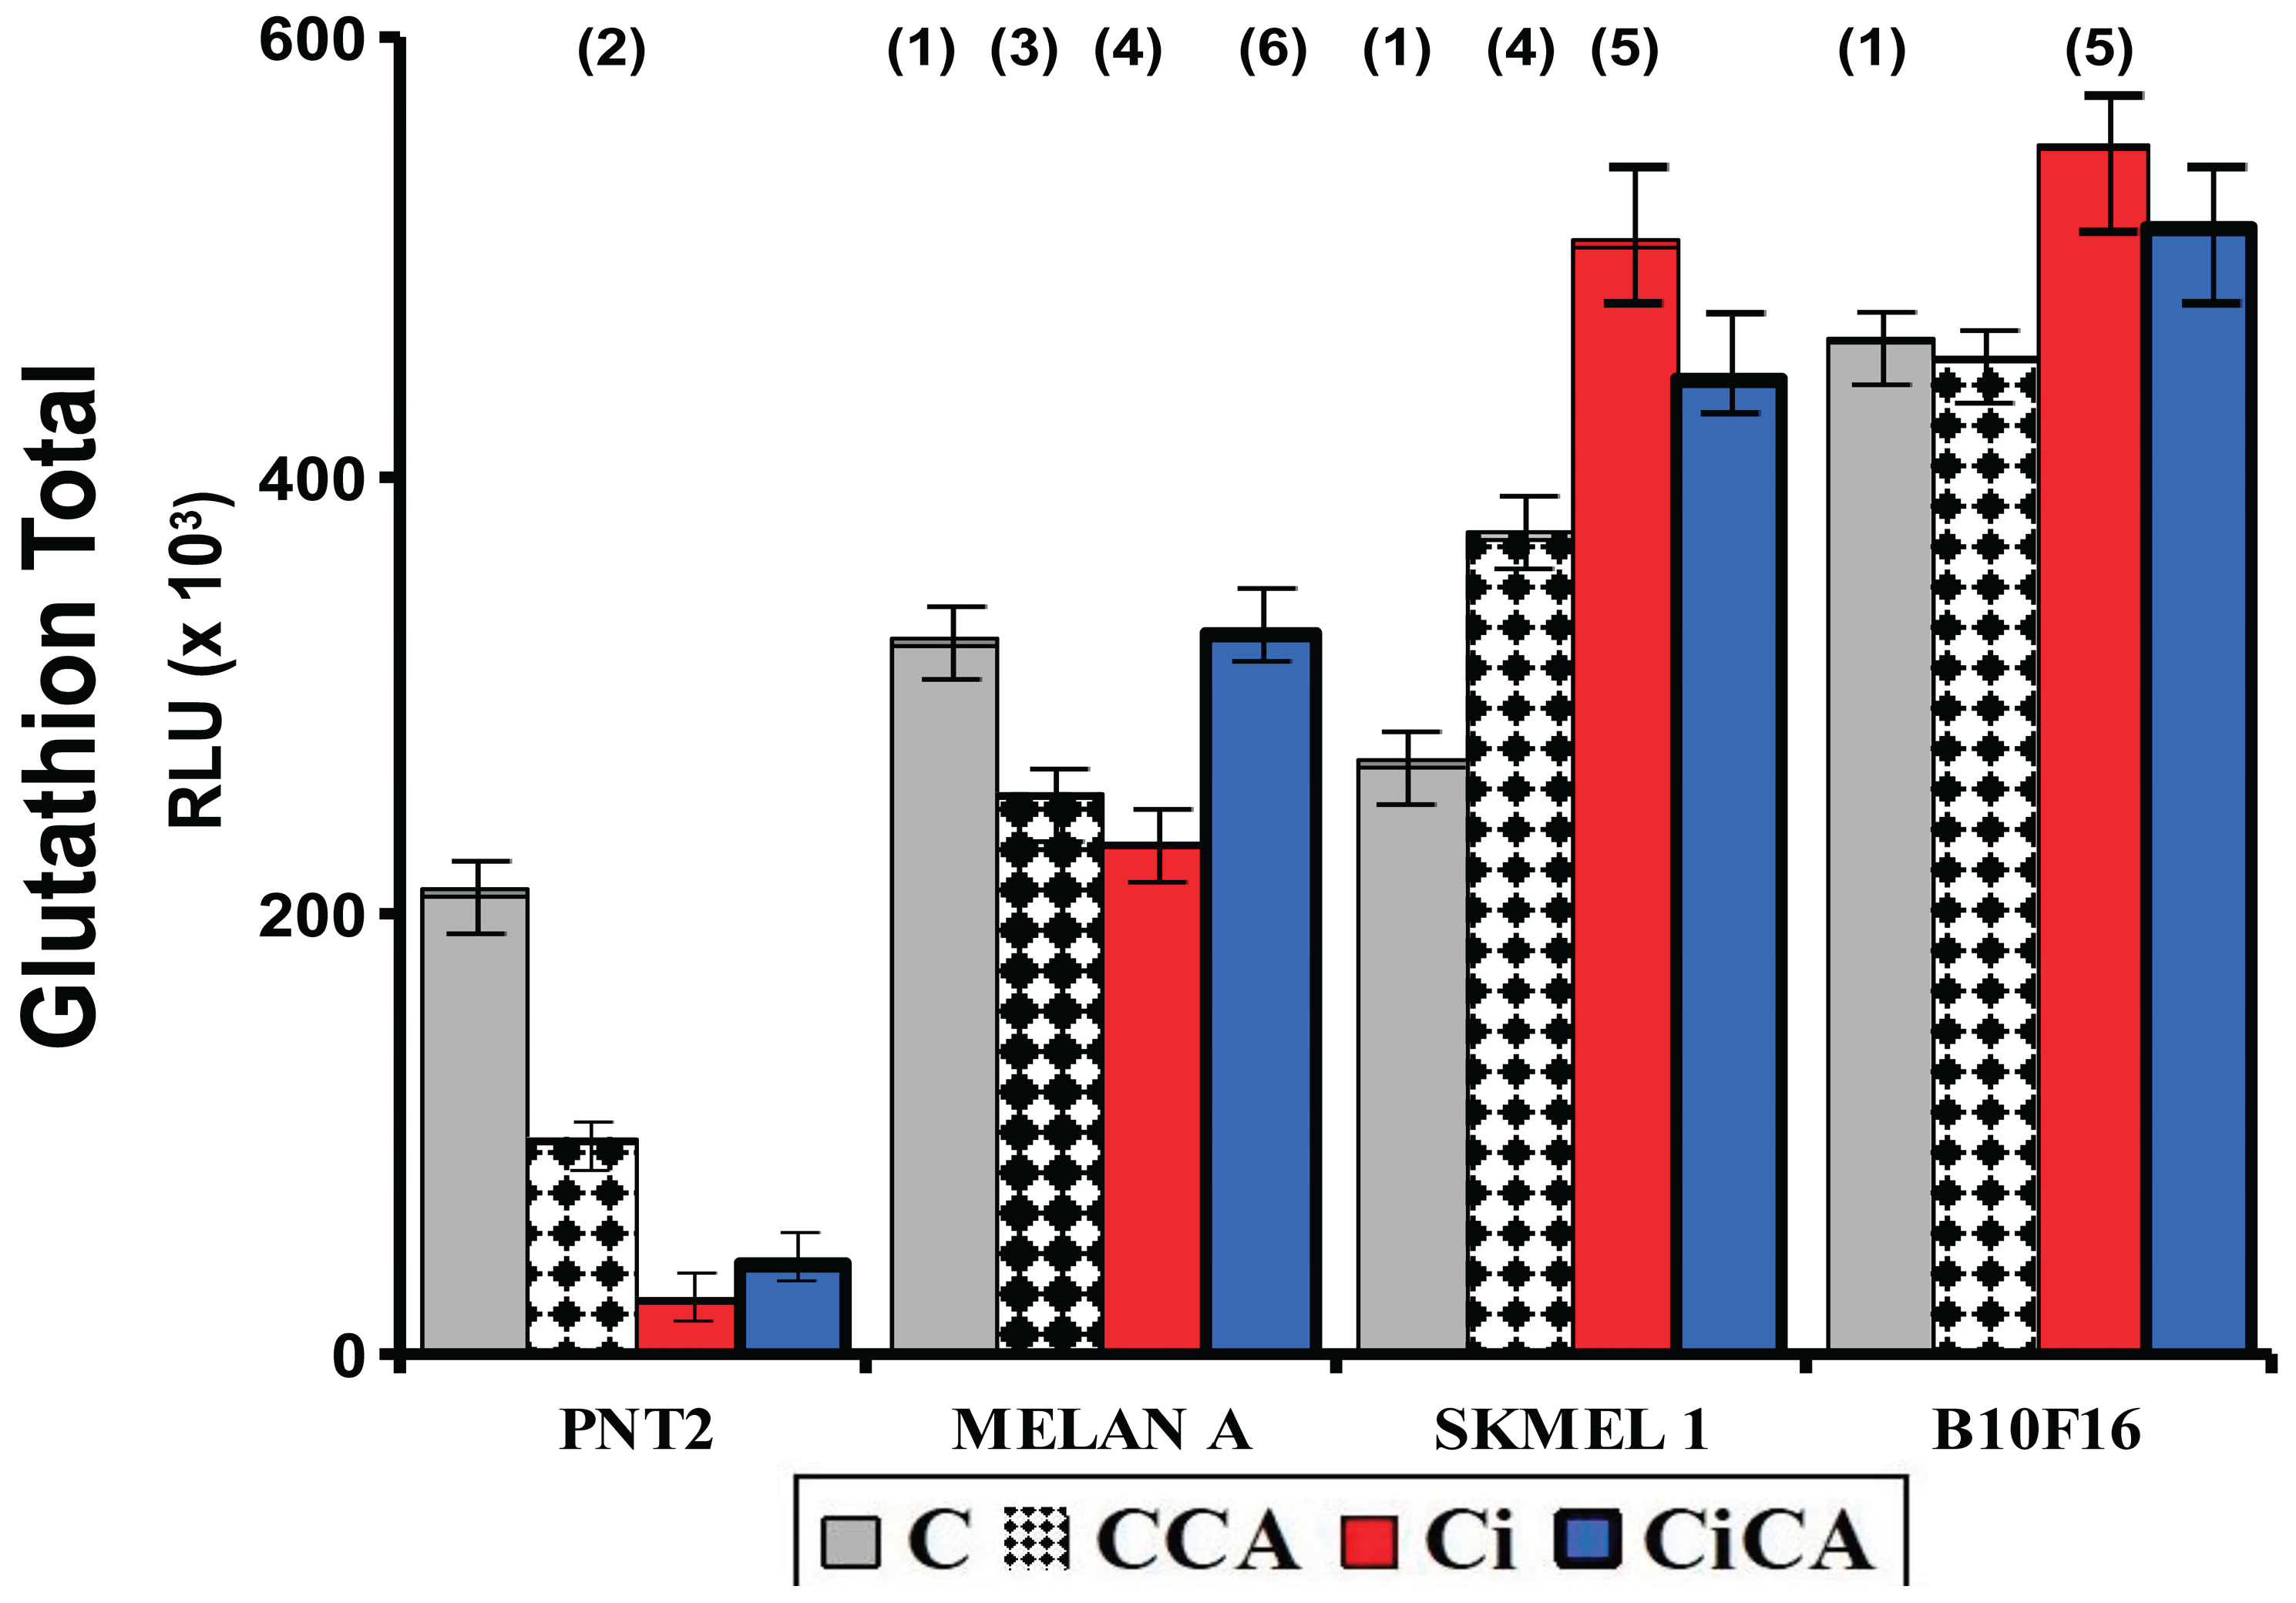
Figure 6.
GSH/GSSG ratios of the different cell lines studied (C, control; CCA, treated with carnosic acid; Ci, irradiated control; CiCA, cells were treated with CA before irradiation) ((1) p < 0.05 versus C; (2) p < 0.01 versus C; (3) p<0.001 versus C). Data are mean ± SE of six independent experiments.
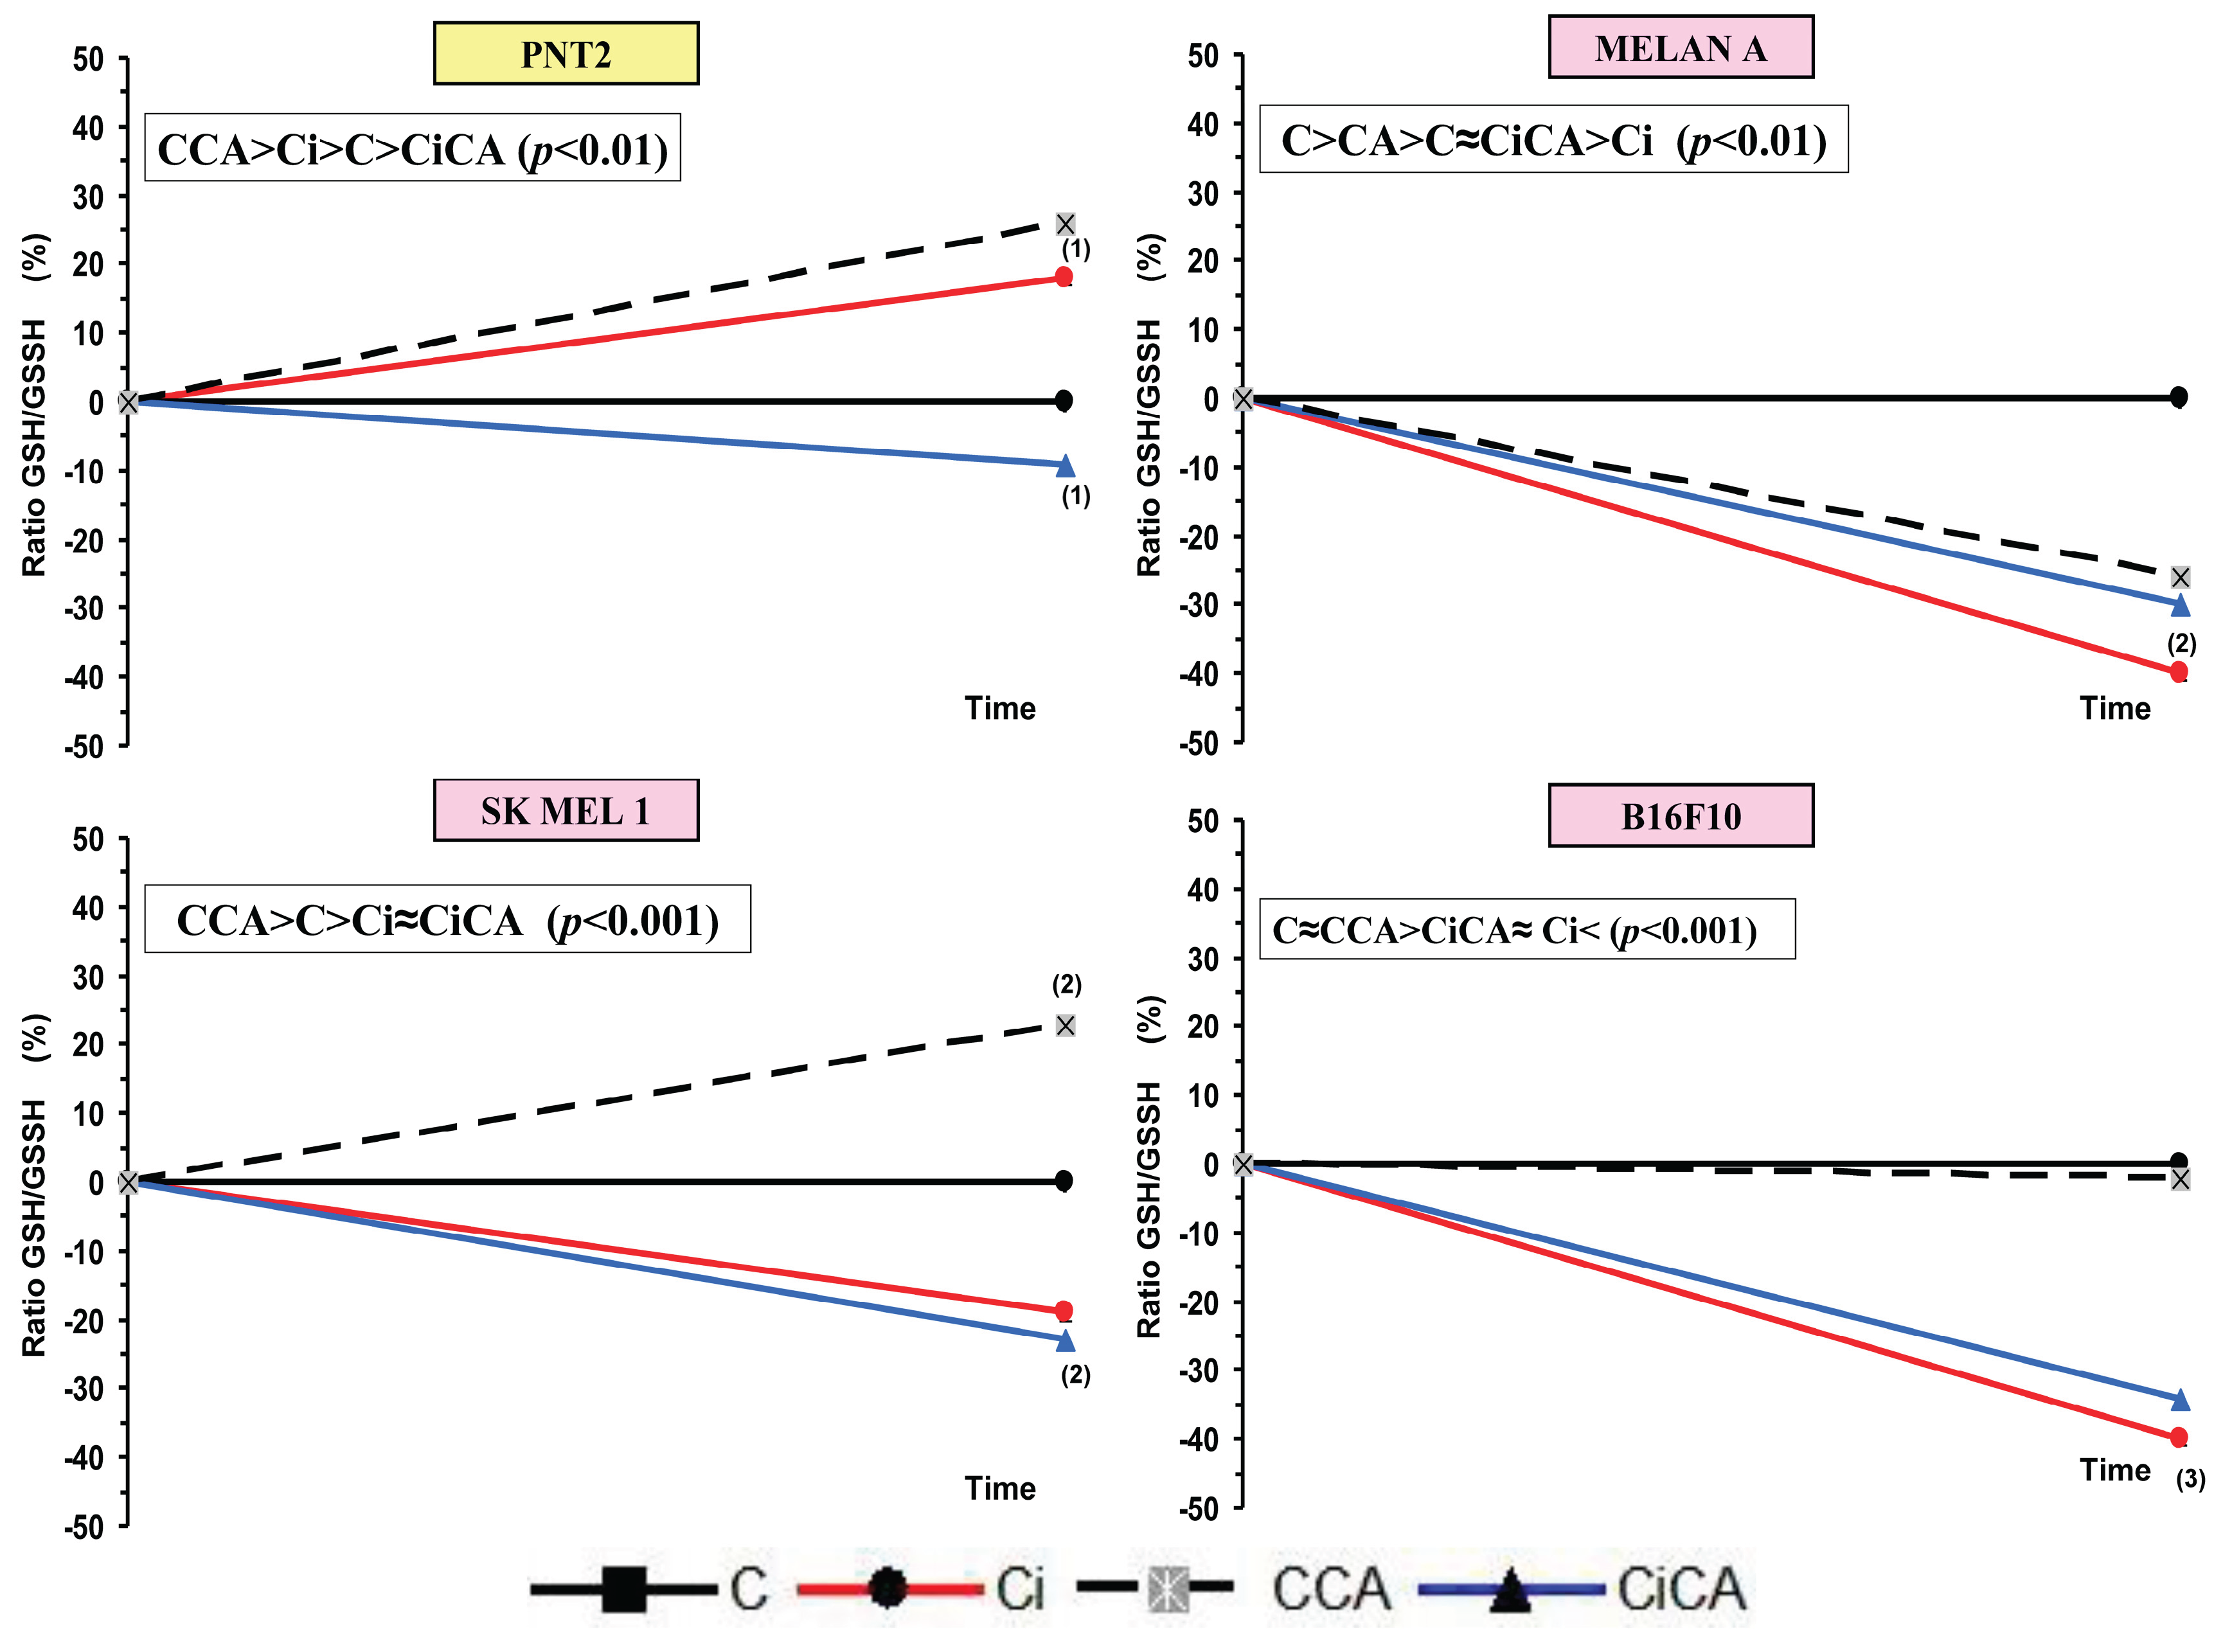
Figure 7.
Cell cycle phases observed in the different cell lines studied (C, control; CA, treated with carnosic acid; Ci, irradiated control; CiCA, irradiated previously treated with carnosic acid) (* p < 0.001 versus C; * p < 0.001 versus Ci). Data are mean ± SE of six independent experiments.
Figure 7.
Cell cycle phases observed in the different cell lines studied (C, control; CA, treated with carnosic acid; Ci, irradiated control; CiCA, irradiated previously treated with carnosic acid) (* p < 0.001 versus C; * p < 0.001 versus Ci). Data are mean ± SE of six independent experiments.
Disclaimer/Publisher’s Note: The statements, opinions and data contained in all publications are solely those of the individual author(s) and contributor(s) and not of MDPI and/or the editor(s). MDPI and/or the editor(s) disclaim responsibility for any injury to people or property resulting from any ideas, methods, instructions or products referred to in the content. |
© 2025 by the authors. Licensee MDPI, Basel, Switzerland. This article is an open access article distributed under the terms and conditions of the Creative Commons Attribution (CC BY) license (http://creativecommons.org/licenses/by/4.0/).
Copyright: This open access article is published under a Creative Commons CC BY 4.0 license, which permit the free download, distribution, and reuse, provided that the author and preprint are cited in any reuse.


