Submitted:
25 July 2025
Posted:
28 July 2025
You are already at the latest version
Abstract
In this study, different hybrid systems based on renewable energies are modeled to cover the energy demands of isolated residential houses on the Canary Islands. The study will cover the energy requirements of a residential house, including fresh water production with a reverse osmosis desalination plant. The system will be designed to be uncoupled from the electrical grid. The tool used to model and optimize the hybrid systems was the HOMER software. The data input to the model were the electrical demand of residential homes (including the consumption of the small reverse osmosis desalination plant) and the technical specifications of the different devices and renewable energies, such as solar radiation and wind speed potentials. The software considers different arrangements to optimize hybrid systems, selecting the best configuration based on the renewable energy sources at the selected location. The data used in the research were taken on the eastern islands of the Canary Islands (Gran Canaria, Lanzarote and Fuerteventura). The knowledge from this research could be applied to other geographical areas of the world that have similar conditions, namely a shortage of water and plentiful renewable energy sources.
Keywords:
renewable energy
; hybrid system
; desalination
; residential house
; Canary Islands
1. Introduction
The Canary Islands are located in the north Atlantic Ocean, northwest of Morocco, Africa. The archipelago is made up of eight main islands: four western ones, El Hierro, La Gomera, Tenerife and La Palma, and four eastern ones, La Graciosa, Fuerteventura, Lanzarote and Gran Canaria (see Figure 1). The stable population on the eight islands exceeds 2 million people. These volcanic islands are very popular, receiving an average of more than 12 million tourists a year (more than 15 million in 2024, a record) [1]. This demographic fluctuation would be a problem anywhere in the world, but particularly on small and isolated islands with limited food, energy, water and other resources.
On the Canary Islands, energy and water are a challenge, especially on the eastern islands, with the islands of Gran Canaria, Fuerteventura and Lanzarote receiving over 50%, 86% and 99% respectively of their water from desalination plants. Obviously, the only way to meet water needs is through the use of efficient reverse osmosis (RO) desalination systems [2,3,4], which consume between 5% and 10% of all the electricity generated on the islands (6.6% on Fuerteventura and 10% on Lanzarote of the total energy generated on these islands) [3,4,5]. This not only places a high strain on the electrical grid, but also on the environment due to the greenhouse gases produced by burning fossil fuels.
The energy system of the archipelago is isolated, with no connections to any continental system, and connections between the islands are very limited due to the depth of the surrounding water. More than 98% of the energy that the Canary Islands need comes from fuels purchased on the international market [3,4,5,6]. Having analyzed all this information, it is easy to conclude that the eastern Canary Islands are the most affected by the shortage of water and electricity necessary for their survival.
Therefore, renewable energies in an isolated system or coupled to the energy grid can be used on these islands to reduce the dependency of fossil fuels and avoid their polluting emissions [7,8]. Given these problems, the main objective of this research is to propose the appropriate hybrid renewable energy system (HRES) to cover the energy loads of isolated residential homes, including the production of fresh water with a small reverse osmosis (RO) desalination plant, on the Canary Islands, from a technical-economic standpoint. Renewable energy sources in the region are taken into consideration. Knowledge from this study could be transferred to other regions with similar conditions to those studied.
The tool used to develop this study is the HOMER computer software, version 2.75 [9]. The main input data in the study were: the electrical needs of an isolated family home near the coast (including a small reverse osmosis plant), the technical specifications of all the systems, and the renewable energy sources (RES), such as solar radiation and wind speed, on the eastern islands. HOMER models the HRES and proposes the most convenient one, using “load-following” dispatch strategies, where the electric generator (if necessary) only produces the energy needed to cover the electricity load, not to charge the batteries [10].
The HOMER software is an interesting tool that has been used by various researchers around the world, such as to simulate the optimization of different renewable energy systems for insertion into the energy grid of certain regions, isolated islands or countries [11,12,13]. HOMER has also been used in many cases to identified the best HRES to supply energy in a village [14], health clinic [15], hotels [16], desalination systems [2,4,8] and isolated houses too [17].
This paper is structured into four sections. The introduction section has provided an overview of the topic. Section 2 presents the materials and methods proposed in this research and lists the main techno-economic input variables for the simulation. The results and a discussion are given in Section 3. Finally, the most relevant conclusions of the research are discussed in Section 4.
2. Materials and Methods
After evaluating different factors such as water scarcity, renewable energy sources, renewable energy policies, electrical system, etc., throughout the Canarian archipelago, this study focuses on the main eastern islands (Gran Canaria, Lanzarote and Fuerteventura).
Once the eastern islands were selected as the most suitable for the study, the research sites were designated, all of them on the east coast of the islands, near the sea. These locations were selected due to the accessibility of information from different meteorological stations at the airports of Gran Canaria, Lanzarote and Fuerteventura, see Figure 1.
2.1. Technical variables input to the HOMER software
The main goal of this software is to support the design and application of any HRES. The basis of the HOMER software is modeling and optimization based on the general cost of any installation, also taking into account the operational cost of any HRES during the operational life of the installation. All the analysis is based on techno-economic benefits [10].
The proposed HRES for the simulation are shown in Figure 2. The simulated systems and devices proposed include photovoltaic (PV) panels, different wind generators, battery banks and diesel generators. The system will cover the electrical demand of an isolated house with a small RO desalination system. The total system is assumed to be disconnected from the electrical system.
2.1.2. Electrical loads
To carry out this study, a total electrical load of around 32 kWh/day was considered. Figure 3 shows the yearly distribution of the possible electrical energy spent, the typical consumption and the monthly high and low in the isolated home. The average electrical demand can be 1.34 kW, which can increase to 2.04 kW during peak hours.
Table 1 shows the suggested electrical loads based on the possible normal electrical consumption of a family house. This proposal takes into consideration different household appliances such as: washing machine, lights, laptops, televisions, refrigerators, fans, microwaves and other loads [17].
A small RO desalination system was also considered, with a daily fresh water production of up to 1.0 m3. The energy requirements assumed for the production of water for this reverse osmosis desalination plant were 5.0 kWh/m3. This value was set high because small desalination plants are more inefficient than industrial desalination plants, where the approximate electrical energy required to produce fresh water is less than 3.5 kWh/m3 [2,4,18].
2.1.3. Solar radiation
The HOMER software receives monthly solar radiation data from NASA. Table 2 shows the latitude and longitude of the meteorological stations used in the study, on the islands of Gran Canaria, Fuerteventura and Lanzarote. Graham's algorithm is the mathematical tool used by the computational software to process solar radiation [2,4,19].
The monthly average solar radiation readings during one year at the coordinates of the stations on the eastern islands are shown in Figure 4, Figure 5 and Figure 6. The daily average radiation is around 4.96 kWh/m2 on Gran Canaria and Fuerteventura, and 4.86 kWh/m2 on Lanzarote, the easternmost island.
2.1.4. Wind Speeds
The monthly average wind speed data were taken from the three meteorological stations located at each island’s main airport. Figure 1 and Table 2 show the location of each station on the three easternmost Islands of the archipelago. Wind speed data at an elevation 10 meters above the ground have been recorded annually at these three stations for more than 40 years. The yearly average wind speed on Lanzarote is 6.28 m/s, on Fuerteventura it is 5.82 m/s and on Gran Canaria it is 7.0 m/s, which can be considered high. Weibull distributions of wind velocity for the three stations are given in Figure 7, Figure 8 and Figure 9.
2.1.5. Wind Turbine System
To model the behavior of the wind turbines, the standard method is used, which relies on transforming the kinetic energy from the wind into electrical energy using the particular power curve of each wind turbine [20].
The wind energy density per unit area (P/A) can be calculated with equation 2.
Equation 3 is the expression used by HOMER to calculate the wind energy production
where is the time frame (one year), Cp is the capacity factor of each wind generator, v is the wind speed, f(v) is the Weibull distribution and j is the class number of the data [2,4,8,20].
Figure 10 displays the power curves of the three wind turbines (WT) designated for the study, with nominal powers of 1.0 kW, 1.9 kW and 3.0 kW. Table 3 shows the characteristics of the proposed wind turbines. The primary economic data for the WT and PV systems are shown in Table 4. The small wind turbine models suggested could be acquired in the Canarian market and are included in the HOMER database.
2.1.6. PV System
Table 4 displays the cost of the PV panels used in the study. The study assumes a useful life of the PV panel of 20 years. The HOMER software does not consider variables such as temperature and voltage during operation when modeling the photovoltaic (PV) system [10].
The electrical energy produced (PPV) by the PV panels is computed using Equation 4
where fPV is the debating factor, YPV is the total installed capacity of the PV panel arrangement (kW), IT is the incident global radiation (kW/m2) and Is is the amount of radiation used to rate the capacity of the PV panel arrangement, equal to 1.0 kW/m2 [10].

Table 4.
Economic data input for HRES.
| Element | Size | I. Capital Cost(ICC)$ | Replacement Cost (RC)$ |
O&M Cost ($) |
Lifetime |
|---|---|---|---|---|---|
| PV panels | 0-50 kW | 2,500 $/kW | 2,500 $/kW | 0.015*ICCPV | 20 years |
| Wind Turbines | WT- 1.0 kW WT- 2.5 kW WT- 3.0 kW |
6000 $/unit 14,900 $/unit 14,900 $/unit |
3700 $/unit 11,000 $/unit 11,000 $/unit |
0.025*ICCWind | 20 years |
| Batteries (360 Ah/6V) |
(0-32) batt. | 350 $/unit | 350 $/unit | 8.00 $/year | 10 years |
| Generator | 0-5.0 kW | 700 $/kW | 700 $/kW | 0.40 $/hour | 15,000 h |
| Converter | 0-5.0 kW | 1000 $/kW | 1000 $/kW | 50 $/year | 20 years |
2.1.7. Generator
The generator assumed in the study is a diesel motor connected to an electric generator. The HOMER software, version 2.75, allows modeling numerous types of electrical generators, from the simplest, like the system used in the study (generator + internal combustion engine (diesel or Otto)), to the most complex, like fuel cells, gas turbines, and others. The fuel price assumed in the research is $0.90/liter. The main generator parameter considered is the power capacity, which can fluctuate between 0 and 5.0 kW, see Table 4. The generator only produces energy if the isolated house demands load; it will never start to charge the batteries [4,10,24].
2.1.8. Converter
The main purpose of a converter is to change electricity from direct current (DC) to alternating current (AC), or to change the voltage or frequency. Table 4 shows the economic properties of the converters proposed, with the equipment operating in the range of 0 to 5.0 kW, with a possible useful life of 20 years and an efficiency of 90% [4,10,24].
2.1.9. Battery bank
HOMER models the battery as a device that can accumulate a quantity of direct current (DC). Based on the number of battery charge and discharge cycles, the software can determine when the battery needs to be replaced [4,10,24]. In this study, the batteries assumed are commercial lead-acid models, with 360 Ah, 6.0 V and 1075 kWh. Table 4 shows the economic characteristics of the proposed batteries. The number of batteries in the simulated battery bank can range from 0 to 32 units.
2.2 Economic analysis
The electrical systems of any country are based on conventional energy systems (thermal power plants), which burn fossil fuels. This happens because these systems have a relatively lower initial capital cost compared to any RES. However, it is important to note that operating costs in RES-based plants are lower. As mentioned above, one of HOMER's main advantages is the optimization of energy processes, where the software establishes a comparison between RES or HRES and conventional energy systems to recommend the most economically viable system [4,24].
In their research, Avila et al. [2,8], Padrón et al. [4] and Hina and Palanisamy [24] present the bases of the economic analysis carried out by HOMER. This economic analysis uses an economic tool known as “Levelized Cost of Energy” (COE), which calculates the average (cost/kWh) of the electrical energy produced by any type of system. The system also implements the “Total Net Present Cost” (NPC) ($), which is capable of calculating the cost of installing the energy system and its operation. All the methodology and economic equations involved can be found in the papers mentioned at the beginning of this paragraph.
3. Results and Discussion
The main problem when designing and proposing any HRES is defining its elements and the size of each, which is restricted by the renewable energy sources in the area where the system will be installed.
The HOMER software, version 2.75, is an exceptional tool for simulating numerous HRES arrangements, allowing the user to identify viable proposals and discard those that are infeasible.
The technical-economic simulation output by the software and its results are presented below. For the simulation, the assumed electrical energy cost from RES is $0.15/kWh. The total electrical load assumed in the simulation is 32 kWh/day, which provides a margin of 5.0% over the estimated actual need. This energy can cover the needs of an isolated house, with its basic appliances and an RO desalination plant that produces 1.0 m3 of water per day.
3.1. Optimization results on Lanzarote, Fuerteventura and Gran Canaria
Table 5 and Table 6 show the result proposed by HOMER after modeling the techno-economic variables with HRES based on photovoltaic-wind-diesel generator systems working in isolated conditions, to supply energy to a family home, with an RO plant included in the proposal, on the islands of Gran Canaria, Fuerteventura and Lanzarote.
Table 5 shows the technical analyses carried out by HOMER, where the system allows the simulation and optimization of all possible HRES to supply energy to the isolated house + RO desalination plant, based on the renewable resources of each island analyzed.
The optimal HRES in all cases (Gran Canaria, Fuerteventura and Lanzarote) was the system composed of an E30pro wind turbine (WT), eight batteries, a 2.0 kW converter and a small diesel generator (DG) with a nominal power of 1.0 kW. The penetration of renewable energies in each of the cases analyzed is greater than 99%. The DG is only used in exceptional situations when the HRES and batteries cannot meet the demand, fewer than three days a year in all cases. The DG will never be used to charge the batteries; it will only run to meet the load demand.
Table 6 shows an initial capital cost of $20,400, which is the same for all probable HRES that can cover the energy needs of an isolated home with a desalination plant. The COE for the different HRES proposed is between 0.223 and 0.227 $/kWh, with only a small difference between them, with the renewable energy conditions on Lanzarote being those that allow the lowest cost/kWh.
3.2. Pollution Avoided
This section shows in Table 7, the total emissions of polluting gases in kg/year that can be avoided with the HRES proposed for isolated homes + RO desalination plant for each of the islands. The main gas emissions considered in the study were carbon dioxide (CO2), nitrogen oxides (NOx) and sulfur dioxide (SO2).
When the result of Table 7 is analyzed, it can be concluded that the HRES proposed for each of the cases can avoid the emission of more than 7200 kg/year of CO2, more than 14.5 kg/year of SO2 and around 159 kg/year of NOx. The HRES with the least emissions is the system proposed for Lanzarote. This system only requires operating the diesel generator 24 hours/year, with emissions of 19.9 kg/year of CO2, 0.44 kg/year of NOx and 0.04 kg/year of SO2. This is due to the good renewable energy resources on the island.
4. Results and Discussion
Having completed the study, different conclusions can be drawn from the proposal to install HRES to supply electricity to a family home with a reverse osmosis seawater desalination plant, all of them based on a technical-economic analysis.
The technical and economic analyses carried out on the islands of Lanzarote, Fuerteventura and Gran Canarias, based on the coordinates of the three meteorological stations located at the islands' airports, can be considered successful. The simulation and optimization of the system concludes that the ideal HRES to install on any of the three eastern islands is the system with an E30pro WT, eight batteries, a 2.0 kW converter and a small 1.0 kW DG. The penetration of renewable energies in all the cases analyzed is greater than 99%. The COEs for all the HRES are less than 0.227 $/kWh in the three cases analyzed. This may seem very expensive compared to the price of electricity from the electrical grid, but in many cases they are offset by the high cost of having to route electrical wiring to homes isolated from the grid.
Each and every one of the systems proposed for each island can avoid the emission of polluting gases; namely, more than 7,200 kg/year of CO2, more than 14.5 kg/year of SO2 and around 159 kg /year of NOx.
Author Contributions
Conceptualization, D.A.; methodology, D.A. and G.N.M; software, D.A.; validation, D.A; G.N.M. and A.H.; formal analysis, G.N.M.; investigation, A.H.; resources, D.A.; data curation, A.H.; writing—original draft preparation, D.A. and A.H.; writing—review and editing, G.N.M; visualization, D.A. and A.H.; supervision, G.N.M.; project administration, D.A.; funding acquisition, G.N.M. All authors have read and agreed to the published version of the manuscript.
Funding
This work has been co-funded by INTERREG MAC 2021–2027 program, within the IDIWATER project (1/MAC/1/1.1/0022), which is integrated into the DESAL+ Living Lab Platform (desalinationlab.com (accessed on 2 May 2025)).
Data Availability Statement
Not applicable.
Acknowledgments
Not applicable.
Conflicts of Interest
The authors declare no conflict of interest. The funders had no role in the design of the study; in the collection, analyses, or interpretation of data; in the writing of the manuscript, or in the decision to publish the results.
References
- Instituto Canario de Estadística (ISTAC), (Canarian Statistic Institute) (2023), http://www.gobiernodecanarias.org/istac (Accessed on 5 June 2024).
- Avila, D.; Marichal, G.N.; Hernández, A.; San Luis, F. Chapter 2 - hybrid renewable energy systems for energy supply to autonomous desalination systems on Isolated Islands. In Design, Analysis, and Applications of Renewable Energy Systems; Azar, A.T.; Kamal N.A., Eds.; Academic Press, 2021; pp. 23–51.
- Gils, HCh.; Simon, S. Carbon neutral archipelago-100% renewable energy supply for the Canary Islands, Appl. Energy 2017,188, 342–55.
- Padrón, I.; Avila, D.; Marichal, G.N.; Rodríguez, J.A. Assessment of Hybrid Renewable Energy Systems to supplied energy to Autonomous Desalination Systems in two islands of the Canary Archipelago. Renew. Sustain. Energy Rev. 2019, 101, 221–230. [CrossRef]
- González. A., Pérez, J.C., Díaz, J.P., Expósito, F.J.: Future projections of wind resource in a mountainous archipelago, Canary Islands. Renew. Energy 2017, 104, 120-128.
- Avila, D.; Marichal, G.N.; Quiza, R.; San Luis, F. Prediction of Wave Energy Transformation Capability in Isolated Islands by Using the Monte Carlo Method. J. Mar. Sci. Eng. 2021, 9, 980. [CrossRef]
- Padrón, I., García, M., Marichal, G., Avila, D. Wave energy potential of the Coast of El Hierro Island for the exploitation of a Wave Energy Converter (WEC). Sustainability 2022, 14, 12139. [CrossRef]
- Avila, D., San Luis, F., Hernández, Á., Marichal, G.N. Optimal Arrangements of Renewable Energy Systems for Promoting the Decarbonization of Desalination Plants. J. Mar. Sci. Eng. 2024, 12, 1193.
- HOMER Software (2.75), HOMER Energy (2012). Available online: http://homerenergy.com/, (Accessed on 5 February 2024).
- Lambert, T.; Gilman, P.; Lilienthal, P. Micropower Modeling System. 2006, pp. 379–417. Available online: http://www.pspb.org/e21/media/HOMERModelingInformation.pdf (Accessed on 14 February 2024).
- Alphen, K., Sark. W., Hekkert, M.P. Renewable energy technologies in the Maldives—determining the potential. Renew. Sustain. Energy Rev. 2007, 11, 1650–74.
- Demiroren, A.; Yilmaz, U. Analysis of change in electric energy cost with using renewable energy sources in Gökceada, Turkey: an island example. Renew. Sustain. Energy Rev. 2010, 14, 323–33.
- Alam, Md.; Denich, M. Assessment of renewable energy resources potential for electricity generation in Bangladesh. Renew. Sustain. Energy Rev. 2010, 4, 2401–13.
- Rehman, S., et al. Feasibility study of hybrid retrofits to an isolated off-grid diesel power plant. Renew. Sustain. Energy Rev. 2007, 11, 635–53. [CrossRef]
- Al-Karaghouli, A.; Kazmerski, L.L. Optimization and life-cycle cost of health clinic PV system for a rural area in southern Iraq using HOMER software. Sol. Energy 2010, 84, 710–714. [CrossRef]
- Dalton, G.J.; Lockington, D.A.; Baldock, T.E. Feasibility analysis of stand-alone renewable energy supply options for a large hotel. Renew. Energy 2008, 33, 1475–90. [CrossRef]
- Kassem, R.; Mahmoud, M.M.; Ibrahim, N.F.; Alkuhayli, A.; Khaled, U.; Beroual, A.; Saleeb, H. A Techno-Economic Environmental Feasibility Study of Residential Solar Photovoltaic/Biomass Power Generation for Rural Electrification: A Real Case Study. Sustainability 2024, 16, 2036. [CrossRef]
- Chenoweth, J. Minimum water requirement for social and economic development. Desalination 2007 229, 245–56. [CrossRef]
- Demiroren, A.; Yilmaz, U. Analysis of change in electric energy cost with using renewable energy sources in Gökceada, Turkey: an island example. Renew. Sustain. Energy Rev. 2010 14, 323–33.
- Manwell, J.F.; McGowan, J.G.; Rogers, A.L. Wind Energy Explained: Theory, Design and Application, 2nd ed.; JohnWiley and Sons:New York, NY, USA, 2009; pp. 23–89. ISBN 978-0-470-01500-1. Available online: https://search.worldcat.org/es/title/wind-energyexplained%20theory-design%20and-application/oclc/431936159 (accessed on 15 July 2024).
- Southwest Windpower. Whisper 100 Owner’s Manual. Installation-Operation-Maintenance. Available online: https://www.technosun.com/descargas/SOUTHWEST-WHISPER-100-manual-EN.pdf (accessed on 19 July 2024).
- Southwest Windpower. Technical Specifications Whisper 100 and Whisper 500. Available online: https://www.technosun.com/descargas/SOUTHWEST-WINDPOWER-WHISPER100-WHISPER200-WHISPER500-ficha-EN.pdf (accessed on 19 July 2024).
- Enair, Rayse Energy. Small Wind Turbine Enair 30PRO, 2024. Available online: https://www.enair.es/en/small-wind-turbines/e30pro, (accessed on 19 July 2024).
- Hina, F.; Palanisamy, K. Renewable systems and energy storages for hybrid systems. In Hybrid-renewable energy systems in microgrids; Hina, F., Prabaharan, N.; Palanisamy, K.; Akhtar, K.; Mekhilef, S.; Justo, J. Eds. 1st ed. Woodhead Publishing, 2018; p. 147–164.
Figure 1.
Map of the Canary Islands. Location of the meteorological stations selected for the study
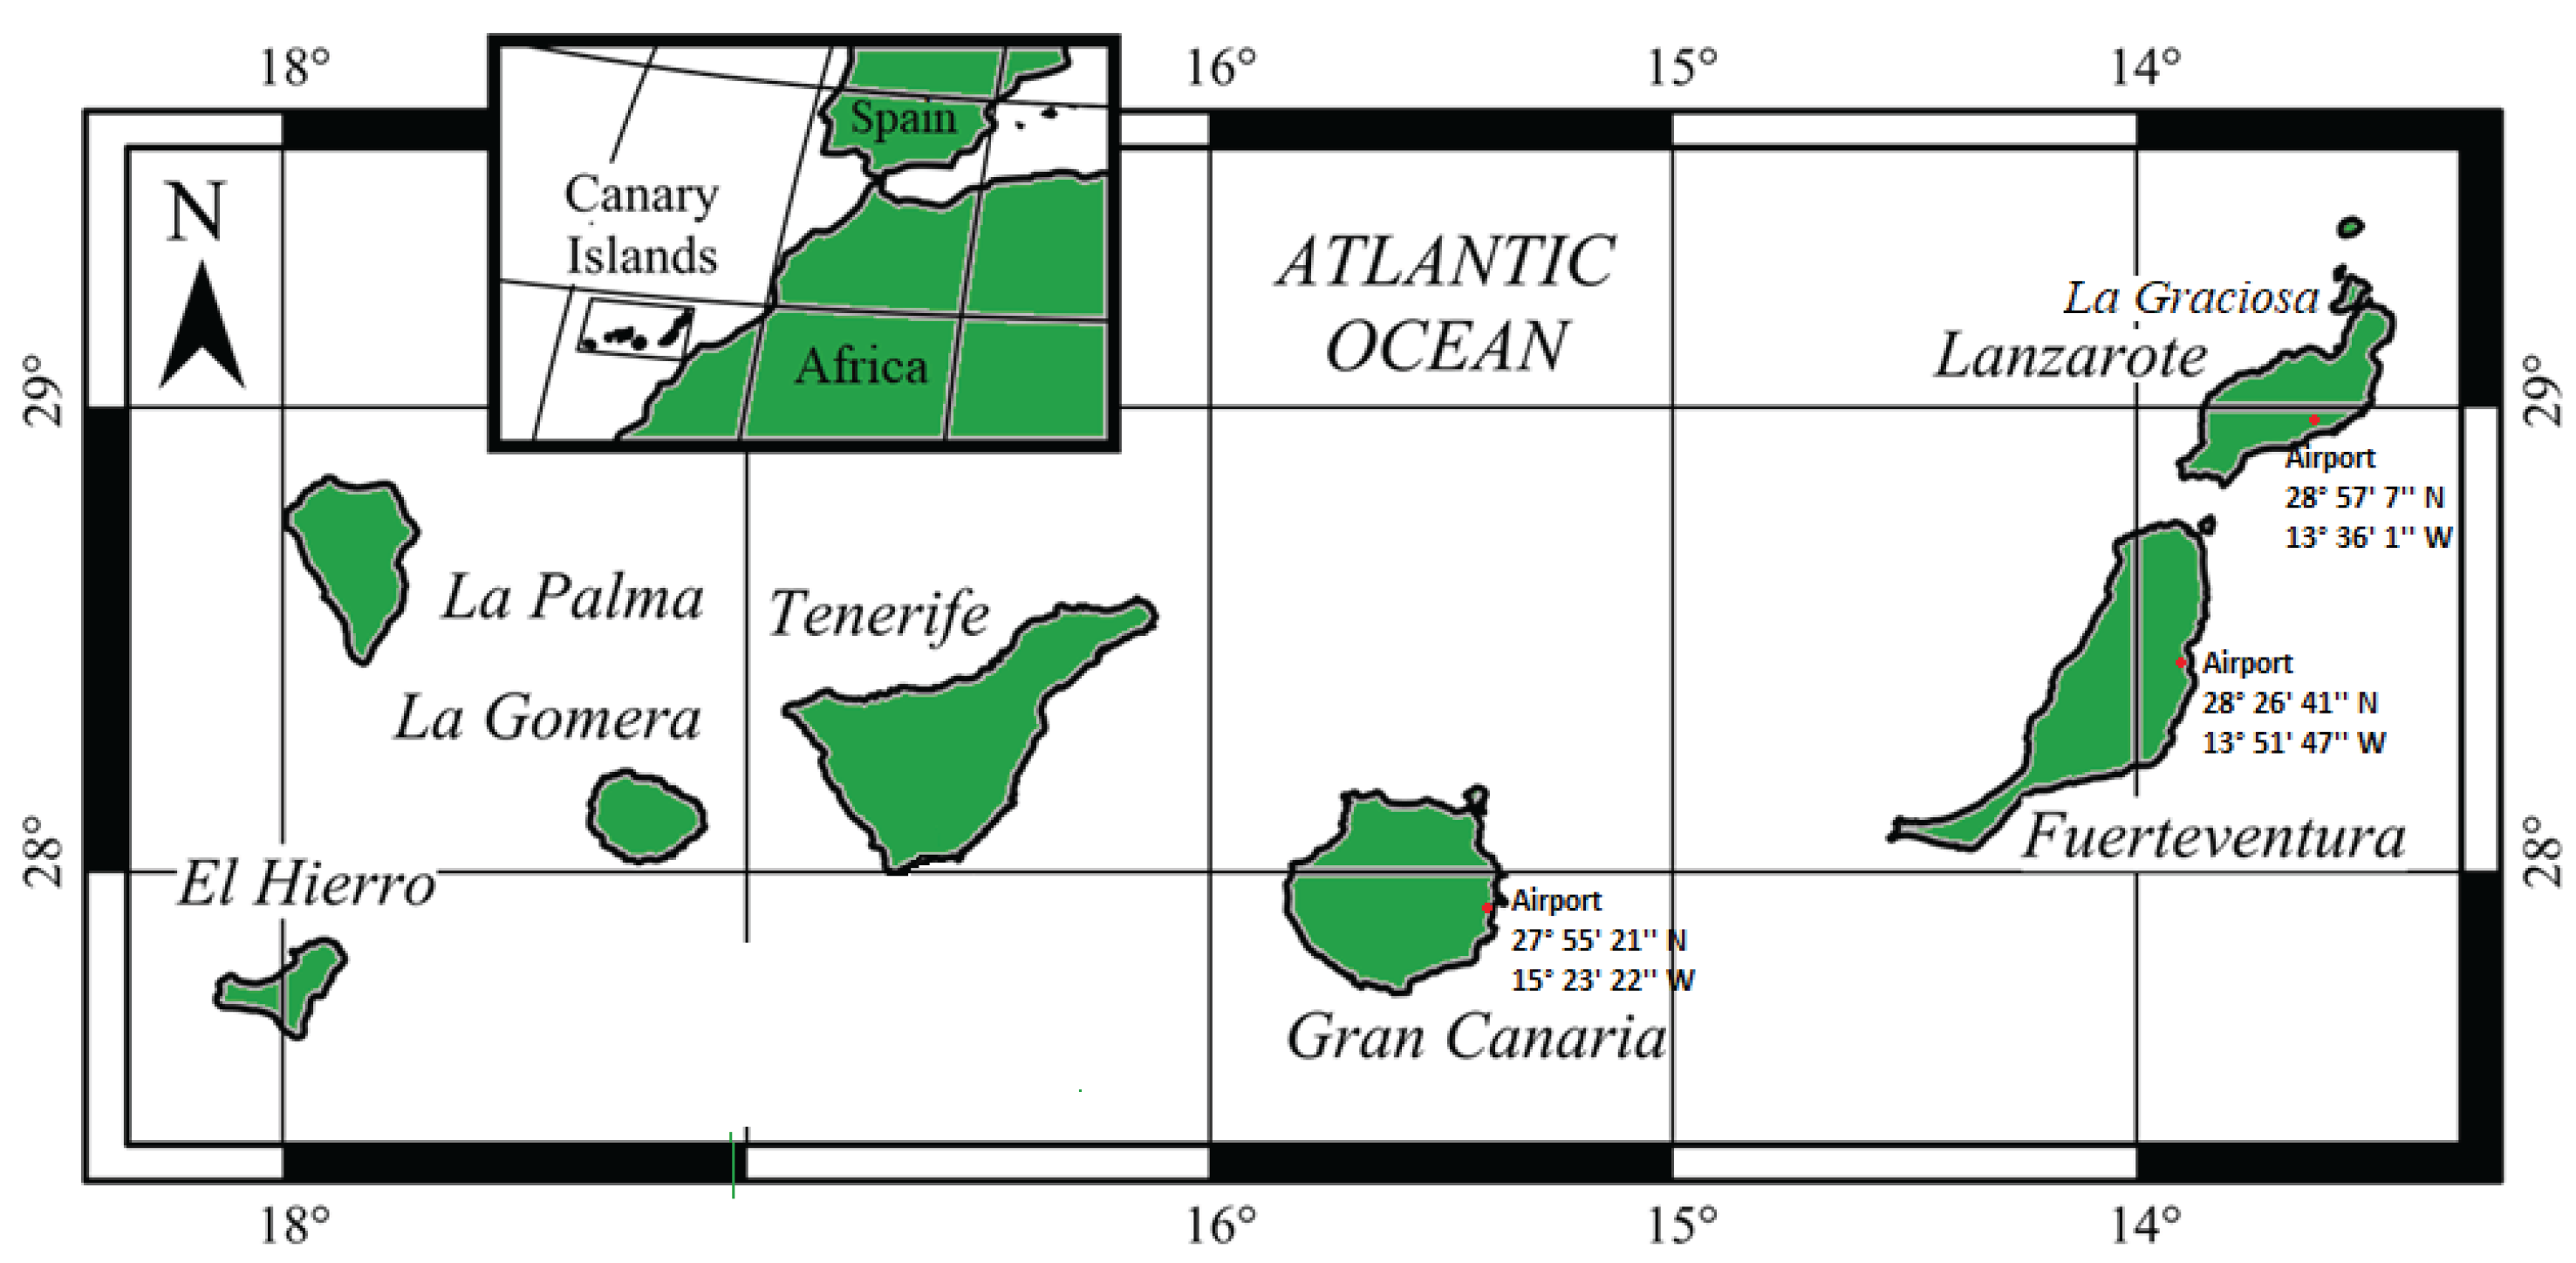
Figure 2.
HOMER software model.
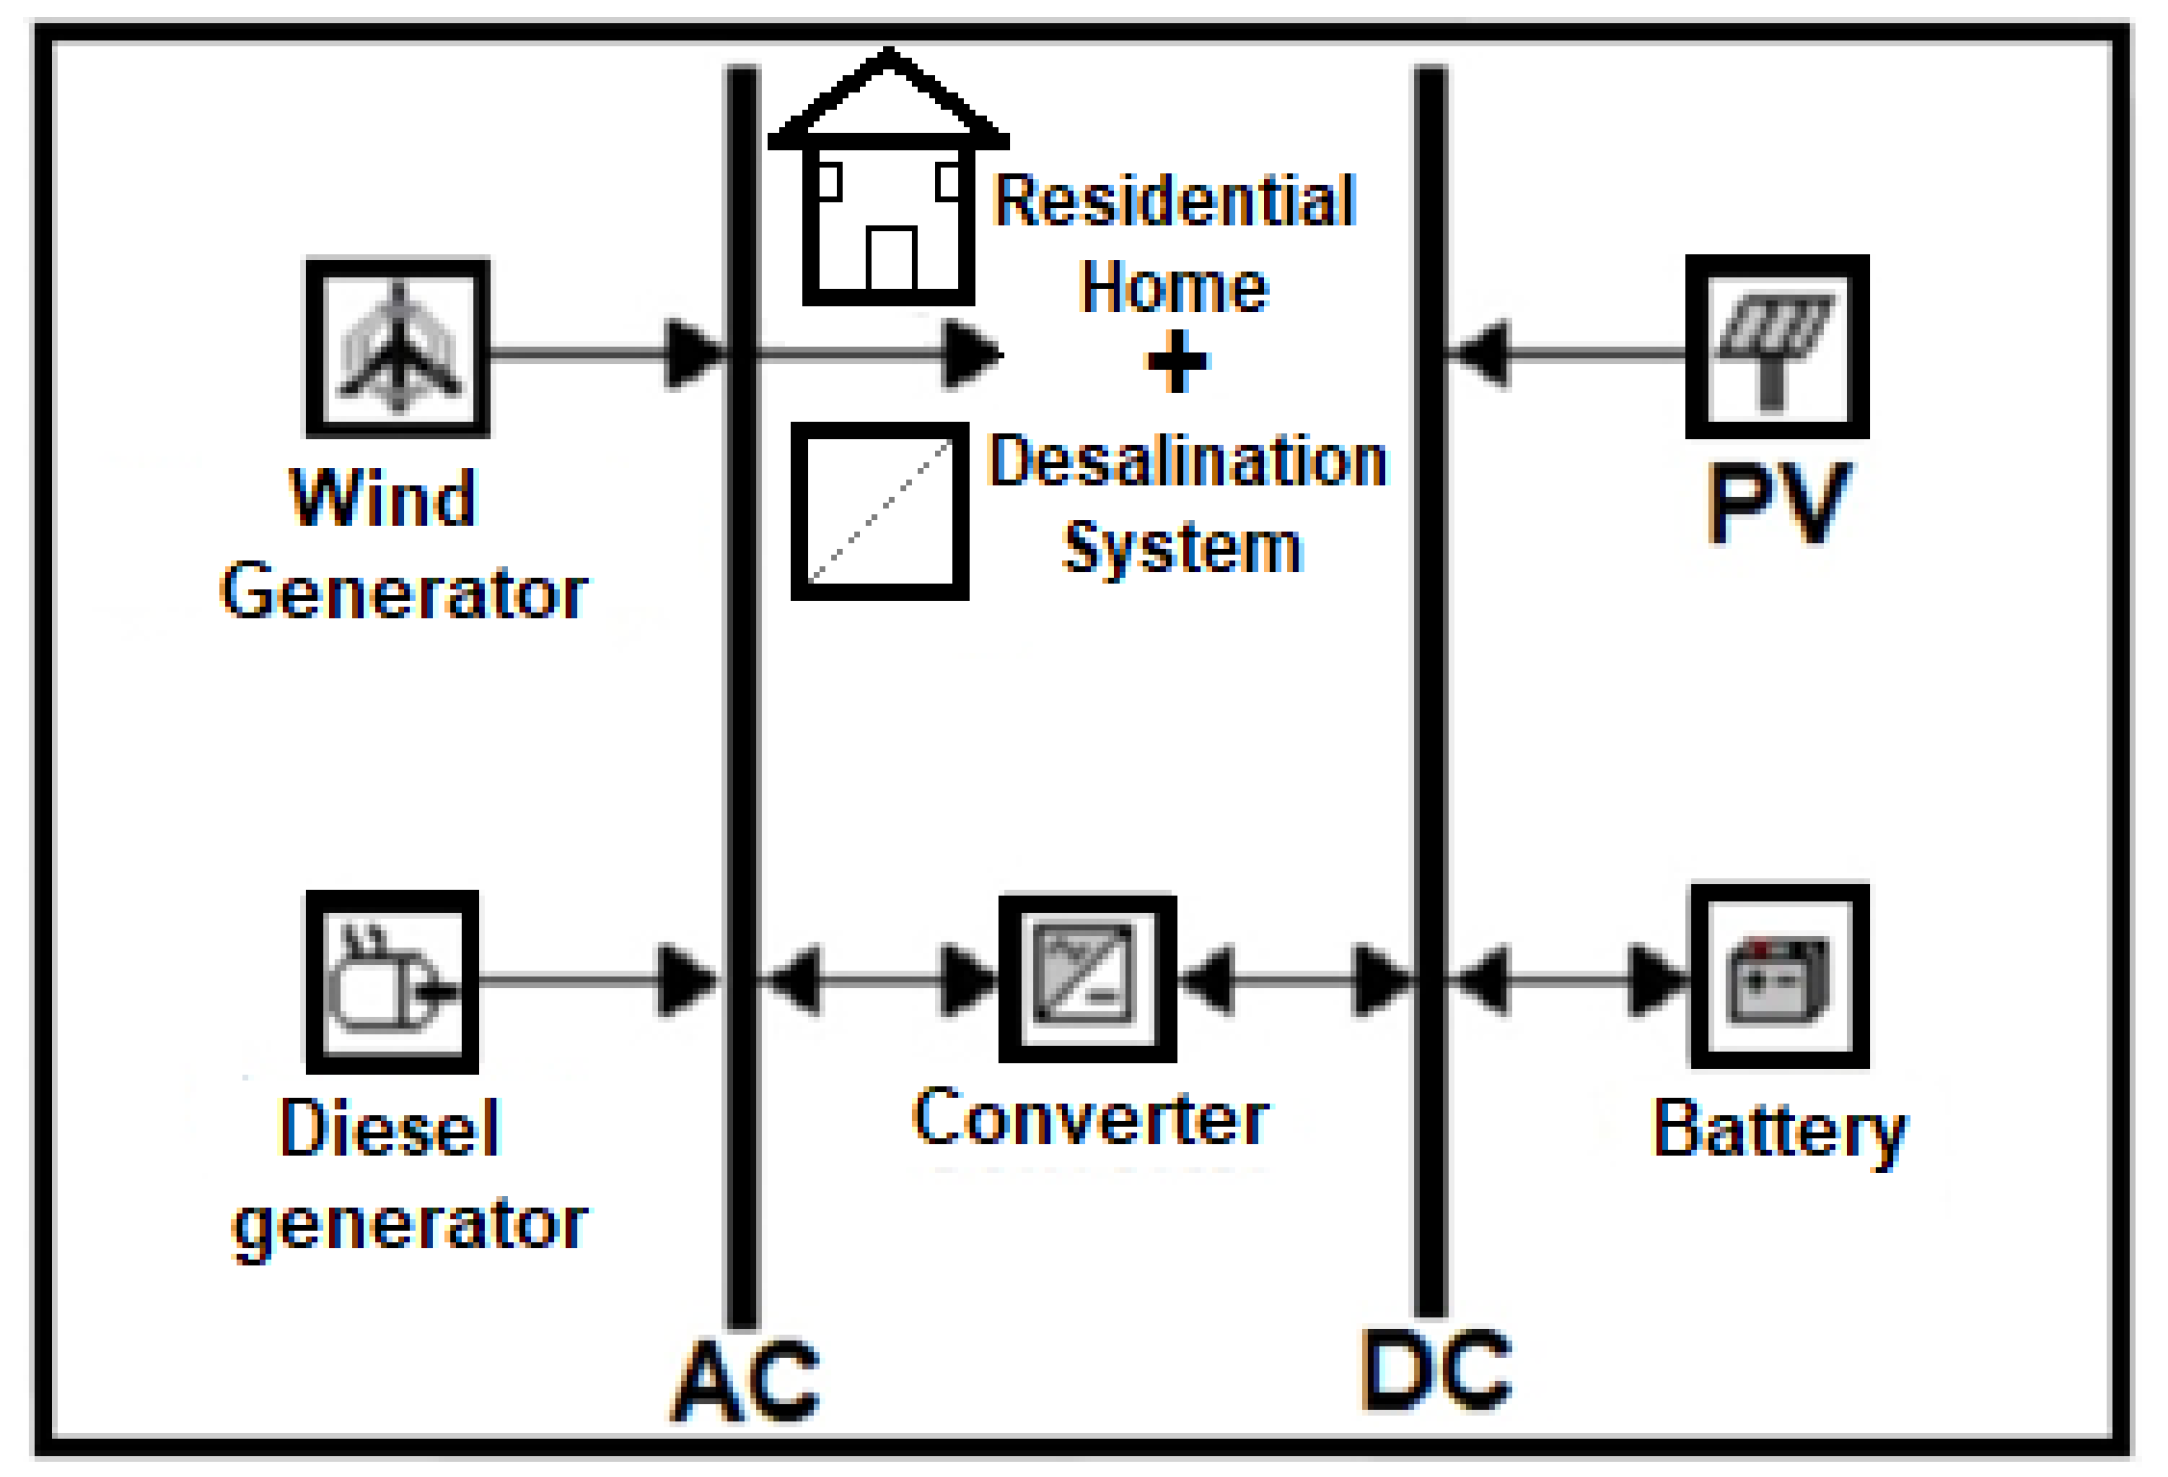
Figure 3.
Annual distribution of electrical energy in the isolated home.
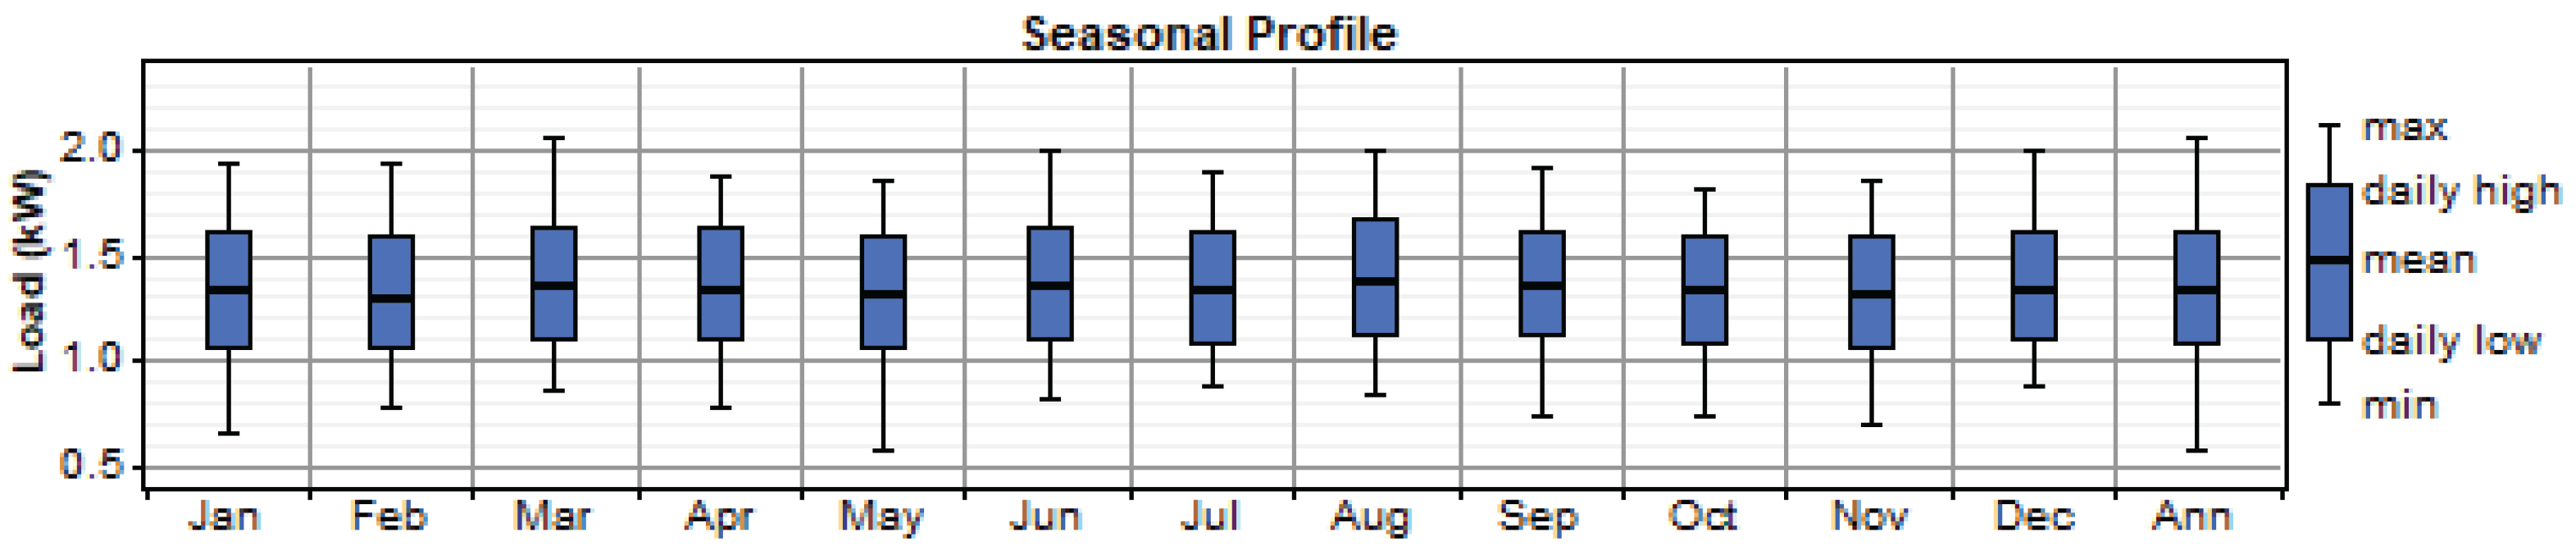
Figure 4.
Annual solar radiation on Lanzarote.
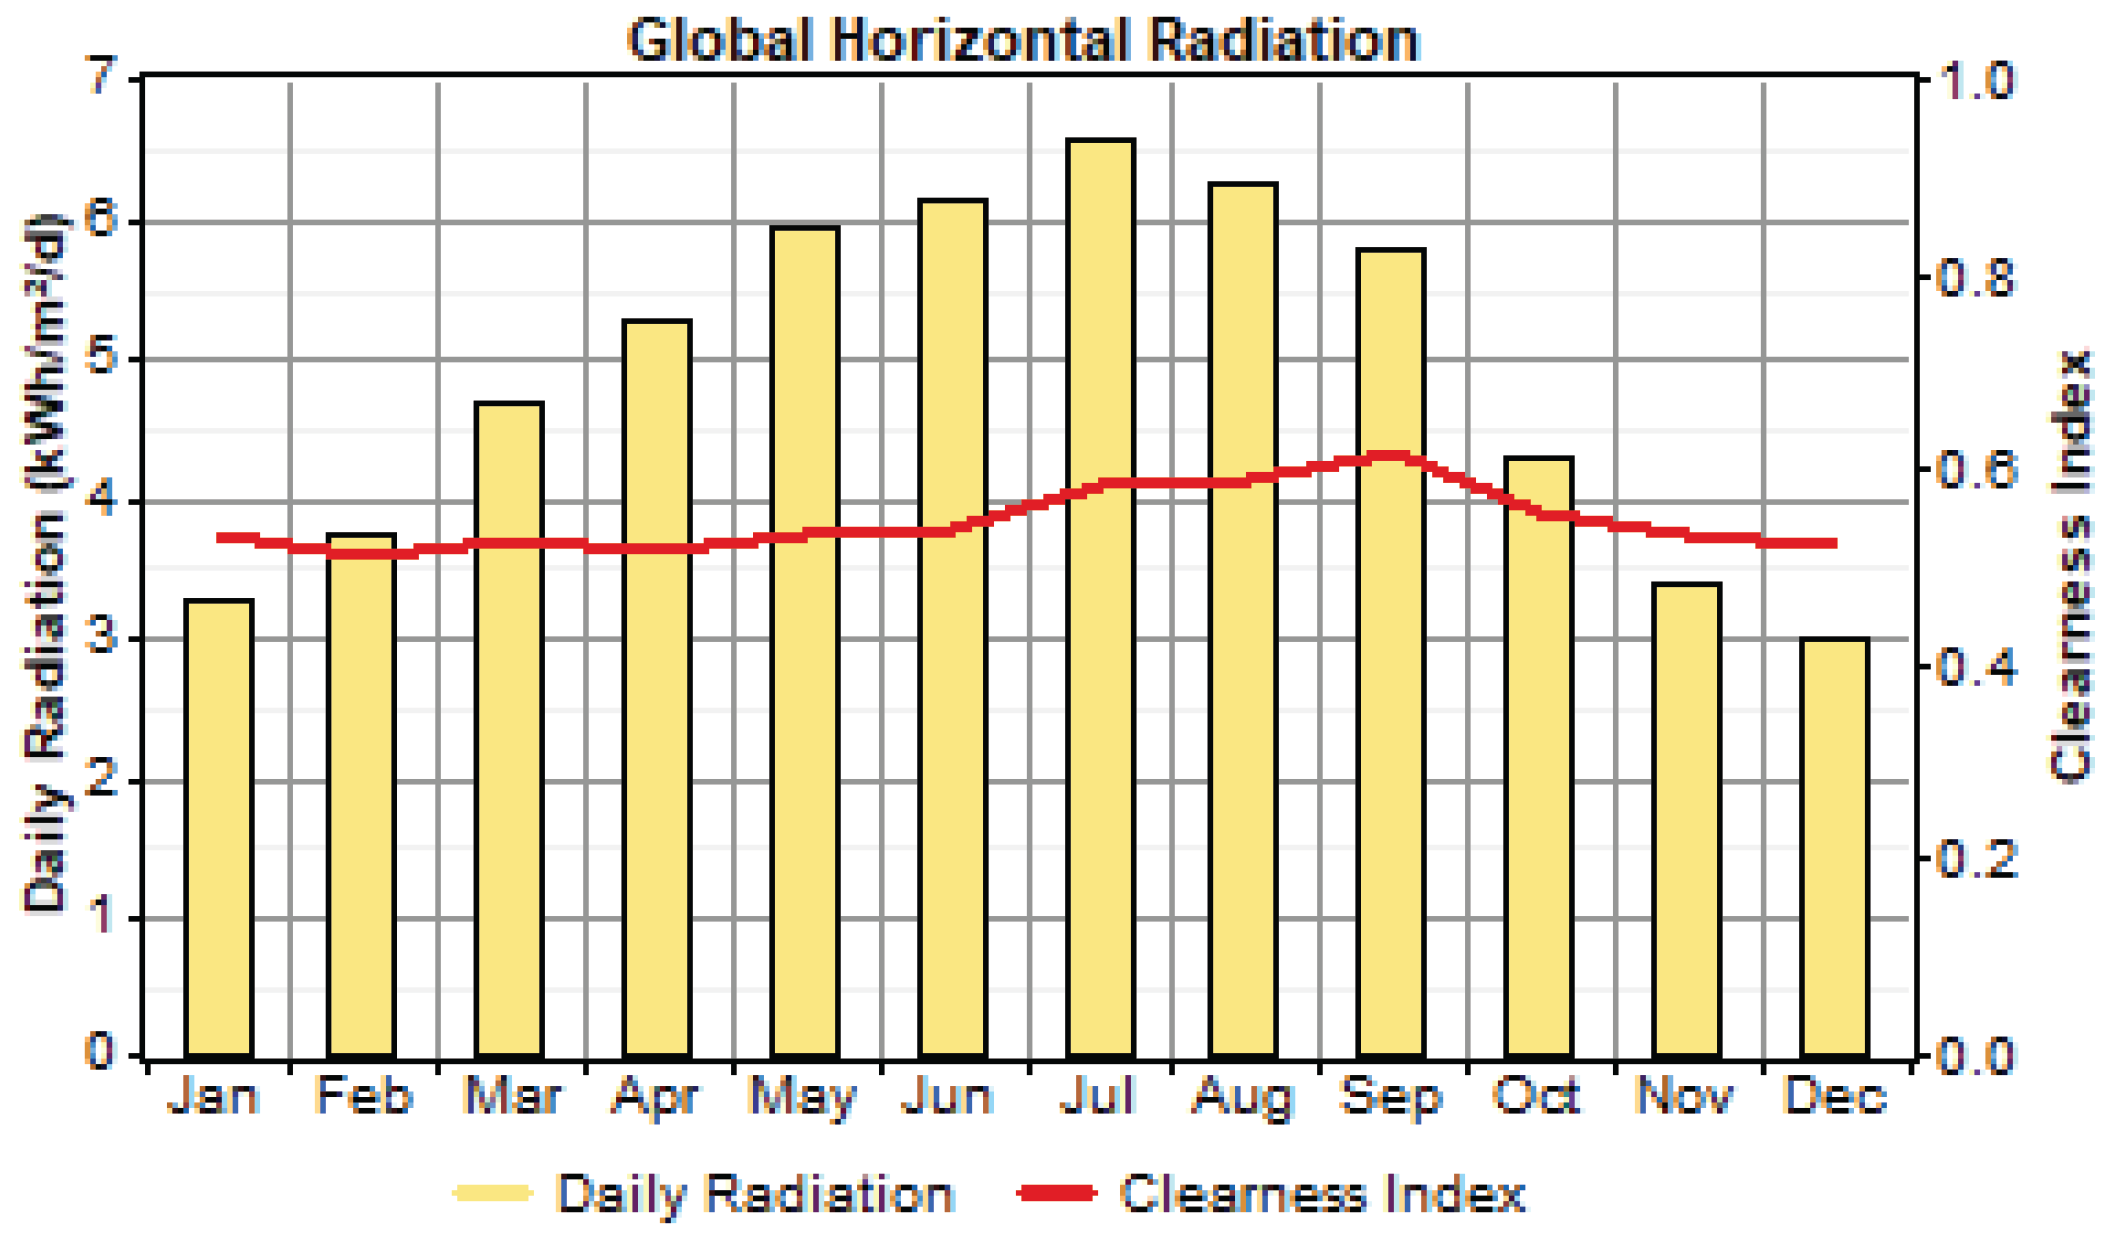
Figure 5.
Annual solar radiation on Fuerteventura.
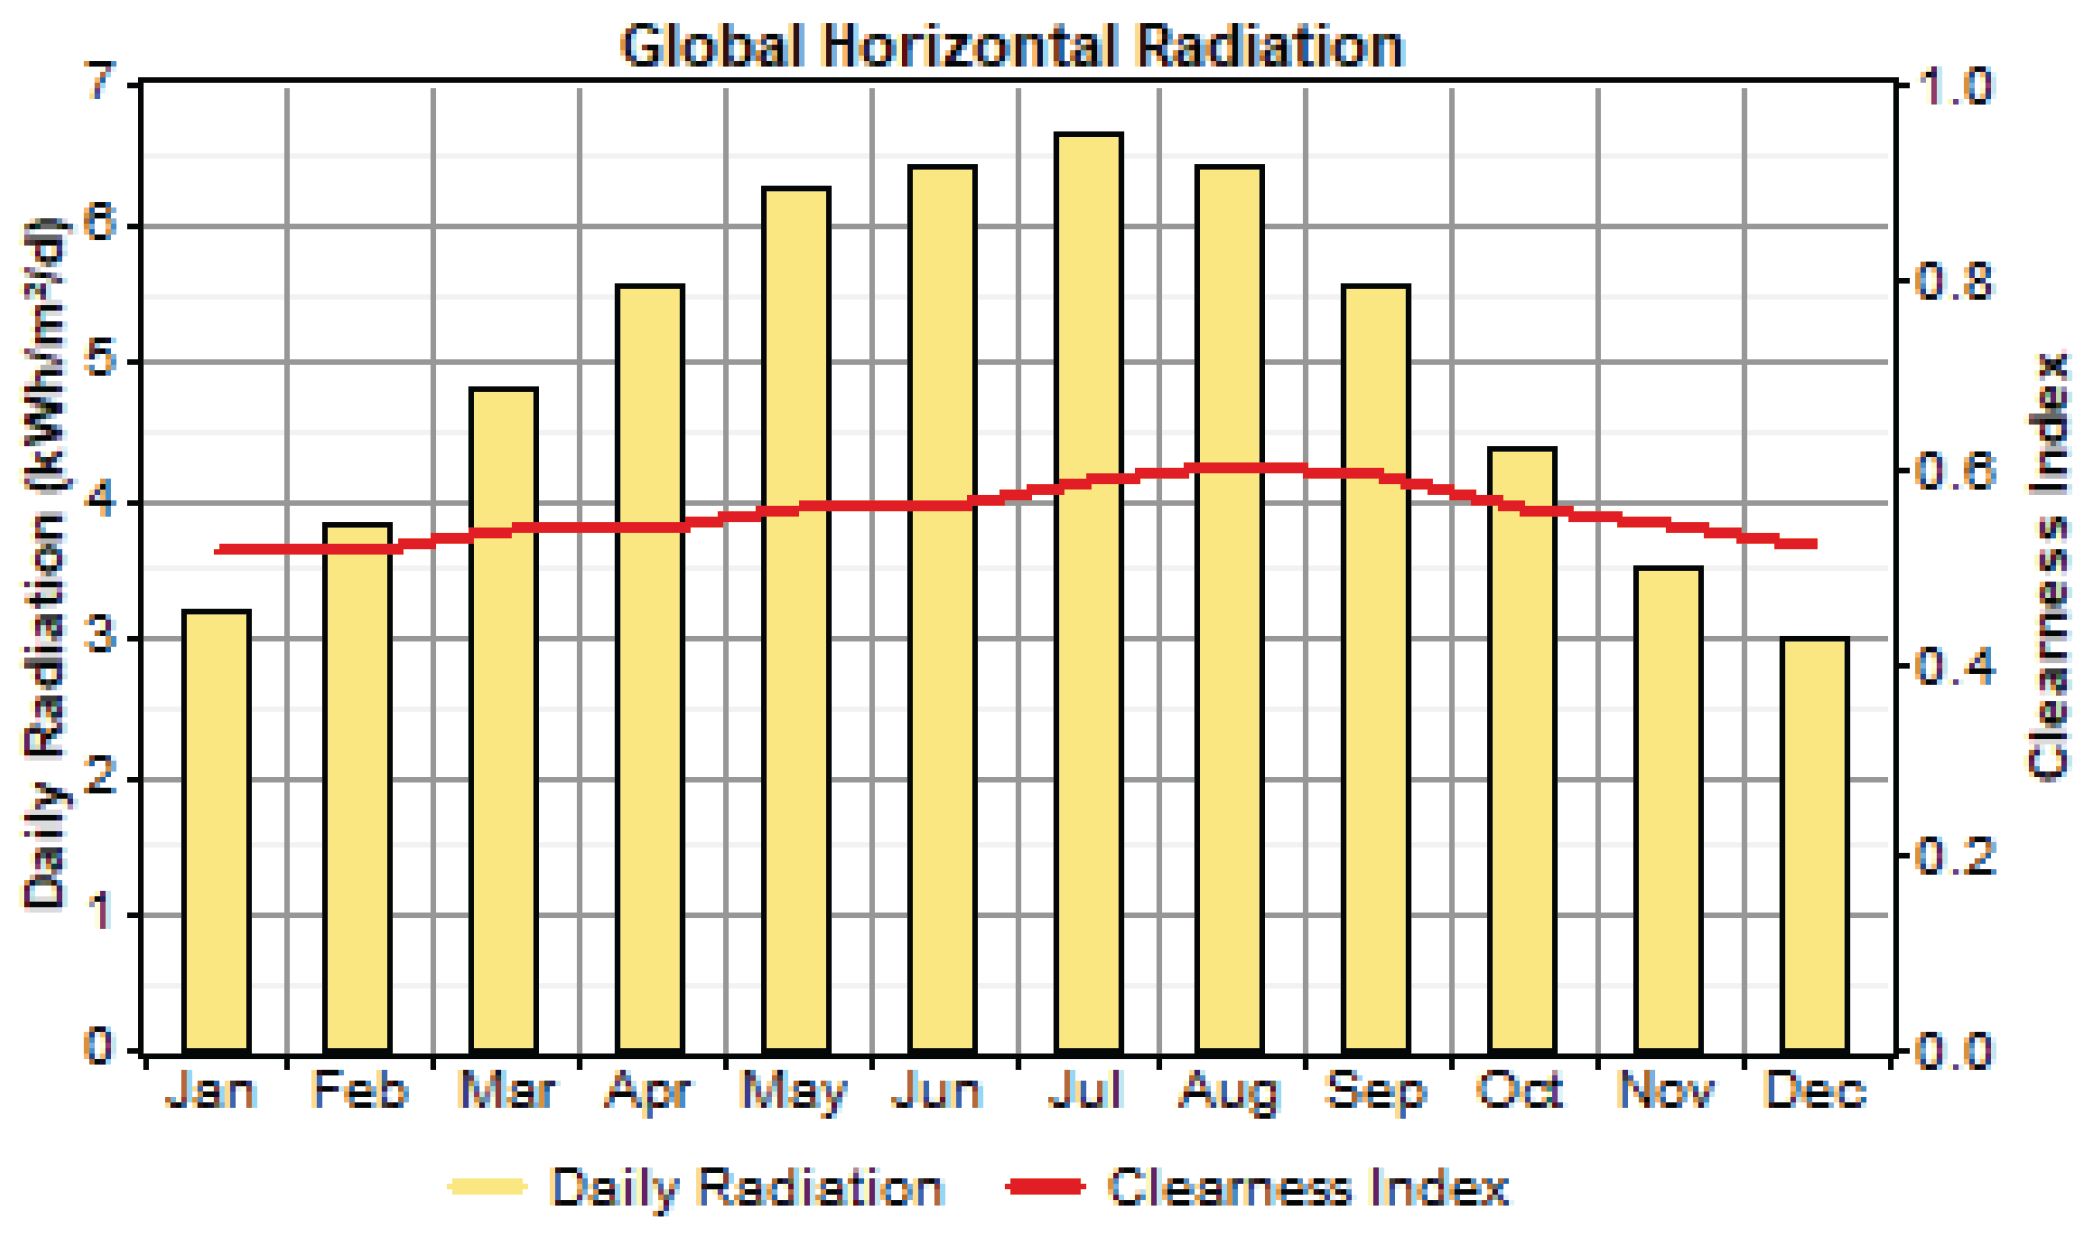
Figure 6.
Annual solar radiation on Gran Canaria.
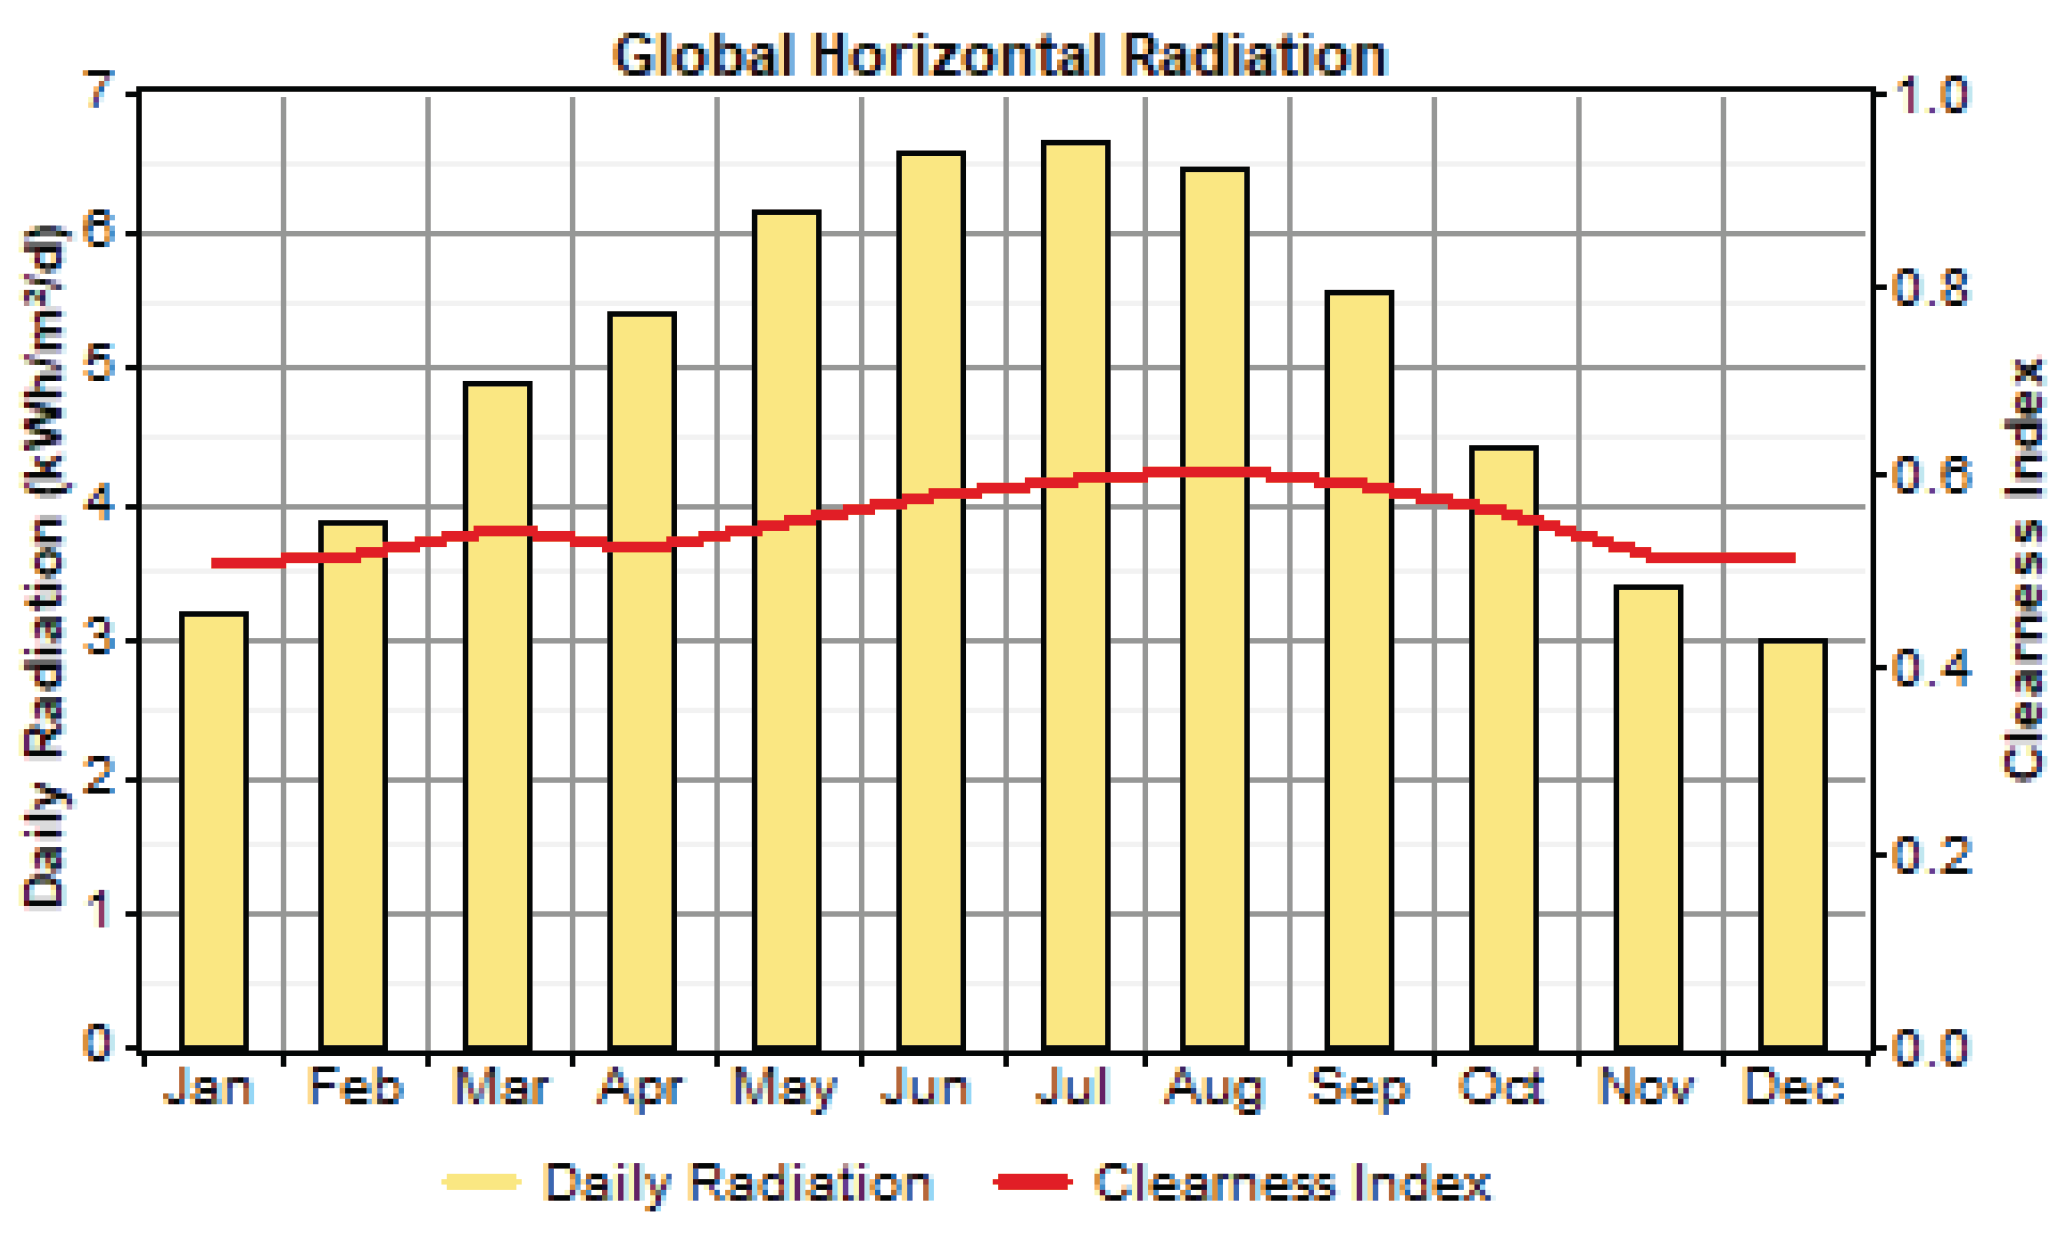
Figure 7.
Weibull distribution of annual wind speeds (m/s) on Lanzarote.
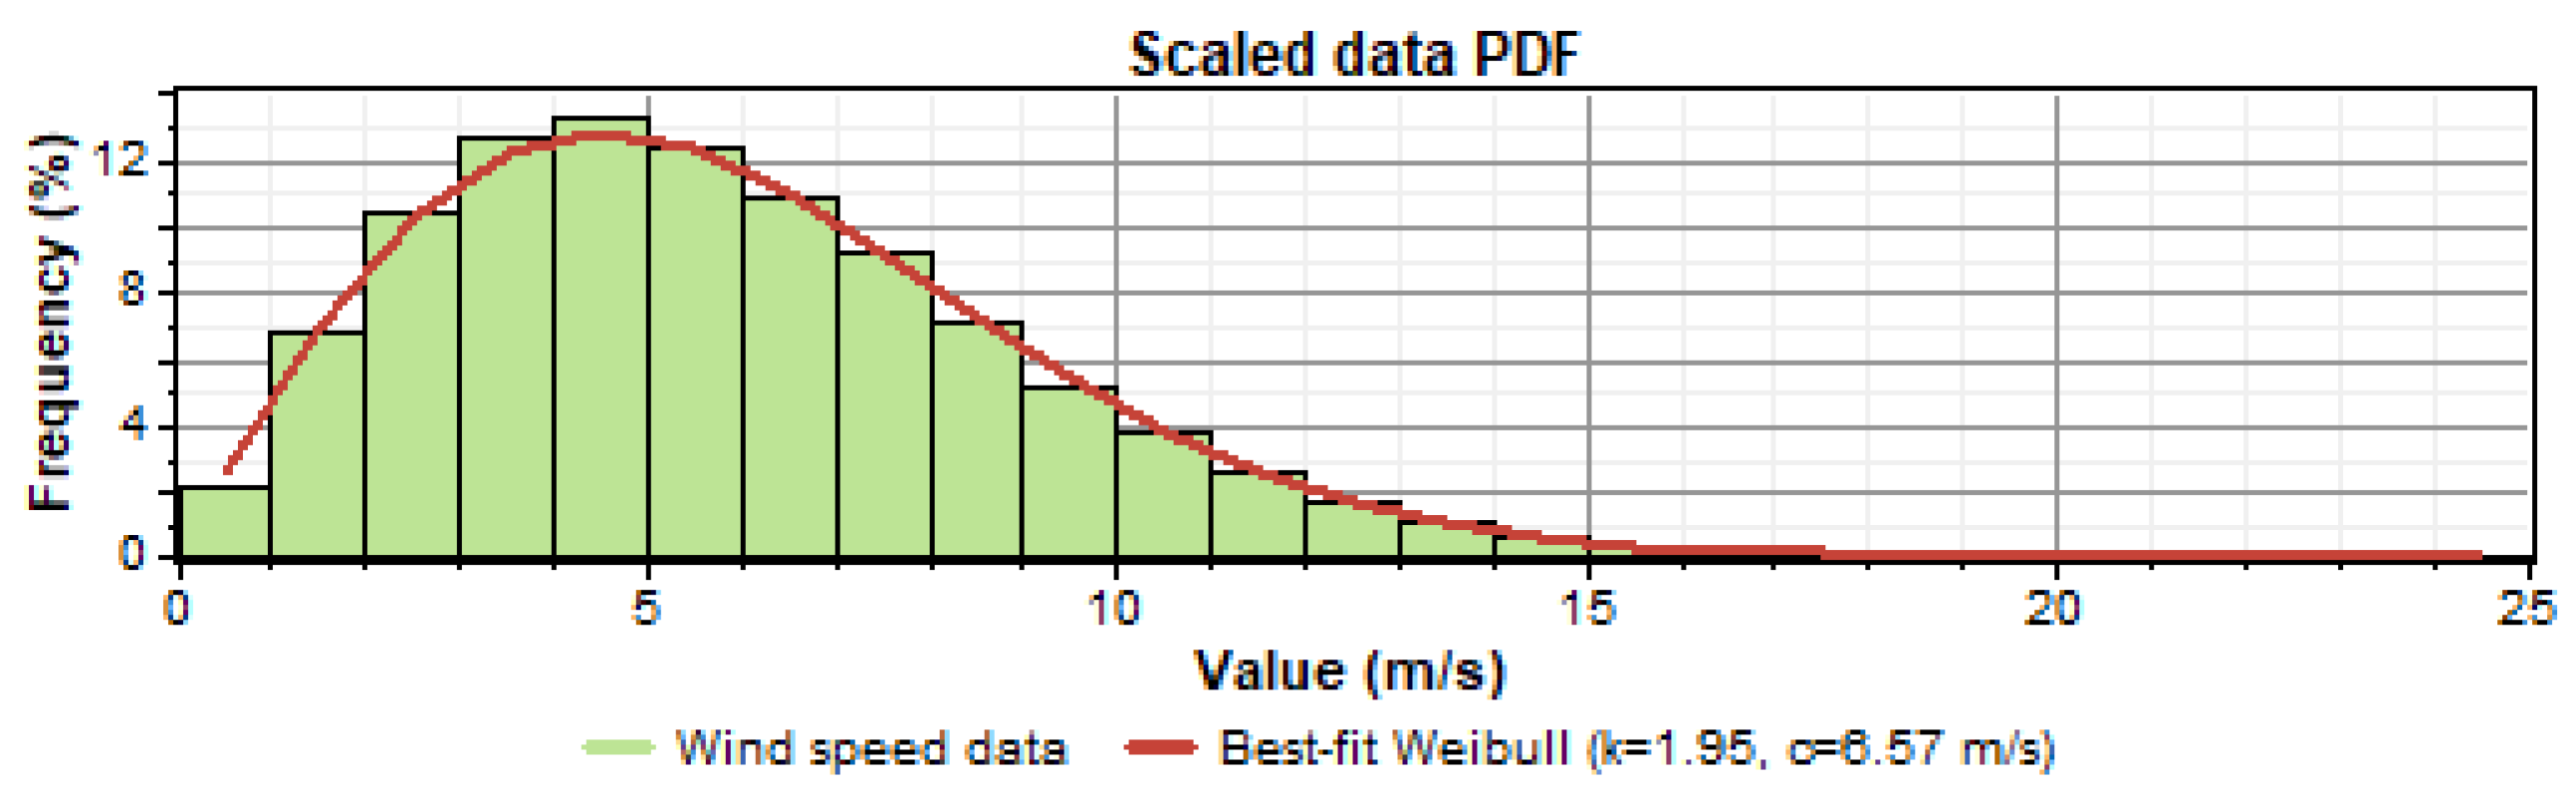
Figure 8.
Weibull distribution of annual wind speeds (m/s) on Fuerteventura.
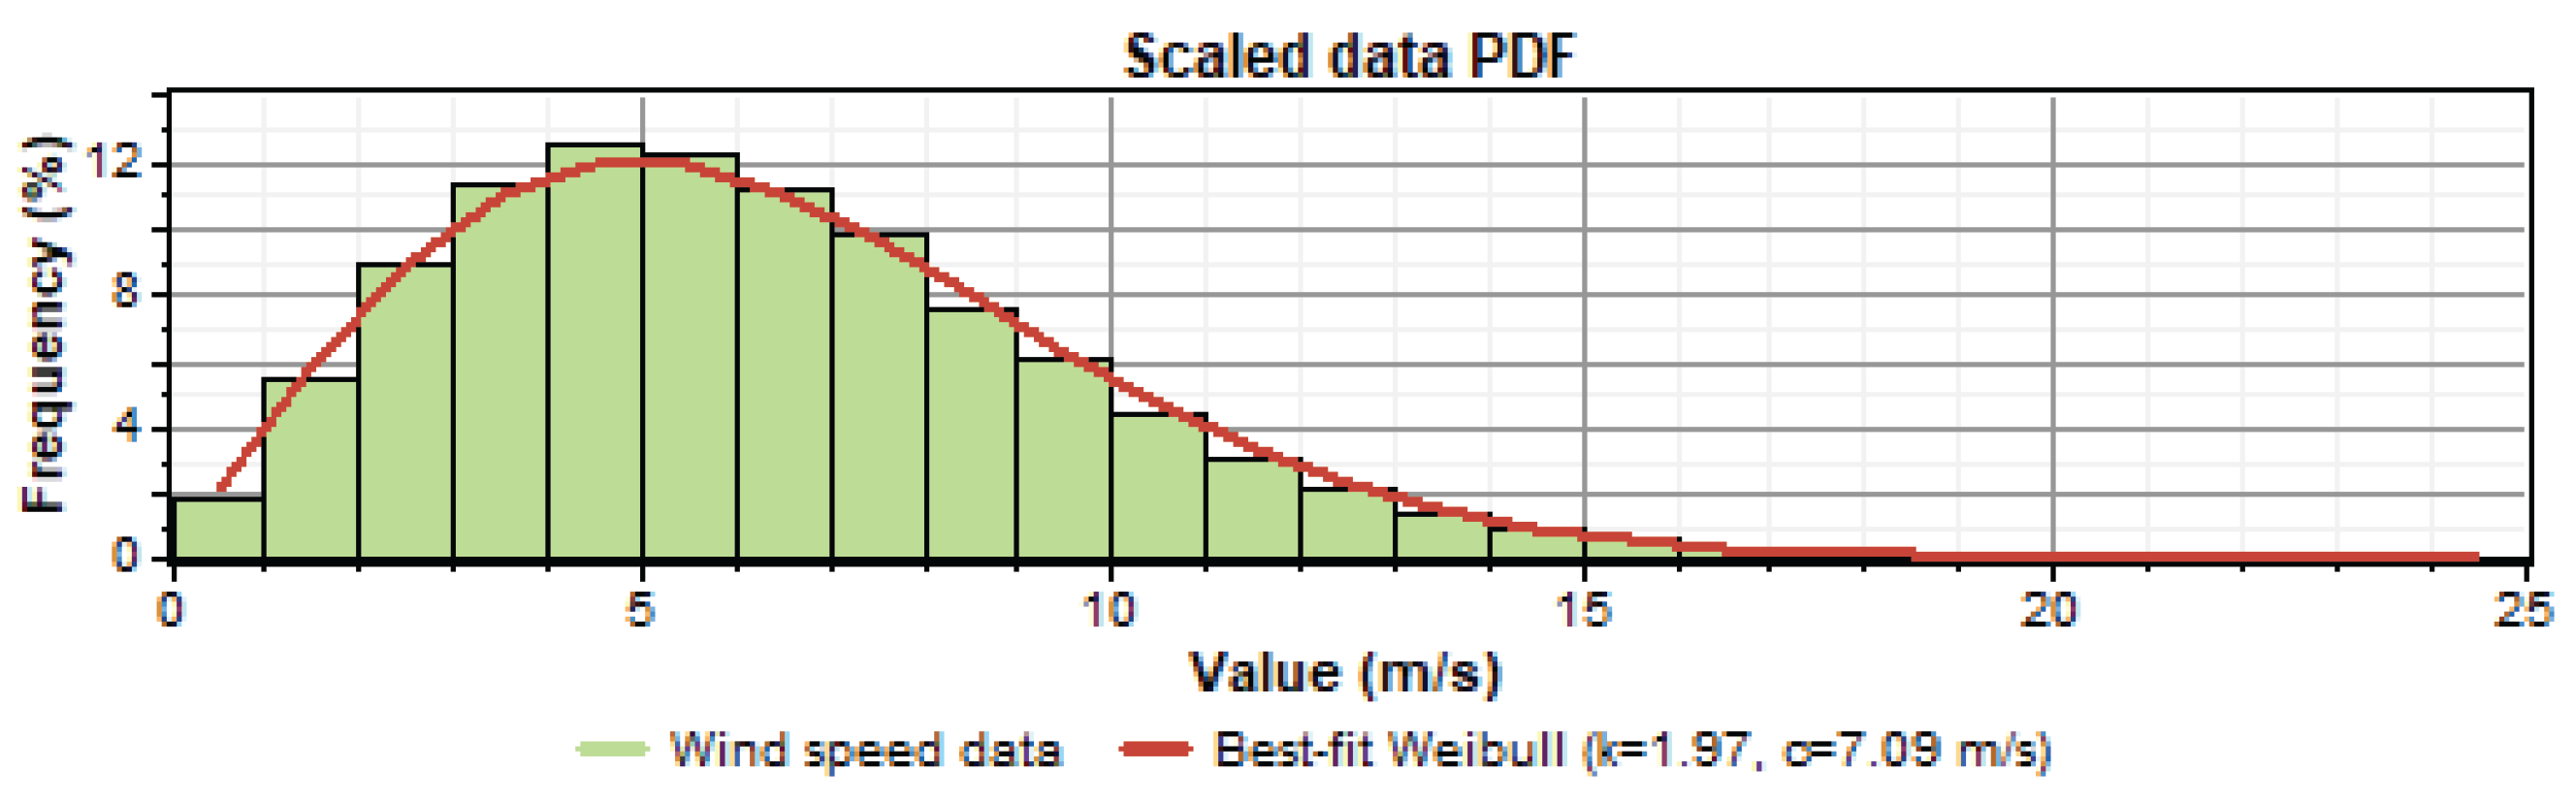
Figure 9.
Weibull distribution of annual wind speeds (m/s) on Gran Canaria.
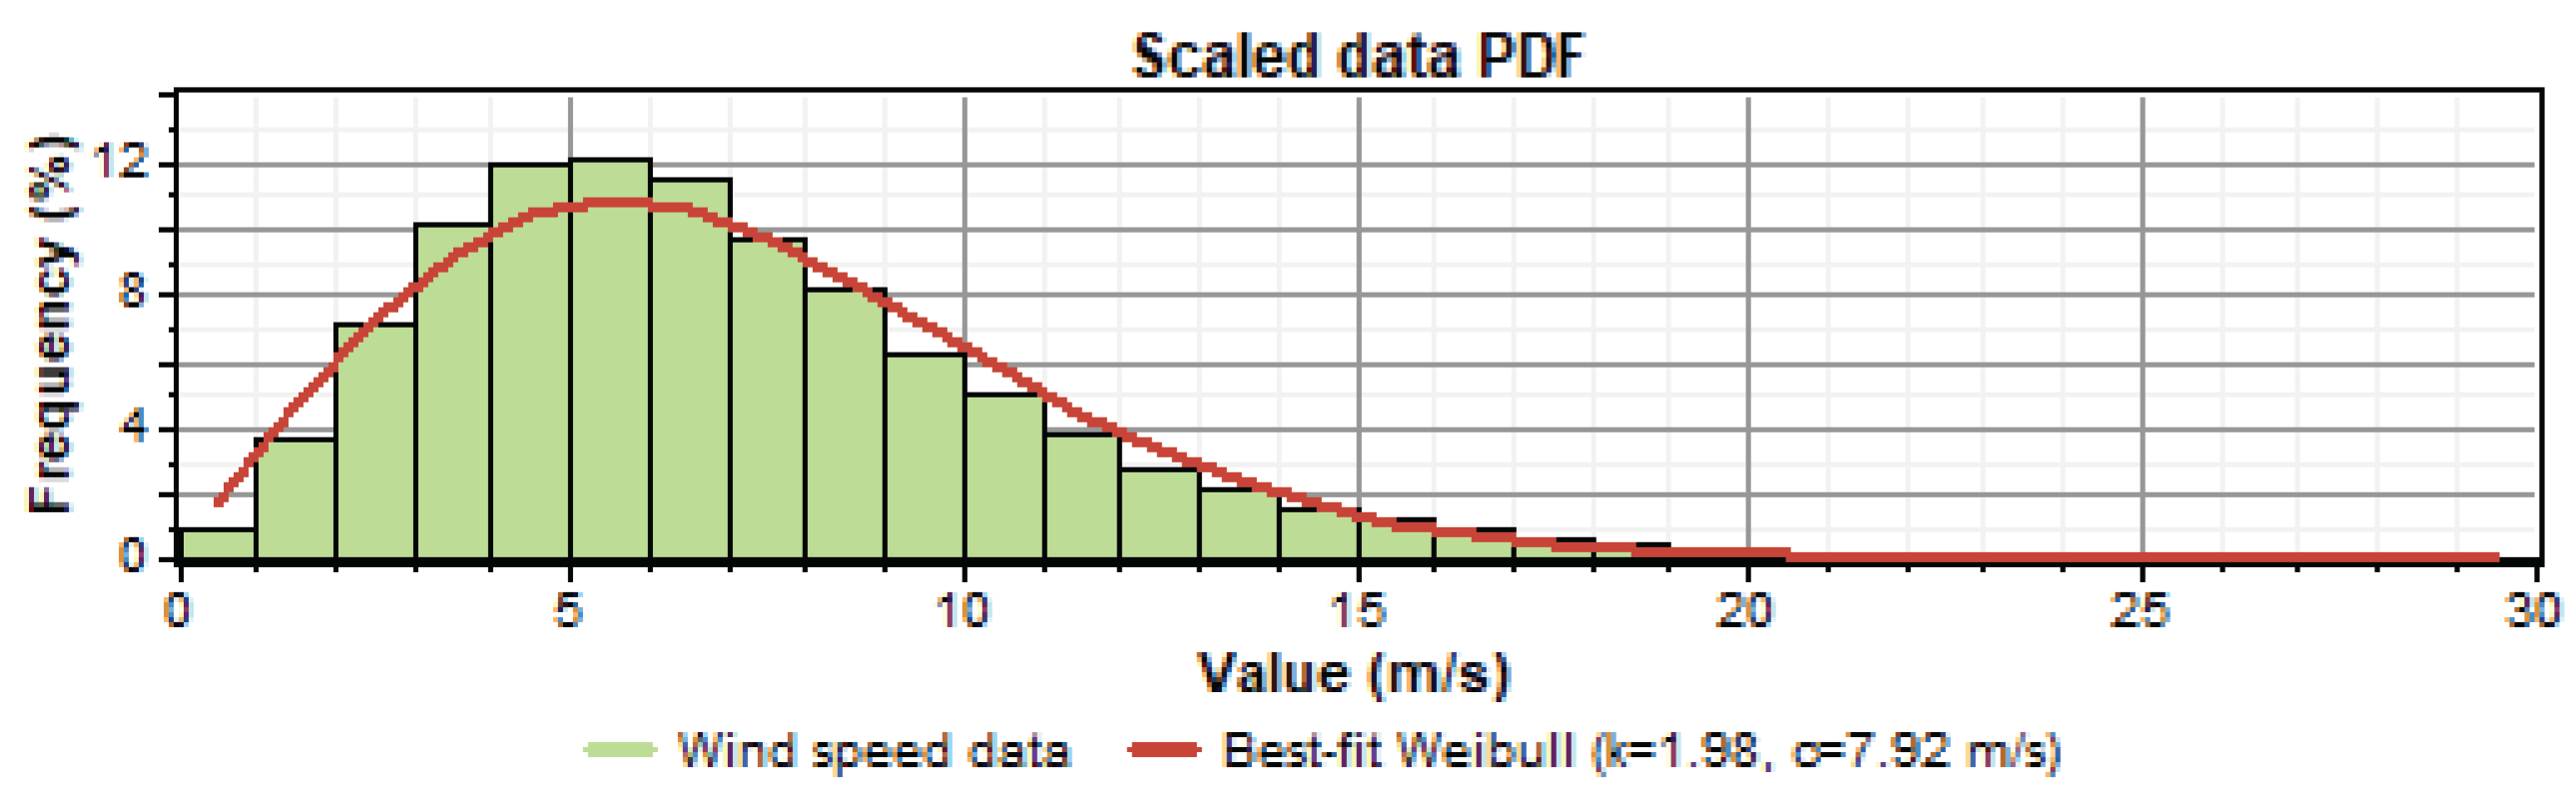
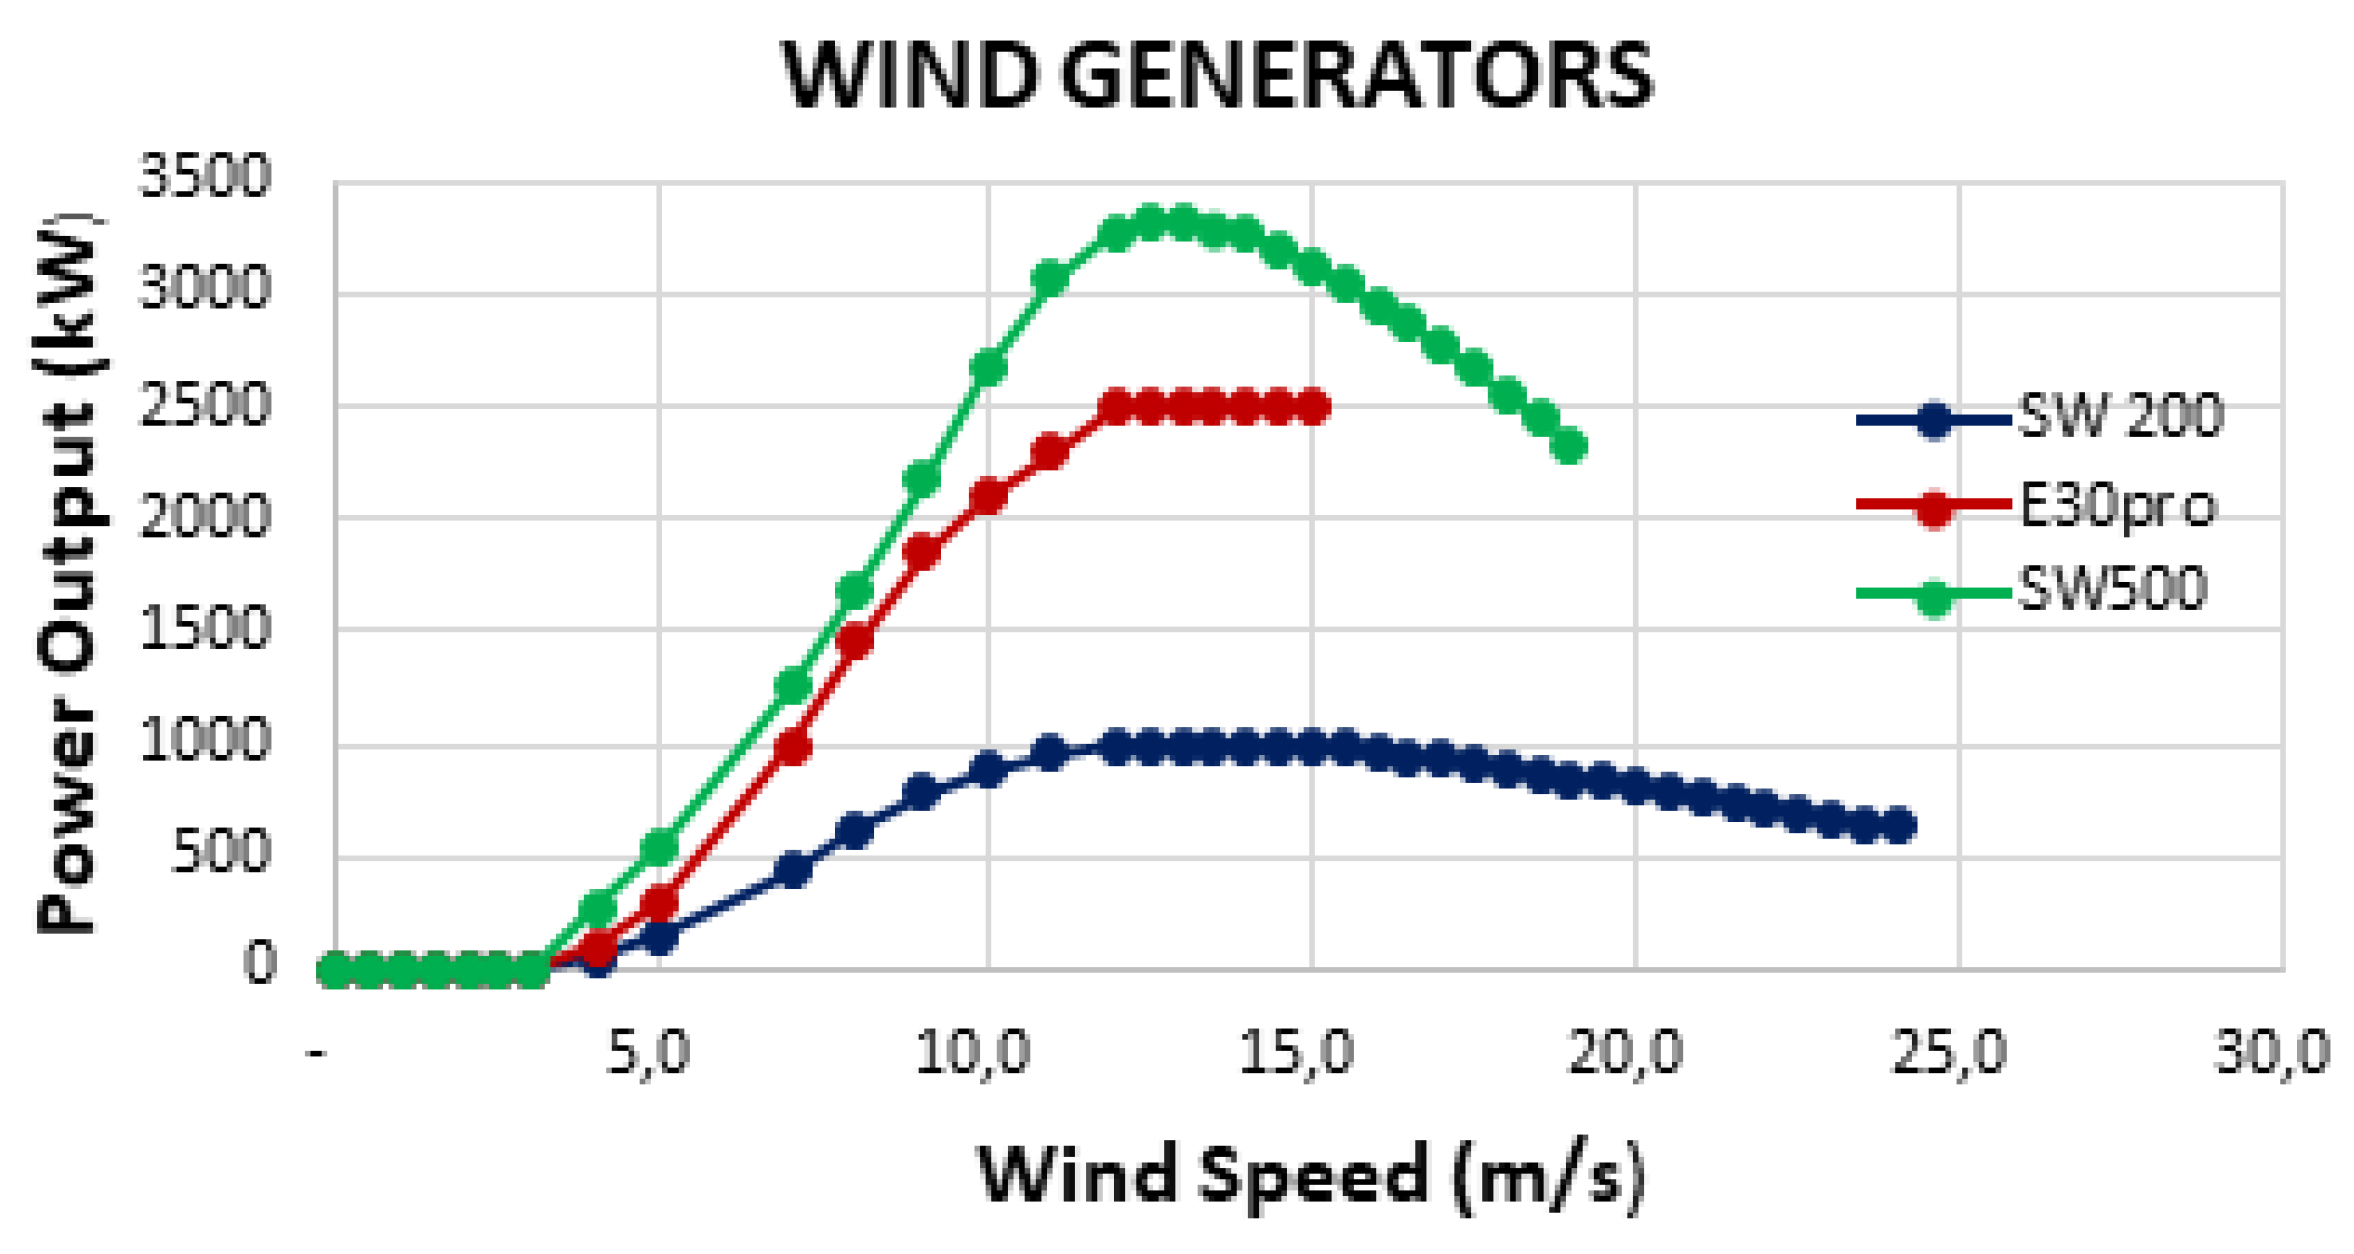
Table 1.
Daily electricity consumption of a residential house with a standard number of appliances.
| Device | Number of devices | Power (W) | Daily operation time (h/day) | Daily electrical consumption (kWh/ day) |
|---|---|---|---|---|
| Indoor lighting | 10 | 12 | 10 | 1.200 |
| Outdoor lighting | 6 | 24 | 8 | 1.152 |
| Ceiling fan | 2 | 55 | 10 | 1.100 |
| Table fan | 3 | 40 | 10 | 1.200 |
| Refrigerator | 1 | 300 | 24 | 7.200 |
| TV | 2 | 200 | 6 | 2.400 |
| Microwaves | 1 | 700 | 1 | 0.700 |
| Electric cooktop | 1 | 4000 | 2 | 8.000 |
| Washing machine | 1 | 1500 | 1 | 1.500 |
| Other loads | - | 1000 | 1 | 1.000 |
| Desalination plant | 1 | 210 | 24 | 5.040 |
| Total | 27 | 7831 | 30.492 |
Table 2.
Coordinates of the Meteorological stations on the three eastern islands.
| Meteorological Station |
Coordinates (Latitude and Longitude) |
Altitude (m) (Above mean sea level) |
|---|---|---|
| Gran Canaria | Latitude: 27° 55' 21'' N Longitude: 15° 23' 22'' W |
24 |
| Fuerteventura | Latitude: 28° 26' 41'' N Longitude: 13° 51' 47'' W |
25 |
| Lanzarote | Latitude: 28° 57' 7'' N Longitude: 13° 36' 1'' W |
14 |
| Technical parameter | SW 200 | E30pro | SW500 |
|---|---|---|---|
| Rotor diameter (m) | 2.7 | 3.8 | 4.5 |
| Nominal Power (kW) | 1.0 | 1.9 | 3.0 |
| Hub height (m) | 10 | 13 | 13 |
| Cut-in wind speed (m/s) | 3.1 | 1.8 | 3.4 |
| Cut-out wind speed (m/s) | 55 | 60 | 55 |
Table 5.
Technical results.
| Island | PV(kW) | WT(number), (Type) |
Battery (number) |
Converter (kW) |
DG(kW) | Diesel (l) | GEN (hrs) |
|---|---|---|---|---|---|---|---|
| Lanzarote | 0 | 1 – (E30pro) | 8 | 2 | 1 | 8 | 24 |
| Fuerteventura | 0 | 1 – (E30pro) | 8 | 2 | 1 | 18 | 57 |
| Gran Canaria | 0 | 1 – (E30pro) | 8 | 2 | 1 | 23 | 71 |
Table 6.
Economic results.
| Island | Initial Capital ($) |
Operating Cost ($/year) |
Total NPC ($) |
COE ($/kWh) |
|---|---|---|---|---|
| Lanzarote | 20,400 | 830 | 29,993 | 0.223 |
| Fuerteventura | 20,400 | 869 | 30,372 | 0.227 |
| Gran Canaria | 20,400 | 843 | 30,073 | 0.225 |
Table 7.
Pollutants avoided by the HRES.
| Proposed HRES |
Pollutant | Emissions avoided Lanzarote (kg/year) |
Emissions avoided Fuerteventura (kg/year) |
Emissions avoided Gran Canaria (kg/year) |
|---|---|---|---|---|
| 1 WT_E30pro 8 batteries 1 converter (2.0 kW) 1 D. generator (1.0 kW) |
CO2 | 7244 | 7214 | 7204 |
| SO2 | 15 | 14.5 | 14.5 | |
| NOx | 160 | 159 | 159 |
Disclaimer/Publisher’s Note: The statements, opinions and data contained in all publications are solely those of the individual author(s) and contributor(s) and not of MDPI and/or the editor(s). MDPI and/or the editor(s) disclaim responsibility for any injury to people or property resulting from any ideas, methods, instructions or products referred to in the content. |
© 2025 by the authors. Licensee MDPI, Basel, Switzerland. This article is an open access article distributed under the terms and conditions of the Creative Commons Attribution (CC BY) license (http://creativecommons.org/licenses/by/4.0/).
Copyright: This open access article is published under a Creative Commons CC BY 4.0 license, which permit the free download, distribution, and reuse, provided that the author and preprint are cited in any reuse.


