
Submitted:
28 July 2025
Posted:
29 July 2025
You are already at the latest version
Abstract
The decline in fossil fuels and environmental pollution have made renewable energy sources essential. In this context, solar and wind energy have come to the forefront to re-duce carbon emissions. While wind energy was previously used for agriculture and water pumping, today its largest contribution is electricity generation. It is rapidly gaining pop-ularity due to its environmental friendliness and affordability. Wind turbines consist of a tower, rotor, shaft, generator, and blades. Blades are critical for system efficiency and en-vironmental protection. While metal materials were initially used, composite materials have now been adopted. Composites offer properties such as light weight, durability, cor-rosion resistance, and long life. Approximately 95% of the composite material used in tur-bine blades is glass fiber and 5% is carbon fiber. The reasons for the preference of glass fi-ber-reinforced composites (GFRP) are low cost, light weight, easy raw material supply, and high mechanical strength. It also offers advantages such as impact resistance, fatigue life, corrosion resistance, and easy shaping during production. Thanks to these properties, glass fiber offers both an economical and structurally safe solution for large-scale blades. The aim of this study is to experimentally investigate the damage processes occurring in the adhesively bonded areas of fiber-reinforced polymer composite materials commonly used in offshore wind turbine blades.
Carbon fiber-reinforced composites (CFRP) offer significantly higher strength and stiffness than glass fiber, enabling them to carry the same loads with thinner and lighter structures. However, due to its higher cost and more complex manufacturing process, the use of car-bon fiber is limited. It is generally used in specialized turbines or blade tips requiring high performance. While glass fiber offers an ideal solution for general use, carbon fiber is pre-ferred to a lesser extent as a support or complement in critical areas. GFRP and CFRP specimens were prepared as 7-layer and 8-layer laminates, respectively, using unidirec-tional twill weave with a 90° orientation. A total of 24 specimens were cut according to ASTM D5868-01. Epoxy and hardener were applied to the prepregs by hand lay-up, fol-lowed by a one-day curing process. After resin gelation, the composites were produced using a hot press method. To examine the marine performance of adhesively bonded joints, commonly used in offshore wind turbine blades, single-layer adhesively bonded specimens were conditioned in separate containers for 1, 2, and 3 months in natural sea-water obtained from the Aegean Sea at 21.0°C and with a salinity of 3.3–3.7%. During this period, the moisture absorption of the joints was weighed periodically using high-precision scales. The obtained data was compared with dry reference samples to characterize the moisture absorption behavior in terms of weight change (%).
To evaluate the mechanical strength of the specimens under the influence of humidity, four-point bending tests were conducted in accordance with the ASTM D790 standard. The damage types and microstructural deteriorations observed during the tests were examined in detail using a ZEISS GEMINI SEM 560 scanning electron microscope (SEM), which pro-vides high-resolution imaging. These analyses provided comprehensive experimental findings regarding the physical and mechanical effects on adhesively bonded composite joints. In the experimental studies, maximum moisture absorption in GFRP specimens was: After 1, 2, and 3 months of seawater exposure, the moisture absorption rates were measured as 1.02%, 2.97%, and 3.78%, respectively. In CFRP samples tested under the same conditions, the moisture absorption rates were determined as 0.49%, 0.76%, and 0.91%, respectively.
According to the results of the four-point bending tests, Young's modulus in GFRP sing-le-lap adhesively bonded joints decreased by 3.15%, 6.42%, and 9.45% for the respective durations compared to specimens tested in a dry environment. Similarly, Young's modu-lus in CFRP single-lap joints decreased by 1.29%, 2.62%, and 3.48% depending on the du-ration of moisture exposure. These results demonstrate that environmental conditions, particularly those of GFRP materials, have a more pronounced impact on their mechanical performance.
Keywords:
adhesively bonded joints
; composite materials
; four-point bending test
; mechanical properties
; young’s modulus
1. Introduction
Today, thanks to their advantages such as high strength-to-weight ratio, corrosion resistance, and design flexibility, composite materials have become strategically important multiphase structures in many engineering fields, from aerospace and automotive to construction and energy systems (Mallick, 2007; Daniel & Ishai, 2006). These materials are formed by combining two or more phases with different physical and chemical properties in a specific order, and the resulting structure offers advanced properties that individual components cannot provide [1].
Due to these properties, fiber-reinforced polymer (FRP) composites, widely used in wind turbine blades, are preferred for reducing weight while increasing structural strength, especially for large blade spans. However, in such structures, the adhesively bonded regions where different composite parts are connected can become critical damage zones due to environmental effects, cyclic loading, and fatigue over time. In this context, understanding the damage formation at the interface and adhesion regions of composite materials is crucial for the long-term safety and structural integrity of wind turbines.
Structural integrity in wind turbine blades depends not only on the mechanical properties of the components but also on the interface quality, fiber orientation, and the manufacturing process. The interface region, in particular, is critical because it facilitates stress transfer between the matrix and fibers. Weaknesses in this region can hinder load transfer and reduce the overall performance of the structure [2,3]. Under dynamic conditions, such as cyclic loading, temperature changes, and wind-induced vibrations, the behavior of composites becomes complex. Fiber orientation has a direct impact on load-carrying capacity and is crucial for ensuring optimal performance in turbine blades, particularly against aerodynamic forces [4]. To improve the performance of composites used in wind turbines, issues such as interface, moisture effects, aging behavior, and the behavior of binder systems should be thoroughly investigated. In this context, the durability of the material against long-term environmental exposure is crucial for safe design in the wind energy sector. Fiber-reinforced polymer (FRP) composite materials are preferred, especially for large-scale wind turbine blades, due to their advantages such as high strength-to-weight ratio, corrosion resistance, and deformability. However, such structures are determined not only by the internal properties of the material but also by the mechanical behavior in the joints. Since wind turbine blades are constructed by assembling various composite parts, the adhesively bonded joints can become one of the weakest links in the structure. Damage types that occur in these areas over time, such as debonding, delamination, and crack propagation, directly affect both structural safety and lifespan [5,6]. Wind energy is an environmentally friendly and high-potential renewable energy source. Wind turbines convert kinetic energy into electrical energy. Turbine blades directly affect the efficiency and cost of the system. Therefore, lightweight and high-strength composite materials—especially glass- or carbon fiber-reinforced epoxy-based structures—are preferred [7].
Some of the studies conducted are as follows;
Khoshmanesh et al. (2022) investigated the damage progression of bonded joints by monitoring changes in vibration properties. In the study, stiffness and damping coefficients were analyzed using extensometers placed in the joint area under fatigue loads. According to the findings, three different damage stages were identified: In the first stage, cracking initiates, but stiffness remains unchanged, while damping increases by 18%. In the second stage, crack density increases, stiffness decreases, and damping increases further. In the third stage, debonding becomes apparent, stiffness decreases by around 8%, and damping increases by up to 117%. These results demonstrate how sensitive indicators of dynamic parameters in the joint area are in terms of structural health monitoring [5].
Mertgenç Yoldaş and Yoldaş (2025) investigated the mechanical performance of glass fiber-reinforced (GFRP) and carbon fiber-reinforced (CFRP) composites after exposure to seawater. Specimens were immersed in seawater at 3.3–3.7% salinity and 23.5°C for 1 to 15 months and subjected to axial impact tests according to ASTM D5868-01. Moisture absorption and fracture behavior were compared in specimens tested under 30 J energy. Interface structures were examined in detail using SEM analyses. After 15 months, an increase in fracture toughness of GFRP was observed to 27.96%, while that of CFRP was observed to 11.96%. Despite the effect of humidity, CFRP specimens generally exhibited superior mechanical performance [8].
Yalçınkaya et al. (2025) investigated the mechanical behavior of GFRP and CFRP composites after exposure to seawater for marine applications. Specimens were immersed in Aegean Sea water for 30 and 60 days, and then subjected to moisture retention, Charpy impact, and three-point bending tests. The results showed that CFRP specimens exhibited lower moisture absorption and a more stable modulus of elasticity than GFRP. GFRP absorbed more energy but exhibited more brittle behavior. Overall, CFRP’s mechanical performance was superior to GFRP [9]. Ji and Han (2014) investigated the crack behavior in adhesively bonded wind turbine blades using the cohesive zone model (CZM) and the finite element method (FEM). The study determined that high shear stresses, in particular, initiated damage at the joint line, initiating this damage from the joint edges and leading to progressive crack growth under load. Modeling results were also supported by experimental findings, emphasizing the determinant role of adhesive thickness and material compatibility in damage behavior [10].
Khoshmanesh et al. (2023) investigated the development of a method for local damage detection in spar cover and shear web joints with thick adhesive layers. In this study, phase changes in mode shapes were observed due to microdamage occurring in the joint area, and this change provided important clues about the location and magnitude of damage. This study, conducted under fatigue tests, demonstrated that mode shape phase analysis can detect damage at an early stage [11].
Rosemeier et al. (2019) investigated the sensitivity of adhesively bonded joints not only to mechanical loading but also to residual stresses and environmental influences originating from the manufacturing process. It was shown that differences in thermal expansion during the manufacturing process caused tunneling cracks in the joint area. These internal stresses, rather than the mechanical load, facilitated crack propagation over time and reduced the life of the structure. Moisture penetration has also been cited as a factor accelerating the propagation of these cracks [12].
Rafiee and Hashemi-Taheri (2021) analyzed the effects of adhesive thickness and tape width on the performance of trailing edge joints using three-dimensional finite elements and cohesive zone models (CZM). The results showed that selecting the appropriate adhesive thickness can significantly improve joint strength and prevent damage propagation [13].
Four-point bending tests are widely used to evaluate the bending behavior of composite materials used in wind turbine blades. In this regard,
Musial, W., and Butterfield, S. (2001) investigated a study conducted by the US National Renewable Energy Laboratory (NREL). In a study conducted by the US National Renewable Energy Laboratory (NREL), pultrusion-produced glass fiber-reinforced composite panels were subjected to full-scale four-point bending tests. 2.4-meter-long panel specimens were tested in different configurations, receiving loads from both high-pressure and low-pressure surfaces. As a result of the study, early local buckling was observed, especially on high-pressure surfaces; however, it was determined that the structures continued to carry loads for some time after buckling. This shows that buckling behavior is not always a strength criterion and that the load-carrying capacity of the structure can be maintained through alternative load paths [14].
Wang et al. (2023) investigated the behavior of composite box-beam profiles representing a wind turbine blade structure under four-point bending. This study, which used three different profile designs, tested two different configurations, including inverted V-shaped and X-shaped stiffeners, in addition to the basic profile. Four-point bending tests revealed that the stiffening structures increased stiffness and significantly reduced displacement. In the inverted V-shaped profile, stiffness increased by 43.41%, while maximum displacement decreased by 30%. Furthermore, modeling studies using finite element analysis showed high agreement with experimental data, indicating that the maximum deflection remained at 11%. When examining the fracture modes, matrix cracking, laminate separation, and local fractures at the joints were observed [15].
Musial et al. (2001) investigated pultrusion-produced glass fiber-reinforced polymer (GFRP) blade segments and evaluated them as panels. The panels were subjected to four-point bending tests in different configurations based on high and low-pressure surfaces. The results showed that although local buckling occurred under load, the panels continued to carry the load after buckling. This revealed that buckling may not always indicate the fracture strength of the structure [16].
Arwood et al. (2025) investigated the mechanical behavior of carbon fiber-reinforced polymer (CFRP) panels produced by pultrusion method in detail through four-point bending tests. The test method used in the study aimed to evaluate the strain distribution to which the panels were subjected under large-span loading conditions. During the experimental process, strain changes on the surface of the panels were monitored using high-resolution fiber optic sensor technology. The obtained data revealed that the four-point bending test allows for detailed analysis of the stress fields and material responses, especially those occurring in the loading zone [17].
The primary objective of this study is to experimentally investigate the damage processes occurring in the adhesively bonded joints of fiber-reinforced polymer (FRP) composite materials, commonly used in offshore wind turbine blades. Adhesive joints play a crucial role in ensuring turbine blades meet design criteria such as lightweight, high strength, and aerodynamic efficiency. To this end, the adhesive type and joint performance under loading were evaluated. In particular, the four-point bending test was used to analyze the stress distribution, damage formation, and propagation mechanisms in the joints in detail. The findings will contribute to design and material selection strategies to improve the reliability of adhesively bonded joints.
2. Materials and Methods
The composite materials used in the study were designed in two different types: glass fiber-reinforced polymer (GFRP) and carbon fiber-reinforced polymer (CFRP). GFRP laminates consist of seven layers, while CFRP laminates consist of eight layers, taking into account volume and density ratio. In both composites, the fiber orientation is arranged at 0/90 degrees, and the weave type is twill weave. The fiber used in the GFRP consists of a glass fiber weft yarn with a density of 390 g/m², while in the CFRP, a 3K carbon fiber weft yarn with a density of 245 g/m² was used.
Prepreg production was carried out on a drum-type prepreg machine for both composites, and the same resin system was used for both material groups. This system consists of F-RES 21 epoxy resin and F-Hard 22 hardener. The laminate thickness was determined to be 2 mm for both composites. GFRP and CFRP sheets are produced by Fibermak Engineering Company, which operates in Izmir, Turkey.
The epoxy-based resin system used in the production of composite materials consists of RES 21 epoxy resin and F-Hard 22 hardener. These two components were mixed at a 100:21 weight ratio to obtain a homogeneous mixture. The viscosity of this mixture at 25°C was measured in the range of 500–800 mPa·s. Following prepreg production, curing was carried out at 120°C for 60 minutes to achieve final hardness. The epoxy and hardener mixture was applied to the fiber-reinforced structure using the hand lay-up method, and the prepreg material was left at room temperature for one day to complete the gelation process. Composite laminates were then produced using the hot press method; this process was carried out at 120°C and 8–10 bar for one hour. The GFRP and CFRP composite sheets produced were designed to measure 500 mm × 500 mm, and a CNC router was used for precision cutting (Figure 1). The mechanical properties of the composite structures obtained after curing were determined to be tensile strength 80 MPa and tensile modulus 3300 MPa. Flexural strength was 125 MPa and flexural modulus 3200 MPa.
The GFRP and CFRP specimens were prepared in accordance with ASTM D5868–01 [18], the standard test method for evaluating lap shear strength in fiber-reinforced plastic (FRP) adhesively bonded joints (Figure 2). Accordingly, the test specimens were cut to appropriate dimensions and shaped to allow for the examination of both moisture absorption and adhesive bond performance. During the preparation phase for the bonding process, reference points located 25 mm from the ends of the GFRP and CFRP specimens were determined, and the corresponding markings were made (Figure 3).
The samples were prepared by bonding solvent-cleaned surfaces using the adhesive bonding method. The bonding was performed using Loctite Hysol-9466 (Alpanhidrolik, Eskişehir, Turkey), a two-component epoxy adhesive that cures at room temperature and is mixed at a 2:1 ratio in the application gun (Figure 4a). Literature indicates that maintaining the adhesive thickness between 0.1 and 0.3 mm provides optimum bond strength, while thicknesses exceeding 0.6 mm result in a decrease in mechanical strength. This is explained by the fact that thin adhesive layers can utilize mechanical strength more efficiently [19]. Therefore, the adhesive layer thickness was set at 0.2 mm, and application was carried out under a constant pressure of 0.1 MPa. The homogeneity of the adhesive layer was checked with a digital caliper. The samples were allowed to cure at room temperature for 7 days in accordance with the product technical data sheet (Figure 4b).
To prevent confusion during the experimental process, the samples were assigned distinctive codes in both Turkish and English. The English code structure was organized to include information on the material type, number of layers, test method, environmental conditions, and sample order. For example, the code GFRP-7L-FPBT-2M-1S represents a seven-layer (7L) glass fiber-reinforced plastic (GFRP) sample subjected to four-point bending test (FPBT), immersed in seawater for two months (2M), and the first-row sample (1S). The same sample was coded in Turkish as GFRP-7K-DNET-2AY-1N. Here, GFRP represents glass fiber-reinforced plastic (GFRP), 7K represents the number of layers, DNET represents the four-point bending test, 2AY represents the two-month immersion period in seawater, and 1N represents the sample number (Figure 5). This bilingual coding approach facilitated the accurate identification of samples throughout the experiment and facilitated the collection of experimental data (Table 1).
The samples were prepared using the single-lap joint method and divided into three experimental groups for exposure to different environmental conditions. The first group was stored in dry conditions, while the other groups were stored in seawater with a salinity of 3.3–3.7% and a constant temperature of 21°C for 1, 2, and 3 months, respectively. The salinity and temperature of the seawater to which the samples were exposed were kept constant throughout the experimental period (Figure 6)
2.1. Comparative Investigation of Moisture Absorption Tendencies of GFRP and CFRP Composite Specimens Under the Effect of Sea Water
GFRP and CFRP composite specimens were prepared using the single-layer adhesive bonding method and subjected to aging in seawater conditions. To examine the moisture sorption behavior of the samples, each group of samples was stored in separate containers in seawater with a salinity of 3.3–3.7% and an average temperature of 21°C for 1, 2, and 3 months. Weight measurements were carried out using an analytical balance with a sensitivity of 0.1 mg at the Dokuz Eylül University Faculty of Science, Daihan Biomedical Chemistry Department Laboratory (Daihan Biomedical, DAIHAN Scientific Laboratory & Medical Instruments Manufacturer, Korea). A total of 12 measurements were made using three standard samples and dry reference samples for each aging period and sample type. Graphs were generated for the average mass changes of the samples based on the obtained data (Figure 7).
2.2. Four Point Bending Test
Because composite structures used in wind turbine blades operate under both aerodynamic and structural loads, reliable assessment of their mechanical performance is crucial. Four-point bending tests are preferred to understand the behavior of blade sections under bending, especially in modern turbines with long blade geometries. This test method creates a constant moment region along the specimen, allowing for detailed observation of both elastic and plastic behavior.
Four-point bending testing is a mechanical testing method used to evaluate the elastic and plastic deformation behavior of materials. This test is particularly used to determine properties such as flexural strength, elastic modulus, ductility, and fracture toughness in composite materials. In a four-point bending test, the specimen is supported at both ends, and two equal loads are applied. The region between the loading points is the pure bending region, where shear stresses are close to zero. This allows for a more even analysis of the material’s bending behavior. The force applied during the test is evaluated along with the deflection (deflection) at the center of the specimen, and stress and strain values are calculated [20]. The four-point bending test is a test method in which the deformation of a flat test piece, usually of circular or rectangular cross-section, placed freely on two supports is examined by applying two equal forces without changing direction. The region between the load points is defined as the bending zone subjected to a constant bending moment. This reduces the effect of shear stresses, allowing a more accurate assessment of the material’s bending behavior (Figure 8) [21].
In this study, the effects of adhesive type, joint geometry, and composite material type on mechanical behavior were investigated using a four-point bending test. Damage formation and progression in GFRP and CFRP single-lap adhesively bonded joints aged in seawater for offshore wind turbine blades were analyzed, and changes in mechanical properties over time were evaluated. The results demonstrate the strength performance of composite joints used in offshore wind turbine blades. In the four-point bending test, the maximum stress (stress) and strain (ε) values occurring in the center of the adhesively bonded joint specimen were calculated for each load level to evaluate the mechanical behavior of the material.
The following equation calculates the maximum stress in the region between the load application points in the four-point bending test.
where:
L: Span between supports, mm
a the distance between the applied forces, mm
b: the specimen width, mm
h: the specimen thickness, mm
F: applied force, N
Strain, the value is calculated using the following formula:
where:
: strain, mm/mm
h: thickness of the specimen, mm
L: support span, mm
a: half the loading span, mm
: deflection at the middle of the span, mm
Four-point bending tests were conducted in accordance with the ASTM D790 standard to investigate the mechanical behavior of composite structures under bending [22]. The experiments were conducted using a 100 kN capacity universal testing machine with a maximum load of 5 kN and a loading rate of 1 mm/min. Parameters such as load, speed, and sample geometry were defined on the machine throughout the experiment, and measurements were automatically recorded using the device software.
GFRP and CFRP single-lap joint specimens with 0.2 mm thick adhesive were used in the study. The specimens were tested in both dry and seawater conditions to evaluate the mechanical performance under environmental conditions. Stress-strain curves were obtained using the test software after the experiment, and analyses were conducted using these data. The effect of environmental effects on the bending behavior at the bond interface was analyzed, and changes in mechanical properties were comparatively examined based on the experimental findings (Figure 9).
A total of 24 connection samples were used, 9 of which were made of GFRP conditioned in seawater conditions, and the other 9 were made of CFRP composite material.
3. Results
3.1. Moisture Absorption Results
In the CFRP and GFRP single-lap joint specimens, prior to weight measurements, free moisture accumulated on the surface was removed using moisture-absorbing paper to increase measurement accuracy. Following this process, the moisture retention rates of the specimens were calculated using the equation given below, based on the data presented in Table 2 and Table 3.
M(%)=(my -mk)/(mk)×(100)
In this equation:
- mk: the dry mass of the sample measured before exposure to moisture (g),
- my: wet mass measured after exposure to seawater for a specified period (g),
- M: moisture retention rate of the sample (%) it expresses.
The moisture retention rates of GFRP single-lap joint specimens, which varied depending on the duration of exposure to seawater, were evaluated in comparison with reference specimens stored in a dry environment, which served as a control group (Table 2). The average moisture retention rates of specimens stored in a seawater environment at 21°C for 1 month, 2 months, and 3 months were determined to be 1.02%, 2.97%, and 3.78%, respectively. These findings suggest that moisture absorption of GFRP specimens increases with increasing seawater exposure time.
Similarly, the moisture retention behavior of CFRP single-lap joint specimens was also examined based on their seawater exposure time and compared with reference specimens stored in a dry environment (Table 3). The average moisture retention rates of CFRP specimens exposed to seawater at 21°C for 1 month, 2 months, and 3 months were measured as 0.49%, 0.76%, and 0.91%, respectively. The data obtained show that the moisture absorption tendency of CFRP samples increases with exposure time.
The comparative moisture absorption behavior of GFRP and CFRP samples is presented in Figure 10.
Figure 10 shows the moisture retention rates (%) of GFRP and CFRP single-lap joint specimens measured after 1, 2, and 3 months of immersion in seawater, representing offshore conditions, respectively. The results show that the GFRP specimens exhibited a tendency toward increasing water absorption over time, and this tendency accelerated, particularly after the second month. This is due to the glass fibers being more permeable to water molecules and their interaction with the epoxy matrix [1]. An increase in moisture retention over time was also observed in CFRP specimens; however, this increase was much less than in GFRP. This difference is due to the lower water absorption tendency and more microstructure of carbon fibers [23].
Table 4 below shows the average moisture retention rates (%) of GFRP and CFRP joints measured in offshore wind turbine blade connections after 1, 2, and 3 months of immersion in seawater.
According to Table 4:
GFRP joint specimens absorbed more moisture compared to CFRP. This increased moisture uptake leads to mechanical weakening and interfacial degradation at the structural joints in GFRP.
- While moisture absorption in GFRP increases significantly over time, the increase in CFRP is comparatively lower.
- This indicates that CFRP offers better environmental durability in structural composite applications operating in humid and salty environments, such as offshore wind turbine blade joints.
3.2. Four Point Bending Test Results
3.2.1. GFRP and CFRP Specimen Details
• Reference Samples -Dry Conditioned (GFRP-7L-FPBT-DE-1S and CFRP-8L-FPBT-DE-1S)
The placement of GFRP and CFRP joint specimens, which were kept in a dry environment, in a four-point bending test apparatus and the test setup are presented in Figure 11. This test setup is designed to evaluate the mechanical behavior of composite structures under bending. The specimens are supported at two end points, and forces are applied through two equally spaced loading points. This ensures a homogeneous stress distribution in the central constant moment region [20].
In the test setup, the bonded joint region is positioned to coincide with the central constant moment region. This allows for the observation of damage occurring at the joint interface. Figure 11 shows in detail the support points, loading pins, and the direction of the test, which ensure the correct alignment of the specimen.
Damage observations after four-point bending of GFRP and CFRP reference samples stored in a dry environment at 21°C for three different samples are given in Figure 12 and Figure 13, respectively. These samples were used as references for comparative evaluation with samples exposed to seawater for 1, 2, and 3 months.
In Figure 12a, separations were observed in all GFRP specimens starting from the bond line. These separations were caused by the maximum bending stress occurring in the constant moment region between the two points where the loads were applied in the four-point bending test. Damage was concentrated in the bending region midway between the load application points, and the integrity of the specimen body was largely preserved. This suggests that rupture behavior began in this region, where the highest bending stress was effective.
Figure 13a shows the CFRP specimens after the four-point bending test. In the CFRP specimens, separation occurred at the bond line, particularly between the load application points, and the integrity of the specimens was maintained. Figure 13 shows that the damage at the bond line began in the constant moment region in the middle, where the maximum bending stress was effective, and progressed along the bond line.
In Figure 12b, the maximum gray value of the surface profile of the GFRP specimen was measured as approximately 150, and the distance (pixels) value was measured as 150. This indicates a regular but slightly rough surface structure. Despite being conditioned in a dry environment, the damage type, such as limited micro-level distortion, was observed at the fiber-matrix interface after the four-point bending test, resulting in the profile exhibiting wide-ranging but low-intensity fluctuations.
In the CFRP sample in Figure 13b, the maximum gray value exceeds 200, while the distance (pixels) value remains around 120. This profile demonstrates more intense and distinct structural features on the CFRP surface, indicating a more rigid fiber-matrix interface. A higher gray value indicates a surface feature where the fibers form a stronger bond with the matrix, while a shorter distance indicates that this integrity is maintained in a more localized yet robust structure.
• One-Month Sea Water Exposure Samples (GFRP-7L-FPBT-1M and CFRP-8L-FPBT-1M)
The placement of the bonded GFRP and CFRP connection samples, which were kept in sea water for one month, in the four-point bending test apparatus and the test setup are presented in Figure 14.
The damage types that occurred after the four-point bending tests performed on GFRP (a) and CFRP (b) samples kept in sea water at a constant temperature of 21°C for 1 month are presented in Figure 15 and Figure 16, respectively, in three different samples.
The samples in Figure 15a were weakened chemically and physically by seawater penetrating the bond interface through the sample. The diffusion of ions in the seawater began to disrupt the bond integrity between the adhesive and the composite samples, reducing the adhesion quality at the interface.
The sudden rupture behavior observed in the CFRP samples in Figure 16a is due to the high structural strength of the carbon fibers. Due to their low water absorption, the CFRP samples were able to maintain adhesion at the bond line for longer periods and exhibited sudden, but higher, fracture capacity under four-point bending loading.
In the GFRP sample in Figure 15b, the maximum gray value of the surface profile reached 200, and the distance value was measured at approximately 120. These data indicate that damage such as significant microstructural deterioration, fiber shrinkage, and matrix separation occurred on the GFRP surface under the influence of seawater. The increase in the gray value compared to the dry environment reveals that the surface irregularities are more concentrated. The distance value of around 120 indicates that this damage effectively spreads to a specific location.
In the CFRP sample in Figure 16b, the maximum gray value was only slightly above 100, while the distance value was measured at approximately 100. A low gray value indicates that surface irregularities are limited and damage is less severe. A low distance value, however, indicates that damage occurs in a narrower, more limited area. This indicates that CFRP specimens maintain their structural integrity better in the seawater environment than GFRP specimens, with less decomposition and deterioration occurring at the fiber-matrix interface.
Two-Month Seawater Exposure Samples (GFRP-7L-FPBT-2M and CFRP-8L-FPBT-2M)
The placement of the bonded GFRP and CFRP connection samples, which were kept in sea water for two months, in the four-point bending test apparatus and the test setup are presented in Figure 17.
The damage types that occurred after the four-point bending tests performed on GFRP (a) and CFRP (b) samples kept in sea water at a constant temperature of 21°C for 2 months are presented in Figure 18 and Figure 19, respectively, in three different samples.
In the samples shown in Figure 18a, a mixed (cohesive + adhesive) type of damage was observed, where the damage was not confined to the bond line, but adhesive residue was also present on both surfaces, and both interfacial and intra-adhesive fractures occurred simultaneously. This indicated that during loading, both the internal structure of the adhesive in the bond region weakened and the bond interfaces separated. This distribution of damage indicated that the stress distribution at the bond line was uneven, and seawater weakened the bond.
Similarly, in Figure 19a, the presence of adhesive residue on both surfaces along with the rupture at the adhesive bond line in the CFRP samples indicates a mixed (cohesive + adhesive) damage type. Despite 2 months of immersion in seawater, CFRP’s superior mechanical properties ensured that the loads transferred from the adhesive to the material were more evenly distributed at the interface, resulting in better adhesion of the adhesive to the sample surface.
In Figure 18b, the maximum gray value and distance (pixels) values for the GFRP samples were measured at approximately 140 and 120, respectively. A decrease in the gray value compared to the one-month post-treatment period indicates that surface differences and microstructural damage have diminished. However, the fact that the distance value remained the same indicates that the spread of surface damage continues at a similar rate.
In Figure 19b, the maximum gray value and distance values for the CFRP samples were measured at 150 and 150, respectively. Compared to the one-month post-treatment period, an increase in the gray value and distance values was observed. This is because the damage in CFRP samples increases over time.
• Three-Month Seawater Exposure Samples (GFRP-7L-FPBT-3M and CFRP-8L-FPBT-3M)
The placement of the bonded GFRP and CFRP connection samples, which were kept in sea water for two months, in the four-point bending test apparatus and the test setup are presented in Figure 20.
The damage types that occurred after four-point bending tests performed on GFRP (a) and CFRP (b) samples kept in seawater at a constant temperature of 21°C for 3 months are presented in Figure 21 and Figure 22, respectively, in three different samples.
In the GFRP specimens exposed to seawater for 3 months, shown in Figure 21a, damage was observed to occur directly at the bond line. The failure was particularly concentrated in the central region of the joint, and adhesive residue remained on both surfaces of the specimens. This indicates that the damage was predominantly adhesive, weakening the bond strength at the bond surface. Moisture penetrating the adhesive-sample interface during seawater exposure reduced adhesion quality and created microscopic voids and a plasticizing effect at the interface. This weakened the bond line.
In Figure 22a, similar damage occurred at the bond line in CFRP samples exposed to seawater for 3 months, with the adhesive remaining on both surfaces, resulting in a cohesive-adhesive transition. However, given the high strength and low moisture absorption capacity of CFRP samples, the damage is less severe compared to GFRP samples.
In Figure 21b, the maximum gray value for the GFRP samples exceeded 140, and the distance value was measured as 150 pixels. Compared to 2 months, there was no significant increase in the gray value, but the distance increased. This indicates that the roughness on the GFRP surface began to remain constant, but the deterioration spread over a wider area. In other words, the GFRP samples continued to absorb seawater, leading to microstructural deterioration on the surface.
In Figure 22b, the maximum gray value for the CFRP samples was determined as 120 and the distance value as 140. Compared to the two-month period, the gray value decreased, but the distance value increased. This change indicates that the roughness of the CFRP surface has decreased somewhat, but the deterioration has spread over a larger surface area. This suggests that although the CFRP samples were initially resistant to seawater conditions, they began to struggle to maintain their surface integrity after prolonged exposure.
The stress–strain (σ–ε) curve presented in Figure 23 shows data obtained from four-point bending tests performed on GFRP composite specimens after exposure to various environmental conditions for specific periods. The specimens were stored in dry environments and in seawater environments for 1, 2, and 3 months, respectively. The effects of these different conditions and exposure times on the mechanical properties of the material were analyzed in detail.
Based on the data presented in Figure 23, it was observed that the bending stress and strain values in the GFRP-7L-FPBT series specimens decreased depending on the duration of exposure to seawater. The measurement results for each specimen are presented in Table 5 below:
The flexural stress and strain values of the GFRP-7L-FPBT series specimens presented in Figure 23 indicate a significant deterioration in the mechanical properties of the material depending on the duration of seawater exposure. The reference specimen tested under dry conditions (GFRP-7L-FPBT-DE) exhibited the highest mechanical performance with a flexural stress of 121.6930 MPa and a strain value of 0.0395.
For the GFRP-7L-FPBT-1M specimen, which was exposed to seawater for one month, the flexural stress dropped to 114.9519 MPa and the strain value to 0.0323. This reduction suggests that seawater penetrated the GFRP matrix, leading to weakening at the fiber-matrix interface.
At the end of the second month (GFRP-7L-FPBT-2M), the flexural stress was measured at 92.6155 MPa and the strain at 0.0244. By the third month (GFRP-7L-FPBT-3M), these values further decreased to 72.7945 MPa and 0.0146, respectively, indicating a decline in both mechanical strength and deformation capacity.
Overall, as the seawater exposure duration increased, both flexural stress and strain values consistently decreased in GFRP specimens. With a total reduction of approximately 40% in flexural stress and up to 63% in strain, these results suggest that GFRP may exhibit limited long-term mechanical performance in marine environments.
According to the data presented in Figure 24, it was observed that the bending stress and strain values in the CFRP-8L-FPBT series specimens varied depending on the duration of exposure to seawater. Table 6 below shows the measurement results for each specimen:
The bending stress and strain values for the CFRP-8L-FPBT series specimens, presented in Figure 24, reveal a gradual decrease in the material’s mechanical properties with the duration of exposure to seawater. The reference specimen (CFRP-8L-FPBT-DE), tested in a dry environment, achieved the highest performance with a bending stress of 148.5722 MPa and a strain of 0.0254.
In the CFRP-8L-FPBT-1M specimen exposed to seawater for one month, the bending stress decreased to 129.2385 MPa, while the strain value increased slightly to 0.0270. This increase was attributed to the short-term softening effect of moisture, which imparted temporary flexibility to the matrix phase.
In the second month, both the bending stress (121.9446 MPa) and strain (0.0206) decreased in the CFRP-8L-FPBT-2M specimen. At the end of the third month (CFRP-8L-FPBT-3M), the bending stress decreased to 109.5578 MPa, indicating an approximately 26% decrease compared to the initial value. At the same time, the strain value decreased to 0.0185, indicating a significant decrease in the material’s deformation capacity. Consequently, a continuous decrease in the bending stress and strain values of the CFRP samples was observed as the duration of seawater exposure increased. This demonstrates that the aging process negatively affects the samples in terms of both strength and ductility. However, this decrease was less pronounced compared to the GFRP samples. This demonstrates that CFRP samples are more durable in applications with intense environmental impacts, such as offshore wind turbine blades.
Young’s Modulus is a parameter that numerically expresses the flexibility or stiffness of a material [24]. Here, it was calculated using the slope obtained from the linear regions of the stress-strain curves presented in Figure 23 and Figure 24. Table 6 below presents a comparison of the modulus of elasticity (Young’s Modulus, E) values of GFRP and CFRP specimens. These values were calculated after the respective specimens were exposed to environmental conditions for different periods of time. Table 7 also shows the percentage change in modulus of elasticity for each specimen compared to its initial (dry environment) value.
3.3. Damage Investigation of GFRP Specimens Using SEM After Four-Point Bending Test
As exposure to seawater increases, the types of damage occurring in the interlayer separation and joint areas of the composite samples become more pronounced. Many factors, including the material’s microstructure, joint configuration, and the properties of the adhesive used, play a role in the formation of these damages. Therefore, detailed characterization of such composite structures is critical.
Following the four-point bending test, SEM images of GFRP samples stored in seawater for 1, 2, and 3 months were obtained for both dry and offshore conditions. Images of the GFRP samples are presented in Figure 25, Figure 26, Figure 27 and Figure 28. Images of the CFRP samples are presented in Figure 29, Figure 30, Figure 31 and Figure 32. Thus, the time-dependent changes in damage mechanisms in samples exposed to environmental influences were comparatively evaluated. Following the four-point bending test, SEM images were obtained for both GFRP and CFRP specimens that had been exposed to seawater for 1, 2, and 3 months, as well as those kept under dry and offshore conditions. In this way, time-dependent changes in the damage mechanisms of the seawater-exposed specimens were comparatively evaluated. The SEM images of the GFRP specimens are presented in Figure 25, Figure 26, Figure 27 and Figure 28.
In Figure 25, SEM images of the GFRP control sample stored in a dry environment show strong interfacial bonding with the polymer matrix around the glass fibers. There is a regular arrangement between the fibers, minimal voids, and continuity in the fiber-matrix interaction. No extensive fractures or bifurcations are observed on the fibers, indicating that the sample maintains its high flexural strength.
In Figure 26, in GFRP samples exposed to seawater for one month, deterioration began at the fiber-matrix interface, resulting in damage mechanisms such as debonding and fiber pull-out. Microcracks and traces of plastic deformation were observed on the matrix surface. Diffusion of water molecules into the matrix caused the matrix to swell and accumulate stress at the interface, weakening the bond. Mechanical strength decreased compared to the dry environment, but integrity was still partially preserved. Figure 27 shows significant microstructural deterioration in the GFRP samples following two months of seawater storage. While fracture and shrinkage were observed in the majority of the fibers, the matrix exhibited intense microcracks, fragmentation, and void formation. The interface exhibited completely ruptured areas, and the fiber-matrix interaction was largely lost. At this stage, load transfer occurred only to a limited extent through the fibers. A decrease in flexural strength, a tendency towards fracture, and brittleness were observed. Figure 28 shows almost complete loss of microstructural integrity in GFRP specimens conditioned in seawater for three months. A structure in which the fiber-matrix interface was reduced, the fibers became free, and the matrix was chemically degraded is envisaged. The microscopic cracks transformed into macroscopic cracks, and the fracture occurred suddenly and brittle. Furthermore, the mechanical strength of the polymer matrix decreased as a result of exposure to water.
The effect of seawater conditioning on the microstructural integrity of GFRP specimens is given in Table 8.
3.4. Damage Investigation of CFRP Specimens Using SEM After Four-Point Bending Test
Following the four-point bending test, SEM images of CFRP specimens conditioned in seawater for 1, 2, and 3 months were obtained for both dry and offshore conditions. Images of the CFRP specimens are presented in Figure 29, Figure 30, Figure 31, and Figure 32.
Figure 29, the CFRP control sample stored in a dry environment, shows that the fiber-matrix interface has high integrity. The fibers are tightly bonded to the matrix and exhibit a regular structure along the fracture surface. Fiber pullout and fiber fracture appear to be balanced. This indicates that energy was absorbed more ductilely during mechanical testing and that fracture occurred in a controlled manner. Figure 30 shows that signs of microstructural deterioration began to appear in samples stored in seawater for one month. Separation occurred locally at the fiber-matrix interface, with microscopic cracks and matrix deformations observed. This indicates that the interfacial bonds began to weaken and that mechanical performance tended to decline. Figure 31 shows that after two months of aging, microstructural deterioration increased significantly. It was observed that the fibers began to completely separate from the matrix. Swelling, cracking, and void formation are evident in the resin phase. Fiber fractures are more irregular and short-distanced, and the fracture surface exhibits a more brittle state. In Figure 32, microstructural deterioration progressed in samples exposed to seawater for three months, and interfacial bonds became loose. Delamination and voids were observed in the resin structure, leading to a decrease in mechanical performance.
The effect of seawater conditioning on the microstructural integrity of CFRP specimens is given in Table 9.
SEM images and mechanical test data obtained after immersing GFRP and CFRP composite samples in seawater for 1, 2, and 3 months, both in dry environments and offshore conditions, reveal that both composite types lose their structural integrity over time. Significant decomposition was observed, particularly at the fiber-matrix interface, with increasing aging time. Damage mechanisms such as fiber pullout, debonding, microscopic cracks, and matrix deformations increased over time in both GFRP and CFRP samples exposed to seawater. Comparisons revealed that CFRP composite samples exhibited higher microstructural resistance to seawater compared to GFRP. Because the chemical and mechanical bond between carbon fibers and epoxy resin is stronger than that of glass fibers, the interface bonds weakened more slowly in CFRP samples, and the fracture transition was more controlled [25]. While microcracks were observed in both samples during the dry and first months, these cracks coalesced over time, transforming into macroscopic delaminations and delamination. At the end of the second and third months, signs of degradation and swelling in the chemical structure of the polymer matrix were clearly observed, particularly in the GFRP samples. With increasing aging, a greater decrease in flexural strength and interfacial strength was observed in the GFRP samples compared to the CFRP samples. The CFRP composite samples were found to be more resistant to these aging conditions compared to GFRP due to their better interface and lower water permeability.
4. Discussion and Conclusions
In this study, the mechanical performance and damage behavior of GFRP and CFRP, fiber-reinforced composite materials commonly used in offshore wind turbine blades, were comparatively evaluated in both dry and marine environments. The reference group samples were stored in a dry environment at 21°C. Four-point bending tests applied to these samples revealed delamination and matrix cracking in the GFRP samples, while more brittle fiber ruptures and fractures were observed in the CFRP samples. It was determined that structural integrity was largely preserved in both material groups. To examine the marine behavior, GFRP and CFRP connection samples were conditioned in separate containers in natural seawater from the Aegean Sea with a temperature of 21°C and a salinity of 3.3–3.7% for 1, 2, and 3 months. During this period, moisture absorption of the connection areas was monitored by weighing them at regular intervals with a high-precision balance. The weight data obtained were compared with the dry reference samples, and the weight change (%) for moisture absorption was determined. The results revealed that moisture absorption causes physical changes and interface weakening in the material matrix with increasing exposure time. In GFRP samples, delamination and loss of adhesion became more pronounced in the binding zones due to moisture exposure, while in CFRP samples, despite relatively lower moisture uptake rates, brittle fracture and separation at the fiber-matrix interface were observed.
The results revealed that both composite materials largely maintained their structural integrity under dry conditions. However, seawater conditioning resulted in increased damage intensity, particularly in the binding zones, and a decrease in mechanical strength. Comparative evaluations revealed that CFRP samples exhibited higher mechanical performance compared to GFRP, particularly in terms of flexural strength. The findings indicate that both environmental influences and material selection play a decisive role in long-term performance in structural systems operating in outdoor environments, such as wind turbine blades.
Author Contributions
S.Y.: Project Administration, Conceptualization, Validation; M.F.Y.: Formal Analysis, Investigation, Resources, Visualization; D.M.Y.: Methodology, Writing—Original Draft Preparation, Writing—Review and Editing, Data Curation;. All authors have read and agreed to the published version of the manuscript.
Funding
This research received no external funding.
Data Availability Statement
The original contributions presented in the study are included in the article, further inquiries can be directed to the corresponding author.
Conflicts of Interest
The authors declare that they have no competing interests.
References
- Agarwal, B. D.; Broutman, L. J.; Chandrashekhara, K. Analysis and performance of fiber composites; John Wiley & Sons, 2017. [Google Scholar]
- Daniel, I. M.; Ishai, O.; Daniel, I. M.; Daniel, I. Engineering mechanics of composite materials; New York: Oxford university press, 1994; Vol. 3, pp. 256–256. [Google Scholar]
- Mallick, P. K. Materials, manufacturing, and design. Mechanical Engineering (Marcel Dekker, Inc.) 2007, 83, 74–81. [Google Scholar]
- Mouritz, A. P.; Gibson, A. G. Fire properties of polymer composite materials; Springer Netherlands; Dordrecht, 2006. [Google Scholar]
- Khoshmanesh, S.; Watson, S. J.; Zarouchas, D. The effect of the fatigue damage accumulation process on the damping and stiffness properties of adhesively bonded composite structures. Composite Structures 2022, 287, 115328. [Google Scholar] [CrossRef]
- Ji, Y. M.; Han, K. S. Fracture mechanics approach for failure of adhesive joints in wind turbine blades. Renewable energy 2014, 65, 23–28. [Google Scholar] [CrossRef]
- Kim, K. S.; Yoo, J. S.; Yi, Y. M.; Kim, C. G. Failure mode and strength of uni-directional composite single lap bonded joints with different bonding methods. Composite structures 2006, 72(4), 477–485. [Google Scholar] [CrossRef]
- Mertgenç Yoldaş, D.; Yoldaş, M. F. Investigation of Diffusion of Different Composite Materials on the Damage Caused by Axial Impact Adhesive Joints. Journal of Composites Science 2025, 9(4), 188. [Google Scholar] [CrossRef]
- Yalçınkaya, S.; Mertgenç Yoldaş, D.; Yoldaş, M. F. Experimental Investigation of the Effect of Seawater on Glass and Carbon Fiber Composites via Mechanical Characterization. Journal of Composites Science 2025, 9(3), 107. [Google Scholar] [CrossRef]
- Ji, Y. M.; Han, K. S. Fracture mechanics approach for failure of adhesive joints in wind turbine blades. Renewable energy 2014, 65, 23–28. [Google Scholar] [CrossRef]
- Khoshmanesh, S.; Watson, S. J.; Zarouchas, D. New indicator for damage localization in a thick adhesive joint of a composite material used in a wind turbine blade. Engineering Structures 2023, 283, 115870. [Google Scholar] [CrossRef]
- Rosemeier, M.; Krimmer, A.; Bardenhagen, A.; Antoniou, A. Tunneling crack initiation in trailing-edge bond lines of wind-turbine blades. AIAA journal 2019, 57(12), 5462–5474. [Google Scholar] [CrossRef]
- Rafiee, R.; Hashemi-Taheri, M. R. Failure analysis of a composite wind turbine blade at the adhesive joint of the trailing edge. Engineering Failure Analysis 2021, 121, 105148. [Google Scholar] [CrossRef]
- Musial, W.; Bourne, B.; Hughes, S.; Zuteck, M. D. Four-Point Bending Strength Testing of Pultruded Fiberglass Composite Wind Turbine Blade Sections (No. NREL/CP-500-30565); National Renewable Energy Lab. (NREL); Golden, CO (United States), 2001. [Google Scholar]
- Maldonado-Santiago, O.; Robles-Ocampo, J. B.; Gálvez, E.; Sevilla-Camacho, P. Y.; de la Cruz, S.; Rodríguez-Reséndiz, J.; Hernández, E. Bending Behavior Analysis of Box Beams with the Reinforcement of Composite Materials for Wind Turbine Blades. Fibers 2023, 11(12), 99. [Google Scholar] [CrossRef]
- Musial, W.; Bourne, B.; Hughes, S.; Zuteck, M. D. Four-Point Bending Strength Testing of Pultruded Fiberglass Composite Wind Turbine Blade Sections (No. NREL/CP-500-30565); National Renewable Energy Lab. (NREL); Golden, CO (United States), 2001. [Google Scholar]
- Arwood, Z.; Young, S.; Foster, D.; Penumadu, D. Quality Investigation of Pultruded Carbon Fiber Panels Subjected to Four-Point Flexure via Fiber Optic Sensing. Materials 2025, 18(1), 166. [Google Scholar] [CrossRef] [PubMed]
- ASTMD5868-01. Standard Test Method for Lap Shear Adhesion for Fiber Reinforced Plastic (FRP) Bonding; ASTM International; West Conshohocken, PA, USA, 2023. [Google Scholar]
- Croccolo, D.; De Agostinis, M.; Fini, S.; Olmi, G. Influence of the engagement ratio on the shear strength of an epoxy adhesive by push-out tests on pin-and-collar joints: Part I: Campaign at room temperature. Int. J. Adhes. Adhes. 2016, 67, 69–75. [Google Scholar] [CrossRef]
- Gibson, R. F. Principles of composite material mechanics; CRC press, 2007. [Google Scholar]
- ASTM International. ASTM D6272-17: Standard Test Method for Flexural Properties of Unreinforced and Reinforced Plastics and Electrical Insulating Materials by Four-Point Bending; ASTM International; West Conshohocken, PA, 2020. [Google Scholar] [CrossRef]
- ASTMD790;Standard Test Methods for Flexural Properties of Unreinforced and Reinforced Plastics and Electrical Insulating Materials; ASTM International; West Conshohocken, PA, USA, 2017.
- Korkees, F. Moisture absorption behavior and diffusion characteristics of continuous carbon fiber reinforced epoxy composites: A review. Polymer-Plastics Technology and Materials 2023, 62(14), 1789–1822. [Google Scholar] [CrossRef]
- Vaidya, A.; Pathak, K. Mechanical stability of dental materials. In Applications of nanocomposite materials in dentistry; Woodhead Publishing, 2019; pp. 285–305. [Google Scholar]
- Selzer, R.; Friedrich, K. Mechanical properties and failure behaviour of carbon fibre-reinforced polymer composites under the influence of moisture. Composites Part A: Applied Science and Manufacturing 1997, 28(6), 595–604. [Google Scholar] [CrossRef]
Figure 1.
Shaping of GFRP (a) and CFRP (b) Plates with CNC Router.
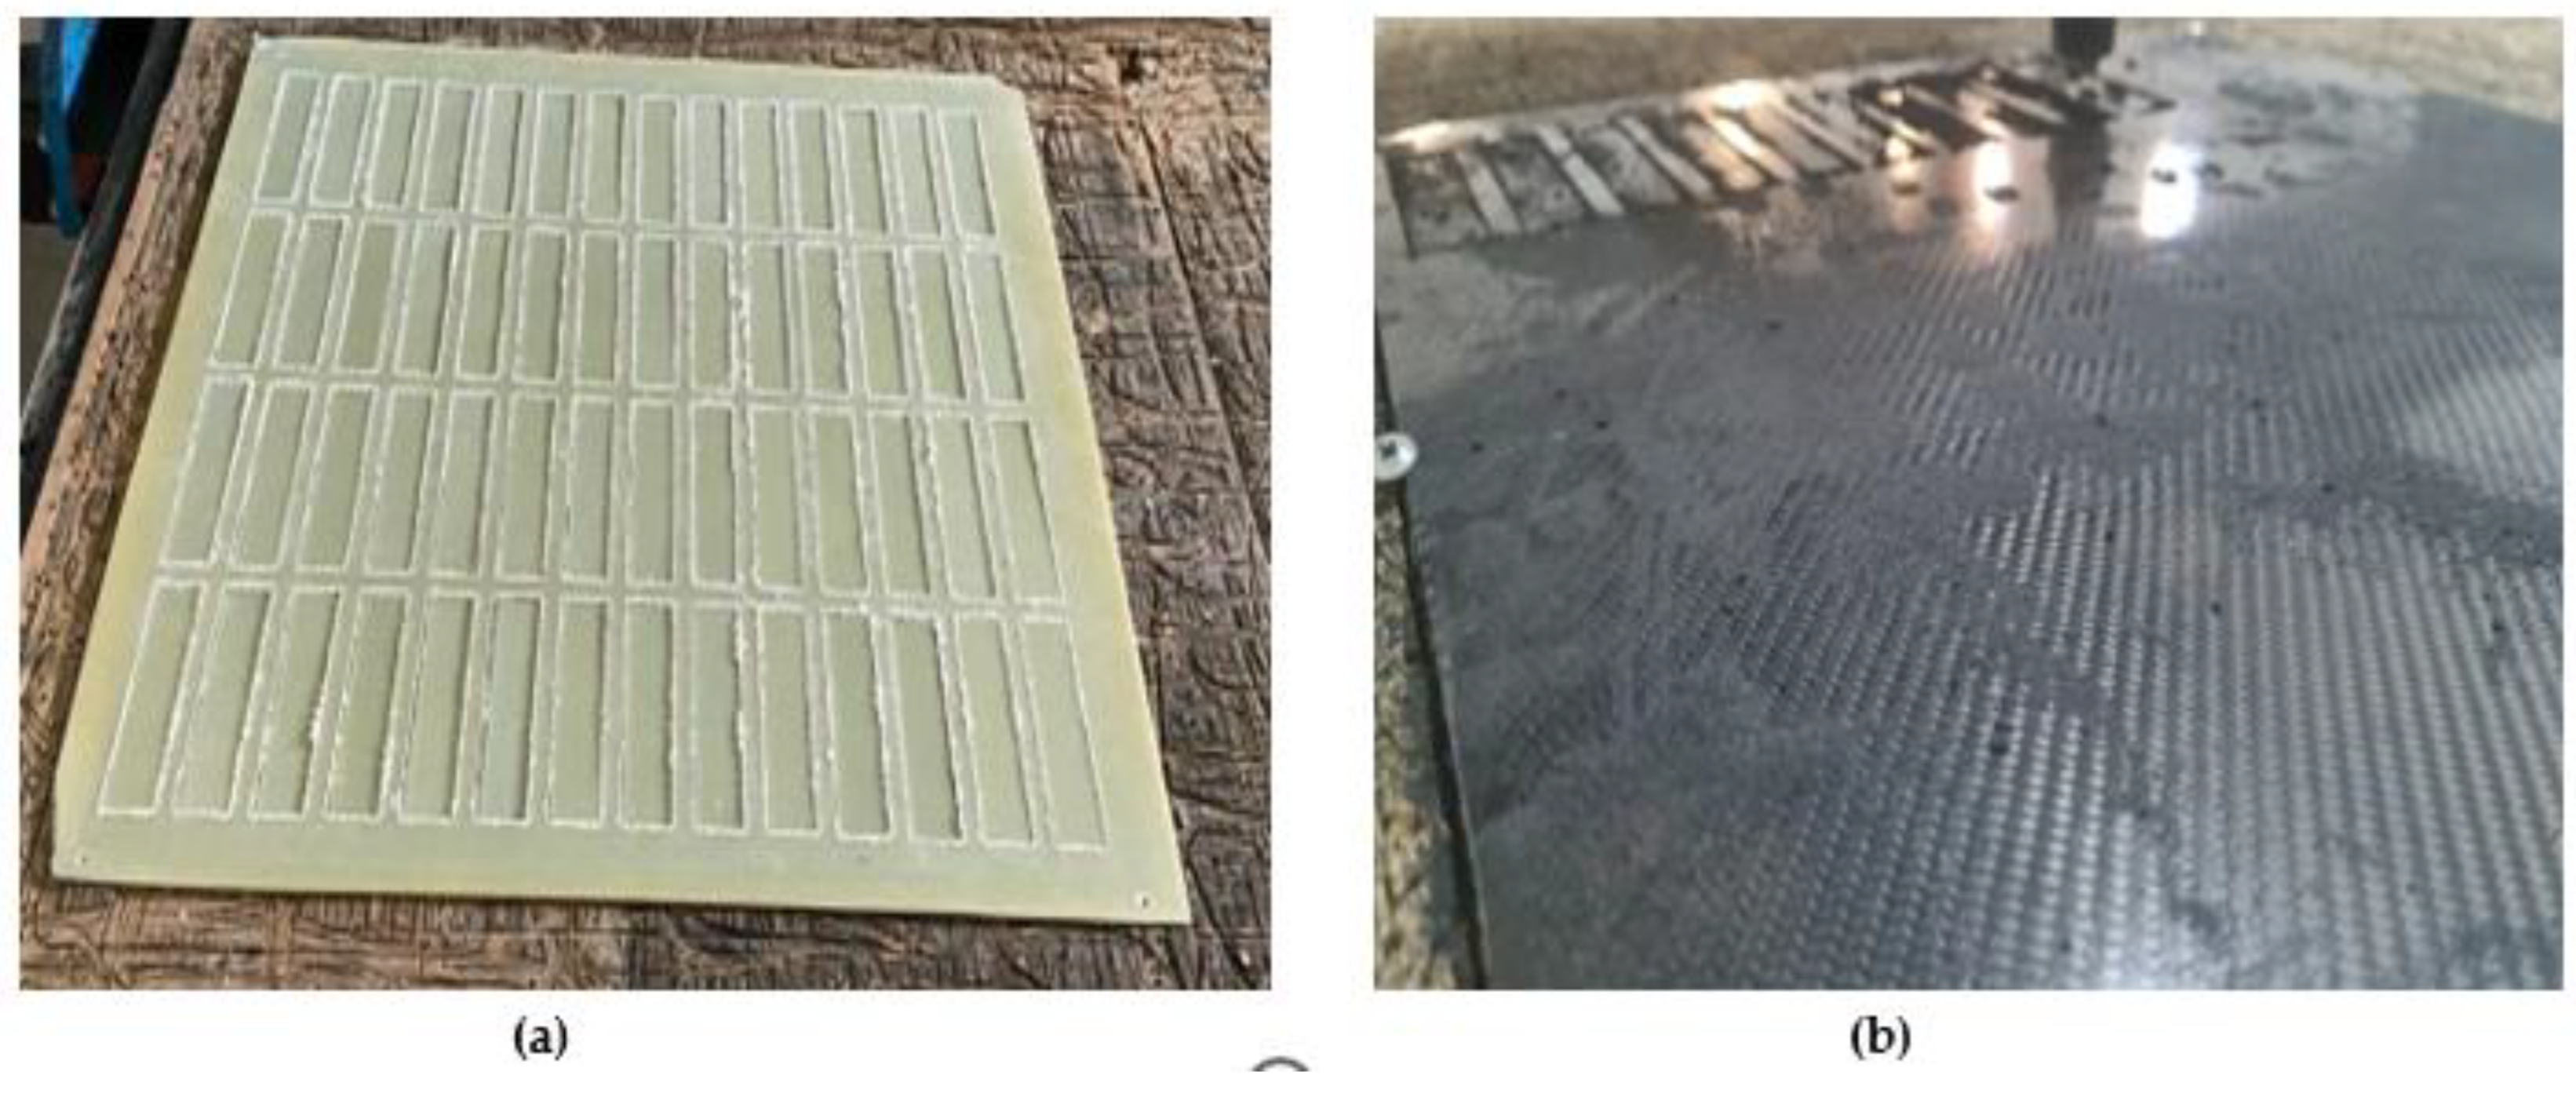
Figure 2.
Geometric configuration of GFRP and CFRP specimens
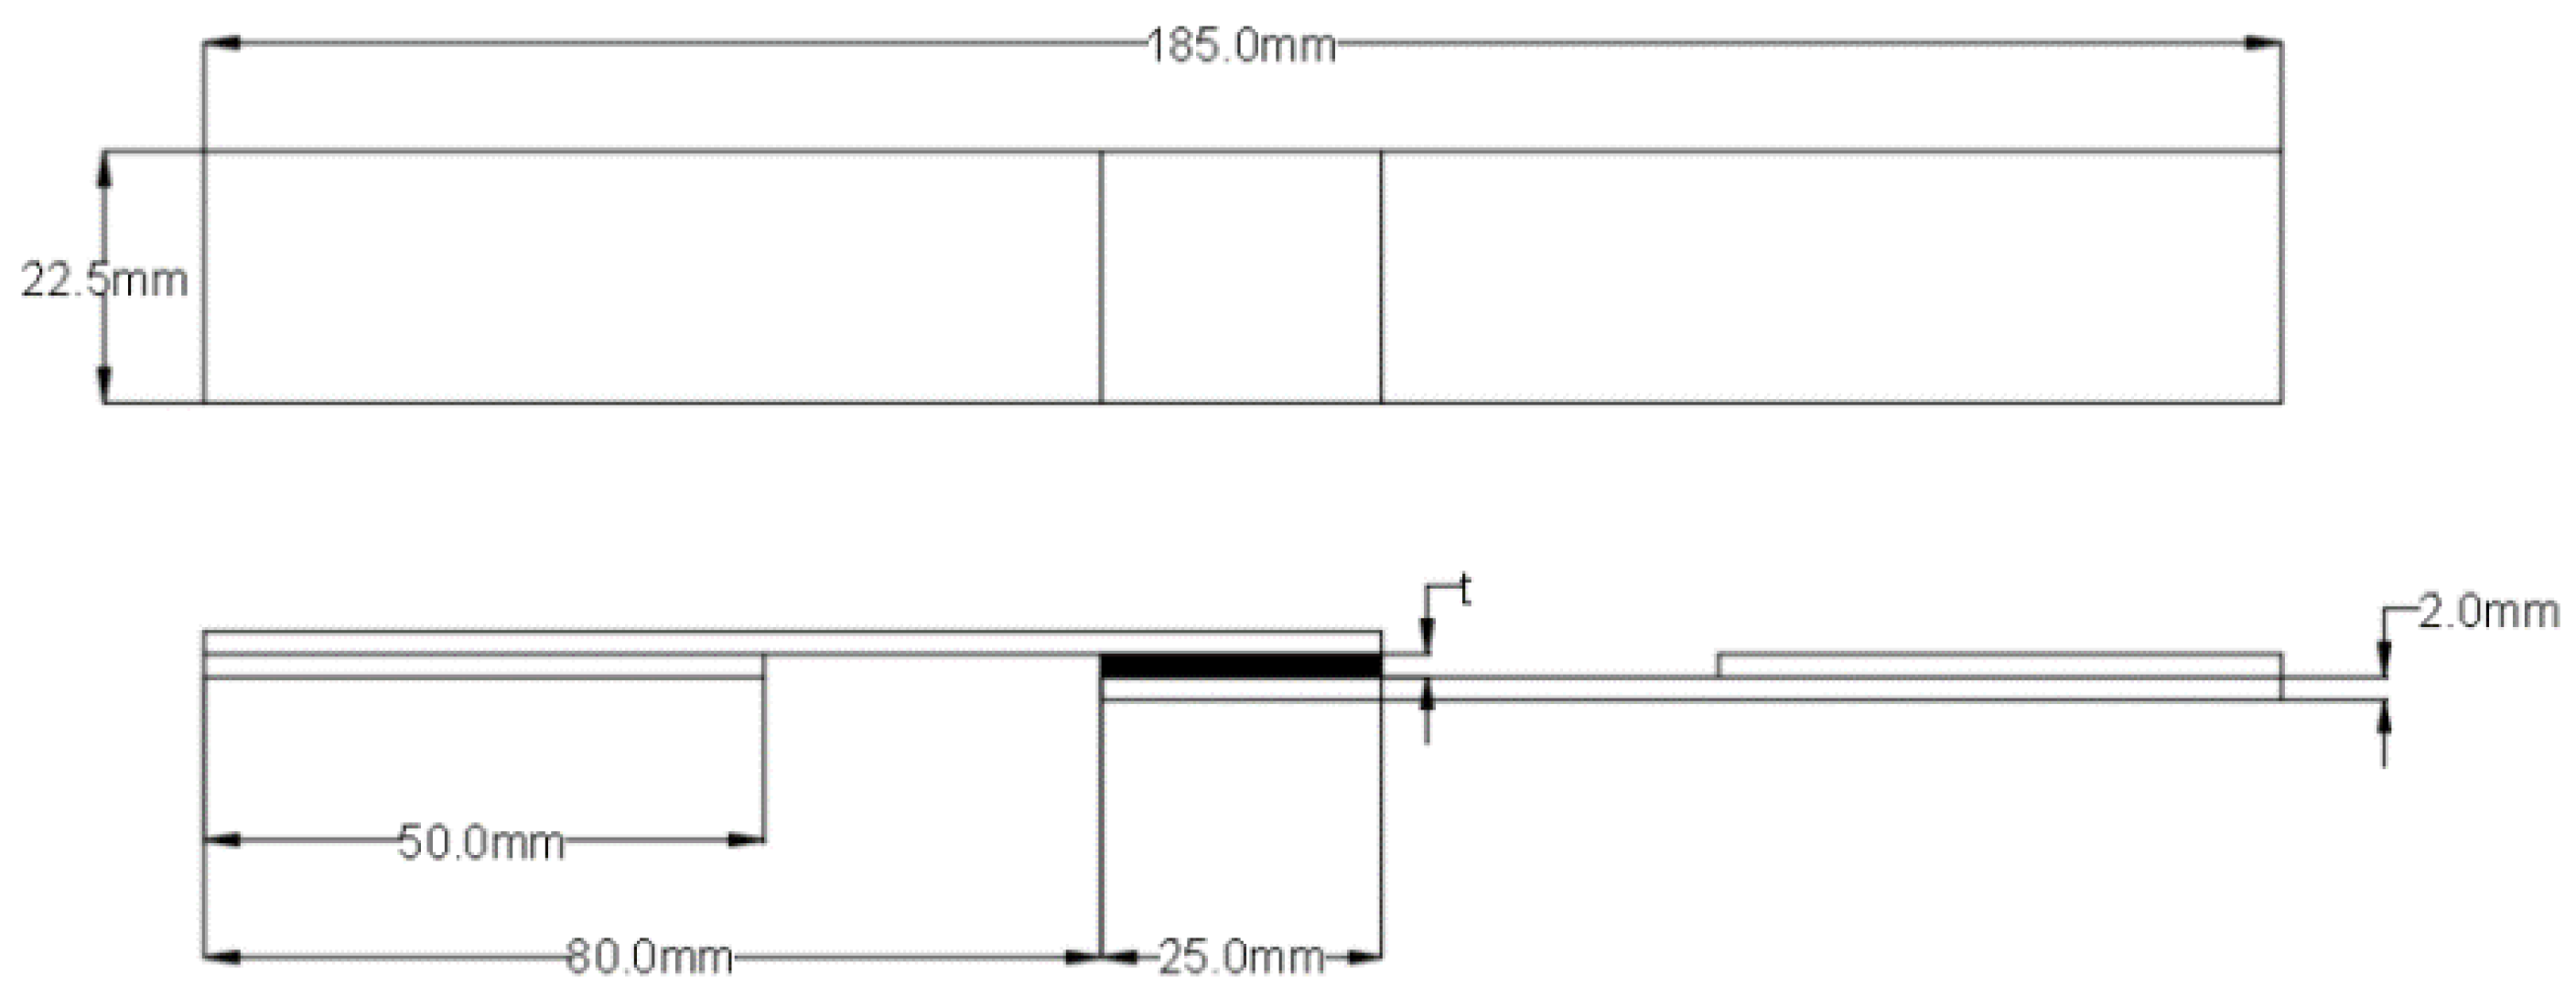
Figure 3.
Marking of GFRP (a) and CFRP (b) specimens for alignment and placement before bonding.
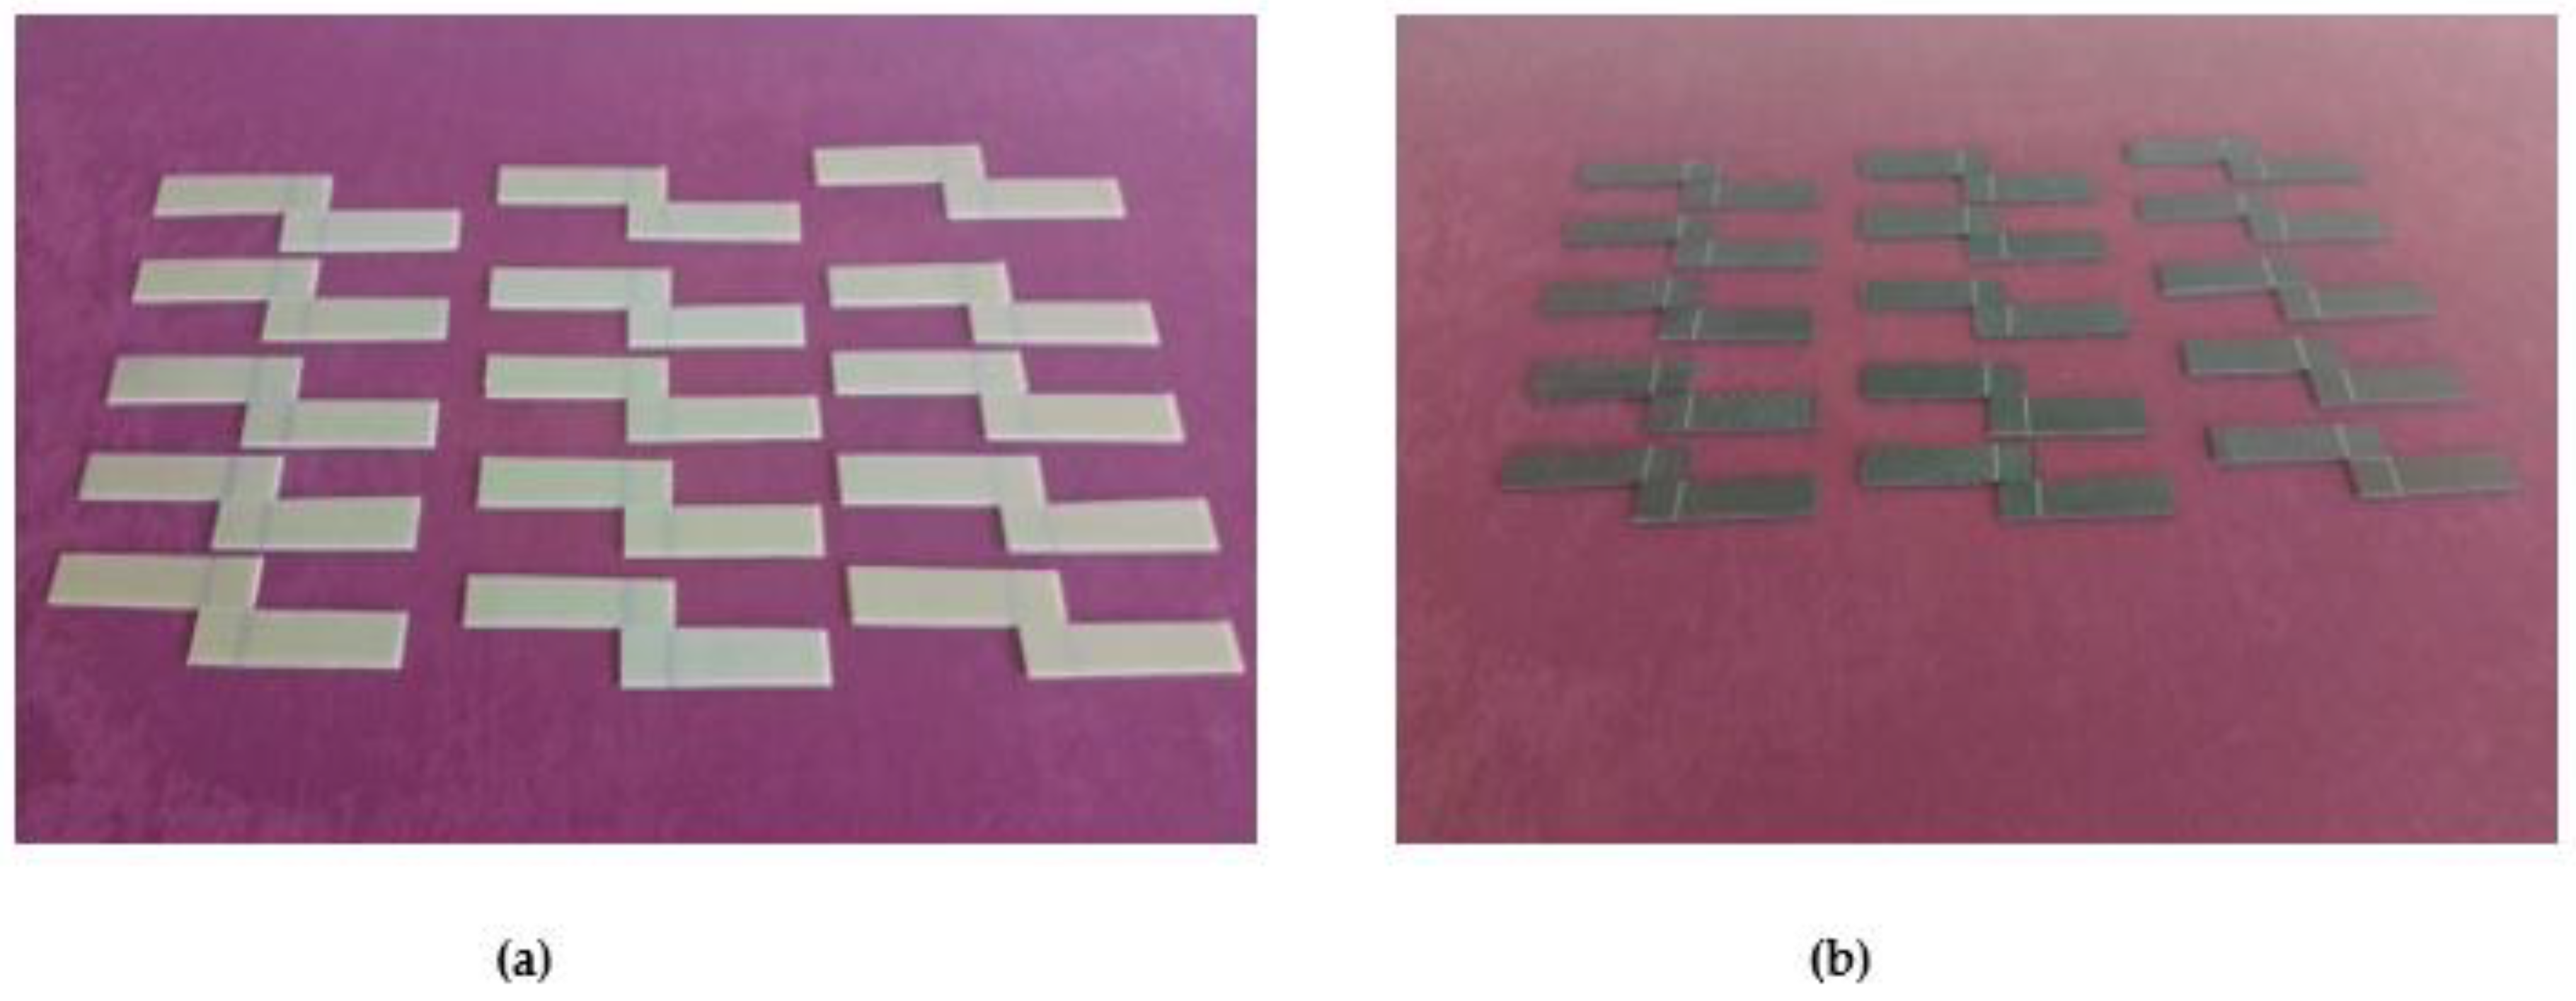
Figure 4.
General appearance of the surface after application of Loctite Hysol-9466 epoxy adhesive (a) on the samples (b).
Figure 4.
General appearance of the surface after application of Loctite Hysol-9466 epoxy adhesive (a) on the samples (b).
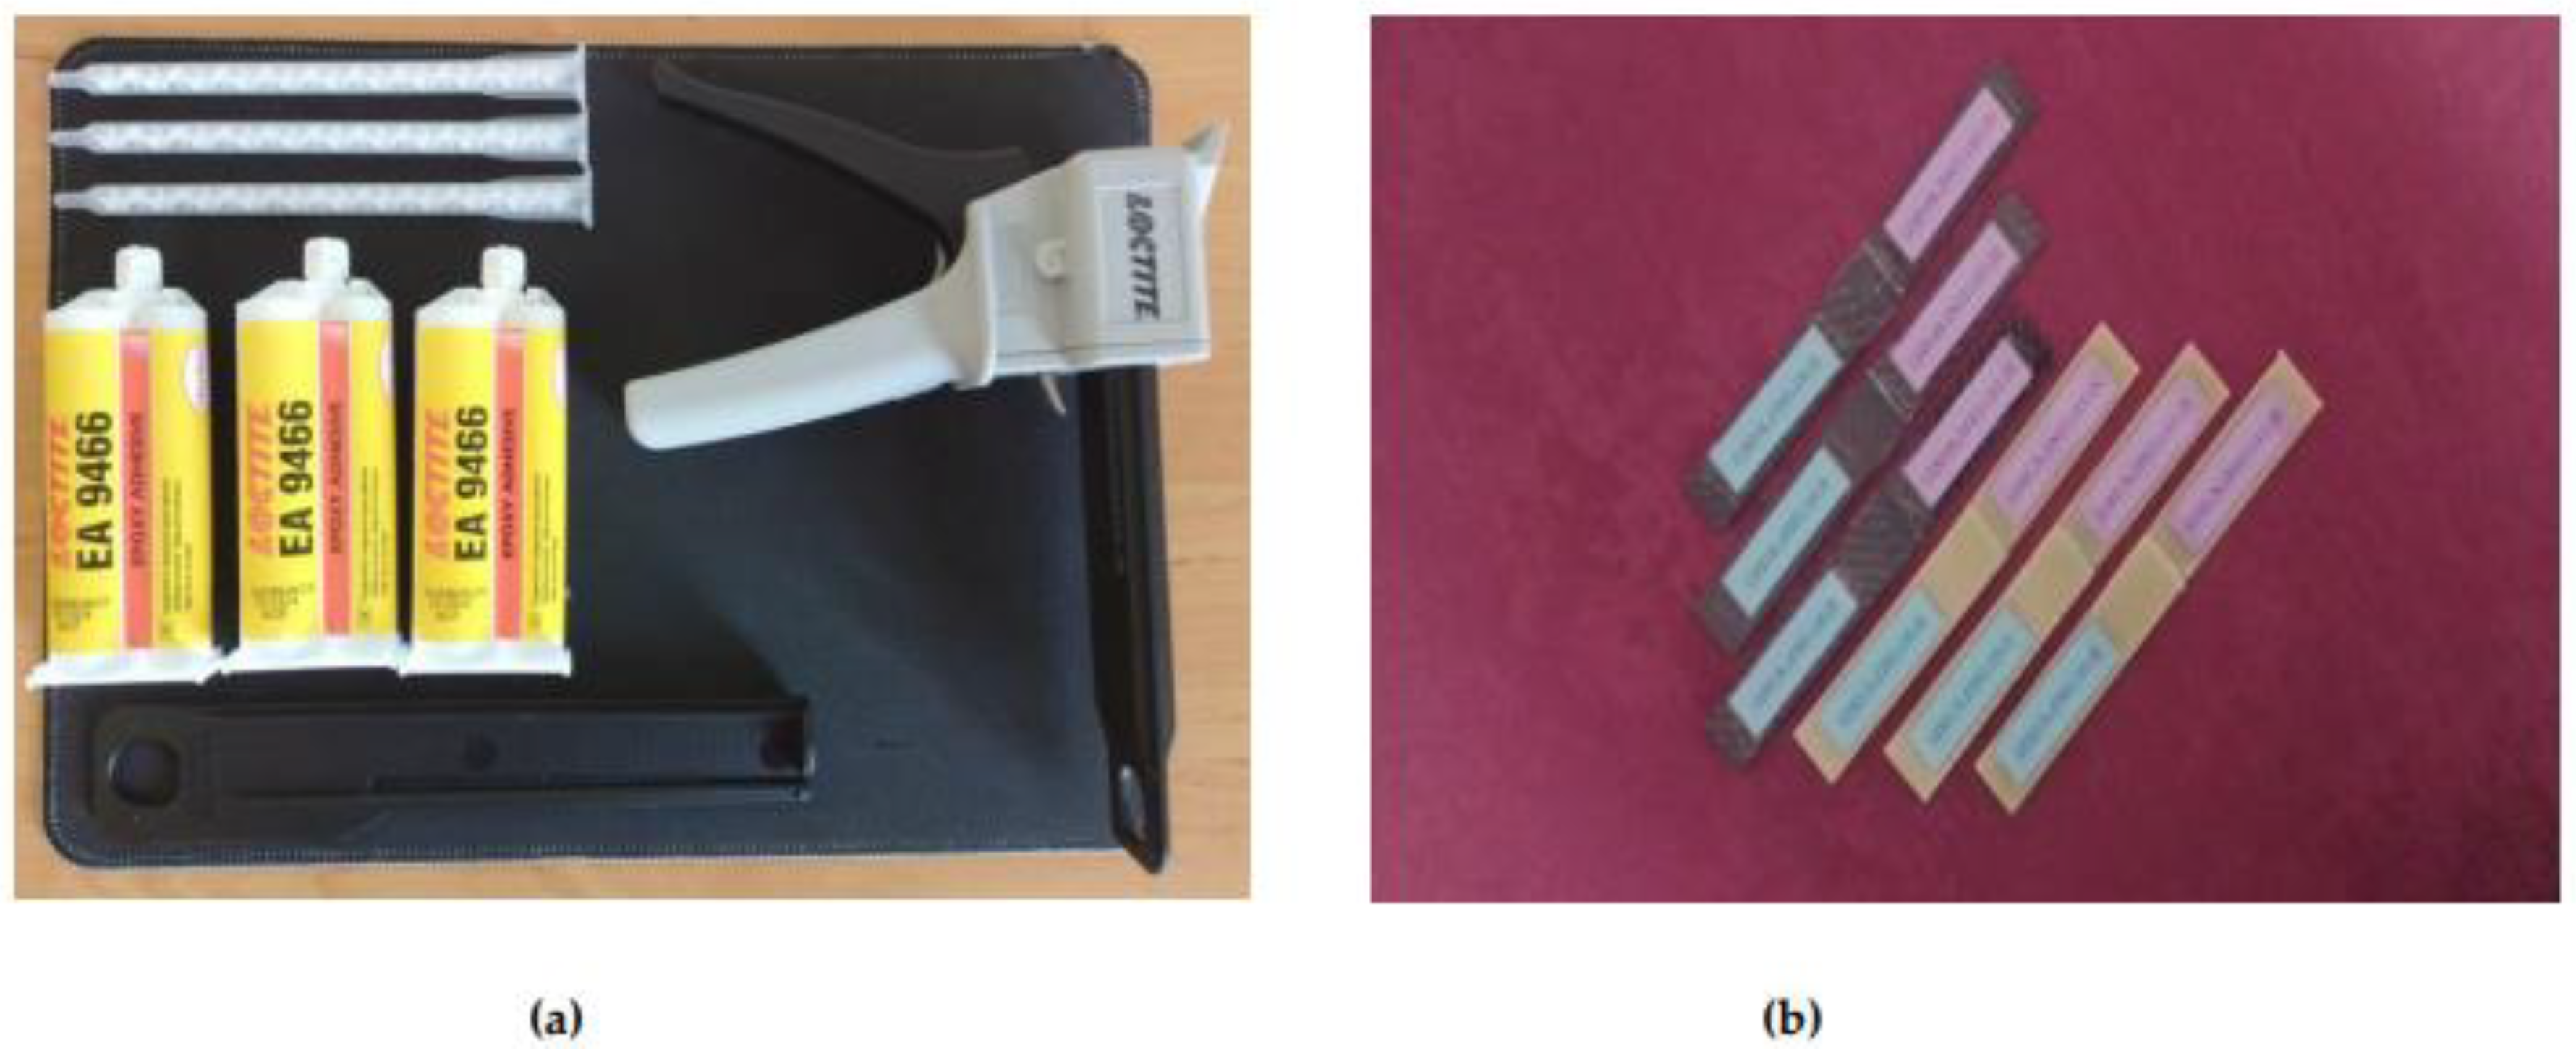
Figure 5.
Sample codings of GFRP (a) and CFRP (b) samples.
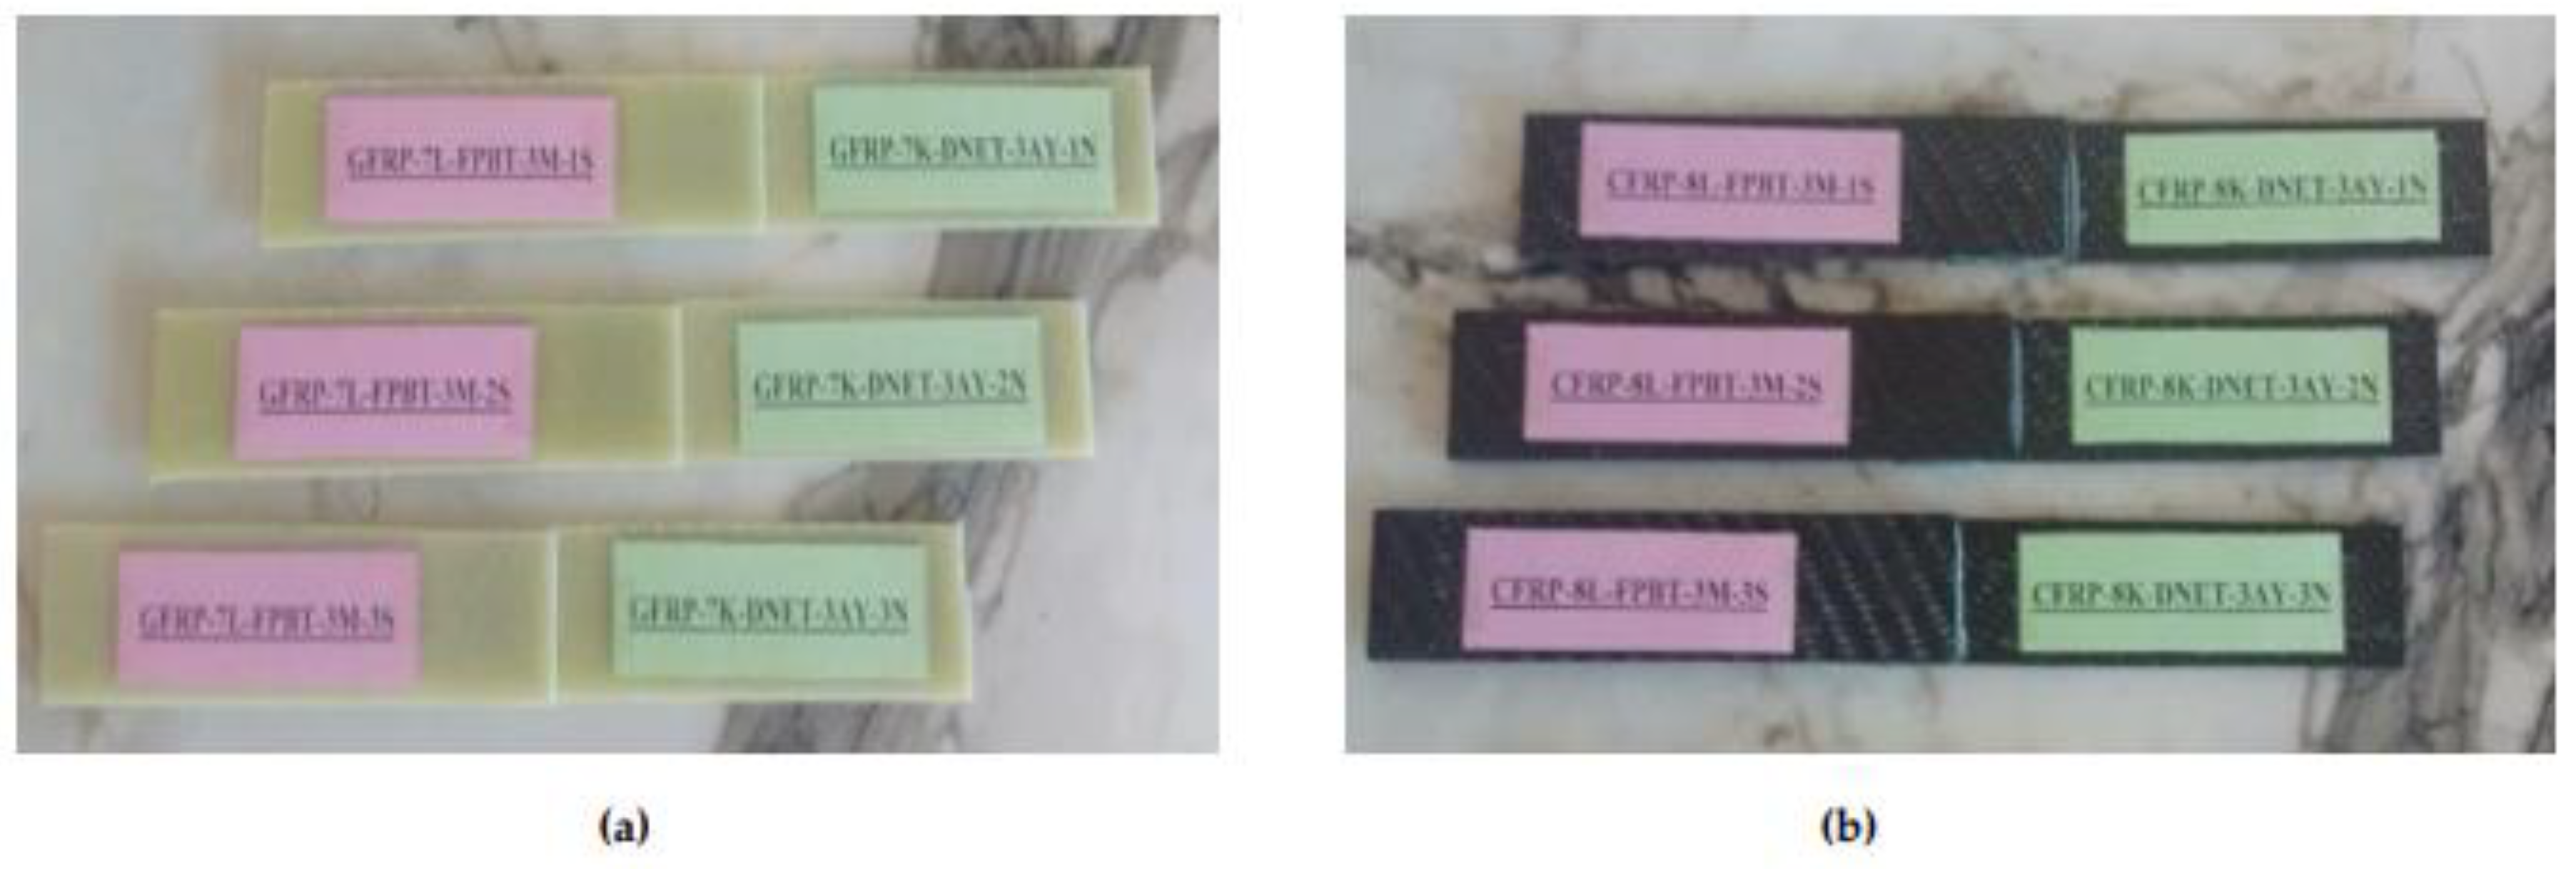
Figure 6.
Soaking of GFRP (a) and CFRP (b) samples in seawater with 3.3–3.7% salinity for 1, 2 and 3 months.
Figure 6.
Soaking of GFRP (a) and CFRP (b) samples in seawater with 3.3–3.7% salinity for 1, 2 and 3 months.
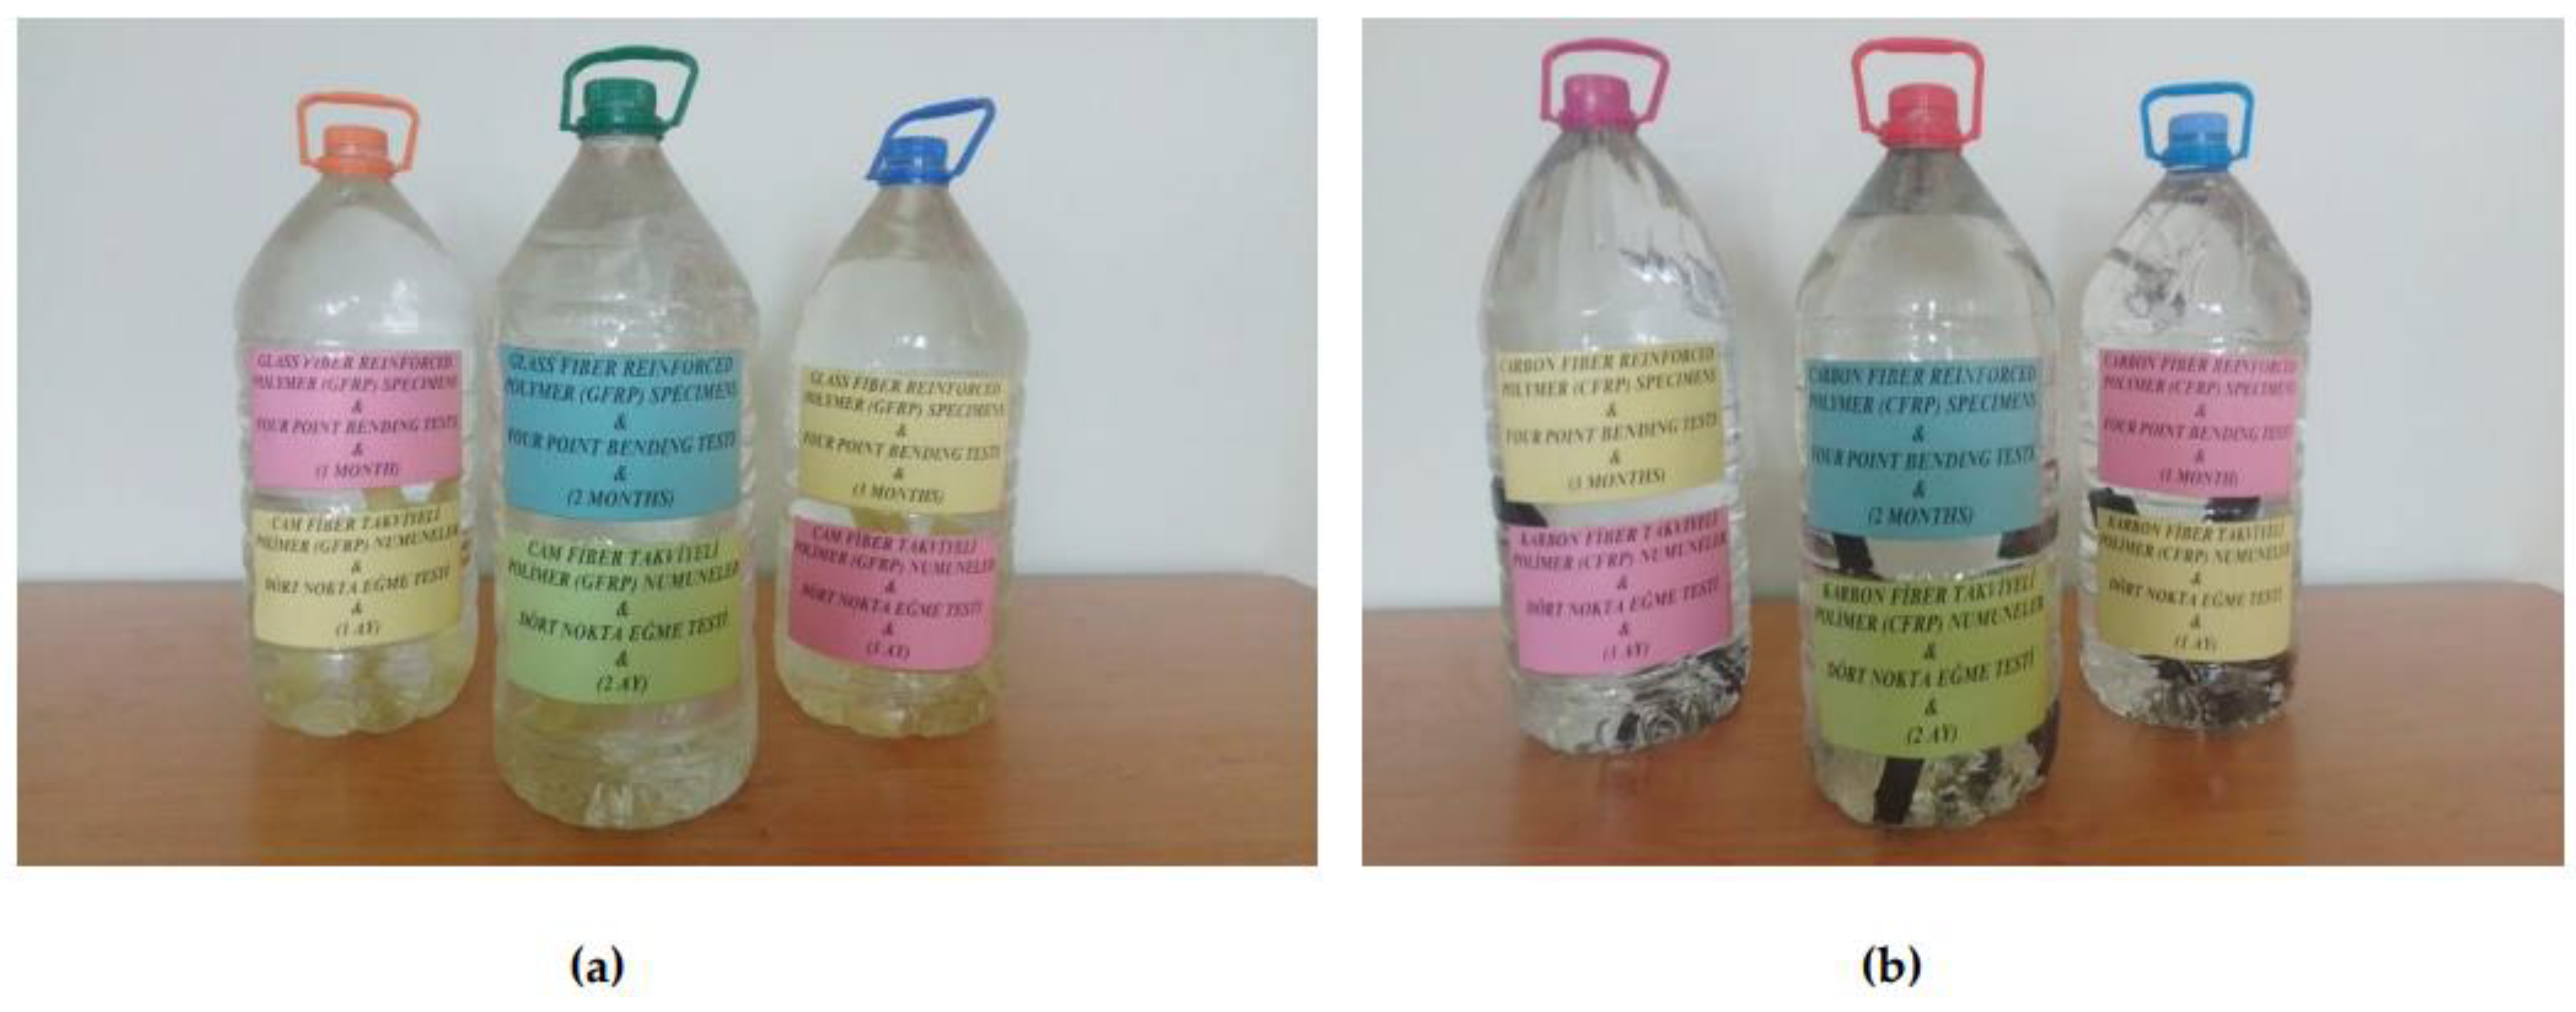
Figure 7.
Analytical balance with 0.1 mg precision (DAIHAN Scientific, Korea) used to measure sample weights.
Figure 7.
Analytical balance with 0.1 mg precision (DAIHAN Scientific, Korea) used to measure sample weights.
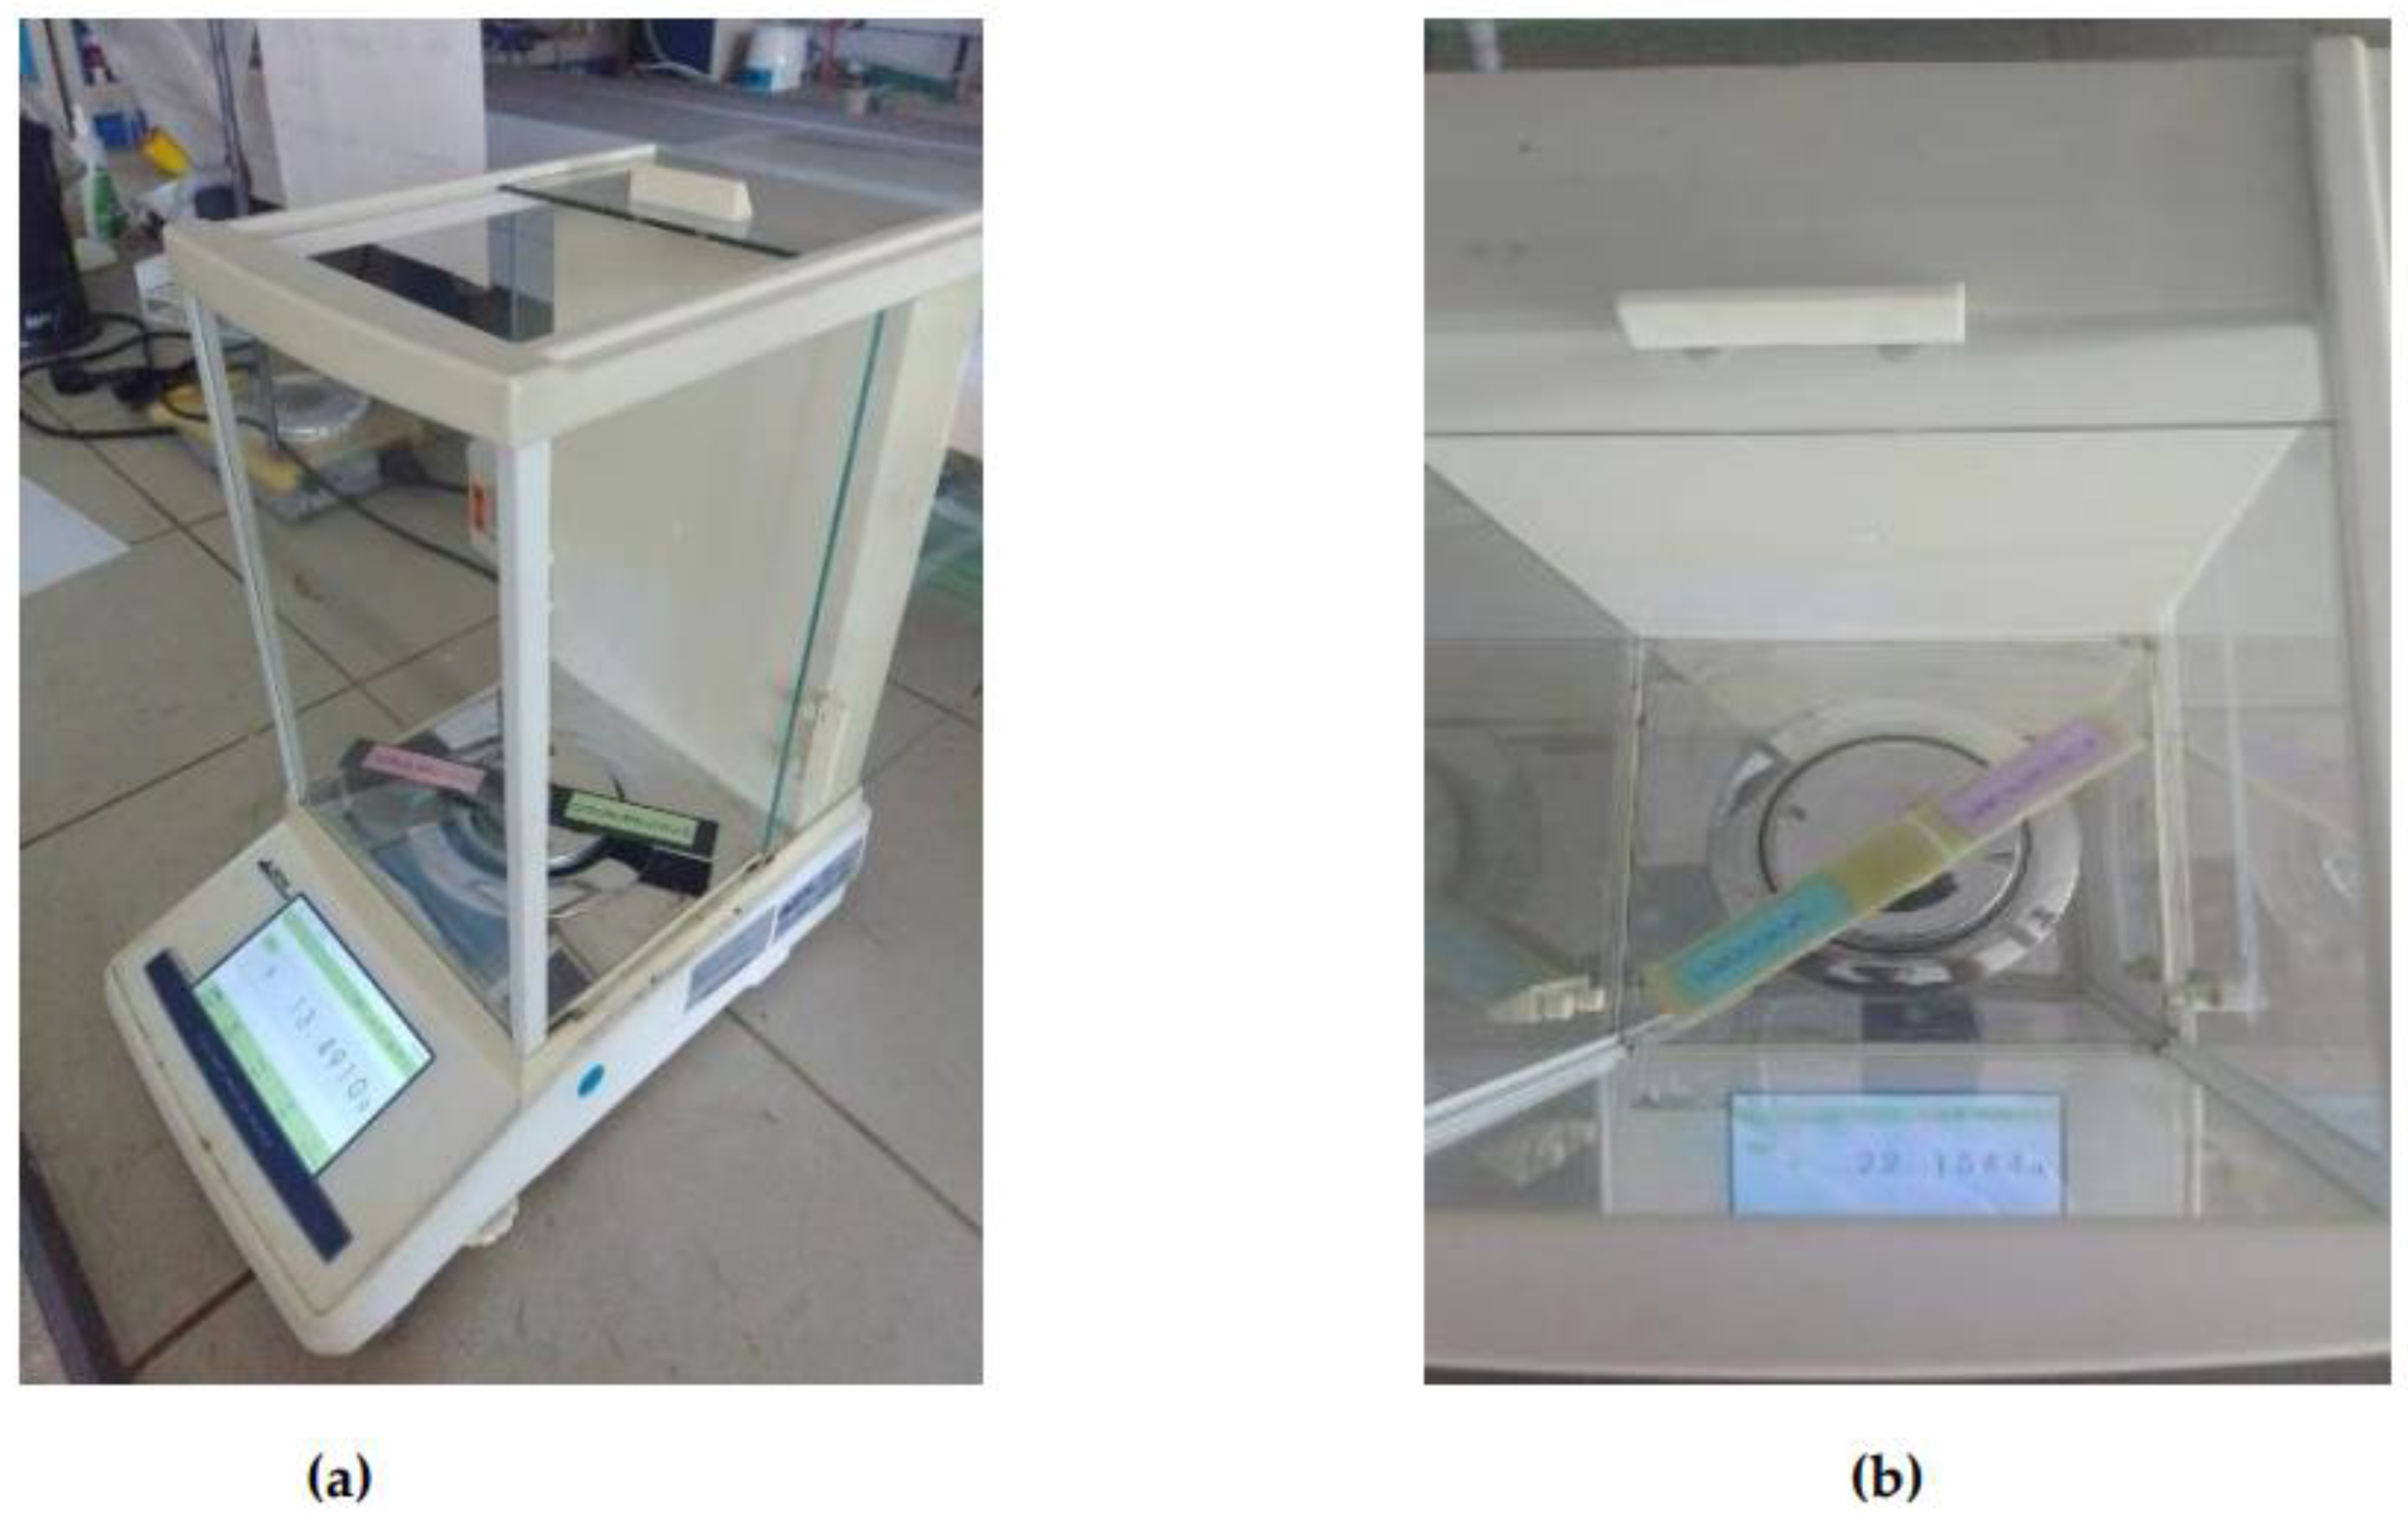
Figure 8.
Schematic view of four-point bending test conditions.
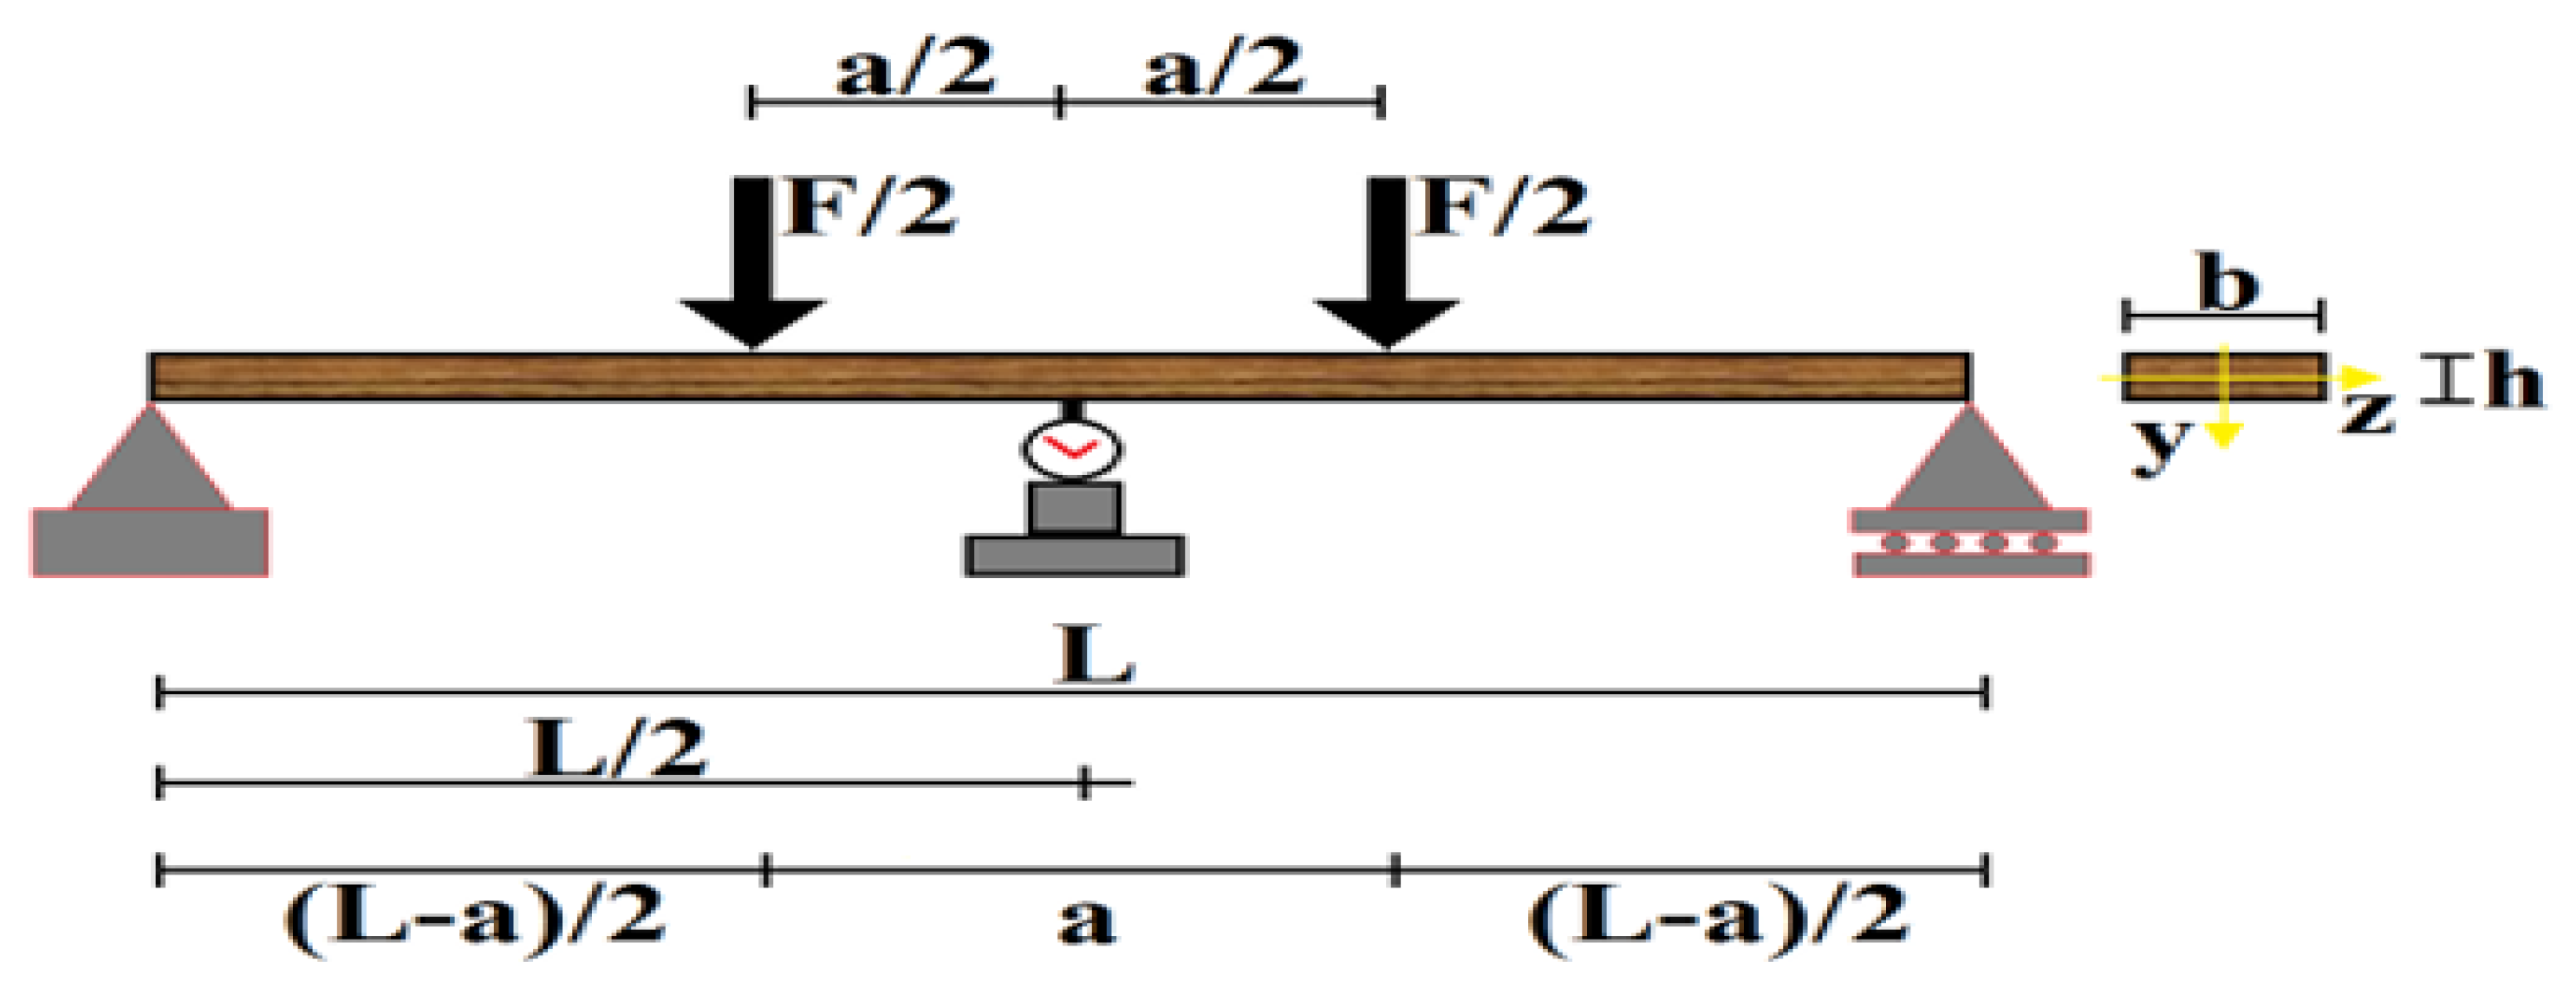
Figure 9.
GFRP (a) and CFRP (b) four-point bending tester and specimen positioning.
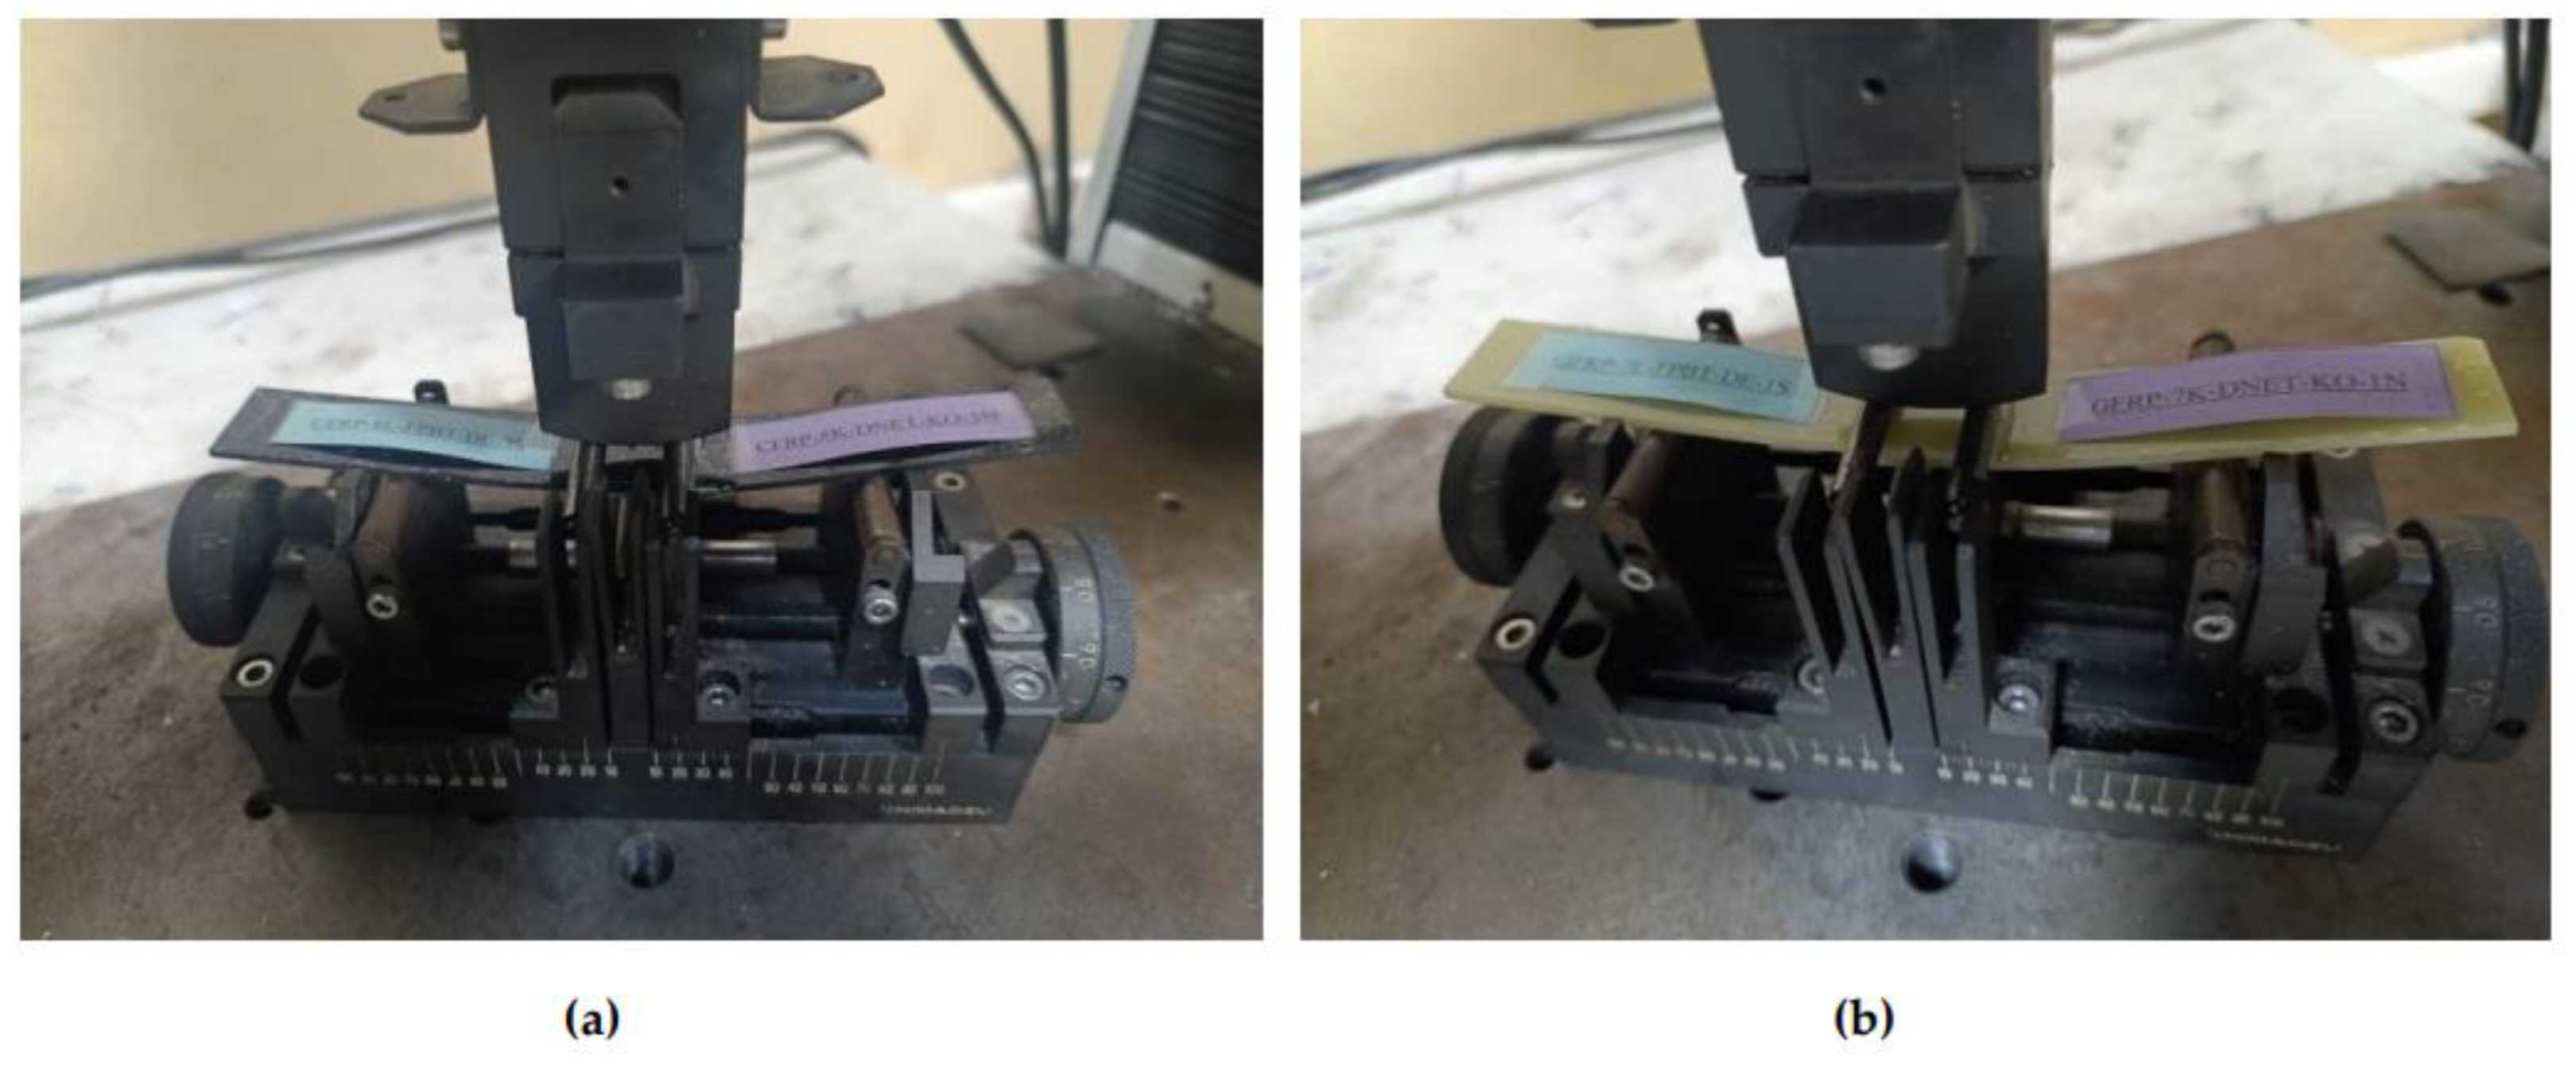
Figure 10.
Moisture Absorption Behavior of GFRP and CFRP Connections Over Time in Wind Turbine Blade Connections in Offshore Conditions.
Figure 10.
Moisture Absorption Behavior of GFRP and CFRP Connections Over Time in Wind Turbine Blade Connections in Offshore Conditions.
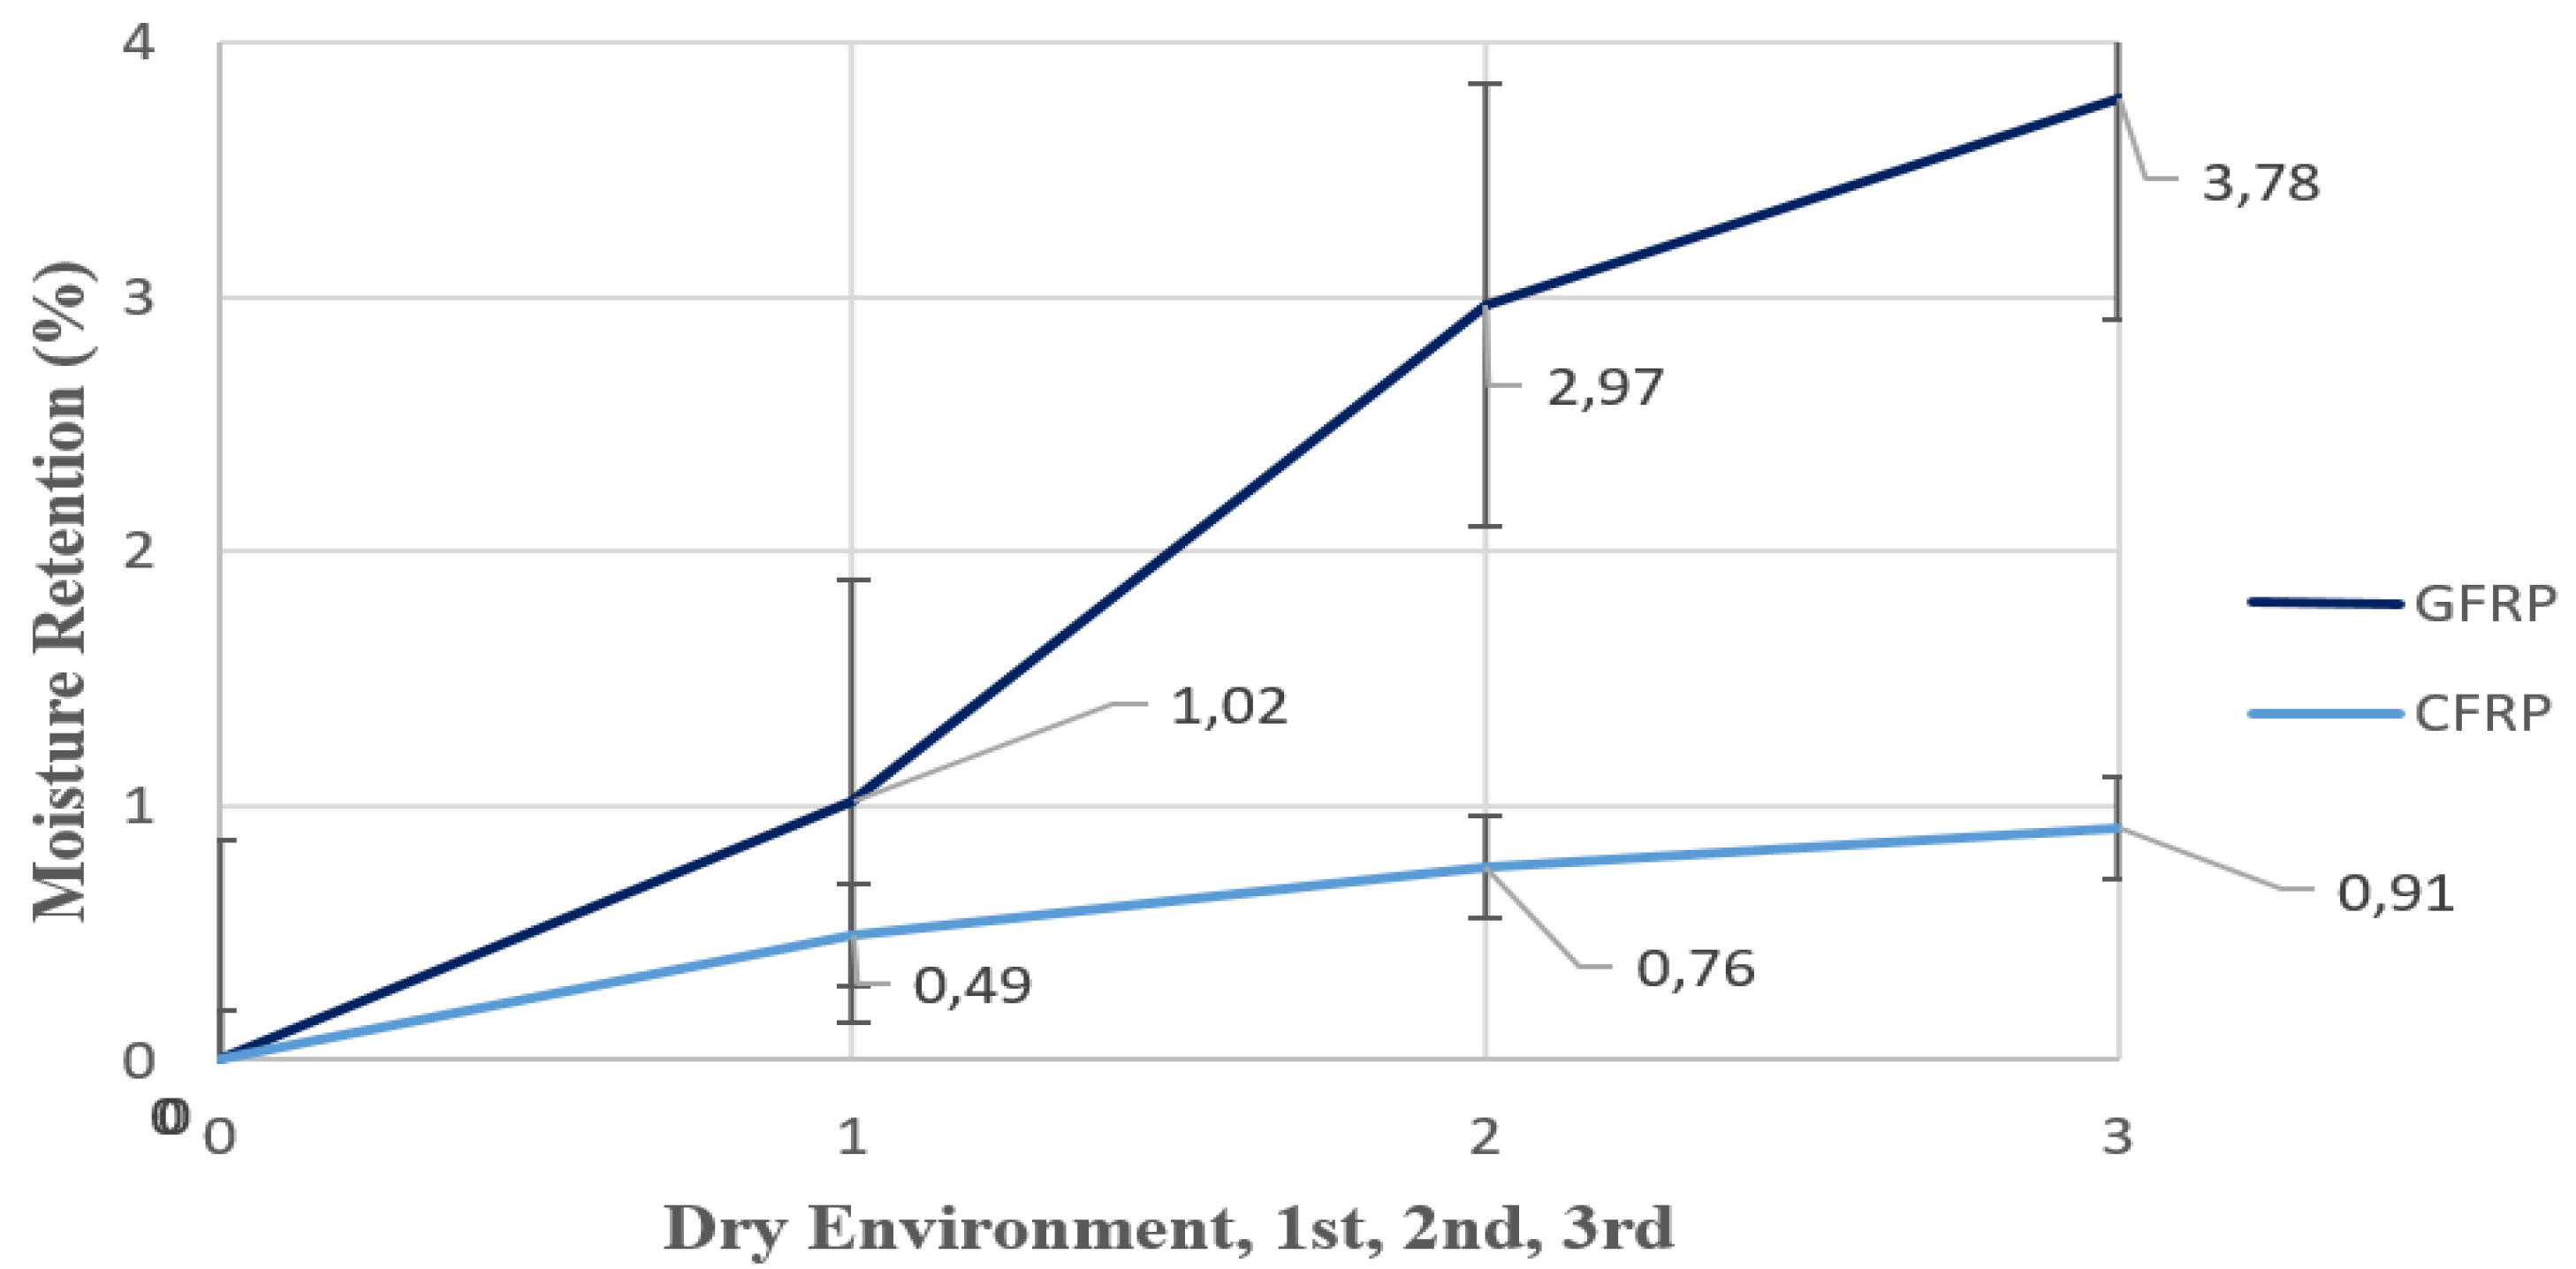
Figure 11.
Four-point bending tester and positioning of GFRP (a) and CFRP (b) dry specimens.
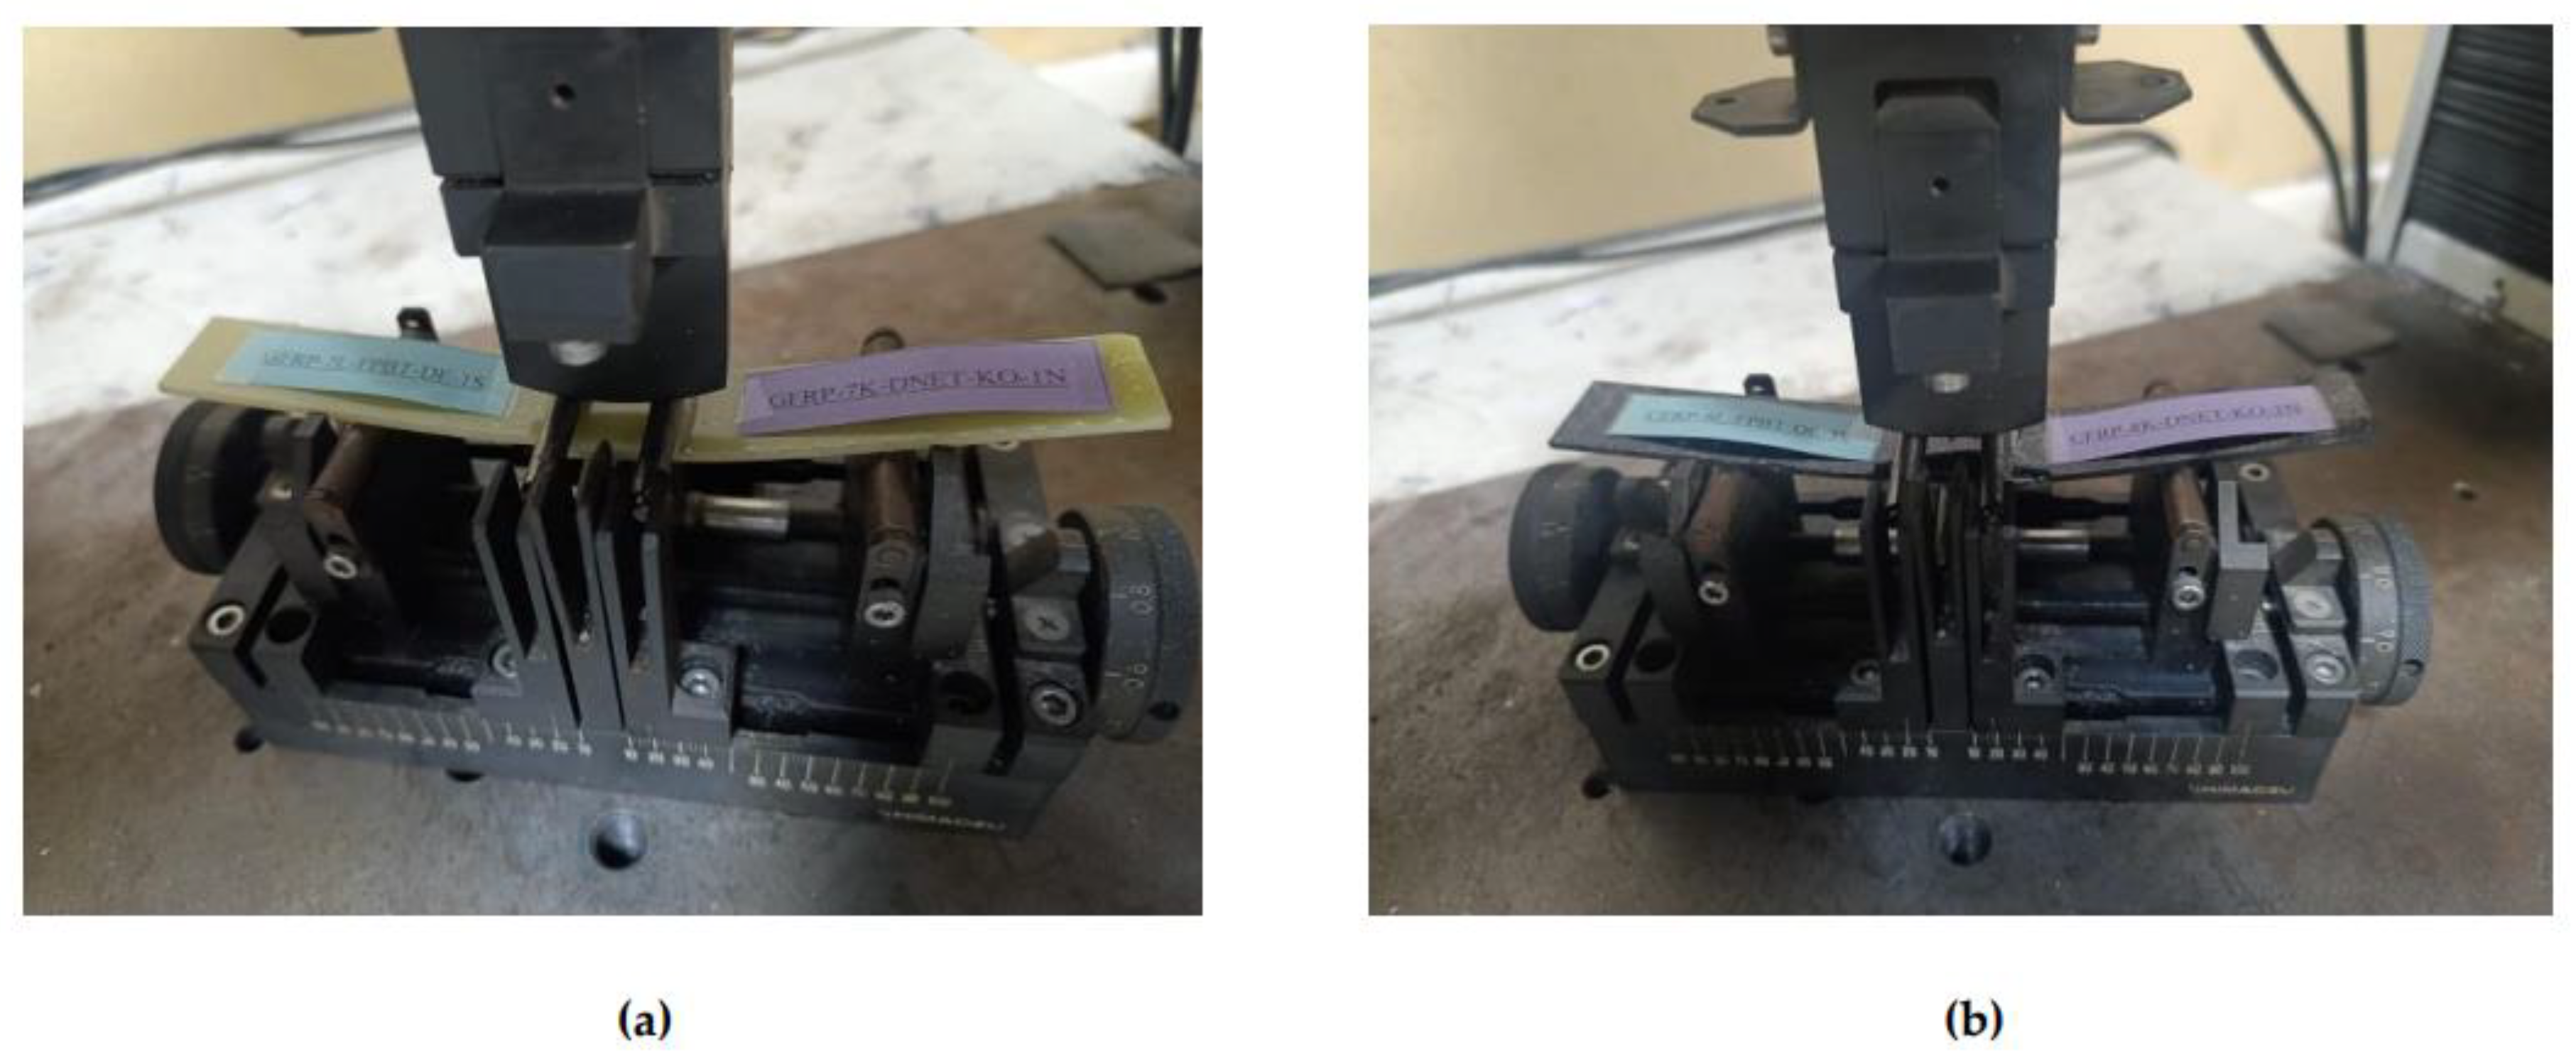
Figure 12.
GFRP-7L-FPBT-DE Dry Conditioned (a) and surface roughness profile along the damage zone (b).
Figure 12.
GFRP-7L-FPBT-DE Dry Conditioned (a) and surface roughness profile along the damage zone (b).
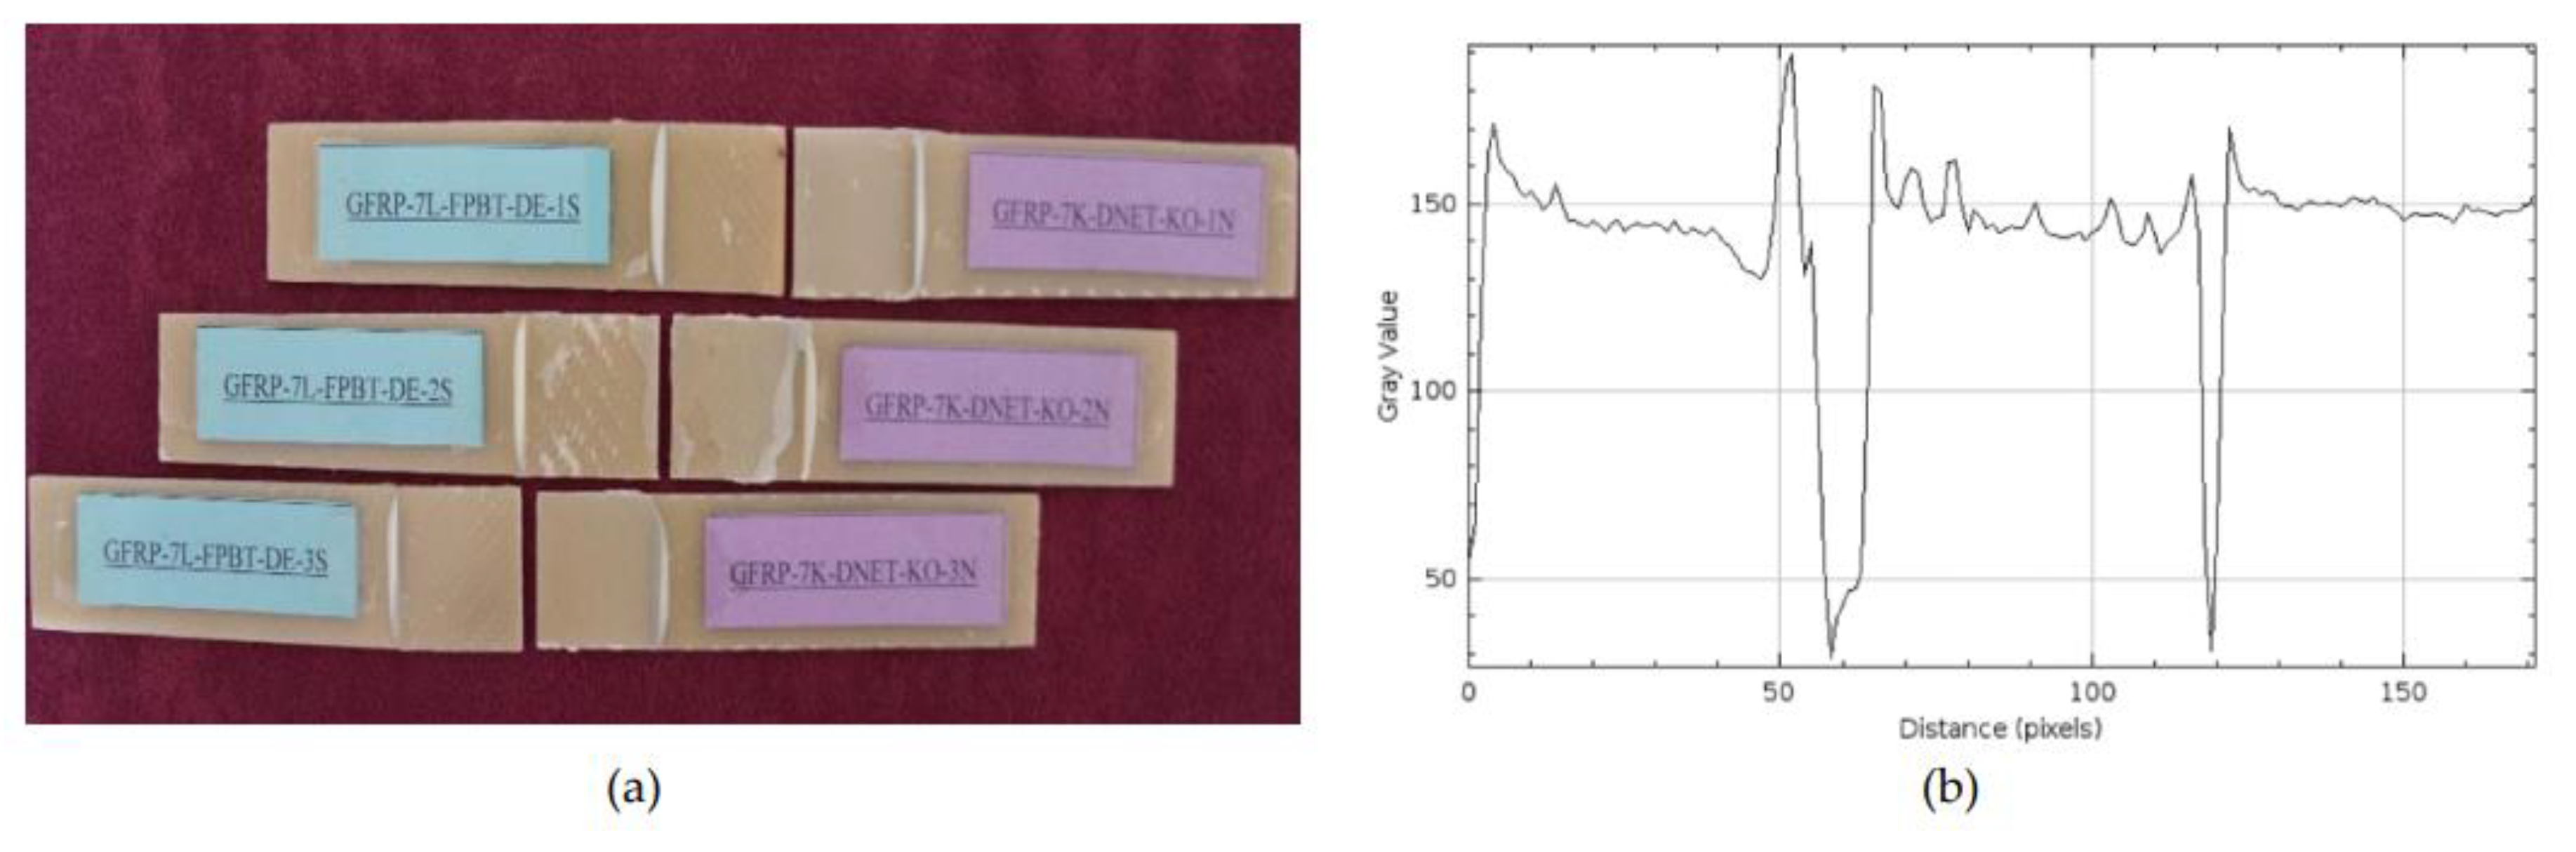
Figure 13.
CFRP-8L-FPBT-DE Dry Conditioned(a) and surface roughness profile along the damage zone (b).
Figure 13.
CFRP-8L-FPBT-DE Dry Conditioned(a) and surface roughness profile along the damage zone (b).
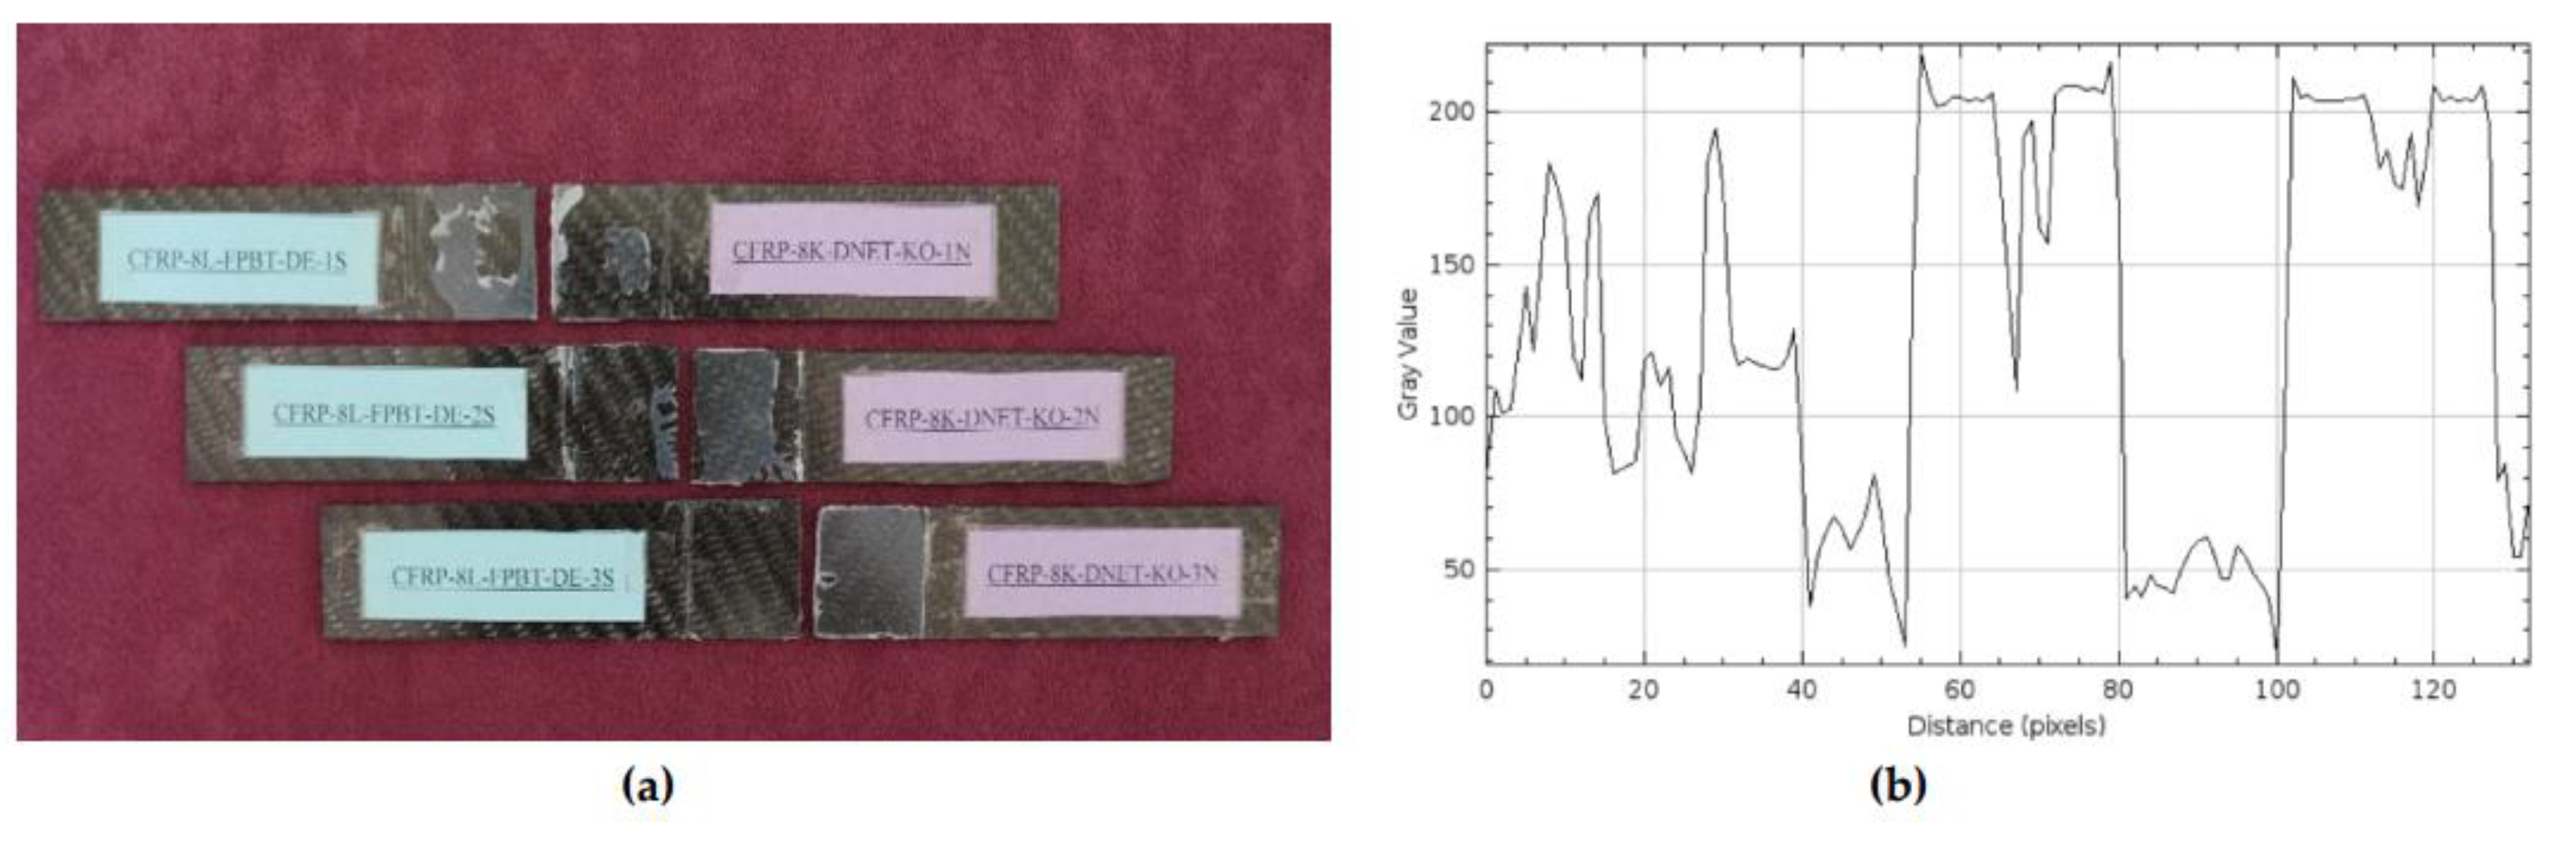
Figure 14.
Four-point bending tester, positioning of GFRP (a) and CFRP (b) samples kept in seawater for 1 month.
Figure 14.
Four-point bending tester, positioning of GFRP (a) and CFRP (b) samples kept in seawater for 1 month.
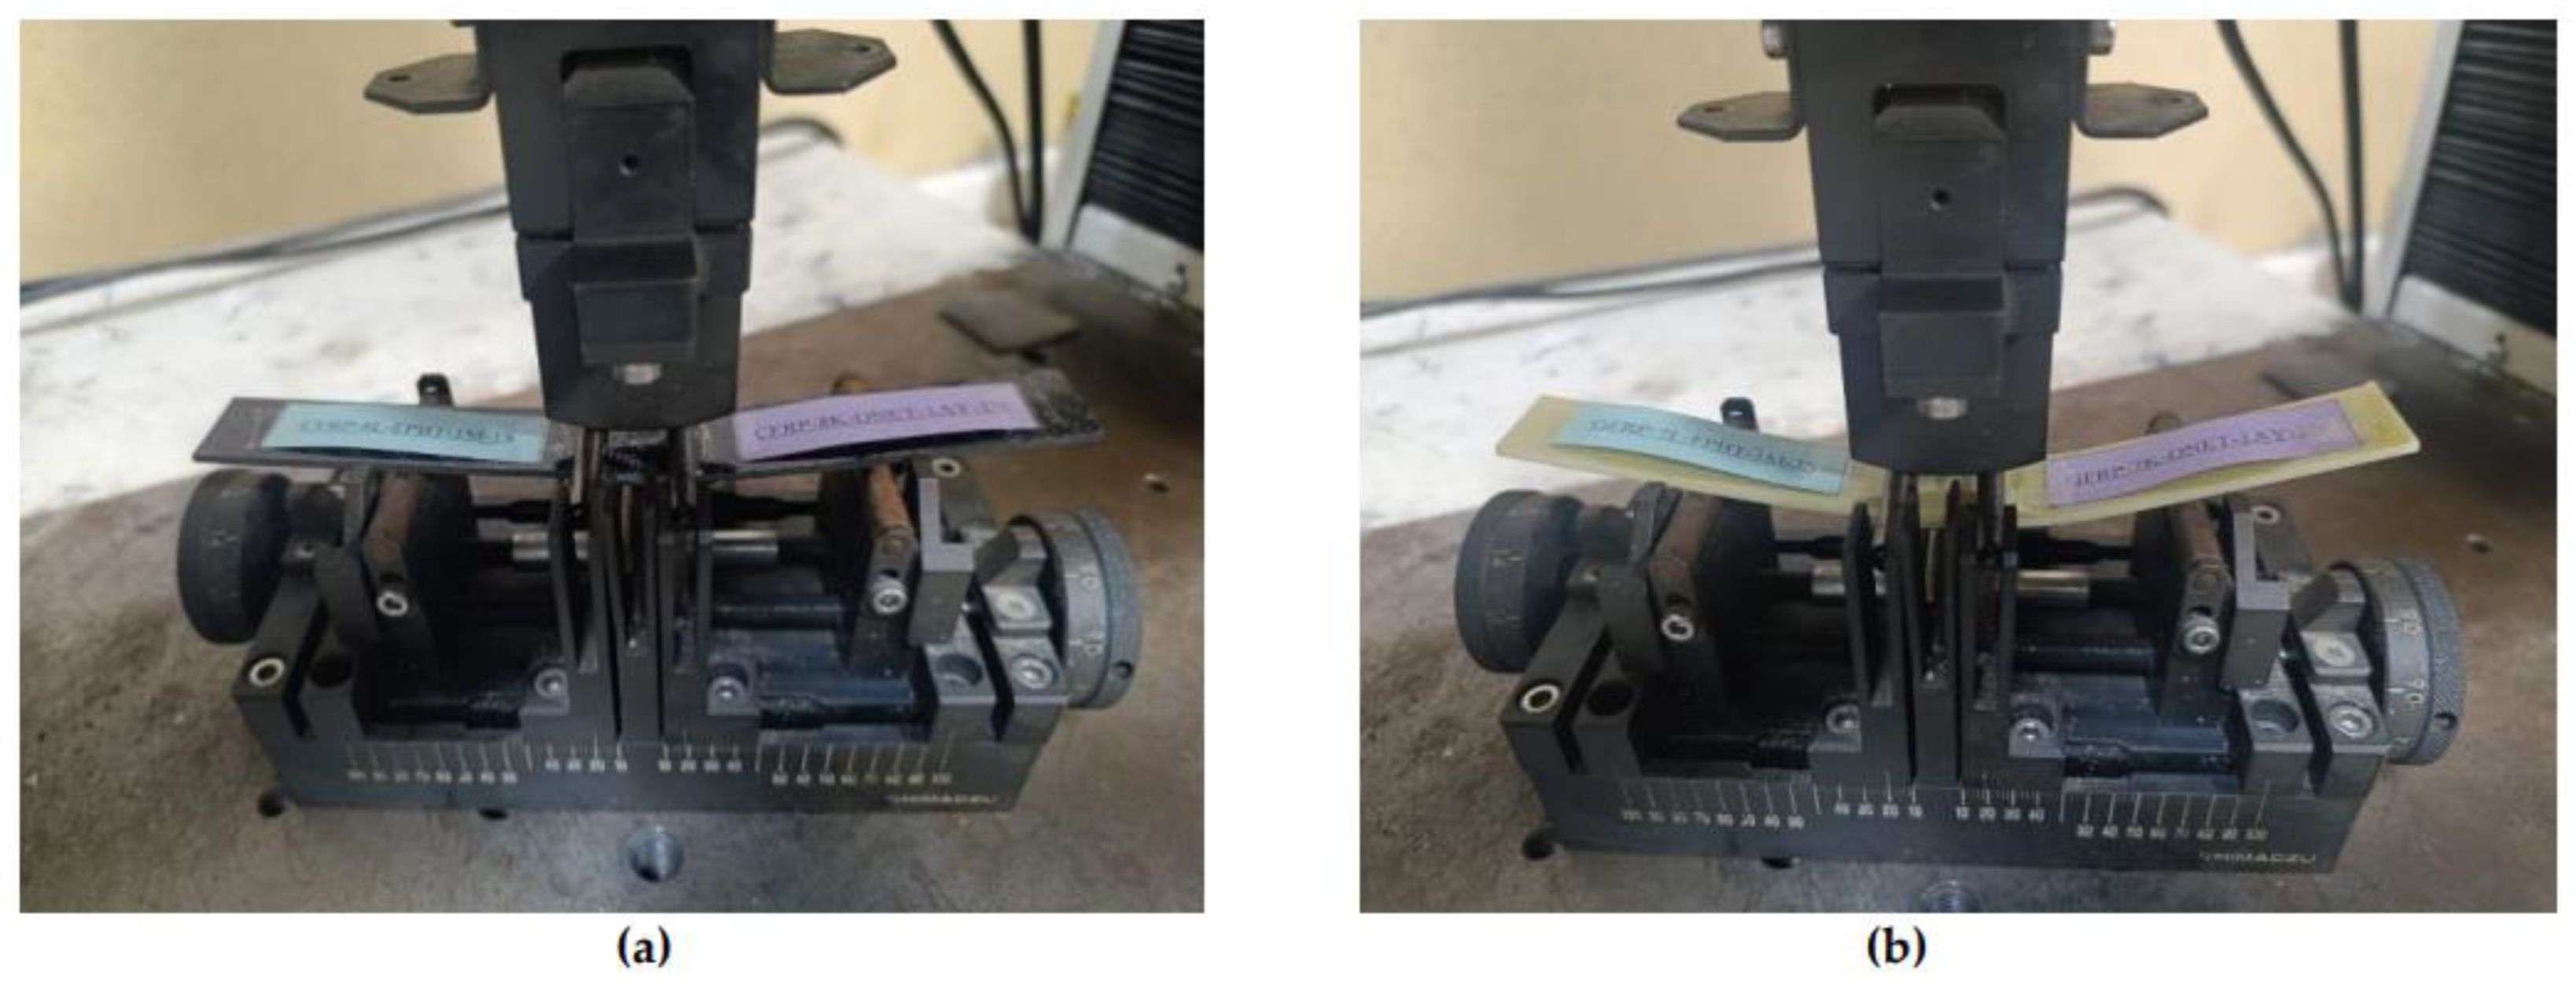
Figure 15.
GFRP-7L-FPBT-1M Samples Kept In Seawater For 1 Month(a) and surface roughness profile along the damage zone (b).
Figure 15.
GFRP-7L-FPBT-1M Samples Kept In Seawater For 1 Month(a) and surface roughness profile along the damage zone (b).
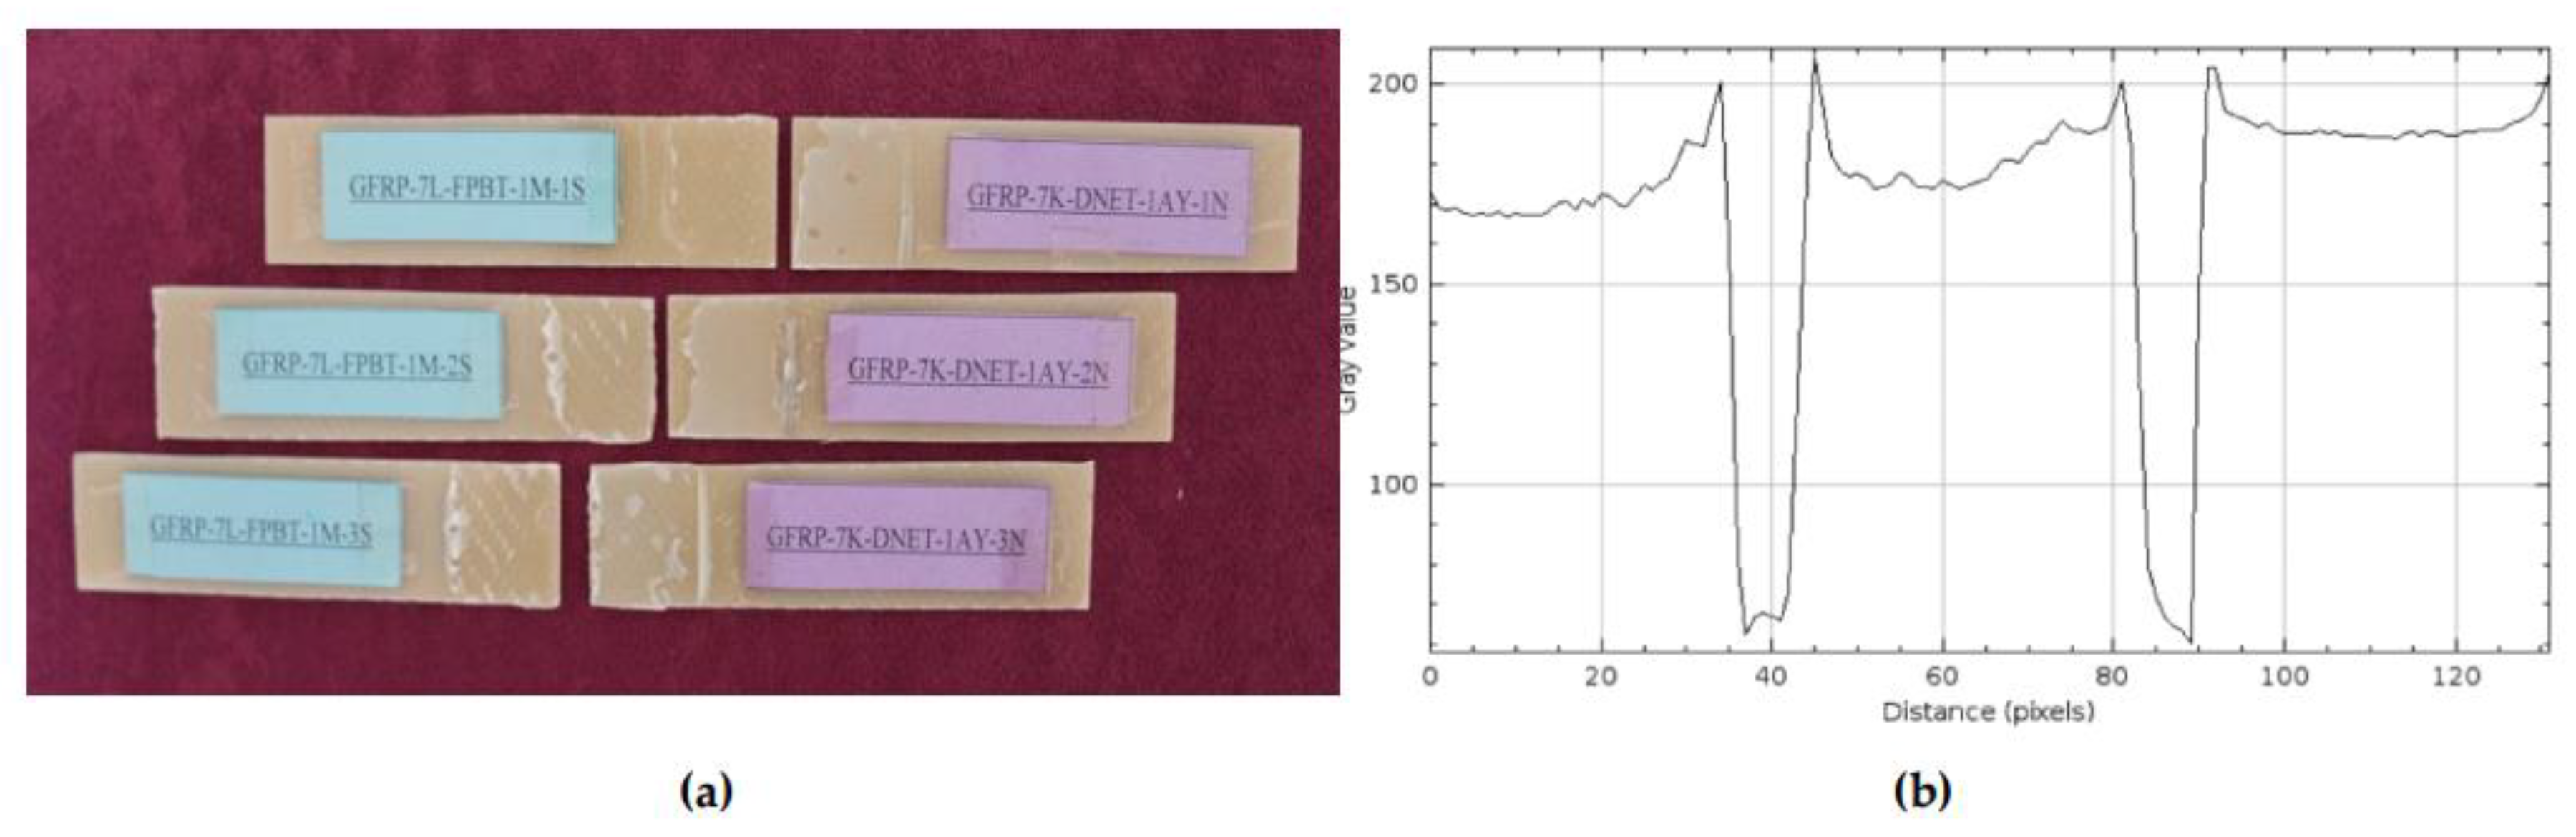
Figure 16.
CFRP-8L-FPBT-1M Samples Kept In Seawater For 1 Month (a) and surface roughness profile along the damage zone (b).
Figure 16.
CFRP-8L-FPBT-1M Samples Kept In Seawater For 1 Month (a) and surface roughness profile along the damage zone (b).
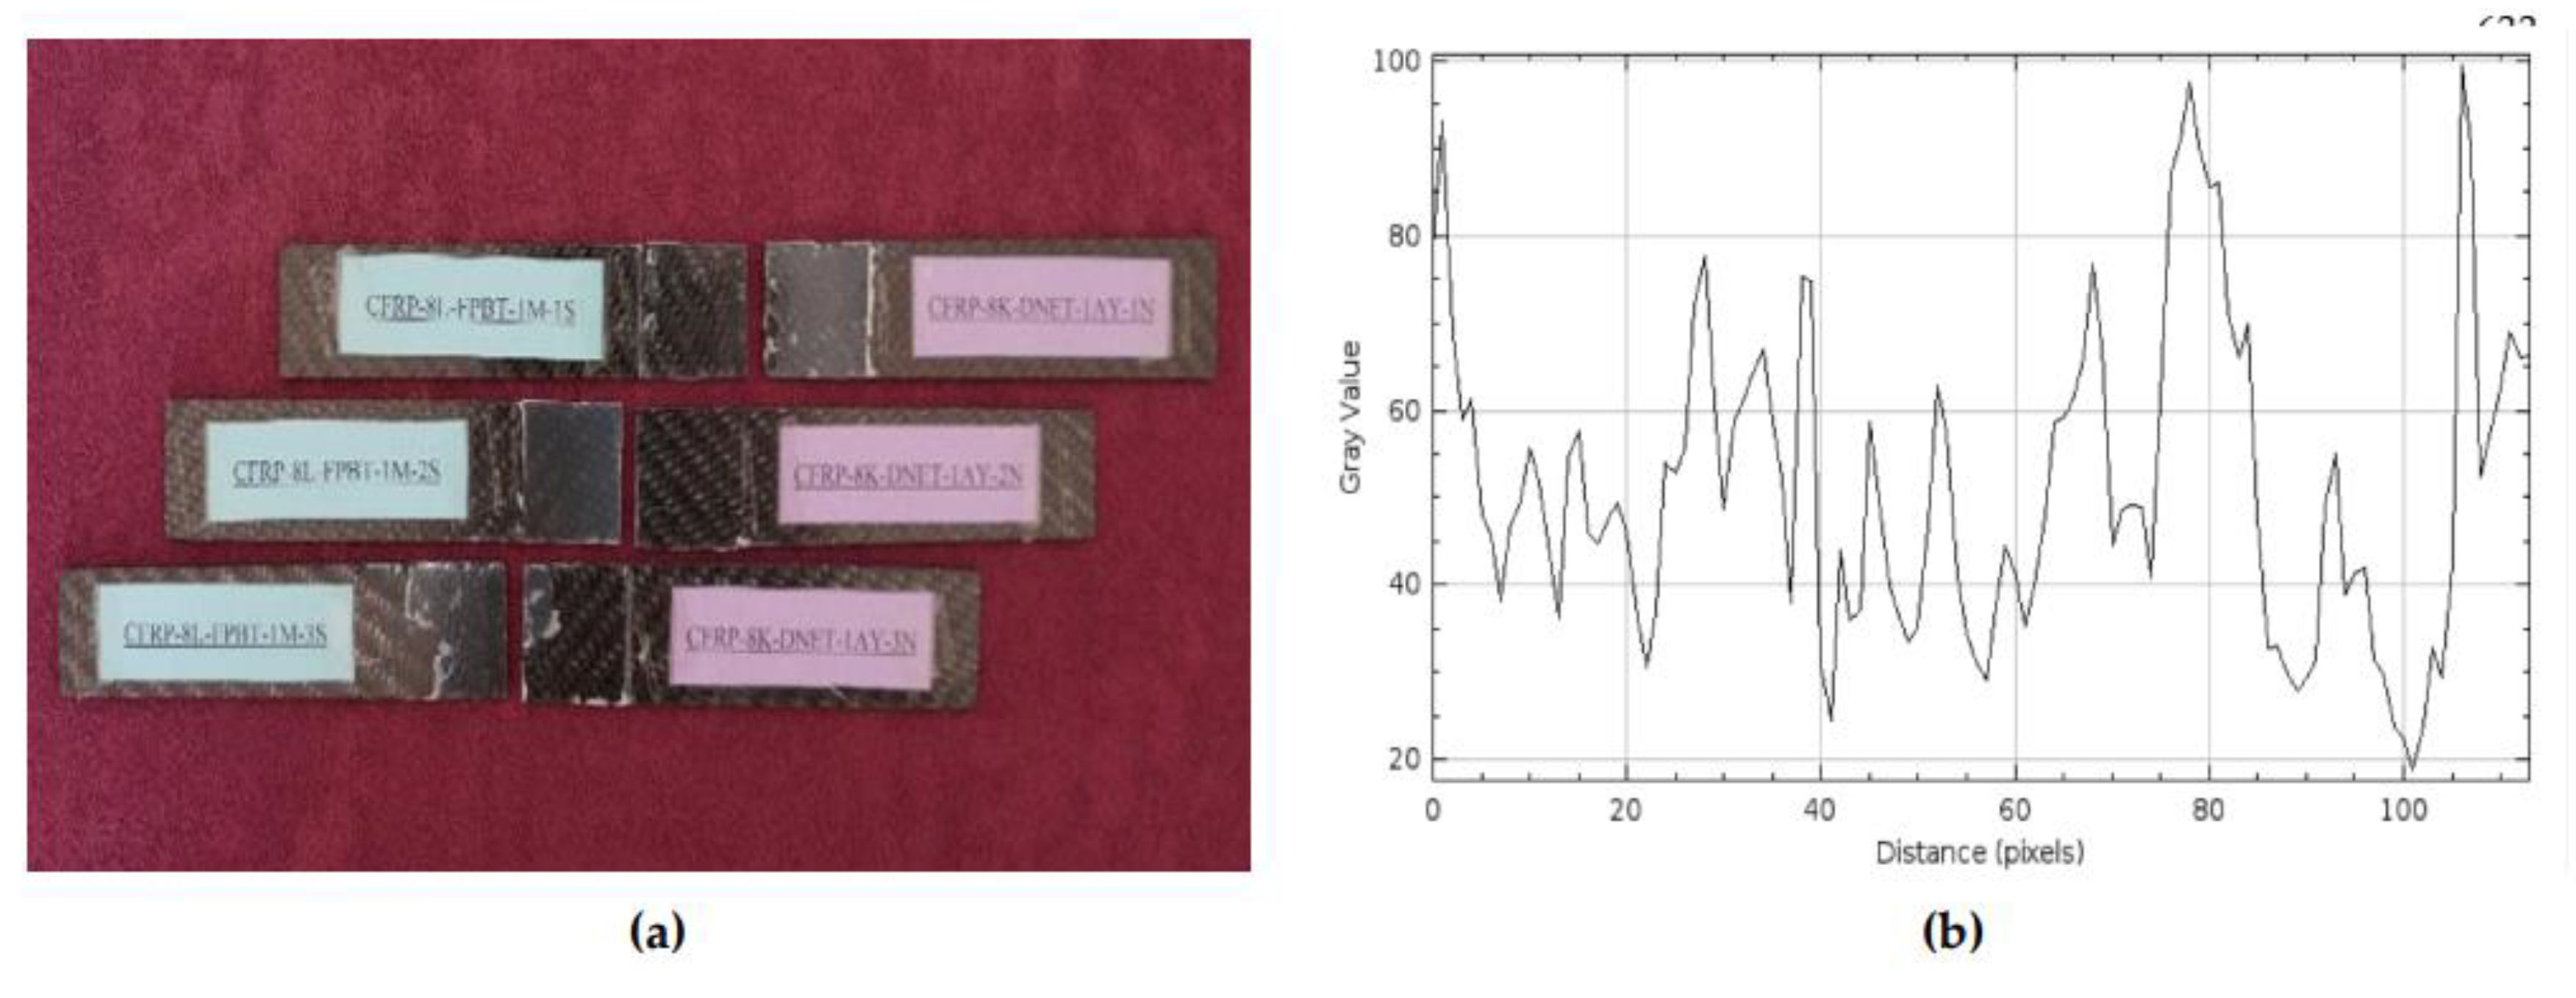
Figure 17.
Four-point bending tester and positioning of GFRP (a) and CFRP (b) samples kept in seawater for 2 months.
Figure 17.
Four-point bending tester and positioning of GFRP (a) and CFRP (b) samples kept in seawater for 2 months.
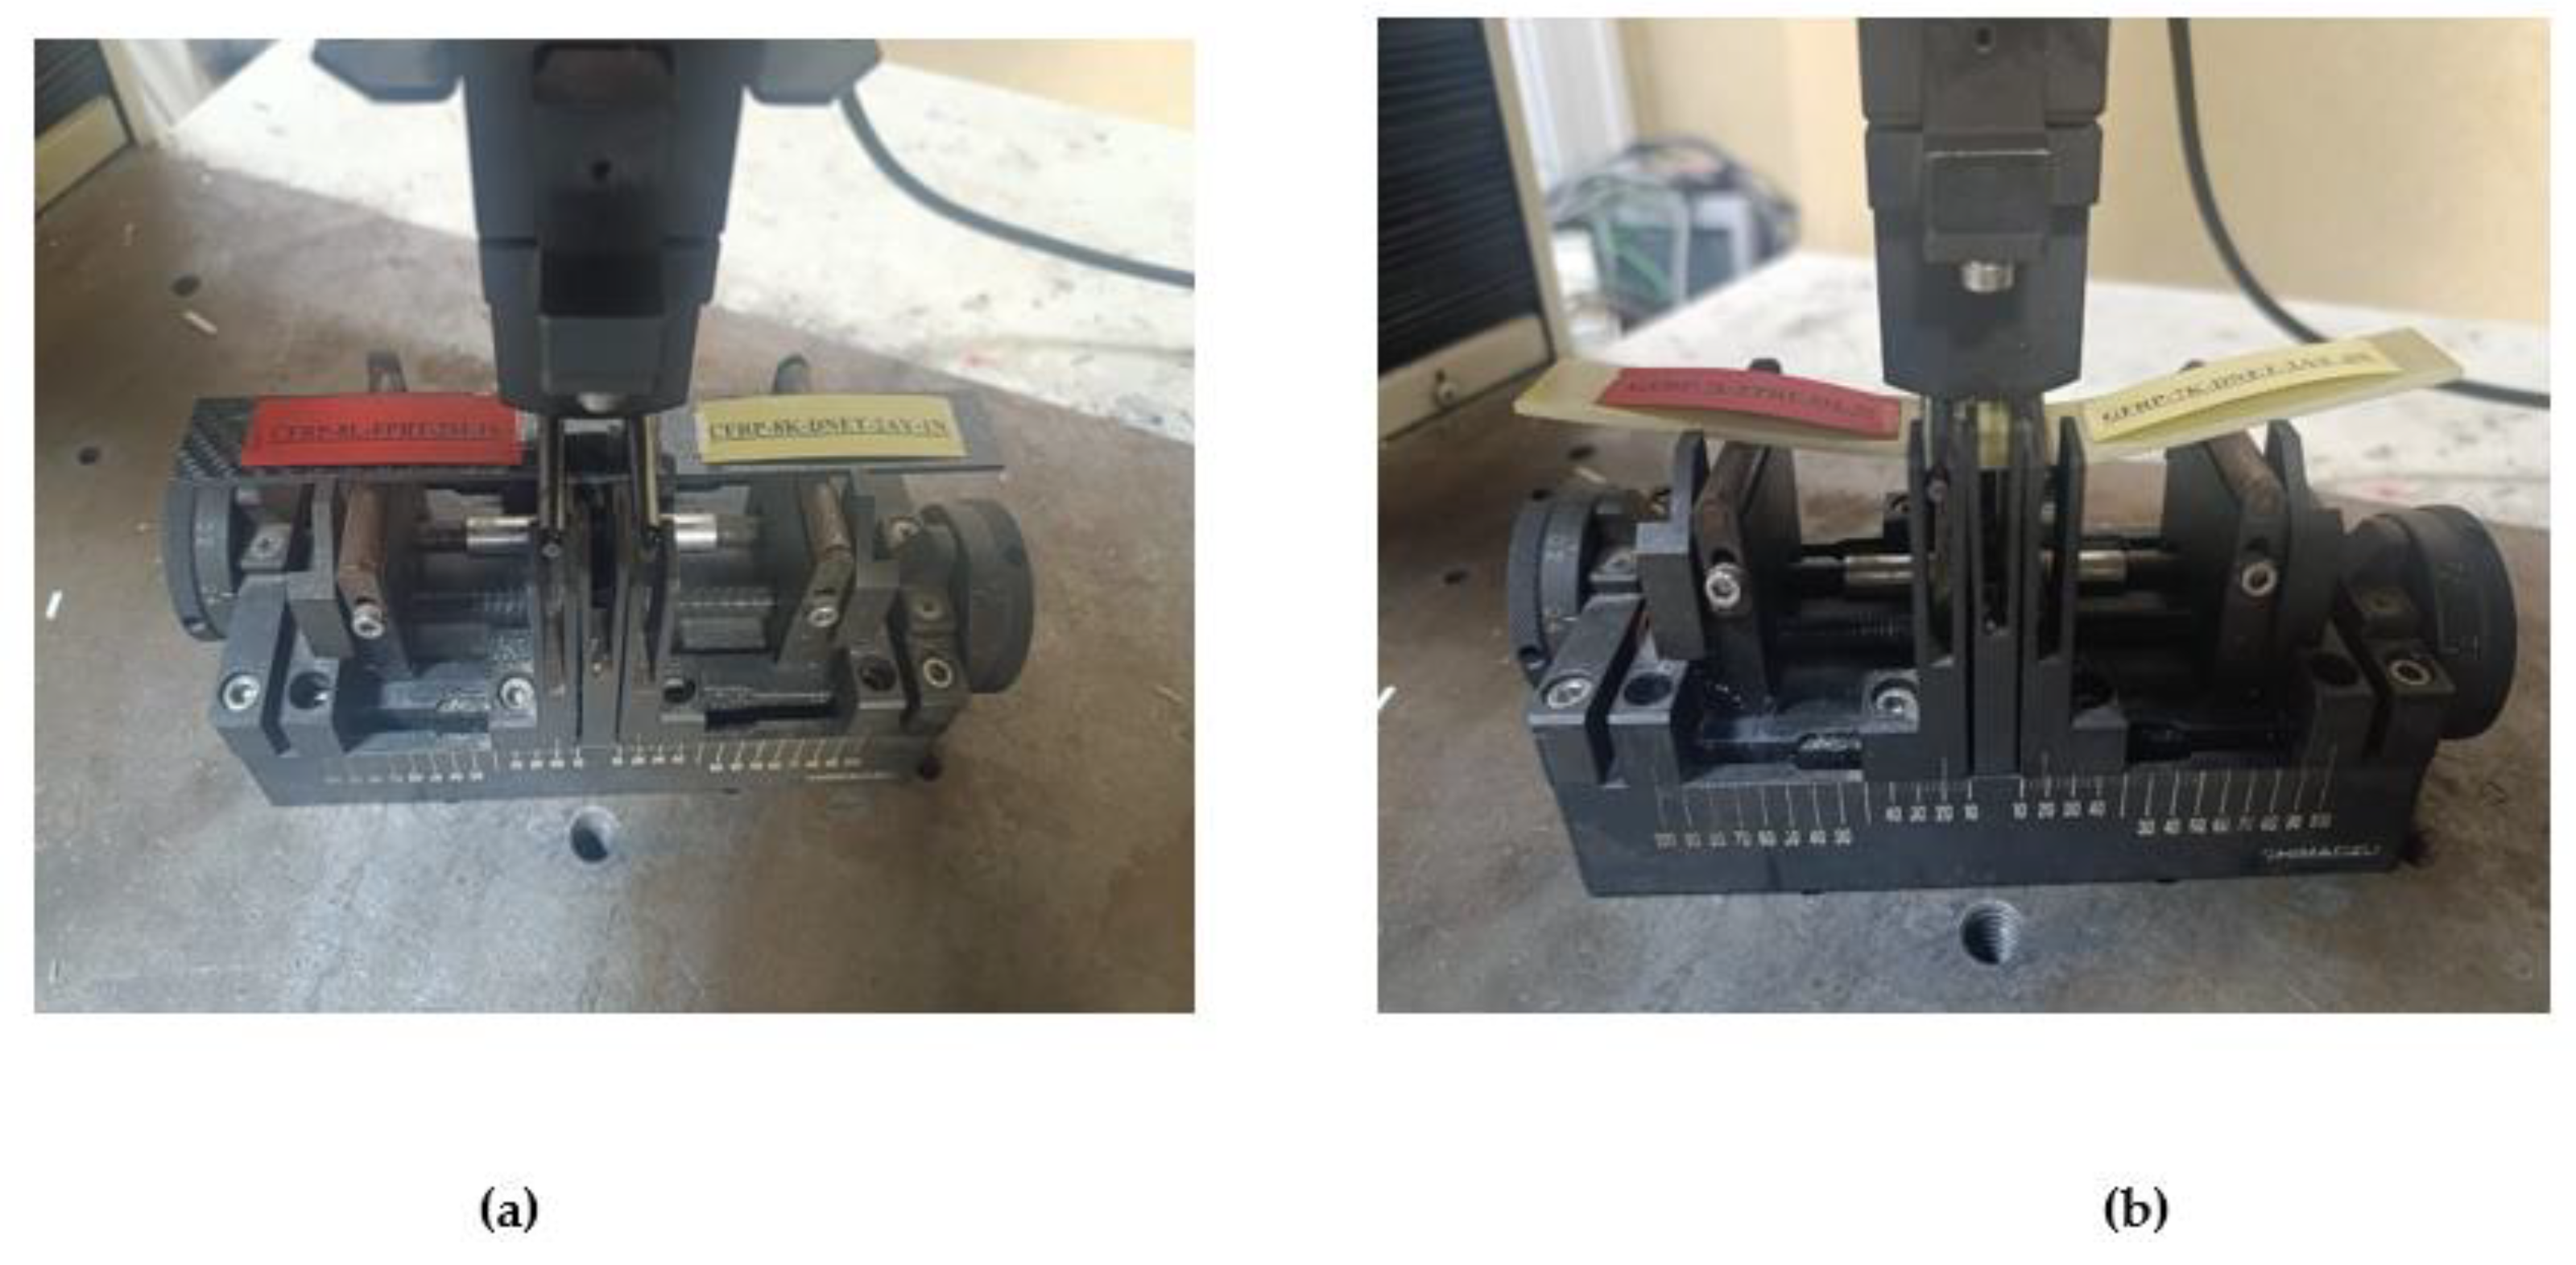
Figure 18.
GFRP-7L-FPBT-2M Samples Were Kept In Sea Water For 2 Months (a) and surface roughness profile along the damage zone (b).
Figure 18.
GFRP-7L-FPBT-2M Samples Were Kept In Sea Water For 2 Months (a) and surface roughness profile along the damage zone (b).
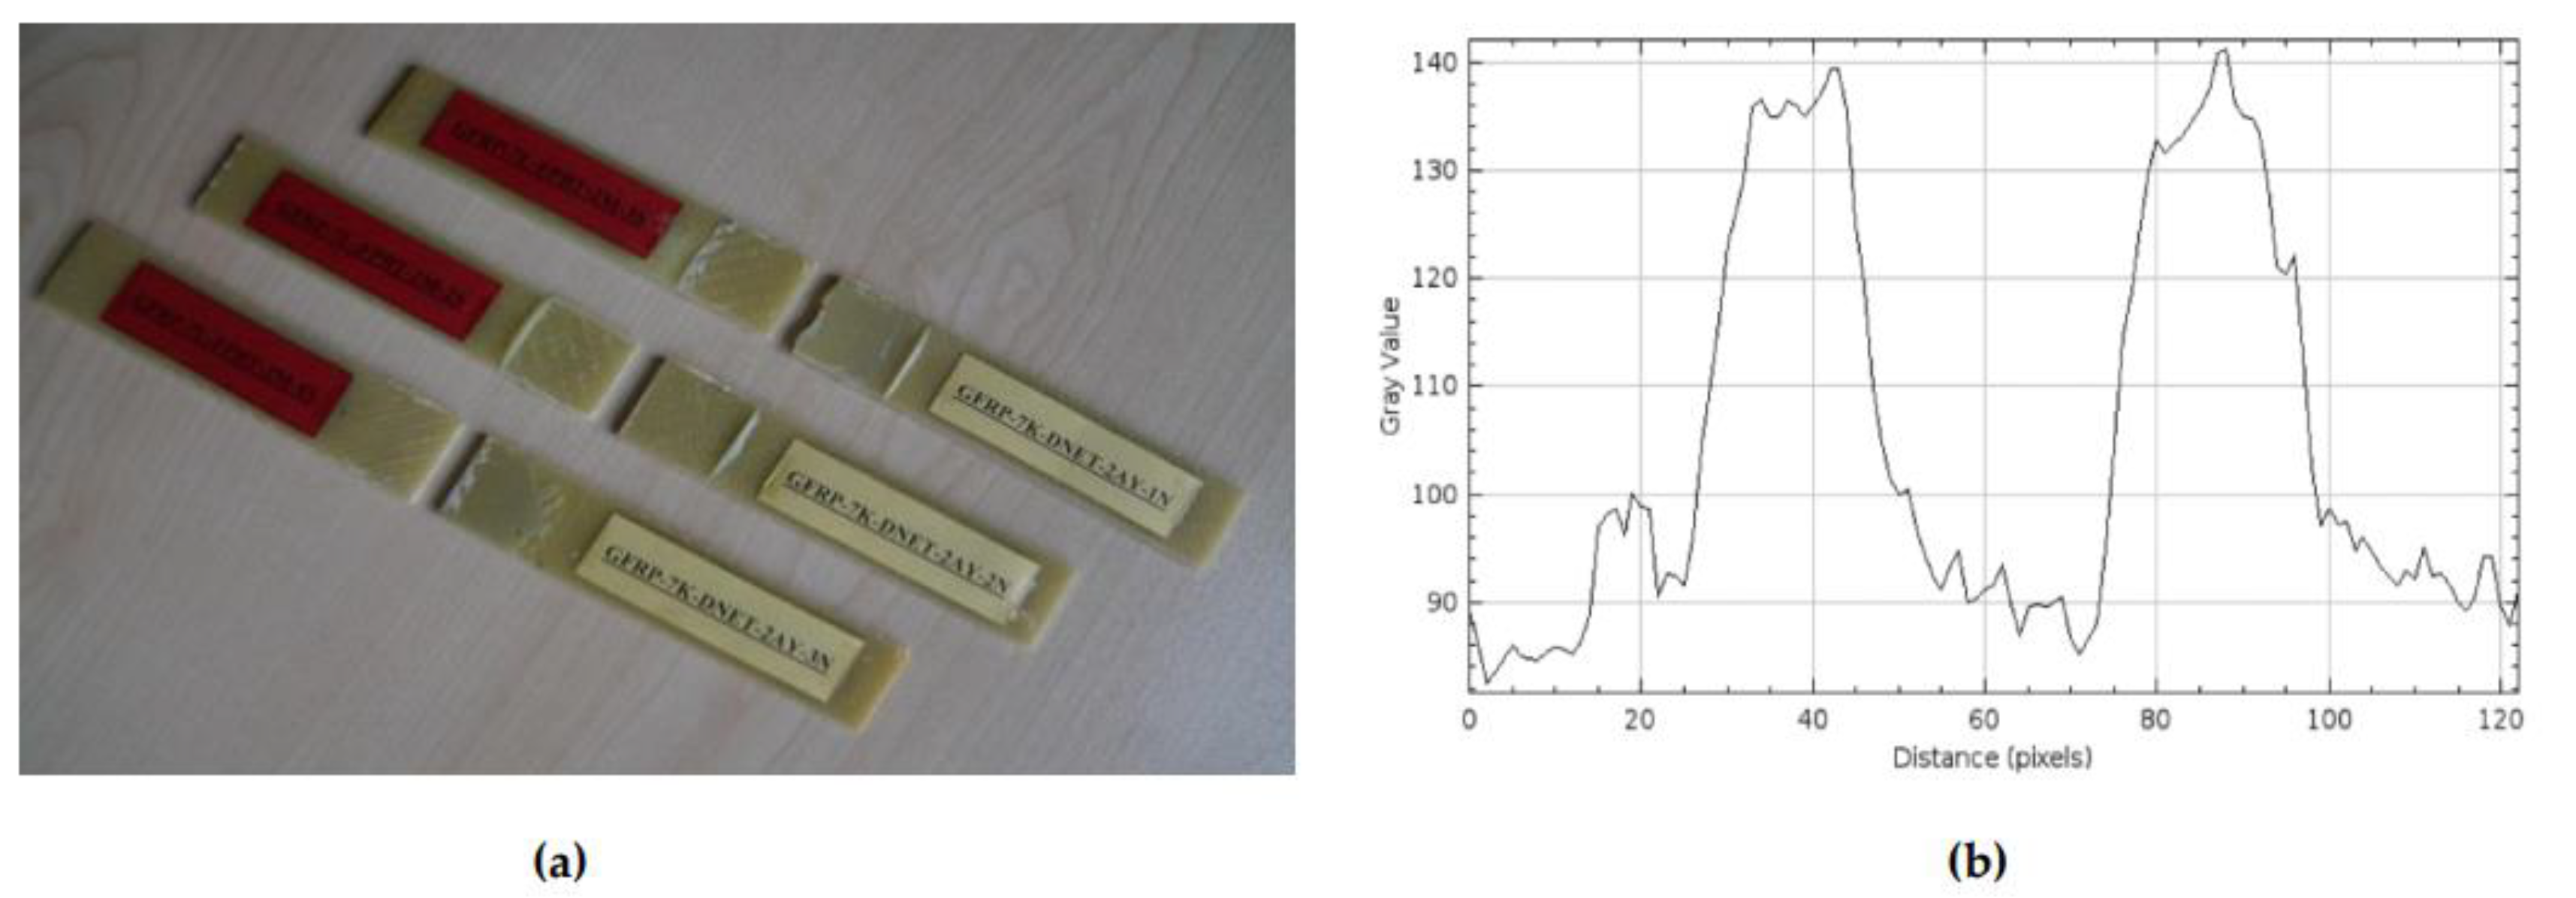
Figure 19.
CFRP-8L-FPBT-2M Samples Were Kept In Sea Water For 2 Months (a) and and surface roughness profile along the damage zone (b).
Figure 19.
CFRP-8L-FPBT-2M Samples Were Kept In Sea Water For 2 Months (a) and and surface roughness profile along the damage zone (b).
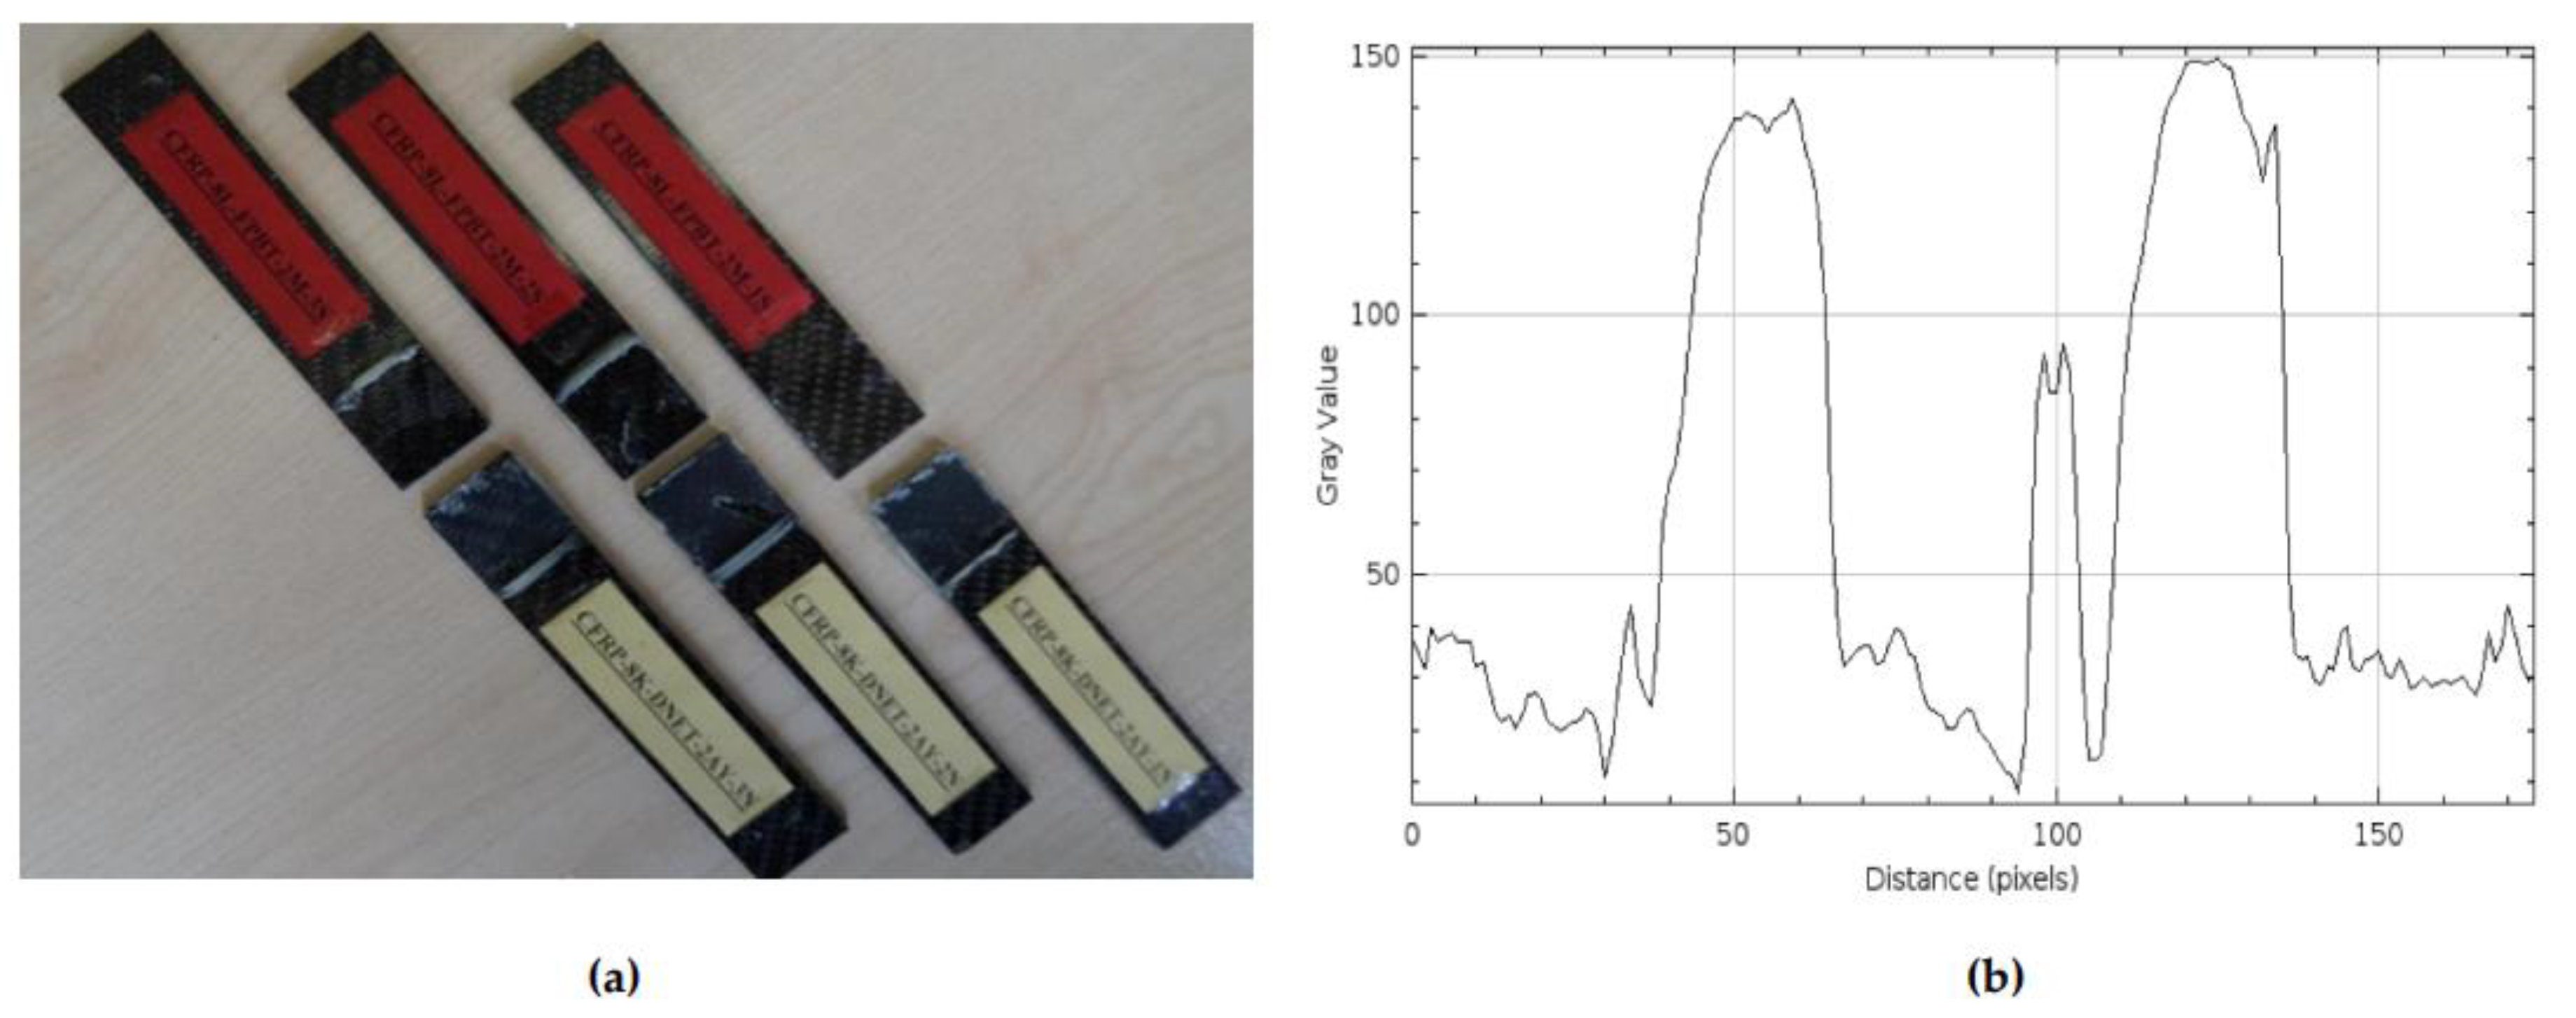
Figure 20.
Four-point bending tester and positioning of GFRP (a) and CFRP (b) samples kept in seawater for 3 months.
Figure 20.
Four-point bending tester and positioning of GFRP (a) and CFRP (b) samples kept in seawater for 3 months.
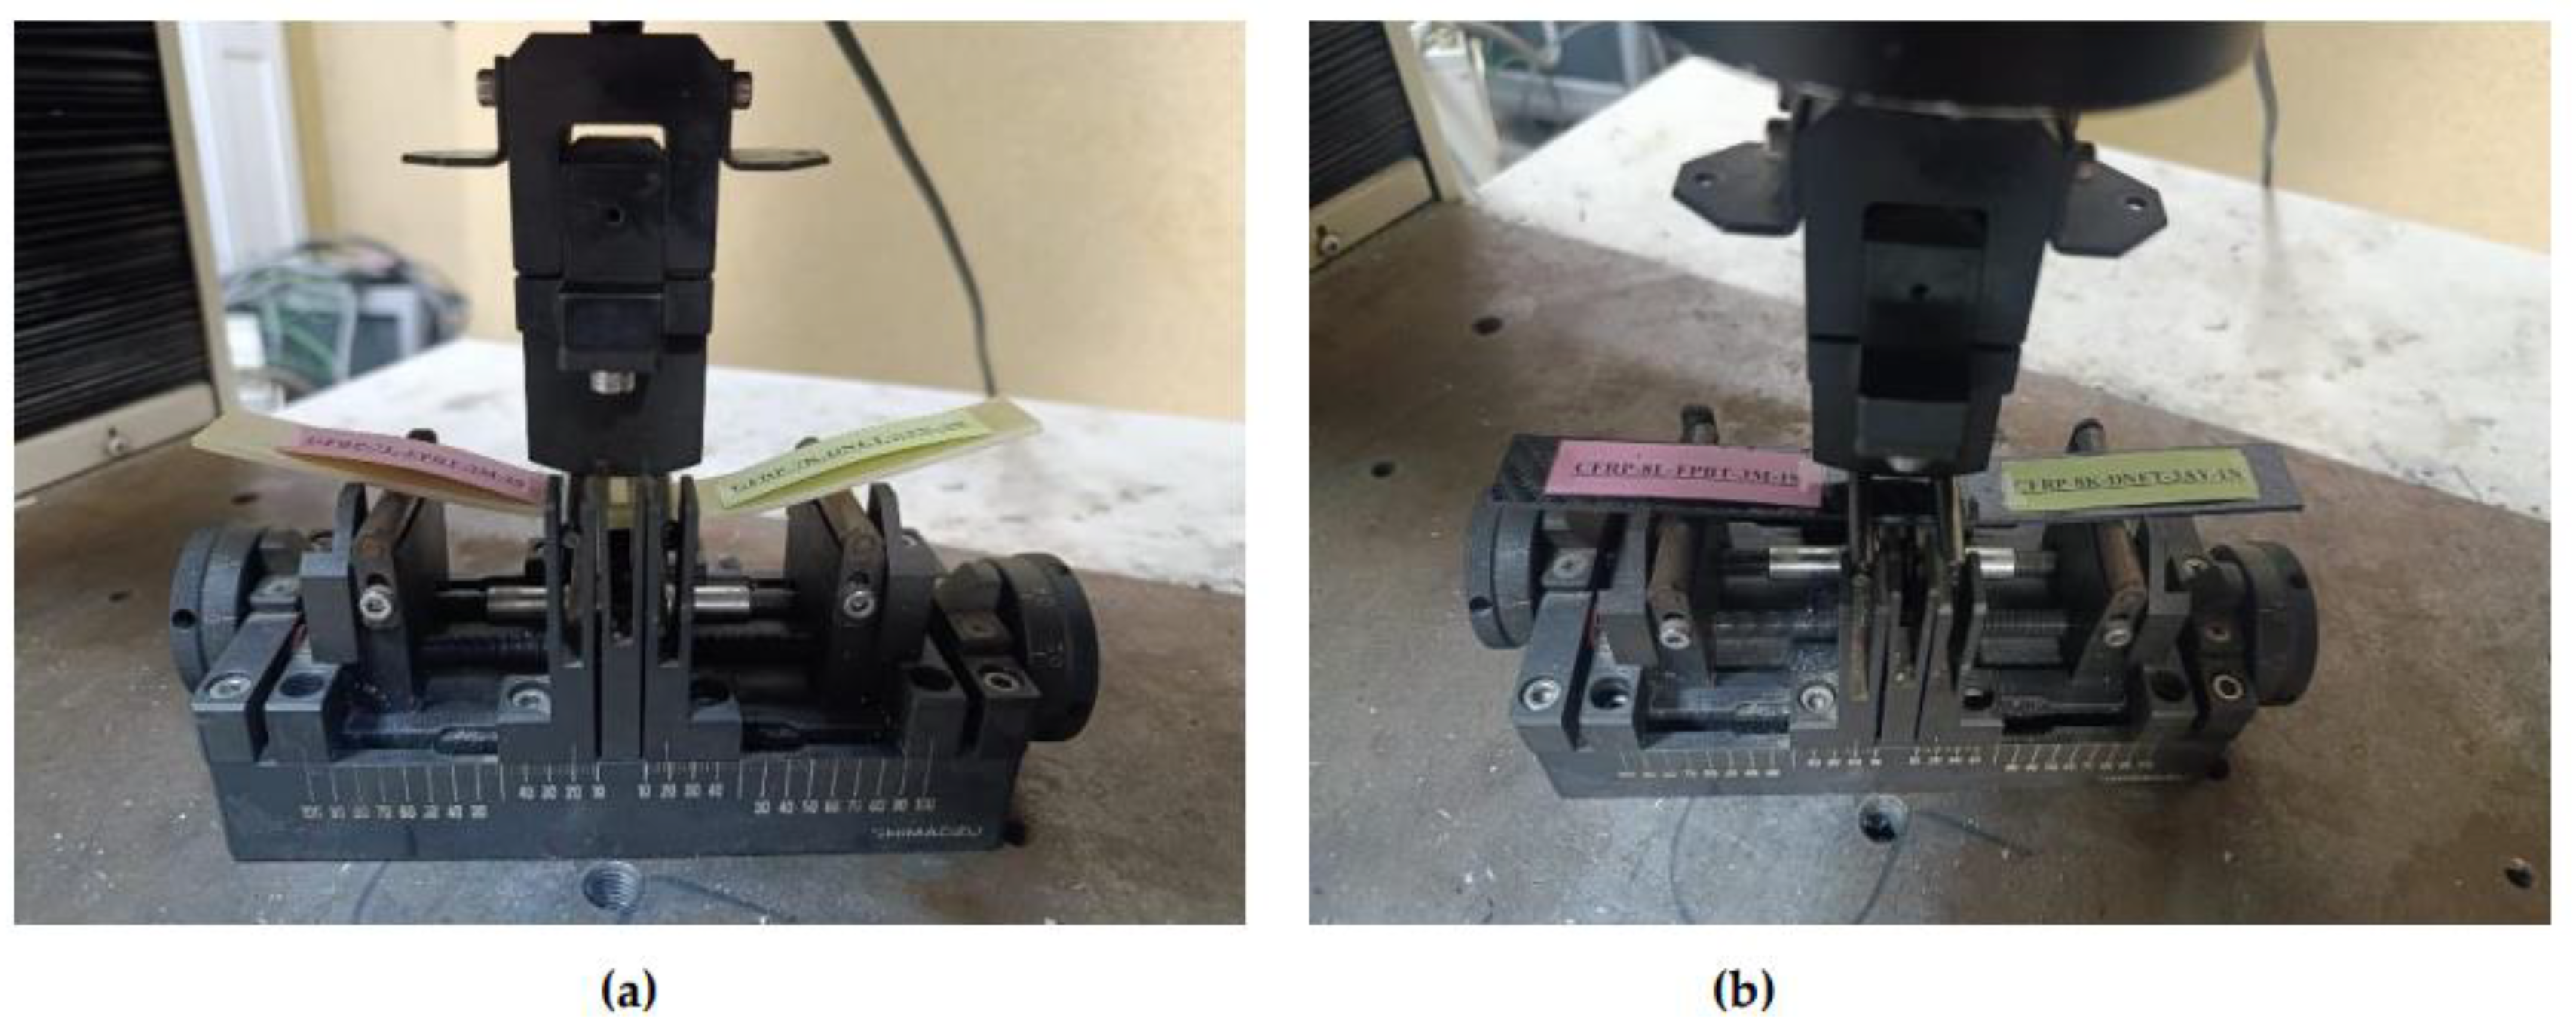
Figure 21.
GFRP-7L-FPBT-3M Samples Were Kept in Sea Water for 3 Months (a) and and surface roughness profile along the damage zone (b).
Figure 21.
GFRP-7L-FPBT-3M Samples Were Kept in Sea Water for 3 Months (a) and and surface roughness profile along the damage zone (b).
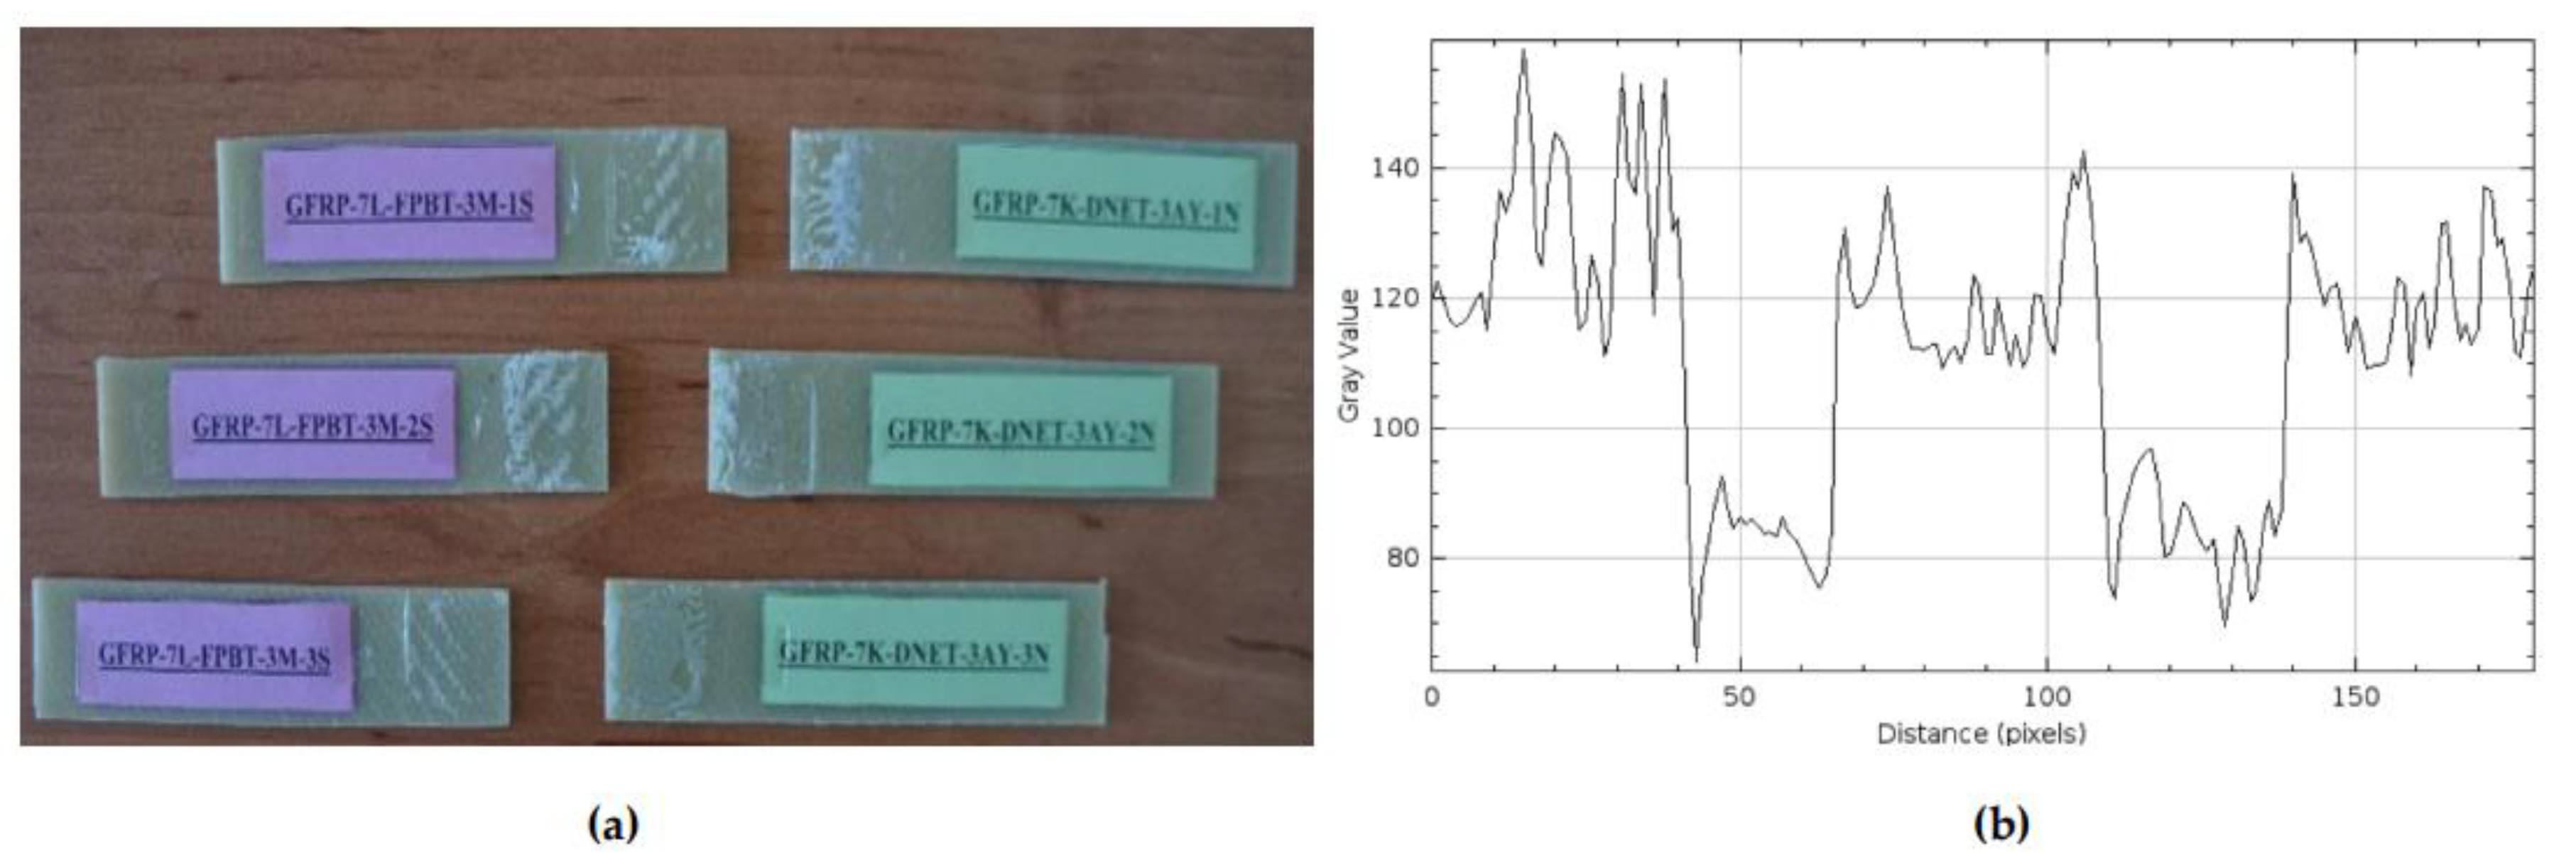
Figure 22.
CFRP-8L-FPBT-3M Samples Were Kept in Sea Water for 3 Months (a) and and surface roughness profile along the damage zone (b).
Figure 22.
CFRP-8L-FPBT-3M Samples Were Kept in Sea Water for 3 Months (a) and and surface roughness profile along the damage zone (b).
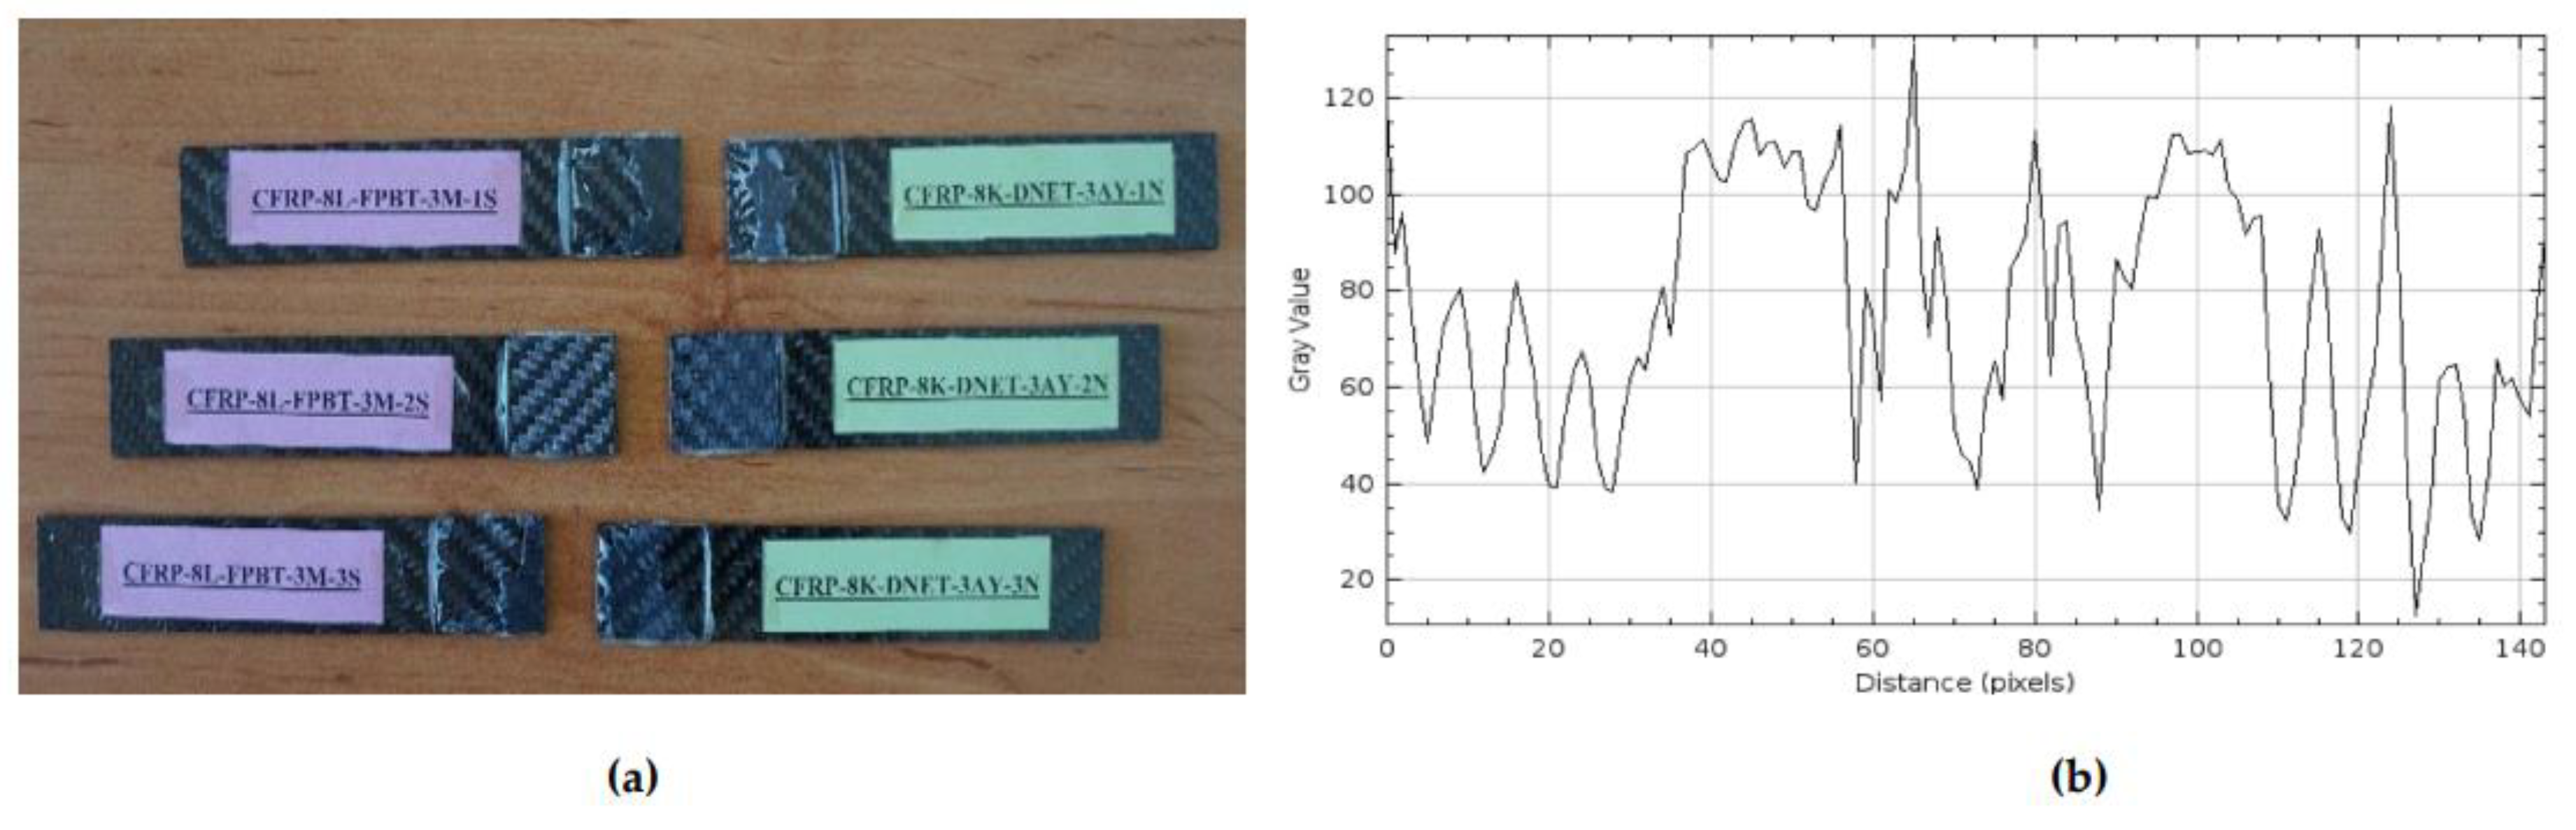
Figure 23.
Comparison of Stress–Strain Graphs of GFRP Specimens Stored in Dry and Seawater Environments (1, 2 and 3 months).
Figure 23.
Comparison of Stress–Strain Graphs of GFRP Specimens Stored in Dry and Seawater Environments (1, 2 and 3 months).
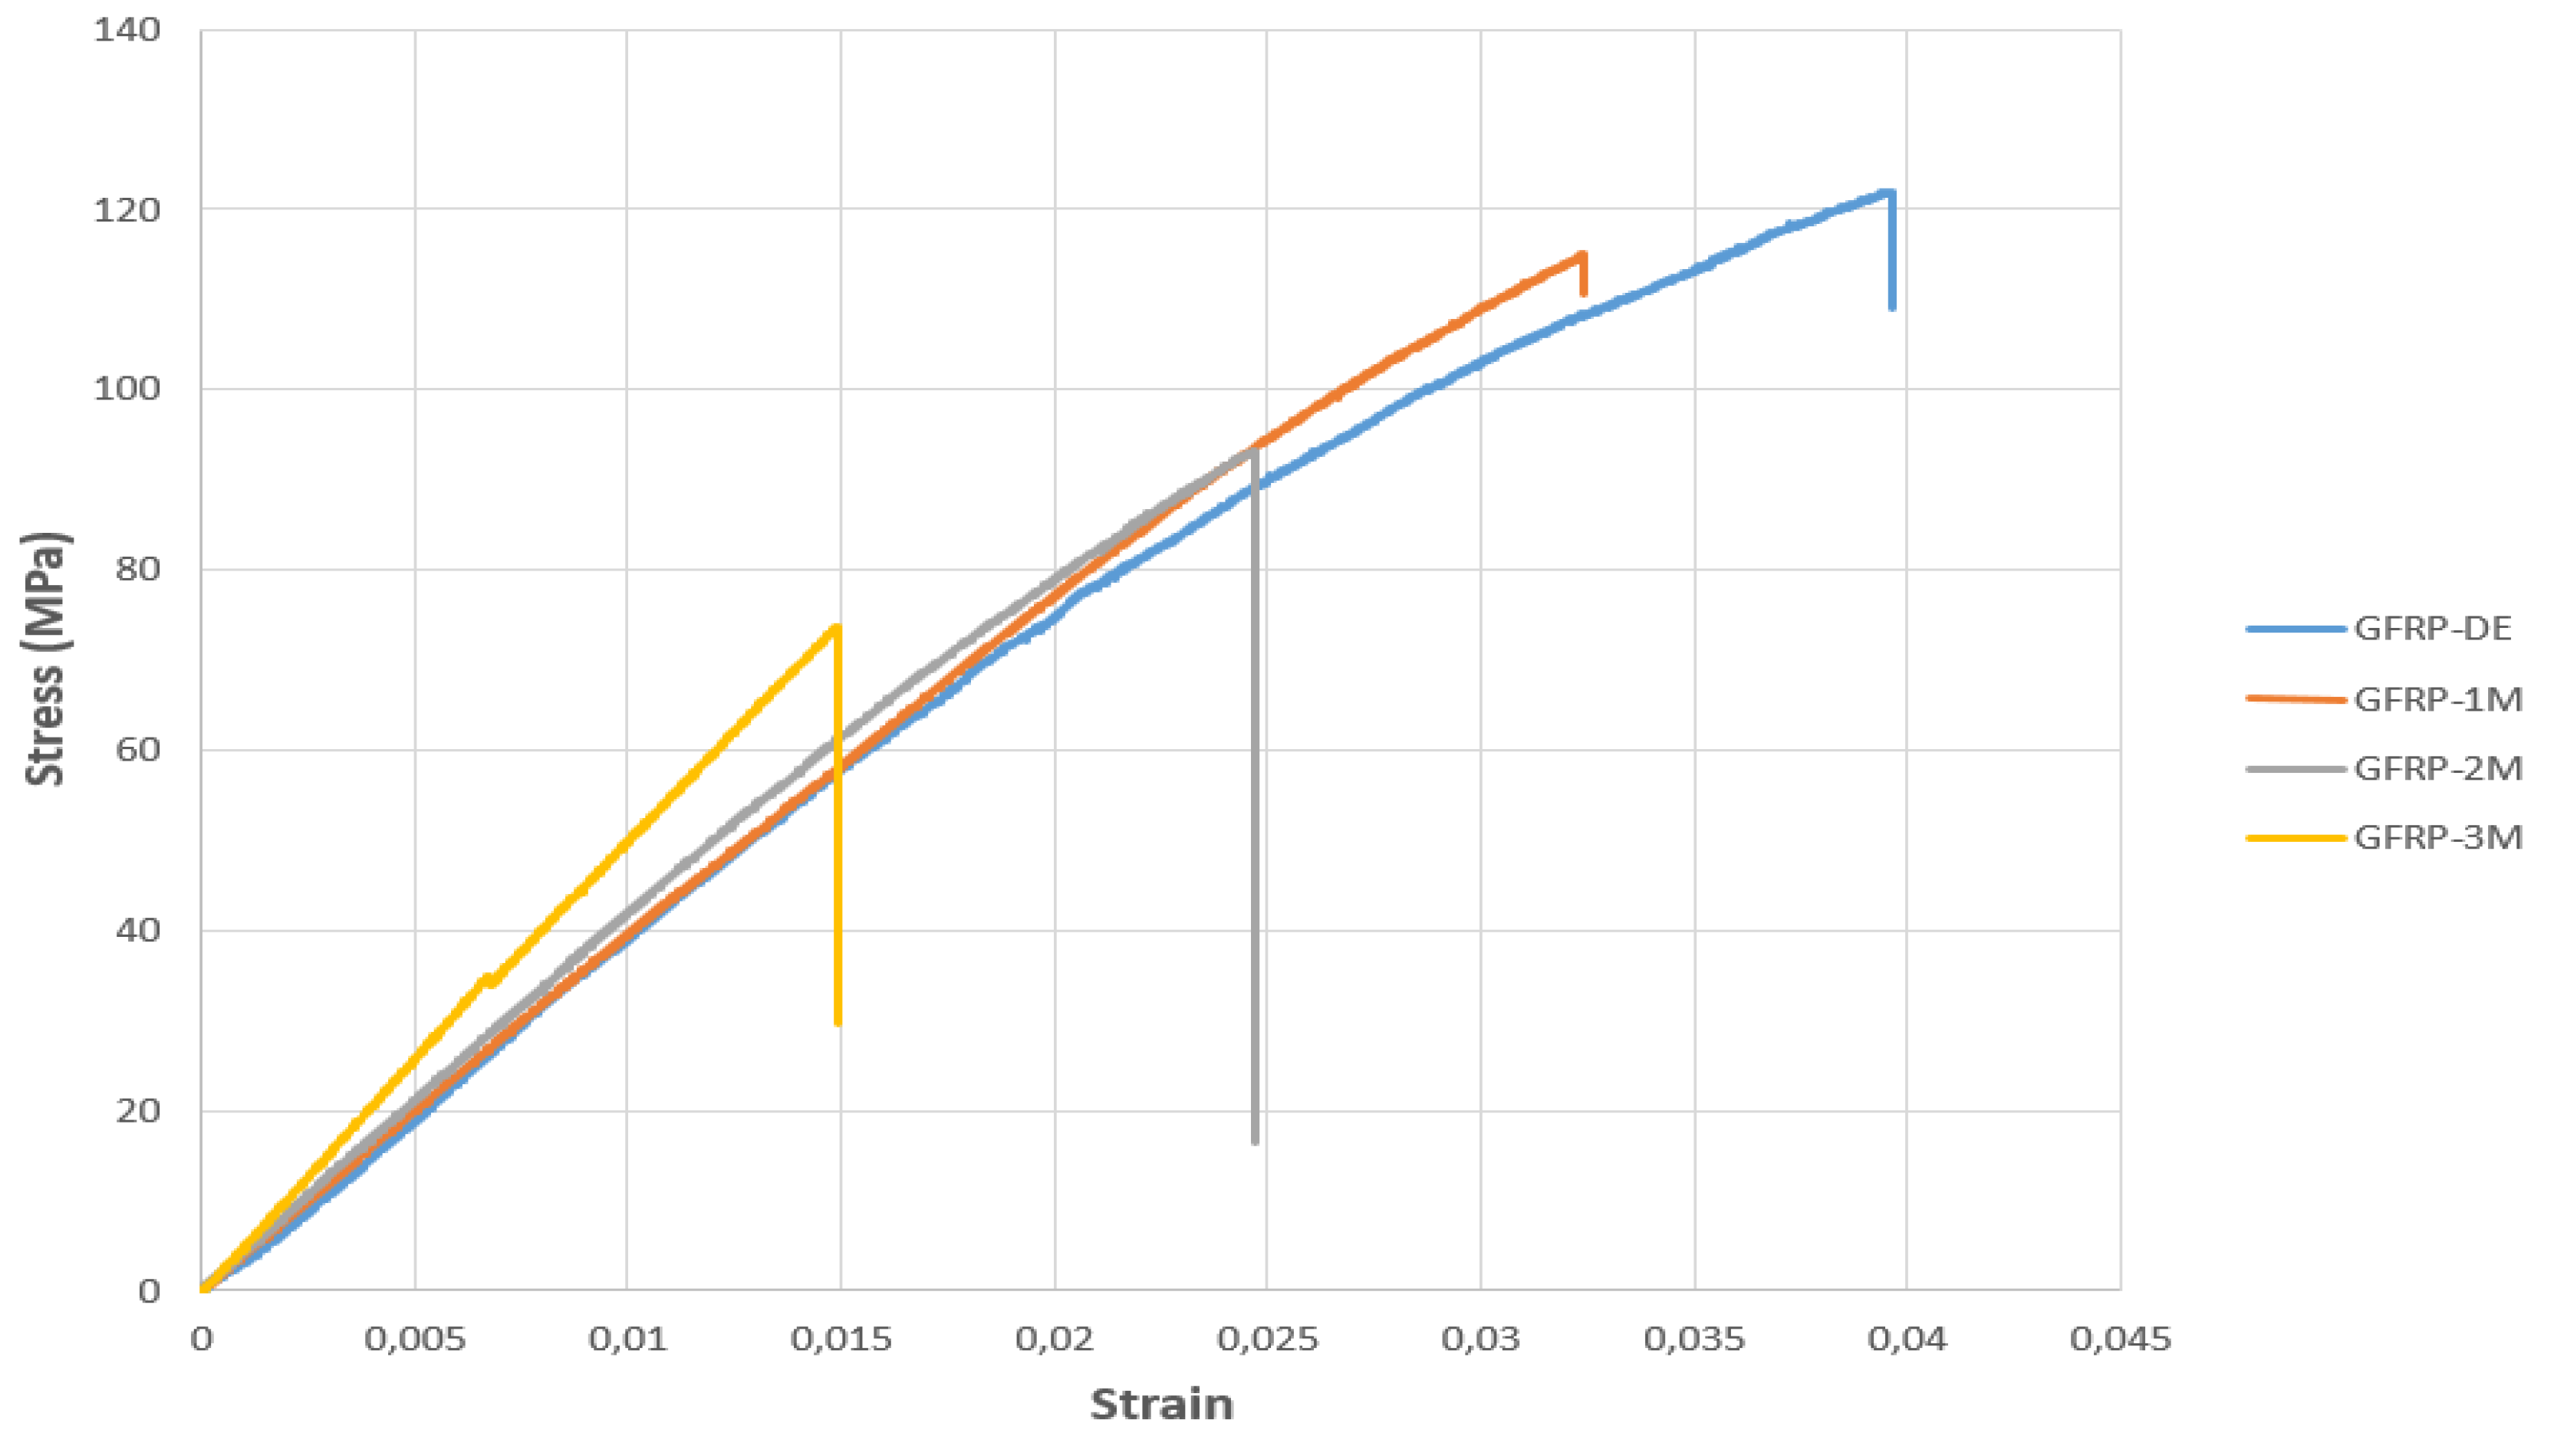
Figure 24.
Comparison of Stress–Strain Graphs of CFRP Specimens Stored in Dry and Seawater Environments (1, 2 and 3 Months).
Figure 24.
Comparison of Stress–Strain Graphs of CFRP Specimens Stored in Dry and Seawater Environments (1, 2 and 3 Months).
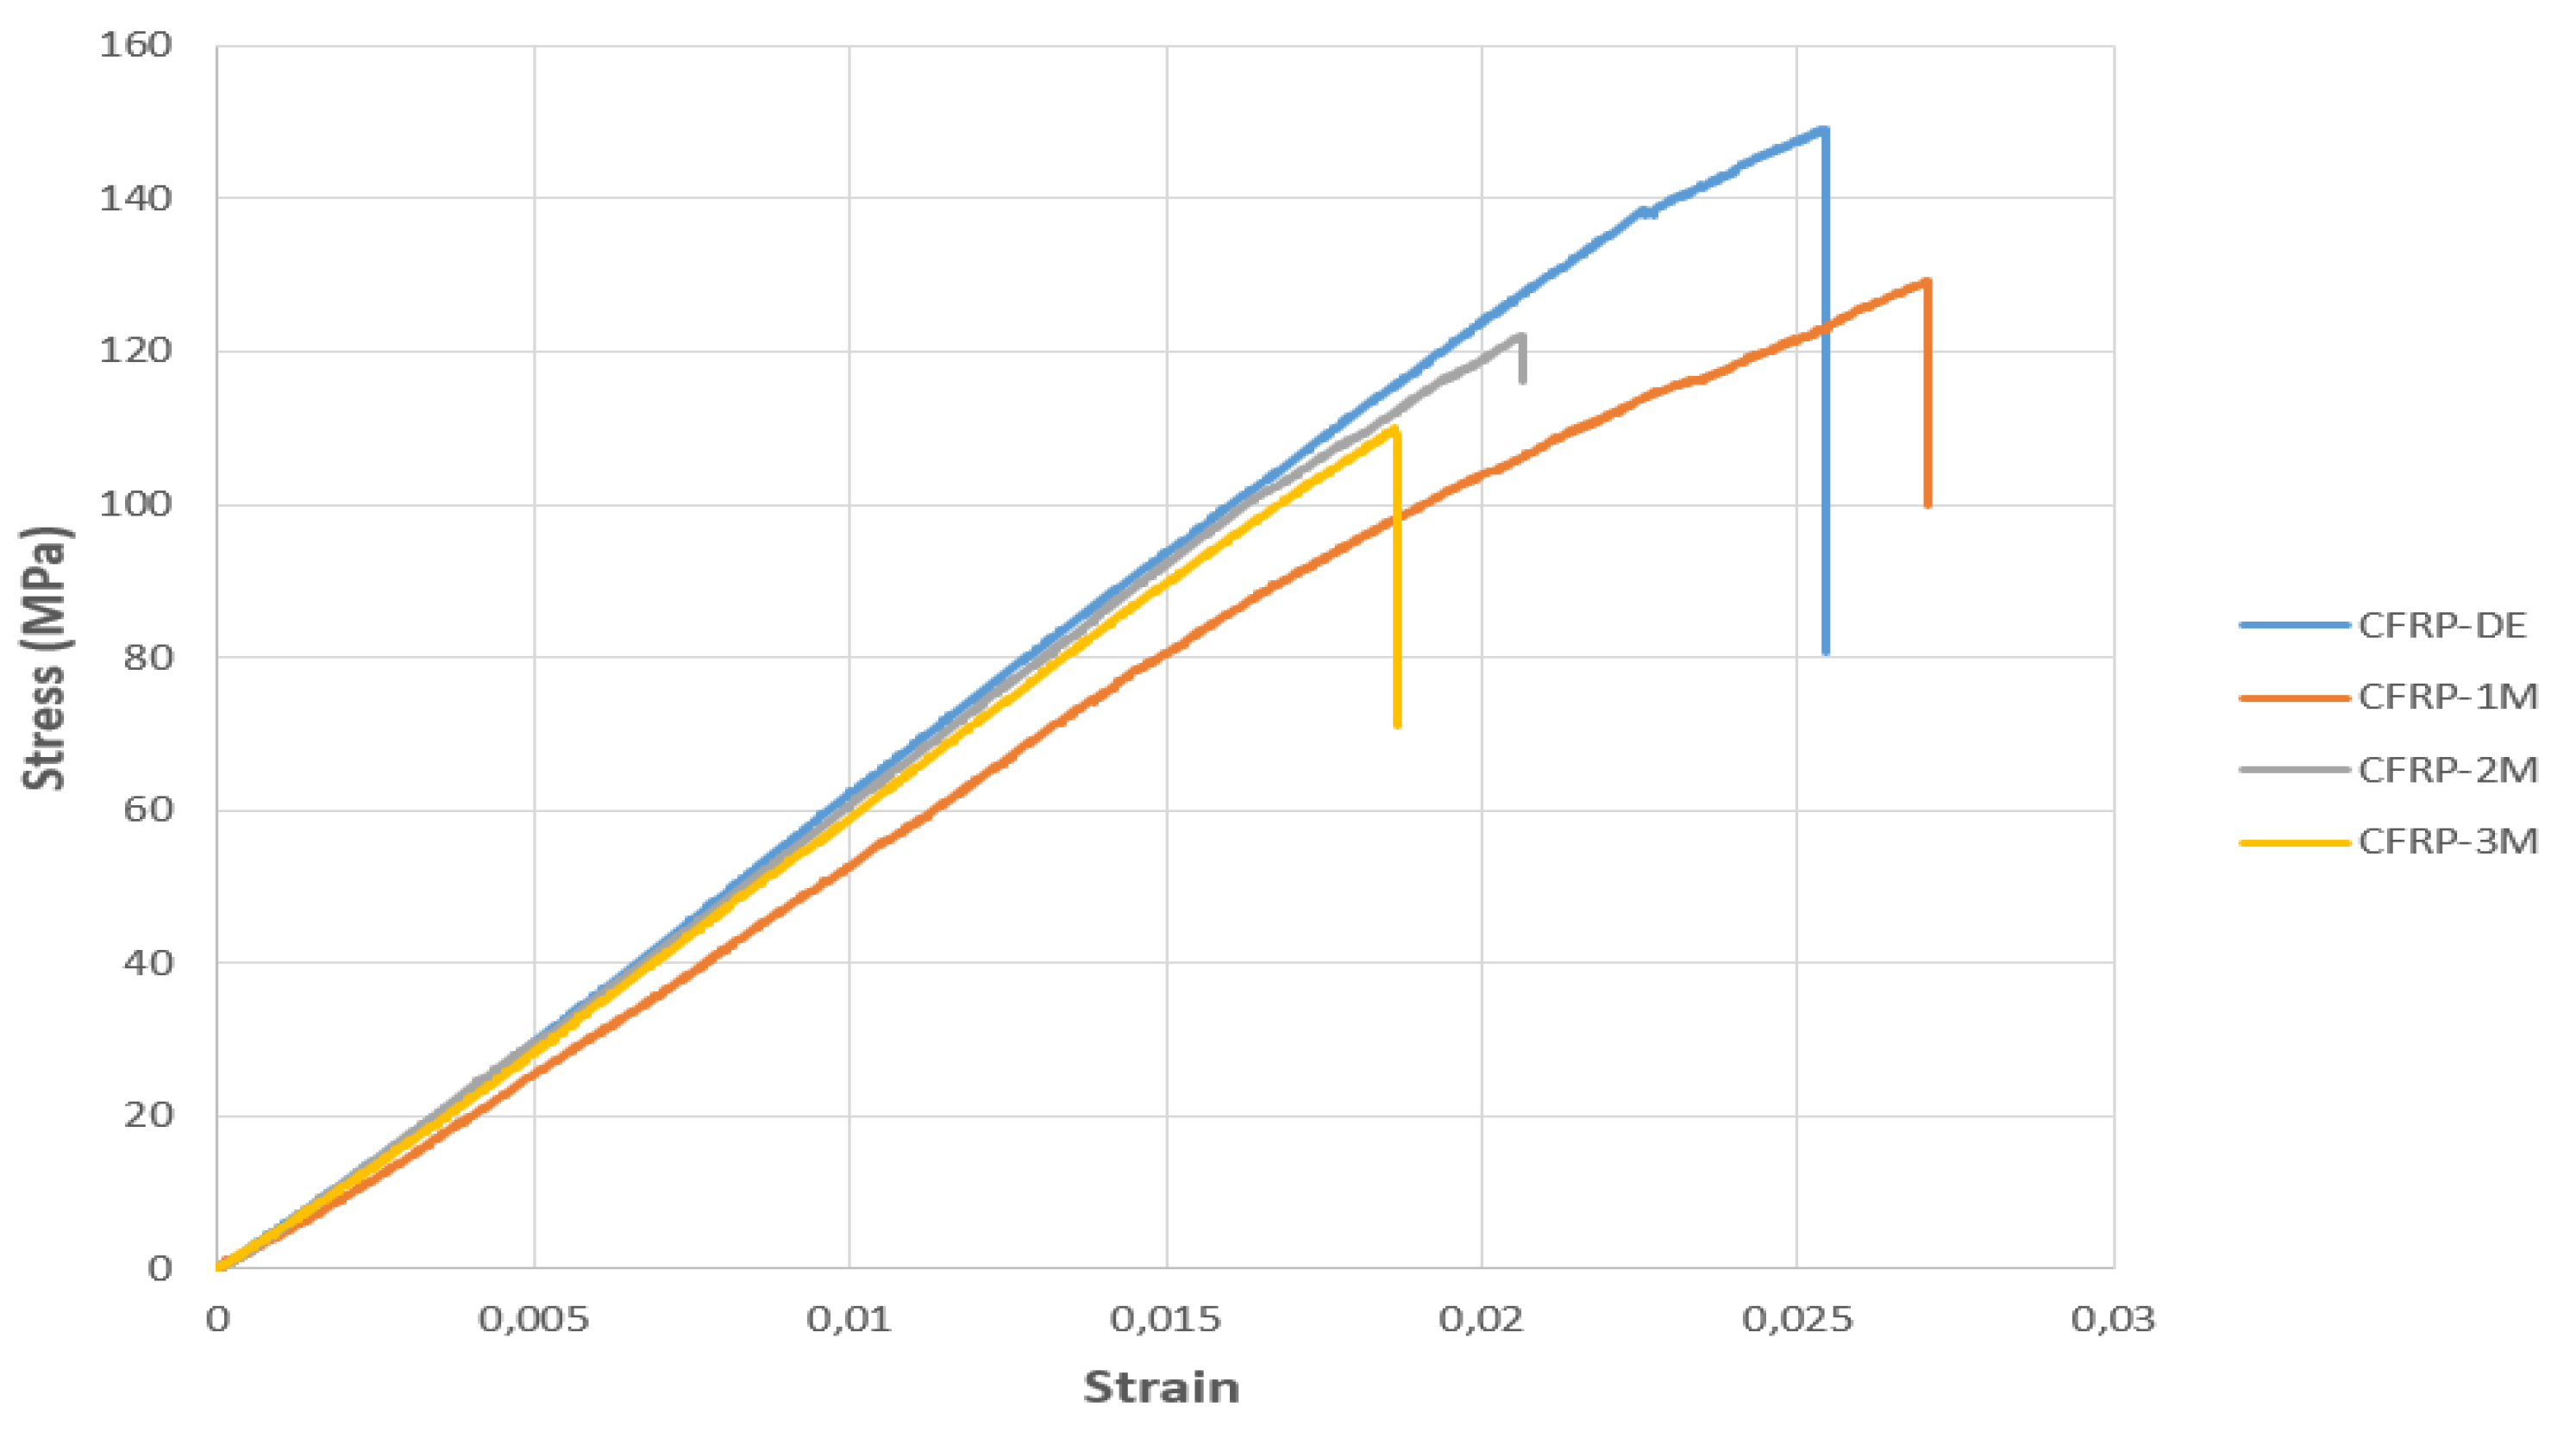
Figure 25.
(a) Mag=1.00KX and (b) Mag=150X Images of GFRP Samples not kept in sea water.
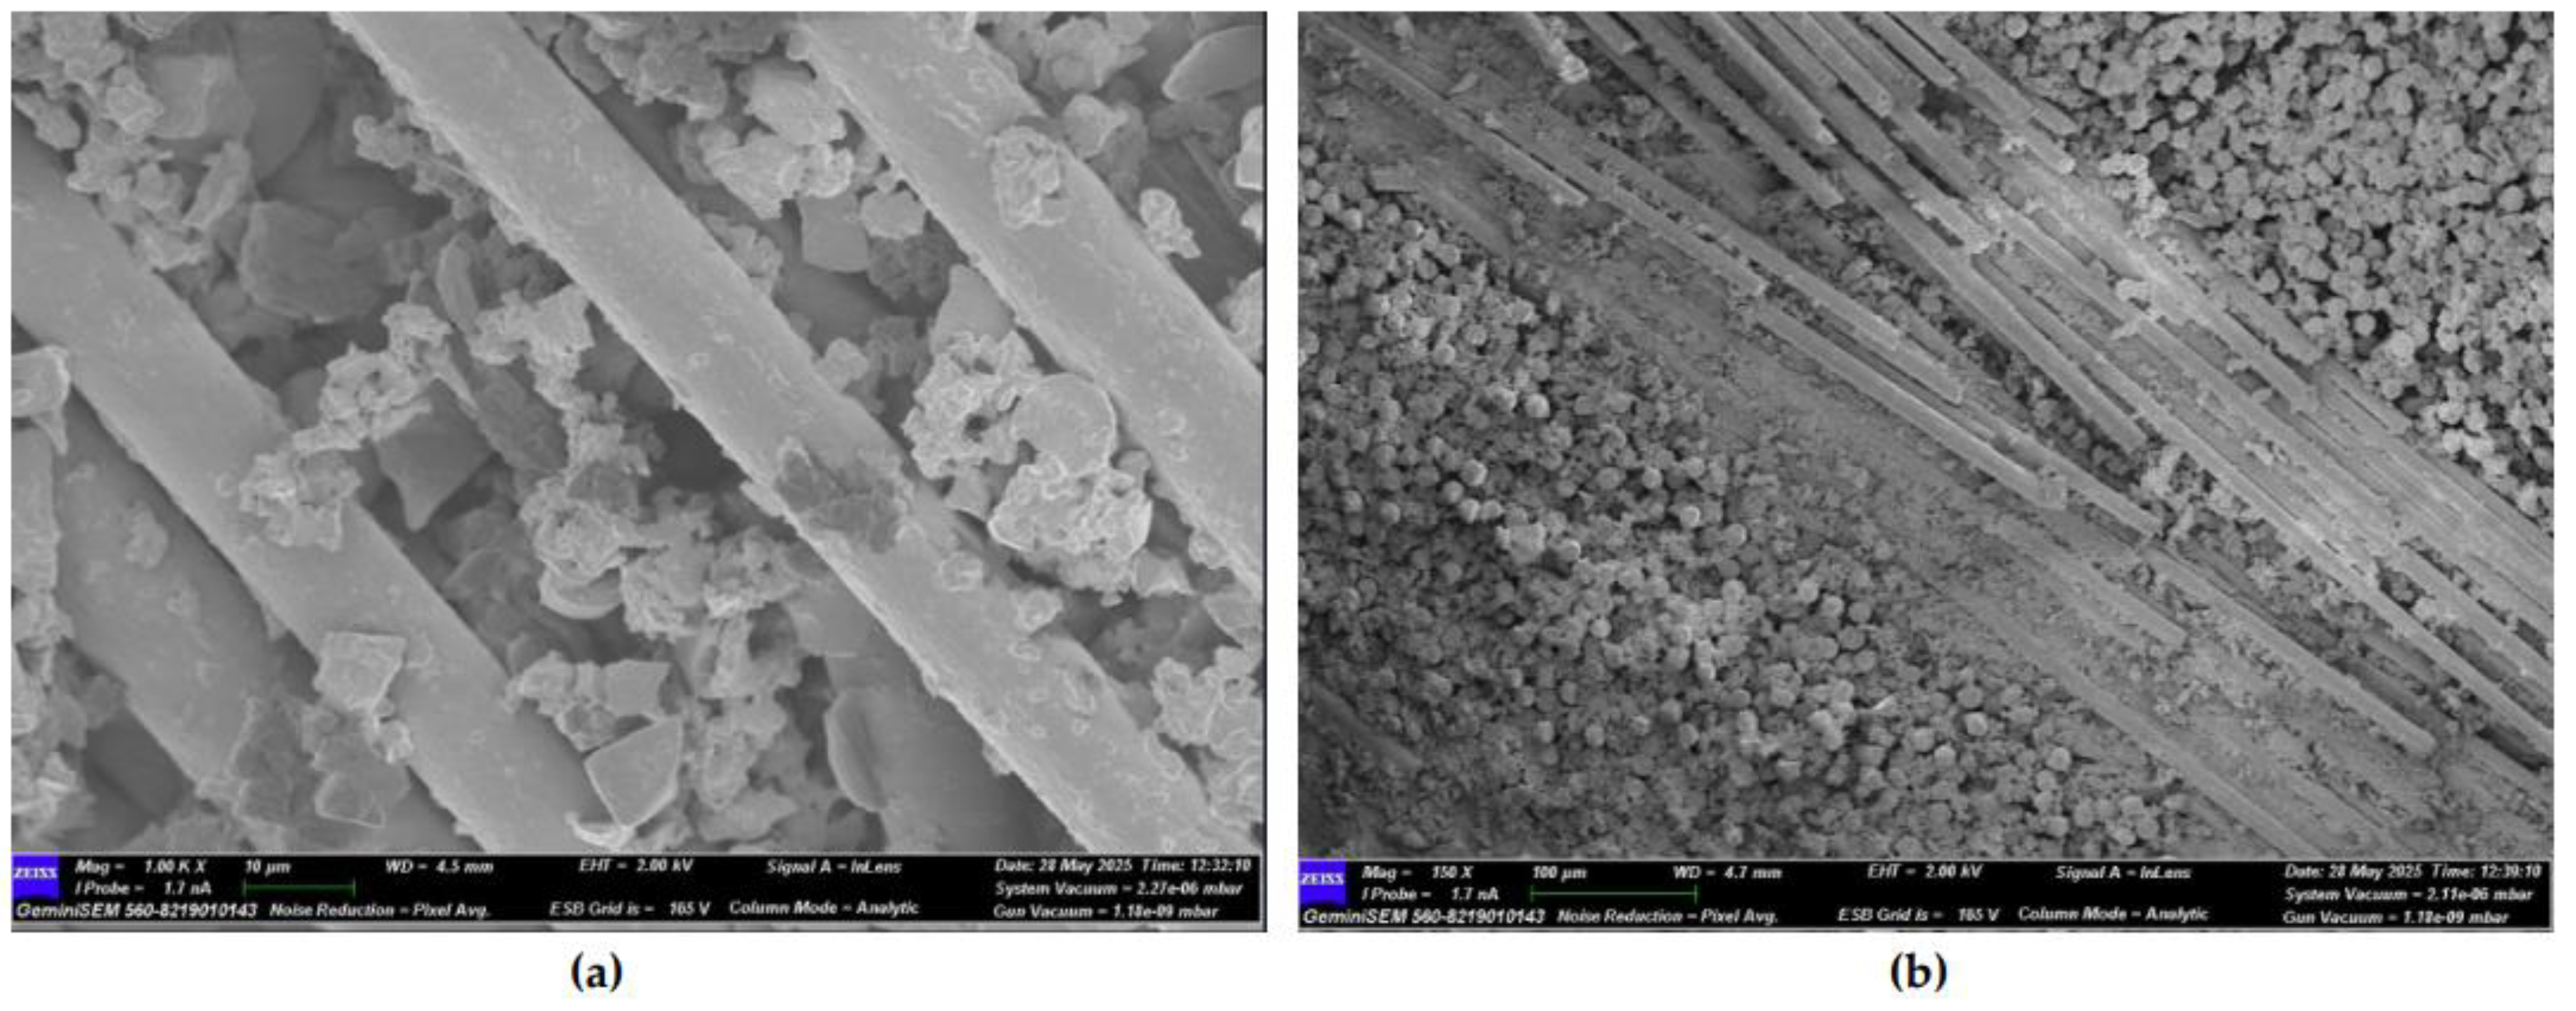
Figure 26.
(a) Mag=1.00KX and (b)Mag=500X Images of GFRP Samples 1st Month.
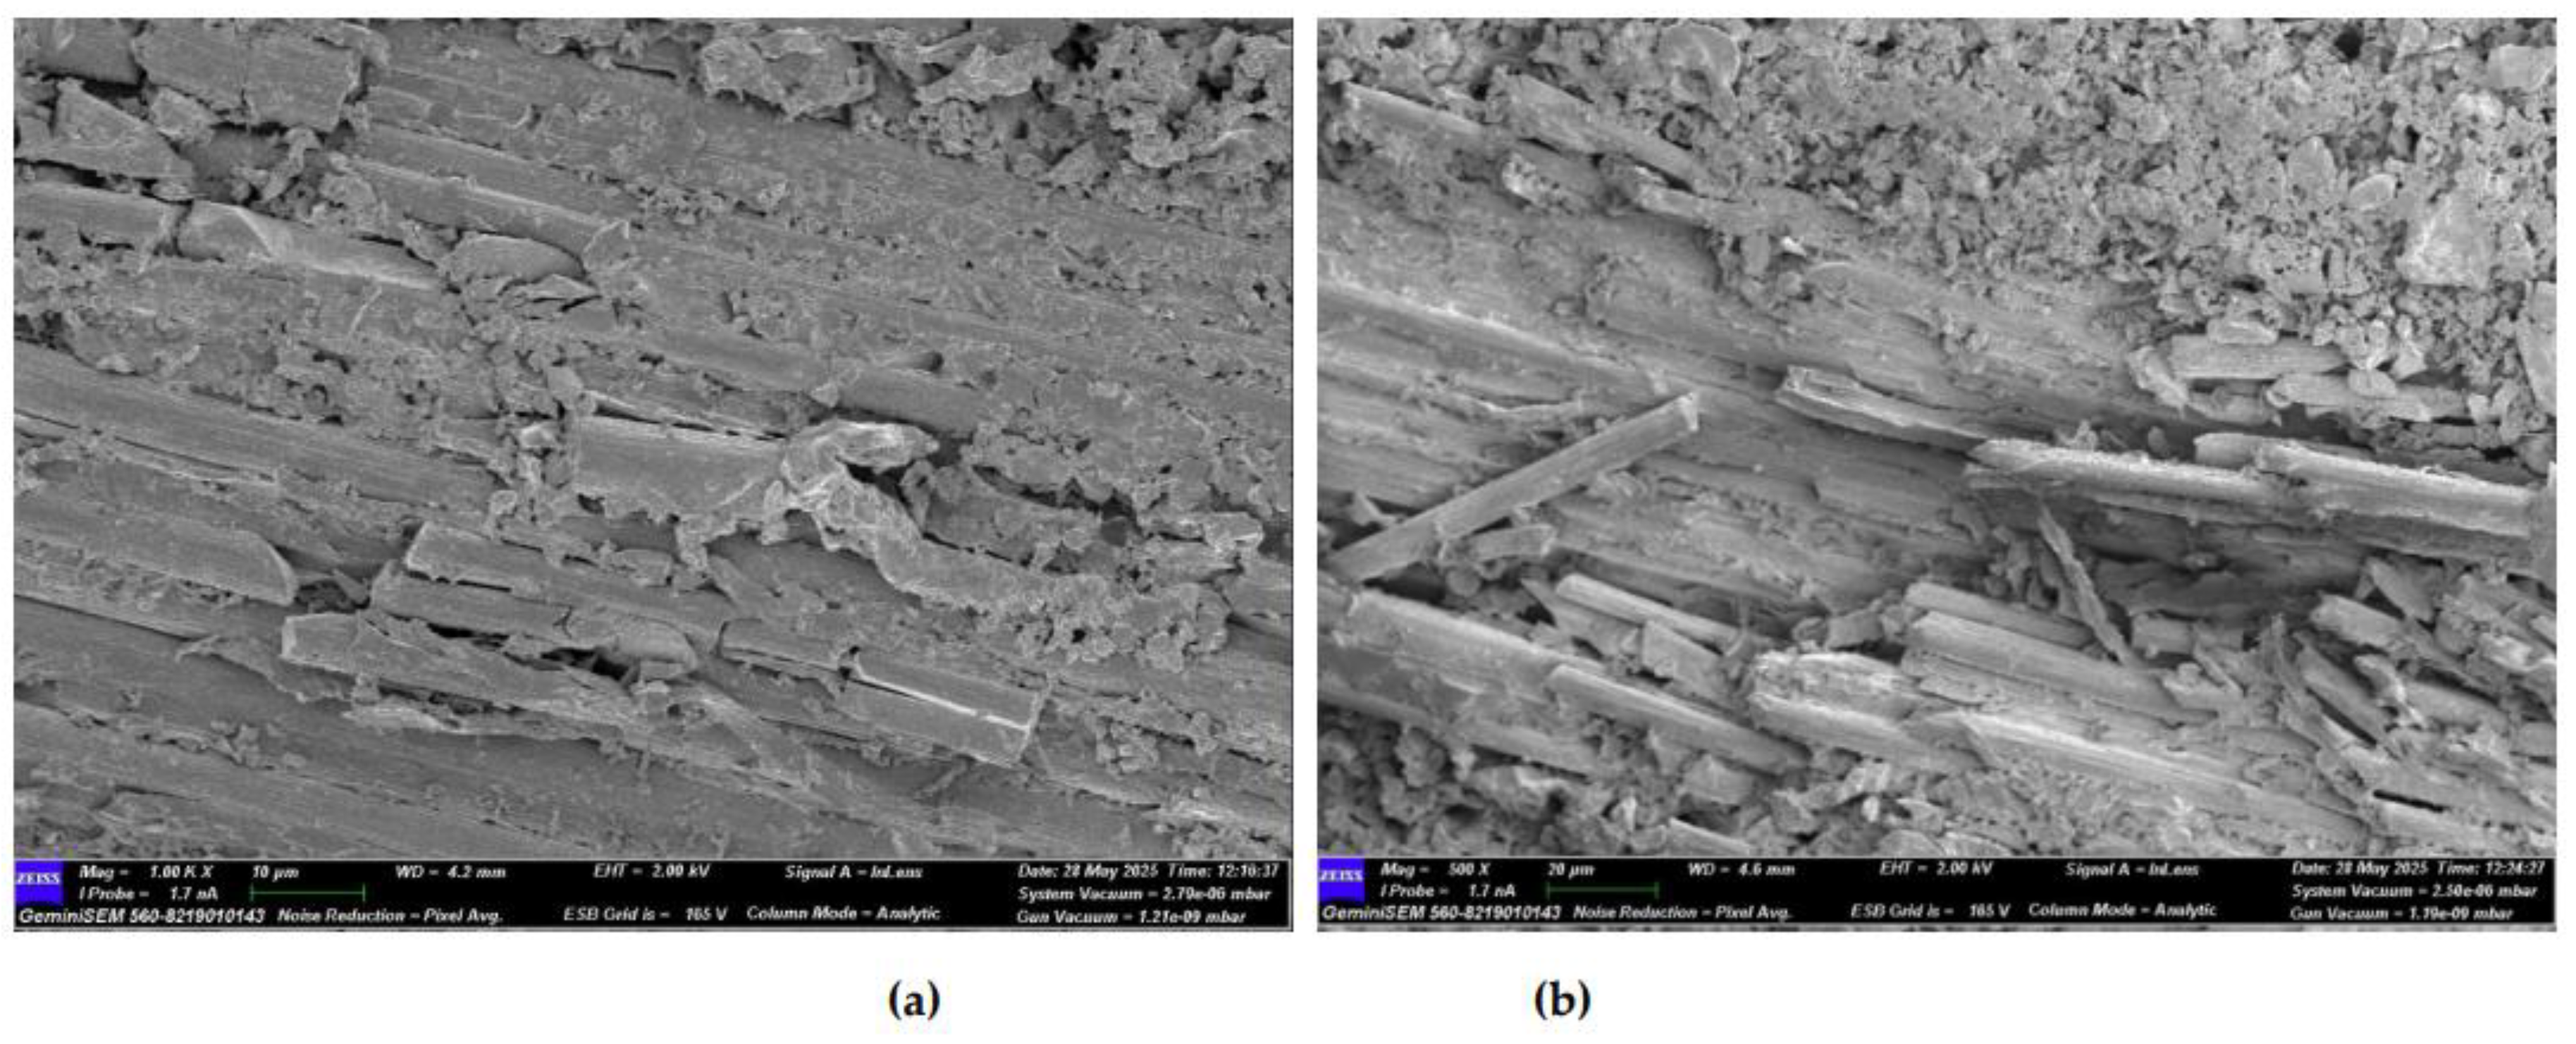
Figure 27.
(a) Mag=1.00KX and (b)Mag=150X Images of GFRP Samples 2nd Month.
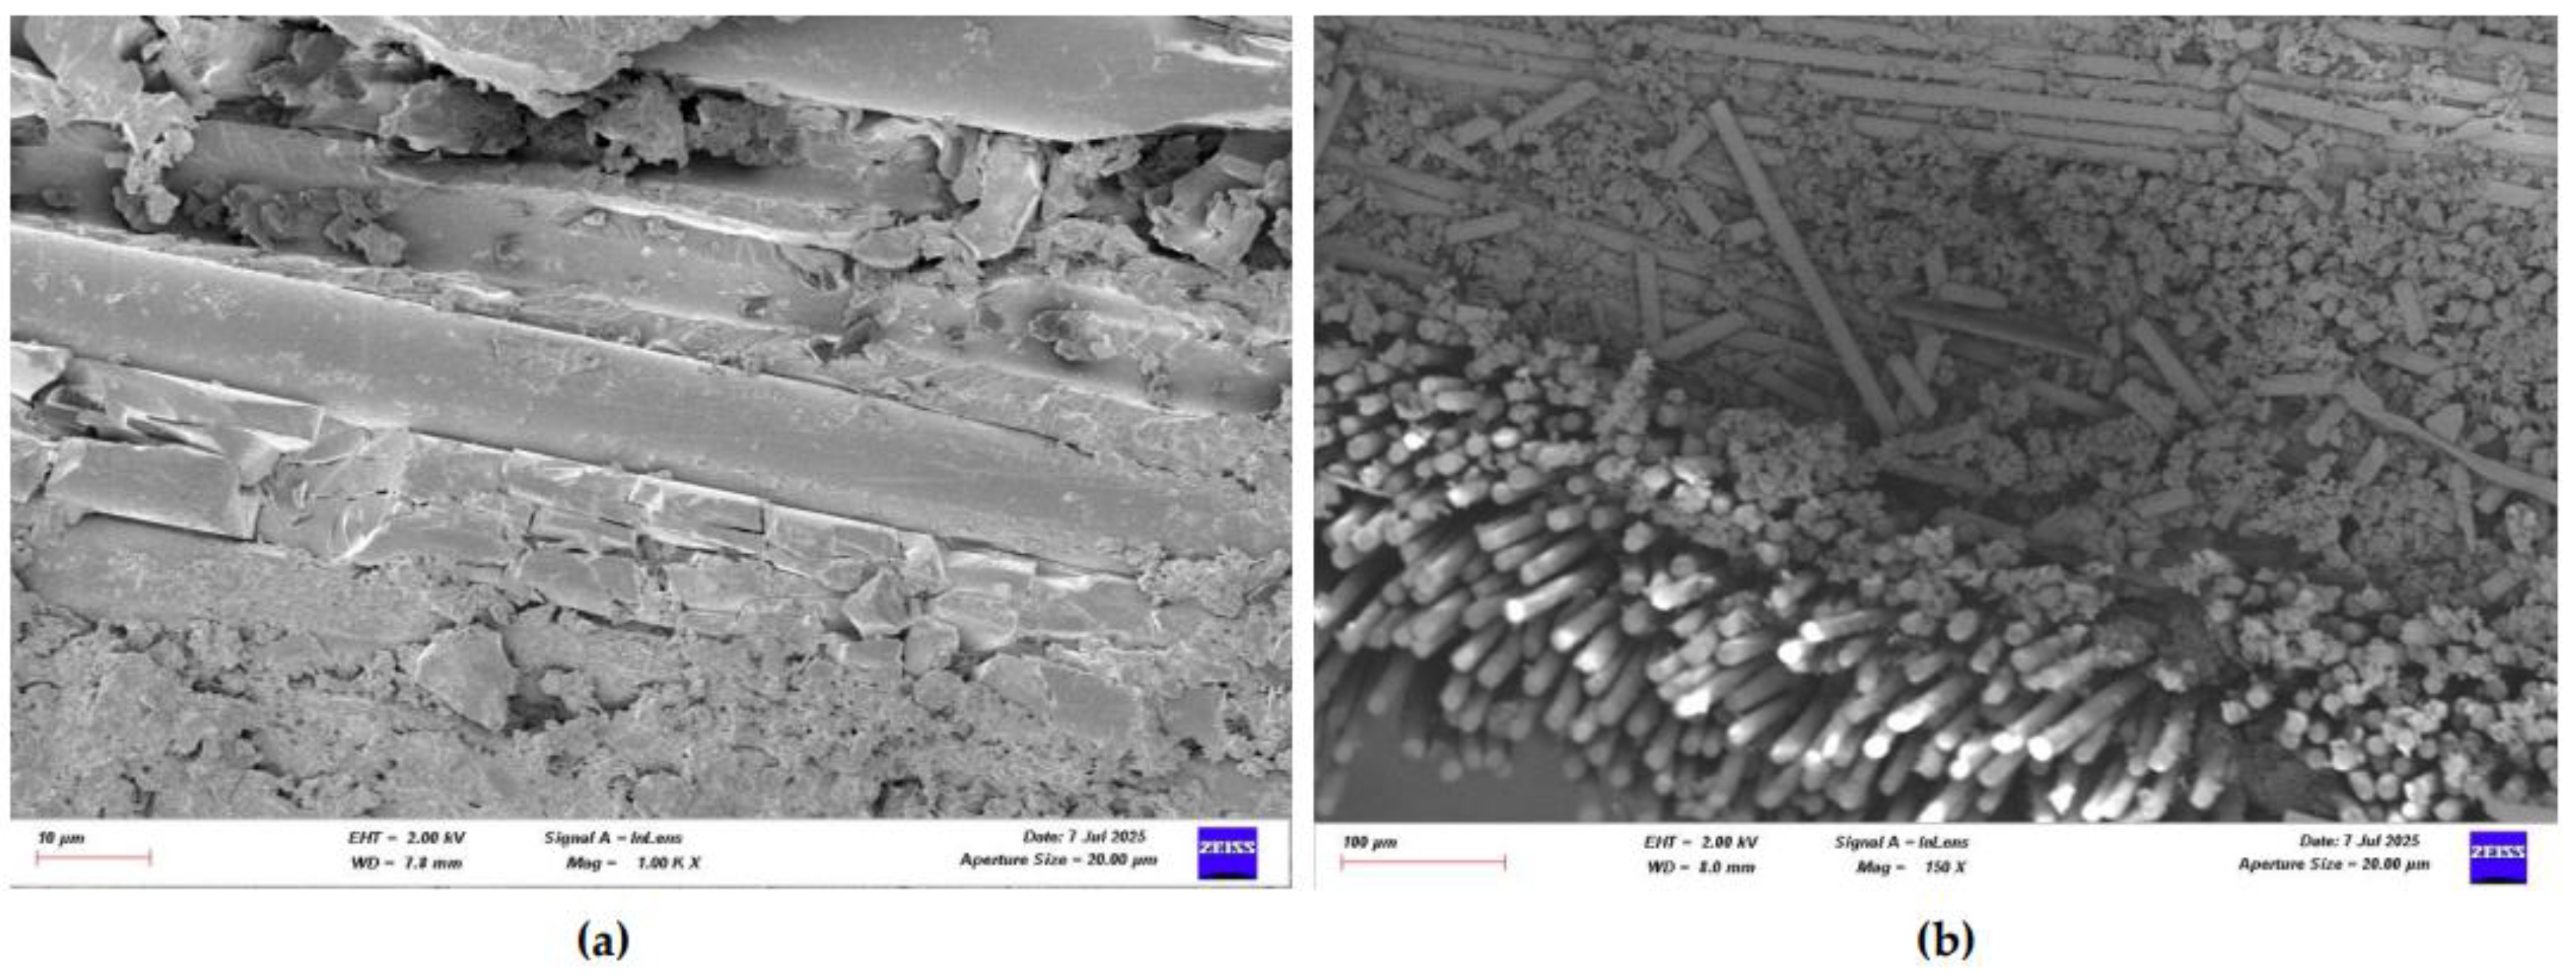
Figure 28.
(a) Mag=1.00KX and (b)Mag=600X Images of GFRP Samples 3rd Month.
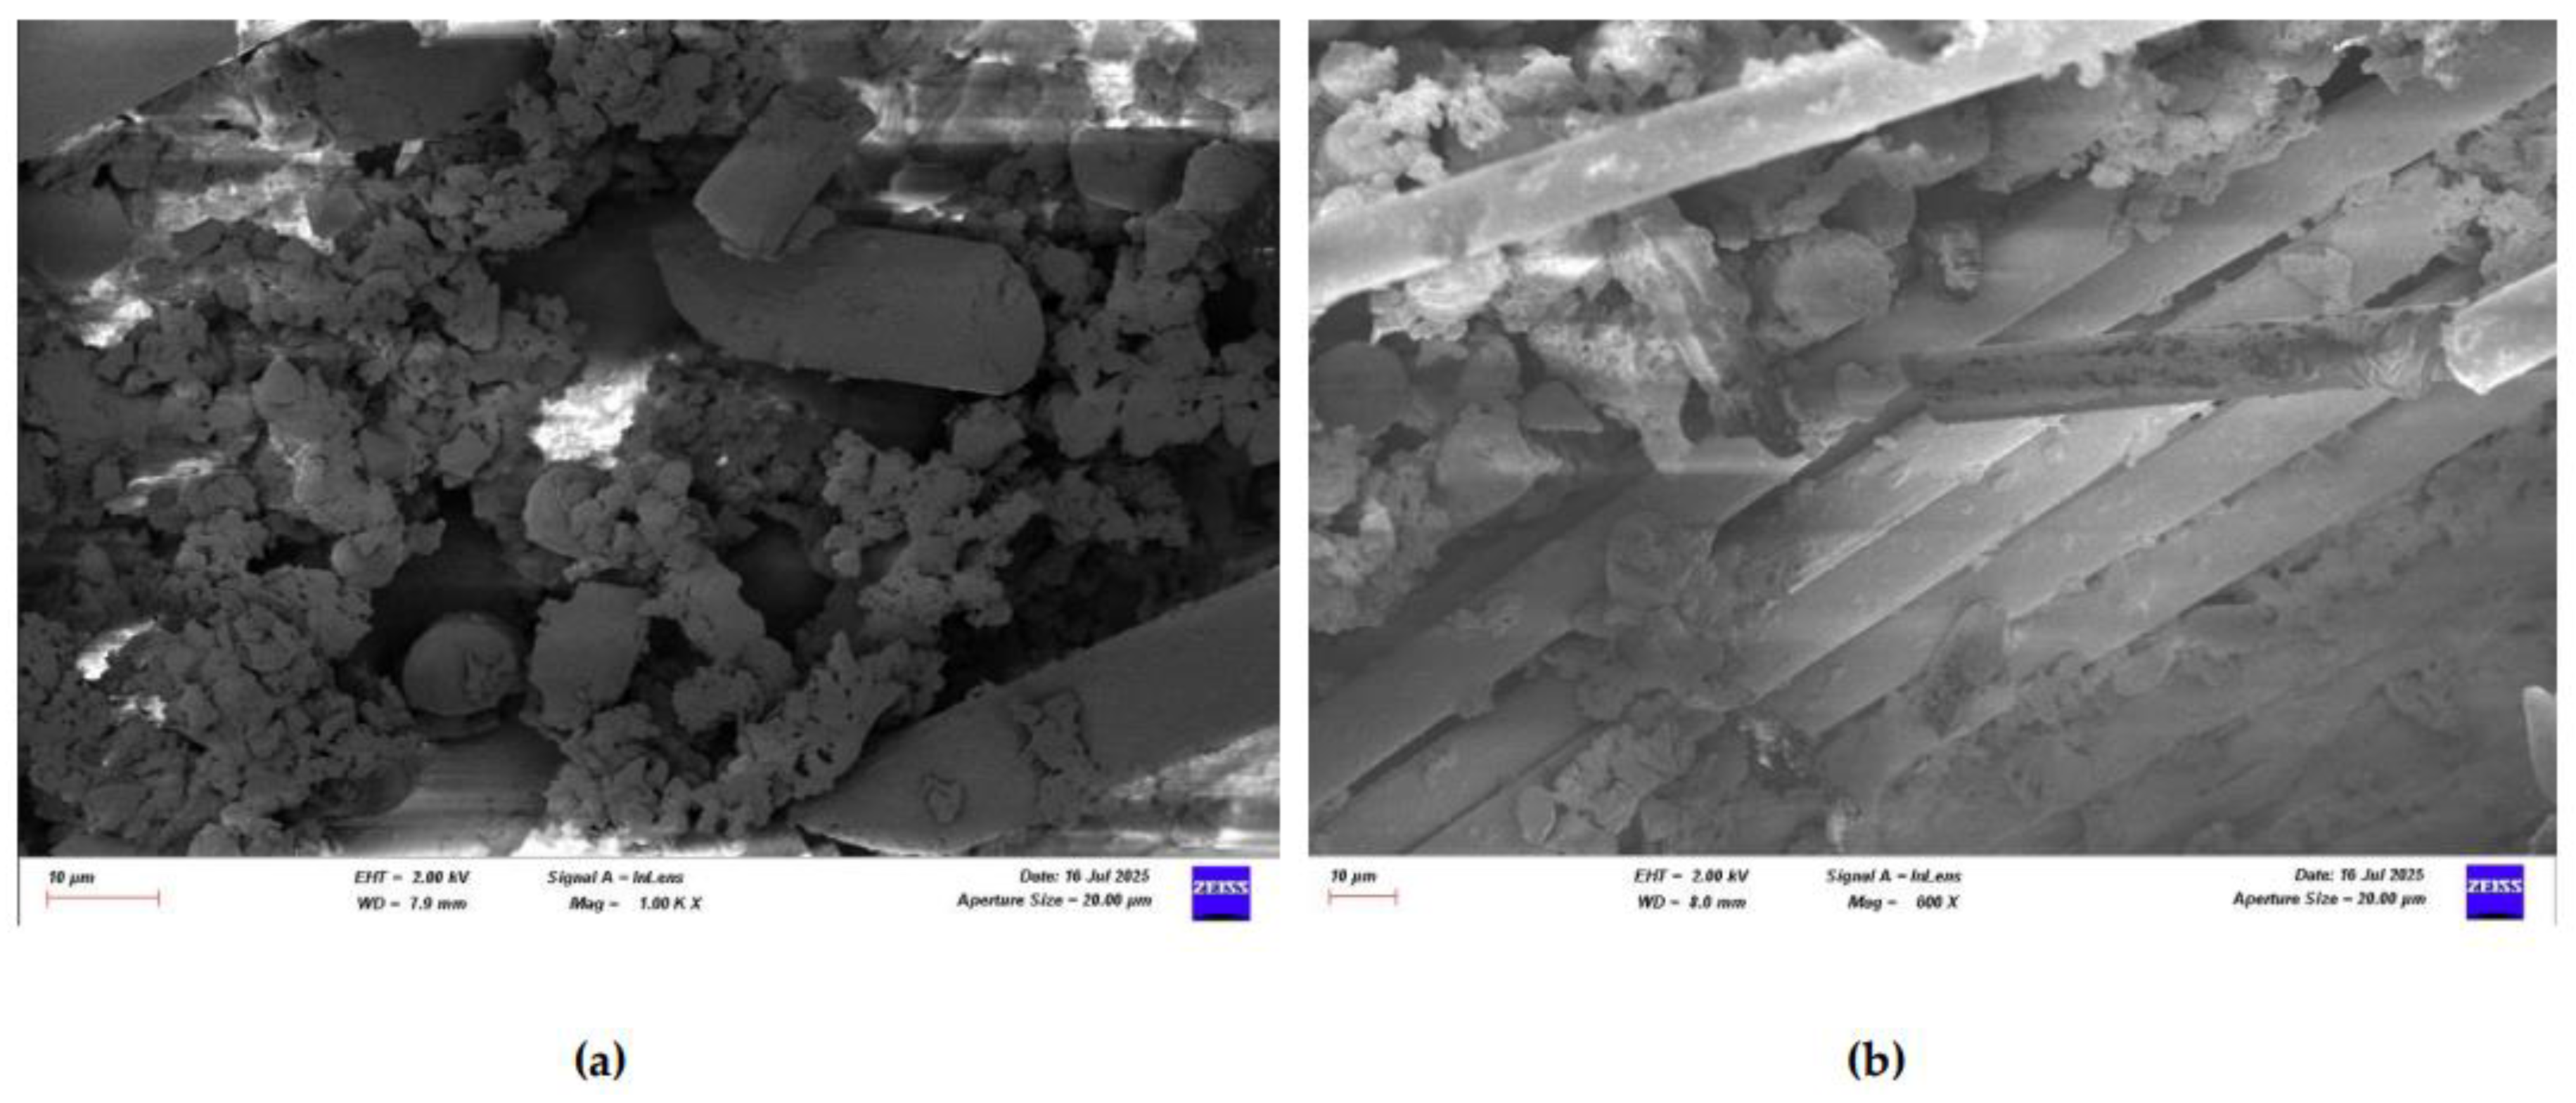
Figure 29.
(a) Mag=1.00KX and (b) Mag=500X Images of CFRP Samples not kept in sea water.
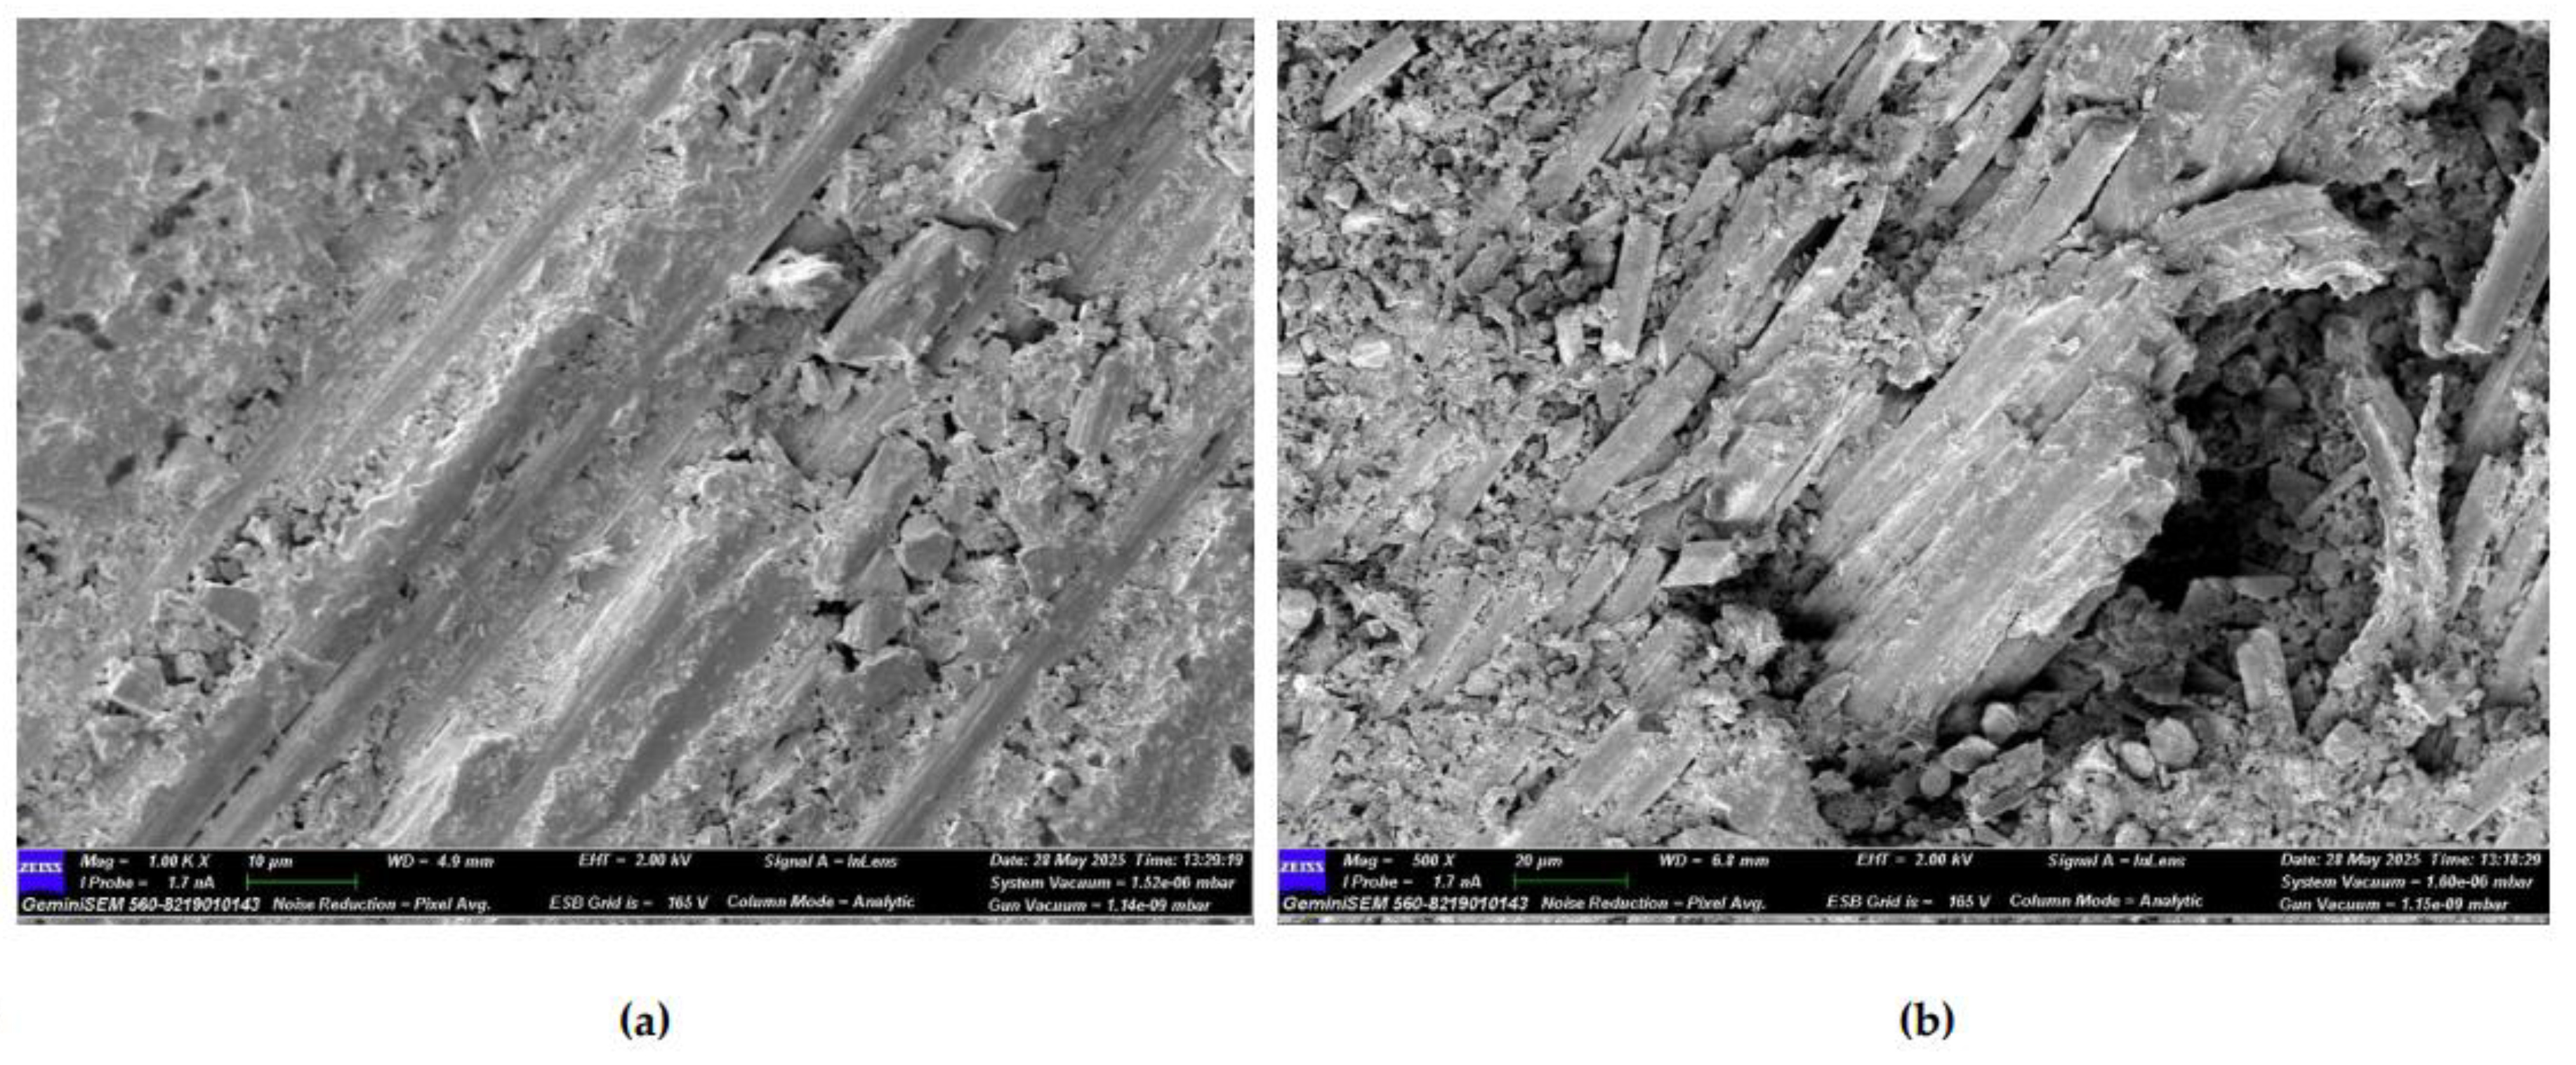
Figure 30.
(a) Mag=1.00KX and (b) Mag=250X Images of CFRP Samples 1st Month.
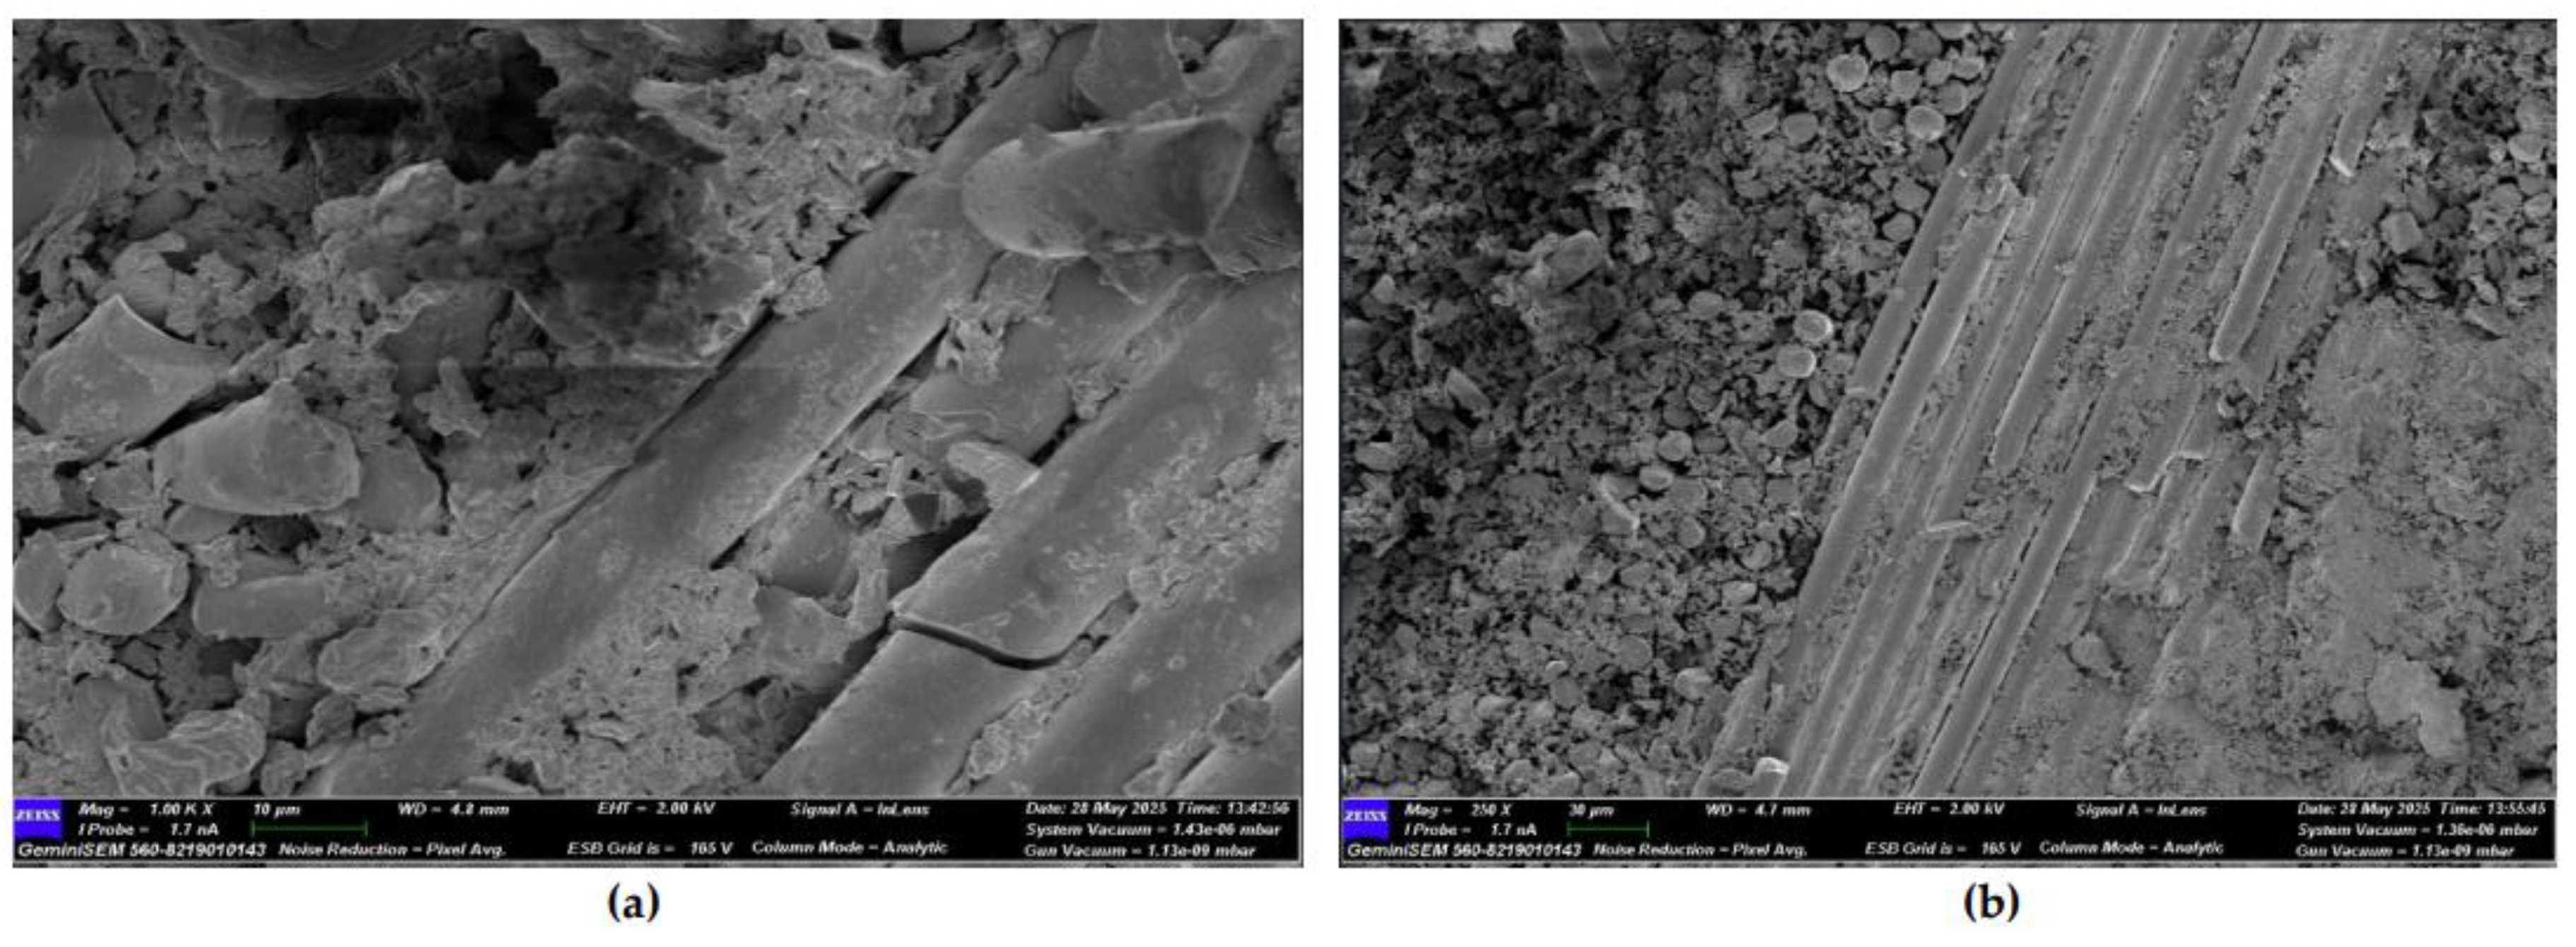
Figure 31.
(a) Mag=1.00KX and (b) Mag=500X Images of CFRP Samples 2nd Month.
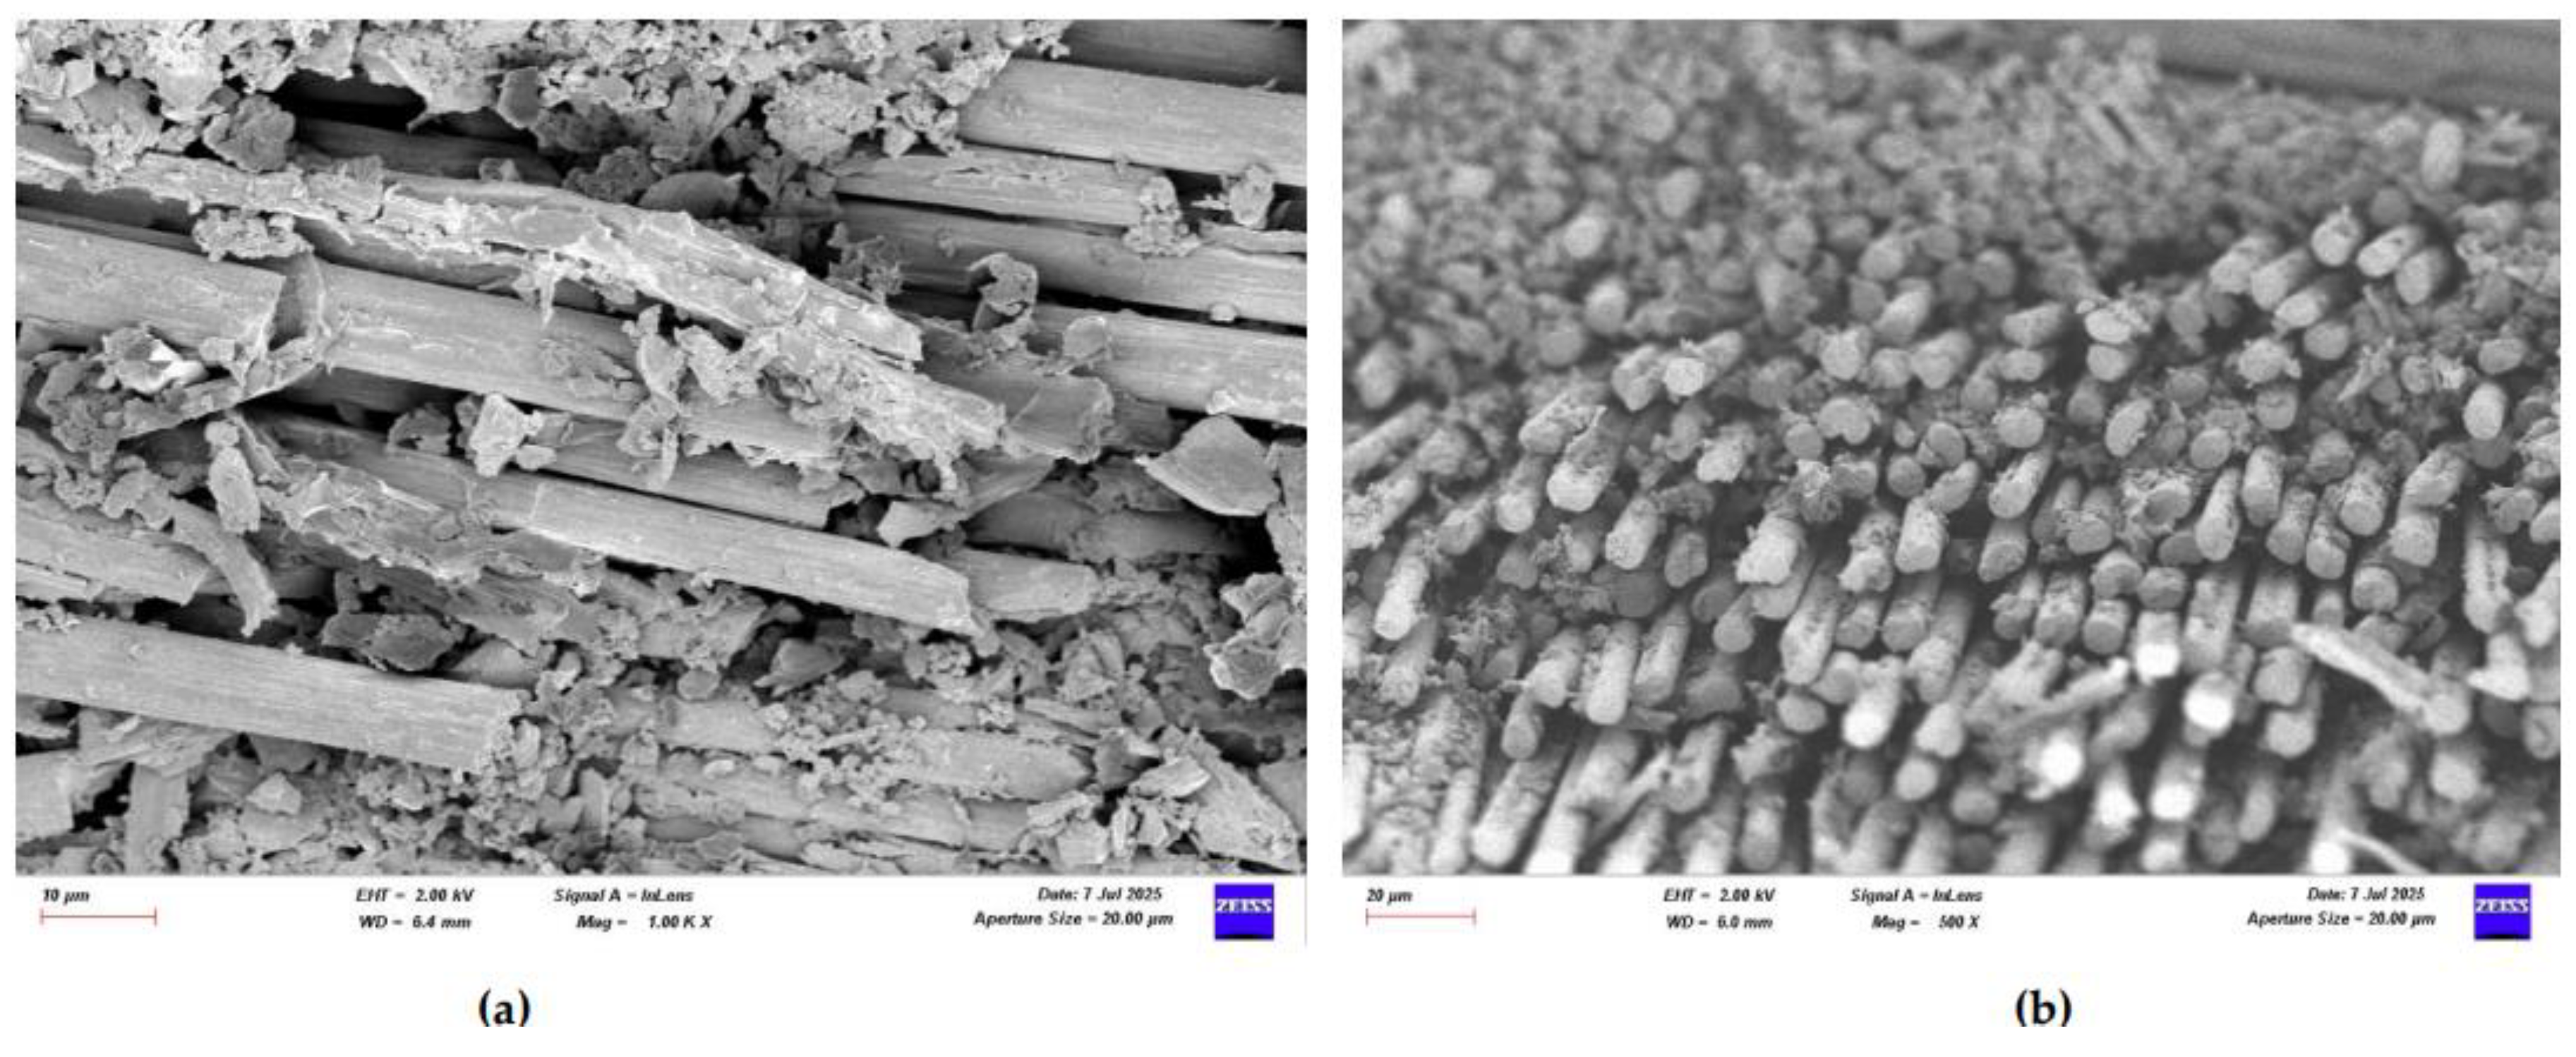
Figure 32.
(a) Mag=1.00KX and (b) Mag=400X Images of CFRP Samples 3rd Month.
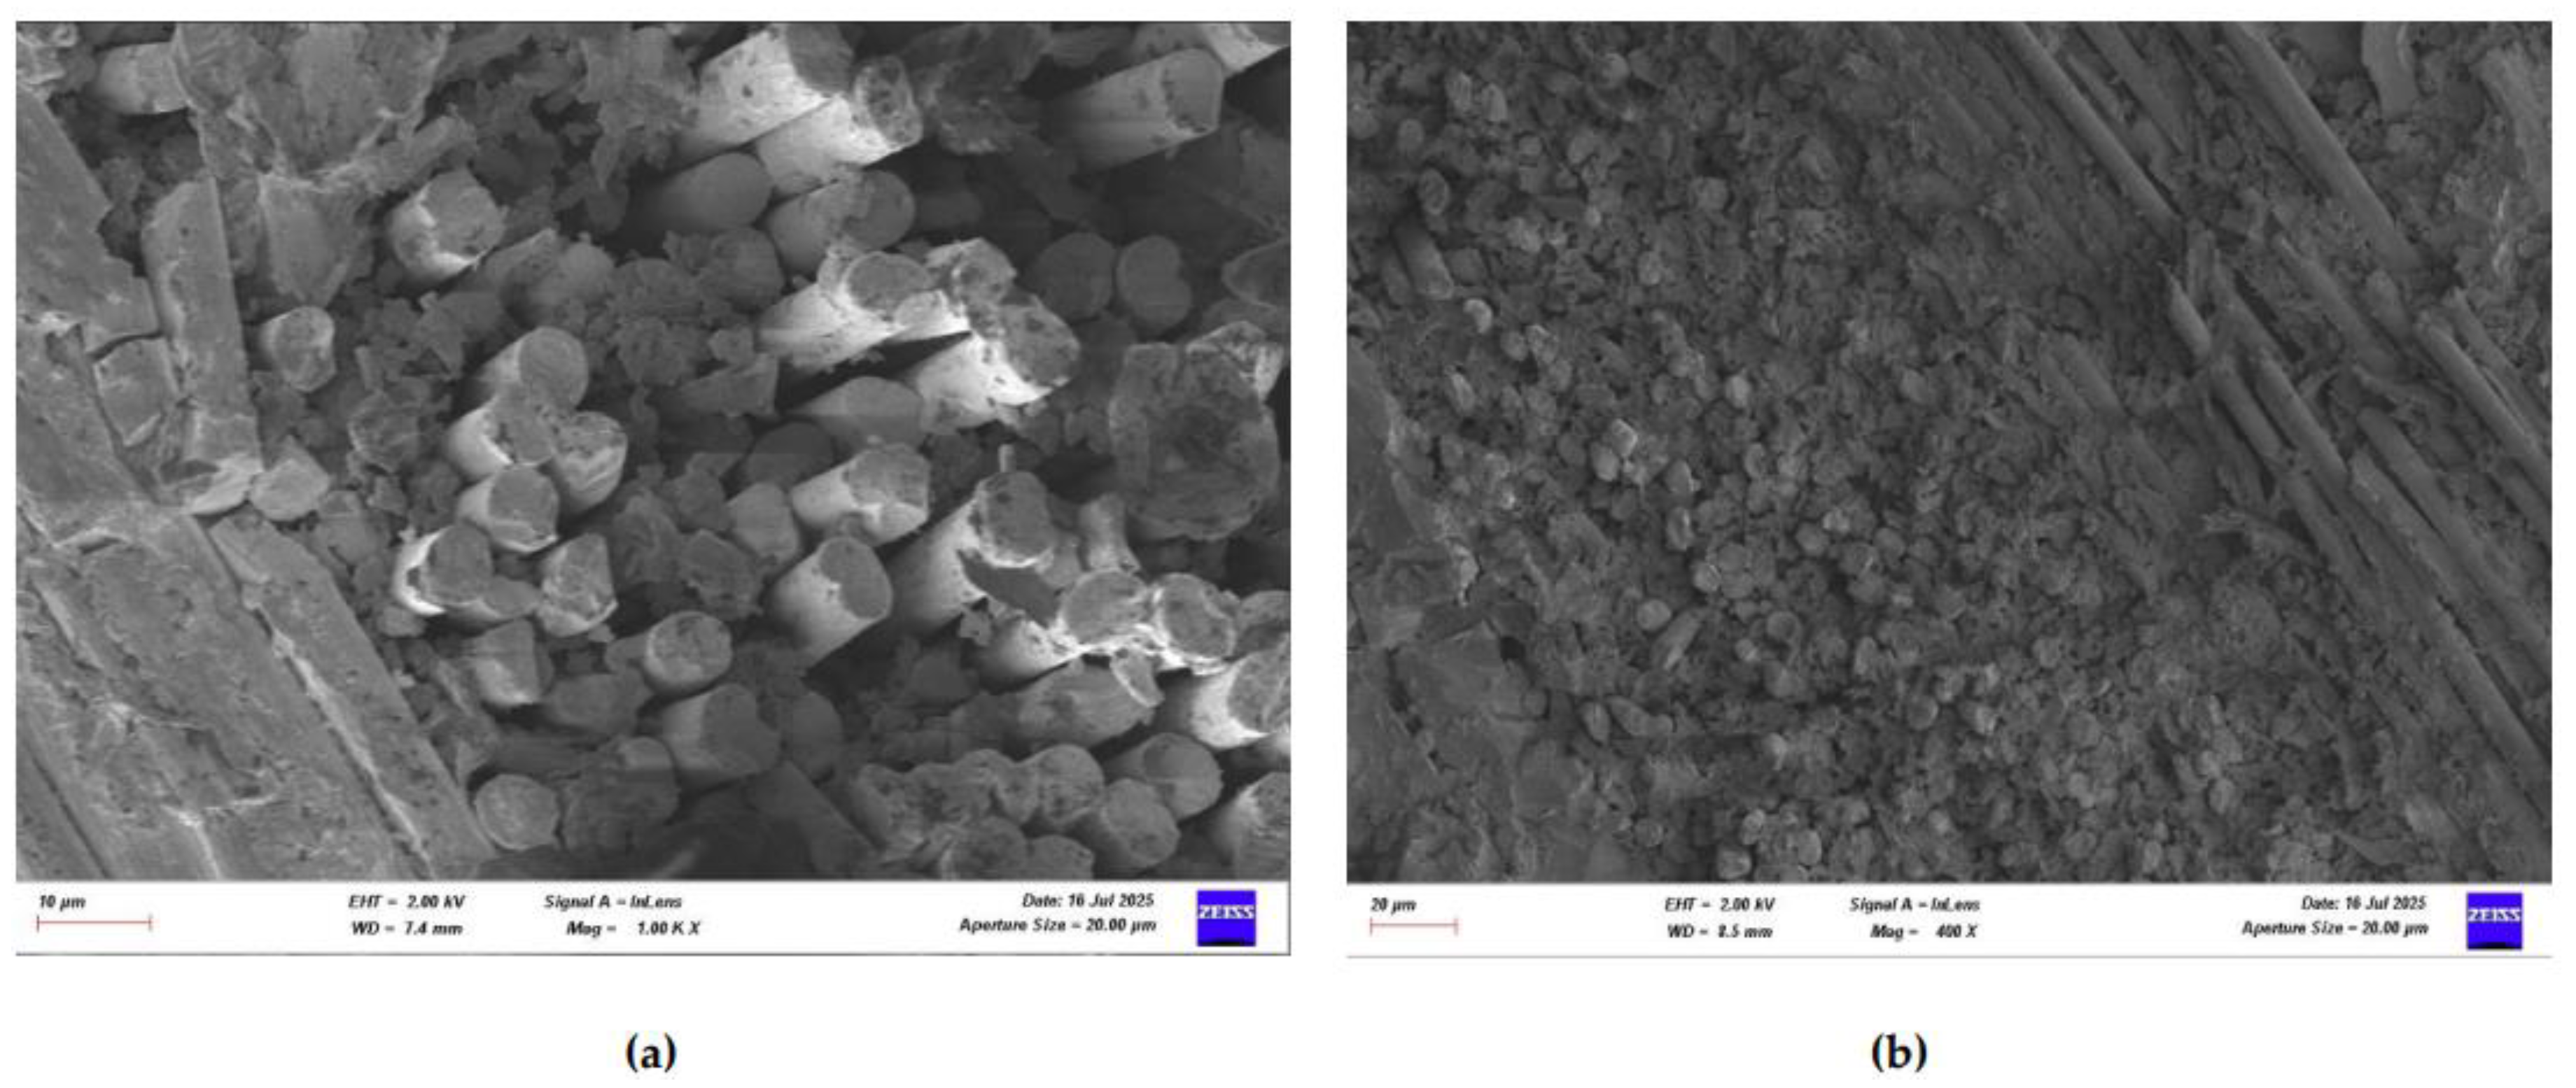

Table 1.
Bilingual coding system for identifying GFRP and CFRP specimens.
| Code (English) | Code (Turkish) | Description |
| GFRP-7L-FPBT-2M-1S | GFRP-7K-DNET-2AY-1N | 7-layer GFRP, four-point bending test, 2 months in seawater, specimen no. 1 |
| CFRP-8L-FPBT-3M-2S | CFRP-8K-DNET-3AY-2N | 8-layer CFRP, four-point bending test, 3 months in seawater, specimen no. 2 |
Table 2.
Moisture Retention Rates (%) of GFRP Specimens Exposed to Seawater for Different Durations.
Table 2.
Moisture Retention Rates (%) of GFRP Specimens Exposed to Seawater for Different Durations.
| Dry sample code |
Dry Weight (g) |
Store time |
Soaked in sea water Sample code |
Wet Weight (g) |
Moisture Retention Rate (%) |
| GFRP-7L-FPBT-DE | 17.2374 | 1st Month | GFRP-7L-FPBT-1M-1S | 17.3524 | 1.02 |
| GFRP-7L-FPBT-DE | 17.2374 | 2nd Month | GFRP-7L-FPBT-2M-2S | 17.8593 | 2.97 |
| GFRP-7L-FPBT-DE | 17.2374 | 3rd Month | GFRP-7L-FPBT-3M-3S | 17.9707 | 3.78 |
Table 3.
Moisture Retention Rates (%) of CFRP Specimens Exposed to Seawater for Different Durations.
Table 3.
Moisture Retention Rates (%) of CFRP Specimens Exposed to Seawater for Different Durations.
| Dry sample code | Dry Weight (g) | Store time | Soaked in sea water Sample code |
Wet Weight (g) | Moisture Retention Rate (%) |
| CFRP-8L-FPBT-DE | 14.7695 | 1st Month | CFRP-8L-FPBT-1M-1S | 14.8808 | 0.49 |
| CFRP-8L-FPBT-DE | 14.7695 | 2nd Month | CFRP-8L-FPBT-2M-2S | 14.9247 | 0.76 |
| CFRP-8L-FPBT-DE | 14.7695 | 3rd Month | CFRP-8L-FPBT-3M-3S | 14.9252 | 0.91 |
Table 4.
Comparison of Moisture Retention Rates.
| Exposure Time (Months) | GFRP Moisture Absorption Rate (%) | CFRP Moisture Absorption Rate (%) |
| 1 | 1.02 | 0.49 |
| 2 | 2.97 | 0.76 |
| 3 | 3.78 | 0.91 |
Table 5.
Mechanical Properties of GFRP-7L-FPBT Series Specimens (Figure 23 Data).
Table 5.
Mechanical Properties of GFRP-7L-FPBT Series Specimens (Figure 23 Data).
| Specimen Code | Flexural Stress (MPa) | Strain (ε) | Seawater Exposure Duration |
| GFRP-7L-FPBT-DE | 121.693 | 0.0395 | None (Dry Condition) |
| GFRP-7L-FPBT-1M | 114.951 | 0.0323 | 1 Month |
| GFRP-7L-FPBT-2M | 92.615 | 0.0244 | 2 Months |
| GFRP-7L-FPBT-3M | 72.794 | 0.0146 | 3 Months |
Table 6.
Mechanical Properties of CFRP-8L-FPBT Series Specimens (Figure 24 Data).
Table 6.
Mechanical Properties of CFRP-8L-FPBT Series Specimens (Figure 24 Data).
| Specimen Code | Flexural Stress (MPa) | Strain (ε) | Seawater Exposure Duration |
| CFRP-8L-FPBT-DE | 148.572 | 0.0270 | None (Dry Condition) |
| CFRP-8L-FPBT-1M | 122.385 | 0.0254 | 1 Month |
| CFRP-8L-FPBT-2M | 121.944 | 0.0206 | 2 Months |
| CFRP-8L-FPBT-3M | 109.557 | 0.0185 | 3 Months |
Table 7.
Comparison of Young’s Modulus (E) for GFRP and CFRP Specimens.
| Specimen Code |
Elastic Modulus (MPa) |
Material Type |
Change Compared to Initial (%) |
| CFRP-8L-FPBT-DE | 6.270 | CFRP | Referans |
| CFRP-8L-FPBT-1M | 6.189 | CFRP | 1,29 |
| CFRP-8L-FPBT-2M | 6.106 | CFRP | 2,62 |
| CFRP-8L-FPBT-3M | 6.052 | CFRP | 3,48 |
| GFRP-7L-FPBT-DE | 3.878 | GFRP | Referans |
| GFRP-7L-FPBT-1M | 3.756 | GFRP | 3,15 |
| GFRP-7L-FPBT-2M | 3.644 | GFRP | 6,42 |
| GFRP-7L-FPBT-3M | 3.510 | GFRP | 9,45 |
Table 8.
Effect of Seawater Conditioning on the Microstructural Integrity of GFRP Specimens.
| Figure No | Condition | Fiber-Matrix Interface | Observed Damage Mechanisms | Microstructural Condition | Mechanical Strength |
| Figure 25 | Dry Condition | Strong bonding | Fiber pull-out | Regular fiber alignment, minimal voids | High |
| Figure 26 | 1 Month Seawater | Initial degradation | Debonding, fiber pull-out, microcracks | Matrix swelling, weakened bonding | Reduced |
| Figure 27 | 2 Months Seawater | Significant damage | Fiber breakage, matrix fragmentation, voids | Loss of fiber-matrix interaction | Reduced |
| Figure 28 | 3 Months Seawater | Almost completely degraded | Macrocracks, chemical matrix degradation | Fibers free, merged cracks, brittle failure | Low |
Table 9.
Effect of Seawater Conditioning on the Microstructural Integrity of CFRP Specimens.
| Figure No | Condition |
Fiber-Matrix Interface |
Observed Damage Mechanisms |
Microstructural Condition |
Mechanical Strength |
| Figure 29 | Dry Condition |
High integrity |
Balanced fiber breakage | Regular structure, controlled fracture | High |
| Figure 30 | 1 Month Seawater | Partial debonding |
Microcracks, matrix deformation | Initial degradation, weakened bonding | Reduced |
| Figure 31 | 2 Months Seawater | Severe degradation |
Fiber-matrix separation, resin cracking and voids | Brittle fracture, irregular fiber breakage | Lower |
| Figure 32 | 3 Months Seawater | Interface detached |
Delamination, void formation | Free fibers | Very low |
Disclaimer/Publisher’s Note: The statements, opinions and data contained in all publications are solely those of the individual author(s) and contributor(s) and not of MDPI and/or the editor(s). MDPI and/or the editor(s) disclaim responsibility for any injury to people or property resulting from any ideas, methods, instructions or products referred to in the content. |
© 2025 by the authors. Licensee MDPI, Basel, Switzerland. This article is an open access article distributed under the terms and conditions of the Creative Commons Attribution (CC BY) license (http://creativecommons.org/licenses/by/4.0/).
Copyright: This open access article is published under a Creative Commons CC BY 4.0 license, which permit the free download, distribution, and reuse, provided that the author and preprint are cited in any reuse.


