Submitted:
25 July 2025
Posted:
28 July 2025
You are already at the latest version
Abstract
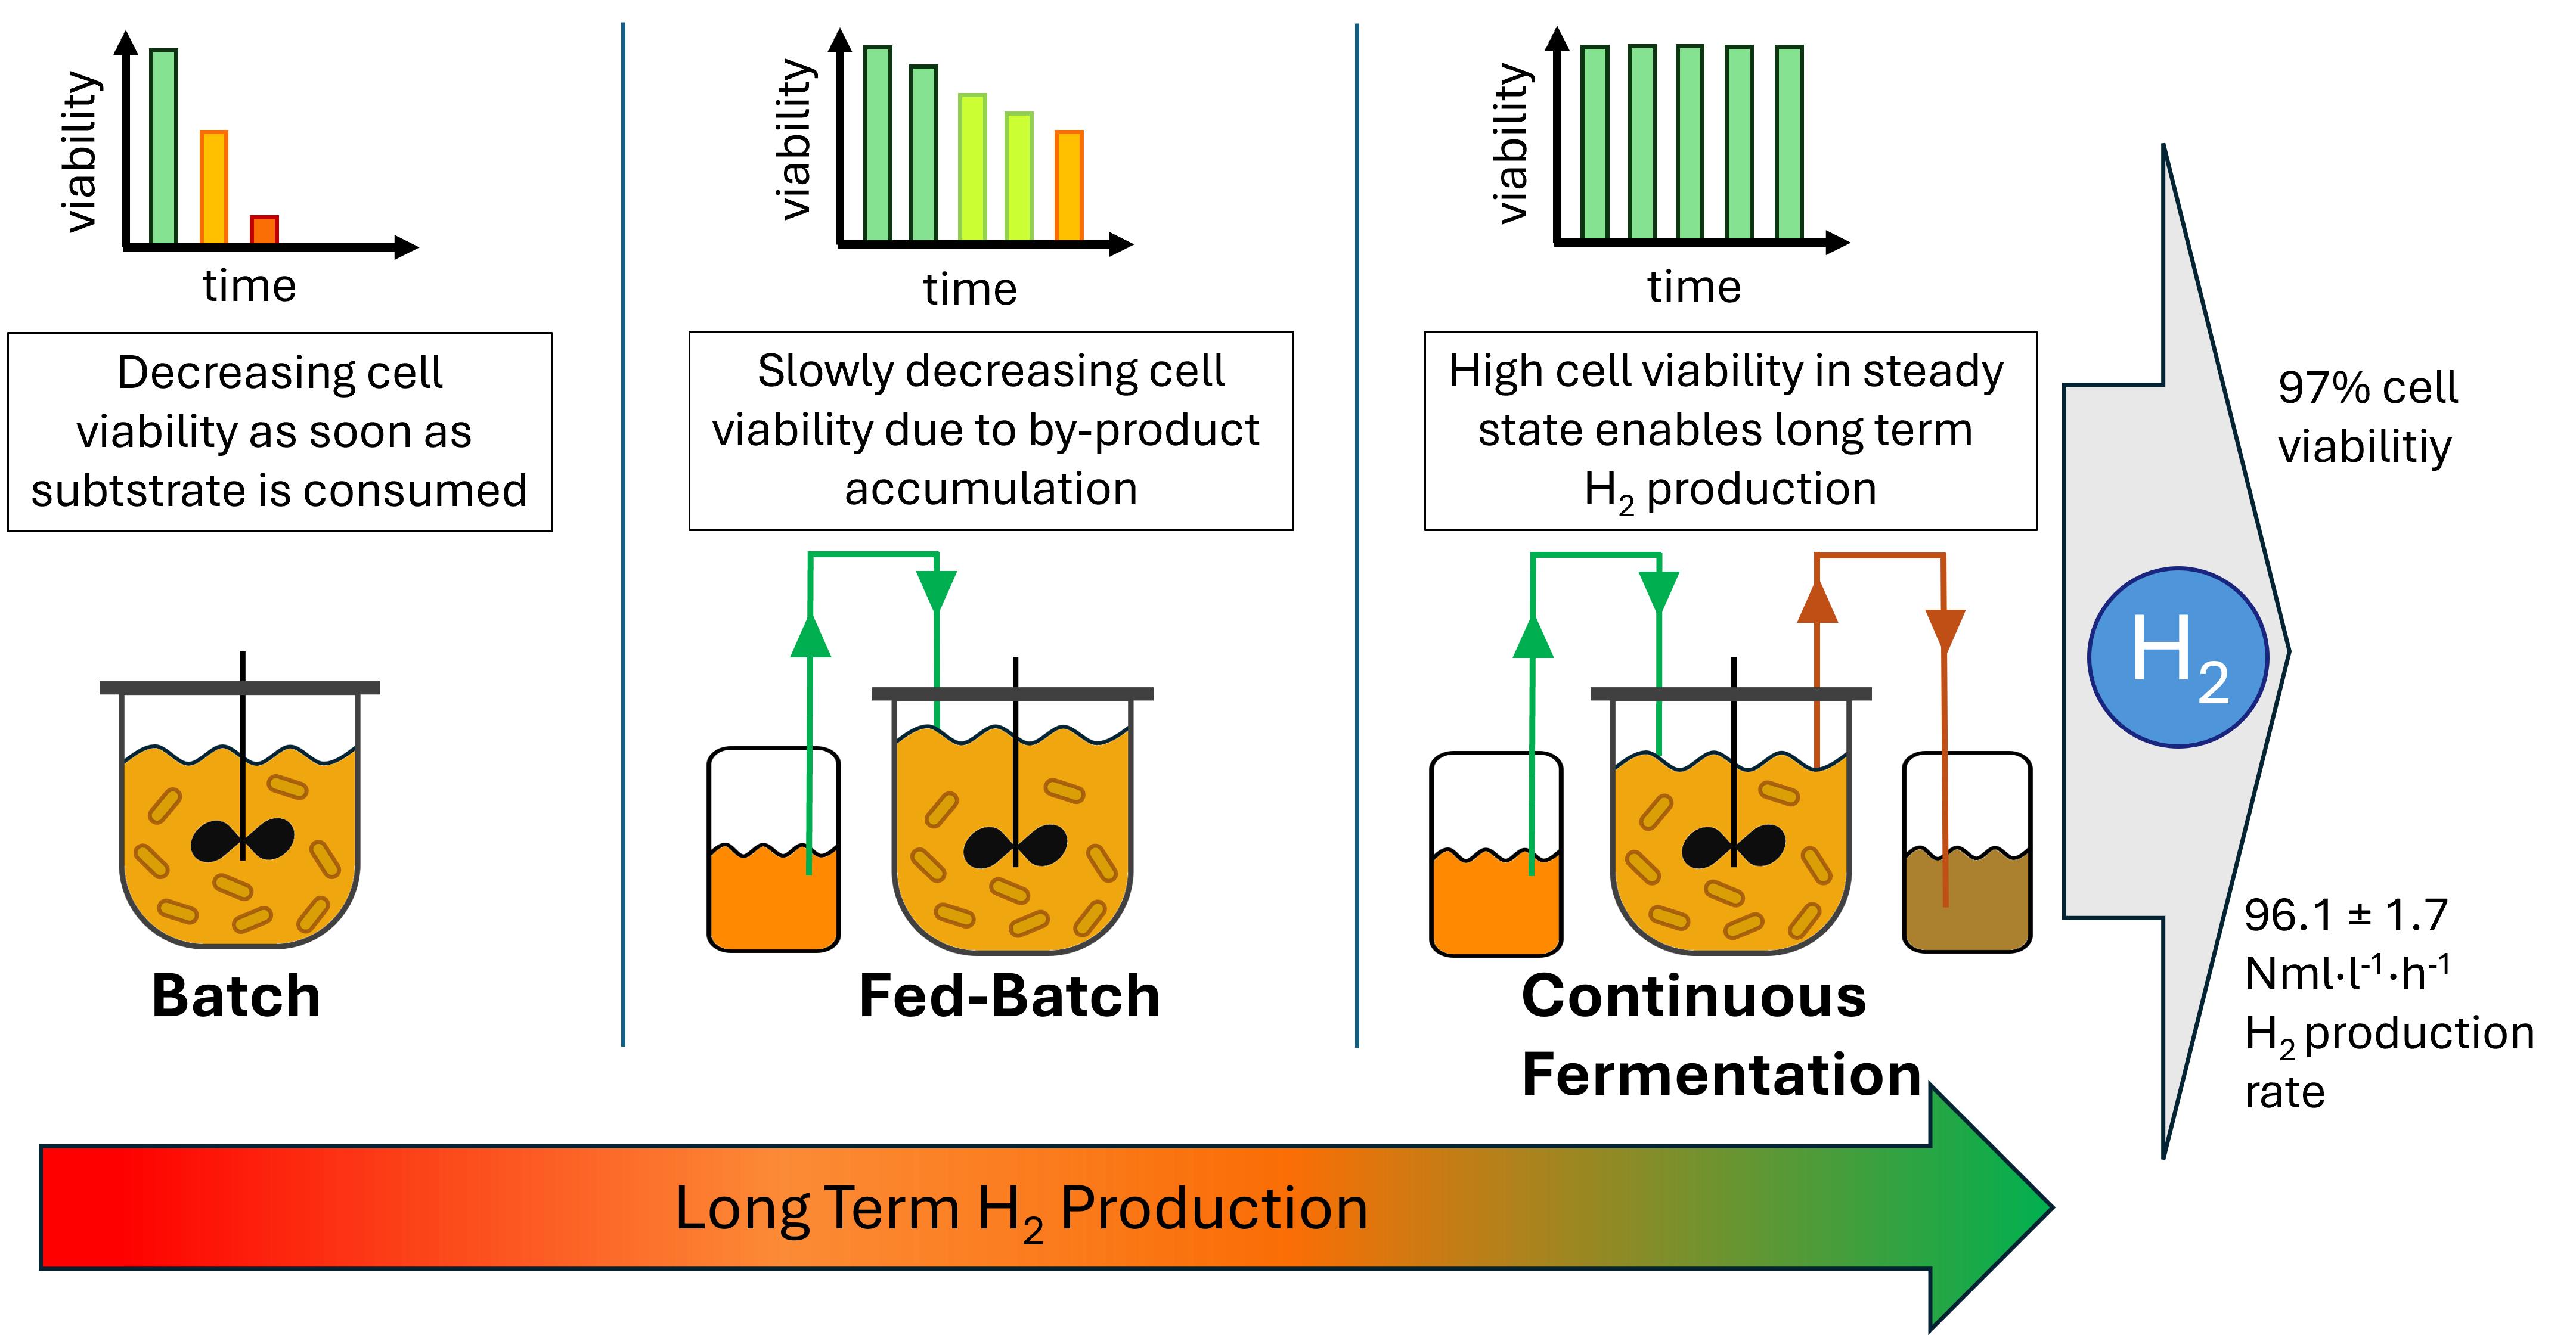
Hydrogen has emerged as a leading candidate due to its high energy density and potential for climate-friendly production. Unlike fossil fuels, hydrogen can be produced sustainably and without direct greenhouse gas emissions. This study investigates the efficient biogenic production of hydrogen via the thermophilic bacterium Thermotoga neapolitana, focusing on optimising process configurations to maximise yield and productivity. To determine optimal conditions, a 1 l anaerobic bioreactor with online gas analytics was designed. The evaluated processing modes included continuous, fed batch and batch. A maximum hydrogen production rate of 96.1 ± 1.7 Nml·l−1·h−1 was observed in the continuous reactor. The optimal dilution rate was 0.07 h−1. A consistently high cell viability (97%) was also observed across various dilution rates. A detailed carbon balance indicates acetate as the main by-product, closely linked to the hydrogen production pathway. Compared to fed batch and batch, the hydrogen production rate could be increased and hold over longer time. In this way the continuous reactor design showed an additional method to produce hydrogen to the established ones. Fermentative hydrogen production is particularly promising when using carbohydrate containing biomass and biowaste, as it can be considered carbon dioxide neutral.
Keywords:
hydrogen
; bioreactor
; processing mode
; Thermotoga neapolitana
; dilution rate
1. Introduction
1.1. Hydrogen as Energy Source
In the context of climate change, research into alternatives to fossil fuels as energy sources has been ongoing for many years. These are not only finite and lead to resource depletion, but also continue to drive climate change due to greenhouse gas emissions [1]. In this context, hydrogen is a promising candidate to replace fossil fuels as the main energy source in many areas. With its high gravimetric energy density of 33.3 kWh·kg−1, it is already used in select industrial applications and is gaining recognition as a key candidate for a future sustainable energy economy [2,3]. The production of hydrogen in general offers the advantage that energy can be transported and utilised compared to electric energy. Hydrogen can be transported in various ways. As it is a highly volatile gas with a density of 0.0899 g·l−1 under normal conditions, transport in liquefied form is preferred. Besides the opportunity to liquefy hydrogen, the liquid transport by modification is promising. In addition to the possibility of using ammonia or methanol, other liquid organic hydrogen carriers (LOHC) are also being heavily researched for this purpose [4,5,6]. Yet the majority of hydrogen produced worldwide currently still comes from the process of steam reforming, which is based on fossil raw materials [1,7]. However, hydrogen can also be produced from renewable resources. One of the most widely used methods is electrolysis. If the electricity required for this can be supplied from renewable energy sources, the hydrogen produced is also considered renewable [1,8]. On the other hand, there is the possibility of producing biogenic hydrogen using microorganisms, which is the focus of this work. There are some microorganisms that can produce hydrogen as part of their metabolism. This can also be referred to as renewable hydrogen, provided that the substrate resources used are renewable. Albuquerque et al. described that fermentation has the greatest potential for biohydrogen production [9]. This is particularly suitable as residual material streams can be utilised here. The biomass produced and unutilised biomass can also be used to produce energy following biohydrogen production.
1.2. Thermotoga Neapolitana
Thermotoga neapolitana is a thermophilic, rod shaped bacterium, which belongs to the Thermotoga genus and was first isolated and described by Belkin et al. in 1986 in the Bay of Naples [10,11]. This bacterium is able to produce H2 as part of dark fermentation. This metabolic pathway is an anaerobic metabolic pathway. For glucose as the starting substrate, the formula for the production of H2 is shown in equation (1).
C6H12O6 + 2H2O → 4H2 + 2CO2+ 2CH3COO− + 2H+
Ideally, due to the microbial redox balance, dark fermentation can produce 4 moles of H2 per mole of glucose [12,13]. For T. neapolitana, yields close to the theoretical maximum have already been demonstrated in various approaches [14,15,16,17,18]. As an alternative to the H2 metabolic pathway, lactate is also possible as an end product. However, as this metabolic pathway competes with the H2 metabolic pathway, this is not the preferred end product in most cases.
Other known by-products in noticeable quantities include ethanol and the amino acid L-alanine. The ability of T. neapolitana to produce ethanol was investigated in more detail by Sha et al. who described the metabolic pathway acetyl-CoA to ethanol [19]. Since acetyl-CoA also occurs in the same metabolic pathway as acetate and H2, ethanol production could also reduce the maximum hydrogen yield. The other possible by-product that has already been demonstrated for T. neapolitana is alanine [20] and here too, effects on the hydrogen yield are possible, as alanine is synthesised from the metabolic intermediate pyruvate.
The used thermophilic bacteria have an optimum temperature of 77 °C. This offers the advantage of minimising the risk of contamination, particularly with regard to the use of renewable raw materials and organic waste. It has already been shown for T. neapolitana that H2 production based on organic waste can be quite effective and achieve high yields [21,22,23,24]. For a close relative, T. maritima, an approach to H2 production consisting of seawater and date hydrolysate has already been demonstrated [25]. The use of seawater as a basis can simplify the process considerably and make it more cost effective, especially for scale up considerations. This enables bacteria of this type to be used to produce H2 from waste materials economically and ecologically.
1.3. Different Reactor Operating Modes
The choice of reactor system contributes significantly to how effectively a process can run [26]. T. neapolitana as a thermophilic anaerobic bacterium must be taken into account when designing a reactor system. In principle, different types of operating modes are possible. As a batch approach, the reactor is set up with medium and all associated components, inoculated with the bacteria and left to run until the substrate has been completely metabolised into products. This method is particularly easy to implement and is therefore used very frequently [27,28]. The fed-batch differs from the batch in that substrate is added during fermentation. This offers the advantage of being able to run the fermentation for an extended period. Larger quantities of substrate can be used without substrate inhibition inhibiting the process [29,30,31]. However, the accumulation of metabolic products in the medium can inhibit further growth and metabolic activities [32].
In many cases, a continuous reactor is suitable for achieving high production rates in the long term [33]. In this case, both fresh medium is constantly fed in and used medium is removed. This is more complex to realise in terms of process technology than a batch or fed-batch but offers several advantages. The permanent removal of used medium means that no inhibiting metabolic products can accumulate. In this way, the production rate can be kept permanently as high as the maximum production rate. In order to keep the utilisation of the substrate as optimal as possible, the dilution rate should be selected so that the growth rate of the cells is not exceeded. On the other hand, the dilution rate must not be too low, as otherwise the critical substrate availability for the cells could be undercut.
In the case of hydrogen production with T. neapolitana, various working groups have already demonstrated success in the different fermentation operating modes. Trials have been carried out in batch operation. Research groups have reported H2 yields close to the theoretical maximum. These were in the range of 1.84 to 3.85 molH2·molglucose−1 depending on the batch fermentation parameters [14,16,20,34]. For fed-batch operation, i.e. the repeated supply of sugar, hydrogen production was also observed for the tested period of 86 h [35]. Here, xylose was used as sugar. The xylose concentration was increased to 5 g·l−1 at four points in time using a feed. The H2 production rate fluctuated during the process between about 2 to 4 mmol·l−1·h−1 (equivalent to 45 to 90 Nml·l−1·h−1). One reason is that a steady increase in the by-products acetate and lactate was observed. Secondly, the concentration of utilisable sugars varied throughout. The continuous mode of operation has already been demonstrated in some approaches. For example, Dipasquale et al. used immobilised T. neapolitana to prevent the cells from being flushed out during continuous operation [36]. Dreschke et al. investigated how glucose concentration in the feed can affect H2 production [17,36]. They found that an increase in the glucose concentration from 11.1 to 41.6 mM (corresponding to 2 g·l−1 to 7.5 g·l−1) resulted in a reduction in the yield from 3.6 ± 0.1 to 1.4 ± 0.1 molH2·molglucose−1. The highest H2 production rate was achieved with 27.8 mM (equivalent to 5 g·l−1) glucose in the feed, with a yield close to the maximum at 3.1 ± 0.1 molH2·molglucose−1. The aim of this study is to test the differences between batch, fed-batch and continuous operation under otherwise identical conditions.
2. Materials and Methods
2.1. Bacterial Strain and Precultivation
T. neapolitana DSM 4359 was purchased from the DSMZ (German Collection of Microorganisms and Cell Cultures) and precultures were grown under anaerobic conditions in a modified TBGY media according to Childers [37] in 120 ml serum bottles. The media was containing glucose (5 g·l−1), NaCl (20 g·l−1), PIPES (6 g·l−1), KCl (2 g·l−1), L-Cystein (1 g·l−1), MgSO4·7H2O (500 mg·l−1), yeast extract (500 mg·l−1), NH4Cl (250 mg·l−1), CaCl2·2H2O (50 mg·l−1), K2HPO4 (50 mg·l−1), FeSO4·7H2O (7 mg·l−1), resazurin (1 mg·l−1) and Biotin (20 µg·l−1). The pH was adjusted using 1 M NaOH to 7.5 at 77 °C. Precultures were incubated for 16 h at 77 °C in an IKA 4000 i control incubator with no shaking.
2.2. Construction of Anaerobic Bioreactor
The anaerobic bioreactor was constructed using a borosilicate glass bottle with a volume of 1 l and is an improved version of the bioreactor described before [18]. Figure 1 illustrates a process flow diagram of the bioreactor. The medium was the same as previously described for the precultures. The oxygen was expelled by gassing with sterile N2. To reduce the possibility of gas leakage, all connections to the reactor were established using a cannula. 2 M NaOH was used to regulate the pH value. This was added in a controlled dose using a peristaltic pump. Similarly, in the case of fed-batch and continuous operation, the feed and the effluent were conveyed in a targeted manner via peristaltic pumps. The pumps were precisely controlled using a Bioflo 120 control unit from Eppendorf. In addition, the system was intermittently sparged with N2 in order to expel the H2 produced and flush to the gas sensors.
The produced gas first passed through a cold trap in order to be cooled to room temperature to condense excess water. After that, the gas stream passed through a H2S adsorber, to prevent the gas analytics from coming in contact with the H2S. Afterward, the product steam first reached BlueVary sensors for humidity, temperature, pressure and relative gas share measurement. Secondly, the steam passed the gas counter.
2.3. Fermentation Conditions
The bioreactor was inoculated with 10% (v/v) preculture after incubation at 77 °C for 16 hours. The working volume was 700 ml for all fermentations, except for the fermentation with increased cell concentration at the beginning of fermentation, which was 400 ml. The bioreactor was placed on a magnetic heating device and was insulated with thermal fiber materials. A thermometer for temperature control was placed between the reactor and isolation. Reactor mixing was performed using a magnetic stirrer at 350 rpm. Due to acid production as by-products, a pH correction during the fermentation with 2 M NaOH was implemented. Liquid samples were taken at certain times. Samples were prepared for OD540 measurement, and cell free supernatant was frozen until HPLC analysis. All samples were taken in technical triplicates.
For the batch with high cell density inoculation, a precultivation of 2,800 ml was performed. Cells were harvested using centrifugation at 2,000 rcf for 30 min. The pellet was resuspended in 40 ml fresh media and used for inoculation of 400 ml main culture.
For fed-batch process, the feeding with modified TBGY media, containing 100 g·l−1 glucose, started after 24 h processing time. The continuous process was operated for the first 8 h as batch and then in continuous mode with modified TBGY media. Each adjusted dilution rate was kept as long as a steady state could be observed and lasted at least for 56 h at steady state before changing the dilution rate.
2.4. Analytics
2.4.1. Cell Viability Test by Fluorescence Microscopy
To check the viability of the cells during fermentation, staining was carried out at regular intervals. For this purpose, fluorescence staining was performed and analysed by microscopy. The microscope used was a Zeiss axio Imager.M2m with a Plan-Apochromat 63x/1.4 Oil DIC objective. The corresponding images were taken with an Axiocam 712 mono installed on the microscope. The Bis-(1,3-Dibutylbarbituric Acid)Trimethine Oxonol (DiBAC4 (3)) dye used here to color cells, as it had already achieved promising results for this application [38]. First a stock solution with a concentration of 0.5 mM (dissolved in ethanol) was prepared. The final concentration of the dye in each sample was 0.5 µM DiBAC4 (3). In addition to the samples to be analysed, a dead and a living control were always stained and tested. DiBAC4 (3) is an anionic fluorescent dye that binds to intracellular proteins and membranes of dead cells. When excited at a wavelength of 493 nm, the maximum emission is at 516 nm. Accordingly, the exposure time was set on the microscope using the dead control. The living and dead control samples were taken from cultures, which were handled in the same way as the precultures above. The serum bottle for dead control was autoclaved for 15 min at 121 °C to ensure the cells were dead. To prevent cell lysis from falsifying the results, only fresh samples from the same day were used, or further samples were frozen in glycerol stocks and thawed when used.
2.4.2. Gas Analytics
The H2 and CO2 gases produced were analysed using a BlueVary device in combination with a BlueVCount online volumetric flow analyzer (both BlueSens, Germany). The produced H2 and CO2 gases were analysed with a device equipped for continuous measurement at 5-second intervals, recording temperature, humidity, pressure, and gas concentrations. The volumetric flow was simultaneously measured, allowing for precise calculation of H2 and CO2 production volumes. This combined gas and concentration analysis enabled the establishment of a comprehensive gas mass balance.
2.4.3. Biomass Analytics
Biomass as cell dry weight (CDW) was calculated using measurement of optical density at 540 nm wavelength using UltroSpec2100 photometer. To prevent adulteration by the coloring agent resazurin, the liquid samples were centrifuged for 15 min at 16,100 rcf. The supernatant was used for HPLC analysis and the pellet was resuspended in 1 ml 0.9% (w/w) NaCl solution. The subsequent formula (equation (2)) allowed the biomass to be calculated based on the optical density.
2.4.4. High Performance Liquid Chromatography Analytics
The supernatant of liquid samples was used for analysis using high performance liquid chromatography (HPLC) from Agilent. The selected column was a Repromer H+ by Dr. Maisch 300·8 mm with a temperature of 30 °C during analysis and 5 µL injection volume. As detector a refractory index detector Infinity II was used. The eluent was 5 mM sulfuric acid with a flow rate of 0.6 ml·min−1. Using the already described method allowed to quantify concentrations of the substrate glucose and the possible by-products acetate, lactate and ethanol [24].
RP-HPLC was used to analyse the amino acid concentration. C18 column from type Reprospher C18-Aqua 5 µM 125 · 4.6 mm was used to separate the individual amino acids. The column temperature was set to 30 °C. A gradient method with two different running agents was used. Eluent A was a sodium buffer (Preparation: 0.05 M sodium acetate, 0.05 M NaH2PO·2H2O solved in H2O, then adjusted pH to 7.0 using 5 M NaOH and adding 2% v/v of each Methanol and Tetrahydrofuran). Eluent B was a 54% Methanol solution. The times for the gradient method are shown in Table 1. A xenon FLD was used as fluorescence detector. To detect amino acids this way, the samples were derivatised with ortho-phthaladehyde (OPA) dye just before injection. The OPA solution consists of 5.4 g·l−1 OPA and 4 ml·l−1 beta-mercaptoethanol solved in 0.4 M borate buffer pH 9.
3. Results and Discussion
3.1. Cell Viability with Different Processing Types
Bacterial cell viability is an important factor in establishing long term processes. The expectation for each batch cultivation is a decreasing cell viability, as the consumption of all substrates and accumulation of by-products lead to increasingly unfavourable conditions. In fed-batch processes, where substrate limitations are mitigated, cell viability also tends to decline over time due to by-product accumulation, ultimately leading to cell lysis. This effect is particularly critical in fed-batch systems with slow-growing organisms and in batch systems with cell retention, as long-term viability directly impacts process stability. Despite the accumulation of by-products, the cells begin to lyse at a certain point. After complete lysis, the cells were neither detectable for biomass determination nor for viability determination.
As shown in Figure 2, dead (coloured) cells can be distinguished from living (uncoloured) cells. By counting the stained and unstained cells, the relative proportions of cells still alive could be determined. Samples were taken at different times for all fermentation approaches and compared with fresh dead or live controls. Figure 3 illustrates cell viability across different fermentation modes over time, highlighting the varying stability and resilience of each approach.
In batch processes, a rapid decline in cell viability was observed, with viability dropping from 95% at 24 h to 68% at 48 h, indicating a limited capacity to sustain cells under nutrient-depleted and by-product-accumulating conditions.
In contrast, the fed-batch approach demonstrated a more gradual decline in viability, starting from 100%, slight decreasing to 95% at 48 h and further decreasing to 84% at 144 h. Nevertheless, viability fell to 38% at later stages, suggesting improved but still limited longevity due to eventual by-product toxicity. This indicates that the availability of essential nutrients alone is not enough to maintain high cell viability over longer periods of time.
High-density batch cultures maintained high initial viability, which indicates, that the process of centrifugation for preparing the fermentation approach did not damage most cells. Nonetheless the dropped viability to 10% within the first 24 h displayed, indicates that even high cell concentrations cannot mitigate long-term viability loss in batch setups.
The consistently high viability of 97% observed in the continuous mode can be attributed to the absence of inhibitory by-product accumulation, as cells are continuously flushed out and replaced by freshly generated cells. This constant renewal maintains a stable and active cell population, supporting prolonged hydrogen production without the inhibitory effects seen in batch and fed-batch processes
3.2. Bacterial Cell Growth
At first to estimate possible dilution rates for continuous process and feeding rate for fed-batch, a normal batch cultivation and a batch cultivation with high cell density at beginning was performed. Based on these results the highest growth rate and substrate consumption could be calculated.
In addition to the metabolisation of glucose, Figure 4a also shows the course of biomass formation in a normal batch mode fermentation. Based on biomass concentration measurements, the exponential growth phase between 1 h and 3 h was identified. The maximum growth rate µmax was 0.77 ± 0.06 h−1.
Although this growth rate is slightly lower than the value of 0.94 h−¹ reported by Yu [39] and Jannasch et al., who calculated a similar growth rate from a doubling time of 0.75 h (equivalent to 0.92 h⁻¹) [10,39], it is notably higher than the rate reported by Frascari et al. for suspended cells with glucose as a substrate, which was 0.024 ± 0.005 h⁻¹ [40]. Differences in media composition and preculture treatments likely account for these variations, highlighting how specific cultivation conditions can significantly influence the maximum growth rate.
The maximum growth rate defines the upper limit for feasible dilution rates in continuous operation, as higher dilution rates would lead to cell washout, exceeding the rate of cellular growth [41,42]. Another approach to determining optimal dilution rates is to consider the maximum substrate consumption rate, since the feed medium for continuous operation was identical to that used in batch fermentation. In this study, the maximum glucose consumption rate was 0.97 ± 0.10 mmol·l⁻¹·h⁻¹. It is important to note, however, that cell density at the start of batch fermentation during exponential growth is significantly lower than after 24 h of fermentation. Within the first 24 h, the substrate was almost entirely depleted, similar to findings in other batch studies using a pH-controlled bioreactor with glucose as the substrate [20,35]. Accordingly, the biomass concentration also almost reached its maximum after 24 h at 0.50 ± 0.02 g·l−1. Hardly any metabolic activity was observed in the following 24 h of fermentation. This is also reflected in the viability of the cells during the course of fermentation, as shown in Figure 3. While the viability only dropped to 95% in the first 24 h of fermentation, it fell further to 68% in the further course. From this point on it can be concluded that at later stages of the fermentation with higher cell densities in a batch approach, optimal growth conditions were no longer present. This can also be attributed to the fact that substrate was no longer available in excess and by-products accumulated in the reactor as a result of metabolism, which can have inhibiting effects. In order to be able to simulate how high the substrate consumption rate can be with cultures of increased biomass concentration, this was also determined for the batch approach with increased cell concentration. In the high cell concentrated batch, a glucose consumption rate of 2.58 ± 0.16 mmol·l−1·h−1 was determined for the period between 0 and 4 h, during which exponential growth occurred in the normal batch. This value indicates how fast the substrate consumption rate can be under optimal conditions without inhibition by by-products. The feed rate for the fed-batch and the dilution rate for the chemostat were based on these results.
In contrast to the normal batch, no exponential growth of the bacteria was observed in the high cell density batch, as shown in Figure 4b. The biomass concentration rose from 0.75 to 0.91 g·l−1, stagnated and fell again after 4 h. With a cell viability of 87% at the start of fermentation, the concentrated cell inoculum demonstrated high viability, indicating that the initial cell concentration was suitable for most cells. This high biomass concentration, along with an increased substrate consumption rate, contributed to correspondingly elevated H₂ production rates. As illustrated in Figure 4c, H2 production between 1 h and 17 h was almost linear. Calculated at 1 h intervals, the average H2 production rate during this period was 89.0 ± 6.5 Nml·l−1·h−1. A total of 2,005 ± 44 Nml·l−1 H2 was produced over the fermentation period of 44 h.
In order to determine what was produced in the process of fermentation in addition to the products already mentioned, further by-product formation was analysed in more detail. As already known from T. neapolitana, alanine was detected. However, another amino acid, namely glutamate, was also detected. An increase in alanine (Figure S1) and glutamate (Figure S2) concentration could be observed. Both batch approaches ended up with comparable amino acid concentrations. The concentration of alanine reached with 0.84 ± 0.01 mM its maximum and highest glutamate concentration was 0.67 ± 0.08 mM. Alanine as by-product is known from T. neapolitana in low amounts. However, little is known so far about glutamate production. Nonetheless, a glutamate dehydrogenase has been described previously for a closely related species, T. maritima [43]. The concentrations measured here are comparatively low compared to the main by-products produced. Others with considerably higher production rates, such as Corynebacterium glutamicum, have already been established for the industrial production of amino acids [44]. Here, the analysis of the amino acids produced is primarily used to determine the products into which the glucose is metabolised, as all by-products can affect the possible H2 yield.
3.3. Fed-Batch
The fed-batch was initially allowed to run for 26 h in batch mode. The feed was subsequently run at 0.7 ml·h−1. At 20-fold glucose feed concentration, this corresponded to a feed of 0.56 mmolglucose·l−1·h−1. The highest H2 production rate during fed-batch was 49,2 ± 1,4 Nml·l−1·h−1, which was maintained for 4 h during this first feed phase. After 35 h of feed supply, the feed was paused to confirm that T. neapolitana was able to completely metabolise the glucose present (Figure 5a). As the glucose in the reactor was completely consumed, H2 production dropped rapidly, as evident from the decline in the H₂ production curve (Figure 5b). At 73 h, following the complete depletion of glucose in the reactor, the feed rate was increased to 1 ml·h⁻¹, corresponding to 0.793 mmol·l⁻¹·h⁻¹ of glucose. This adjustment initially led to an increase in hydrogen production, indicating that substrate availability directly influences H₂ output. However, despite the increased glucose feed rate, biomass concentration did not continue to rise. Instead, it slightly decreased and subsequently turned stationary. This suggests that a threshold in cell growth was reached, possibly due to limitations from by-product accumulation (e.g., acetate and lactate) or other inhibitory effects specific to the metabolic environment.
One possible reason for this is the accumulation of by-products such as acetate and lactate. The concentrations of these two components were similar to the batch approach in the first 48 h but then increased accordingly (Figure 5a). The inhibitory effect of acetate had already been demonstrated by Dreschke et al. [17]. Another recent study focussed on the inhibition of acetate on hydrogen production by dark fermentation in a bacterial consortium. Here, increased acetate concentrations led to the lactate metabolic pathway being favoured and the composition of the dominant bacteria changed considerably [32]. After 144 h, the concentration of acetate already exceeded with 84.9 ± 0.5 mM more than twice that of the batch approach at the end of fermentation (37.0 ± 0.2 mM). This was reflected in the productivity of the cells. On the one hand, Figure 5a shows that the glucose concentration increased and the glucose consumption rate decreased accordingly. On the other hand, as H2 production became noticeably slower and the biomass in the reactor decreased slightly. As the cells were no longer able to consume all the glucose supplied from the feed, the feed rate was consequently reduced from 1 ml·h−1 to 0.7 ml·h−1 after 146 h of fermentation time, corresponding to a glucose supply of 0.556 mmolglucose·l−1·h−1. A similar trend emerged as the fermentation time progressed. The glucose concentration in the reactor continued to increase, indicating that the glucose consumption rate was still below the feed rate. The by-products acetate and lactate continued to increase, possibly leading to increasing inhibition effects. The H2 formation rate decreased to an average of 10.0 ± 3.0 Nml·l−1·h−1 between 146 h and 217 h. Since the pH value of the reactor was permanently regulated to pH 7.35, the inhibitory effect due to the accumulation of the acids produced cannot be attributed to pH reduction. In this case, the increasing ionic strength in the reactor could possibly have negative effects on the bacteria. Due to the continuing increase in glucose concentration, the feed rate was further adjusted downwards from time 217 h and changed to 0.5 ml·h−1, corresponding to 0.396 mmolglucose·l−1·h−1. During this period of fermentation, H2 was still produced, but at a lower production rate of 5.4 ± 3.1 Nml·l−1·h−1. Even at the lower feed rate, less glucose was metabolised than was supplied.
Interestingly, the concentrations of the by-products alanine and glutamate, which are depicted in Figure 5c, show different courses. The concentration of the analysed amino acids were above 0 mM at the begin of fermentation, mainly due to the addition of yeast extract to the media. Here, an increase in concentration was observed from the start of fermentation until after 144 h fermentation time. Alanine increased from 0.18 ± 0.03 mM to 1.99 ± 0.04 mM and glutamate from 0.13 ± 0.03 mM to 1.05 ± 0.07 mM. Unlike the continuous accumulation observed for acetate and lactate, glutamate concentration stabilised, remaining relatively constant until the end of the fermentation process. Alanine, on the other hand, began to decrease, suggesting a shift from production to consumption. Considering the initial amino acid concentrations (e.g., 0.18 mM alanine from yeast extract at 0 h) and the low amino acid input from the feed, which primarily contained glucose in concentrated form, it is likely that the ongoing addition of amino acids was minimal. Accordingly, it is conceivable that T. neapolitana consumed rather than produced amino acids in the later course of the fermentation, possibly as an adaptive response to prolonged fermentation conditions or limited nutrient availability.
An additional indication that the cells may have experienced inhibition in their metabolic pathway toward acetate and H₂ is the accumulation of another by-product ethanol. While ethanol could not be quantified in all batch or continuous approaches (c< 0.1 g·l−1), the fed-batch showed an increasing ethanol concentration in the reactor over the course of 72 h fermentation time. The concentration profile is displayed in Table 2 and reached its maximum of 0.61 ± 0.04 g·l−1 at the end of fermentation. Although T. neapolitana possesses the enzymatic system required for ethanol production, previous studies indicate that the activity of these enzymes is relatively low [19]. This suggests that ethanol accumulation may occur under specific conditions, such as those present in the fed-batch process, where inhibition of primary pathways (e.g., acetate and hydrogen production) prompts the cells to redirect metabolism toward ethanol as an alternative by-product. H₂ and CO₂ are unlikely to cause product inhibition, as they readily escape as gases and are continuously expelled through N₂ sparging. However, dissolved by-products that accumulate in the liquid phase can reach inhibitory concentrations, potentially leading to a metabolic shift towards ethanol production. This accumulation of liquid-phase inhibitors may alter the metabolic balance, favouring ethanol as an alternative by-product under higher concentration conditions. As H2 is produced in the same metabolic pathway as acetate, inhibition of acetate production also results in lower H2 production. It would therefore be advisable to plan for in-situ product removal of acetate if longer lasting H2 production in the fed-batch is intended.
In addition to the expected results that in the course of a batch process, the viability decreased with time and the running out of the substrate, the same could also be determined for the fed-batch. Here, the consumption of the substrate was not the limiting factor that caused the viability to decrease over time (Figure 3). The inhibition caused by the accumulation of by-products inhibited the cells in their metabolism and growth. It is likely that in this case it was not just the by-products, but the overall ionic strength of the medium. This naturally also increased due to the accumulation of by-products. Various experiments with different buffer concentrations have already shown that increased buffer concentrations might have inhibitory effects on T. neapolitana [45]. Thus, by-product enrichment and the associated increase in ionic strength could also have a negative effect on T. neapolitana. In any case, it can be deduced from the viability profile that a fed-batch can no longer maintain high viability rates over several weeks under the tested conditions. While the viability was still relatively high at 84% after 144 h fermentation time, it dropped to only 40% after 214 h. After 336 h, viability was at its lowest at 38%. It should be noted that only whole cells could be detected as living or dead by staining. Accordingly, cells that died and were completely lysed during fermentation could not be detected. As the fermentation lasted a total of two weeks and low cell viabilities were present at later times, it can be assumed that several cells were already lysed during fermentation.
3.4. Continuous Fermentation
Due to the limitations observed in the fed-batch system, especially concerning extended fermentation times, a continuous bioreactor was implemented following the setup outlined in Figure 1. The continuous supply of fresh medium and removal of used medium ensured that no by-products could accumulate in the medium in higher concentrations. The dilution rates of 0.03 h−1, 0.05 h−1, 0.07 h−1 and 0.1 h−1 tested here are based on the maximum observed glucose consumption rates of the batch runs. Since the feed had the same composition as the TBGY media described, the glucose feed rates were accordingly 0.833 mmolglucose·l−1·h−1, 1.388 mmolglucose·l−1·h−1, 1.943 mmolglucose·l−1·h−1 and 2.775 mmolglucose·l−1·h−1. The glucose concentration in the reactor increased from 0.11 ± 0.05 g·l−1 to 1.08 ± 0.03 g·l−1 at a dilution rate of 0.1 h−1. This indicates that the critical dilution rate was already exceeded. Accordingly, a steady state could not be achieved. Steady state was observed for all other tested dilution rates. The steady state was characterised by the fact that the glucose concentration in the reactor remained constantly low and fluctuated by less than 0.1 g·l−1. It can therefore be assumed that the substrate supplied was almost consumed. The highest glucose consumption rate in chemostat mode was 2.19 ± 0.05 mmolglucose·l−1·h−1. This observation matches the results of the maximum glucose consumption rate, which could be determined in batch fermentations. Here, a glucose consumption rate of 2.58 ± 0.16 mmolglucose·l−1·h−1 could only be determined for the batch with an increased starting cell concentration under optimum conditions. This is slightly below the glucose supply rate at the 0.1 h−1 dilution rate in continuous operation. Theoretically, based on the maximum growth rate, which was µmax=0.77 ± 0.06 h−1 during the batch fermentation in exponential growth phase, even considerably higher dilution rates would be conceivable. Several factors likely contribute to the observed discrepancy between the maximum growth rate and the achievable dilution rate in continuous operation. One primary factor is the significantly higher cell density in the steady state of the continuous reactor compared to the exponential growth phase in batch mode. The biomass grew between 0.023 ± 0.009 g·l−1 and 0.085 ± 0.011 g·l−1 during the exponential growth phase. The continuous reactor with a dilution rate of 0.03 h−1 had an average biomass concentration of 0.550 ± 0.065 g·l−1 during the steady state. The increased biomass concentration could therefore prevent the cells from continuing to grow at the maximum possible growth rate, as the availability of nutrients might be limited, or the cell density itself inhibits further growth. This also indicates that, as already mentioned, the maximum growth rate can vary greatly under different conditions and cannot be maintained for long. Accordingly, the specific growth rate can be significantly lower for a longer period of time. With an experimentally determined maximum dilution rate D=0.07 h−1, this is noticeably higher than the prognosed optimal dilution rate of D=0.041 h−1 predicted by Frascari et al. for dissolved cells, which is based on substrate to product and biomass conversion rate and yield [40]. The results are shown in Figure 6a-d.
The H2 production rate was overall consistent, indicating a stable steady state. The biomass concentration remained constant as well. So was the viability of the cells in continuous operation very high at steady state for all dilution rates tested and averaged 97 ± 3%. Thus, in contrast to the batch and fed-batch approaches, there was no recognisable downward trend over the entire steady state period. This indicates that suitable fermentation conditions were generally available for the cells at all different dilution rates. But as the cells are also permanently rinsed out during the continuous process, the cells are only in the bioreactor for a certain time depending on the respective dilution rate. In this case, the residence time was 33.3 h (D=0.03 h−1), 20.0 h (D=0.05 h−1) or 14.3 h (D=0.07 h−1). For periods of time in this range, a comparably high viability was also observed at the start of fermentation in the batch or fed-batch. Nevertheless, it can be assumed that over the period of fermentation, some cells lysed as well. However, as soon as they lyse, they were no longer detectable.
As depicted in Figure 6a, the H2 production rate increased with increasing dilution rate. While at D=0.03 h−1 it was 62.1 ± 4.7 Nml·l−1·h−1, at D=0.07 h−1 it was even 96.1 ± 1.7 Nml·l−1·h−1 at steady state. An almost comparable increase in biomass production was also observed at higher dilution rates (Figure 6b). Reasons for this are the higher availability of glucose at higher dilution rates. For the by-products analysed here, a trend of increasing production rate with increasing dilution rate could also be observed. However, the ratio of acetate to lactate production shifted slightly in favour of lactate as the dilution rate increased. While at the lowest dilution rate D=0.03 h−1 the ratio was 13.4 acetate : 1 lactate, at D=0.05 h−1 this ratio fell to 11.1 acetate : 1 lactate. At D=0.07 h−1, the ratio was even decreased to 7.5 acetate : 1 lactate. As the metabolic pathway to lactate is in competition with the H2 metabolic pathway [14], the lowest possible lactate production rate should usually be aimed for. However, it could also be shown that lactate production does not necessarily have to reduce the H2 yield, as T. neapolitana, or the strain T. neapolitana cf capnolactica (DSM33003) used in some cases, appears to be able to form lactate from acetate and CO2 without negatively affecting H2 production [16,46].
Interestingly, a look at the yields for all stable dilution rates showed hardly any differences in terms of product yields. As shown in Figure 7a, the H2 yield at steady state for the dilution rates tested was between 2.7 ± 0.1 molH2·molglucose−1 (D=0.05 h−1) and 3.0 ± 0.1 molH2·molglucose−1 (D=0.07 h−1). The yields also remained constant for the steady state period. The yields for acetate and lactate also showed hardly any differences. Only the yields of the produced amino acids alanine and glutamate showed a slightly increased yield at the dilution rate of D=0.07 h−1 (Figure 7b). The calculated yield of 0.044 ± 0.002 molalanine·molglucose−1 is close to the alanine yield reported before [47]. However, among other things, production of alanine ensured the H2 yield was below the theoretical maximum. This is because it has already been shown that both pyruvate and reduction equivalents are required for alanine production [16,20,48]. As a consequence, these components are not available to the maximum possible extent for H2 production. On the other hand, it could also be shown that alanine, among others, can be used as a nutrient source [49], which is in line with the results from the fed-batch as described above. Accordingly, the use of pyruvate and reduction equivalents for alanine production could be counteracted by specifically adding small amounts of alanine to the fermentation.
One possible approach to improving the system would be to introduce a membrane that retains the cells in the bioreactor. It has already been shown that increasing the biomass concentration can lead to a significantly faster metabolisation of glucose [47]. Higher biomass concentration could also overcome possible inhibition because of higher glucose concentration in the feed. As shown by Dreschke et al. increased glucose concentration from 11.1 to 41.6 mM in the feed, reduced noticeably the hydrogen yield [17]. A more efficient metabolisation of glucose would bring many advantages, especially with regard to scale-up. In this way, higher throughputs could also be achieved with lower volumes, making the entire process more cost-effective.
Another option for optimising the continuous system to enable an increase in the dilution rate would be to immobilise the cells in the reactor. Successful approaches for this have already been demonstrated by [36,40]. This would prevent a washout, even at higher dilution rates. However, it would have to be ensured that the substrate is as favourably accessible as possible for the cells and is metabolised as quickly as possible.
In addition to the individual production rates in a continuous process, the carbon balance is an important aspect to consider. This can provide information on whether all the main products produced have already been identified and quantified. Furthermore, an overview of the proportions of the products produced can provide information on whether contamination or a shift in metabolism has occurred over time.
The carbon balance, which is illustrates in Figure 8, refers to the substrate consumption and the resulting products in continuous operation at steady state. A value of 45.9% carbon of the total cell dry weight was determined empirically for T. maritima [50]. Here, a C content of 38.7 ± 0.2% was determined experimentally for T. neapolitana. For this purpose, the dried cell biomass from the fermenter was analysed as part of a C-H-N analysis using a Vario EL cube elemental analyser. It is initially noticeable that the overall balance of 102.8% is above the theoretical maximum. Compared to the carbon balance of Munro et al. [14] the value is quite similar, though. This could be explained by the assumption that the small amounts of yeast extract present in the media were also used to synthesise biomass. However, the balance suggests that all carbon-containing products that are formed in significant quantities have been found and quantified here. Overall, acetate was found to make up the largest proportion of carbon (54.0%). This was followed by CO2 (27.3%) and biomass (11.1%). As acetate is produced in the same metabolic pathway as H2, a correspondingly high acetate production is also to be expected with a high H2 production [48,51]. Since the carbon that was used at the beginning of the process could be recovered in the form of various products, possible further utilisation options are quite calculable. For example, the biomass can be used as a favourable substrate for further fermentation processes. With the help of the CO2 gas produced, it is even conceivable to subsequently produce methanol from CO2 and H2. Methanol would be a suitable way of both fixing the CO2 and enabling the H2 to be stored and transported more easily [52].
4. Conclusions
This study provides a comprehensive evaluation of Thermotoga neapolitana performance in hydrogen production under different fermentation modes, highlighting key factors that impact cell viability, growth, and product yield.
Overall, it could be demonstrated in this work that in the fermentation of Thermotoga neapolitana for microbial hydrogen production, a continuous bioreactor appears to be advantageous compared to the batch or fed-batch system. By operating the continuous fermentation with a dilution rate of D=0.07 h−1, the H2 production rate could be permanently maintained at 96.1 ± 1.7 Nml·l−1·h−1 which is a higher level compared to the highest production rate in the batch or fed-batch. These also could only maintain their highest H2 production rate for few hours. In the case of batch fermentation, the highest H2 production rate was 89.0 ± 6.5 Nml·l−1·h−1 in the batch with high inoculation density and could be maintained until the glucose was almost completely consumed. For the fed-batch fermentation, the highest H2 production rate could be only maintained for 4 h with 49,2 ± 1,4 Nml·l−1·h−1 in the first feed phase, while H2 production rate decreased in later stages due to inhibition effect. Inhibition could be avoided by continuous mode. At dilution rates of up to 0.07 h−1, no stationary low glucose concentrations were observed, which indicates that the supplied glucose was completely metabolised. The use of renewable raw materials or waste streams as a substrate will play an indispensable role in future experiments. This is due to the fact that in order to be able to produce truly climate-friendly hydrogen in a continuous process on a larger scale, it is essential to use renewable raw materials that are not otherwise required, for example as food. In addition, the continuous reactor system could be upgraded to include a membrane that retains the biomass in the reactor. In this way, the dilution rate could possibly be set even higher, as the cells will not be washed out even above D=0.07 h−1. The biomass concentration could also be increased in this way. This would increase the H2 production efficiency of the entire system.
In batch and fed-batch systems, cell viability decreased over time due to substrate depletion and by-product accumulation. While fed-batch mode mitigated substrate limitations, it faced challenges with by-product inhibition, particularly from acetate and lactate. This accumulation led to metabolic shifts, favouring ethanol production, and resulted in lower hydrogen yields over extended fermentation periods. The observed decline in cell viability and production rates under these conditions highlights the limitations of fed-batch systems for sustained hydrogen production. The observed metabolic inhibition and increased ionic strength, likely due to by-product accumulation, underscore the need for improved strategies, such as in situ product removal, to enhance process stability in these systems. In contrast, the continuous bioreactor maintained high cell viability (averaging 97%) and stable hydrogen production rates across various dilution rates, demonstrating the feasibility of long-term hydrogen production without significant viability loss. The continuous mode enabled efficient removal of inhibitory by-products, thereby preventing the metabolic shifts observed in fed-batch mode. Notably, the maximum H₂ production rate reached 96.1 ± 1.7 Nml·l⁻¹·h⁻¹ at a dilution rate of 0.07 h⁻¹, with a steady-state H₂ yield of up to 3.0 molH2·molglucose−1. This stability and efficiency position continuous fermentation as the optimal strategy for high-yield, long-term hydrogen production with T. neapolitana.
Across all fermentation modes, acetate was identified as the dominant carbon-containing by-product, reflecting its production via the same metabolic pathway as H₂. The continuous process further allowed for consistent acetate and lactate production, although the ratio of these by-products shifted slightly with increased dilution rates, favouring lactate production. Amino acids, such as alanine and glutamate, were also detected, with alanine production partially diverting pyruvate and reduction equivalents, possibly impacting the maximum theoretical H₂ yield.
The carbon balance analysis revealed that acetate and CO₂ accounted for the largest carbon fractions, with acetate production closely linked to H₂ output. The potential for downstream utilisation of both biomass and CO₂ suggests future directions for integrating hydrogen production into bioeconomic frameworks. For example, CO₂ can be converted into methanol using produced H₂, enabling easier storage and transport and enhancing the sustainability of the hydrogen production process.
To overcome the observed limitations in batch and fed-batch systems, potential strategies for improving hydrogen production include cell retention methods, such as membrane integration or cell immobilisation, which could allow higher biomass densities and increased substrate utilisation without washout. Additionally, in continuous systems, further research into optimising substrate accessibility and minimising inhibitory effects, particularly from acetate, could enhance yield and productivity.
Supplementary Materials
The following supporting information can be downloaded at the website of this paper posted on Preprints.org.
Author Contributions
Conceptualization, F.M. and L.H.; methodology, F.M. and J.T.; validation, F.M., and L.H..; formal analysis, F.M. and L.H.; investigation, F.M. and L.H.; resources, N.T..; data curation, L.H.; writing—original draft preparation, F.M.; writing—review and editing, N.T. and J.T.; visualization, F.M.; supervision, N.T.; project administration, N.T.; funding acquisition, N.T. All authors have read and agreed to the published version of the manuscript.
Funding
This work was supported by the state north rhine westphalia via PtJ [grant number 005-2207 0036_0211]; the Ministry of Culture and Science of the state of North Rhine Westphalia [grant number 005-2105-0044] and the Aachen University of Applied Sciences library.
Data Availability Statement
The original contributions presented in this study are included in the article/supplementary material. Further inquiries can be directed to the corresponding author.
Conflicts of Interest
The authors declare no conflicts of interest. The funders had no role in the design of the study; in the collection, analyses, or interpretation of data; in the writing of the manuscript; or in the decision to publish the results.
References
- Ishaq, H.; Dincer, I.; Crawford, C. A review on hydrogen production and utilization: Challenges and opportunities. Int. J. Hydrogen Energy 2022, 47, 26238–26264. [CrossRef]
- Łukajtis, R.; Hołowacz, I.; Kucharska, K.; Glinka, M.; Rybarczyk, P.; Przyjazny, A.; Kamiński, M. Hydrogen production from biomass using dark fermentation. Renew. Sustain. Energy Rev. 2018, 91, 665–694. [CrossRef]
- Zajic, J.E.; Kosaric, N.; Brosseau, J.D. Microbial production of hydrogen. Advances in Biochemical Engineering 1978, 9, 57–109. [CrossRef]
- Reuß, M.; Grube, T.; Robinius, M.; Preuster, P.; Wasserscheid, P.; Stolten, D. Seasonal storage and alternative carriers: A flexible hydrogen supply chain model. Appl. Energy 2017, 200, 290–302. [CrossRef]
- Teichmann, D.; Arlt, W.; Wasserscheid, P. Liquid Organic Hydrogen Carriers as an efficient vector for the transport and storage of renewable energy. Int. J. Hydrogen Energy 2012, 37, 18118–18132. [CrossRef]
- Teichmann, D.; Arlt, W.; Wasserscheid, P.; Freymann, R. A future energy supply based on Liquid Organic Hydrogen Carriers (LOHC). Energy Environ. Sci. 2011, 4, 2767. [CrossRef]
- Panchenko, V.A.; Daus, Y.; Kovalev, A.A.; Yudaev, I.V.; Litti, Y. Prospects for the production of green hydrogen: Review of countries with high potential. Int. J. Hydrogen Energy 2023, 48, 4551–4571. [CrossRef]
- Cetinkaya, E.; Dincer, I.; Naterer, G.F. Life cycle assessment of various hydrogen production methods. Int. J. Hydrogen Energy 2012, 37, 2071–2080. [CrossRef]
- Albuquerque, M.M.; Sartor, G.d.B.; Martinez-Burgos, W.J.; Scapini, T.; Edwiges, T.; Soccol, C.R.; Medeiros, A.B.P. Biohydrogen Produced via Dark Fermentation: A Review. Methane 2024, 3, 500–532. [CrossRef]
- Jannasch, H.W.; Huber, R.; Belkin, S.; Stetter, K.O. Thermotoga neapolitana sp. nov. of the extremely thermophilic, eubacterial genus Thermotoga. Arch. Microbiol. 1988, 150, 103–104. [CrossRef]
- Belkin, S.; Wirsen, C.O.; Jannasch, H.W. A new sulfur-reducing, extremely thermophilic eubacterium from a submarine thermal vent. Appl. Environ. Microbiol. 1986, 51, 1180–1185. [CrossRef]
- Schroeder, C.; Selig, M.; Schoenheit, P. Glucose fermentation to acetate, CO2 and H2 in the anaerobic hyperthermophilic eubacterium Thermotoga maritima: involvement of the Embden-Meyerhof pathway. Arch. Microbiol. 1994, 161, 460–470. [CrossRef]
- Thauer, R.K.; Jungermann, K.; Decker, K. Energy conservation in chemotrophic anaerobic bacteria. Bacteriol. Rev. 1977, 41, 100–180. [CrossRef]
- Munro, S.A.; Zinder, S.H.; Walker, L.P. The fermentation stoichiometry of Thermotoga neapolitana and influence of temperature, oxygen, and pH on hydrogen production. Biotechnol. Prog. 2009, 25, 1035–1042. [CrossRef]
- van Ooteghem, S.A.; Beer, S.K.; Yue, P.C. Hydrogen production by the thermophilic bacterium Thermotoga neapolitana. Appl. Biochem. Biotechnol. 2002, 98-100, 177–189. [CrossRef]
- Dipasquale, L.; d’Ippolito, G.; Fontana, A. Capnophilic lactic fermentation and hydrogen synthesis by Thermotoga neapolitana: An unexpected deviation from the dark fermentation model. Int. J. Hydrogen Energy 2014, 39, 4857–4862. [CrossRef]
- Dreschke, G.; Papirio, S.; Sisinni, D.M.G.; Lens, P.N.L.; Esposito, G. Effect of feed glucose and acetic acid on continuous biohydrogen production by Thermotoga neapolitana. Bioresour. Technol. 2019, 273, 416–424. [CrossRef]
- Pradhan, N.; Dipasquale, L.; d’Ippolito, G.; Panico, A.; Lens, P.N.L.; Esposito, G.; Fontana, A. Hydrogen Production by the Thermophilic Bacterium Thermotoga neapolitana. Int. J. Mol. Sci. 2015, 16, 12578–12600. [CrossRef]
- Sha, C.; Wang, Q.; Wang, H.; Duan, Y.; Xu, C.; Wu, L.; Ma, K.; Shao, W.; Jiang, Y. Characterization of Thermotoga neapolitana Alcohol Dehydrogenases in the Ethanol Fermentation Pathway. Biology (Basel) 2022, 11. [CrossRef]
- d’Ippolito, G.; Dipasquale, L.; Vella, F.M.; Romano, I.; Gambacorta, A.; Cutignano, A.; Fontana, A. Hydrogen metabolism in the extreme thermophile Thermotoga neapolitana. Int. J. Hydrogen Energy 2010, 35, 2290–2295. [CrossRef]
- Alibardi, L.; Cossu, R. Effects of carbohydrate, protein and lipid content of organic waste on hydrogen production and fermentation products. Waste Manag. 2016, 47, 69–77. [CrossRef]
- Shao, W.; Wang, Q.; Rupani, P.F.; Krishnan, S.; Ahmad, F.; Rezania, S.; Rashid, M.A.; Sha, C.; Md Din, M.F. Biohydrogen production via thermophilic fermentation: A prospective application of Thermotoga species. Energy 2020, 197, 117199. [CrossRef]
- Lanzilli, M.; Esercizio, N.; Vastano, M.; Xu, Z.; Nuzzo, G.; Gallo, C.; Manzo, E.; Fontana, A.; d’Ippolito, G. Effect of Cultivation Parameters on Fermentation and Hydrogen Production in the Phylum Thermotogae. Int. J. Mol. Sci. 2020, 22. [CrossRef]
- Tix, J.; Moll, F.; Krafft, S.; Betsch, M.; Tippkötter, N. Hydrogen Production from Enzymatic Pretreated Organic Waste with Thermotoga neapolitana. Energies 2024, 17, 2938. [CrossRef]
- Saidi, R.; Hamdi, M.; Bouallagui, H. Improvement of Biohydrogen Production from Date Wastes by Thermotoga maritima Using a Continuous Anaerobic Membrane Bioreactor. Waste Biomass Valor. 2023, 14, 1859–1868. [CrossRef]
- Wang, S.-J.; Zhong, J.-J. Bioreactor Engineering. Bioprocessing for Value-Added Products from Renewable Resources; Elsevier, 2007; pp 131–161, ISBN 9780444521149.
- Cinar, A.; Parulekar, S.J.; Undey, C.; Birol, G. Batch Fermentation, 1st ed.; CRC Press, 2003, ISBN 9780203911358.
- Liu, Z.; Antolli, P.G. Bioreactors: Design, Properties, and Applications (Biochemistry Research Trends Series); Nova Science Publishers Incorporated, 2012, ISBN 978-1-62100-164-5.
- Luli, G.W.; Strohl, W.R. Comparison of growth, acetate production, and acetate inhibition of Escherichia coli strains in batch and fed-batch fermentations. Appl. Environ. Microbiol. 1990, 56, 1004–1011. [CrossRef]
- Modak, J.M.; Lim, H.C.; Tayeb, Y.J. General characteristics of optimal feed rate profiles for various fed-batch fermentation processes. Biotechnol. Bioeng. 1986, 28, 1396–1407. [CrossRef]
- Zhong, J.-J. Recent advances in bioreactor engineering. Korean J. Chem. Eng. 2010, 27, 1035–1041. [CrossRef]
- Yin, Y.; Song, W.; Wang, J. Inhibitory effect of acetic acid on dark-fermentative hydrogen production. Bioresour. Technol. 2022, 364, 128074. [CrossRef]
- Jung, K.-W.; Kim, D.-H.; Kim, S.-H.; Shin, H.-S. Bioreactor design for continuous dark fermentative hydrogen production. Bioresour. Technol. 2011, 102, 8612–8620. [CrossRef]
- Nguyen, T.; Pyokim, J.; Sunkim, M.; Kwanoh, Y.; Sim, S. Optimization of hydrogen production by hyperthermophilic eubacteria, Thermotoga maritima and Thermotoga neapolitana in batch fermentation. Int. J. Hydrogen Energy 2008, 33, 1483–1488. [CrossRef]
- Ngo, T.A.; Kim, M.-S.; Sim, S.J. Thermophilic hydrogen fermentation using Thermotoga neapolitana DSM 4359 by fed-batch culture. Int. J. Hydrogen Energy 2011, 36, 14014–14023. [CrossRef]
- Basile, M.A.; Carfagna, C.; Cerruti, P.; Gomez d’Ayala, G.; Fontana, A.; Gambacorta, A.; Malinconico, M.; Dipasquale, L. Continuous hydrogen production by immobilized cultures of Thermotoga neapolitana on an acrylic hydrogel with pH-buffering properties. RSC Advances 2012, 2, 3611. [CrossRef]
- Childers, S.E.; Vargas, M.; Noll, K.M. Improved Methods for Cultivation of the Extremely Thermophilic Bacterium Thermotoga neapolitana. Appl. Environ. Microbiol. 1992, 58, 3949–3953. [CrossRef]
- Beck, P.; Huber, R. Detection of cell viability in cultures of hyperthermophiles. FEMS Microbiol. Lett. 2006, 148, 11–14. [CrossRef]
- Xiaohui Yu. Biohydrogen Production by the Hyperthermophilic Bacterium Thermotoga neapolitana. Ph.D. thesis; Clemson University, Clemson University, 2007.
- Frascari, D.; Cappelletti, M.; Mendes, J.D.S.; Alberini, A.; Scimonelli, F.; Manfreda, C.; Longanesi, L.; Zannoni, D.; Pinelli, D.; Fedi, S. A kinetic study of biohydrogen production from glucose, molasses and cheese whey by suspended and attached cells of Thermotoga neapolitana. Bioresour. Technol. 2013, 147, 553–561. [CrossRef]
- Sharma, A.; Arya, S.K. Hydrogen from algal biomass: A review of production process. Biotechnol. Rep. (Amst) 2017, 15, 63–69. [CrossRef]
- Esener, A.A.; Roels, J.A.; Kossen, N.W.F.; Roozenburg, J.W.H. Description of microbial growth behaviour during the wash-out phase; determination of the maximum specific growth rate. European J. Appl. Microbiol. Biotechnol. 1981, 13, 141–144. [CrossRef]
- Kort, R.; Liebl, W.; Labedan, B.; Forterre, P.; Eggen, R.I.; Vos, W.M. de. Glutamate dehydrogenase from the hyperthermophilic bacterium Thermotoga maritima: molecular characterization and phylogenetic implications. Extremophiles 1997, 1, 52–60. [CrossRef]
- Wendisch, V.F. Microbial production of amino acids and derived chemicals: synthetic biology approaches to strain development. Curr. Opin. Biotechnol. 2014, 30, 51–58. [CrossRef]
- Cappelletti, M.; Bucchi, G.; Sousa Mendes, J. de; Alberini, A.; Fedi, S.; Bertin, L.; Frascari, D. Biohydrogen production from glucose, molasses and cheese whey by suspended and attached cells of four hyperthermophilic Thermotoga strains. J. Chem. Technol. Biotechnol. 2012, 87, 1291–1301. [CrossRef]
- Pradhan, N.; d’Ippolito, G.; Dipasquale, L.; Esposito, G.; Panico, A.; Lens, P.N.; Fontana, A. Simultaneous synthesis of lactic acid and hydrogen from sugars via capnophilic lactic fermentation by Thermotoga neapolitana cf capnolactica. Biomass Bioenergy 2019, 125, 17–22. [CrossRef]
- Dreschke, G.; d’Ippolito, G.; Panico, A.; Lens, P.N.; Esposito, G.; Fontana, A. Enhancement of hydrogen production rate by high biomass concentrations of Thermotoga neapolitana. Int. J. Hydrogen Energy 2018, 43, 13072–13080. [CrossRef]
- Hallenbeck, P. Biological hydrogen production; fundamentals and limiting processes. Int. J. Hydrogen Energy 2002, 27, 1185–1193. [CrossRef]
- van Ooteghem, S.A.; Jones, A.; van der Lelie, D.; Dong, B.; Mahajan, D. H2 production and carbon utilization by Thermotoga neapolitana under anaerobic and microaerobic growth conditions. Biotechnol. Lett. 2004, 26, 1223–1232. [CrossRef]
- Rinker, K.D.; Kelly, R.M. Effect of carbon and nitrogen sources on growth dynamics and exopolysaccharide production for the hyperthermophilic archaeonThermococcus litoralis and bacterium Thermotoga maritima. Biotechnol. Bioeng. 2000, 69, 537–547. [CrossRef]
- Nath, K.; Das, D. Improvement of fermentative hydrogen production: various approaches. Appl. Microbiol. Biotechnol. 2004, 65, 520–529. [CrossRef]
- Dalena, F.; Senatore, A.; Marino, A.; Gordano, A.; Basile, M.; Basile, A. Methanol Production and Applications: An Overview. Methanol; Elsevier, 2018; pp 3–28, ISBN 9780444639035.
Figure 1.
Process flow diagram of the constructed anaerobic bioreactor for continuous fermentation system.
Figure 1.
Process flow diagram of the constructed anaerobic bioreactor for continuous fermentation system.
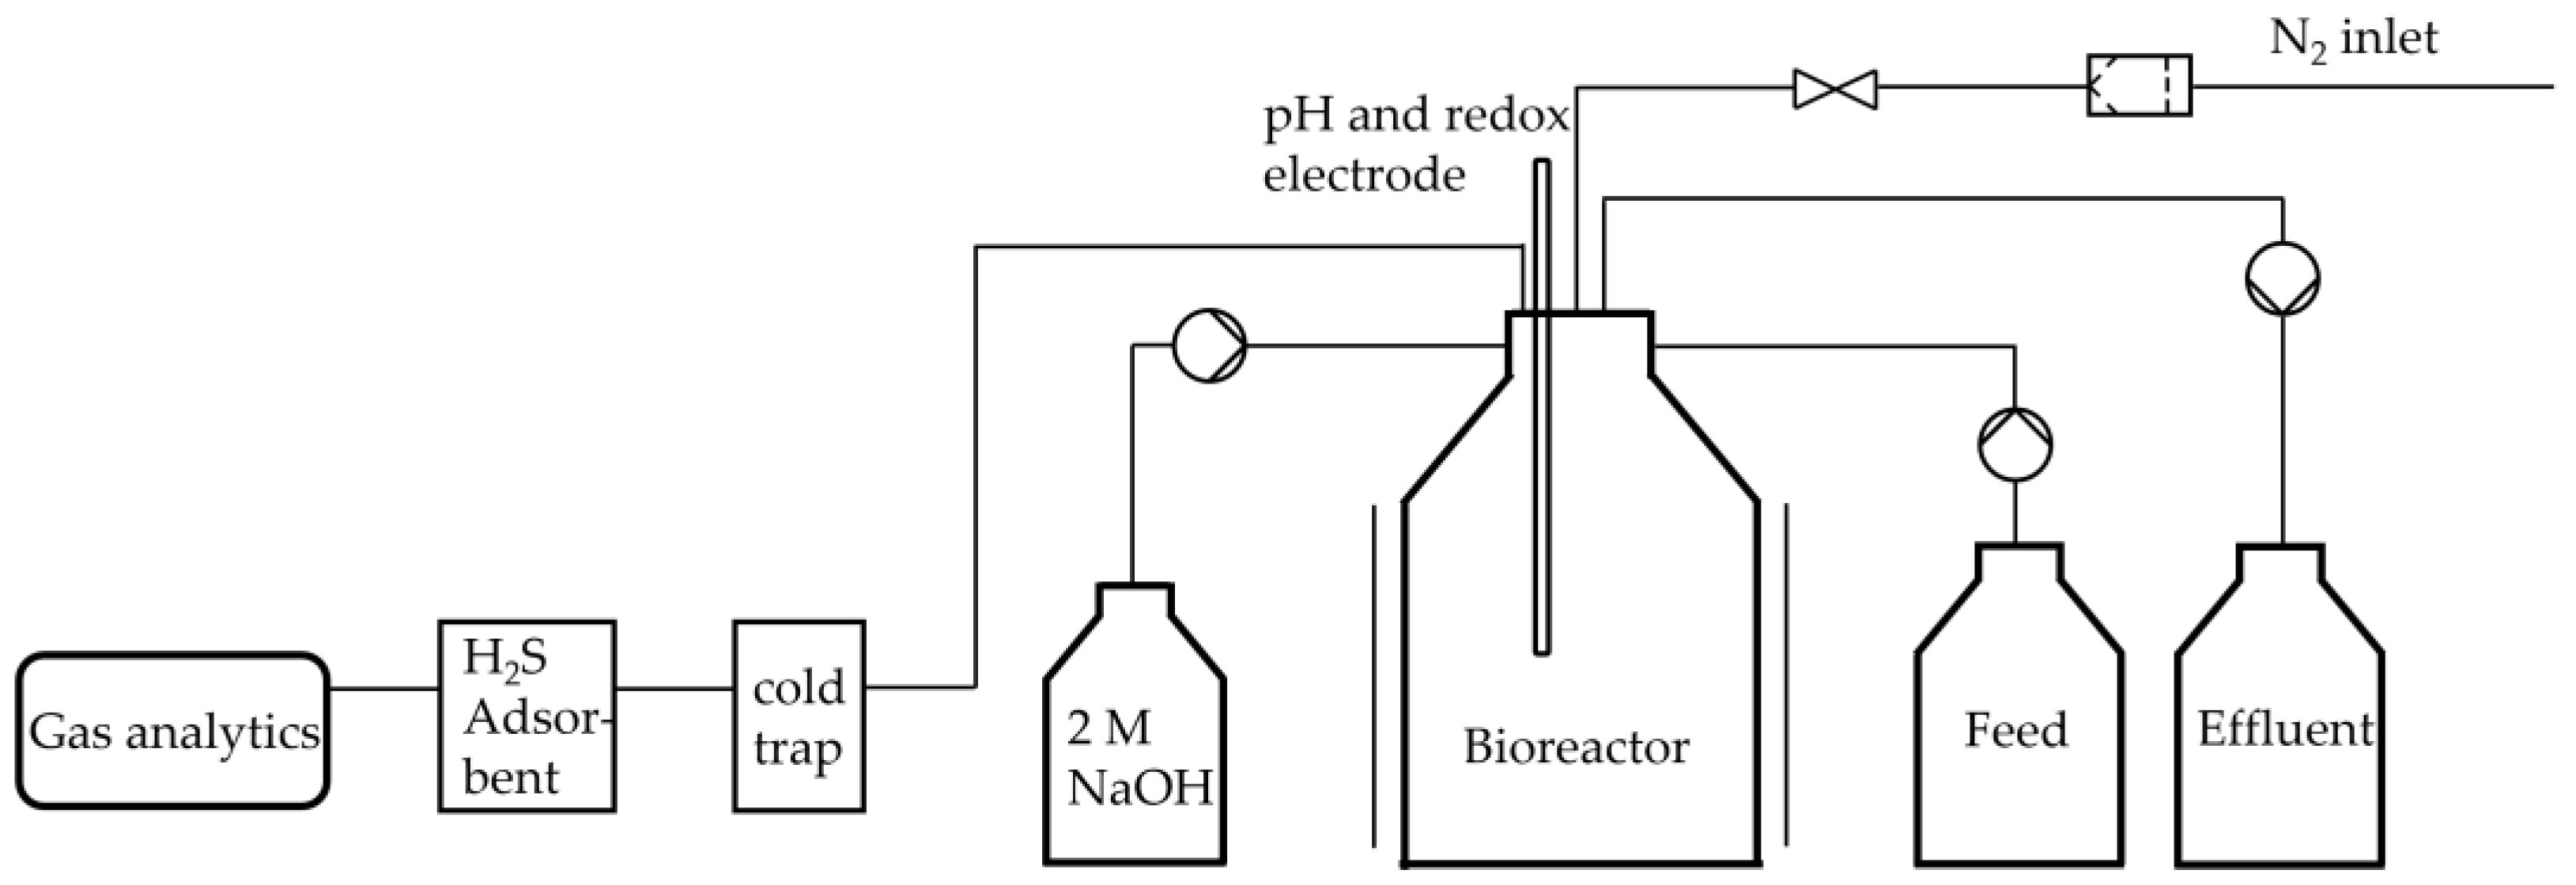
Figure 2.
Viability test for T. neapolitana with fluorescence microscopy using DiBAC4 (3). Dead cells were coloured by the dye and fluorescence and living cells did not light up. (a) shows a fresh autoclaved positive control of dead cells, (b) contains a mixture of living and dead cells and (c) shows the positive control of a fresh preculture containing living cells.

Figure 3.
Results of the viability tests in different fermentation approaches at different time point. For the evaluation of the continuous process, only samples in the steady state of the tested dilution rates were considered.
Figure 3.
Results of the viability tests in different fermentation approaches at different time point. For the evaluation of the continuous process, only samples in the steady state of the tested dilution rates were considered.
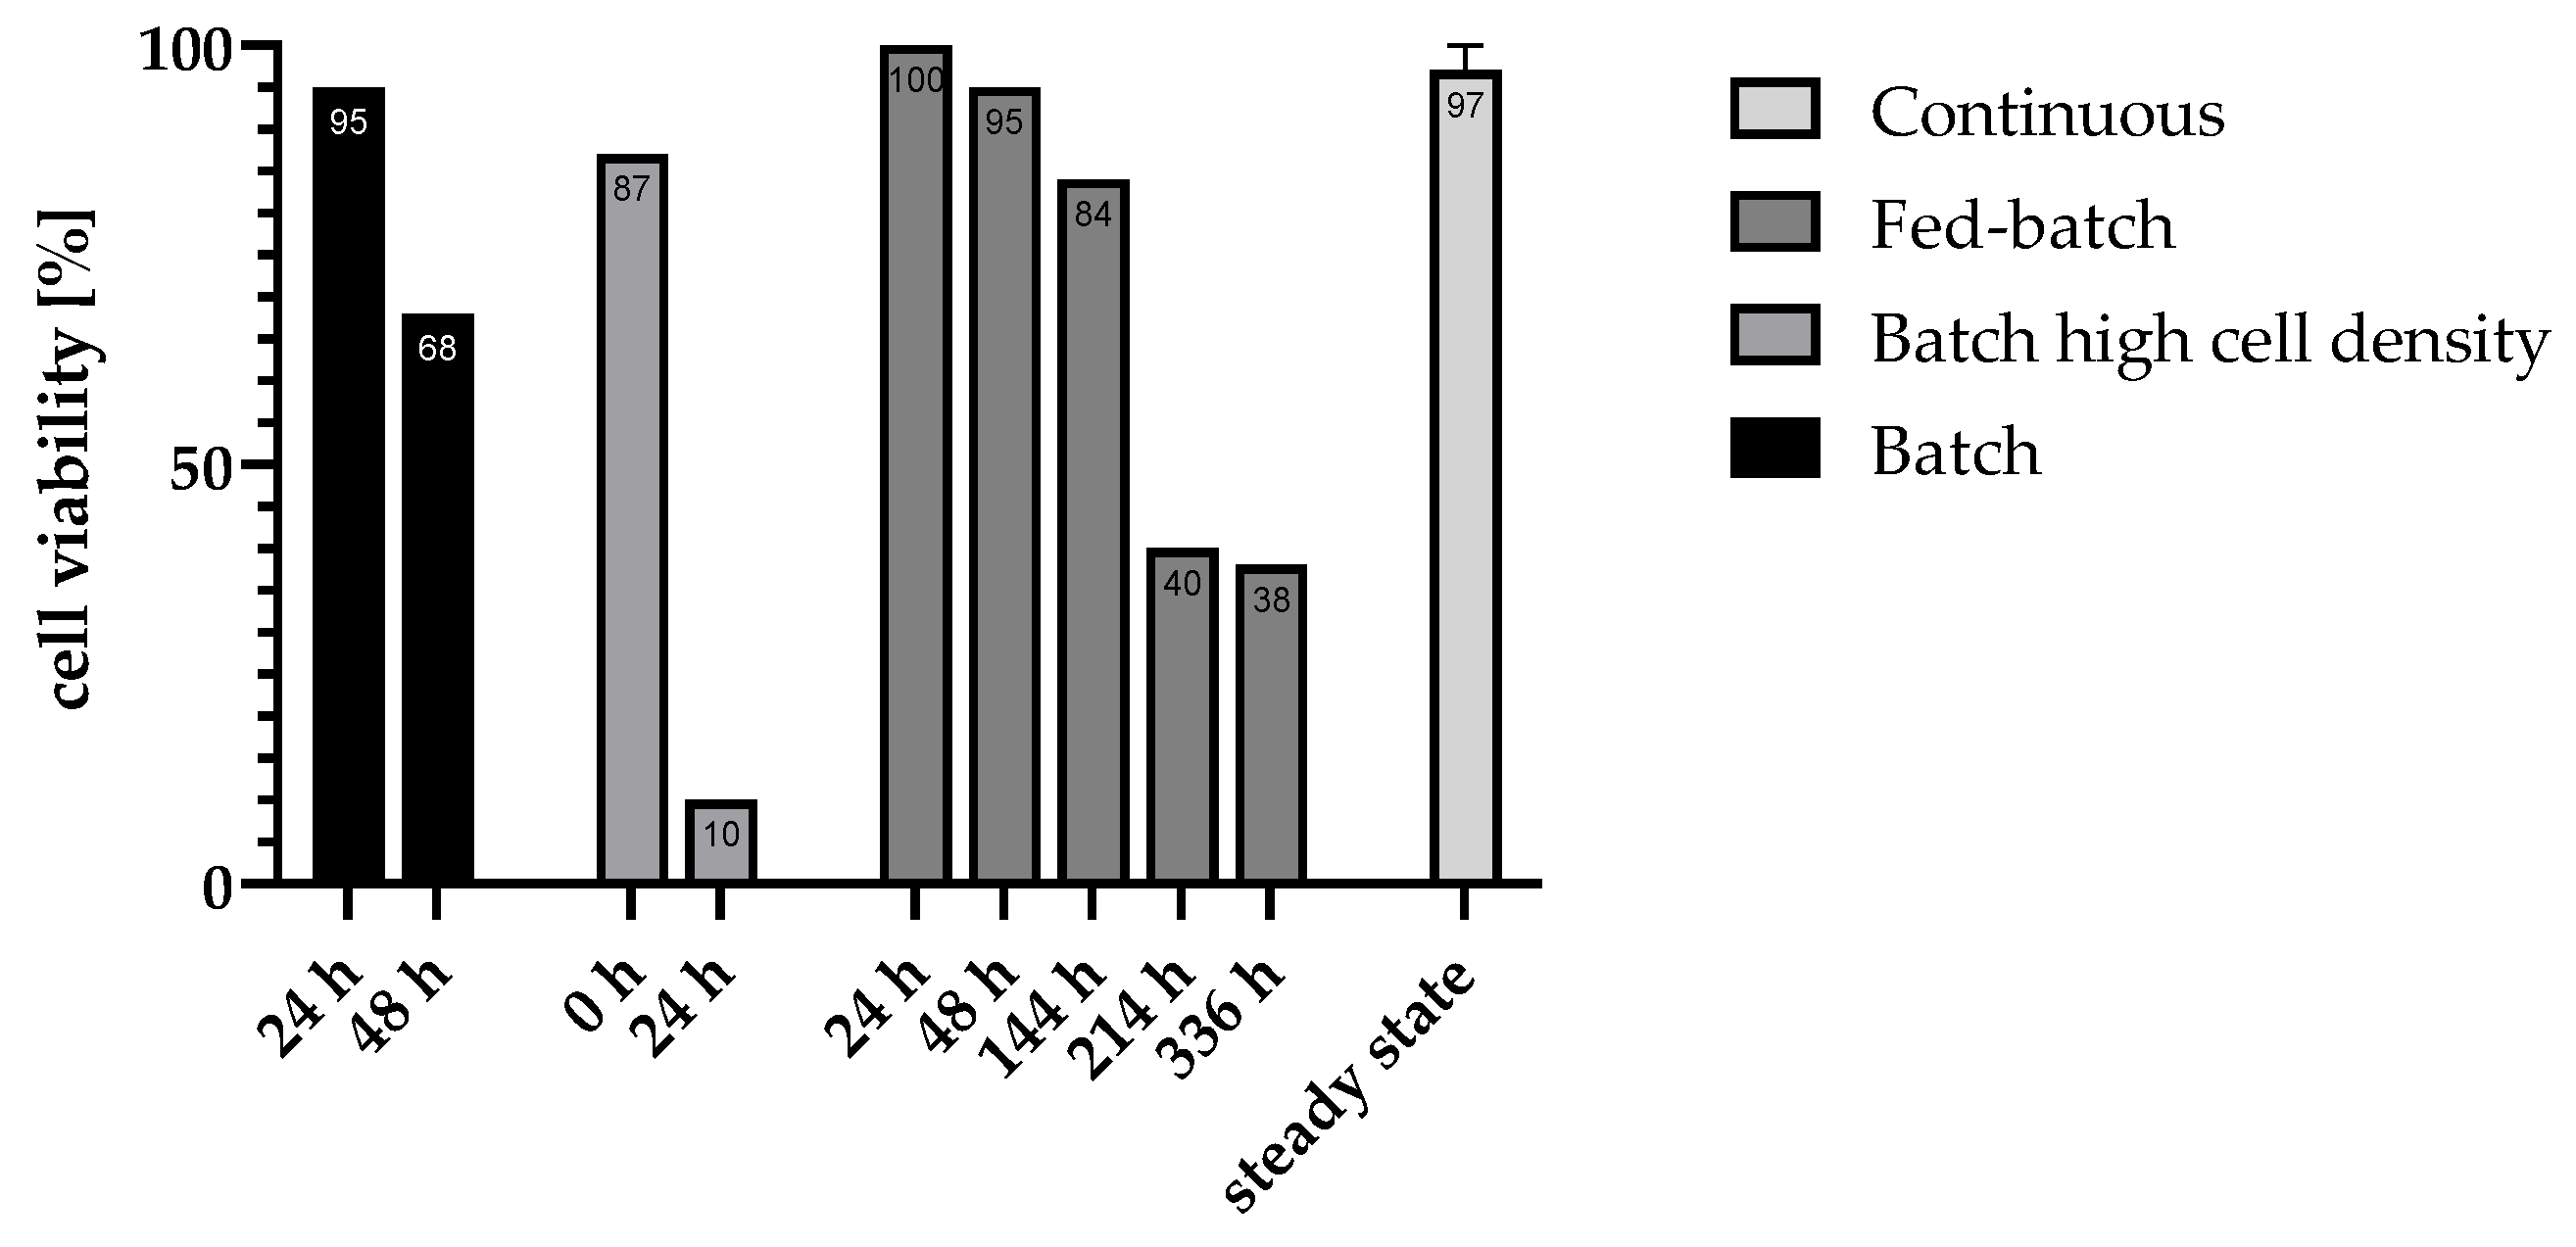
Figure 4.
Results of different batch approaches in 1 L anaerobic bioreactor concerning (a) glucose metabolism of the normal batch, (b) the high cell density batch containing harvested cells of 2,800 ml preculture at the beginning, and (c) the H2 standard volume curve of the high cell density batch.
Figure 4.
Results of different batch approaches in 1 L anaerobic bioreactor concerning (a) glucose metabolism of the normal batch, (b) the high cell density batch containing harvested cells of 2,800 ml preculture at the beginning, and (c) the H2 standard volume curve of the high cell density batch.
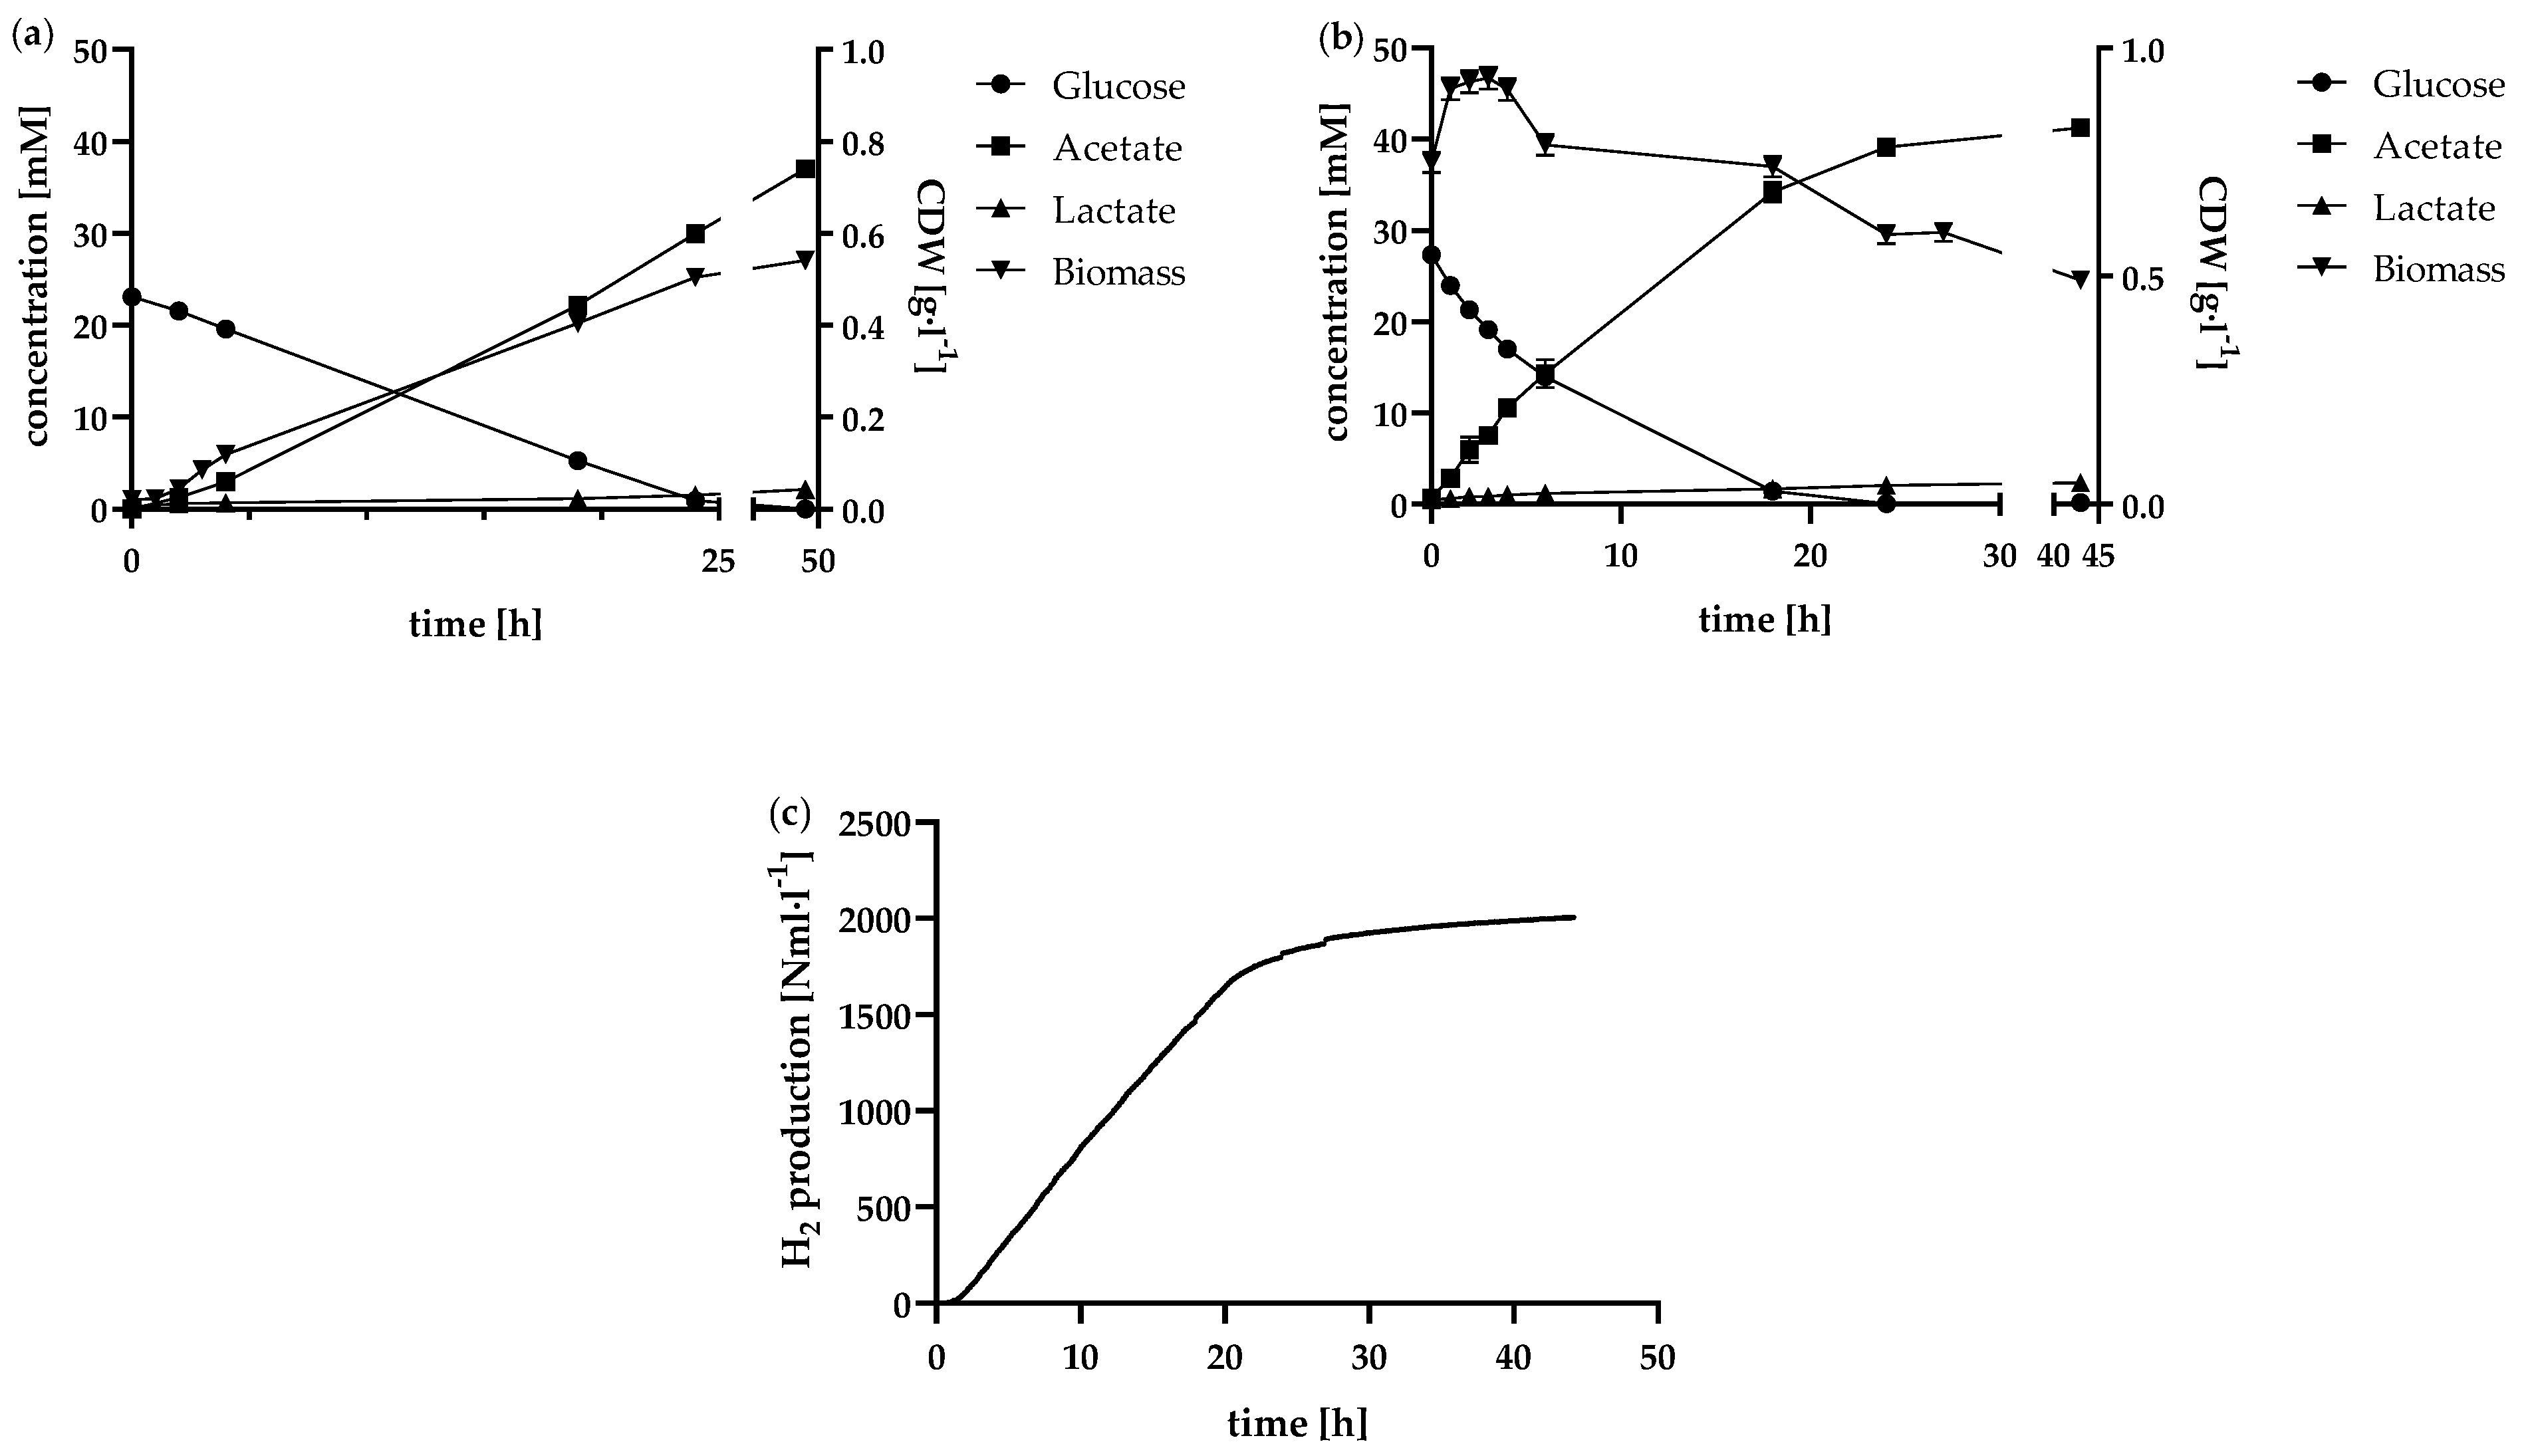
Figure 5.
Results of the fed-batch approach in the 1 l anaerobic bioreactor. The course of the glucose, acetate and lactate concentrations over the fermentation time is shown in (a). Correspondingly, (b) shows the biomass concentration and the cumulative H2 standard volume. (c) shows the course of the amino acid concentration in the bioreactor over the fermentation time.
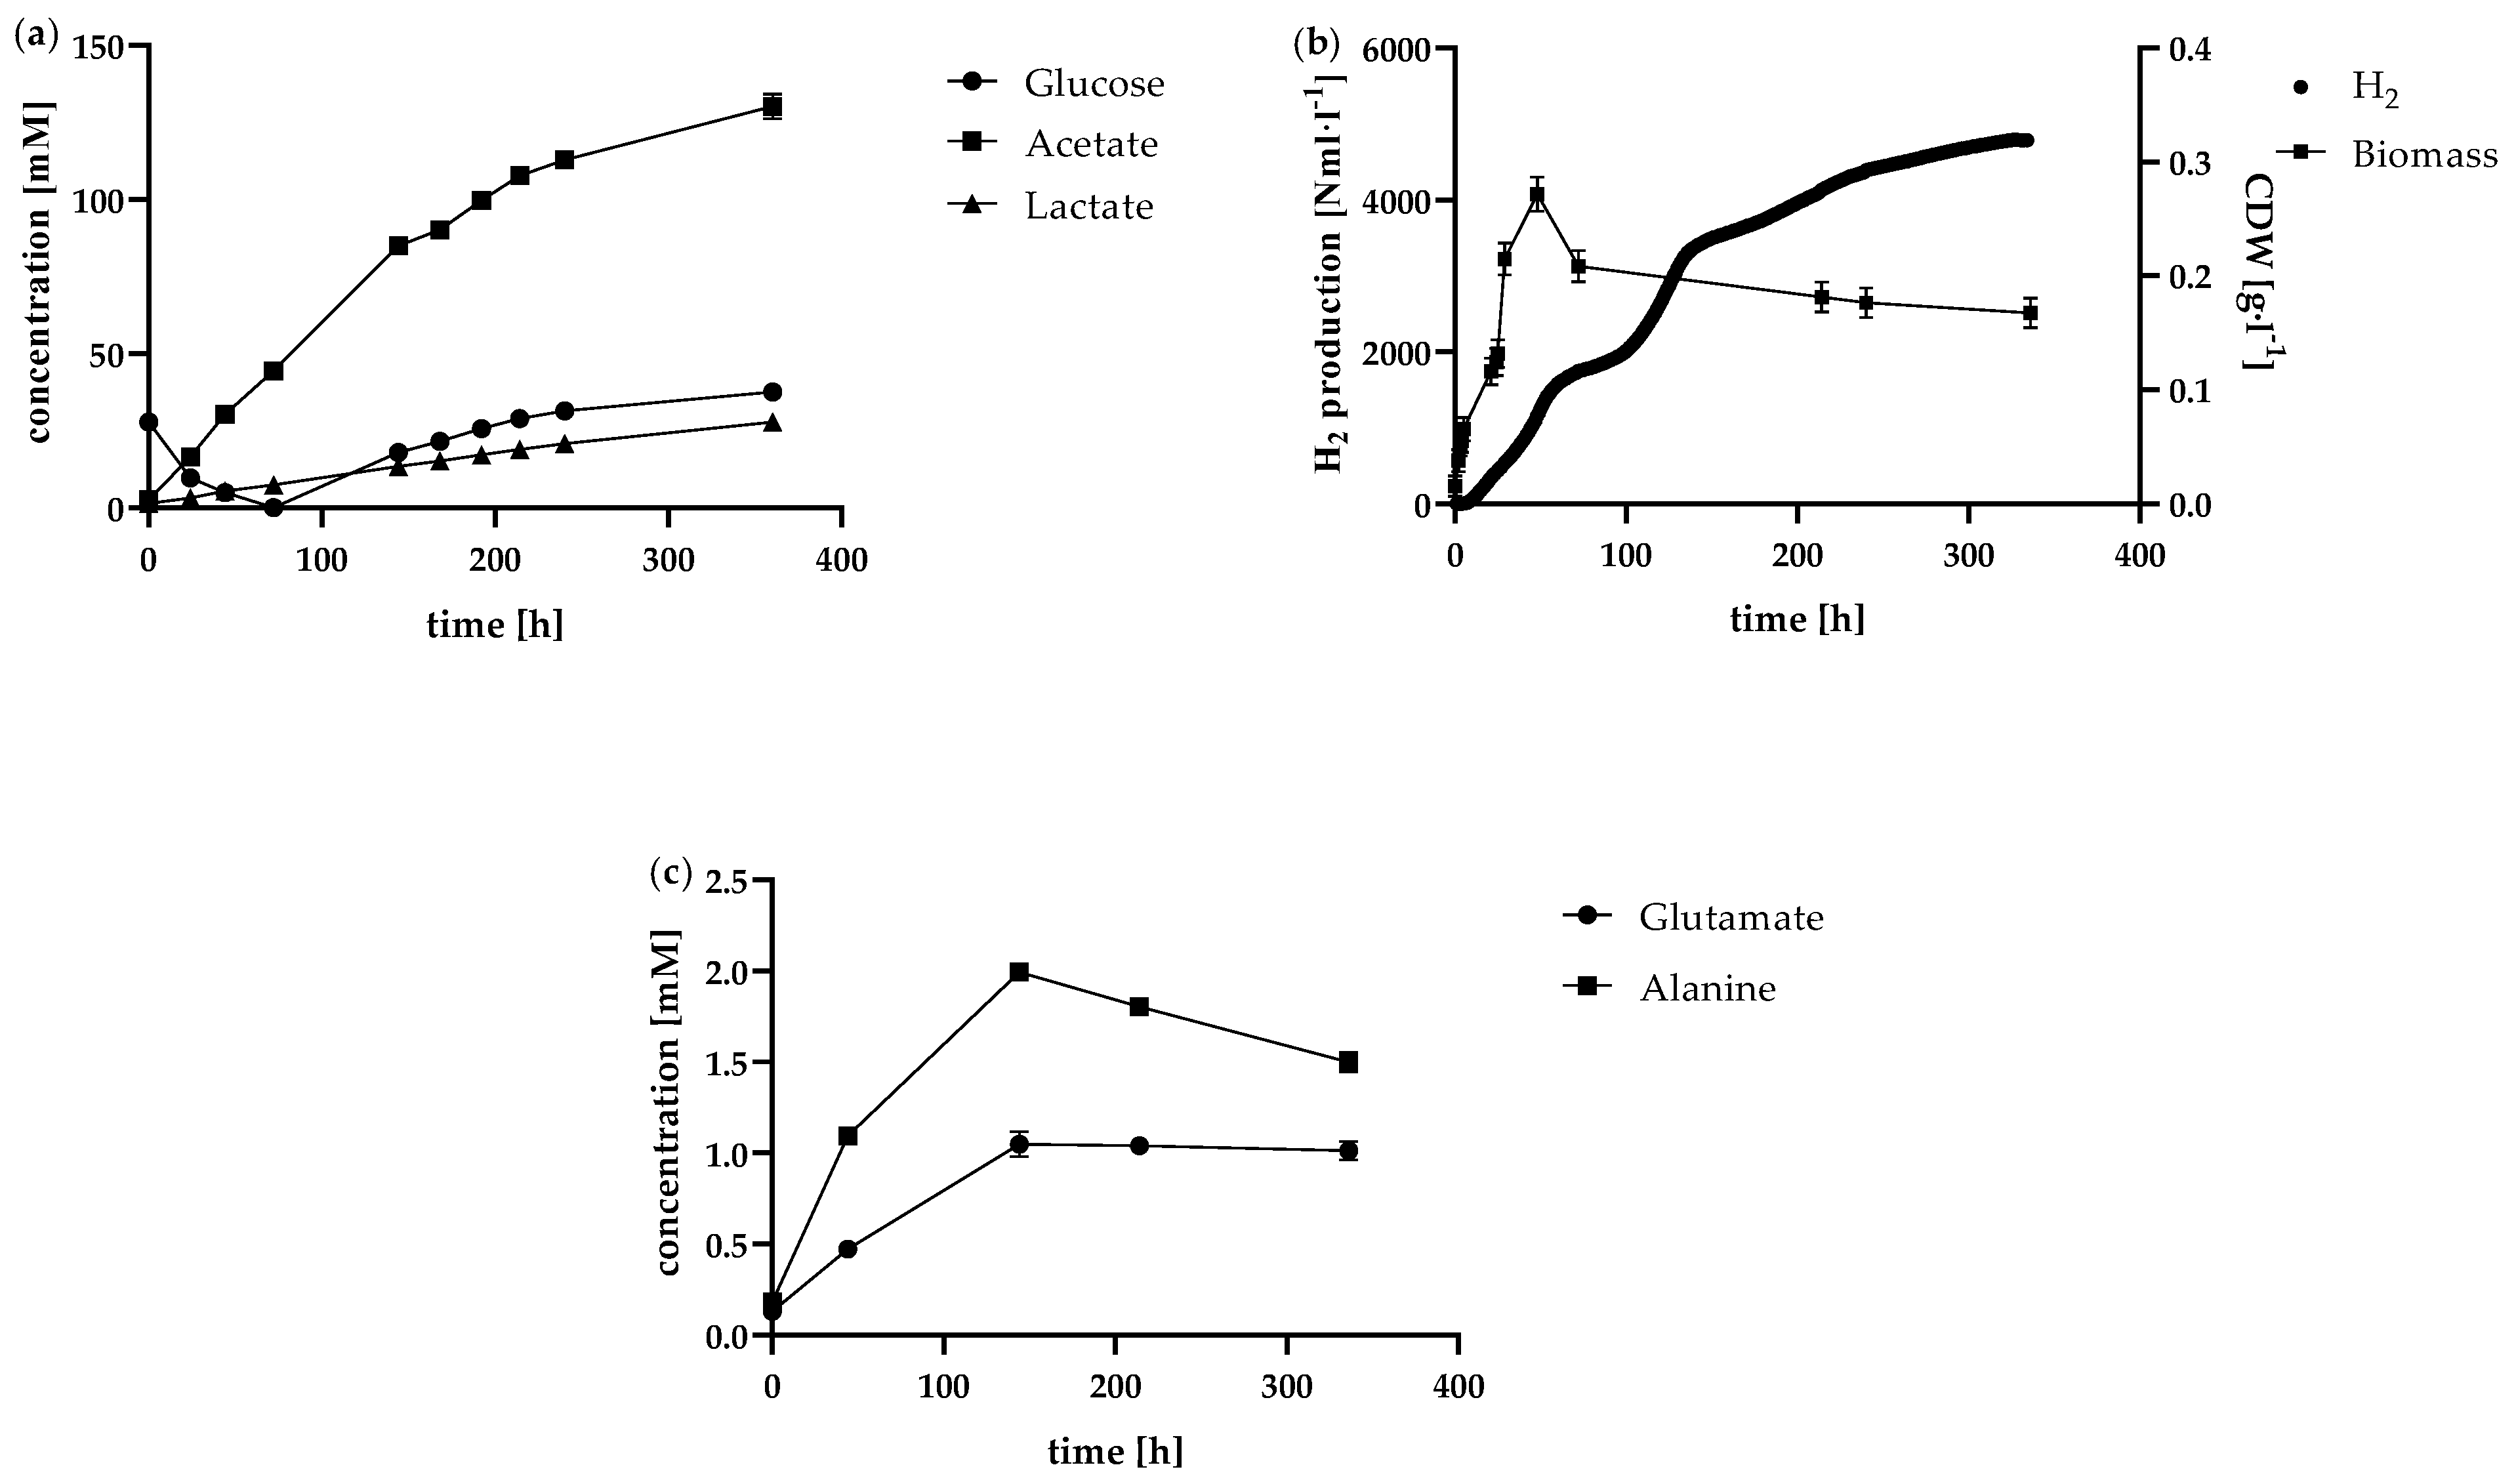
Figure 6.
Production rates in the continuous process in the 1 l anaerobic bioreactor at the tested dilution rates 0.03 h-1 (black bar), 0.05 h-1 (light grey bar) and 0.07 h-1 (dark grey bar). Depicted is the average of each steady state concerning (a) the H2 production rate, (b) the biomass production rate, (c) the acetate and lactate production rate and (d) the amino acid production rate.
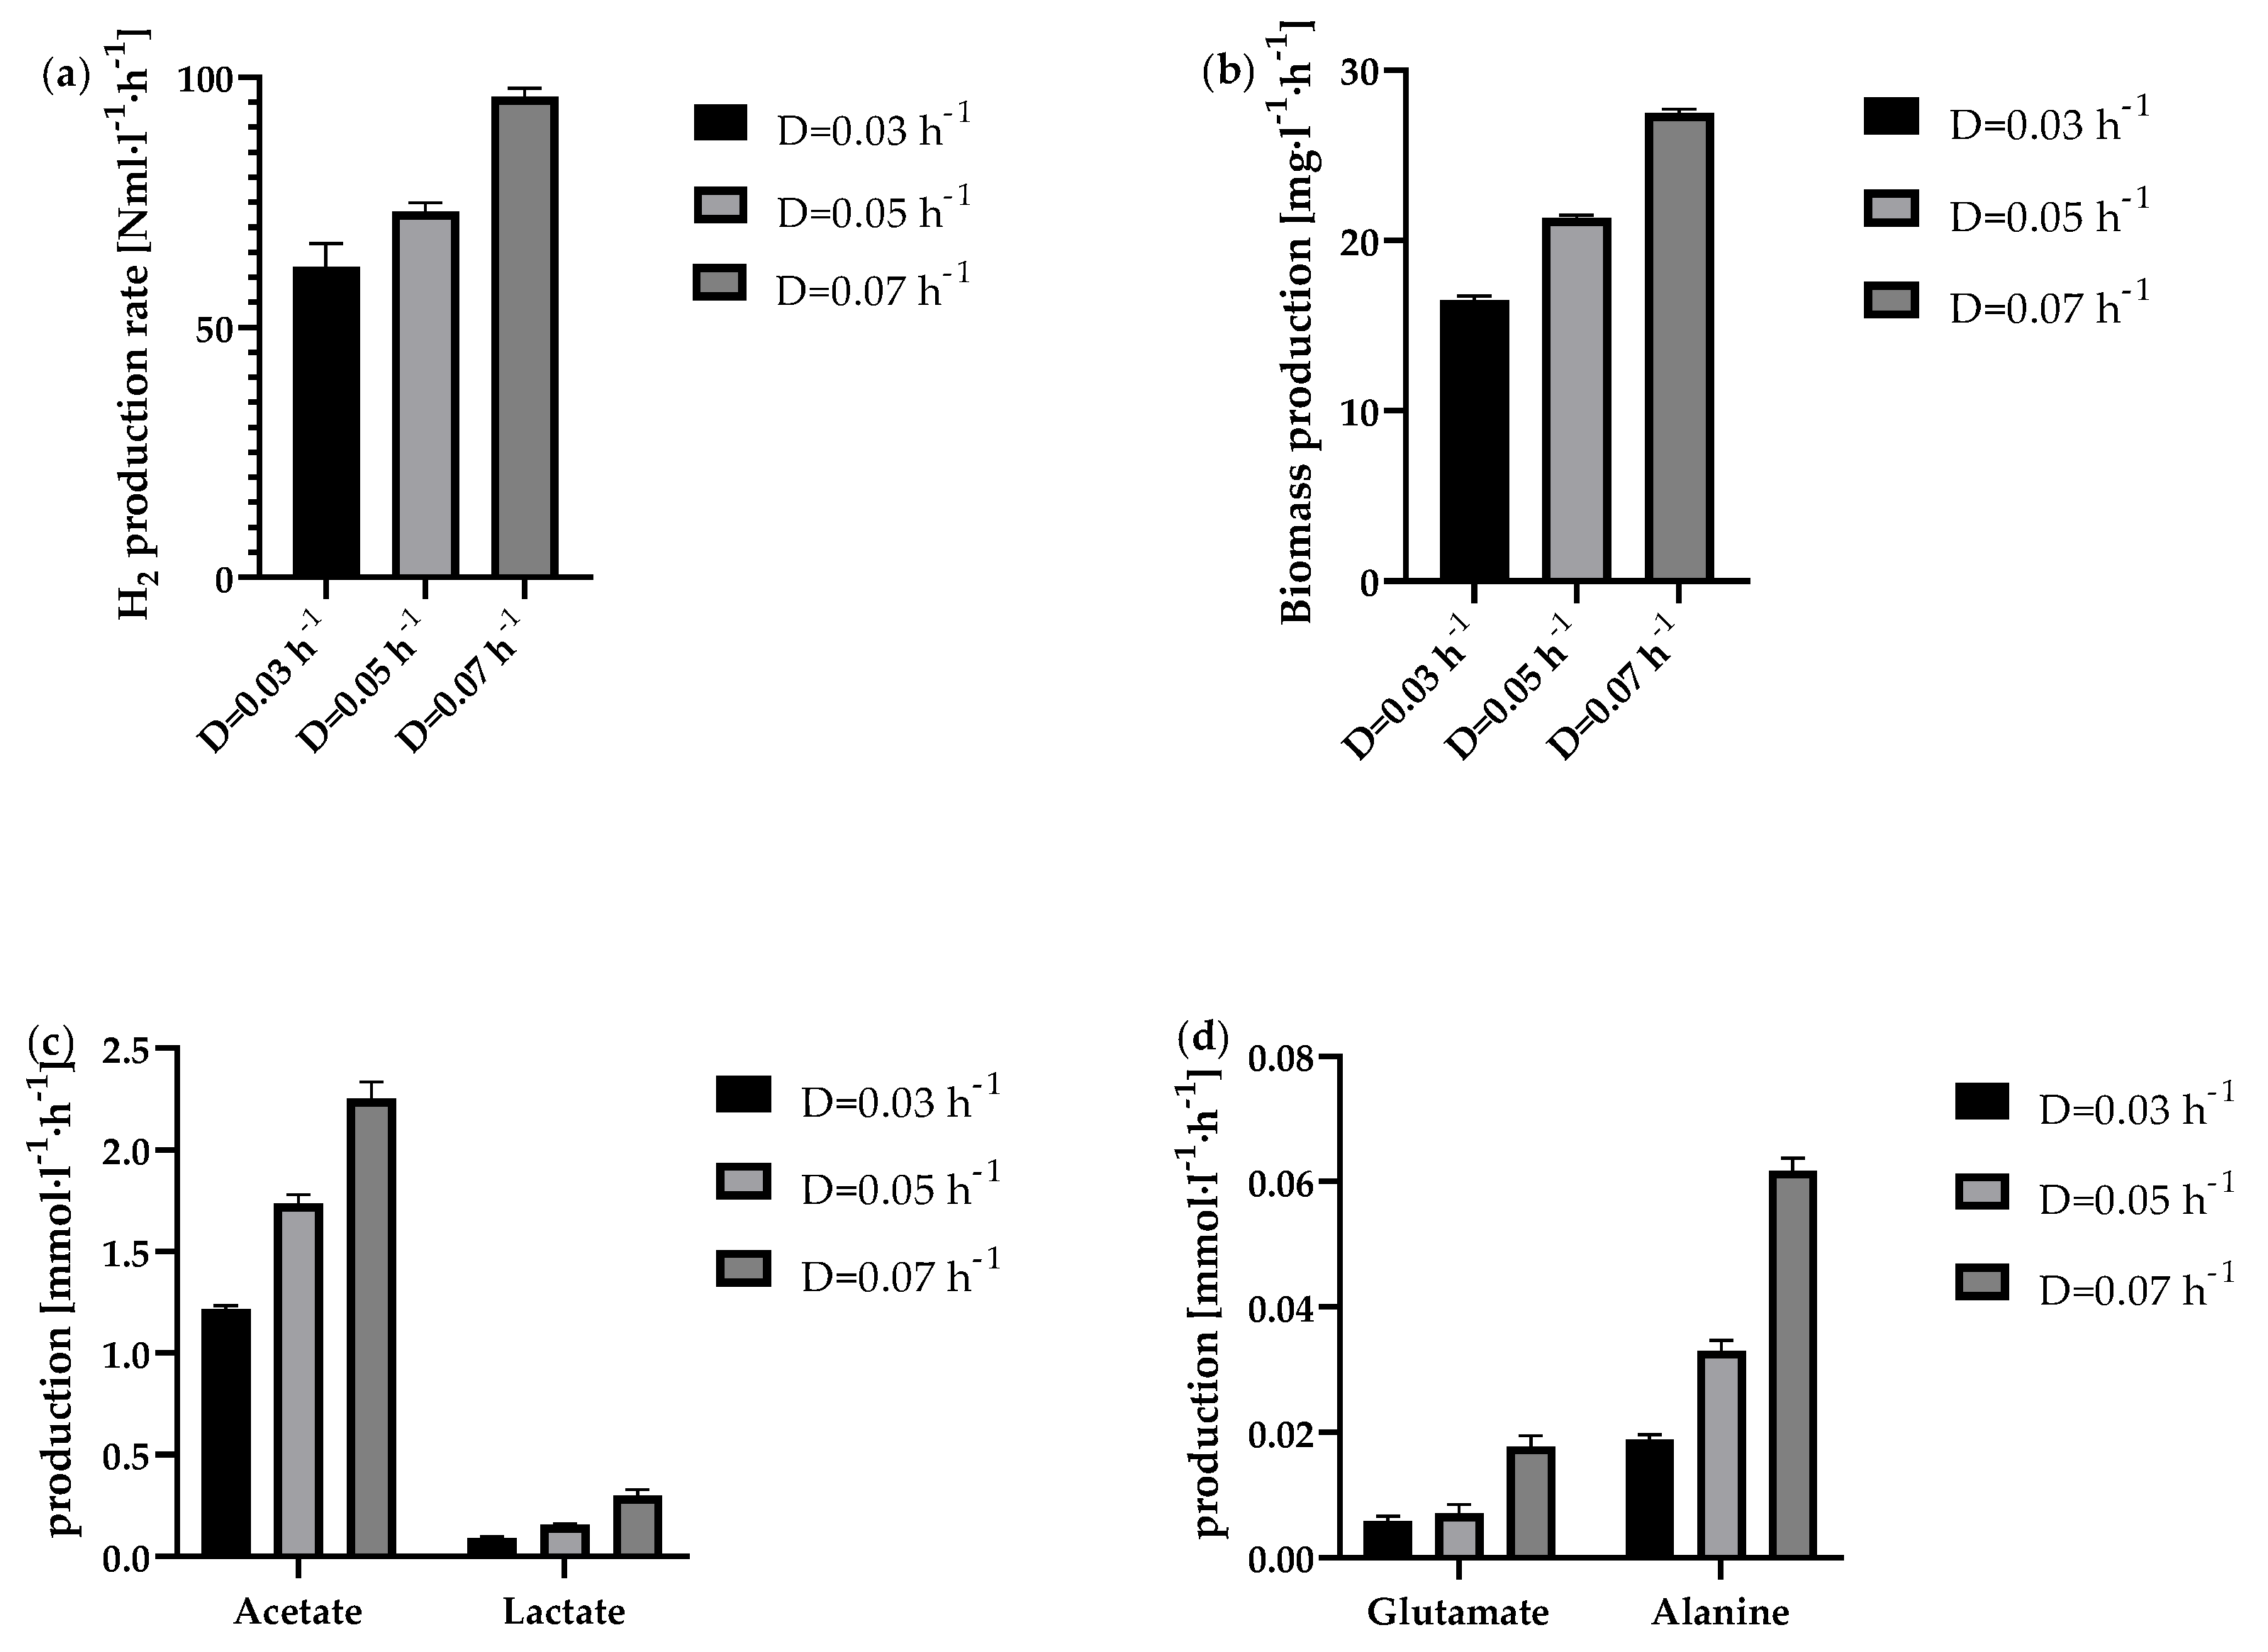
Figure 7.
Product yields in the continuous process in the 1 l anaerobic bioreactor at the tested dilution rates 0.03 h-1 (black bar), 0.05 h-1 (light grey bar) and 0.07 h-1 (dark grey bar). Depicted is the average yield based on glucose consumption of each steady state concerning (a) the H2 acetate and lactate yield and (b) the yield of analysed amino acids.
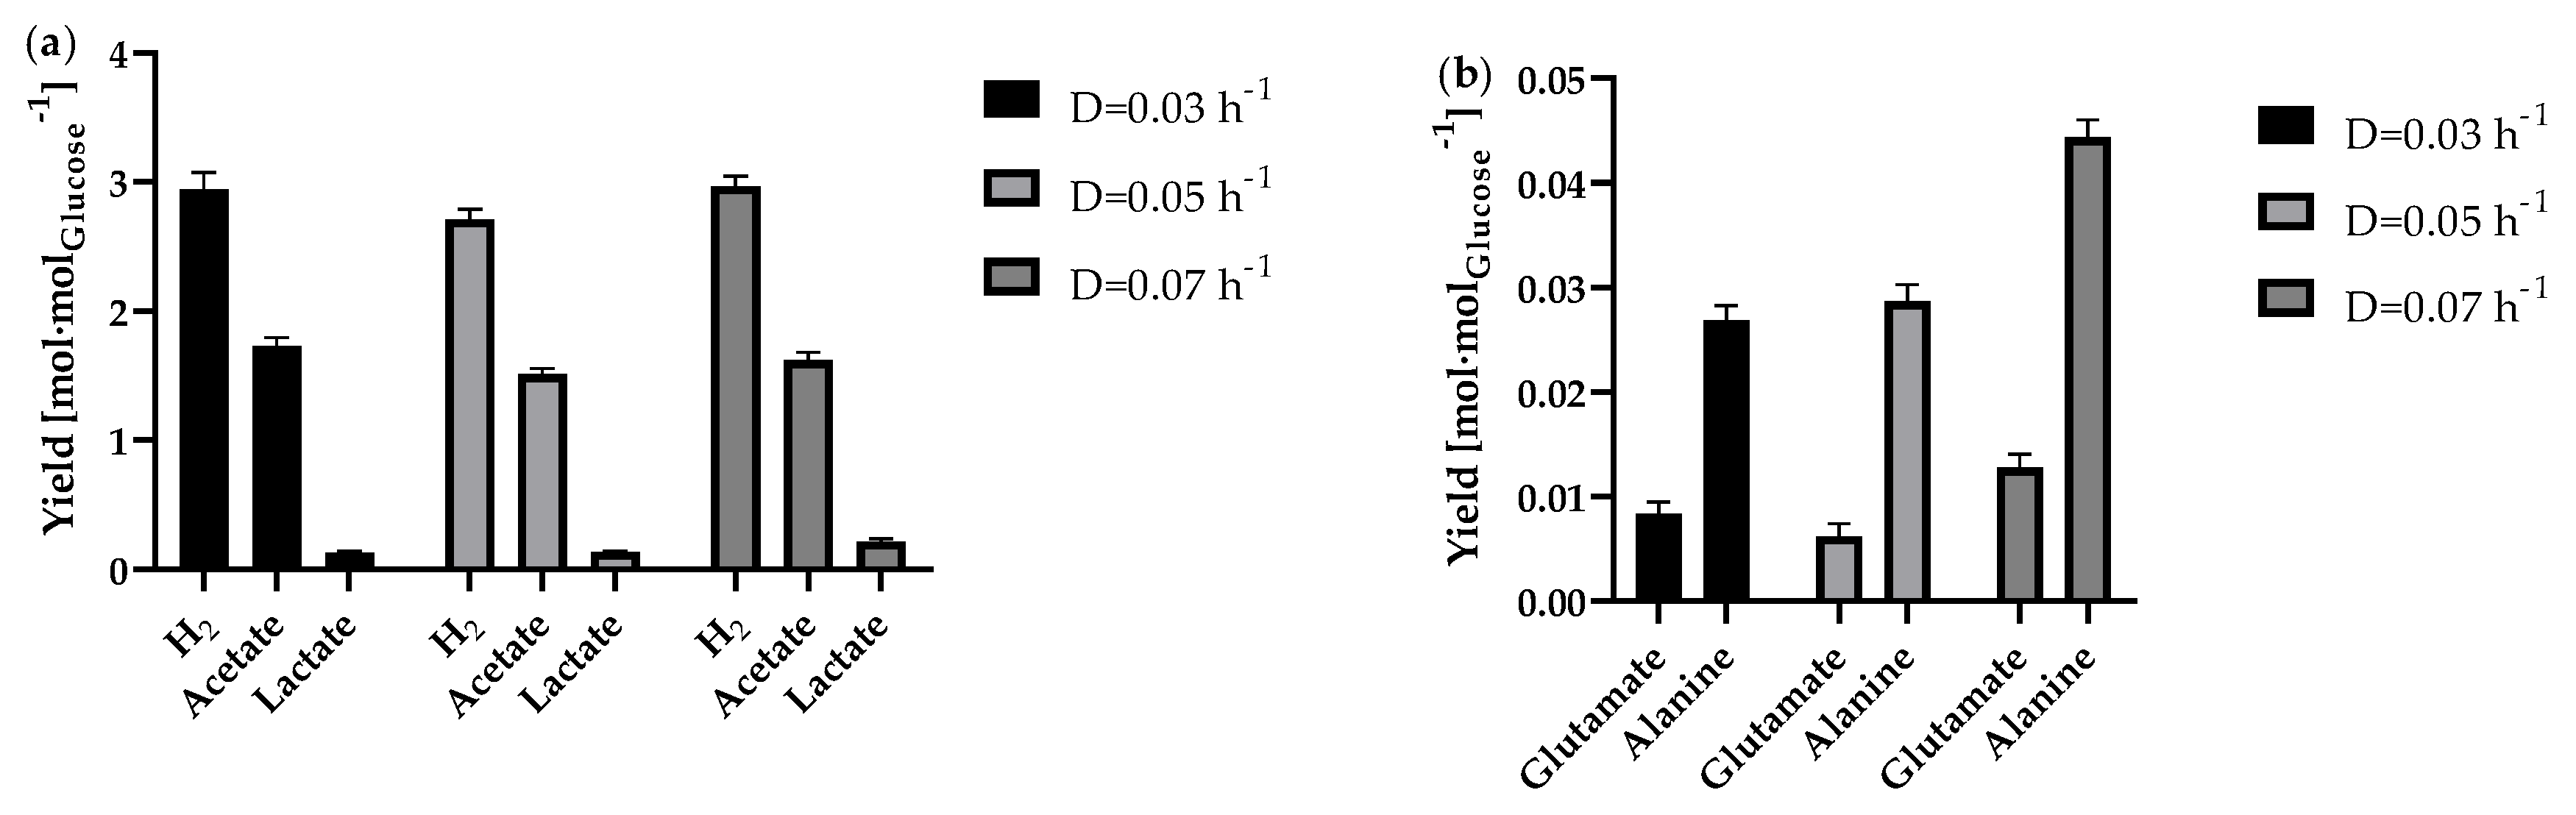
Figure 8.
Average calculated carbon balance of the continuous fermentation during steady state for tested dilution rates. Calculation was based on the glucose consumption as hexose containing 6 C-atoms. The production rate of all detected products was multiplied by the number of carbon atoms in order to identify the proportion of carbon.
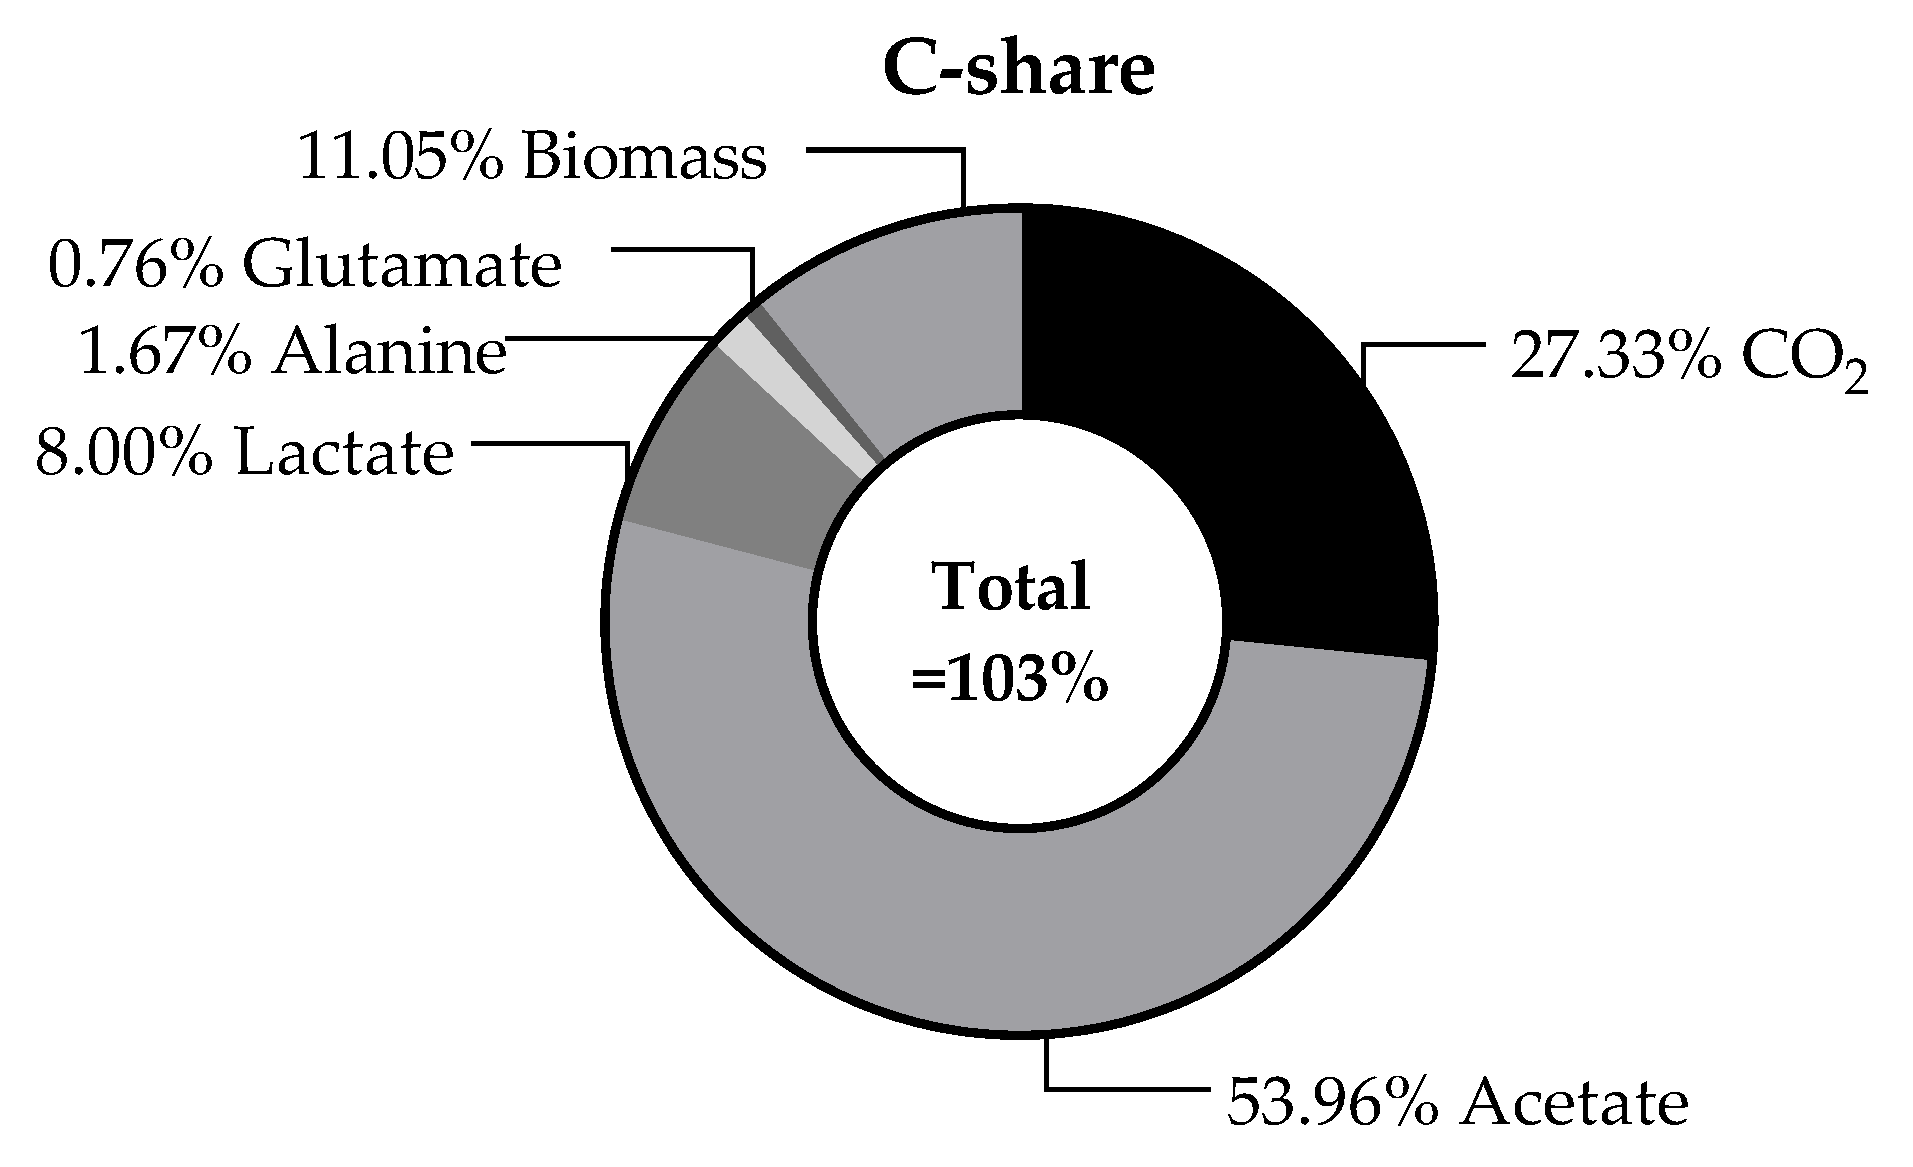

Table 1.
Time profile of the gradient of the eluents of the described sodium buffer (eluent A) and 54% methanol (eluent B) for amino acid detection.
Table 1.
Time profile of the gradient of the eluents of the described sodium buffer (eluent A) and 54% methanol (eluent B) for amino acid detection.
| Time [min] | Eluent A [%] | Eluent B [%] |
|---|---|---|
| 0.0 | 100.0 | 0.0 |
| 50.0 | 0.0 | 100.0 |
| 55.0 | 0.0 | 100.0 |
| 60.0 | 100.0 | 0.0 |
| 67.0 | 100.0 | 0.0 |
Table 2.
Ethanol concentration in g·l−1 during the fed-batch. Liquid samples were taken in technical triplicate and analysed by using HPLC method described above.
Table 2.
Ethanol concentration in g·l−1 during the fed-batch. Liquid samples were taken in technical triplicate and analysed by using HPLC method described above.
| 0 h | 24 h | 44 h | 72 h | 144 h | 168 h | 192 h | 214 h | 240 h | 336 h |
|---|---|---|---|---|---|---|---|---|---|
| < 0.1 | <0.1 | <0.1 | 0.15 ± 0.00 | 0.48 ± 0.02 | 0.45 ± 0.05 | 0.6 ± 0.03 | 0.58 ± 0.09 | 0.58 ± 0.09 | 0.61 ± 0.04 |
Disclaimer/Publisher’s Note: The statements, opinions and data contained in all publications are solely those of the individual author(s) and contributor(s) and not of MDPI and/or the editor(s). MDPI and/or the editor(s) disclaim responsibility for any injury to people or property resulting from any ideas, methods, instructions or products referred to in the content. |
© 2025 by the authors. Licensee MDPI, Basel, Switzerland. This article is an open access article distributed under the terms and conditions of the Creative Commons Attribution (CC BY) license (http://creativecommons.org/licenses/by/4.0/).
Copyright: This open access article is published under a Creative Commons CC BY 4.0 license, which permit the free download, distribution, and reuse, provided that the author and preprint are cited in any reuse.


